
A Relationship Prediction Method for Magnaporthe oryzae–Rice Multi-Omics Data Based on WGCNA and Graph Autoencoder
 , and
, and
Abstract
:1. Introduction
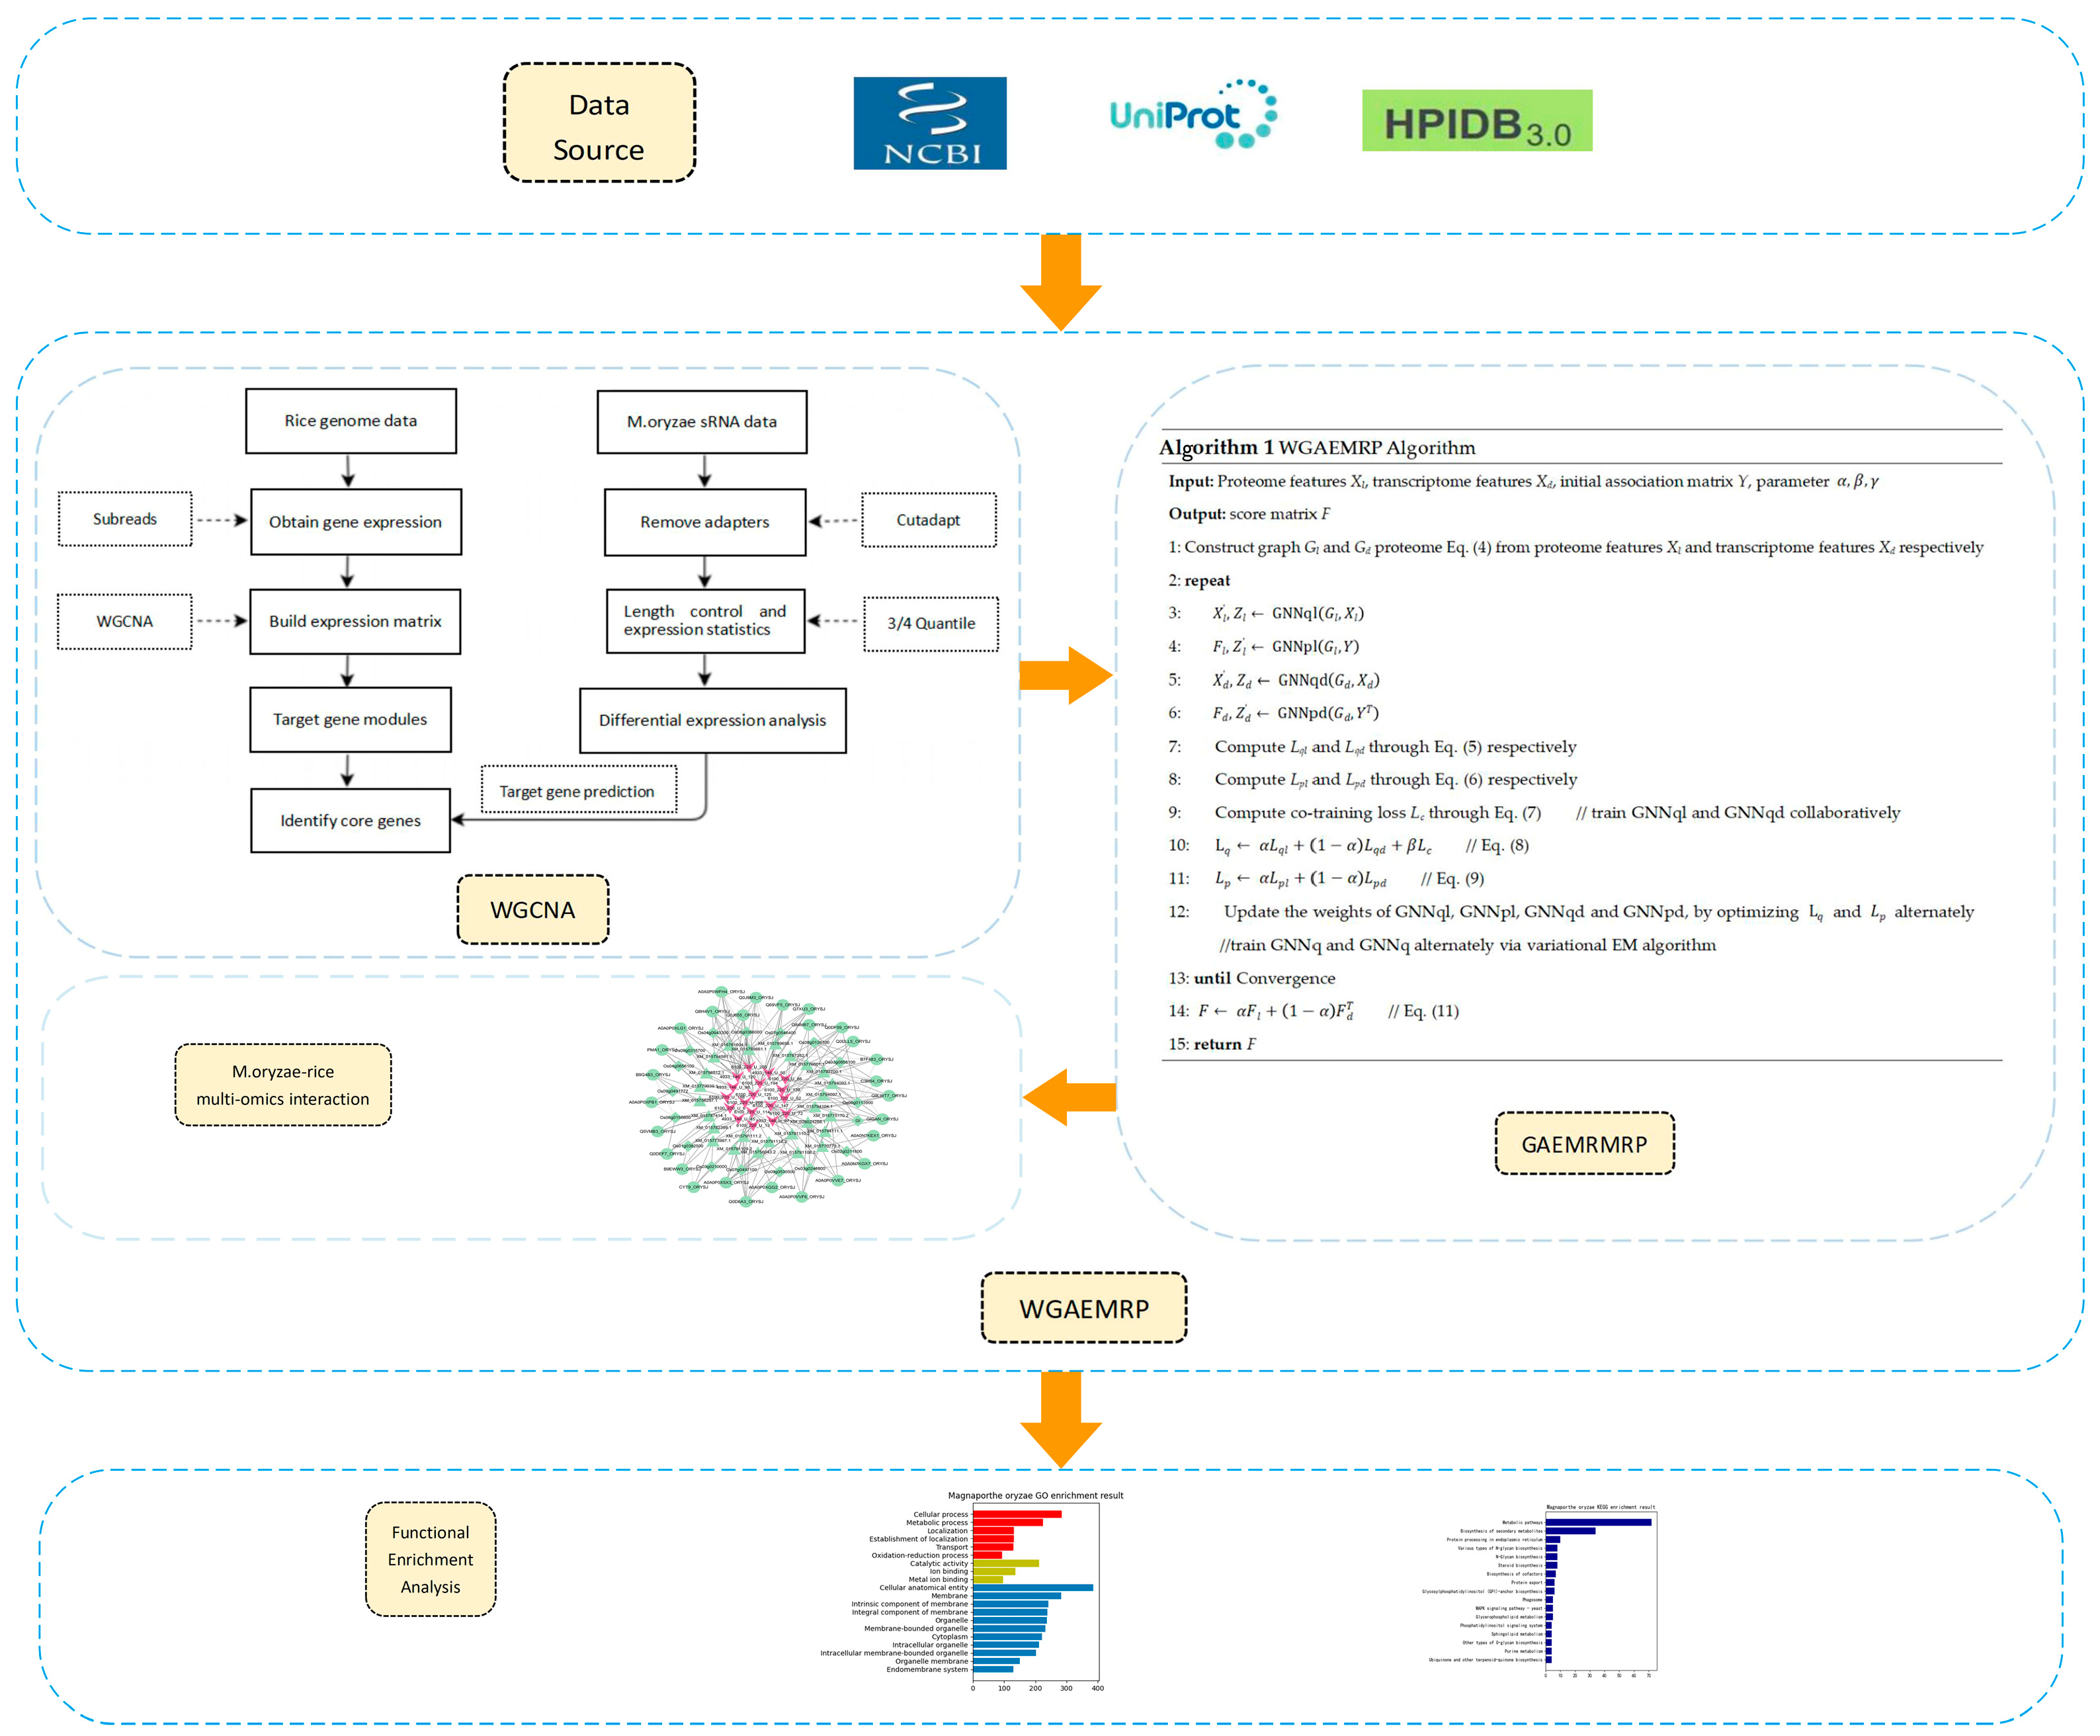
2. Materials and Methods
2.1. Data Resources and Preprocessing
2.2. Algorithm Ideas
2.3. GAEMRMRP Model Based on GAE
2.4. WGAEMRP Algorithm Based on WGCNA and GAEMRMRP
- (1)
- When predicting the relationship between the proteome and the transcriptome, for the features of the transcriptome data, the association with the genome data is used as the feature vector, which is Xd. The feature Xl of the protein sequence is calculated using Word2Vec [56], and the adjacency matrix Y is the known relationship between the proteome and the transcriptome.
- (2)
- According to the feature Xl of the protein sequence and the feature Xd of the transcriptome data, the network Gl and the network Gd of the proteome and transcriptome are constructed, respectively.
- (3)
- GNNql and GNNpl are applied to Gl, requiring Xl and Y as inputs, while GNNqd and GNNpd applied to Gd require Xd and YT as inputs.
- (4)
- The variational EM algorithm is used to train GNNq and GNNp alternately and collaboratively train GNNql and GNNqd. Like other VGAE, the loss function of GNNq is the sum of the reconstruction error Lqr and KL divergence LKL.
- (5)
- The final prediction result fusion is performed according to Equation (11).
| Algorithm 1. WGAEMRP Algorithm |
| Input: Proteome features Xl, transcriptome features Xd, initial association matrix Y, and parameters Output: score matrix F 1: Construct graph Gl and Gd proteome Equation (4) from proteome features Xl and transcriptome features Xd, respectively 2: repeat 3: 4: 5: 6: 7: Compute Lql and Lqd through Equation (5), respectively 8: Compute Lpl and Lpd through Equation (6), respectively 9: Compute the co-training loss Lc through Equation (7) // train GNNql and GNNqd collaboratively 10: // Equation (8) 11: // Equation (9) 12: Update the weights of GNNql, GNNpl, GNNqd, and GNNpd by optimizing and alternately //train GNNq and GNNq alternately via the variational EM algorithm 13: until Convergence 14: // Equation (11) 15: return F |
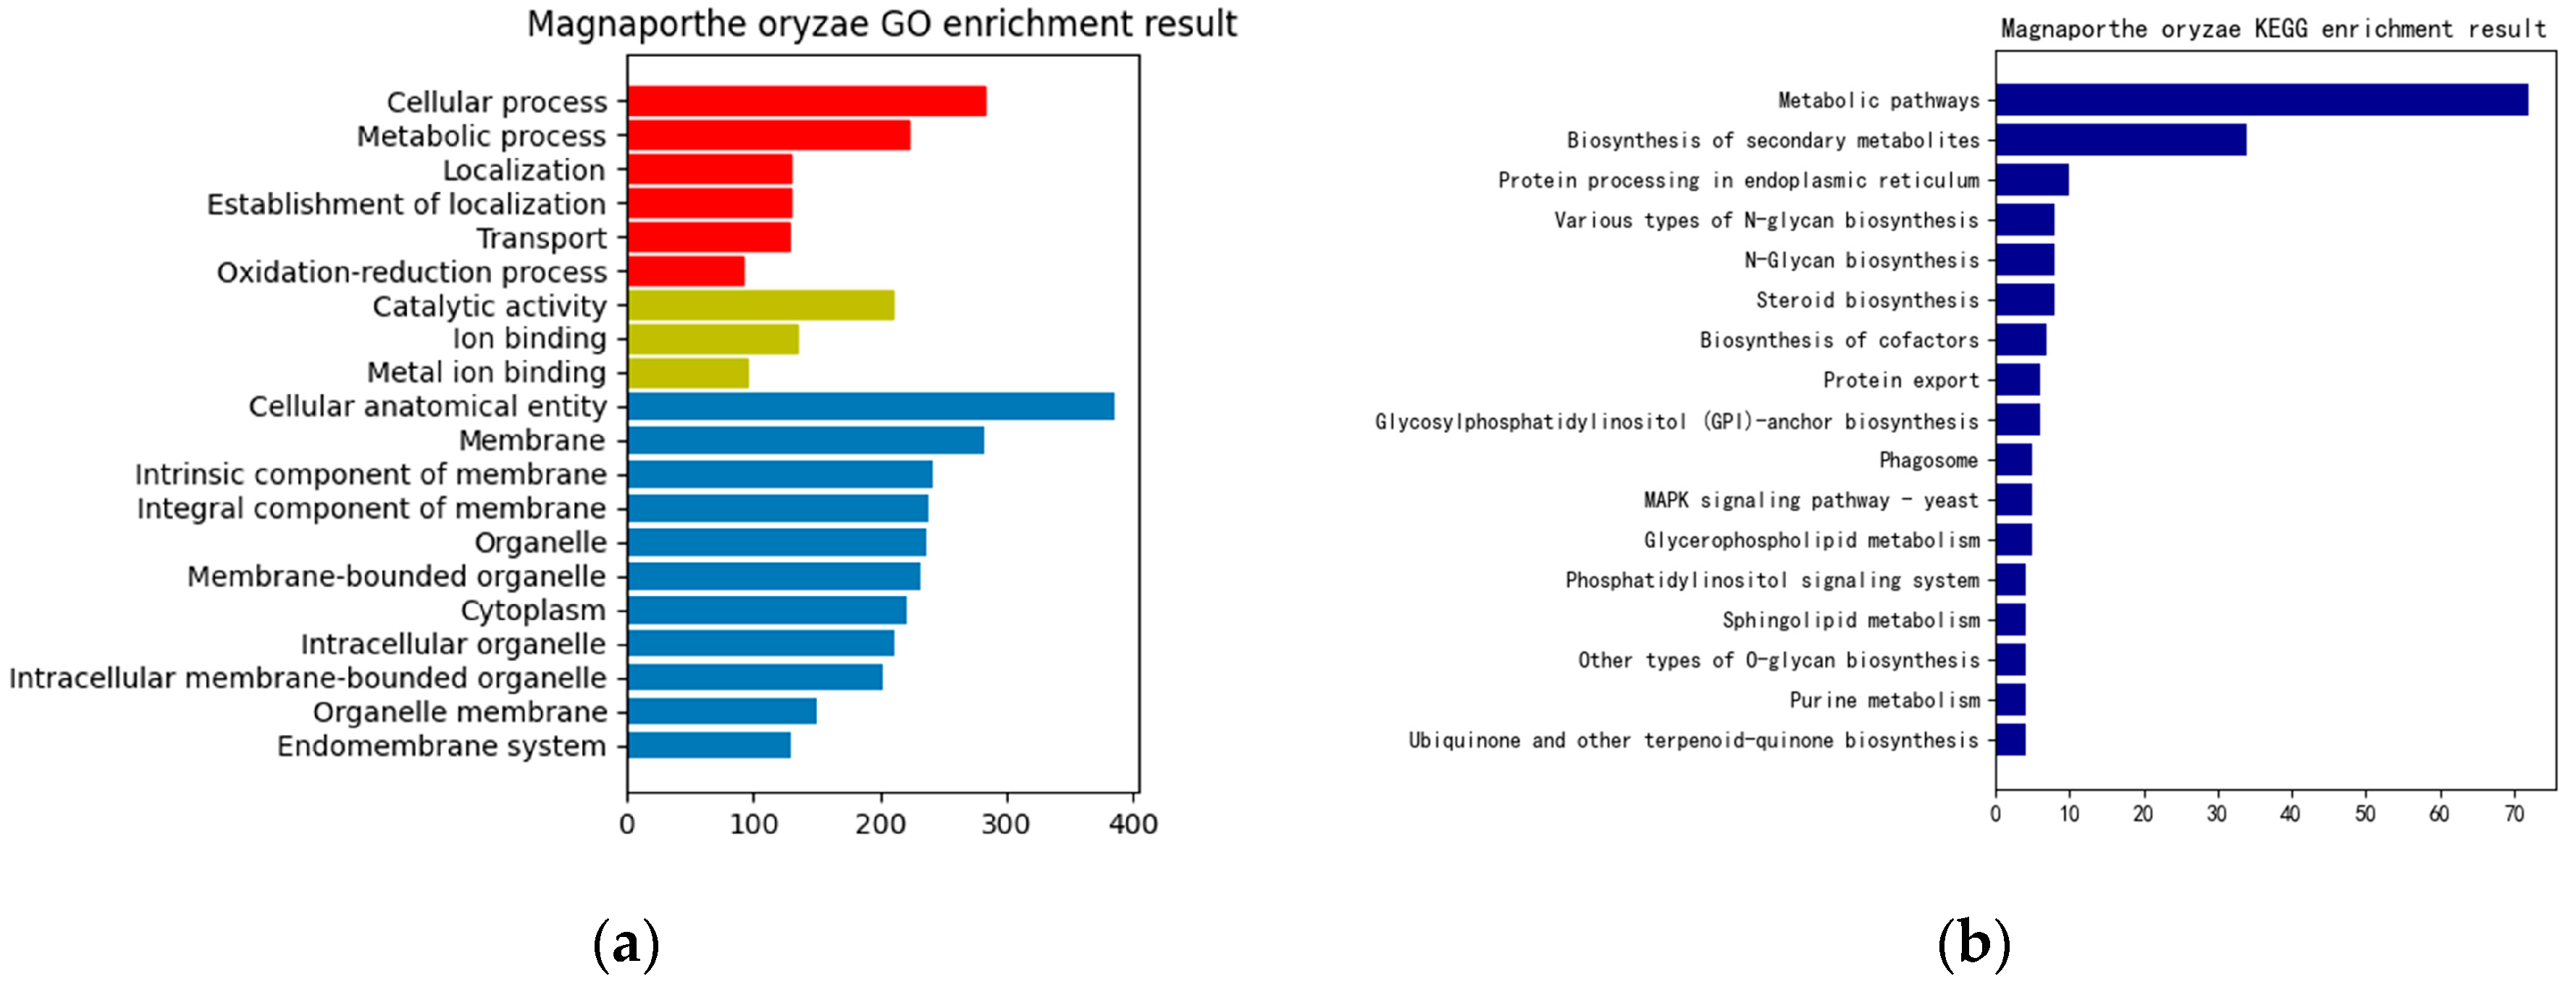
3. Results
4. Discussion
5. Conclusions
Author Contributions
Funding
Institutional Review Board Statement
Informed Consent Statement
Data Availability Statement
Conflicts of Interest
References
- Saleh, D.; Milazzo, J.; Adreit, H.; Fournier, E.; Tharreau, D. South-East Asia is the center of origin, diversity and dispersion of the rice blast fungus, Magnaporthe oryzae. New Phytol. 2014, 201, 1440–1456. [Google Scholar] [CrossRef] [PubMed]
- Roy, K.K.; Reza, M.M.A.; Muzahid-E-Rahman, M.; Mustarin, K.E.; Malaker, P.K.; Barma, N.C.D.; He, X.; Singh, P.K. First report of barley blast caused by Magnaporthe oryzae pathotype Triticum (MoT) in Bangladesh. J. Gen. Plant Pathol. 2021, 87, 184–191. [Google Scholar] [CrossRef]
- Urashima, A.S.; Silva, C.P. Characterization of Magnaporthe grisea (Pyricularia grisea) from black oat in Brazil. J. Phytopathol. 2011, 159, 789–795. [Google Scholar] [CrossRef]
- Kasetsomboon, T.; Kate-Ngam, S.; Sriwongchai, T.; Zhou, B.; Jantasuriyarat, C. Sequence variation of avirulence gene AVR-Pita1 in rice blast fungus, Magnaporthe oryzae. Mycol. Prog. 2013, 12, 617–628. [Google Scholar] [CrossRef]
- Patel, S.; Akhtar, N. Antimicrobial peptides (AMPs): The quintessential ‘offense and defense’ molecules are more than antimicrobials. Biomed. Pharmacother. 2017, 95, 1276–1283. [Google Scholar] [CrossRef] [PubMed]
- Li, W.; Zhu, Z.; Chern, M.; Yin, J.; Yang, C.; Ran, L.; Cheng, M.; He, M.; Wang, K.; Wang, J.; et al. A Natural Allele of a Transcription Factor in Rice Confers Broad-Spectrum Blast Resistance. Cell 2017, 170, 114–126. [Google Scholar] [CrossRef] [PubMed]
- Nelson, R.; Wiesner-Hanks, T.; Wisser, R.; Balint-Kurti, P. Navigating complexity to breed disease-resistant crops. Nat. Rev. Genet. 2018, 19, 21–33. [Google Scholar] [CrossRef]
- Zhang, H.; Zhan, M.; Chang, H.; Song, S.; Zhang, C.; Liu, Y. Research progress of exogenous plant miRNAs in cross-kingdom regulation. Curr. Bioinform. 2019, 14, 241–245. [Google Scholar] [CrossRef]
- Zhang, T.; Chang, H.; Zhang, B.; Liu, S.; Zhao, T.; Zhao, E.; Zhao, H.; Zhang, H. Transboundary Pathogenic microRNA Analysis Framework for Crop Fungi Driven by Biological Big Data and Artificial Intelligence Model. Comput. Biol. Chem. 2020, 89, 107401. [Google Scholar] [CrossRef] [PubMed]
- Wang, S.; Zhang, H.; Liu, Z.; Liu, Y. A Novel Deep Learning Method to Predict Lung Cancer Long-Term Survival With Biological Knowledge Incorporated Gene Expression Images and Clinical Data. Front. Genet. 2022, 13, 800853. [Google Scholar] [CrossRef]
- Yan, W.; Tang, X.; Wang, L.; He, C.; Cui, X.; Yuan, S.; Zhang, H. Applicability analysis of immunotherapy for lung cancer patients based on deep learning. Methods 2022, 205, 149–156. [Google Scholar] [CrossRef] [PubMed]
- Zhong, X.; Liu, Y.; Liu, H.; Zhang, Y.; Wang, L.; Zhang, H. Identification of Potential Prognostic Genes for Neuroblastoma. Front. Genet. 2018, 9, 589. [Google Scholar] [CrossRef] [PubMed]
- Zhang, H.; Li, Z.; Li, Y.; Liu, Y.; Liu, J.; Li, X.; Shen, T.; Duan, Y.; Hu, M.; Xu, D. A computational method for predicting regulation of human microRNAs on the influenza virus genome. BMC Syst. Biol. 2013, 7, 1–14. [Google Scholar] [CrossRef]
- Li, Z.; Zhang, T.; Lei, H.; Wei, L.; Liu, Y.; Shi, Y.; Li, S.; Shen, B.; Guo, H.; Chen, Z.; et al. Research on gastric cancer’s drug-resistant gene regulatory network model. Curr. Bioinform. 2020, 15, 225–234. [Google Scholar] [CrossRef]
- Wang, L.; Zhang, H.; Chang, H.W.; Qin, Q.M.; Zhang, B.R.; Li, X.Q.; Zhao, T.H.; Zhang, T.Y. GAEBic: A Novel Biclustering Analysis Method for miRNA-Targeted Gene Data Based on Graph Autoencoder. J. Comput. Sci. Technol. 2021, 36, 299–309. [Google Scholar] [CrossRef]
- Chi, J.; Song, S.; Zhang, H.; Liu, Y.; Zhao, H.; Dong, L. Research on the Mechanism of Soybean Resistance to Phytophthora Infection Using Machine Learning Methods. Front. Genet. 2021, 12, 634635. [Google Scholar] [CrossRef]
- Chang, H.; Zhang, H.; Zhang, T.; Su, L.; Qin, Q.M.; Li, G.; Li, X.; Wang, L.; Zhao, T.; Zhao, E.; et al. A Multi-Level Iterative Bi-Clustering Method for Discovering miRNA Co-regulation Network of Abiotic Stress Tolerance in Soybeans. Front. Plant Sci. 2022, 13, 860791. [Google Scholar] [CrossRef] [PubMed]
- Xue, M.; Yang, J.; Li, Z.; Hu, S.; Yao, N.; Dean, R.A.; Zhao, W.; Shen, M.; Zhang, H.; Li, C.; et al. Comparative analysis of the genomes of two field isolates of the rice blast fungus Magnaporthe oryzae. PLoS Genet. 2012, 8, e1002869. [Google Scholar] [CrossRef]
- Dean, R.A.; Talbot, N.J.; Ebbole, D.J.; Farman, M.L.; Mitchell, T.K.; Orbach, M.J.; Thon, M.; Kulkarni, R.; Xu, J.R.; Pan, H.; et al. The genome sequence of the rice blast fungus Magnaporthe grisea. Nature 2005, 434, 980–986. [Google Scholar] [CrossRef]
- Kawahara, Y.; de la Bastide, M.; Hamilton, J.P.; Kanamori, H.; McCombie, W.R.; Ouyang, S.; Schwartz, D.C.; Tanaka, T.; Wu, J.; Zhou, S.; et al. Improvement of the Oryza sativa Nipponbare reference genome using next generation sequence and optical map data. Rice 2013, 6, 4. [Google Scholar] [CrossRef]
- International Rice Genome Sequencing Project. The map-based sequence of the rice genome. Nature 2005, 436, 793–800. [Google Scholar] [CrossRef] [PubMed]
- Wang, B.H.; Ebbole, D.J.; Wang, Z.H. The arms race between Magnaporthe oryzae and rice: Diversity and interaction of Avr and R genes. J. Integr. Agric. 2017, 16, 2746–2760. [Google Scholar] [CrossRef]
- Wang, X.; Zhang, R.; Shi, Z.; Zhang, Y.; Sun, X.; Ji, Y.; Zhao, Y.; Wang, J.; Zhang, Y.; Xing, J.; et al. Multi-omics analysis of the development and fracture resistance for maize internode. Sci. Rep. 2019, 9, 8183. [Google Scholar] [CrossRef] [PubMed]
- Brown, J.K. A cost of disease resistance: Paradigm or peculiarity? Trends Genet. 2003, 19, 667–671. [Google Scholar] [CrossRef] [PubMed]
- Qi, H.; Jiang, Z.; Zhang, K.; Yang, S.; He, F.; Zhang, Z. PlaD: A Transcriptomics Database for Plant Defense Responses to Pathogens, Providing New Insights into Plant Immune System. Genom. Proteom. Bioinform. 2018, 16, 283–293. [Google Scholar] [CrossRef] [PubMed]
- Weiberg, A.; Wang, M.; Lin, F.M.; Zhao, H.; Zhang, Z.; Kaloshian, I.; Huang, H.D.; Jin, H. Fungal small RNAs suppress plant immunity by hijacking host RNA interference pathways. Science 2013, 342, 118–123. [Google Scholar] [CrossRef]
- Wang, M.; Weiberg, A.; Dellota, E., Jr.; Yamane, D.; Jin, H. Botrytis small RNA Bc-siR37 suppresses plant defense genes by cross-kingdom RNAi. RNA Biol. 2017, 14, 421–428. [Google Scholar] [CrossRef]
- Kusch, S.; Frantzeskakis, L.; Thieron, H.; Panstruga, R. Small RNAs from cereal powdery mildew pathogens may target host plant genes. Fungal Biol. 2018, 122, 1050–1063. [Google Scholar] [CrossRef]
- Wenlei, C.; Xinxin, C.; Jianhua, Z.; Zhaoyang, Z.; Zhiming, F.; Shouqiang, O.; Shimin, Z. Comprehensive characteristics of microRNA expression profile conferring to Rhizoctonia solani in Rice. Rice Sci. 2020, 27, 101–112. [Google Scholar] [CrossRef]
- Nair, M.M.; Krishna, T.S.; Alagu, M. Bioinformatics insights into microRNA mediated gene regulation in Triticum aestivum during multiple fungal diseases. Plant Gene 2020, 21, 100219. [Google Scholar] [CrossRef]
- Raman, V.; Simon, S.A.; Demirci, F.; Nakano, M.; Meyers, B.C.; Donofrio, N.M. Small RNA Functions Are Required for Growth and Development of Magnaporthe oryzae. Mol. Plant Microbe Interact. 2017, 30, 517–530. [Google Scholar] [CrossRef] [PubMed]
- Urban, M.; Cuzick, A.; Seager, J.; Wood, V.; Rutherford, K.; Venkatesh, S.Y.; De Silva, N.; Martinez, M.C.; Pedro, H.; Yates, A.D.; et al. PHI-base: The pathogen-host interactions database. Nucleic Acids Res. 2020, 48, D613–D620. [Google Scholar] [CrossRef] [PubMed]
- Urban, M.; Cuzick, A.; Rutherford, K.; Irvine, A.; Pedro, H.; Pant, R.; Sadanadan, V.; Khamari, L.; Billal, S.; Mohanty, S.; et al. PHI-base: A new interface and further additions for the multi-species pathogen-host interactions database. Nucleic Acids Res. 2017, 45, D604–D610. [Google Scholar] [CrossRef] [PubMed]
- Yang, F.; Jensen, J.D.; Svensson, B.; Jørgensen, H.J.; Collinge, D.B.; Finnie, C. Secretomics identifies Fusarium graminearum proteins involved in the interaction with barley and wheat. Mol. Plant Pathol. 2012, 13, 445–453. [Google Scholar] [CrossRef]
- Grenville-Briggs, L.J.; Avrova, A.O.; Bruce, C.R.; Williams, A.; Whisson, S.C.; Birch, P.R.; van West, P. Elevated amino acid biosynthesis in Phytophthora infestans during appressorium formation and potato infection. Fungal Genet. Biol. 2005, 42, 244–256. [Google Scholar] [CrossRef]
- Solomon, P.S.; Oliver, R.P. The nitrogen content of the tomato leaf apoplast increases during infection by Cladosporium fulvum. Planta 2001, 213, 241–249. [Google Scholar] [CrossRef]
- McGaha, T.L.; Huang, L.; Lemos, H.; Metz, R.; Mautino, M.; Prendergast, G.C.; Mellor, A.L. Amino acid catabolism: A pivotal regulator of innate and adaptive immunity. Immunol. Rev. 2012, 249, 135–157. [Google Scholar] [CrossRef]
- Grohmann, U.; Bronte, V. Control of immune response by amino acid metabolism. Immunol. Rev. 2010, 236, 243–264. [Google Scholar] [CrossRef]
- Mehta, A.; Brasileiro, A.C.; Souza, D.S.; Romano, E.; Campos, M.A.; Grossi-de-Sá, M.F.; Silva, M.S.; Franco, O.L.; Fragoso, R.R.; Bevitori, R.; et al. Plant-pathogen interactions: What is proteomics telling us? FEBS J. 2008, 275, 3731–3746. [Google Scholar] [CrossRef]
- Larsen, P.E.; Sreedasyam, A.; Trivedi, G.; Desai, S.; Dai, Y.; Cseke, L.J.; Collart, F.R. Multi-Omics Approach Identifies Molecular Mechanisms of Plant-Fungus Mycorrhizal Interaction. Front. Plant Sci. 2016, 6, 1061. [Google Scholar] [CrossRef]
- Kim, J.; Woo, H.R.; Nam, H.G. Toward Systems Understanding of Leaf Senescence: An Integrated Multi-Omics Perspective on Leaf Senescence Research. Mol. Plant 2016, 9, 813–825. [Google Scholar] [CrossRef] [PubMed]
- Großkinsky, D.K.; Syaifullah, S.J.; Roitsch, T. Integration of multi-omics techniques and physiological phenotyping within a holistic phenomics approach to study senescence in model and crop plants. J. Exp. Bot. 2018, 69, 825–844. [Google Scholar] [CrossRef] [PubMed]
- Mahmud, M.; Kaiser, M.S.; Hussain, A.; Vassanelli, S. Applications of Deep Learning and Reinforcement Learning to Biological Data. IEEE Trans. Neural Netw. Learn. Syst. 2018, 29, 2063–2079. [Google Scholar] [CrossRef] [PubMed]
- Su, C.; Tong, J.; Zhu, Y.; Cui, P.; Wang, F. Network embedding in biomedical data science. Brief. Bioinform. 2018, 21, 182–197. [Google Scholar] [CrossRef] [PubMed]
- Kuo, T.C.; Tian, T.F.; Tseng, Y.J. 3Omics: A web-based systems biology tool for analysis, integration and visualization of human transcriptomic, proteomic and metabolomic data. BMC Syst. Biol. 2013, 7, 64. [Google Scholar] [CrossRef] [PubMed]
- Lourenço, A.; Ferreira, A.; Veiga, N.; Machado, I.; Pereira, M.O.; Azevedo, N.F. BiofOmics: A Web platform for the systematic and standardized collection of high-throughput biofilm data. PLoS ONE 2012, 7, e39960. [Google Scholar] [CrossRef]
- Shen, R.; Olshen, A.B.; Ladanyi, M. Integrative clustering of multiple genomic data types using a joint latent variable model with application to breast and lung cancer subtype analysis. Bioinformatics 2009, 25, 2906–2912. [Google Scholar] [CrossRef] [PubMed]
- Wang, B.; Mezlini, A.M.; Demir, F.; Fiume, M.; Tu, Z.; Brudno, M.; Haibe-Kains, B.; Goldenberg, A. Similarity network fusion for aggregating data types on a genomic scale. Nat. Methods 2014, 11, 333–337. [Google Scholar] [CrossRef] [PubMed]
- Zhang, Y.; Xia, R.; Kuang, H.; Meyers, B.C. The Diversification of Plant NBS-LRR Defense Genes Directs the Evolution of MicroRNAs That Target Them. Mol. Biol. Evol. 2016, 33, 2692–2705. [Google Scholar] [CrossRef]
- Zhang, H.; Liu, S.; Chang, H.; Zhan, M.; Qin, Q.M.; Zhang, B.; Li, Z.; Liu, Y. Mining Magnaporthe oryzae sRNAs With Potential Transboundary Regulation of Rice Genes Associated With Growth and Defense Through Expression Profile Analysis of the Pathogen-Infected Rice. Front. Genet. 2019, 10, 296. [Google Scholar] [CrossRef]
- Chang, H.; Zhang, H.; Qin, Q.M.; Zhang, T.; Zhang, T.; Liu, Y.; Liu, H.; Zhong, X.; Song, S.; Shen, B. Identification of novel Phytophthora infestans small RNAs involved in potato late blight reveals potential cross-kingdom regulation to facilitate oomycete infection. Int. J. Data Min. Bioinform. 2020, 23, 119–141. [Google Scholar] [CrossRef]
- Parker, D.; Beckmann, M.; Zubair, H.; Enot, D.P.; Caracuel-Rios, Z.; Overy, D.P.; Snowdon, S.; Talbot, N.J.; Draper, J. Metabolomic analysis reveals a common pattern of metabolic re-programming during invasion of three host plant species by Magnaporthe grisea. Plant J. 2009, 59, 723–737. [Google Scholar] [CrossRef] [PubMed]
- Chi, J.; Zhang, H.; Zhang, T.; Zhao, E.; Zhao, T.; Zhao, H.; Yuan, S. Exploring the Common Mechanism of Fungal sRNA Transboundary Regulation of Plants Based on Ensemble Learning Methods. Front. Genet. 2022, 13, 816478. [Google Scholar] [CrossRef] [PubMed]
- Zhang, H.; Li, Y.; Liu, Y.; Liu, H.; Wang, H.; Jin, W.; Zhang, Y.; Zhang, C.; Xu, D. Role of plant MicroRNA in cross-species regulatory networks of humans. BMC Syst. Biol. 2016, 10, 60. [Google Scholar] [CrossRef] [PubMed]
- Paszke, A.; Gross, S.; Massa, F.; Lerer, A.; Bradbury, J.; Chanan, G.; Killeen, T.; Lin, Z.; Gimelshein, N.; Antiga, L.; et al. Pytorch: An imperative style, high-performance deep learning library. Adv. Neural Inf. Process. Syst. 2019, 32, 8024–8035. [Google Scholar]
- Le, Q.; Mikolov, T. Distributed representations of sentences and documents. In International Conference on Machine Learning; ML Research Press: Beijing, China, 2014; pp. 1188–1196. [Google Scholar]
- Zhao, E.; Zhang, H.; Li, X.; Zhao, T.; Zhao, H. Construction of sRNA Regulatory Network for Magnaporthe oryzae Infecting Rice Based on Multi-Omics Data. Front. Genet. 2021, 12, 763915. [Google Scholar] [CrossRef]
- van Dam, S.; Võsa, U.; van der Graaf, A.; Franke, L.; de Magalhães, J.P. Gene co-expression analysis for functional classification and gene-disease predictions. Brief. Bioinform. 2018, 19, 575–592. [Google Scholar] [CrossRef]
- Pei, G.; Chen, L.; Zhang, W. WGCNA Application to Proteomic and Metabolomic Data Analysis. Methods Enzymol. 2017, 585, 135–158. [Google Scholar]
- Li, W.; Chern, M.; Yin, J.; Wang, J.; Chen, X. Recent advances in broad-spectrum resistance to the rice blast disease. Curr. Opin. Plant Biol. 2019, 50, 114–120. [Google Scholar] [CrossRef]
- Chuma, I.; Isobe, C.; Hotta, Y.; Ibaragi, K.; Futamata, N.; Kusaba, M.; Yoshida, K.; Terauchi, R.; Fujita, Y.; Nakayashiki, H.; et al. Multiple translocation of the AVR-Pita effector gene among chromosomes of the rice blast fungus Magnaporthe oryzae and related species. PLoS Pathog. 2011, 7, e1002147. [Google Scholar] [CrossRef]


| Protein | sRNA/mRNA | Score |
|---|---|---|
| Q0J9M3_ORYSJ | XM_015789661.1 | 0.256037617 |
| Q0J9M3_ORYSJ | 4933_146_U_50 | 0.254859433 |
| Q0J9M3_ORYSJ | XM_015789658.1 | 0.253295534 |
| A0A0P0WFH4_ORYSJ | XM_015789661.1 | 0.251212673 |
| A0A0P0WFH4_ORYSJ | 4933_146_U_50 | 0.251002283 |
| C3H54_ORYSJ | XM_015787282.1 | 0.25043423 |
| B7F483_ORYSJ | XM_015787282.1 | 0.250195788 |
| C3H54_ORYSJ | 6100_220_U_86 | 0.249845138 |
| Q0J9M3_ORYSJ | 6100_220_U_194 | 0.249648774 |
| B7F483_ORYSJ | 6100_220_U_86 | 0.249606696 |
| Protein | Gene | Score |
|---|---|---|
| C3H54_ORYSJ | Os06g0113900 | 0.22856142 |
| B7F483_ORYSJ | Os06g0113900 | 0.228370044 |
| A0A0P0XLG1_ORYSJ | Os08g0366000 | 0.215526588 |
| Q0J655_ORYSJ | Os03g0858100 | 0.210768768 |
| B9G4B3_ORYSJ | Os06g0155600 | 0.199169256 |
| A0A0P0XPB1_ORYSJ | Os06g0155600 | 0.194762292 |
| CYT9_ORYSJ | Os01g0382500 | 0.190769976 |
| GIGAN_ORYSJ | Os03g0858100 | 0.18874458 |
| A0A0P0WFH4_ORYSJ | Os07g0546400 | 0.184396092 |
| PMA1_ORYSJ | Os08g0366000 | 0.182716236 |
| sRNA/mRNA | Gene | Score |
|---|---|---|
| XM_015775170.2 | Os07g0497100 | 0.392323263 |
| XM_015756043.2 | Os07g0497100 | 0.389914638 |
| XM_026024258.1 | Os07g0497100 | 0.273902412 |
| XM_015791110.2 | Os03g0246800 | 0.221535693 |
| XM_015791108.2 | Os03g0246800 | 0.188026902 |
| XM_015756043.2 | Os03g0246800 | 0.187596561 |
| XM_015791111.2 | Os03g0246800 | 0.187570869 |
| XM_015791112.2 | Os03g0246800 | 0.187570869 |
| XM_015791109.2 | Os03g0246800 | 0.187333218 |
| XM_015770772.1 | GI | 0.182458161 |
| Proteome–Transcriptome | |||||||
| Time | 1 | 2 | 3 | 4 | 5 | Mean | Stdev |
| AUROC | 0.9432 | 0.9459 | 0.9471 | 0.9498 | 0.9642 | 0.9500 | 0.0083 |
| AUPR | 0.3901 | 0.6939 | 0.7013 | 0.3917 | 0.6646 | 0.5683 | 0.1625 |
| Proteome–Genome | |||||||
| Time | 1 | 2 | 3 | 4 | 5 | Mean | Stdev |
| AUROC | 0.8955 | 0.8897 | 0.8923 | 0.8974 | 0.9150 | 0.8980 | 0.0100 |
| AUPR | 0.2514 | 0.5146 | 0.4913 | 0.2259 | 0.5316 | 0.4030 | 0.1509 |
| Transcriptome–Genome | |||||||
| Time | 1 | 2 | 3 | 4 | 5 | Mean | Stdev |
| AUROC | 0.9017 | 0.9088 | 0.9042 | 0.8648 | 0.8999 | 0.6423 | 0.0177 |
| AUPR | 0.3091 | 0.6294 | 0.4848 | 0.5555 | 0.6423 | 0.5242 | 0.1358 |
| Algorithm Name | Omics | Basic Algorithms | Results | Advantages | Disadvantages |
|---|---|---|---|---|---|
| / | Genome and transcriptome | SVM | Key sRNA of MoO | Screened out differentially expressed sRNAs of MoO | Lacking the support of proteomic data |
| / | Genome, transcriptome and proteome | RNN | Cross-species protein interaction network | Analysis of cross-species regulatory mechanism | Model prediction only for proteomic data |
| WGAEMRP | Genome, transcriptome and proteome | WGCNA and graph autoencoder | Multi-omics heterogeneous interaction network | Predicted for multi-omics relationship data | The model failed to predict the relationship between the three omics directly |
| sRNA | Target_Accession Number | Target_Name | Target_Organism |
|---|---|---|---|
| 4933_146_U_50 | AJ704622.1; KP985760.1; MH807580.1 | ACE1; Pi50; Pizh | Pyricularia grisea; Oryza sativa Japonica Group |
| 6100_220_U_147 | EU837058.1; DQ285630.1; MH807580.1 | AvrPiz-t; Pi9; Pizh | Pyricularia grisea; Oryza sativa Indica Group; Oryza sativa Japonica Group |
| 6100_220_U_188 | EU837058.1; DQ285630.1; MH807580.1 | AvrPiz-t; Pi9; Pizh | Pyricularia grisea; Oryza sativa Indica Group; Oryza sativa Japonica Group |
| 6100_220_U_194 | AJ704622.1; KP985760.1; MH807580.1 | ACE1; Pi50; Pizh | Pyricularia grisea; Oryza sativa Japonica Group |
| 6100_220_U_208 | KM522920.1 | IUG9 | Pyricularia oryzae |
| 6100_220_U_86 | KM522920.1 | IUG9 | Pyricularia oryzae |
| 4933_146_U_97 | KP985760.1; MH807580.1 | Pi50; Pizh | Oryza sativa Japonica Group |
| 4933_146_U_98 | KP985760.1; MH807580.1 | Pi50; Pizh | Oryza sativa Japonica Group |
| 6100_220_U_139 | MH807580.1 | Pizh | Oryza sativa Japonica Group |
| 6100_220_U_52 | DQ285630.1; KP985760.1; MH807580.1 | Pi9; Pi50; Pizh | Oryza sativa Indica Group; Oryza sativa Japonica Group |
| 6100_220_U_72 | HM048900.1 | Pik | Oryza sativa Japonica Group |
Disclaimer/Publisher’s Note: The statements, opinions and data contained in all publications are solely those of the individual author(s) and contributor(s) and not of MDPI and/or the editor(s). MDPI and/or the editor(s) disclaim responsibility for any injury to people or property resulting from any ideas, methods, instructions or products referred to in the content. |
© 2023 by the authors. Licensee MDPI, Basel, Switzerland. This article is an open access article distributed under the terms and conditions of the Creative Commons Attribution (CC BY) license (https://creativecommons.org/licenses/by/4.0/).
Share and Cite
Zhao, E.; Dong, L.; Zhao, H.; Zhang, H.; Zhang, T.; Yuan, S.; Jiao, J.; Chen, K.; Sheng, J.; Yang, H.; et al. A Relationship Prediction Method for Magnaporthe oryzae–Rice Multi-Omics Data Based on WGCNA and Graph Autoencoder. J. Fungi 2023, 9, 1007. https://doi.org/10.3390/jof9101007
Zhao E, Dong L, Zhao H, Zhang H, Zhang T, Yuan S, Jiao J, Chen K, Sheng J, Yang H, et al. A Relationship Prediction Method for Magnaporthe oryzae–Rice Multi-Omics Data Based on WGCNA and Graph Autoencoder. Journal of Fungi. 2023; 9(10):1007. https://doi.org/10.3390/jof9101007
Chicago/Turabian StyleZhao, Enshuang, Liyan Dong, Hengyi Zhao, Hao Zhang, Tianyue Zhang, Shuai Yuan, Jiao Jiao, Kang Chen, Jianhua Sheng, Hongbo Yang, and et al. 2023. "A Relationship Prediction Method for Magnaporthe oryzae–Rice Multi-Omics Data Based on WGCNA and Graph Autoencoder" Journal of Fungi 9, no. 10: 1007. https://doi.org/10.3390/jof9101007