Article

Investigations upon the Improvement of Dermatophyte Identification Using an Online Mass Spectrometry Application

1
AP-HP (Assistance Publique-Hôpitaux de Paris), Service de Parasitologie Mycologie, Hôpital La Pitié-Salpêtrière, 75013 Paris, France
2
AP-HP, Hôpital Saint-Antoine, Service de Parasitologie Mycologie, Sorbonne Université, 75012 Paris, France
3
Inserm, Centre d’Immunologie et des Maladies Infectieuses (CIMI-Paris), AP-HP, Hôpital Pitié-Salpêtrière, 75013 Paris, France
4
Dynamic Research Group, Ecole Nationale Vétérinaire d’Alfort, UPEC, USC ANSES, 94700 Maisons-Alfort, France
5
Department of Parasitology-Mycology, Ecole Nationale Vétérinaire, Agroalimentaire et de L’alimentation, Oniris, 44307 Nantes, France
6
Service de Parasitologie-Mycologie, Ecole Nationale Vétérinaire d’Alfort, Biopole Alfort, 94700 Maisons-Alfort, France
7
Centre Hospitalier Universitaire Vétérinaire de la Faune Sauvage (Chuv-FS), Ecole nationale vétérinaire d’Alfort, 94700 Maisons-Alfort, France
8
AP-HP, Hôpital Avicenne, Service de Parasitologie-Mycologie, 93000 Bobigny, France
9
EA3593 Ecosystèmes Amazoniens et Pathologie Tropicale, Université de Guyane, 97300 Cayenne, French Guiana
10
Hôpital Andrée Rosemon, Laboratoire Hospitalo-Universitaire de Parasitologie-Mycologie, 97300 Cayenne, French Guiana
11
Service de Dermatologie, Cayenne Hospital, CEDEX 97300 Cayenne, French Guiana
12
Inserm, Institut Pierre Louis d’Epidemiologie et de Santé Publique, Sorbonne Université, 75571 Paris, France
13
Sciensano, BCCM/IHEM Collection, Mycology and Aerobiology Unit, 1000 Brussels, Belgium
*
Author to whom correspondence should be addressed.
J. Fungi 2022, 8(1), 73; https://doi.org/10.3390/jof8010073
Submission received: 17 December 2021 / Revised: 31 December 2021 / Accepted: 7 January 2022 / Published: 11 January 2022
(This article belongs to the Special Issue Epidemiology and Pathogenesis of Dermatophytes)

Abstract

:
Online MALDI-TOF mass spectrometry applications, such as MSI-2, have been shown to help identify dermatophytes, but recurrent errors are still observed between phylogenetically close species. The objective of this study was to assess different approaches to reduce the occurrence of such errors by adding new reference spectra to the MSI-2 application. Nine libraries were set up, comprising an increasing number of spectra obtained from reference strains that were submitted to various culture durations on two distinct culture media: Sabouraud gentamicin chloramphenicol medium and IDFP Conidia medium. The final library included spectra from 111 strains of 20 species obtained from cultures on both media collected every three days after the appearance of the colony. The performance of each library was then analyzed using a cross-validation approach. The spectra acquisitions were carried out using a Microflex Bruker spectrometer. Diversifying the references and adding spectra from various culture media and culture durations improved identification performance. The percentage of correct identification at the species level rose from 63.4 to 91.7% when combining all approaches. Nevertheless, residual confusion between close species, such as Trichophyton rubrum, Trichophyton violaceum and Trichophyton soudanense, remained. To distinguish between these species, mass spectrometry identification should take into account basic morphological and/or clinico-epidemiological features.

1. Introduction

Dermatophytes are a monophyletic clade of keratinophilic fungi (Arthrodermataceae) that are frequent skin pathogens in human and animals [1,2]. Until the 2000 s, dermatophyte identification was mostly based on macroscopic and microscopic morphological features. This conventional approach requires well-trained professionals and extended culture time. MALDI-TOF mass spectrometry appeared as an alternative allowing earlier and standardized identification of fungal colonies. Many studies have been published since 2008 [3,4] demonstrating the interest of this identification method. The best performances have been obtained with “in-house” libraries and not commercial libraries [5]. Nevertheless, recurrent errors still occurred regarding closely related species such as T. rubrum, T. violaceum and T. soudanense; Trichophyton interdigitale and Trichophyton mentagrophytes; Trichophyton equinum and Trichophyton tonsurans; and Microsporum audouinii and Microsporum canis [5,6,7,8,9,10]. The boundaries between these species or even the validity of some of them have been controversial [11,12,13,14]. In 2017, the updated taxonomy of dermatophytes [1] gathered them in species complexes, calling for further studies to better distinguish species within these complexes. Recent studies on the T. rubrum complex [15,16] and T. equinum/T. tonsurans [17] complex have tended to confirm the validity of the species boundaries. In contrast, many genotypes have been described inside the T. interdigitale/T. mentagrophytes complex, raising new questions about the corresponding species boundaries [18]. Finally, Microsporum species distinction appeared less controversial [19,20].
To improve MALDI-TOF mass spectral fungal identification, an online application named MSI was launched in 2017. Even if it allowed for an improvement of dermatophyte identification, mistakes between closely related species were still observed with MSI [21,22,23,24]. Sharing most of its references with MSI, MSI-2 (https://msi.happy-dev.fr/ (accessed on 12 December 2021)) is a new application typified by more accurate algorithms and an extended fungal database [25]. The aim of this study was to improve MSI-2’s library of references for the identification of dermatophytes, investigating two improvements: increasing the number of reference strains per species and including more spectra per reference strain obtained from cultures of various ages. Furthermore, as a new culture plate named ID-fungi plate (IDFP) (Conidia, Lyon, France) has been developed to facilitate mass spectra realization from fungal cultures, we also investigated the interest of including spectra from cultures on this media in the MSI-2 references.

2. Materials and Methods

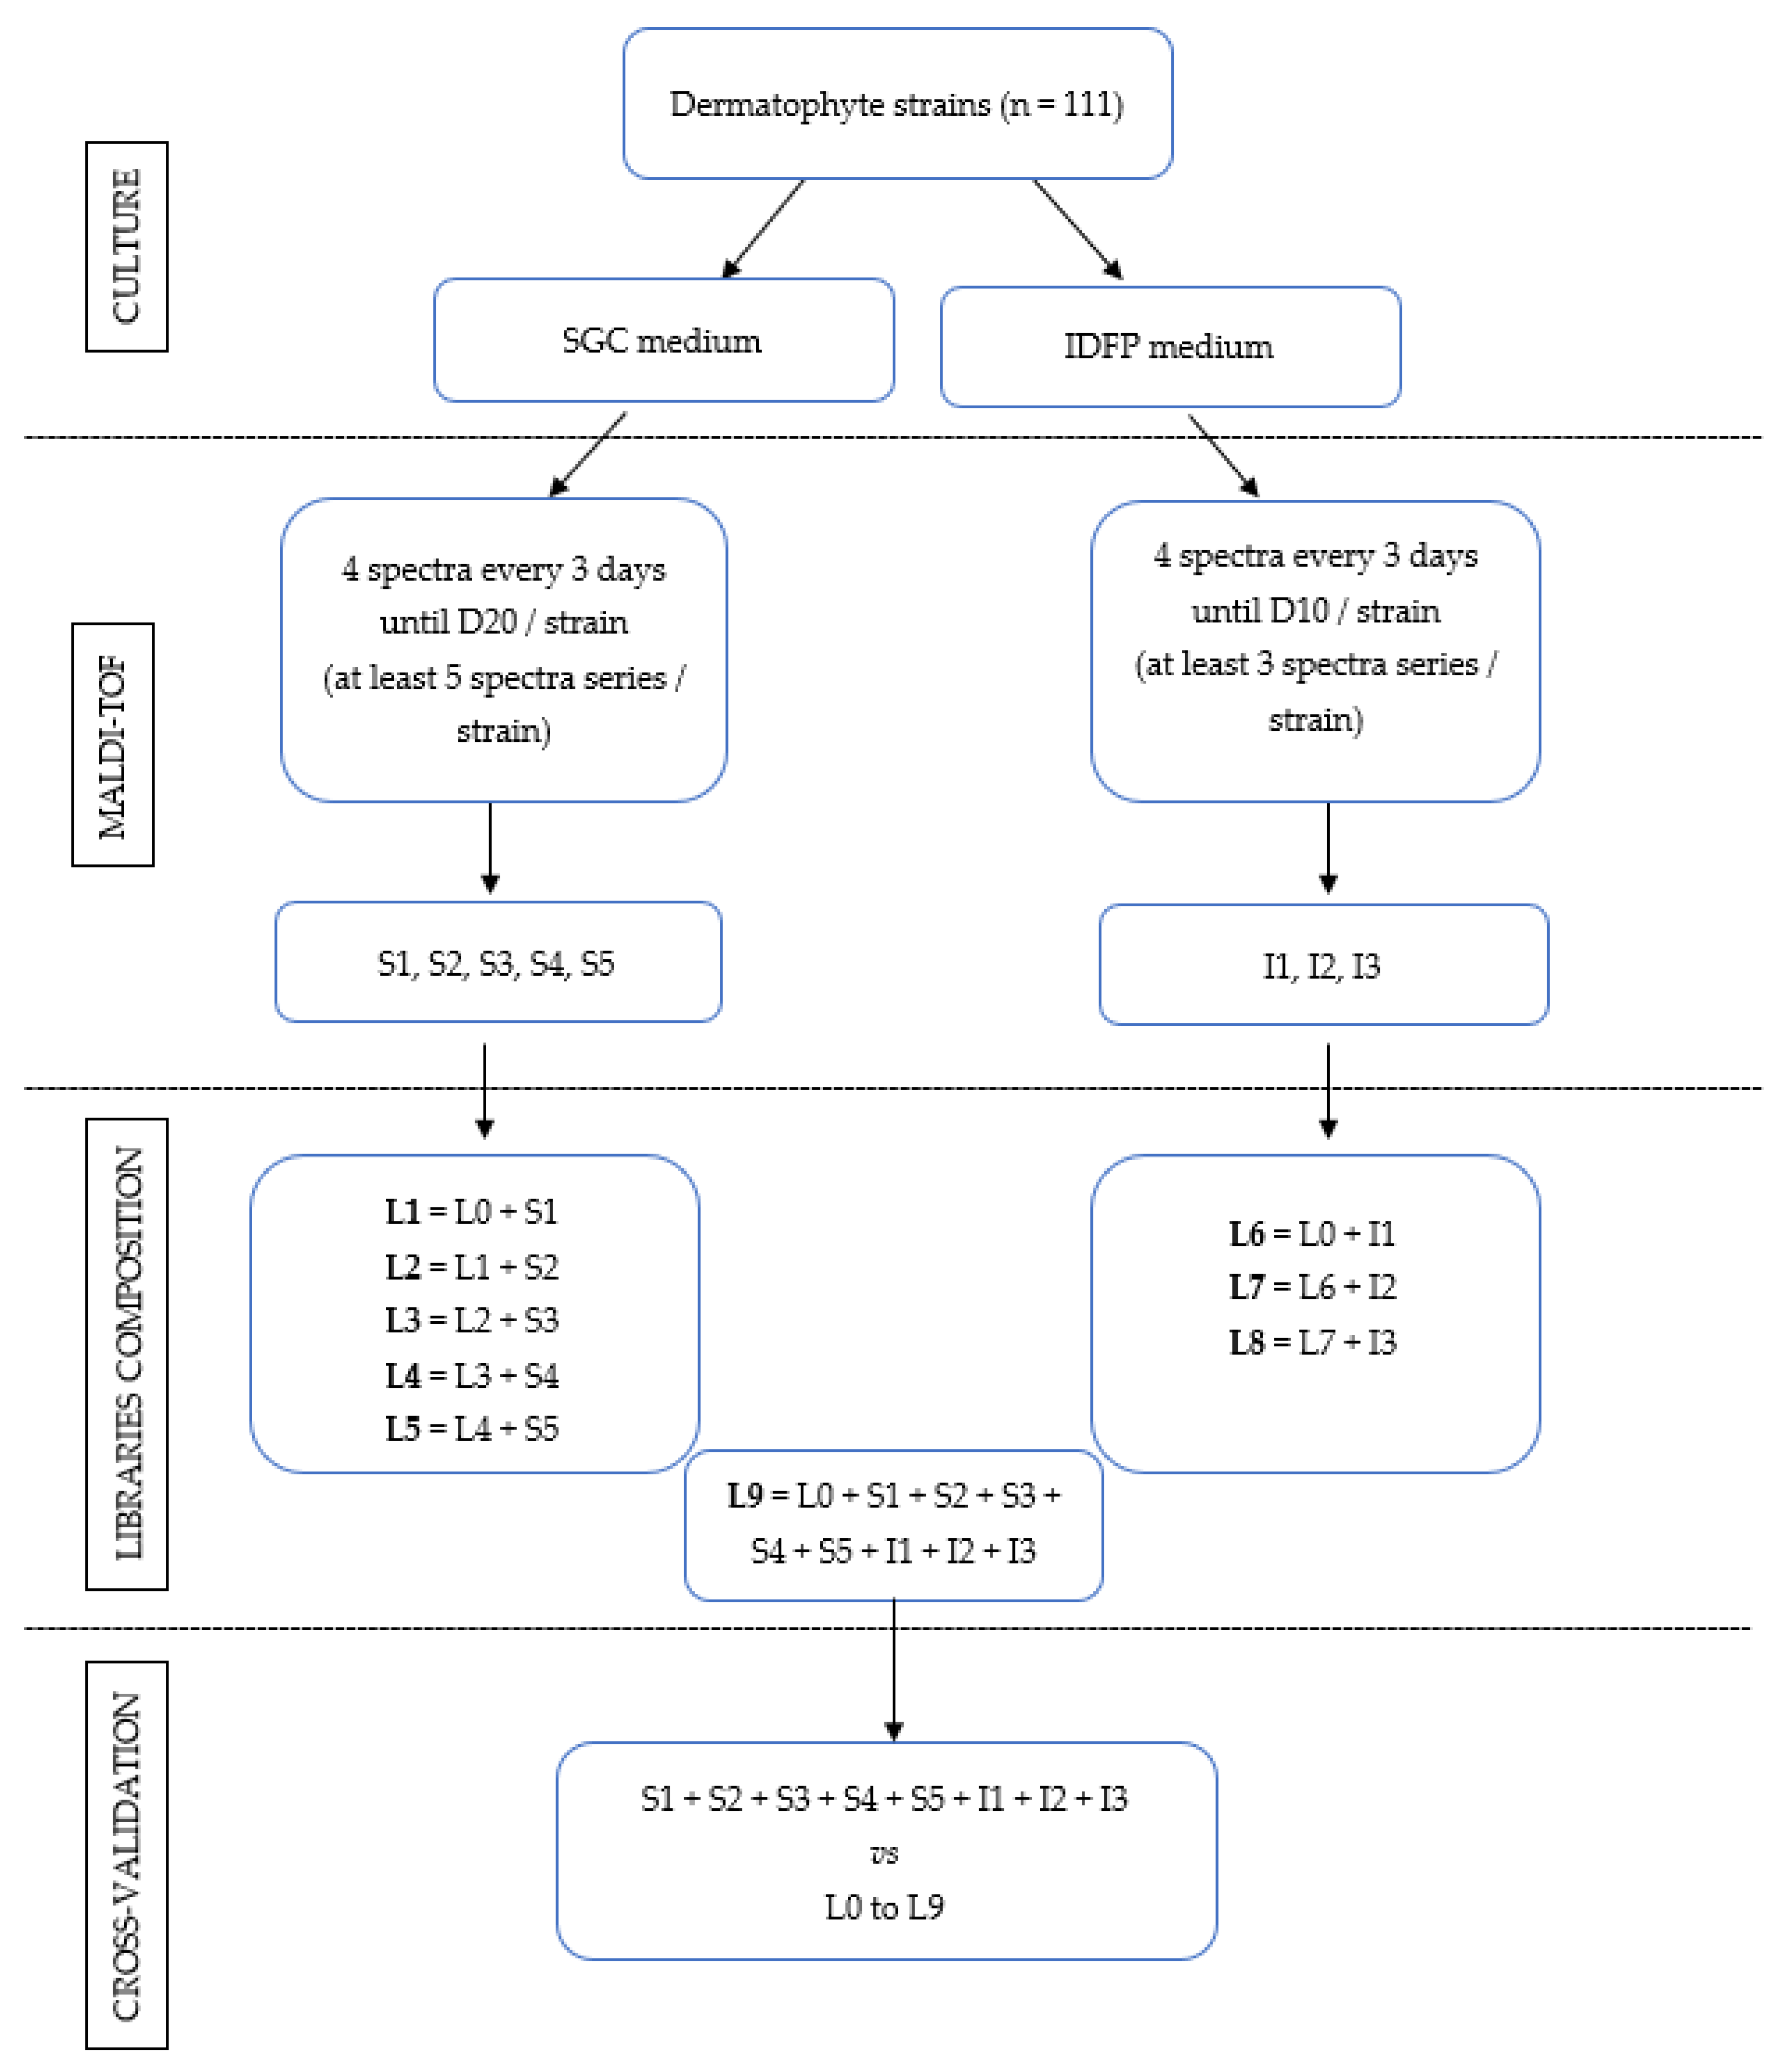
2.1. Strains and Culture

Fifty-five strains of dermatophytes were collected from four teaching hospitals (La Pitié-Salpêtrière and Saint-Antoine hospitals in Paris, France, Avicenne Hospital in Bobigny, France and Cayenne Hospital in French Guiana, France), twenty-eight from the national veterinary College of Alfort and twenty-eight additional strains from BCCM/IHEM Fungi Collection (Brussels, Belgium). The 111 strains used in this study are listed in Table S1. They correspond to 20 dermatophyte species (1 to 14 strains per species).
The strains were reseeded on two culture plates: Sabouraud medium with gentamicin and chloramphenicol but without cycloheximide (Oxoid, Dardilly, France) (SGC) and IDFP medium. The media were incubated at 25 °C until all successive mass spectra were obtained.

2.2. Sequencing

Sequencing of the ITS1-5.8S-ITS2 region was performed for all strains and was used as the reference for the identifications. The primers used were ITS1 (TCCGTAGGTGAACCTGCGG) and ITS4c (TCCTCCGCTTATTGATATGC). DNA extraction was performed on an Emag machine (Biomérieux, Marcy-l’Étoile, France). The reaction mixture for PCR consisted of 30 µL of 1X LC480 mix (Roche Diagnostics, Basel, Switzerland) with 0.3 µL of the primer pair at a concentration of 10 pmol/µL and 2 µL of DNA extract. The PCR program consisted of an initial 10 min denaturation step at 94 °C followed by 40 cycles of 20 s denaturation at 94 °C, 30 s annealing at 55 °C and 60 s elongation at 72 °C and finally a final elongation step of 7 min at 72 °C. Sequencing was carried out using an ABI3730 DNA sequencer (Thermo Fisher Scientific, Waltham, MA, USA) via the Sanger technique. Species identification was obtained through the alignment of the ITS sequences of the isolates with those of the reference strains [1] available in GenBank in MEGA X software version 10.1.8 (Kumar, Stecher, Li, Knyaz, and Tamura 2018) to compare the base-to-base sequences. Indeed, it has been demonstrated that database results by automated comparison may be inaccurate [26].
The genotype determination of isolates belonging to three complexes of closely related species (T. rubrum complex [15], T. interdigitale/T. mentagrophytes complex [18] and T. tonsurans/T. equinum [27] complex) was carried out via comparison with the ITS sequences of published strains also available in GenBank.

2.3. MALDI-TOF Mass Spectrometry

The cultures were subjected to the MALDI-TOF extraction protocol as soon as the growth of the dermatophyte was sufficient to allow the collection of biological material without fear of preventing the further growth of the fungus. For cultures on SGC plates, the mass spectra were acquired approximately every three days, at least until the twentieth day post-seeding, to obtain at least five series of successive spectra. For cultures on IDFP medium, mass spectra were acquired approximately every three days, at least until the tenth day post-seeding, to obtain at least three series of successive spectra. The acquired spectra were gathered in files according to the chronology of the realization of the spectra and the culture medium. Files S1 to S5 group together the five series of spectra obtained from isolates grown on SGC plates, and I1 to I3 group together the three series acquired from the same isolates grown on IDFP.
Mass spectra were acquired after complete protein extraction. A small fragment of colony was collected from the culture dish with a scalpel blade and suspended in a mixture of 300 µL of sterile water and 900 µL of anhydrous ethyl alcohol in a sterile 1.5 mL tube. After centrifugation for 2 min at 13,000× g, the pellet was resuspended in 10 µL of 70% formic acid for 5 min before the addition of 10 µL of 100% acetonitrile and incubation for 5 min. After further centrifugation (13,000× g, 2 min), 1 μL of supernatant was deposited in quadruplicate for the same extract on a polished steel target. After air drying, 1 µL of matrix (HCCA) was applied to each deposit. The spectra acquisitions were carried out using a Microflex Bruker spectrometer (Bruker Daltonics, Bremen, Germany), and the manufacturer’s default parameters were applied. In the event of an acquisition failure according to Bruker’s criteria, the obtained spectra were not rejected; instead, the sum of the rejected spectra was saved for each deposit in question.

2.4. Libraries of Spectra

The original spectra library (L0) that was included in MSI-2 before this study included 612 representative spectra of 51 different species with one to eight different strains per species (Table S2). We used L0 as a starting point to determine the impact of the addition of spectra from cultures of various ages and on two different media. For that purpose, nine new libraries were created. Libraries L1 to L5 were formed by the successive addition to L0 of files S1 to S5 (spectra of increasing age acquired from cultures on SGC). For instance, L1 was formed by the addition to L0 of files S1 and L2 by the addition to L1 of file S2. Libraries L6 to L8 were formed on the same principle but by the addition to L0 of files I1 to I3 (spectra of increasing age acquired from cultures on IDFP). L9 was formed by the addition to L0 of all additional spectra acquired from cultures on SGC (S1 to S5) and IDFP (I1 to I3).

2.5. Cross-Validation

All spectra produced were submitted to each library. Self-recognitions of spectra obtained from the same strain were excluded. This indicates that a submitted spectrum could not be compared with a spectrum made from the same strain regardless of age or culture medium. Consequently, it was not possible to assess the results corresponding to the species represented by a single strain (Arthroderma quadrifidum, Nannizzia incurvata and Paraphyton cookei). Indeed, the prohibition of self-recognition makes these results irrelevant.
The identification threshold for MSI-2 was set at 20. A maximum of three identifications were returned, corresponding to the three species that gave the highest MSI-2 results. The first identification was compared with the result of ITS sequencing for each strain. If they were identical, the identification was considered correct; otherwise, it was considered incorrect. If the score was below 20, no identification was retained.
The global design of the study is summarized in Figure 1.

2.6. Statistical Analysis

Statistical analyses used McNemar’s nonparametric paired sample test and were performed using XLSTAT 2021.2.2software (Addinsoft, Paris, France), with α risk set at 5%.

3. Results

3.1. Overall Results

The overall results of the cross-validation are summarized in Table 1. A total of 3852 different spectra (including 2490 carried out on SGC and 1362 on IDFP) were taken into account for this comparison.
The gradual enrichment of the banks with spectra corresponding to late cultures on SGC was associated with an increase in the percentages of correct identification. The most marked gains concerned the passage from L0 to L1 (63.4% vs. 77.5%, p < 0.0001) and from L1 to L2 (77.5% vs. 85.9%, p < 0.0001), whereas lower but significant improvement was observed when comparing L2 to L5 (85.9% vs. 88.9%, p < 0.0001). Similar results were obtained with the libraries formed by the addition of spectra produced on the IDFP medium, with a significant progression between L0 and L6 (63.4% vs. 74.8%, p < 0.0001), L6 and L7 (74.8% vs. 84.4%, p < 0.0001) and L7 and L8 (84.3% vs. 85.8%, p < 0.001). The best results were obtained with L9, which integrates all new spectra carried out on SGC and IDFP, leading to an overall success rate of 91.7%, significantly better than the success rate of the L5 and L8 libraries. From L0 to L9, the identification gains were based both on a reduction in the number of errors (32.1% vs. 7.8%) and on the identification of previously unrecognized spectra (4.5% vs. 0.4%).

3.2. Results by Species and Species Complexes

When the results were studied by species, the impact of the addition of new spectra was variable (Table 2). For some species, the switch from L0 to L9 was associated with a marked improvement in the rates of correct identification, as was the case with Epidermophyton floccosum (56.7% vs. 100%), Nannizzia fulva (75.4% vs. 100%) or Trichophyton benhamiae (81.0% vs. 97.0%); conversely, there was no impact for Nannizzia gypsea or Nannizzia persicolor—the results were already excellent with L0, with 100 and 97.4% correct identification for these two species, respectively. Regarding Trichophyton verrucosum, the progress was major—no spectrum was recognized with L0—but the percentage of correct identification was not above 50.0% with L9. Regarding the complexes in which most errors occurred, the T. rubrum complex, T. interdigitale/T. mentagrophytes, T. equinum/T. tonsurans and Microsporum spp., the results differed according to the complex. For the Microsporum complex, with L9, 98.0% of the spectra were correctly identified at the species level (vs. 68.6% with L0), and there was only one remaining confusion between M. audouinii and M. canis. For the T. rubrum complex, the shift from L0 to L9 was associated with major progress in identifying T. soudanense (2.6% vs. 94.3%) and T. violaceum (19.6% vs. 80.4%) and 99.1% of the spectra were correctly identified at the complex level. However, at the species level, incorrect identifications still occurred in 9.2% of the cases. Regarding the T. mentagrophytes/T. interdigitale and T. equinum/T. tonsurans complexes, correct identification rates were 84.6% and 90.7% with L9, respectively, but incorrect identifications still occurred, not only between species inside the complexes but also between these two complexes (4.0 and 1.3% of the spectra, respectively, according to the complex). In this latter case, false recognitions corresponded to confusion between the “early” spectra of T. interdigitale and T. equinum. Within the T. mentagrophytes/T. interdigitale complex, incorrect identifications were unequally distributed among strains. A total of 48.7% of errors concerning the species T. mentagrophytes implied two strains corresponding to genotype II *: ENVA W985 and ROUT13, which were identified as T. interdigitale. Conversely, 53.1% of false identifications of T. interdigitale as T. mentagrophytes implied references from either of these two strains. Within the T. equinum/T. tonsurans complex, the IHEM13407 strain, representative of the ‘T. tonsurans DNA type 2’ genotype, was responsible for 38.6% of the errors, and 68.8% of its spectra were recognized as T. equinum.

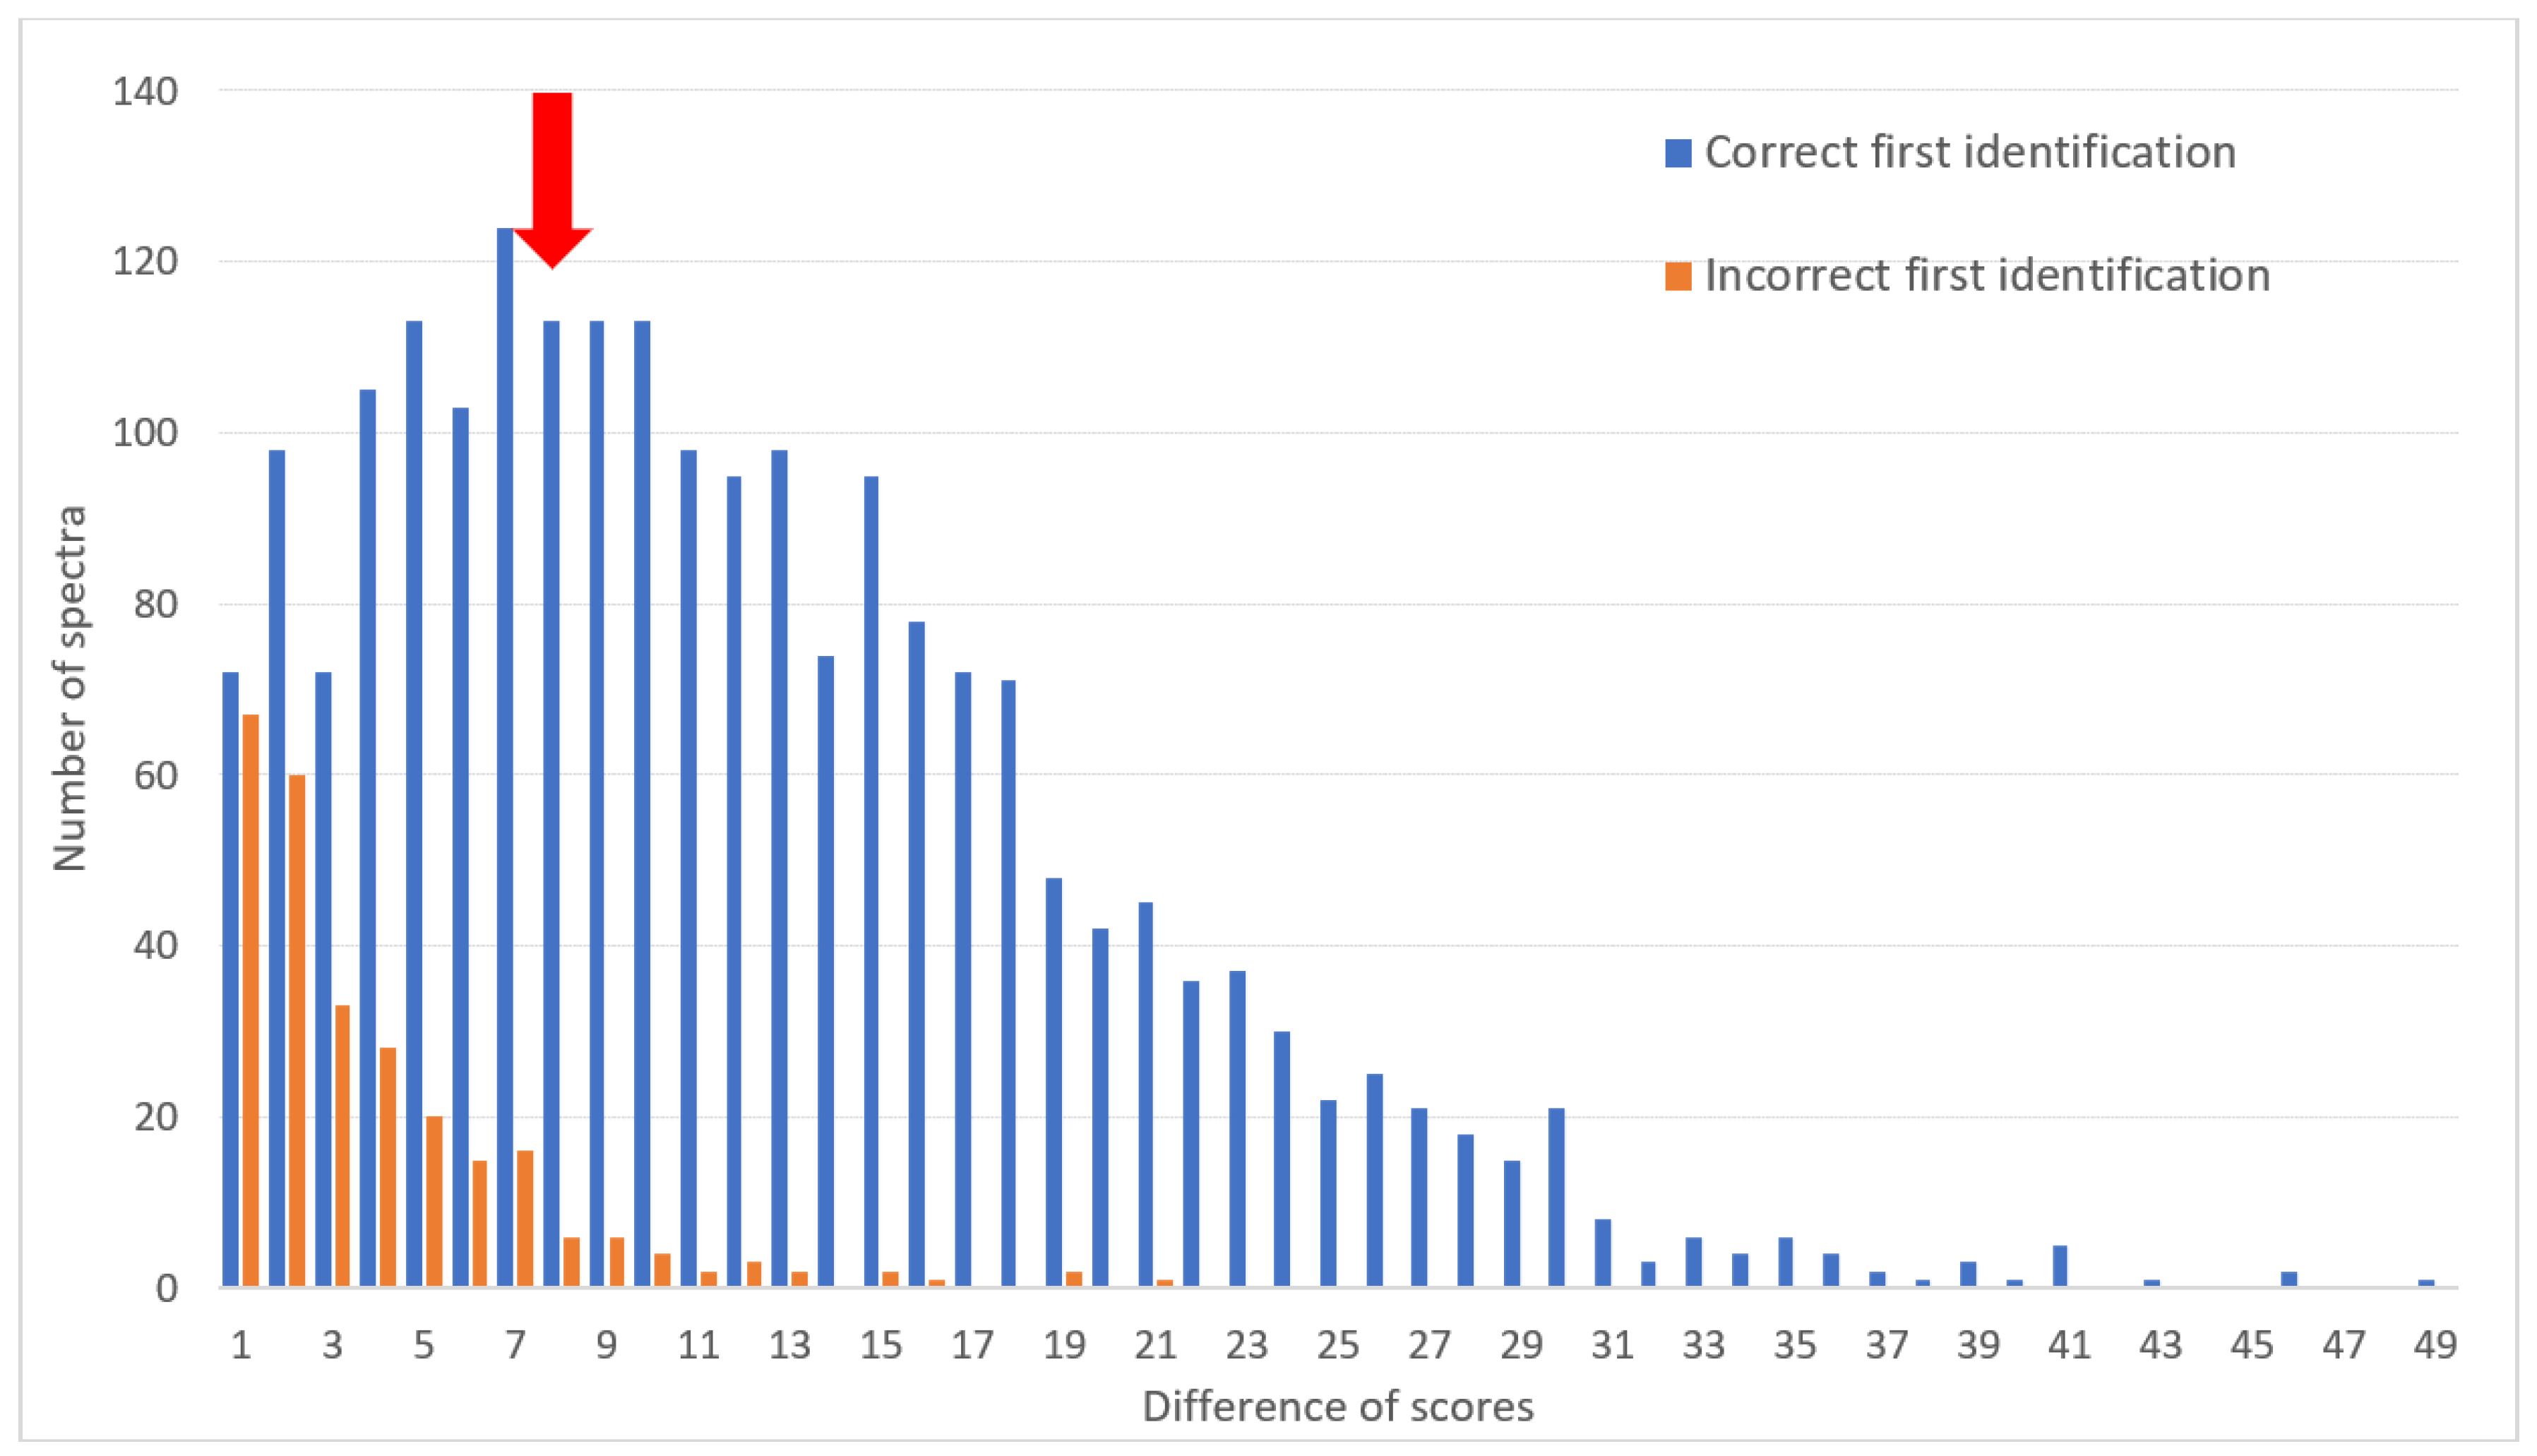
3.3. Distinction of Correct and Incorrect Identifications

When considering both the first identification score and the second identification score given by MSI-2, it was possible to detect most identification errors observed within the T. rubrum complex, T. interdigitale/T. mentagrophytes and T. equinum/T. tonsurans complexes. Indeed, most false results corresponded to a small difference (i.e., less than 8) between the scores of the first and second species identified (Figure 2). Applying this threshold to take into account a species identification result would lead to 62.0% sensitivity and 91.4% specificity for correct identification at the species level. Below this threshold, the identifications could be at least considered at the complex level with a minimal chance of error of 3.5%.

4. Discussion

The aim of this work was to improve the MSI-2 library for dermatophyte identification. Thus, 3984 spectra were obtained from 111 molecularly identified strains, representative of 20 different species. They were acquired from cultures on two different media (SGC and IDFP) and at various ages of culture. The impact of adding these spectra to the current bank was assessed through a cross-validation experiment. The transition from the initial library (L0) to the library formed by the addition of all spectra produced (L9) was associated with a marked improvement in the overall rate of correct identification of the spectra to the species level (63.4% vs. 91.7%). The significant progression (63.4% vs. 77.5%) already obtained by the only addition of early spectra from cultures on SGC (L0 to L1) confirmed the major effect observed when multiplying reference strains of a given species [4]. The positive effect of the addition of late spectra (L1 compared to L4 and L5) and spectra from cultures on IDFP (L5 compared to L9) was also demonstrated. These results contradict some previous publications that only observed a limited impact of culture medium and age of colonies on the spectra, with minimal consequence on the accuracy of the identification [5,7].
Regarding the complexes in which incorrect identifications mostly occurred, major improvement was achieved for Microsporum spp. allowing distinction between M. canis and M. audouinii with high confidence. In contrast, for the T. rubrum, T. interdigitale/T. mentagrophytes and T. equinum/T. tonsurans complexes, confusion between closely related species still occurred. The difference between the scores of the first identified species and of the second species may help assess the accuracy of the identification. Nevertheless, basic morphological and/or clinico-epidemiological features should also be integrated in a polyphasic approach to improve the reliability and accuracy of identifications.
Thus, the location of the lesions (mostly tinea pedis and tinea unguium for T. rubrum and tinea capitis for T. soudanense and T. violaceum) and typical macroscopic morphological features (fluffy, white colonies for T. rubrum; small, glabrous, wrinkled, yellow or orange colonies for T. soudanense; or small, glabrous, wrinkled, purple colonies for T. violaceum) could be of interest to distinguish the species inside the T. rubrum complex. In addition to the well-known T. rubrum, T. soudanense and T. violaceum species, T. kuryangei was taken into account in this study. Indeed, according to recent publications [15,16], T. kuryangei constitutes a specific clade inside the T. rubrum complex. It has been implicated as an agent of tinea capitis, and colonies have been described as T. rubrum-like colonies.
Regarding T. equinum/T. tonsurans differentiation, the epidemiological context of the infection (zoonotic infection involving horses or interhuman transmission) is a key element. In our study, a strain corresponding to ‘T. tonsurans DNA type 2’ (IHEM 13407) generated almost 40% of the misidentifications inside the T. equinum/T. tonsurans complex. This may indicate that this genotype is actually closer to T. equinum than to T. tonsurans. Suppressing the spectra of this strain could probably improve the performance of the application in distinguishing these two species.
Trichophyton interdigitale and T. mentagrophytes share similar morphological features. Trichophyton interdigitale is considered an anthropophilic species mostly involved in tinea pedis and tinea unguium, whereas T. mentagrophytes is a zoophilic species that causes inflammatory lesions of tinea capitis and tinea corporis in humans [1,18]. However, two genotypes (VII and VIII) challenge this dichotomy. They have been associated with T. mentagrophytes based on ITS sequencing, but their transmission is interhuman, and the lesions are mostly tinea genitalis or tinea cruris and tinea corporis, respectively [28,29]. It has recently been proposed to elevate T. mentagrophytes genotype VIII to the species level as T. indotineae [30,31]. Moreover, T. mentagrophytes genotype II * is molecularly closer to T. interdigitale genotypes than T. mentagrophytes based on ITS sequences [18]. This could explain why this genotype is more often implicated in species confusion than the others. Waiting for taxonomic clarifications and further MALDI-TOF studies, atypical clinical cases may benefit from ITS sequencing for genotype determination.
Our study has limitations. While the most common anthropophilic, zoophilic and geophilic species were included in our work, it is not, however, exhaustive. Some anthropophilic species, such as T. schoenleinii, T. concentricum and M. ferrugineum, as well as zoophilic species, such as T. quinckeanum or geophilic species, were not included in this study because they are exceptionally observed in developed countries [32]. For some species, the progress observed in our study is still insufficient, particularly for T. verrucosum or T. violaceum, and the addition of new references is therefore necessary. While many strains of T. mentagrophytes were included, our study only imperfectly reflects the diversity of genotypes grouped within the species. Genotypes VII and VIII in particular are not represented. There are also taxonomic uncertainties over the species T. benhamiae, which could be divided into four species [33]. The continual renewal of the taxonomy requires regular updating of the database.

5. Conclusions

This enriched library for dermatophyte identification may offer users improved performance and was conceived to be adapted to most laboratory practices (spectra of various ages and two culture media). Residual misidentifications are linked to molecular proximity between species, and dermatophyte PCRs can encounter the same kind of limitations [34]. The difference between the score of the first identified species and the score of the second one and/or basic morphological or clinico-epidemiological features could be integrated to obtain the most accurate identifications.

Supplementary Materials

The following supporting information can be downloaded at https://www.mdpi.com/article/10.3390/jof8010073/s1. Table S1: Strains included in the study, corresponding genotype and number of associated spectra. Table S2: Composition of the L0 library.

Author Contributions

Conceptualization, A.J., A.-C.N., A.M.-S., J.G., A.P. and R.P.; investigation, A.J. and A.-C.N.; methodology, A.J., A.-C.N. and R.P.; project administration, A.-C.N. and R.P.; resources, A.J., A.-C.N., A.M.-S., J.G., V.R.-C., S.B., M.D., R.B., C.N. and A.P.; software, A.-C.N.; supervision, A.-C.N. and R.P.; visualization, A.J.; writing—original draft, A.J.; writing—review and editing, A.-C.N., A.M.-S., J.G., V.R.-C., S.B., M.D., R.B., C.N., A.P. and R.P. All authors have read and agreed to the published version of the manuscript.

Funding

This research received no external funding.

Data Availability Statement

Data (raw spectra and DNA sequences) can be obtained freely by contacting the corresponding author.

Acknowledgments

We thank Romain Challand for his technical support.

Conflicts of Interest

The authors declare no conflict of interest.

References

  1. De Hoog, G.S.; Dukik, K.; Monod, M.; Packeu, A.; Stubbe, D.; Hendrickx, M.; Kupsch, C.; Stielow, J.B.; Freeke, J.; Göker, M.; et al. Toward a novel multilocus phylogenetic taxonomy for the dermatophytes. Mycopathologia 2017, 182, 5–31. [Google Scholar] [CrossRef] [PubMed] [Green Version]
  2. Hubka, V.; Peano, A.; Cmokova, A.; Guillot, J. Common and emerging dermatophytoses in animals: Well-known and new threats. In Emerging and Epizootic Fungal Infections in Animals; Seyedmousavi, S., de Hoog, G.S., Guillot, J., Verweij, P.E., Eds.; Springer International Publishing: Cham, Switzerland, 2018; pp. 31–79. ISBN 978-3-319-72091-3. [Google Scholar]
  3. Erhard, M.; Hipler, U.-C.; Burmester, A.; Brakhage, A.A.; Wöstemeyer, J. Identification of dermatophyte species causing onychomycosis and tinea pedis by MALDI-TOF mass spectrometry. Exp. Dermatol. 2008, 17, 356–361. [Google Scholar] [CrossRef]
  4. L’Ollivier, C.; Ranque, S. MALDI-TOF-based dermatophyte identification. Mycopathologia 2017, 182, 183–192. [Google Scholar] [CrossRef] [Green Version]
  5. Theel, E.S.; Hall, L.; Mandrekar, J.; Wengenack, N.L. Dermatophyte identification using matrix-assisted laser desorption ionization-time of flight mass spectrometry. J. Clin. Microbiol. 2011, 49, 4067–4071. [Google Scholar] [CrossRef] [PubMed] [Green Version]
  6. De Respinis, S.; Monnin, V.; Girard, V.; Welker, M.; Arsac, M.; Cellière, B.; Durand, G.; Bosshard, P.P.; Farina, C.; Passera, M.; et al. Matrix-assisted laser desorption ionization-time of flight (MALDI-TOF) mass spectrometry using the vitek MS system for rapid and accurate identification of dermatophytes on solid cultures. J. Clin. Microbiol. 2014, 52, 4286–4292. [Google Scholar] [CrossRef] [Green Version]
  7. L’Ollivier, C.; Cassagne, C.; Normand, A.-C.; Bouchara, J.-P.; Contet-Audonneau, N.; Hendrickx, M.; Fourquet, P.; Coulibaly, O.; Piarroux, R.; Ranque, S. A MALDI-TOF MS procedure for clinical dermatophyte species identification in the routine laboratory. Med. Mycol. 2013, 51, 713–720. [Google Scholar] [CrossRef] [Green Version]
  8. Alshawa, K.; Beretti, J.-L.; Lacroix, C.; Feuilhade, M.; Dauphin, B.; Quesne, G.; Hassouni, N.; Nassif, X.; Bougnoux, M.-E. Successful identification of clinical dermatophyte and neoscytalidium species by matrix-assisted laser desorption ionization-time of flight mass spectrometry. J. Clin. Microbiol. 2012, 50, 2277–2281. [Google Scholar] [CrossRef] [Green Version]
  9. Hedayati, M.T.; Ansari, S.; Ahmadi, B.; Taghizadeh Armaki, M.; Shokohi, T.; Abastabar, M.; Er, H.; Özhak, B.; Öğünç, D.; Ilkit, M.; et al. Identification of clinical dermatophyte isolates obtained from Iran by matrix-assisted laser desorption/ionization time-of-flight mass spectrometry. Curr. Med. Mycol. 2019, 5, 22–26. [Google Scholar] [CrossRef] [PubMed]
  10. Packeu, A.; Hendrickx, M.; Beguin, H.; Martiny, D.; Vandenberg, O.; Detandt, M. Identification of the Trichophyton Mentagrophytes complex species using MALDI-TOF mass spectrometry. Med. Mycol. 2013, 51, 580–585. [Google Scholar] [CrossRef] [Green Version]
  11. Gräser, Y.; Kuijpers, A.F.; Presber, W.; de Hoog, G.S. Molecular taxonomy of the trichophyton rubrum complex. J. Clin. Microbiol. 2000, 38, 3329–3336. [Google Scholar] [CrossRef] [Green Version]
  12. Gräser, Y.; Kuijpers, A.F.; Presber, W.; De Hoog, G.S. Molecular taxonomy of Trichophyton Mentagrophytes and T. Tonsurans. Med. Mycol. 1999, 37, 315–330. [Google Scholar] [CrossRef]
  13. Beguin, H.; Pyck, N.; Hendrickx, M.; Planard, C.; Stubbe, D.; Detandt, M. The Taxonomic status of Trichophyton Quinckeanum and T. Interdigitale revisited: A multigene phylogenetic approach. Med. Mycol. 2012, 50, 871–882. [Google Scholar] [CrossRef] [PubMed] [Green Version]
  14. Woodgyer, A. The curious adventures of Trichophyton Equinum in the realm of molecular biology: A modern fairy tale. Med. Mycol. 2004, 42, 397–403. [Google Scholar] [CrossRef] [Green Version]
  15. Su, H.; Packeu, A.; Ahmed, S.A.; Al-Hatmi, A.M.S.; Blechert, O.; İlkit, M.; Hagen, F.; Gräser, Y.; Liu, W.; Deng, S.; et al. Species distinction in the Trichophyton Rubrum complex. J. Clin. Microbiol. 2019, 57. [Google Scholar] [CrossRef] [PubMed] [Green Version]
  16. Packeu, A.; Stubbe, D.; Roesems, S.; Goens, K.; Van Rooij, P.; de Hoog, S.; Hendrickx, M. Lineages within the Trichophyton Rubrum complex. Mycopathologia 2020, 185, 123–136. [Google Scholar] [CrossRef] [PubMed]
  17. Kandemir, H.; Dukik, K.; Hagen, F.; Ilkit, M.; Gräser, Y.; de Hoog, G.S. Polyphasic discrimination of Trichophyton Tonsurans and T. Equinum from humans and horses. Mycopathologia 2020, 185, 113–122. [Google Scholar] [CrossRef]
  18. Taghipour, S.; Pchelin, I.M.; Zarei Mahmoudabadi, A.; Ansari, S.; Katiraee, F.; Rafiei, A.; Shokohi, T.; Abastabar, M.; Taraskina, A.E.; Kermani, F.; et al. Trichophyton Mentagrophytes and T Interdigitale genotypes are associated with particular geographic areas and clinical manifestations. Mycoses 2019, 62, 1084–1091. [Google Scholar] [CrossRef]
  19. Gräser, Y.; Kuijpers, A.F.; El Fari, M.; Presber, W.; de Hoog, G.S. Molecular and conventional taxonomy of the microsporum Canis complex. Med. Mycol. 2000, 38, 143–153. [Google Scholar] [CrossRef] [Green Version]
  20. Rezaei-Matehkolaei, A.; Makimura, K.; de Hoog, G.S.; Shidfar, M.R.; Satoh, K.; Najafzadeh, M.J.; Mirhendi, H. Multilocus differentiation of the related dermatophytes Microsporum Canis, Microsporum Ferrugineum and Microsporum Audouinii. J. Med. Microbiol. 2012, 61, 57–63. [Google Scholar] [CrossRef]
  21. Normand, A.C.; Becker, P.; Gabriel, F.; Cassagne, C.; Accoceberry, I.; Gari-Toussaint, M.; Hasseine, L.; De Geyter, D.; Pierard, D.; Surmont, I.; et al. Validation of a new web application for identification of fungi by use of matrix-assisted laser desorption ionization–time of flight mass spectrometry. J. Clin. Microbiol. 2017, 55, 2661–2670. [Google Scholar] [CrossRef] [PubMed] [Green Version]
  22. Becker, P.; Normand, A.-C.; Vanantwerpen, G.; Vanrobaeys, M.; Haesendonck, R.; Vercammen, F.; Stubbe, D.; Piarroux, R.; Hendrickx, M. Identification of fungal isolates by MALDI-TOF mass spectrometry in veterinary practice: Validation of a web application. J. Vet. Diagn. Invest. 2019, 31, 471–474. [Google Scholar] [CrossRef] [PubMed]
  23. Heireman, L.; Patteet, S.; Steyaert, S. Performance of the new ID-fungi plate using two types of reference libraries (Bruker and MSI) to identify fungi with the Bruker MALDI biotyper. Med. Mycol. 2020, 58, 946–957. [Google Scholar] [CrossRef]
  24. Sacheli, R.; Henri, A.-S.; Seidel, L.; Ernst, M.; Darfouf, R.; Adjetey, C.; Schyns, M.; Marechal, L.; Meex, C.; Arrese, J.; et al. Evaluation of the new Id-fungi plates from conidia for MALDI-TOF MS identification of filamentous fungi and comparison with conventional methods as identification tool for dermatophytes from nails, hair and skin samples. Mycoses 2020, 63, 1115–1127. [Google Scholar] [CrossRef] [PubMed]
  25. Normand, A.-C.; Blaize, M.; Imbert, S.; Packeu, A.; Becker, P.; Fekkar, A.; Stubbe, D.; Piarroux, R. Identification of Molds with matrix-assisted laser desorption ionization-time of flight mass spectrometry: Performance of the newly developed MSI-2 Application in comparison with the Bruker filamentous fungi database and MSI-1. J. Clin. Microbiol. 2021, 59, e0129921. [Google Scholar] [CrossRef]
  26. Normand, A.C.; Packeu, A.; Cassagne, C.; Hendrickx, M.; Ranque, S.; Piarroux, R. Nucleotide sequence database comparison for routine dermatophyte identification by internal transcribed spacer 2 genetic region DNA barcoding. J. Clin. Microbiol. 2018, 56, e00046-18. [Google Scholar] [CrossRef] [Green Version]
  27. Summerbell, R.C.; Moore, M.K.; Starink-Willemse, M.; Van Iperen, A. ITS barcodes for trichophyton tonsurans and T. Equinum. Med. Mycol. 2007, 45, 193–200. [Google Scholar] [CrossRef] [Green Version]
  28. Kupsch, C.; Czaika, V.-A.; Deutsch, C.; Gräser, Y. Trichophyton Mentagrophytes—A New genotype of zoophilic dermatophyte causes sexually transmitted infections. J. Dtsch. Dermatol. Ges. 2019, 17, 493–501. [Google Scholar] [CrossRef]
  29. Nenoff, P.; Verma, S.B.; Vasani, R.; Burmester, A.; Hipler, U.-C.; Wittig, F.; Krüger, C.; Nenoff, K.; Wiegand, C.; Saraswat, A.; et al. The current Indian epidemic of superficial dermatophytosis due to trichophyton mentagrophytes—A molecular study. Mycoses 2019, 62, 336–356. [Google Scholar] [CrossRef] [PubMed]
  30. Kano, R.; Kimura, U.; Kakurai, M.; Hiruma, J.; Kamata, H.; Suga, Y.; Harada, K. Trichophyton Indotineae Sp. Nov.: A new highly terbinafine-resistant anthropophilic dermatophyte species. Mycopathologia 2020, 185, 947–958. [Google Scholar] [CrossRef] [PubMed]
  31. Tang, C.; Kong, X.; Ahmed, S.A.; Thakur, R.; Chowdhary, A.; Nenoff, P.; Uhrlass, S.; Verma, S.B.; Meis, J.F.; Kandemir, H.; et al. Taxonomy of the Trichophyton Mentagrophytes/T. Interdigitale Species Complex Harboring the Highly Virulent, Multiresistant genotype T. Indotineae. Mycopathologia 2021, 186, 315–326. [Google Scholar] [CrossRef]
  32. Seebacher, C.; Bouchara, J.-P.; Mignon, B. Updates on the epidemiology of dermatophyte infections. Mycopathologia 2008, 166, 335–352. [Google Scholar] [CrossRef] [PubMed] [Green Version]
  33. Baert, F.; Lefevere, P.; D’hooge, E.; Stubbe, D.; Packeu, A. A Polyphasic approach to classification and identification of species within the trichophyton benhamiae complex. JoF 2021, 7, 602. [Google Scholar] [CrossRef] [PubMed]
  34. Bergmans, A.M.C.; van der Ent, M.; Klaassen, A.; Böhm, N.; Andriesse, G.I.; Wintermans, R.G.F. Evaluation of a single-tube real-time PCR for detection and identification of 11 dermatophyte species in clinical material. Clin. Microbiol. Infect. 2010, 16, 704–710. [Google Scholar] [CrossRef] [PubMed] [Green Version]
Figure 1. Overall design of the study. S1, S2, S3, S4 and S5 are files of spectra of increasing age acquired from cultures on Sabouraud medium plus gentamicin and chloramphenicol (SGC) medium. I1, I2 and I3 are files of spectra of increasing age acquired from cultures on ID-fungi plate (IDFP). L0 is constituted by spectra of BCCM/IHEM Fungi collection strains currently in MSI-2.
Jof 08 00073 g001
Figure 2. Difference between the score of the first identification and that of the second depending on whether the first identification was correct (results of identification with the L9 library and for the T. rubrum complex, T. interdigitale/T. mentagrophytes and T. equinum/T. tonsurans complexes). The red arrow indicates the chosen threshold (8) beyond which the identification result could be considered at the species level and below which it should be taken into account only at the complex level.
Jof 08 00073 g002
Table 1. General results (%) of the cross-validation.
LibrariesL0L1L2L3L4L5L6L7L8L9
SGC LibrariesIDFP Libraries
Composition
of the libraries
MSI-2
references
L0 + S1L1 + S2L2 + S3L3 + S4L4 + S5L0 + I1L6 + I2L7 + I3L0 + S + I
Correct identification63.477.585.986.987.688.974.884.385.891.7
Incorrect identification32.120.813.212.411.810.522.714.413.37.8
No identification4.51.70.90.80.60.62.51.20.90.5
The L0 library corresponds to the spectra from IHEM strains currently present in MSI-2. L1 to L5 libraries were formed by gradual addition to L0 of increasingly late spectra produced from isolates cultivated on Sabouraud medium plus gentamicin and chloramphenicol (SGC). L6 to L8 libraries were formed on the same principle from the same isolates cultivated on ID-fungi plate (IDFP). The L9 library was composed by adding all spectra acquired to L0.
Table 2. Percentages of correct identification by species with the L0 and L9 libraries.
LibrariesL0L9
Composition of the LibrariesMSI-2 ReferencesL0 + S + I
Epidermophyton floccosum (n = 120)56.7100
M. audouinii (n = 360)57.296.9
M. canis (n = 236)86.099.6
N. fulva (n = 65)75.4100
N. gypsea (n = 198)100100
N. persicolor (n = 76)97.497.4
T. benhamiae (n = 100)81.097.0
T. equinum (n = 258)28.089.3
T. erinacei (n = 168)96.9100
T. interdigitale (n = 439)63.681.8
Trichophyton kuryangei (n = 96)62.577.1
T. mentagrophytes (n = 352)71.688.1
T. rubrum (n = 454)84.191.6
T. soudanense (n = 348)2.694.3
T. tonsurans (n = 442)60.291.2
T. verrucosum (n = 48)0.050.0
T. violaceum (n = 92)19.680.4
Publisher’s Note: MDPI stays neutral with regard to jurisdictional claims in published maps and institutional affiliations.

