
New Insights into Blood Circulating Lymphocytes in Human Pneumocystis Pneumonia

 , , ,
, , ,
Abstract
:1. Introduction
2. Patients and Methods
2.1. Subject Inclusion and Sample Collection
2.2. Leukocyte Count and Differential
2.3. PBMC Isolation and Lymphocyte Immunophenotyping
2.4. Statistical Analysis
3. Results
3.1. Patient Characteristics
3.2. Lymphocyte Subpopulations in PCP-Positive versus PCP-Negative Subjects
3.3. Lymphocyte Subpopulations in Deceased Subjects versus Survivors
3.4. Lymphocyte Predictive Values of PCP Outcome
4. Discussion
Supplementary Materials
Author Contributions
Funding
Institutional Review Board Statement
Informed Consent Statement
Data Availability Statement
Acknowledgments
Conflicts of Interest
References
- Roux, A.; Canet, E.; Valade, S.; Gangneux-Robert, F.; Hamane, S.; Lafabrie, A.; Maubon, D.; Debourgogne, A.; Le Gal, S.; Dalle, F.; et al. Pneumocystis jirovecii Pneumonia in Patients with or without AIDS, France. Emerg. Infect. Dis. 2014, 20, 1490–1497. [Google Scholar] [CrossRef]
- Wickramasekaran, R.N.; Jewell, M.P.; Sorvillo, F.; Kuo, T. The changing trends and profile of pneumocystosis mortality in the United States, 1999–2014. Mycoses 2017, 60, 607–615. [Google Scholar] [CrossRef] [PubMed]
- Enomoto, T.; Azuma, A.; Kohno, A.; Kaneko, K.; Saito, H.; Kametaka, M.; Usuki, J.; Gemma, A.; Kudoh, S.; Nakamura, S. Differences in the clinical characteristics of Pneumocystis jirovecii pneumonia in im-munocompromized patients with and without HIV infection. Respirology 2010, 15, 126–131. [Google Scholar] [CrossRef]
- Centre de national de référence Mycoses Invasives et Antifongiques. Rapport annuel d’activité 2019-Année d’exercice 2018. April 2019. Available online: https://www.pasteur.fr/fr/file/31034/download (accessed on 11 March 2021).
- Wright, T.W.; Gigliotti, F.; Finkelstein, J.N.; McBride, J.T.; An, C.L.; Harmsen, A.G. Immune-mediated inflammation directly impairs pulmonary function, contributing to the pathogenesis of Pneumocystis carinii pneumonia. J. Clin. Investig. 1999, 104, 1307–1317. [Google Scholar] [CrossRef] [PubMed]
- Limper, A.H.; Offord, K.P.; Smith, T.F.; Martin, W.J. Pneumocystis carinii pneumonia. Differences in lung parasite number and in-flammation in patients with and without AIDS. Am. Rev. Respir. Dis. 1989, 140, 1204–1209. [Google Scholar] [CrossRef] [PubMed]
- Iriart, X.; Witkowski, B.; Cassaing, S.; Abbes, S.; Menard, S.; Fillaux, J.; Valentin, A.; Linas, M.-D.; Tkaczuk, J.; Huget, F.; et al. Alveolar and Blood T Lymphocyte Profiles in Pneumocystis jirovecii–Positive Patients: Effects of HIV Status. J. Infect. Dis. 2011, 204, 544–553. [Google Scholar] [CrossRef] [Green Version]
- Kolls, J.K.; Habetz, S.; Shean, M.K.; Vazquez, C.; A Brown, J.; Lei, D.; Schwarzenberger, P.; Ye, P.; Nelson, S.; Summer, W.R.; et al. IFN-gamma and CD8+ T cells restore host defenses against Pneumocystis carinii in mice depleted of CD4+ T cells. J. Immunol. 1999, 162, 2890–2894. [Google Scholar]
- Beck, J.M.; Newbury, R.L.; Palmer, B.E.; Warnock, M.L.; Byrd, P.K.; Kaltreider, H. Role of CD8+ lymphocytes in host defense against Pneumocystis carinii in mice. J. Lab. Clin. Med. 1996, 128, 477–487. [Google Scholar] [CrossRef]
- Ruan, S.; McKinley, L.; Zheng, M.; Rudner, X.; D’Souza, A.; Kolls, J.K.; Shellito, J.E. Interleukin-12 and Host Defense against Murine Pneumocystis Pneumonia. Infect. Immun. 2008, 76, 2130–2137. [Google Scholar] [CrossRef] [Green Version]
- Eddens, T.; Elsegeiny, W.; Nelson, M.P.; Horne, W.; Campfield, B.; Steele, C.; Kolls, J.K. Eosinophils Contribute to Early Clearance of Pneumocystis murina Infection. J. Immunol. 2015, 195, 185–193. [Google Scholar] [CrossRef] [Green Version]
- Zhang, N.-N.; Huang, X.; Feng, H.-Y.; Huang, L.-N.; Xia, J.-G.; Wang, Y.; Zhang, Y.; Wu, X.-J.; Li, M.; Cui, W.; et al. Circulating and Pulmonary T-cell Populations Driving the Immune Response in Non-HIV Immunocompromised Patients with Pneumocystis jirovecii Pneumonia. Int. J. Med. Sci. 2019, 16, 1221–1230. [Google Scholar] [CrossRef] [Green Version]
- Swain, S.D.; Meissner, N.N.; Harmsen, A.G. CD8 T Cells Modulate CD4 T-Cell and Eosinophil-Mediated Pulmonary Pathology in Pneumocystis Pneumonia in B-Cell-Deficient Mice. Am. J. Pathol. 2006, 168, 466–475. [Google Scholar] [CrossRef] [Green Version]
- Kelly, M.N.; Zheng, M.; Ruan, S.; Kolls, J.; D’Souza, A.; Shellito, J.E. Memory CD4+T Cells Are Required for Optimal NK Cell Effector Functions against the Opportunistic Fungal Pathogen Pneumocystis murina. J. Immunol. 2012, 190, 285–295. [Google Scholar] [CrossRef] [PubMed] [Green Version]
- Fillaux, J.; Malvy, S.; Alvarez, M.; Fabre, R.; Cassaing, S.; Marchou, B.; Linas, M.-D.; Berry, A. Accuracy of a routine real-time PCR assay for the diagnosis of Pneumocystis jirovecii pneumonia. J. Microbiol. Methods 2008, 75, 258–261. [Google Scholar] [CrossRef] [PubMed]
- Décret n° 2017-884 du 9 mai 2017 modifiant certaines dispositions réglementaires relatives aux recherches impliquant la personne humaine. Ministère des affaires sociales et de la santé. JORF n° 0109 10 May 2017. Available online: https://www.legifrance.gouv.fr/jorf/id/JORFTEXT000034634217 (accessed on 12 April 2021).
- Robin, X.; Turck, N.; Hainard, A.; Tiberti, N.; Lisacek, F.; Sanchez, J.-C.; Muller, M.J. pROC: An open-source package for R and S+ to analyze and compare ROC curves. BMC Bioinform. 2011, 12, 77. [Google Scholar] [CrossRef]
- Iriart, X.; Belval, T.C.; Fillaux, J.; Esposito, L.; Lavergne, R.-A.; Cardeau-Desangles, I.; Roques, O.; Del Bello, A.; Cointault, O.; Lavayssière, L.; et al. Risk Factors of Pneumocystis Pneumonia in Solid Organ Recipients in the Era of the Common Use of Posttransplantation Prophylaxis. Arab. Archaeol. Epigr. 2015, 15, 190–199. [Google Scholar] [CrossRef]
- Rong, H.-M.; Li, T.; Zhang, C.; Wang, D.; Hu, Y.; Zhai, K.; Shi, H.-Z.; Tong, Z.-H. IL-10-producing B cells regulate Th1/Th17-cell immune responses in Pneumocystis pneumonia. Am. J. Physiol. Cell. Mol. Physiol. 2019, 316, L291–L301. [Google Scholar] [CrossRef] [PubMed] [Green Version]
- Lund, F.E.; Hollifield, M.; Schuer, K.; Lines, J.L.; Randall, T.D.; Garvy, B.A. B Cells Are Required for Generation of Protective Effector and Memory CD4 Cells in Response to Pneumocystis Lung Infection. J. Immunol. 2006, 176, 6147–6154. [Google Scholar] [CrossRef] [Green Version]
- Martin-Garrido, I.; Carmona, E.M.; Specks, U.; Limper, A.H. Pneumocystis Pneumonia in Patients Treated With Rituximab. Chest 2013, 144, 258–265. [Google Scholar] [CrossRef] [Green Version]
- Saxon, A.; Stevens, R.H.; Ramer, S.J.; Clements, P.J.; Yu, D.T. Glucocorticoids administered in vivo inhibit human suppressor T lym-phocyte function and diminish B lymphocyte responsiveness in in vitro immunoglobulin synthesis. J. Clin. Investig. 1978, 61, 922–930. [Google Scholar] [CrossRef] [Green Version]
- Cupps, T.R.; Gerrard, T.L.; Falkoff, R.J.; Whalen, G.; Fauci, A.S. Effects of in vitro corticosteroids on B cell activation, proliferation, and differentiation. J. Clin. Investig. 1985, 75, 754–761. [Google Scholar] [CrossRef] [PubMed]
- Hu, Y.; Wang, D.; Zhai, K.; Tong, Z. Transcriptomic Analysis Reveals Significant B Lymphocyte Suppression in Corticoster-oid-Treated Hosts with Pneumocystis Pneumonia. Am. J. Respir. Cell Mol. Biol. 2017, 56, 322–331. [Google Scholar] [CrossRef] [PubMed]
- Li, Y.; Ghannoum, M.; Deng, C.; Gao, Y.; Zhu, H.; Yu, X.; Lavergne, V. Pneumocystis pneumonia in patients with inflammatory or autoimmune diseases: Usefulness of lymphocyte subtyping. Int. J. Infect. Dis. 2017, 57, 108–115. [Google Scholar] [CrossRef] [Green Version]
- Freiwald, T.; Büttner, S.; Cheru, N.T.; Avaniadi, D.; Martin, S.S.; Stephan, C.; Pliquett, R.U.; Asbe-Vollkopf, A.; Schüttfort, G.; Jacobi, V.; et al. CD4 + T cell lymphopenia predicts mortality from Pneumocystis pneumonia in kidney transplant patients. Clin. Transplant. 2020, 34, e13877. [Google Scholar] [CrossRef]
- Jin, F.; Xie, J.; Wang, H.-L. Lymphocyte subset analysis to evaluate the prognosis of HIV-negative patients with Pneumocystis pneumonia. BMC Infect. Dis. 2021, 21, 441. [Google Scholar] [CrossRef]
- Beck, J.M.; Liggitt, H.D.; Brunette, E.N.; Fuchs, H.J.; E Shellito, J.; Debs, R.J. Reduction in intensity of Pneumocystis carinii pneumonia in mice by aerosol administration of gamma interferon. Infect. Immun. 1991, 59, 3859–3862. [Google Scholar] [CrossRef] [Green Version]
- Mc Allister, F.; Steele, C.; Zheng, M.; Young, E.; Shellito, J.E.; Marrero, L.; Kolls, J.K. T cytotoxic-1 CD8+ T cells are effector cells against Pneumocystis in mice. J. Immunol. 2005, 175, 3447. [Google Scholar] [CrossRef] [Green Version]
- Ruan, S.; Samuelson, D.R.; Assouline, B.; Morre, M.; Shellito, J.E. Treatment with Interleukin-7 Restores Host Defense against Pneu-mocystis in CD4+ T-Lymphocyte-Depleted Mice. Infect. Immun 2016, 84, 108–119. [Google Scholar] [CrossRef] [PubMed] [Green Version]
- Elsegeiny, W.; Zheng, M.; Eddens, T.; Gallo, R.L.; Dai, G.; Trevejo-Nunez, G.; Castillo, P.; Kracinovsky, K.; Cleveland, H.; Horne, W.; et al. Murine models of Pneumocystis infection recapitulate human primary immune disorders. JCI Insight 2018, 3. [Google Scholar] [CrossRef]


| PCP (+) | PCP (−) | p-Value | |
|---|---|---|---|
| n patients | 20 a | 20 b | |
| Median age (years) (min; max) | 65 (30; 78) | 58 (33; 77) | 0.24 |
| Sex ratio (M/F) | 2.3 (14/6) | 1.2 (11/9) | 0.33 |
| Immunosuppressive condition | |||
| Solid organ transplant | 5 (25%) | 4 (20%) | 1 |
| Cancer with chemotherapy c | 6 (30%) | 7 (35%) | 0.74 |
| Bone marrow graft | 2 (10%) | 2 (10%) | 1 |
| Inflammatory disease | 3 (15%) | 3 (15%) | 1 |
| HIV-positive | 4 (20%) | 4 (20%) | 1 |
| Immunosuppressive and anti-inflammatory therapies | |||
| Corticosteroid therapy | 14 (70%) | 8 (40%) | 0.06 |
| 2-month cumulative dose d, Medians (IQR) | 300 (0; 2314) | 0 (0; 422) | 0.04 |
| 2-month cumulative dose >3000 d | 5 (25%) | 0 (0%) | 0.05 |
| Mofetil mycophenolate | 1 (5%) | 1 (5%) | 1 |
| Anticalcineurins | 4 (20%) | 6 (30%) | 0.72 |
| mTOR inhibitors | 4 (20%) | 2 (10%) | 0.66 |
| Cytotoxic agents | 6 (30%) | 8 (40%) | 0.51 |
| Anti-CD-20 agents | 2 (10%) | 2 (10%) | 1 |
| Anti-TNFα agents | 0 (0%) | 1 (5%) | 1 |
| Bactrim prophylaxis | 0 (0%) | 4 (20%) | 0.11 |
| Positive CMV PCR (blood and/or BAL) | 6 (30%) | 4 (20%) | 0.72 |
| Other/Co-infections | 15 (75%) | 12 (60%) | 0.31 |
| Bacteria | 10 (50%) | 9 (45%) | 0.75 |
| Viruses | 10 (50%) | 6 (30%) | 0.2 |
| Fungi | 6 (30%) | 3 (15%) | 0.45 |
| Clinical signs and hospital care | |||
| Fever | 15 (75%) | 7 (35%) | 0.01 |
| Cough | 12 (60%) | 7 (35%) | 0.11 |
| Dyspnea | 17 (85%) | 9 (45%) | 0.01 |
| Ground glass or interstitial infiltrates on CT scan | 18 (90%) | 9 (45%) | <0.01 |
| Intensive care admission | 10 (50%) | 6 (30%) | 0.2 |
| Mechanical ventilation/High-flow O2 | 11 (55%) | 3 (15%) | 0.01 |
| 2-month mortality | 7 (35%) | 3 (15%) | 0.27 |
| PCP (+) | PCP (-) | Control | |||
|---|---|---|---|---|---|
| Medians (IQR) | p-Value | Medians (IQR) | p-Value | ||
| n leukocytes (G/L) | 5.5 (3.9; 12.8) | 5.2 (2.5; 9.8) | 0,92 | ||
| n lymphocytes (G/L) | 0.9 (0.6; 1.5) | 0.9 (0.4; 1.6) | 0.96 | ||
| n neutrophils (G/L) | 3.9 (2.3; 8.9) | 4.2 (1.6; 8.4) | 0.79 | ||
| n eosinophils (G/L) | 0.1 (0.0; 0.2) | 0.1 (0.0; 0.3) | 0.49 | ||
| n basophils (G/L) | 0.0 (0.0; 0.1) | 0.0 (0.0; 0.1) | 0.99 | ||
| n monocytes (G/L) | 0.4 (0.1; 0.9) | 0.6 (0.1; 1.0) | 0.81 | ||
| n T lymphocytes (cells/µL) | 515 (298; 1012) | 551 (179; 1219) | 0.99 | ||
| T lymphocytes (% lymphocytes) | 67.0 (49.1; 81.9) | 62.9 (40.4; 82.9) | 0.69 | 67.0 (52.4; 81.9) | 0.83 |
| n T CD4 (cells/µL) | 333 (106; 559) | 331 (89; 702) | 0.8 | ||
| n T CD4 < 200 cells/µL | 8 (40%) a | 7 (35%) a | 0.74 | ||
| T CD4 (% CD3) | 55.9 (41.8; 76.6) | 73.5 (55.8; 84.9) | 0.21 | 74.7 (67.0; 82.0) | 0.14 |
| Naive CD4 (% CD4) | 24.2 (8.1; 48.9) | 23.2 (4.7; 62.7) | 0.9 | 40.5 (27.5; 51.3) | 0.30 |
| Effector CD4 (% CD4) | 2.1 (1.2; 3.9) | 2.2 (1.2; 4.2) | 0.92 | 2.9 (1.7; 5.4) | 0.43 |
| Effector memory CD4 (% CD4) | 29.0 (19.1; 50.1) | 35.2 (12.1; 52.1) | 0.69 | 19.9 (13.7; 34.1) | 0.18 |
| Central memory CD4 (% CD4) | 30.2 (22.4; 41.9) | 28.3 (23.5; 39.9) | 0.8 | 33.9 (27.4; 41.8) | 0.56 |
| Th1 CD4 (% CD4) | 12.6 (7.7; 27.4) | 13.2 (7.9; 21.5) | 0.78 | 15.6 (10.9; 20.2) | 0.58 |
| Th2 CD4 (% CD4) | 0.6 (0.3; 1.2) | 0.5 (0.2; 1.0) | 0.36 | 0.3 (0.2; 0.4) | 0.01 (a <0.05; b: NS) |
| Th17 CD4 (% CD4) | 0.4 (0.1; 0.8) | 0.4 (0.2; 0.7) | 0.92 | 0.2 (0.1; 0.3) | 0.03 |
| Th1-Th17 CD4 (% CD4) | 4.6 (2.0; 8.9) | 4.2 (2.4; 9.4) | 0.99 | 8.5 (5.0; 11.6) | 0.04 |
| Th9 CD4 (% CD4) | 5.5 (4.1; 11.5) | 7.4 (2.8; 14.6) | 0.59 | 7.8 (6.0; 10.4) | 0.55 |
| CD4 Treg (% CD4) | 5.3 (2.9; 8.2) | 4.9 (3.9; 7.9) | 0.7 | 5.4 (5.0; 6.2) | 0.81 |
| Ratio Th1/Th2 | 19.2 (9.1; 44.8) | 21.4 (12.6; 46.3) | 0.51 | 52.9 (29.5; 138.7) | <0.01 (a < 0.01; b < 0.05) |
| Ratio Th17/Treg | 0.07 (0.02; 0.15) | 0.06 (0.03; 0.08) | 0.47 | 0,03 (0.01; 0.06) | 0,03 (a < 0.05; b: NS) |
| n T CD8 (cells/µL) | 117 (60; 338) | 53 (31; 131) | 0.13 | ||
| T CD8 (% CD3) | 32.1 (15.8; 47.7) | 17.1 (8.4; 25.9) | 0.06 | 17.9 (10.9; 24.4) | 0.06 |
| Naive CD8 (% CD8) | 13.5 (4.8; 33.3) | 19.3 (7.0; 33.4) | 0.35 | 19.2 (9.3; 30.8) | 0.54 |
| Effector CD8 (% CD8) | 19.8 (15.6; 35.3) | 30.8 (17.9; 48.4) | 0.39 | 27.1 (18.1; 35.3) | 0.55 |
| Effector memory CD8 (% CD8) | 49.3 (17.2; 75.8) | 35.9 (25.1; 48.9) | 0.42 | 41.6 (34.4; 49.9) | 0.53 |
| Central memory CD8 (% CD8) | 6.0 (2.6; 10.6) | 5.2 (2.9; 7.5) | 0.92 | 8.2 (4.9; 14.1) | 0.04 |
| FoxP3+ CD8 (% CD8) | 0.04 (0.00; 0.2) | 0.1 (0.02; 0.4) | 0.16 | 0.3 (0.11; 0.48) | <0.01 (a < 0.01; b: NS) |
| Non-naive Tc1 CD8 (% CD8) | 45.5 (36.4; 70.6) | 49.7 (32.0; 61.3) | 0.7 | 57.5 (49.6; 67.0) | 0.18 |
| Non-naive Tc2 CD8 (% CD8) | 1.1 (0.6; 1.9) | 1.5 (1.0; 2.0) | 0.32 | 0.8 (0.5; 1.2) | 0.02 |
| Non-naive Tc9 CD8 (% CD8) | 0.3 (0.1; 0.5) | 0.3 (0.1; 0.6) | 0.7 | 0.6 (0.4; 1.5) | <0.001 (a < 0,01; b < 0.05) |
| Ratio CD4/CD8 | 1.5 (0.9; 4.7) | 4.6 (2.0; 9.8) | 0.1 | 4.0 (2.8; 7.6) | 0.08 |
| n B lymphocytes (cells/µL) | 34 (6; 210) | 67 (14; 220) | 0.39 | ||
| n B lymphocytes <40 cells/µL | 12 (60%) # | 5 (25%) # | 0.03 | ||
| B lymphocytes (% lymphocytes) | 4.3 (1.2; 18.6) | 12.5 (2.6; 20.9) | 0.29 | 12.3 (7.8; 14.5) | 0.21 |
| n NK lymphocytes (cells/µL) | 60 (32; 160) | 65 (25; 81) | 0.41 | ||
| NK lymphocytes (% lymphocytes) | 7.0 (3.8; 12.4) | 5.1 (2.0; 9.2) | 0.3 | 10.2 (7.5; 15.6) | 0.02 (a: NS; b < 0.05) |
| n NK T lymphocytes (cells/µL) | 29 (11; 77) | 20 (8; 39) | 0.27 | ||
| NK T lymphocytes (% lymphocytes) | 3.2 (1.4; 5.3) | 1.8 (0.9; 7.8) | 0.29 | 4.5 (2.5; 7.4) | 0.12 |
| PCP (+) | |||
|---|---|---|---|
| Survivors | Deceased | p-Value | |
| n patients | 13 | 7 a | |
| Median age (years) (min; max) | 63 (36; 78) | 68 (30; 71) | 0.63 |
| Sex ratio (M/F) | 1.6 (8/5) | 6 (6/1) | 0.35 |
| Immunosuppression condition | |||
| Solid organ transplant | 3 (23%) | 2 (29%) | 1 |
| Cancer with chemotherapy b | 2 (15%) | 4 (57%) | 0.12 |
| Bone marrow graft | 2 (15%) | 0 (0%) | 0.52 |
| Inflammatory disease | 3 (23%) | 0 (0%) | 0.52 |
| HIV-positive | 3 (23%) | 1 (14%) | 1 |
| Immunosuppressive and anti-inflammatory therapies | |||
| Corticosteroid therapy | 8 (62%) | 6 (86%) | 0.35 |
| Mofetil mycophenolate | 0 (0%) | 1 (14%) | 0.35 |
| Anticalcineurins | 3 (23%) | 1 (14%) | 1 |
| mTOR inhibitors | 3 (23%) | 1 (14%) | 1 |
| Cytotoxic agents | 2 (15%) | 4 (57%) | 0.12 |
| Anti-CD-20 agents | 1 (8%) | 0 (0%) | 1 |
| Fungal load (30-Cq)–median (interquartile range) | 7.5 (3.3; 11.2) | 9.3 (4.5; 10.5) | 0.75 |
| Positive CMV PCR (blood and/or BAL) | 3 (23%) | 4 (57%) | 0.17 |
| Co-infections | 9 (69%) | 7 (100%) | 0.25 |
| Bacteria | 5 (38%) | 6 (86%) | 0.07 |
| Viruses | 6 (46%) | 4 (57%) | 1 |
| Fungi | 3 (23%) | 3 (43%) | 0.61 |
| Clinical signs and hospital care | |||
| Fever | 12 (92%) | 4 (57%) | 0.1 |
| Cough | 10 (77%) | 3 (43%) | 0.17 |
| Dyspnea | 11 (85%) | 7 (100%) | 0.52 |
| CT scan abnormalities | 12 (92%) | 7 (100%) | 1 |
| Intensive care admission | 5 (38%) | 5 (71%) | 0.35 |
| Mechanical ventilation/High flow O2 | 5 (38%) | 6 (86%) | 0.07 |
| Medians (Interquartile Ranges) | p-Value | ||
| n leukocytes (G/L) | 5.4 (4.0; 10.8) | 5.6 (2.9; 14.3) | 1 |
| n lymphocytes (G/L) | 0.9 (0.7; 2.0) | 0.6 (0.4; 0.7) | 0.05 |
| n neutrophils (G/L) | 3.9 (2.5; 7.1) | 4.2 (2.0; 12.4) | 0.78 |
| n eosinophils (G/L) | 0.1 (0.0; 0.3) | 0 (0.0; 0.1) | 0.06 |
| n basophils (G/L) | 0 (0.0; 0.1) | 0 (0.0; 0.1) | 1 |
| n monocytes (G/L) | 0.4 (0.2; 1.1) | 0.4 (0.1; 0.8) | 0.32 |
| n T CD3 (cells/µL) | 620 (364; 1424) | 500 (136; 538) | 0.23 |
| T CD3 (% lymphocytes) | 66.4 (48.4; 79.7) | 76.9 (48; 83.3) | 0.58 |
| n T CD4 (cells/µL) | 363 (116; 854) | 166 (89; 376) | 0.2 |
| T CD4 (% CD3) | 58.6 (41; 80.2) | 51.5 (42.5; 76.9) | 1 |
| Naive CD4 (% CD4) | 20.2 (4.5; 41) | 42.5 (24.9; 49.6) | 0.11 |
| Effectors CD4 (% CD4) | 1.8 (0.7; 2.9) | 2.9 (1.6; 5;7) | 0.17 |
| Effectors memory CD4 (% CD4) | 31.4 (19.6; 62.6) | 27.9 (19; 36.1) | 0.38 |
| Central memory CD4 (% CD4) | 36.2 (23.6; 43) | 28.6 (20; 39.9) | 0.18 |
| Th1 CD4 (% CD4) | 19 (11.7; 30.4) | 9.2 (7.0; 10.0) | 0.02 |
| Th2 CD4 (% CD4) | 0.6 (0.3; 0.8) | 1.3 (0.4; 1.5) | 0.03 |
| Th17 CD4 (% CD4) | 0.5 (0.1; 0.8) | 0.3 (0.1; 1.2) | 1 |
| Th1-Th17 CD4 (% CD4) | 4.8 (3.2; 8.8) | 3.9 (0.8; 9.2) | 0.81 |
| Th9 CD4 (% CD4) | 6.9 (4.7; 11.7) | 4.3 (2.1; 11.7) | 0.34 |
| CD4 Treg (% CD4) | 6.1 (2.6; 11.1) | 4.65 (3.0; 8.2) | 0.81 |
| Ratio Th1/Th2 | 33.3 (13.7; 108.8) | 9.4 (4.3; 16.4) | 0.01 |
| Ratio Th17/Treg | 0.07 (0.03; 0.13) | 0.07 (0.02; 0.31) | 1 |
| n T CD8 (cells/µL) | 109 (48; 599) | 125 (58; 187) | 0.58 |
| T CD8 (% CD3) | 29.8 (13.6; 47.7) | 37.5 (16.3; 47.9) | 0.94 |
| Naive CD8 (% CD8) | 13.3 (1.5; 34) | 15.6 (12.3; 24.5) | 0.63 |
| Effector CD8 (% CD8) | 16.5 (13.7; 23.9) | 44.1 (28.6; 68.4) | <0.01 |
| Effector memory CD8 (% CD8) | 51.3 (26.1; 76.7) | 24.5 (15.4; 43.3) | 0.1 |
| Central memory CD8 (% CD8) | 6.4 (4.1; 11.8) | 2.3 (1.2; 7) | 0.04 |
| CD8 Treg (% CD8) | 0.03 (0.0; 0.2) | 0.07 (0.02; 0.2) | 0.93 |
| Non-naive Tc1 CD8 (% CD8) | 58.7 (45.2; 71.8) | 36.0 (29.9; 45.5) | 0.03 |
| Non-nave Tc2 CD8 (% CD8) | 1.1 (0.9; 1.6) | 1.2 (0.5; 2.4) | 0.97 |
| Non-naive Tc9 CD8 (% CD8) | 0.2 (0.1; 0.4) | 0.3 (0.1; 0.5) | 0.57 |
| Ratio CD4/CD8 | 1.7 (0.9; 6) | 1.4 (0.9; 4.7) | 1 |
| n B lymphocytes (cells/µL) | 42 (6; 321) | 25 (5; 55) | 0.43 |
| B lymphocytes (% lymphocytes) | 4.7 (1.3; 19.9) | 3.2 (0.9; 7.9) | 0.53 |
| n NK lymphocytes (cells/µL) | 94 (51; 165) | 31 (6; 45) | 0.02 |
| NK lymphocytes (% lymphocytes) | 9.2 (5.0; 24) | 4.5 (1.0; 7.1) | 0.1 |
| n NK T lymphocytes (cells/µL) | 37 (12; 82) | 22 (8; 55) | 0.63 |
| NK T lymphocytes (% lymphocytes) | 3.2 (1.3; 5.3) | 3.3 (1.6; 9.1) | 0.69 |
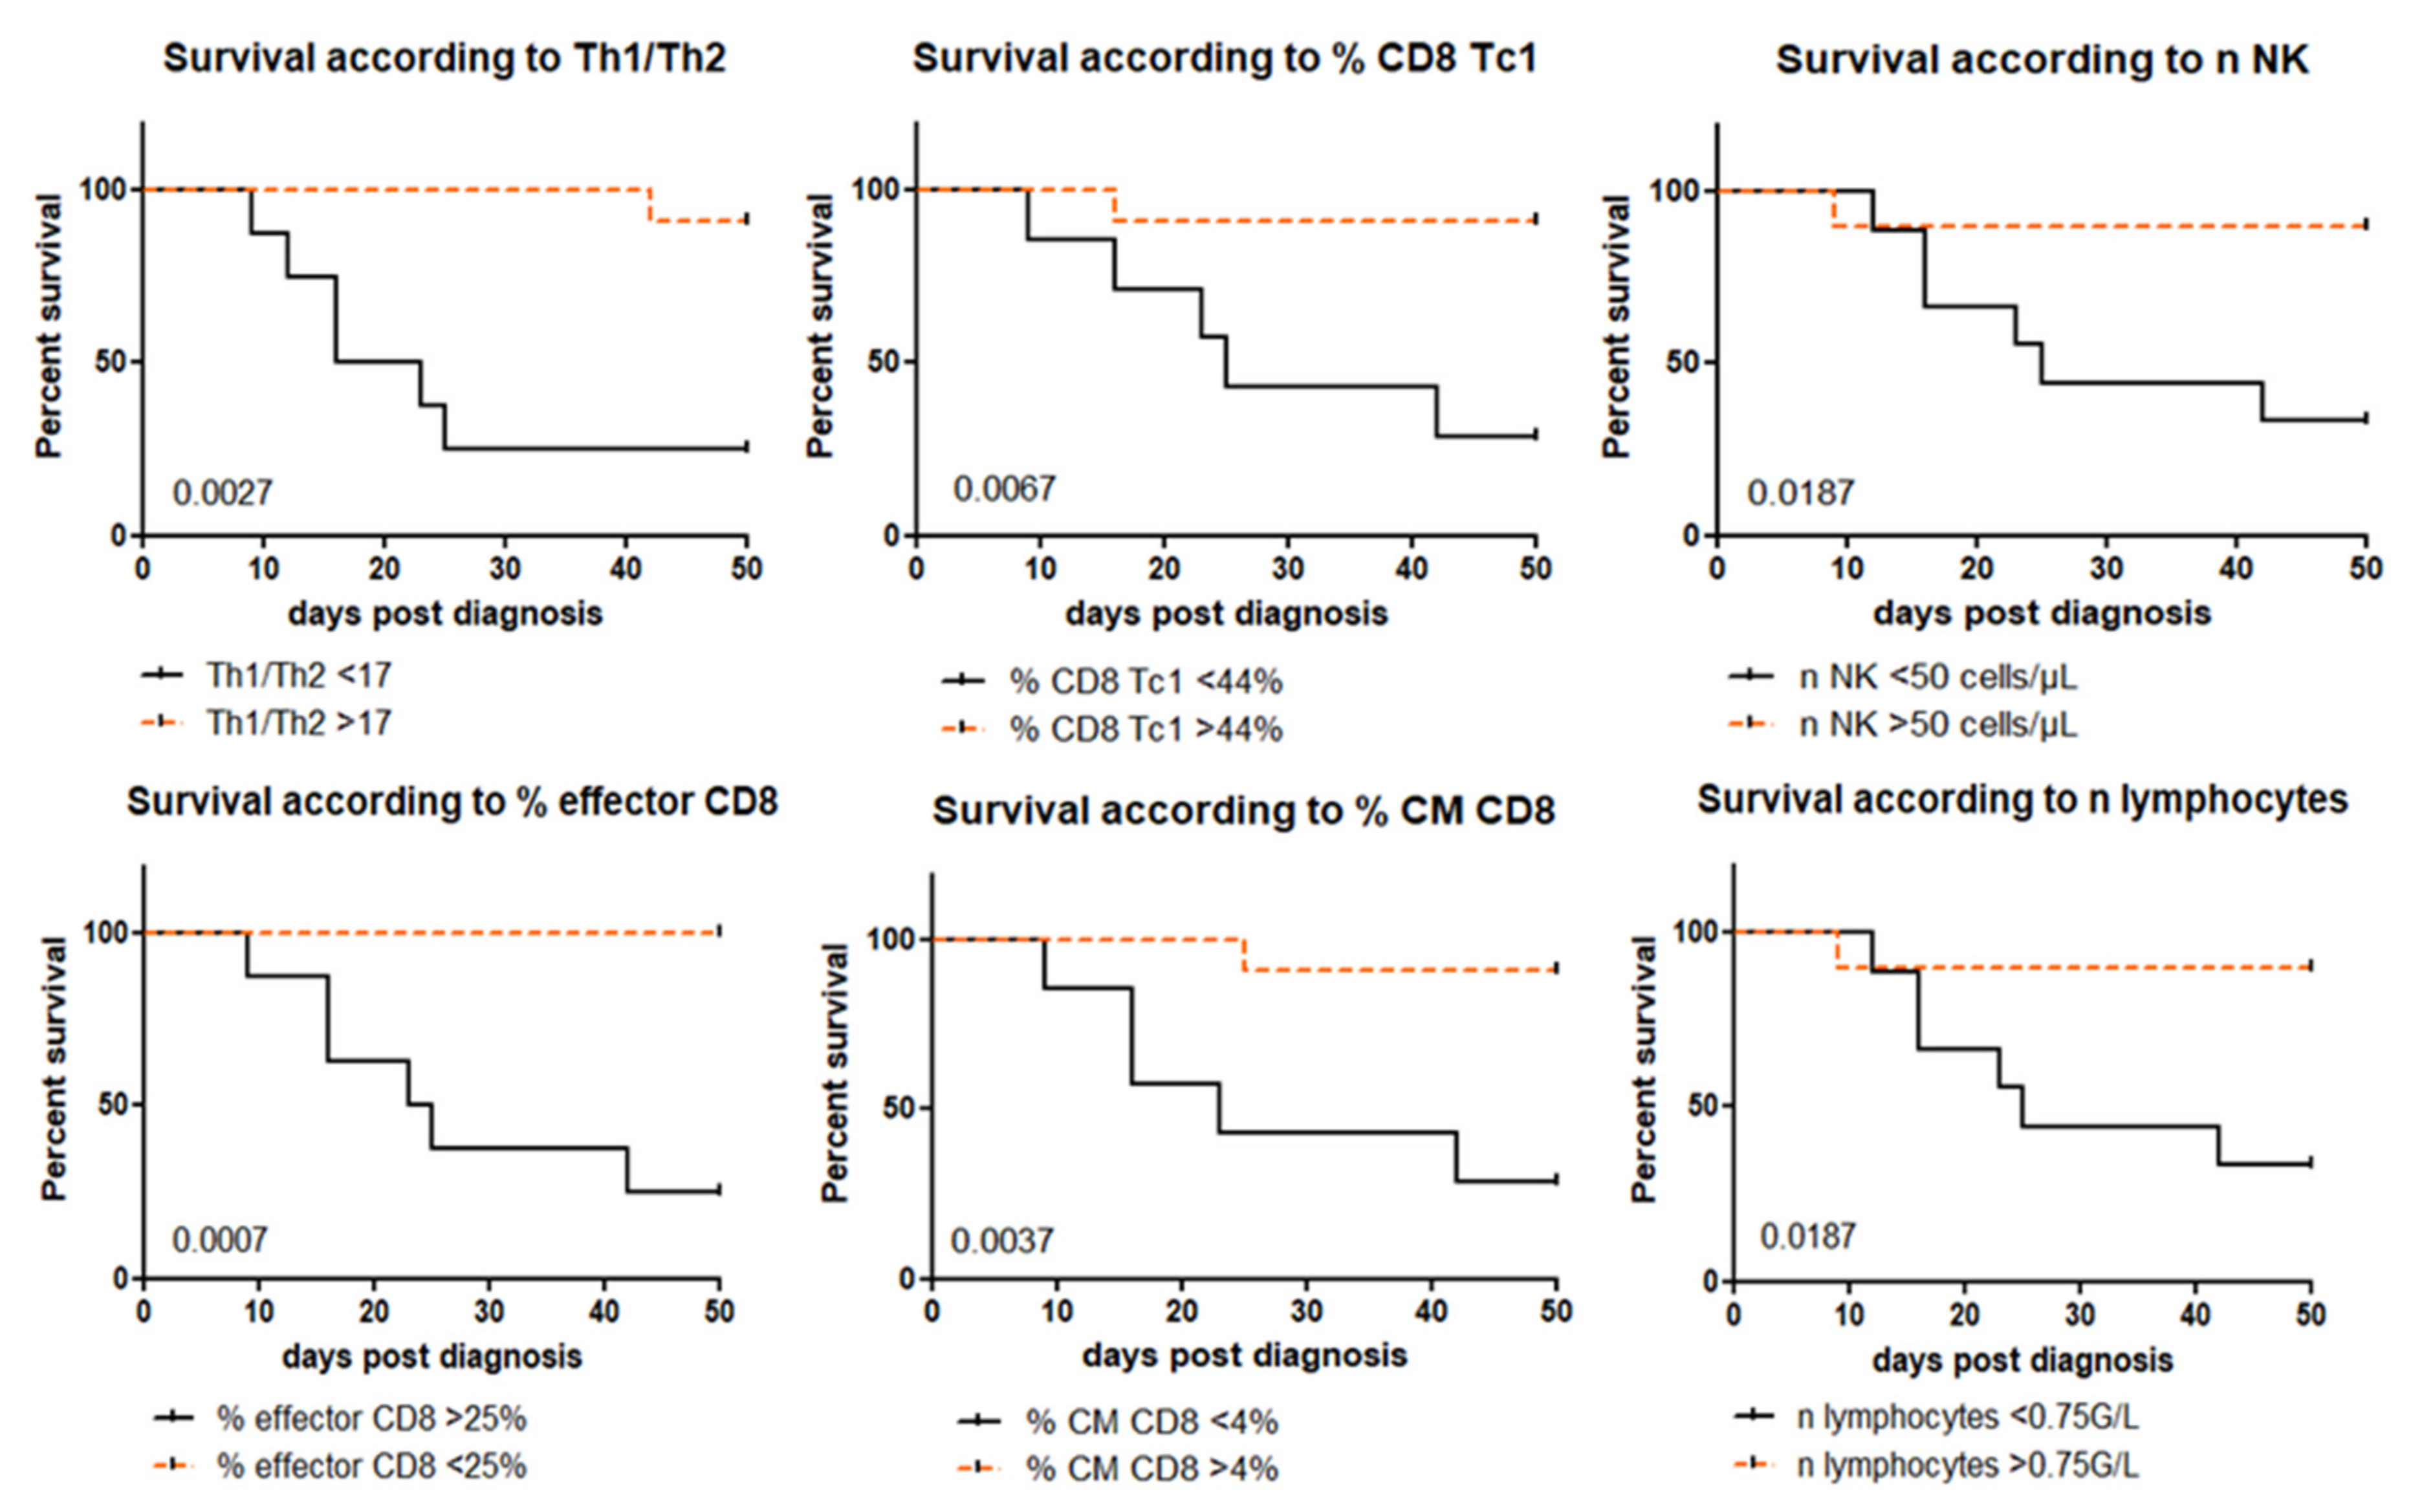
| Th1/Th2 | % Tc1 CD8 | % Effector CD8 | % CM CD8 | n NK Cells | n Lymphocytes | |
|---|---|---|---|---|---|---|
| Threshold | 17 | 44% | 25% | 4% | 50 cells/µL | 0.75 G/L |
| Sensitivity (%) | 85.7 | 83.3 | 100 | 83.3 | 85.7 | 85.7 |
| Specificity (%) | 83.3 | 83.3 | 83.3 | 83.3 | 75 | 75 |
| PPV (%) | 75 | 71.4 | 75 | 71.4 | 66.7 | 66.7 |
| NPV (%) | 90.9 | 90.9 | 100 | 90.9 | 90 | 90 |
| AUC (%) | 88.1 | 83.3 | 93.1 | 81.3 | 82.1 | 76.8 |
Publisher’s Note: MDPI stays neutral with regard to jurisdictional claims in published maps and institutional affiliations. |
© 2021 by the authors. Licensee MDPI, Basel, Switzerland. This article is an open access article distributed under the terms and conditions of the Creative Commons Attribution (CC BY) license (https://creativecommons.org/licenses/by/4.0/).
Share and Cite
Charpentier, E.; Marques, C.; Ménard, S.; Chauvin, P.; Guemas, E.; Cottrel, C.; Cassaing, S.; Fillaux, J.; Valentin, A.; Blanchard, N.; et al. New Insights into Blood Circulating Lymphocytes in Human Pneumocystis Pneumonia. J. Fungi 2021, 7, 652. https://doi.org/10.3390/jof7080652
Charpentier E, Marques C, Ménard S, Chauvin P, Guemas E, Cottrel C, Cassaing S, Fillaux J, Valentin A, Blanchard N, et al. New Insights into Blood Circulating Lymphocytes in Human Pneumocystis Pneumonia. Journal of Fungi. 2021; 7(8):652. https://doi.org/10.3390/jof7080652
Chicago/Turabian StyleCharpentier, Eléna, Catherine Marques, Sandie Ménard, Pamela Chauvin, Emilie Guemas, Claire Cottrel, Sophie Cassaing, Judith Fillaux, Alexis Valentin, Nicolas Blanchard, and et al. 2021. "New Insights into Blood Circulating Lymphocytes in Human Pneumocystis Pneumonia" Journal of Fungi 7, no. 8: 652. https://doi.org/10.3390/jof7080652