
Utility of the Comprehensive Trail Making Test in the Assessment of Mild Cognitive Impairment in Older Patients


Abstract
:1. Introduction
2. Materials and Methods
2.1. Study Design, Setting, and Duration
2.2. Sample Size and Participant Recruitment
- A group of patients with a diagnosis of MCI (Group I),
- A group of patients without a cognitive impairment, constituting the control group (Group K).
2.3. Study Inclusion, Exclusion, and Diagnostic Criteria
2.4. Data Collection and Instruments Used
2.5. Statistical Analyses
3. Results
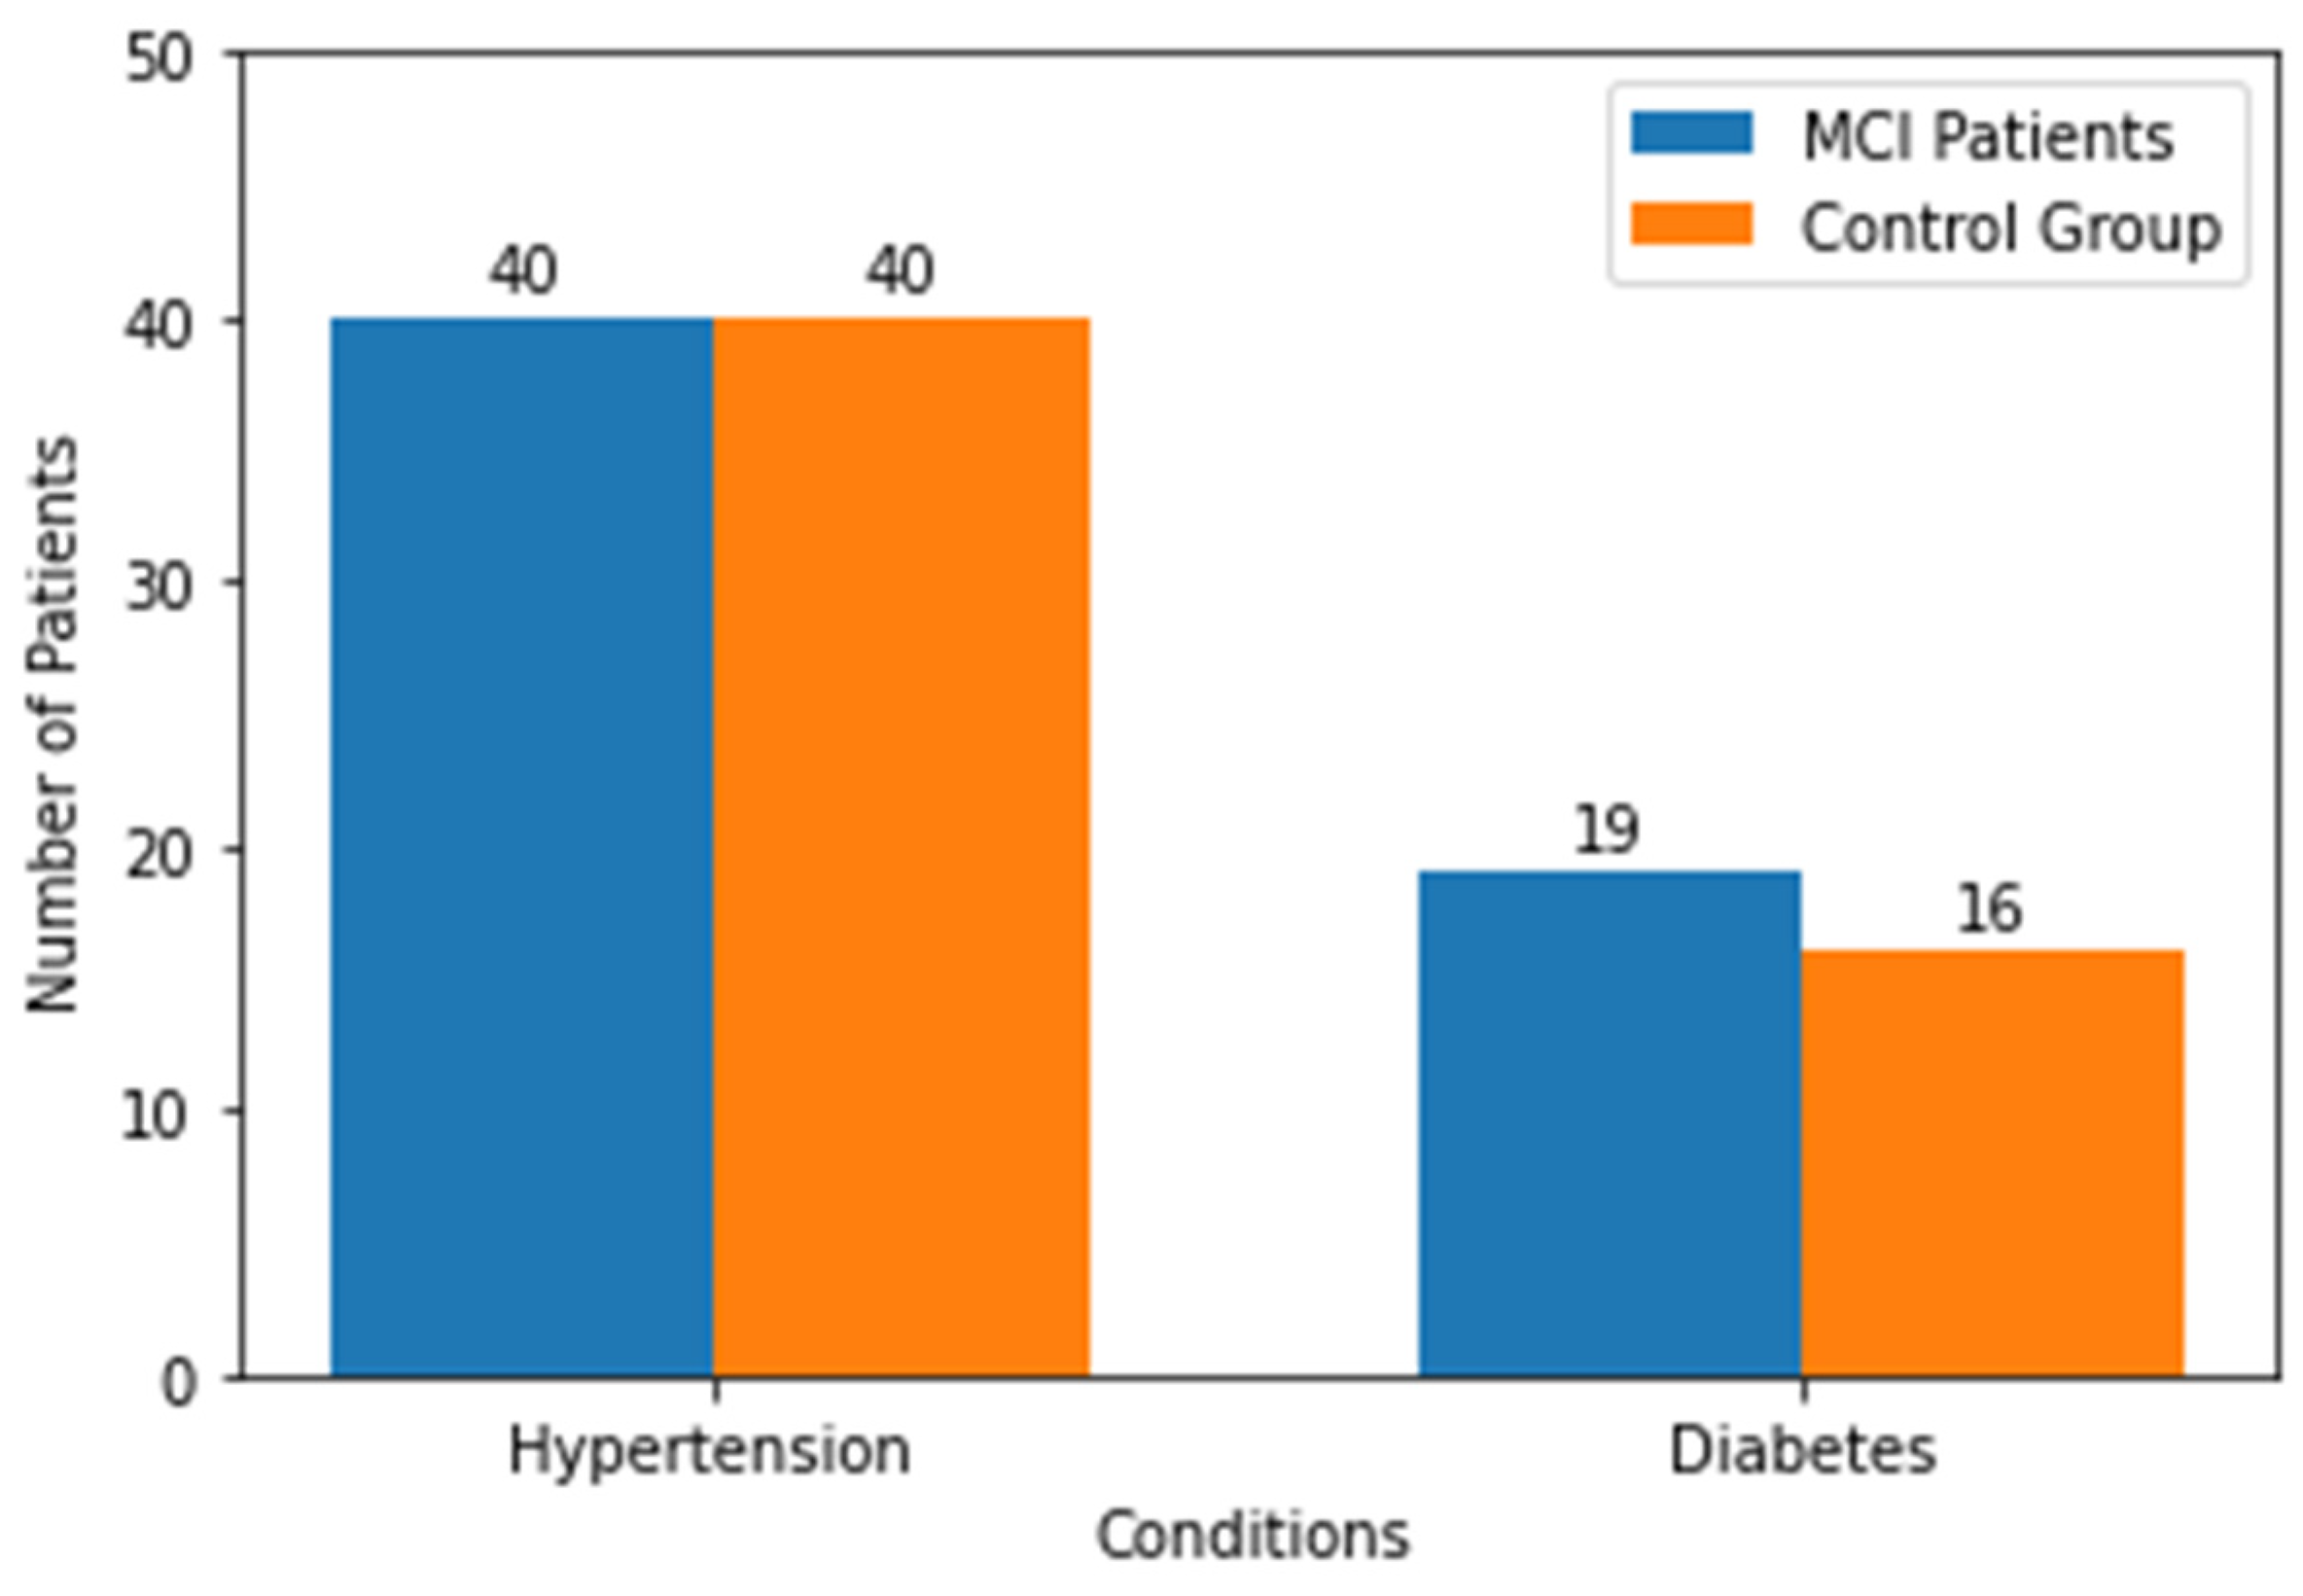
3.1. Characteristics of Study Sample
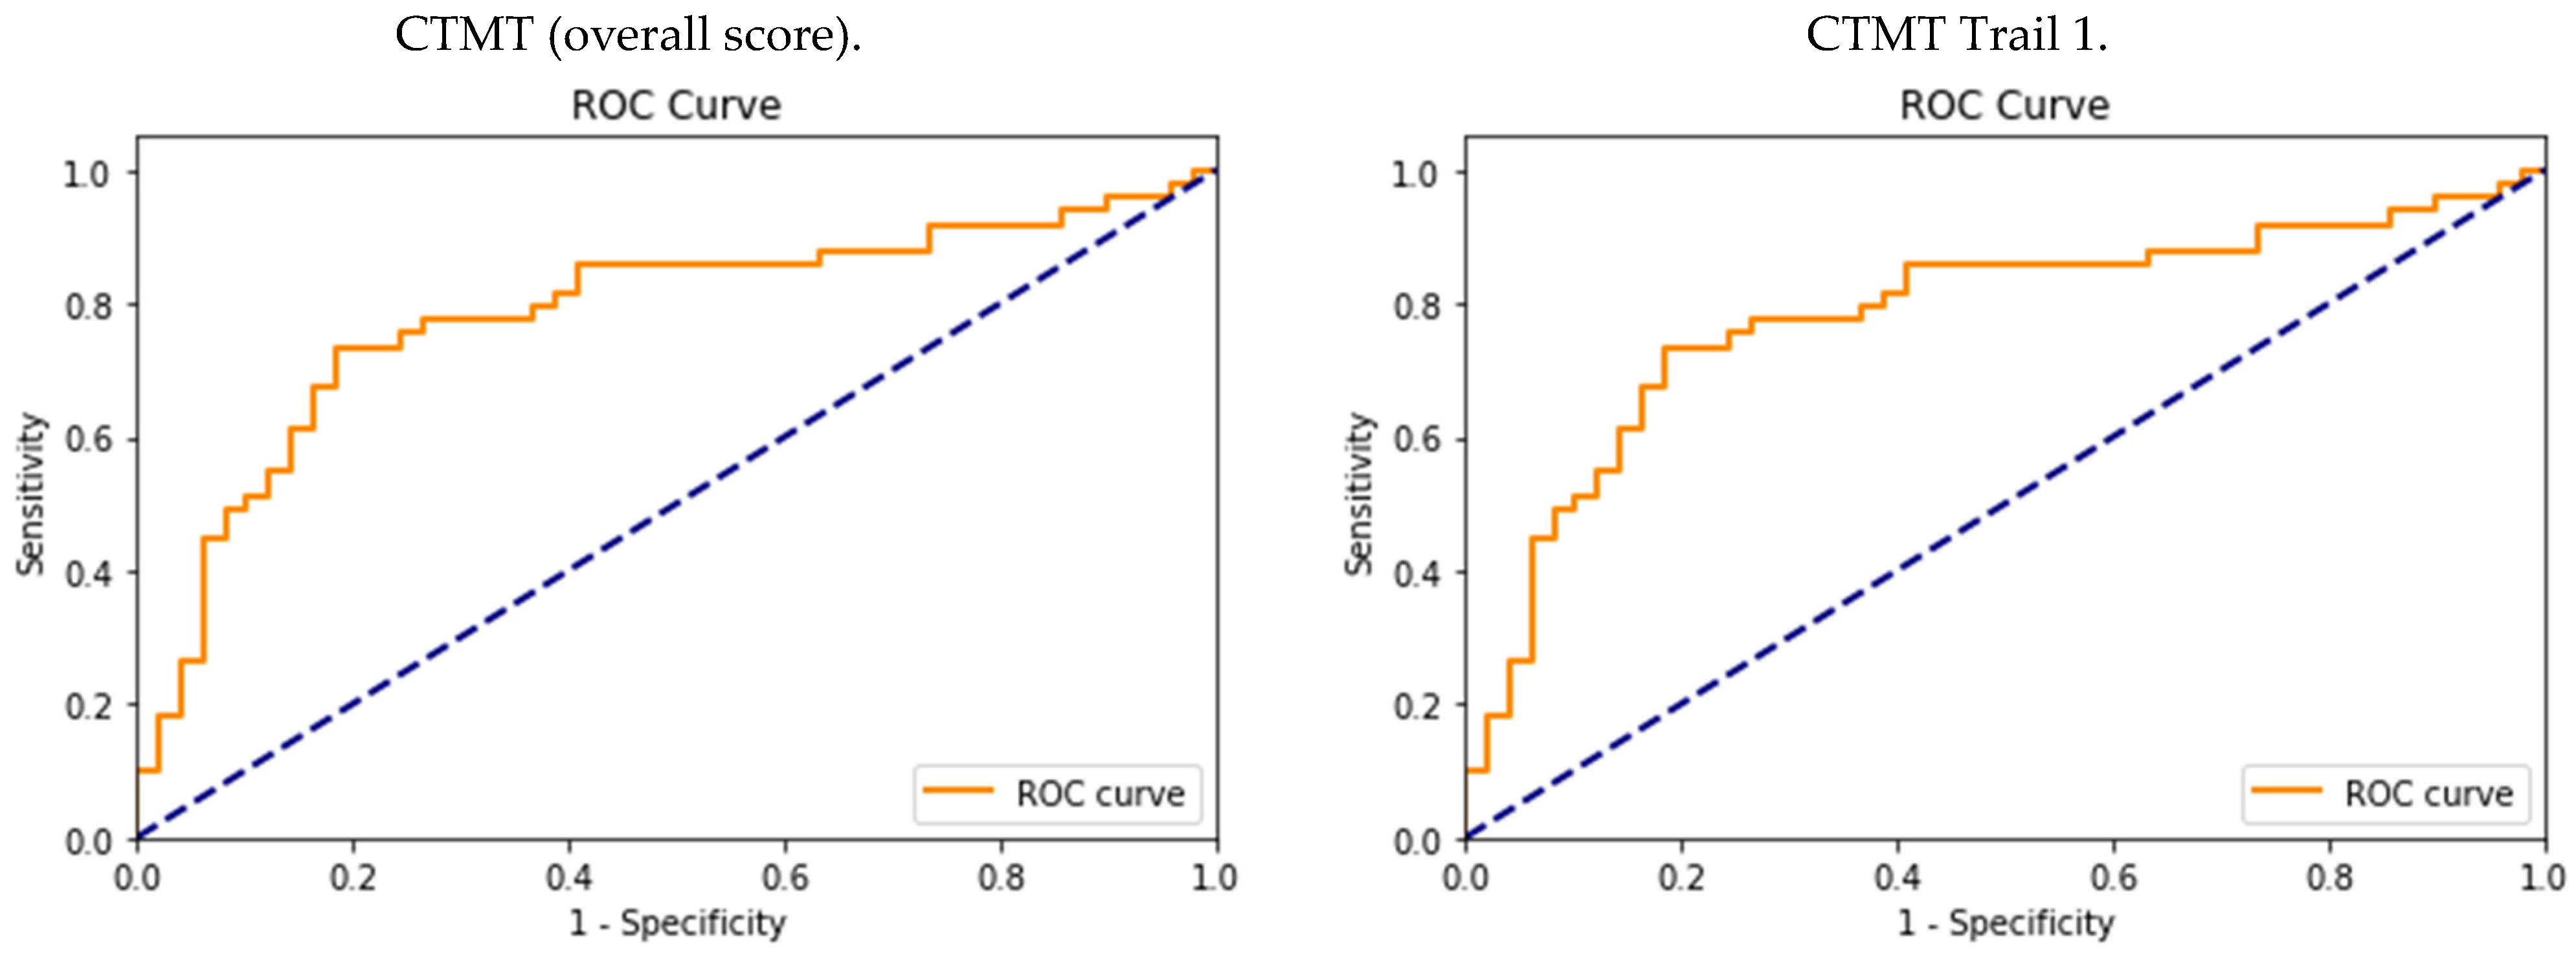
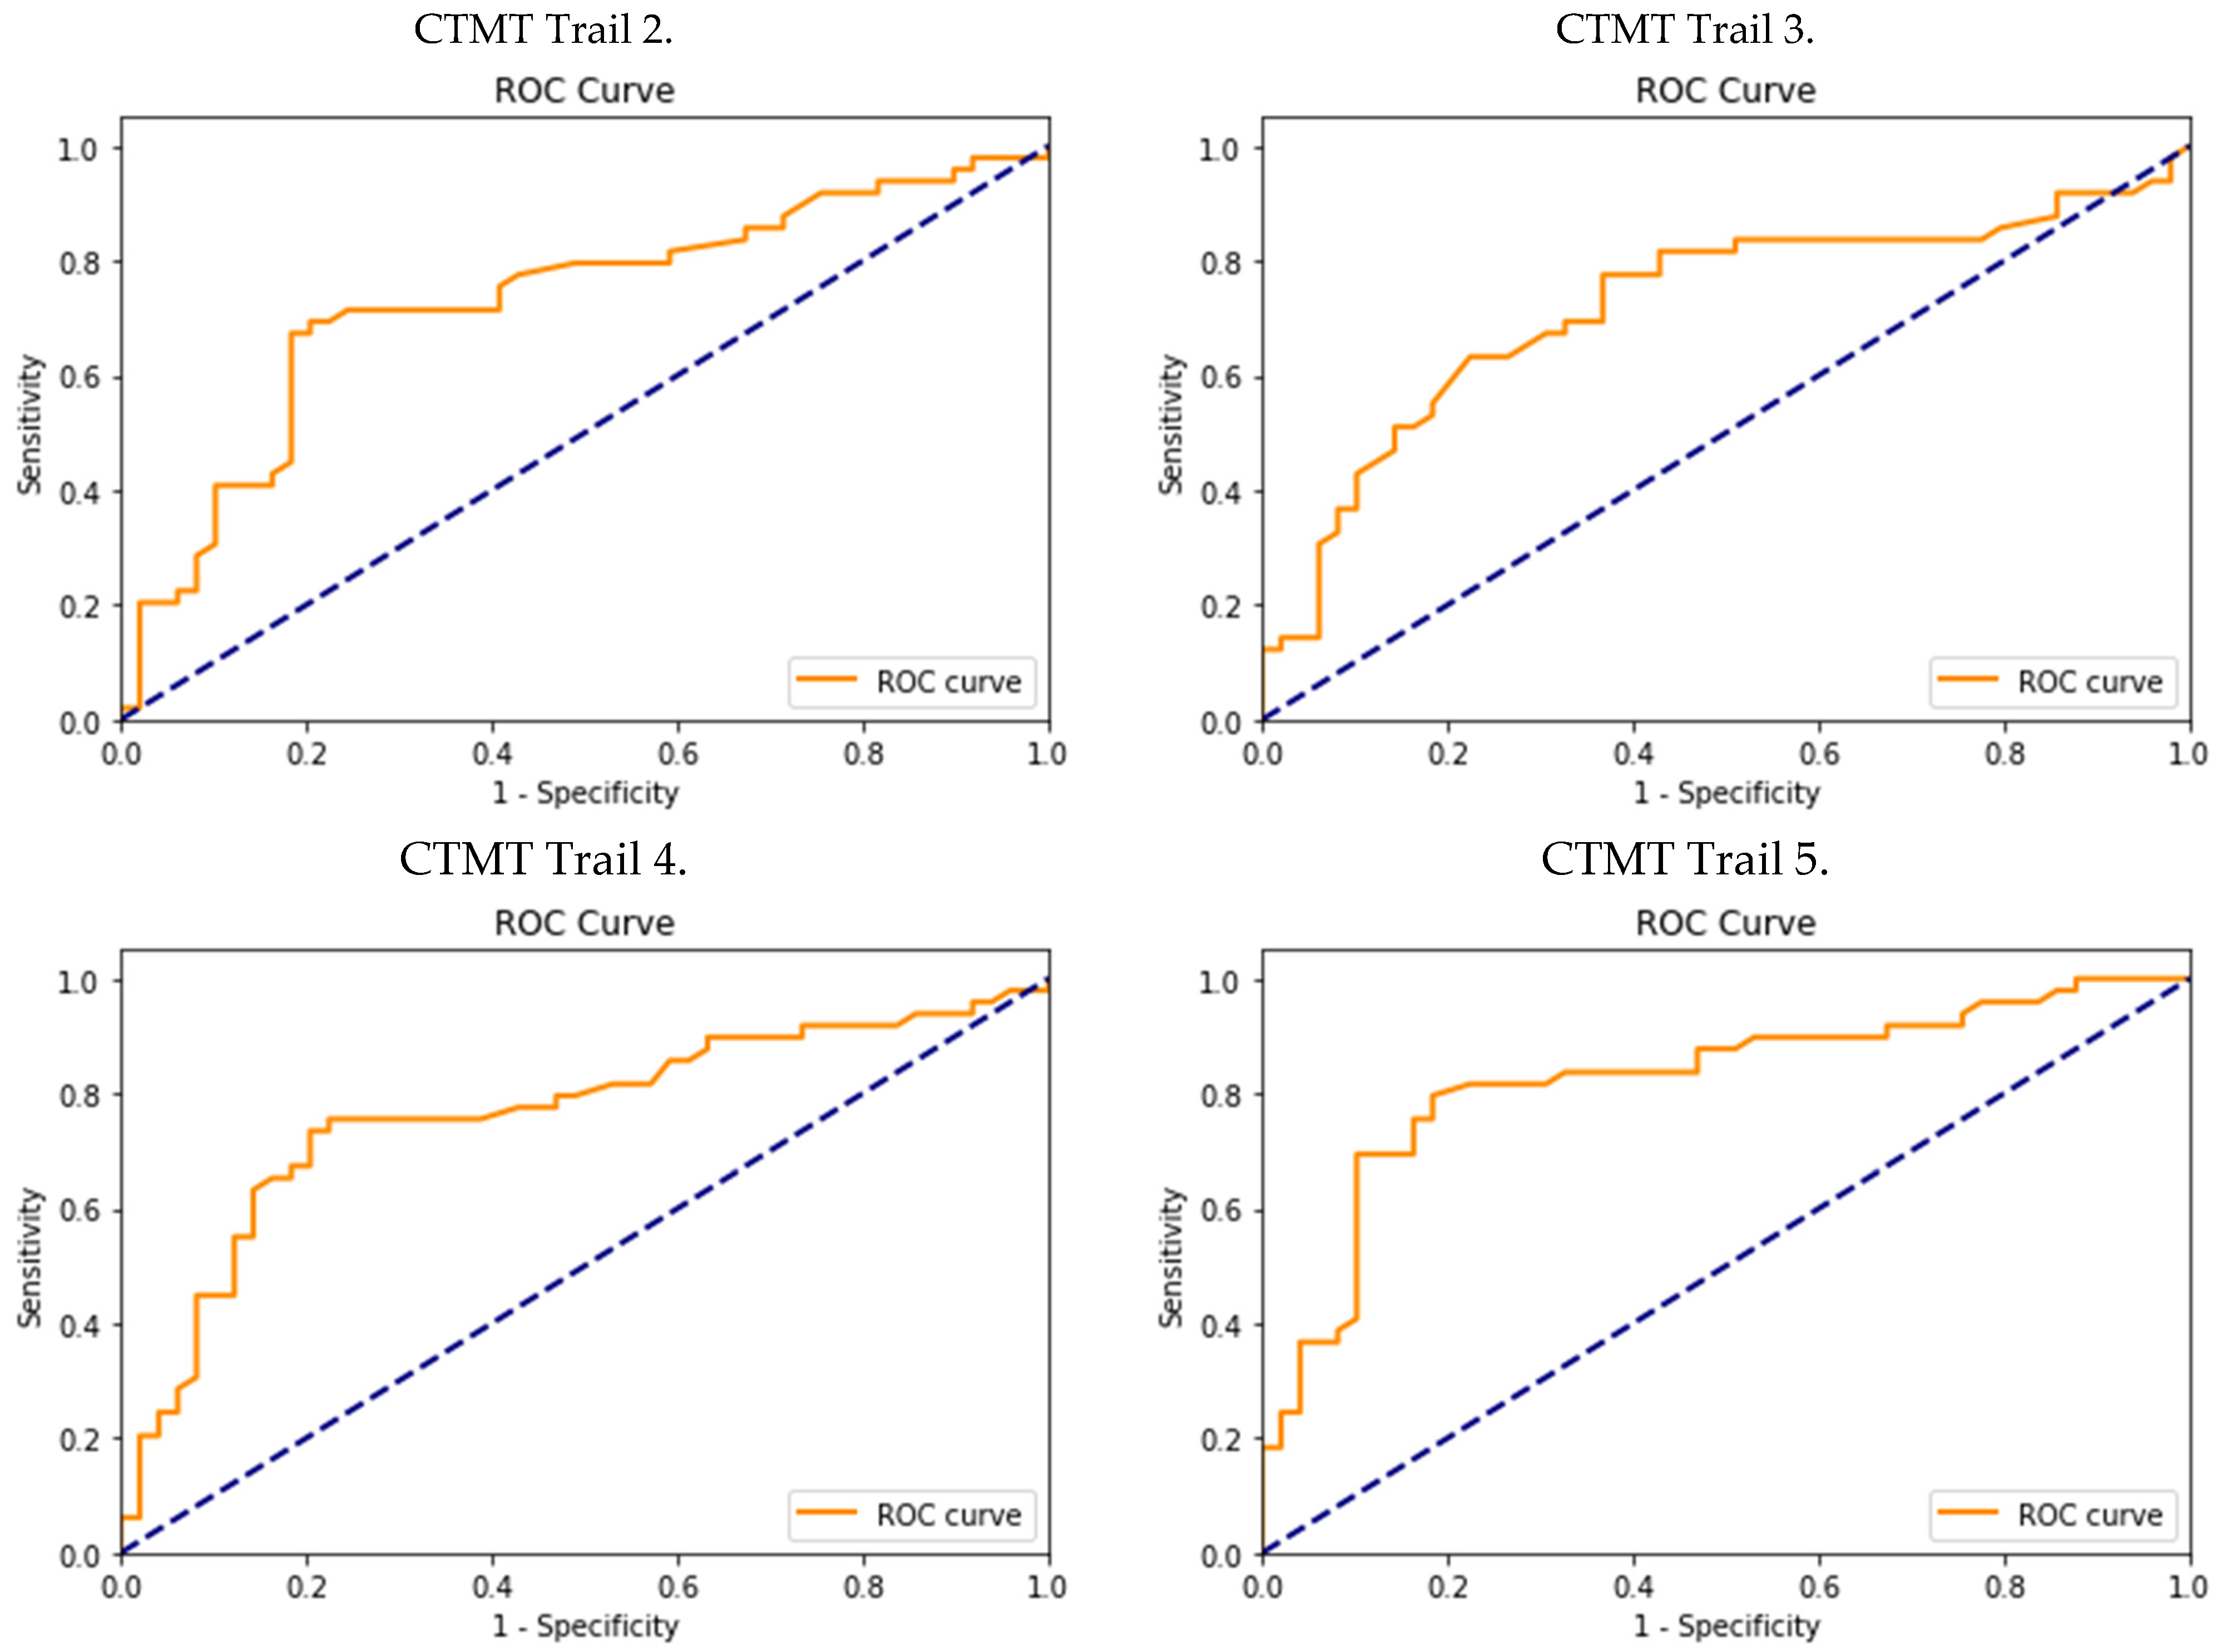
3.2. Diagnostic Accuracy and Optimal CTMT Cutoff Scores
4. Discussion
Limitations
5. Conclusions
Author Contributions
Funding
Institutional Review Board Statement
Informed Consent Statement
Data Availability Statement
Acknowledgments
Conflicts of Interest
References
- Dubois, B.; Feldman, H.H.; Jacova, C.; Hampel, H.; Molinuevo, J.L.; Blennow, K.; DeKosky, S.T.; Gauthier, S.; Selkoe, D.; Bateman, R.; et al. Advancing research diagnostic criteria for Alzheimer’s disease: The IWG-2 criteria. Lancet Neurol. 2014, 13, 614–629. [Google Scholar] [CrossRef]
- Gramkow, M.H.; Gjerum, L.; Koikkalainen, J.; Lötjönen, J.; Law, I.; Hasselbalch, S.G.; Waldemar, G.; Frederiksen, K.S. Prognostic value of complementary biomarkers of neurodegeneration in a mixed memory clinic cohort. PeerJ 2020, 8, e9498. [Google Scholar] [CrossRef]
- Somers, C.; Struyfs, H.; Goossens, J.; Niemantsverdriet, E.; Luyckx, J.; De Roeck, N.; De Roeck, E.; De Vil, B.; Cras, P.; Martin, J.J.; et al. A Decade of Cerebrospinal Fluid Biomarkers for Alzheimer’s Disease in Belgium. J. Alzheimer’s Dis. 2016, 54, 383–395. [Google Scholar] [CrossRef]
- Aisen, P.S.; Bateman, R.J.; Carrillo, M.; Doody, R.; Johnson, K.; Sims, J.R.; Sperling, R.; Vellas, B. Platform Trials to Expedite Drug Development in Alzheimer’s Disease: A Report from the EU/US CTAD Task Force. J. Prev. Alzheimer’s Dis. 2021, 8, 306–312. [Google Scholar] [CrossRef] [PubMed]
- Milà-Alomà, M.; Salvadó, G.; Shekari, M.; Grau-Rivera, O.; Sala-Vila, A.; Sánchez-Benavides, G.; Arenaza-Urquijo, E.M.; González-de-Echávarri, J.M.; Simon, M.; Kollmorgen, G.; et al. Comparative Analysis of Different Definitions of Amyloid-β Positivity to Detect Early Downstream Pathophysiological Alterations in Preclinical Alzheimer. J. Prev. Alzheimer’s Dis. 2021, 8, 68–77. [Google Scholar] [CrossRef] [PubMed]
- Liu, X.; Chen, K.; Wu, T.; Weidman, D.; Lure, F.; Li, J. Use of multimodality imaging and artificial intelligence for diagnosis and prognosis of early stages of Alzheimer’s disease. Transl. Res. 2018, 194, 56–67. [Google Scholar] [CrossRef] [PubMed]
- Petersen, R.C. Mild Cognitive Impairment. Contin. Lifelong Learn. Neurol. 2016, 22, 404–418. [Google Scholar] [CrossRef]
- Albert, M.S.; DeKosky, S.T.; Dickson, D.; Dubois, B.; Feldman, H.H.; Fox, N.C.; Gamst, A.; Holtzman, D.M.; Jagust, W.J.; Petersen, R.C.; et al. The diagnosis of mild cognitive impairment due to Alzheimer’s disease: Recommendations from the National Institute on Aging-Alzheimer’s Association workgroups on diagnostic guidelines for Alzheimer’s disease. Alzheimer’s Dement. J. Alzheimer’s Assoc. 2011, 7, 270–279. [Google Scholar] [CrossRef]
- Petersen, R.C.; Lopez, O.; Armstrong, M.J.; Getchius, T.S.D.; Ganguli, M.; Gloss, D.; Gronseth, G.S.; Marson, D.; Pringsheim, T.; Day, G.S.; et al. Practice guideline update summary: Mild cognitive impairment: Report of the Guideline Development, Dissemination, and Implementation Subcommittee of the American Academy of Neurology. Neurology 2018, 90, 126–135. [Google Scholar] [CrossRef]
- Jongsiriyanyong, S.; Limpawattana, P. Mild Cognitive Impairment in Clinical Practice: A Review Article. Am. J. Alzheimer’s Dis. Other Dement. 2018, 33, 500–507. [Google Scholar] [CrossRef]
- Winblad, B.; Palmer, K.; Kivipelto, M.; Jelic, V.; Fratiglioni, L.; Wahlund, L.O.; Nordberg, A.; Bäckman, L.; Albert, M.; Almkvist, O.; et al. Mild cognitive impairment--beyond controversies, towards a consensus: Report of the International Working Group on Mild Cognitive Impairment. J. Intern. Med. 2004, 256, 240–246. [Google Scholar] [CrossRef] [PubMed]
- Cloutier, S.; Chertkow, H.; Kergoat, M.J.; Gauthier, S.; Belleville, S. Patterns of Cognitive Decline Prior to Dementia in Persons with Mild Cognitive Impairment. J. Alzheimer’s Dis. 2015, 47, 901–913. [Google Scholar] [CrossRef]
- Johnson, J.K.; Gross, A.L.; Pa, J.; McLaren, D.G.; Park, L.Q.; Manly, J.J. Longitudinal change in neuropsychological performance using latent growth models: A study of mild cognitive impairment. Brain Imaging Behav. 2012, 6, 540–550. [Google Scholar] [CrossRef] [PubMed]
- Boccardi, M.; Monsch, A.U.; Ferrari, C.; Altomare, D.; Berres, M.; Bos, I.; Buchmann, A.; Cerami, C.; Didic, M.; Festari, C.; et al. Harmonizing neuropsychological assessment for mild neurocognitive disorders in Europe. Alzheimer’s Dement. J. Alzheimer’s Assoc. 2022, 18, 29–42. [Google Scholar] [CrossRef] [PubMed]
- Payton, N.M.; Rizzuto, D.; Fratiglioni, L.; Kivipelto, M.; Bäckman, L.; Laukka, E.J. Combining Cognitive Markers to Identify Individuals at Increased Dementia Risk: Influence of Modifying Factors and Time to Diagnosis. J. Int. Neuropsychol. Soc. 2020, 26, 785–797. [Google Scholar] [CrossRef]
- Prado, C.E.; Watt, S.; Treeby, M.S.; Crowe, S.F. Performance on neuropsychological assessment and progression to dementia: A meta-analysis. Psychol. Aging 2019, 34, 954–977. [Google Scholar] [CrossRef]
- Jutten, R.J.; Sikkes, S.A.M.; Amariglio, R.E.; Buckley, R.F.; Properzi, M.J.; Marshall, G.A.; Rentz, D.M.; Johnson, K.A.; Teunissen, C.E.; Van Berckel, B.N.M.; et al. Identifying Sensitive Measures of Cognitive Decline at Different Clinical Stages of Alzheimer’s Disease. J. Int. Neuropsychol. Soc. 2021, 27, 426–438. [Google Scholar] [CrossRef]
- McFall, G.P.; Sapkota, S.; McDermott, K.L.; Dixon, R.A. Risk-reducing Apolipoprotein E and Clusterin genotypes protect against the consequences of poor vascular health on executive function performance and change in nondemented older adults. Neurobiol. Aging 2016, 42, 91–100. [Google Scholar] [CrossRef]
- Sapkota, S.; Bäckman, L.; Dixon, R.A. Executive function performance and change in aging is predicted by apolipoprotein E, intensified by catechol-O-methyltransferase and brain-derived neurotrophic factor, and moderated by age and lifestyle. Neurobiol. Aging 2017, 52, 81–89. [Google Scholar] [CrossRef]
- Caballero, H.S.; McFall, G.P.; Wiebe, S.A.; Dixon, R.A. Integrating Three Characteristics of Executive Function in Non-Demented Aging: Trajectories, Classification, and Biomarker Predictors. J. Int. Neuropsychol. Soc. 2021, 27, 158–171. [Google Scholar] [CrossRef] [PubMed]
- Logie, R.; Parra Rodriguez, M.; Della Sala, S. From Cognitive Science to Dementia Assessment. Behav. Brain Sci. 2015, 2, 81–91. [Google Scholar] [CrossRef]
- Derejczyk, J.; Hanusiak, A.; Stępień Wyrobiec, O.; Radwan, G.; Szymszal, J.; Jabłeka, A.; Wilgus, M.; Płoska, A.; Schindler, W.; Malczyk, W.; et al. Test MoCA i test z L-Dopą jako nowe narzędzia Całościowej Oceny Geriatrycznej. Geriatria 2011, 5, 281–291. [Google Scholar]
- Reynolds, C. Comprehensive Trail Making Test (CTMT); PRO-ED Inc.: Austin, TX, USA, 2002. [Google Scholar]
- Amieva, H.; Jacqmin-Gadda, H.; Orgogozo, J.-M.; Le Carret, N.; Helmer, C.; Letenneur, L.; Barberger-Gateau, P.; Fabrigoule, C.; Dartigues, J.-F. The 9 year cognitive decline before dementia of the Alzheimer type: A prospective population-based study. Brain 2005, 128 Pt 5, 1093–1101. [Google Scholar] [CrossRef]
- Sutin, A.R.; Stephan, Y.; Terracciano, A. Verbal fluency and risk of dementia. Int. J. Geriatr. Psychiatry 2019, 34, 863–867. [Google Scholar] [CrossRef] [PubMed]
- Lakens, D. Sample Size Justification. Collabra: Psychology. Available online: https://psyarxiv.com/9d3yf/download?format=pdf (accessed on 15 December 2021).
- Ashendorf, L.; Jefferson, A.L.; O’Connor, M.K.; Chaisson, C.; Green, R.C.; Stern, R.A. Trail Making Test errors in normal aging, mild cognitive impairment, and dementia. Arch. Clin. Neuropsychol. Off. J. Natl. Acad. Neuropsychol. 2008, 23, 129–137. [Google Scholar] [CrossRef]
- Kim, K.; Jang, J.W.; Baek, M.J.; Kim, S.Y. A Comparison of Three types of Trail Making Test in the Korean Elderly: Higher Completion Rate of Trail Making Test-Black and White for Mild Cognitive Impairment. J. Alzheimers Dis. Park. 2016, 6, 239. [Google Scholar] [CrossRef]
- Zhou, H.; Sabbagh, M.; Wyman, R.; Liebsack, C.; Kunik, M.E.; Najafi, B. Instrumented Trail-Making Task to Differentiate Persons with No Cognitive Impairment, Amnestic Mild Cognitive Impairment, and Alzheimer Disease: A Proof of Concept Study. Gerontology 2017, 63, 189–200. [Google Scholar] [CrossRef]
- Cohen, R.A.; Marsiske, M.M.; Smith, G.E. Neuropsychology of aging. Handb. Clin. Neurol. 2019, 167, 149–180. [Google Scholar] [CrossRef]
- Krukow, P.; Jonak, K.; Karakuła-Juchnowicz, H.; Podkowiński, A.; Jonak, K.; Borys, M.; Harciarek, M. Disturbed functional connectivity within the left prefrontal cortex and sensorimotor areas predicts impaired cognitive speed in patients with first-episode schizophrenia. Psychiatry Res. Neuroimaging 2018, 275, 28–35. [Google Scholar] [CrossRef]
- Krukow, P.; Szaniawska, O.; Harciarek, M.; Plechawska-Wójcik, M.; Jonak, K. Cognitive inconsistency in bipolar patients is determined by increased intra-individual variability in initial phase of task performance. J. Affect. Disord. 2017, 210, 222–225. [Google Scholar] [CrossRef]
- Ciafone, J.; Thomas, A.; Durcan, R.; Donaghy, P.C.; Hamilton, C.A.; Lawley, S.; Roberts, G.; Colloby, S.; Firbank, M.J.; Allan, L.; et al. Neuropsychological Impairments and Their Cognitive Architecture in Mild Cognitive Impairment (MCI) with Lewy Bodies and MCI-Alzheimer’s Disease. J. Int. Neuropsychol. Soc. 2022, 28, 963–973. [Google Scholar] [CrossRef]
- Kirova, A.M.; Bays, R.B.; Lagalwar, S. Working memory and executive function decline across normal aging, mild cognitive impairment, and Alzheimer’s disease. BioMed Res. Int. 2015, 999, 748212. [Google Scholar] [CrossRef] [PubMed]
- Reinvang, I.; Grambaite, R.; Espeseth, T. Executive Dysfunction in MCI: Subtype or Early Symptom. Int. J. Alzheimer’s Dis. 2012, 999, 936272. [Google Scholar] [CrossRef]
- Sjöbeck, M.; Elfgren, C.; Larsson, E.M.; Brockstedt, S.; Lätt, J.; Englund, E.; Passant, U. Alzheimer’s disease (AD) and executive dysfunction. A case-control study on the significance of frontal white matter changes detected by diffusion tensor imaging (DTI). Arch. Gerontol. Geriatr. 2010, 50, 260–266. [Google Scholar] [CrossRef] [PubMed]
- Kerchner, G.A.; Racine, C.A.; Hale, S.; Wilheim, R.; Laluz, V.; Miller, B.L.; Kramer, J.H. Cognitive processing speed in older adults: Relationship with white matter integrity. PLoS ONE 2012, 7, e50425. [Google Scholar] [CrossRef] [PubMed]
- Han, S.H.; Chung, M.S.; Kim, S.; Youn, Y.C. Can the trail making test black and white predict white matter hyperintensity on MRI? J. Clin. Neurosci. Off. J. Neurosurg. Soc. Australas. 2019, 64, 155–159. [Google Scholar] [CrossRef] [PubMed]
- Huang, C.J.; Zhou, X.; Yuan, X.; Zhang, W.; Li, M.X.; You, M.Z.; Zhu, X.Q.; Sun, Z.W. Contribution of Inflammation and Hypoperfusion to White Matter Hyperintensities-Related Cognitive Impairment. Front. Neurol. 2022, 12, 786840. [Google Scholar] [CrossRef]
- Lee, S.; Viqar, F.; Zimmerman, M.E.; Narkhede, A.; Tosto, G.; Benzinger, T.L.; Marcus, D.S.; Fagan, A.M.; Goate, A.; Fox, N.C.; et al. Dominantly Inherited Alzheimer Network. White matter hyperintensities are a core feature of Alzheimer’s disease: Evidence from the dominantly inherited Alzheimer network. Ann. Neurol. 2016, 79, 929–939. [Google Scholar] [CrossRef]
- Van Rooden, S.; van den Berg-Huysmans, A.A.; Croll, P.H.; Labadie, G.; Hayes, J.M.; Viviano, R.; van der Grond, J.; Rombouts, S.A.R.B.; Damoiseaux, J.S. Subjective Cognitive Decline Is Associated with Greater White Matter Hyperintensity Volume. J. Alzheimer’s Dis. 2018, 66, 1283–1294. [Google Scholar] [CrossRef]
- Leal, S.L.; Yassa, M.A. Perturbations of neural circuitry in aging, mild cognitive impairment, and Alzheimer’s disease. Ageing Res. Rev. 2013, 12, 823–831. [Google Scholar] [CrossRef]
- Filley, C.M.; Fields, R.D. White matter and cognition: Making the connection. J. Neurophysiol. 2016, 116, 2093–2104. [Google Scholar] [CrossRef] [PubMed]
- Van den Berg, E.; Geerlings, M.I.; Biessels, G.J.; Nederkoorn, P.J.; Kloppenborg, R.P. White Matter Hyperintensities and Cognition in Mild Cognitive Impairment and Alzheimer’s Disease: A Domain-Specific Meta-Analysis. J. Alzheimer’s Dis. 2018, 63, 515–527. [Google Scholar] [CrossRef] [PubMed]
- Pini, L.; Pievani, M.; Bocchetta, M.; Altomare, D.; Bosco, P.; Cavedo, E.; Galluzzi, S.; Marizzoni, M.; Frisoni, G.B. Brain atrophy in Alzheimer’s Disease and aging. Ageing Res. Rev. 2016, 30, 25–48. [Google Scholar] [CrossRef] [PubMed]
- Lockhart, S.N.; Luck, S.J.; Geng, J.; Beckett, L.; Disbrow, E.A.; Carmichael, O.; DeCarli, C. White matter hyperintensities among older adults are associated with futile increase in frontal activation and functional connectivity during spatial search. PLoS ONE 2015, 10, e0122445. [Google Scholar] [CrossRef]
- Reijmer, Y.D.; Schultz, A.P.; Leemans, A.; O’Sullivan, M.J.; Gurol, M.E.; Sperling, R.; Greenberg, S.M.; Viswanathan, A.; Hedden, T. Decoupling of structural and functional brain connectivity in older adults with white matter hyperintensities. NeuroImage 2015, 117, 222–229. [Google Scholar] [CrossRef] [PubMed]
- Yang, H.J.; Lee, S.; Koh, M.J.; Lee, H.K.; Kim, B.S.; Kim, K.W.; Park, J.H. The Association of White Matter Hyperintensities with Frailty in Patients with Very Mild to Moderate Alzheimer’s Disease. J. Alzheimer’s Dis. 2021, 83, 1281–1289. [Google Scholar] [CrossRef]
- Jung, Y.; Viviano, R.P.; van Rooden, S.; van der Grond, J.; Rombouts, S.A.R.B.; Damoiseaux, J.S. White Matter Hyperintensities and Apolipoprotein E Affect the Association Between Mean Arterial Pressure and Objective and Subjective Cognitive Functioning in Older Adults. J. Alzheimers Dis. 2021, 84, 1337–1350. [Google Scholar] [CrossRef]
- Ritchie, C.; Smailagic, N.; Noel-Storr, A.H.; Ukoumunne, O.; Ladds, E.C.; Martin, S. CSF tau and the CSF tau/ABeta ratio for the diagnosis of Alzheimer’s disease dementia and other dementias in people with mild cognitive impairment (MCI). Cochrane Database Syst. Rev. 2017, 3, CD010803. [Google Scholar] [CrossRef]
- Koychev, I.; Gunn, R.N.; Firouzian, A.; Lawson, J.; Zamboni, G.; Ridha, B.; Sahakian, B.J.; Rowe, J.B.; Thomas, A.; Rochester, L.; et al. PET Tau and Amyloid-β Burden in Mild Alzheimer’s Disease: Divergent Relationship with Age, Cognition, and Cerebrospinal Fluid Biomarkers. J. Alzheimer’s Dis. 2017, 60, 283–293. [Google Scholar] [CrossRef]
- Larner, A.J. Manual of Screeners for Dementia. In Pragmatic Test Accuracy Studies; Springer Nature: Basel, Switzerland, 2020; pp. 2–3. [Google Scholar]


| Variables | Groups | p-Value | |
|---|---|---|---|
| Group I (n = 49) | Group K (n = 49) | ||
| Sex (female/male) | 43/6 | 44/5 | |
| Age (years) | 77.24 ± 5.43 | 75.51 ± 6.11 | 0.07 |
| Education (years) | 10.20 ± 2.30 | 11.04 ± 2.44 | 0.08 |
| MMSE | 28.28 ± 1.48 | 29.06 ± 1.19 | |
| MoCA | 22.42 ± 2.02 | 27.95 ± 1.25 | |
| CDT | 8.86 ± 1.85 | 9.79 ± 0.57 | |
| Semantic fluency | 13.42 ± 4.49 | 18.4 ± 5.85 | |
| Phonetic fluency | 10.53 ± 4.07 | 13.29 ± 0.59 | |
| Test | Groups | p-Value | Cohen’s d Value (CI) | ||
|---|---|---|---|---|---|
| Group I (n = 49) | Group K (n = 49) | ||||
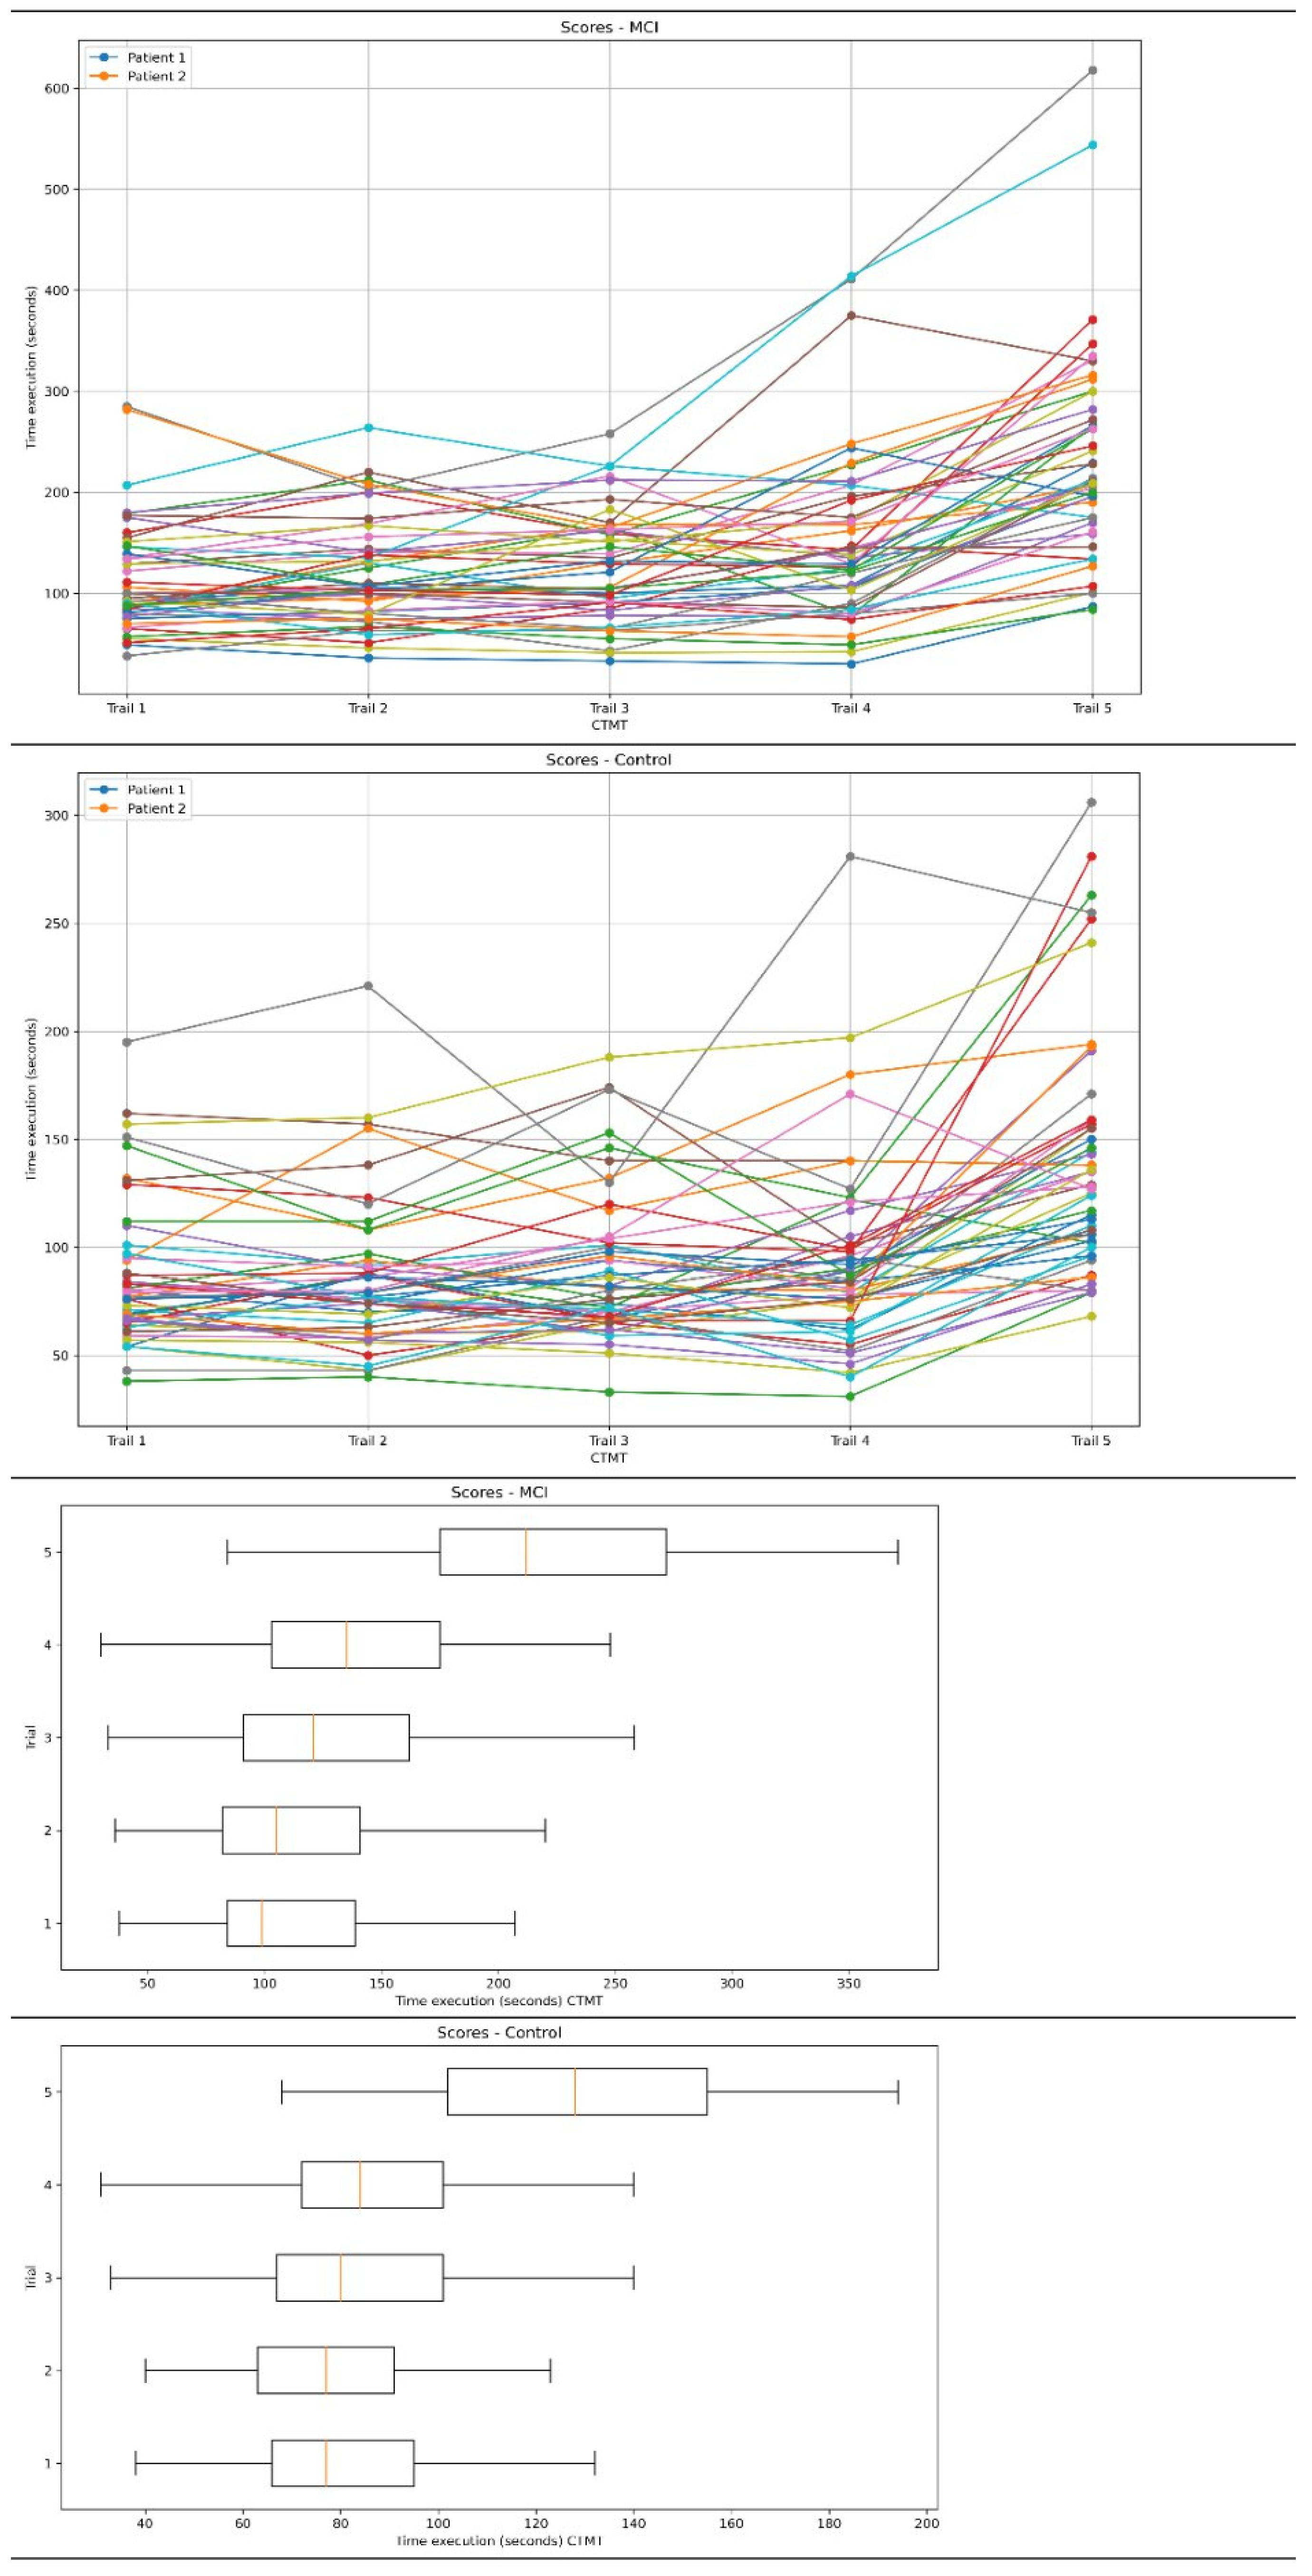
| CTMT (seconds) | All trails | 744.44 ± 309.47 | 491.57 ± 169.79 | p < 0.01 | 1.01 (0.59–1.43) |
| Trail 1 | 114.16 ± 52.60 | 85.83 ± 31.98 | p < 0.01 | 0.65 (0.24–1.05) | |
| Trail 2 | 119.59 ± 51.06 | 85.14 ± 34.46 | p < 0.01 | 0.79 (0.37–1.20) | |
| Trail 3 | 125.89 ± 52.60 | 89.16 ± 33.26 | p < 0.01 | 0.83 (0.42–1.27) | |
| Trail 4 | 150.93 ± 83.11 | 93.16 ± 43.82 | p < 0.01 | 0.86 (0.45–1.28) | |
| Trail 5 | 233.85 ± 102.35 | 138.26 ± 54.09 | p < 0.01 | 1.16 (0.73–1.59) | |
| Indicator 1 | 1.08 ± 0.23 | 0.90 ± 0.21 | p < 0.01 | --- | |
| Indicator 2 | 2.13 ± 0.57 | 1.68 ± 0.62 | p < 0.01 | ---- | |
| Diagnostic Performance | ||||||
|---|---|---|---|---|---|---|
| Cutoff | Sen | Sp | PPV | NPV | AUC | |
| CTMT (overall score) | 578 | 0.73 (CI: 0.59–0.85) | 0.81 (CI: 0.68–0.90) | 0.79 | 0.75 | 0.77 (CI: 0.65–0.89) |
| CTMT Trail 1 | 84 | 0.75 (CI: 0.61–0.85) | 0.63 (CI: 0.49–0.73) | 0.66 | 0.71 | 0.69 (CI: 0.56–0.82) |
| CTMT Trail 2 | 99 | 0.67 (CI: 0.53–0.78) | 0.81 (CI: 0.68–0.9) | 0.77 | 0.71 | 0.74 (CI: 0.62–0.86) |
| CTMT Trail 3 | 104 | 0.63 (CI: 0.49–0.73) | 0.77 (CI: 0.64–0.86) | 0.73 | 0.67 | 0.70 (CI: 0.57–0.83) |
| CTMT Trail 4 | 106 | 0.73 (CI: 0.59–0.83) | 0.79 (CI: 0.66–0.88) | 0.77 | 0.74 | 0.76 (CI: 0.64–0.86) |
| CTMT Trail 5 | 161 | 0.79 (CI: 0.66–0.88) | 0.81 (CI: 0.68–0.90) | 0.80 | 0.79 | 0.80 (CI: 0.69–0.91) |
| Test | MoCA | MMSE | CDT | |||
|---|---|---|---|---|---|---|
| R | p | R | p | R | p | |
| CTMT (all) | −0.28 | 0.04 | 0.04 | 0.74 | −0.23 | 0.11 |
| CTMT Trail 1 | −0.22 | 0.12 | 0.14 | 0.33 | −0.22 | 0.12 |
| CTMT Trail 2 | −0.28 | 0.04 | 0.05 | 0.7 | −0.29 | 0.04 |
| CTMT Trail 3 | −0.16 | 0.26 | 0.15 | 0.3 | −0.35 | 0.01 |
| CTMT Trail 4 | −0.20 | 0.15 | 0.07 | 0.61 | −0.13 | 0.34 |
| CTMT Trail 5 | −0.36 | 0.009 | 0.05 | 0.70 | −0.27 | 0.05 |
| Test | Semantic Fluency | Phonetic Fluency | ||
|---|---|---|---|---|
| R | p | R | p | |
| CTMT (all) | −0.52 | <0.01 | −0.17 | 0.23 |
| CTMT Trail 1 | −0.47 | <0.01 | −0.22 | 0.12 |
| CTMT Trail 2 | −0.47 | <0.01 | −0.12 | −0.12 |
| CTMT Trail 3 | −0.51 | <0.01 | −0.04 | 0.74 |
| CTMT Trail 4 | −0.36 | 0.01 | −0.24 | 0.09 |
| CTMT Trail 5 | −0.54 | <0.01 | −0.22 | 0.11 |
Disclaimer/Publisher’s Note: The statements, opinions and data contained in all publications are solely those of the individual author(s) and contributor(s) and not of MDPI and/or the editor(s). MDPI and/or the editor(s) disclaim responsibility for any injury to people or property resulting from any ideas, methods, instructions or products referred to in the content. |
© 2023 by the authors. Licensee MDPI, Basel, Switzerland. This article is an open access article distributed under the terms and conditions of the Creative Commons Attribution (CC BY) license (https://creativecommons.org/licenses/by/4.0/).
Share and Cite
Bednorz, A.; Religa, D. Utility of the Comprehensive Trail Making Test in the Assessment of Mild Cognitive Impairment in Older Patients. Geriatrics 2023, 8, 108. https://doi.org/10.3390/geriatrics8060108
Bednorz A, Religa D. Utility of the Comprehensive Trail Making Test in the Assessment of Mild Cognitive Impairment in Older Patients. Geriatrics. 2023; 8(6):108. https://doi.org/10.3390/geriatrics8060108
Chicago/Turabian StyleBednorz, Adam, and Dorota Religa. 2023. "Utility of the Comprehensive Trail Making Test in the Assessment of Mild Cognitive Impairment in Older Patients" Geriatrics 8, no. 6: 108. https://doi.org/10.3390/geriatrics8060108