1. Summary
Currently, there are no publicly available annotated datasets for substation equipment. For any method of supervised learning, a dataset of images with objects labeled in categories is the first step before any machine learning model can be trained [
1]. The motivation of this work is to provide a foundation for further research and advancements in the fields related to substation analysis and automation, filling an existing gap in the literature.
With the increasing number of substations and the growing complexity of their equipment, manual inspection and maintenance have become more challenging, time-consuming and costly [
2]. In recent years, advances in computer vision techniques and deep learning algorithms have paved the way for automating the inspection process, since they offer the robustness necessary to work with such complex environments [
3]. Object detection and segmentation are key components of this automation, as they enable the identification and localization of objects of interest within an image or video. Such systems can play a vital role in ensuring the smooth functioning of electrical grids and preventing potential equipment failures that can result in power outages and safety hazards [
4]. As the existing literature lacks comprehensive and well-annotated datasets specifically tailored to the unique challenges and characteristics of electrical substations, works such as [
5] (that focused on semantic segmentation of electrical switches), [
6] (that focused on semantic segmentation of current transformers on thermograms) and [
7] (that focused on semantic segmentation of insulators) had to make their own datasets to train their segmentation models.
During the process of making our own dataset as a part of research related to automating substation inspections, we realized the challenging and time-consuming nature of the task of collecting, annotating and curating a dataset. Semantic annotation is much harder than a box-based object annotation; every region of interest (RoI) needs to be outlined by a polygon that follows their shape as closely as possible, a task that takes approximately 15 times longer than standard box annotation [
8]. While fully supervised methods achieve state-of-the-art performance, the process of manually annotating each training image is time-consuming and expensive [
9,
10]. This motivated us to share the dataset we created, providing researchers and practitioners with a valuable resource for developing and testing innovative algorithms and solutions. By addressing the shortage of annotated datasets in this domain, our work aims to contribute to the advancement of substation automation, monitoring and computer vision research, ultimately improving the efficiency, reliability and safety of electrical power systems, as substations are responsible for safe and reliable operation of the electrical network [
11,
12].
Furthermore, beyond its original purpose, this dataset serves as a fundamental building block for diverse applications and future research endeavors. It provides a solid foundation for improving detection algorithms, achieving instance segmentation if paired with an object detector, enabling real-time anomaly detection, advancing autonomous inspection systems, facilitating object recognition under diverse conditions and exploring potential applications in various domains. By fulfilling the fundamental requirement of dataset acquisition, our work paves the way for a multitude of tasks and advancements in the field.
The paper is organized as follows:
Section 2 details the images, classes and file structure of our dataset;
Section 3.1 explains how the images were captured and
Section 3.2 explains how the images were annotated; finally,
Section 4 shows an example of a case where our dataset is used to validate a weakly supervised semantic segmentation model trained on substation reclosers.
2. Data Description
This dataset comprises a total of 1660 electric substation images, which have been annotated with a total of 50,705 objects. There are images collected by humans using a variety of cameras, images collected by AGV-mounted cameras and images collected by a camera in a fixed location.
Table 1 provides an overview of the distribution of the images based on source. The unspecified smartphone and digital cameras collected by humans on field are referred to as miscellaneous. The images in the dataset come in a variety of resolutions, as shown in
Table 2.
There are 15 classes of substation equipment.
Table 3 lists them, along with how many times each object appears in the “Instances” column. An example of each object class is presented in
Figure 1.
The semantic annotations of the images are available in two formats: VOC-style polygonal JSON files and segmentation masks in .png images. The polygonal VOC-style JSON format used in this dataset consists of a .json file with a dictionary that includes the following fields:
“version”: the LabelMe version that was used to annotate the associated image;
“imagePath”: the path to the associated image file in the ”images“ directory;
“imageHeight”: the height of the image associated with the .json file in pixels;
“imageWidth”: the width of the image associated with the .json file in pixels;
“flags”: either “Day”: “True“ or “Night”: “True“, to indicate daytime or nighttime images;
“imageData”: since the images are not embedded into the jsons, this entry is unused in this dataset;
“shapes”: a list with each polygon annotated in the image. Each one has these attributes:
- ⚬
“label”: one of the 15 class labels from
Table 3 plus the Background class;
- ⚬
“points”: a vector with coordinates in pixels for each point of the polygon, in the format , where are the vertical and horizontal coordinates, respectively;
- ⚬
“group_id”: unused in this dataset;
- ⚬
“shape_type”: all entries in our dataset list this as “polygon“;
- ⚬
“flags”: unused in our dataset.
The .png masks were generated from the annotations present in the .json files.
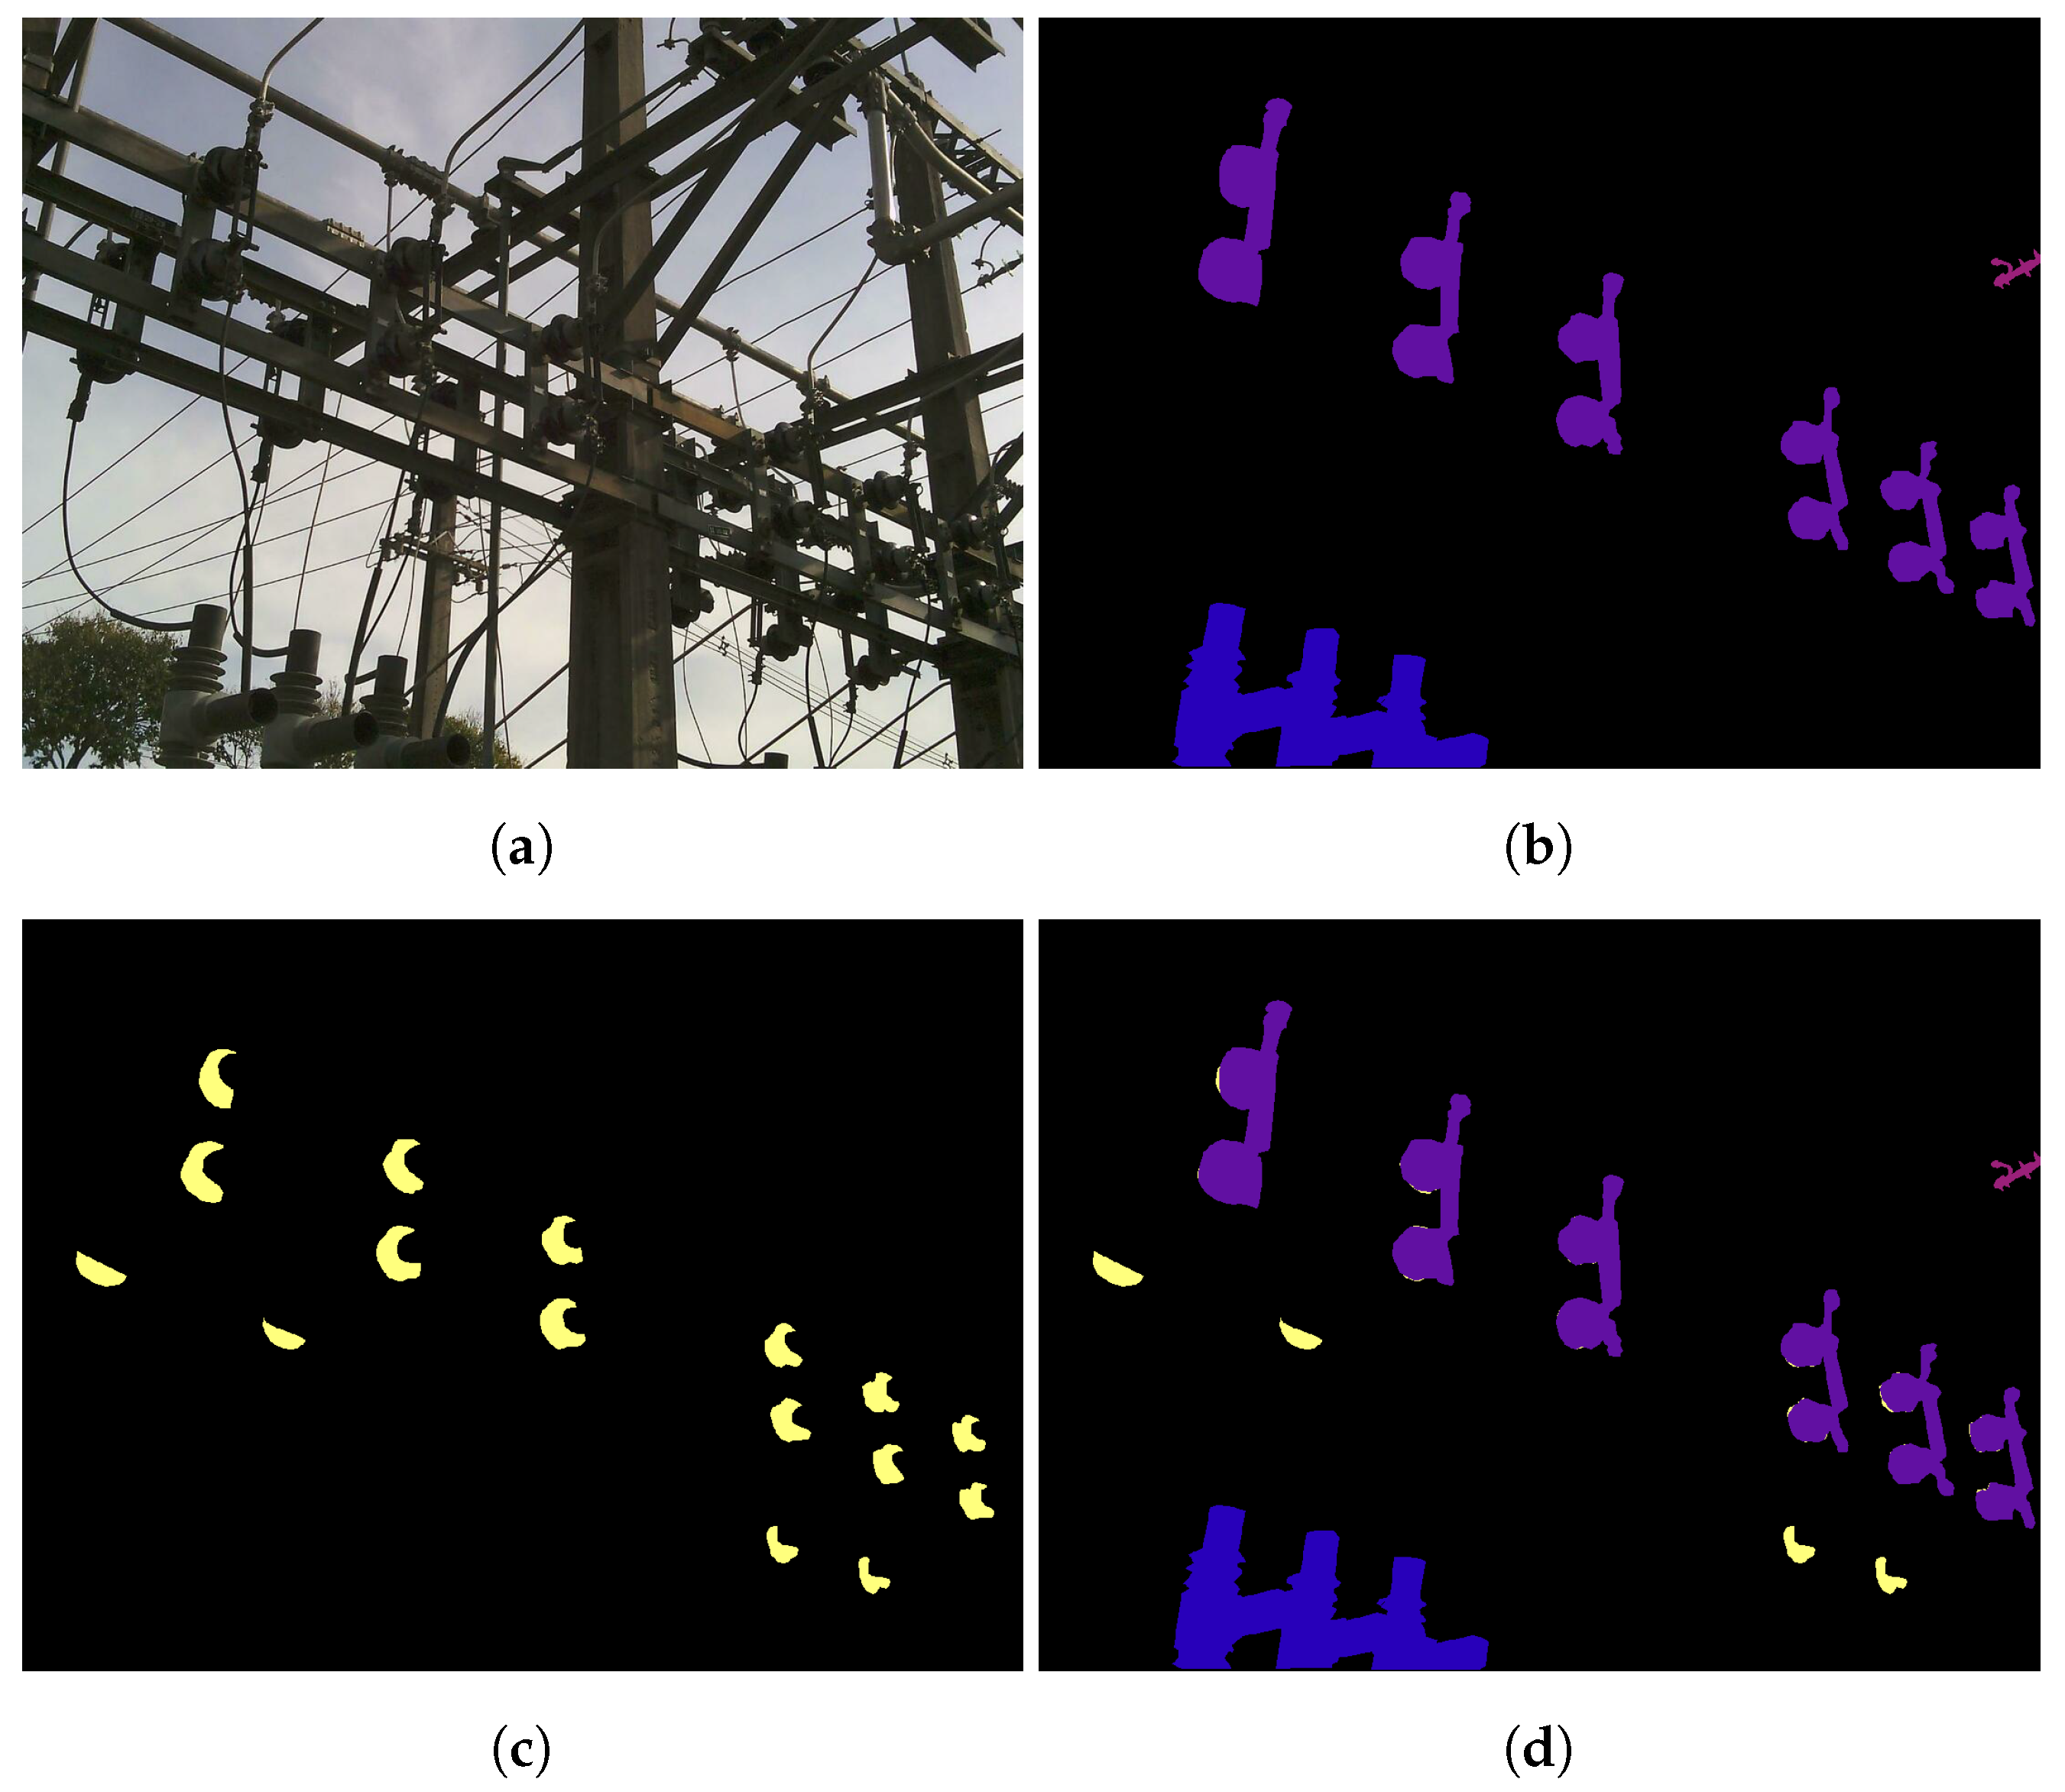
Table 3 lists the RGB color values used in the .png masks for each class in the “RGB” and “Color” columns. Since annotations of the class “Porcelain pin insulator” often overlap with disconnect switches, this class had its own .png masks generated apart from the other 14 classes, as shown in
Figure 2.
The Python script used to generate masks from the .json files is also included with this dataset, allowing the desired classes to be filtered. This dataset presents three different segmentation masks: 15-class masks where only porcelain pin insulators that were not part of another object appear, 14-class masks that have all classes except porcelain pin insulators and single-class masks that only contain porcelain pin insulators.
The script utilizes the provided .json files containing polygonal annotations to extract the coordinates of each object. Those coordinates are then used as input to the OpenCV
fillPoly function, which fills the specified polygonal regions with the corresponding class label color. It operates on a per-image basis, iterating through the .json files and generating the masks for each image in the dataset. The pseudocode that describes this script is described in Algorithm 1, with its associated variables shown in
Table 4.
| Algorithm 1: Generate .png Masks from .json Annotations |
![Data 08 00118 i001]() |
Dataset Organization
The structure of the directories and files present in this dataset is as follows:
images: this directory contains the 1660 substation images;
labels_json: this directory contains the .json files annotated in the VOC-style polygonal JSON format, where each file shares the same filename as its respective image in the images directory;
15_masks: this directory contains the .png segmentation masks for all classes. Each file shares the same name as its counterpart in the images directory;
14_masks: this directory contains the .png segmentation masks for all classes except porcelain pin insulator. Each file shares the same name as its counterpart in the images directory;
porcelain_masks: this directory contains the .png segmentation masks for the porcelain pin insulator class. Each file shares the same name as its counterpart in the images directory;
classes.txt: a text file with the 15 classes plus background used with LabelMe;
json2png.py: a Python script that can generate segmentation masks using the VOC-style polygonal JSON annotations.
3. Methods
The collection of this dataset was conducted as part of a research project aimed at developing an automated monitoring system for infrared thermography. The dataset was specifically curated based on its relevance to infrared thermography using stereo cameras for thermal imaging. Due to limitations in the number of available thermal cameras, the dataset consists exclusively of optical images, which can be captured using a wide range of cameras. This deliberate choice ensures that the dataset encompasses a diverse set of relevant images, despite the constraints on accessing thermal imaging equipment. It is worth noting that our team conducted additional research, beyond the scope of this paper, where the RoI information extracted from object detectors using models trained with the optical images of our dataset was applied to segment corresponding objects in their equivalent infrared images. Thus, the creation of this optical image dataset was instrumental in enabling further investigations within our research project.
To ensure high-quality and relevant substation equipment pictures, a rigorous screening process was conducted. Expert technicians and electrical engineers with field experience reviewed and filtered the images based on their suitability for equipment analysis. Their expertise allowed them to assess the visual clarity, relevance and representativeness of each image. By applying strict criteria during the screening, the dataset contained images that accurately represent the diverse range of substation equipment encountered in real-world scenarios.
In addition to the initial screening, a second round of evaluation was conducted during the annotation process to further enhance the quality and reliability of the dataset. Dataset annotators carefully examined each image to identify objects of interest and provide accurate annotations. To maintain the integrity of the dataset, objects that were not clearly visible or had significant occlusion were excluded from annotation. Only objects with a visible area occlusion of less than 60% were considered for annotation, ensuring that the included objects were readily discernible. Moreover, annotators focused on annotating objects with clear class identification, avoiding ambiguity and enabling efficient utilization of the dataset for subsequent analysis and modeling tasks. The combination of expert-driven screening and rigorous annotation evaluation guaranteed the overall quality and reliability of the dataset, providing researchers and practitioners with a valuable resource for substation equipment analysis and related tasks.
3.1. Data Acquisition
The images in this dataset were captured from a single electrical distribution substation in Brazil over a period of two years, at different times of day and under varying weather and seasonal conditions, ensuring a diverse range of lighting conditions for the depicted objects. All the images underwent a curation process by experts in Electrical Engineering to ensure that the angles and distances depicted in the images were suitable for automating inspections in a substation.
According to the provided information from the electrical company overseeing the substation, the energy consumption profile exhibits a consistent pattern throughout the year. The profile shows a global minimum at 6h00, a local maximum at 13h00, a local minimum at 17h00 and a global maximum at 20h00, with slight amplitude variations. Based on this insight, a collection schedule was devised for automated inspections, encompassing time slots at 8h00, 13h00, 17h00 and 20h00. Human-led collections were conducted exclusively during the morning period to align with the availability of on-field company technicians assisting our researchers.
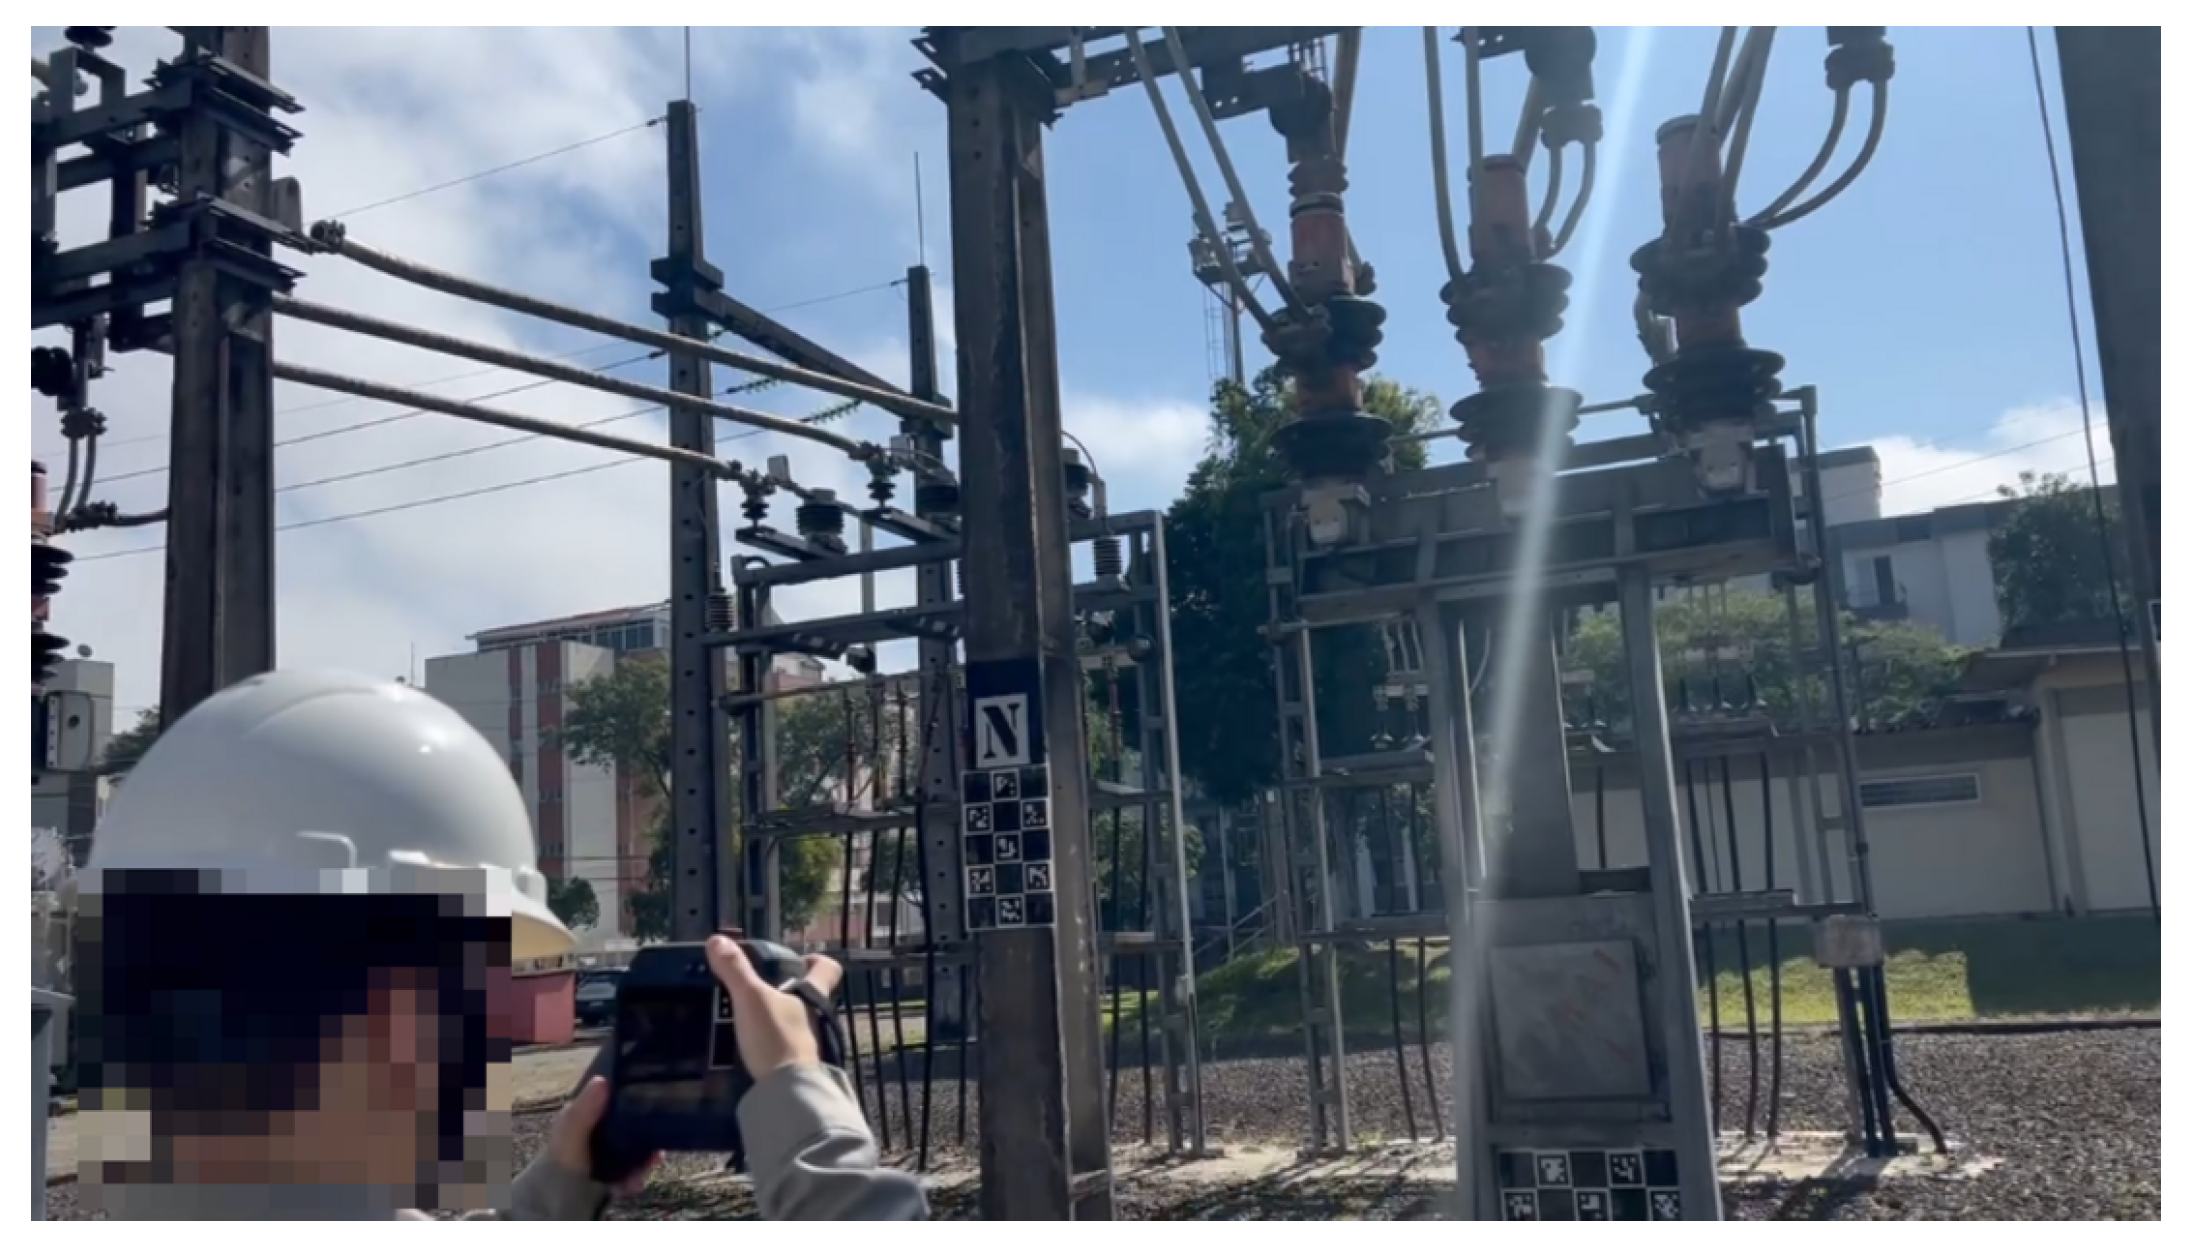
The human-collected images were captured by various individuals using different camera models, including smartphone cameras, unspecified digital cameras and the FLIR T540, as shown in
Figure 3. There was no standardization in terms of camera angles or distances, although the maximum distance for image capture was limited to 30 m. Those images were taken during the morning period, with the time of capture ranging from 8h00 to 12h00.
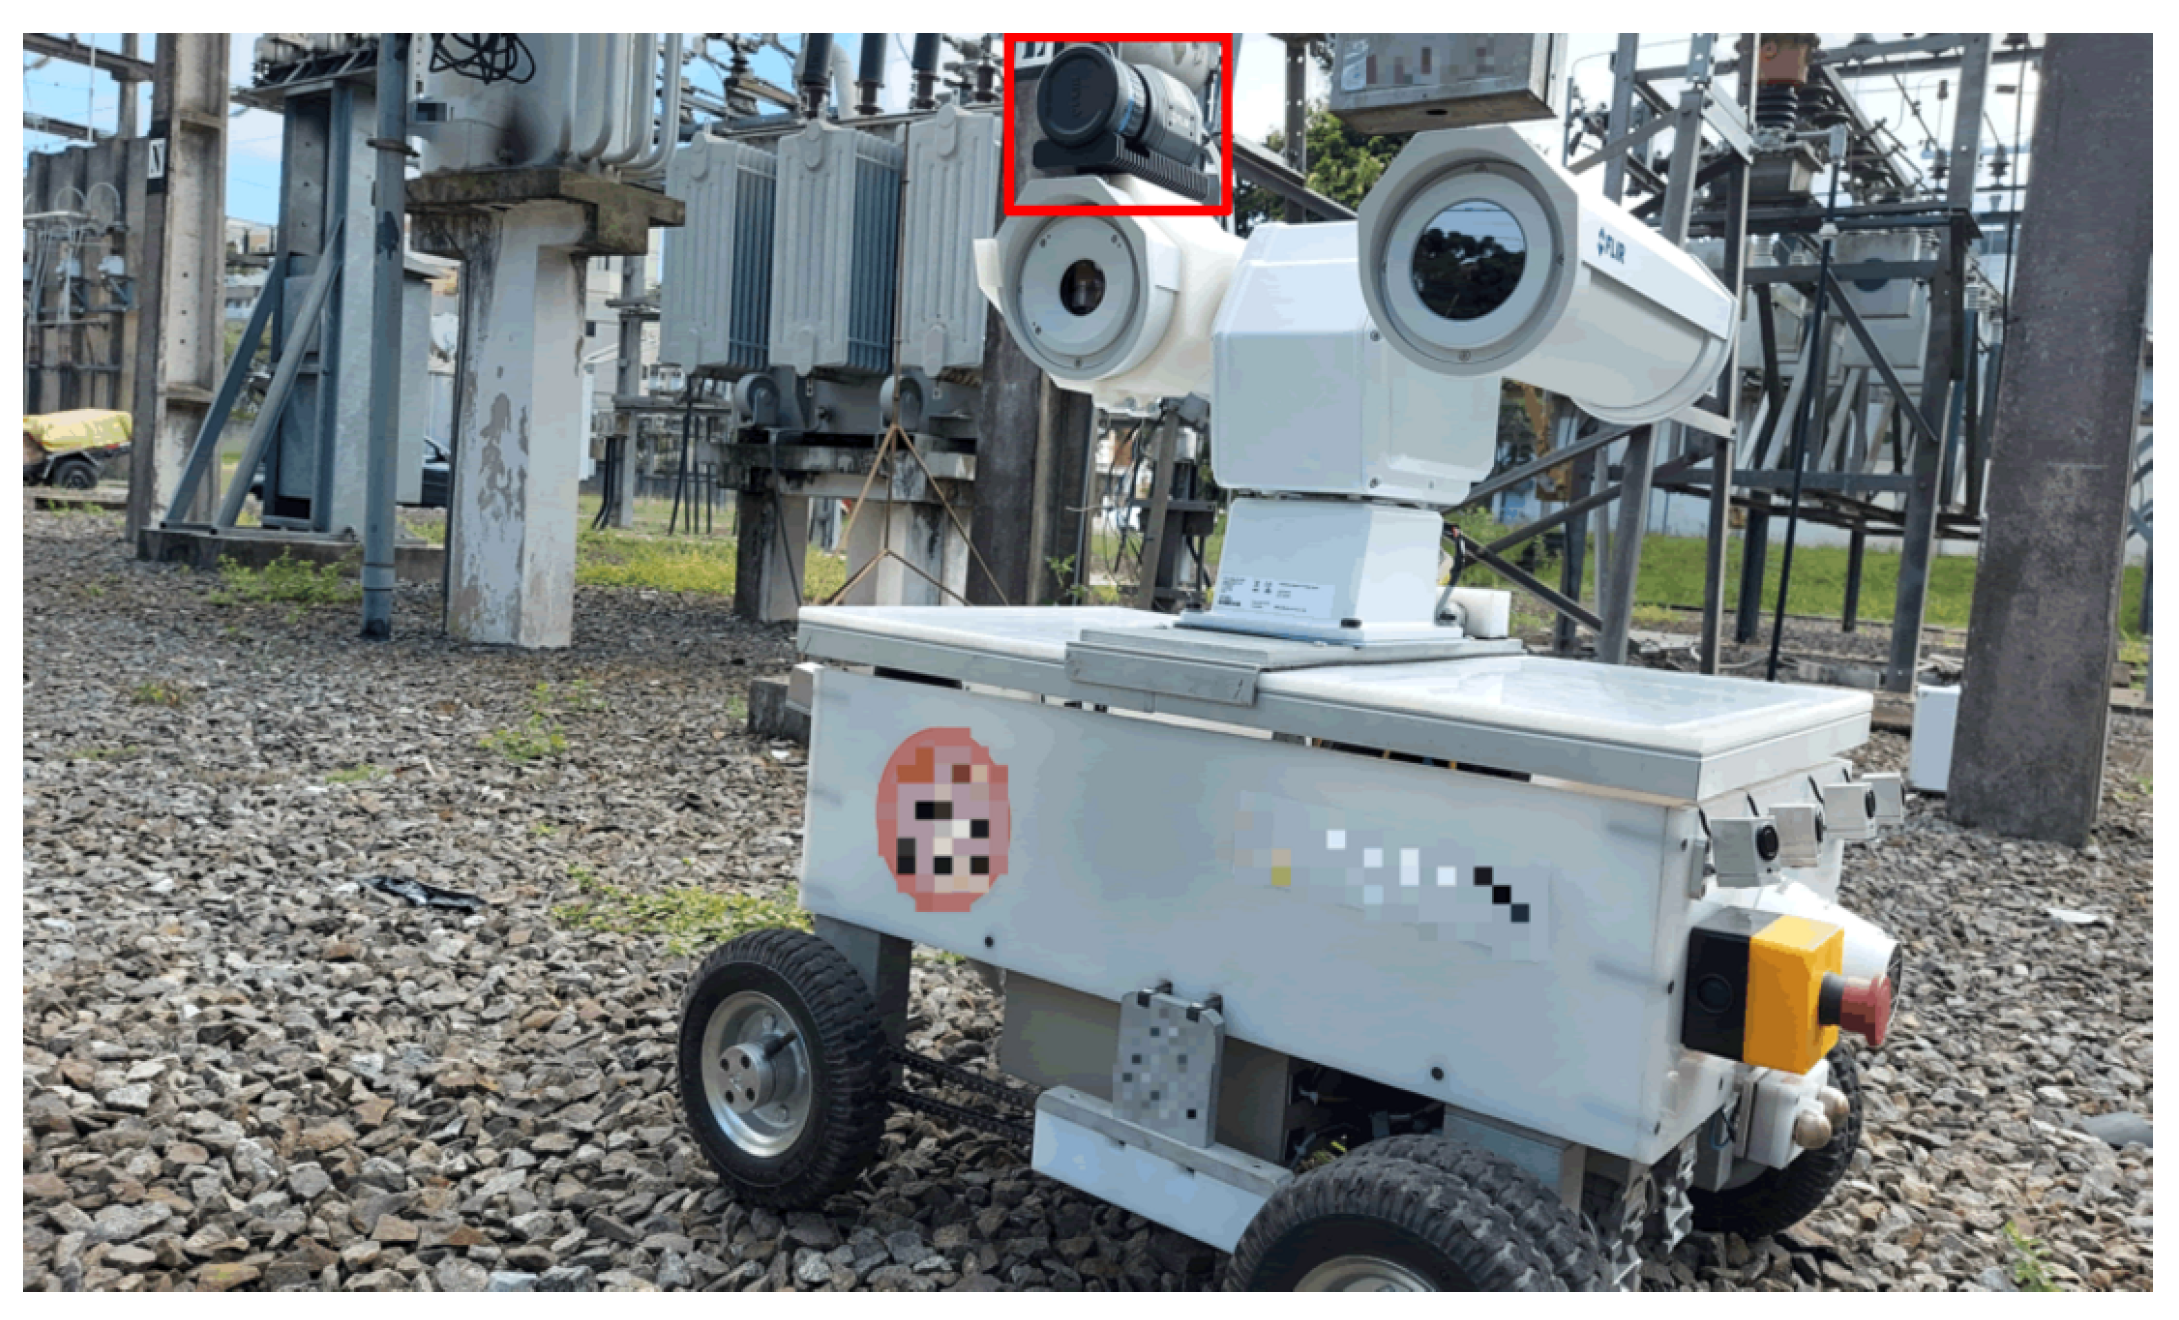
The Autonomous Ground Vehicle (AGV) shown in
Figure 4 used the FLIR A700 camera to collect the majority of the images in this dataset. This AGV followed a predetermined path through 60 possible scenes, capturing images at fixed angles and distances ranging from 3 to 5 m. Those collections were conducted three times per day, with the specific times being in the morning (between 8h00 and 10h00), in the afternoon (between 13h00 and 17h00) and at night (between 20h00 and 21h00).
The FLIR A700 camera fixed in the substation, shown in
Figure 5, collected photos also three times per day: in the morning (between 6h00 and 11h00), in the afternoon (between 13h00 and 18h00) and at night (between 21h00 and 00h00).
3.2. Dataset Annotation
We annotated the semantic dataset using the software LabelMe [
13], as shown in
Figure 6. The annotation process took approximately 1100 man-hours over the course of 4 months by 9 people.
Most objects of interest had been previously labeled using box annotations if at least 40% of them were visible, which was used as the starting point for the semantic annotation. However, since the goal of semantic annotation is assigning a class to every pixel in an image, all identifiable objects were annotated following the same rules as long as there was no ambiguity in their class, even if they lacked box guidelines.
4. User Notes
The dataset presented in this data descriptor adheres to the FAIR principles, which encompass Findability, Accessibility, Interoperability and Reusability [
14]:
Findability: The dataset is easily discoverable, as it is assigned unique and persistent identifiers in the form of DOIs (Digital Object Identifiers);
Accessibility: The dataset is readily accessible through Zenodo, an open-access repository that provides users with the ability to access and download the data without restrictions;
Interoperability: The dataset is designed to promote interoperability with various tools and platforms. The images are provided in common formats such as .jpg, .tif and .png, while the annotations are provided in .json and .png;
Reusability: The dataset is designed for reuse and ease of use. It includes documentation that facilitates understanding and utilization of the data, with all code used for its generation and the enclosed use case example publicly available. Additionally, it is licensed under a Creative Commons Attribution 4.0 International License, enabling users to freely utilize, distribute and build upon the dataset, as long as appropriate credit is given. Moreover, an accompanying Python script is provided to allow users to freely choose which classes they want from the .json files to generate .png masks to fit their needs.
This dataset was originally assembled to be used as the test set to validate weakly supervised models that we are currently studying. What we present here is a use case example of how it can be used in the context of substation automation, where the ground truths are used to validate the performance of a DeepLabV3+ [
15] model trained for semantic segmentation on substation reclosers, 1 of the 15 classes in this dataset.
4.1. Weakly Supervised Semantic Segmentation
We adapted the weak supervision technique proposed in the paper “Simple Does It: Weakly supervised instance and semantic segmentation” [
16].
Box annotations previously made to train an object detector serve as the starting point for a recursive process over multiple generations that tries to converge boxes into something closer to the real RoI of the objects. The recursive procedure for an SDI generation consists of the following steps:
- 1
Train DeepLabV3+ for 200 epochs using automatically generated mask annotations as the training set (automatically generated annotations for the first generation; output from the previous generation of training for the following generations) and manually annotated ground truths as the validation test;
- 2
Run the DeepLabV3+ detector on the images of the training set with the weights from the training from the previous step, generating new mask annotations;
- 3
Post-process the masks to fine-tune the output and also to prevent them from shrinking too much.
For the automatic mask generation, we tried three techniques inspired by those described in the SDI paper, namely, box, boxi and GrabCut:
Box: Shown in
Figure 7b. The ground truth boxes are simply drawn as they come for the first generation;
Box
i: Shown in
Figure 7c, only 20% of the object’s ground truth boxes are filled with that class’s color, with the remainder being filled with the ignore color, being neither background nor object;
GrabCut: Shown in
Figure 7d, the GrabCut algorithm [
17] is applied using masks of all objects of a given class as input. We used the Box
i masks instead of Box masks, considering the innermost 20% as definitely foreground and the remainder of the box as likely background.
For post-processing, the segmentation mask annotations are subjected to a denseCRF algorithm [
18] for refinement. To prevent the masks from shrinking excessively, they are compared to the area of the original box annotation. If the IoU of a given object mask has reduced beyond a certain threshold in relation to the box area for that same object, that object’s segmentation is returned to the previous generation’s state. The original SDI study employed a shrinkage threshold of 50%; however, this value was found to be suboptimal for the segmentation of objects that either fill a significant portion of their bounding boxes, or occupy a much smaller area than their bounding boxes.
Table 5 shows the thresholds we observed to give best results visually for each class in our dataset. However, the only relevant information for the recloser model is that 50% still works well for it.
4.2. Evaluation Metric
The Intersection over Union (IoU) is a commonly used evaluation metric for image segmentation tasks. It measures the similarity between the predicted segmentation mask and the ground truth mask by calculating the ratio of the intersection between these two masks to their union. The IoU for each class is computed separately and then averaged across all classes to generate the mIoU (mean Intersection over Union). This allows for a more fine-grained evaluation of the segmentation performance, as it considers the different sizes and shapes of objects within the image.
In our single-class semantic segmentation problem, we only needed to classify pixels belonging to the class of reclosers; however, the background is treated as a separate class in segmentation problems, even if there is only one target class. Since using mean IoU with the background class results in a high IoU score, it does not reflect the true performance of the model on our target class. By using only class IoU, we can focus solely on how well the model identifies reclosers in the image, providing us with a clear and interpretable evaluation metric.
4.3. Technical Results
As this dataset was mainly intended for testing and validation, we split it into three sets in a 20:40:40 ratio for augmenting training, validation and testing sets, respectively.
Table 6 shows the image and ground truth totals that had reclosers from the 15-class dataset.
To evaluate the performance of the automatic segmentation techniques employed (box, box
i and GrabCut), we trained six generations of SDI, followed by two models that mixed automatic generated masks with some ground truth images from
Table 6.
Table 7 shows the numbers of images and boxes present in the three training sets used. The segmentation masks from the fully generated dataset were made from box annotations.
4.4. Box Method Models
In
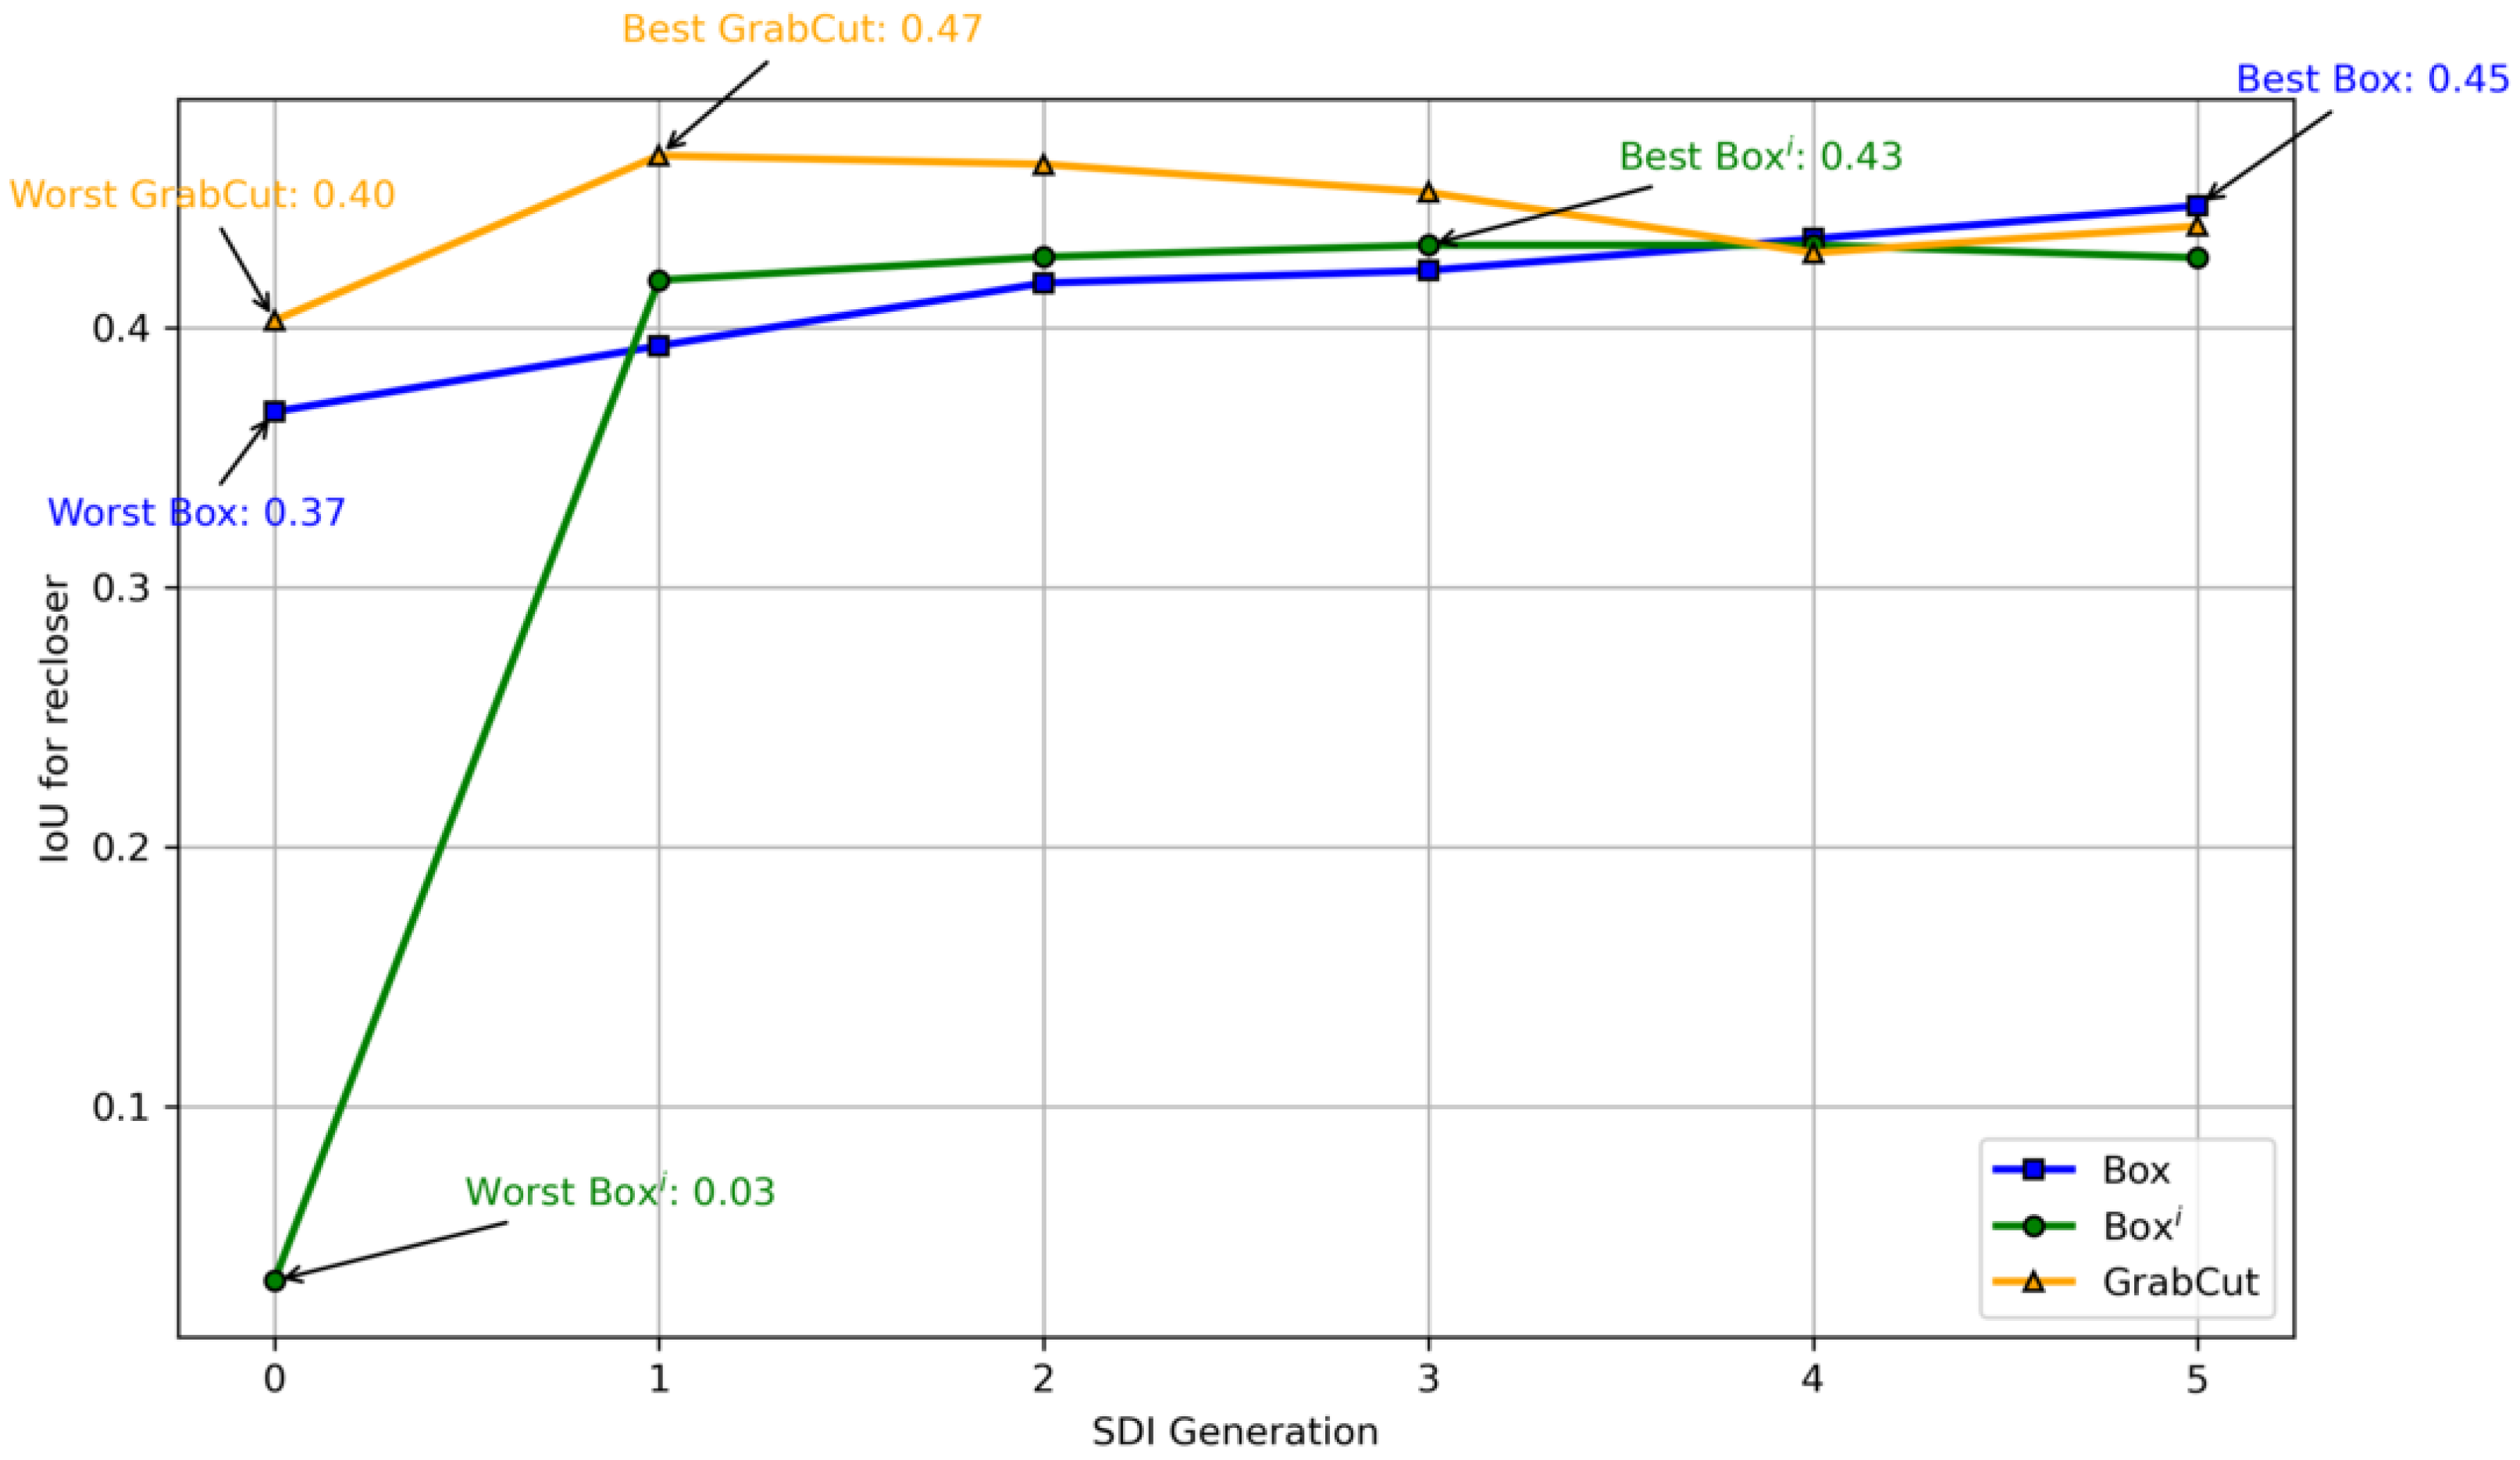
Figure 8, the performance of each SDI model is shown. The SDI generations are named generation 0 up to generation 5, where generation 0 used the masks generated by each technique, whereas generations 1 up to 5 used the results of predictions of the DeepLabV3+ models from the previous generation for training. The last training is what we expected to effectively use as the object detector, but the results show that a later SDI generation does not necessarily yield the best class IoU.
Box showed gradual improvements through every generation, even scoring the highest recloser IoU by generation 5, when compared to more elaborate methods.
Box
i had the worst Generation 0, indicating that this technique is ill-suited for the general format of reclosers, since the innermost center may sometimes not even be part of the object class, as shown in the example from
Figure 9. However, post-processing greatly improved the results starting from Generation 1, surpassing the Box method on all generations until the last, where it performed worse than Box.
GrabCut obtained the highest IoU score in generation 1, implying that it required only one detection round and post-processing to attain optimal performance. Despite a steady decline in the IoU score over the subsequent generations, GrabCut outperformed both Box and Boxi in all rounds until generation 4, where its performance level matched the other two methods.
Based on our experimental results, it appears that, by the fifth generation of SDI, all three techniques achieved similar results. This can be attributed to the post-processing step involving the use of denseCRF on the detection masks between each generation. However, this approach may not be ideal for the GrabCut method, which performed well in generating visually impressive automatic segmentation even without post-processing, at least for this class. It is also worth noting that our use of DeepLabV3+ may have contributed to the observed similarity in performance between the three methods, since the original SDI paper used DeepLabV1 [
16].
4.5. Final Model Performance
For the final model, we mixed some ground truth masks from the dataset with the segmentation masks generated by the fifth generation of SDI. Specifically, we used the weights file generated by the fifth generation of GrabCut SDI, which had scored the highest using the validation dataset (recloser IoU of 0.43), to generate segmentation masks using the output from the DeepLabV3+ detector and mixed them with the 331 ground truth images to train two models: one augmented with 2363 images (called mixed dataset) and the other with 3038 images (called bigger mixed dataset). The results are presented in
Table 8.
Mixing the box annotations of what was originally the training set for an object detector with the ground truth masks resulted in an IoU score of 0.617. By incorporating additional images generated from the box annotations for the validation set of that object detector to the mixed dataset, we were able to achieve a score of 0.629. This suggests that the inclusion of more synthetic images enhances performance, although ground truth images remain the optimal means of attaining convergence in results.
Figure 10 shows examples of predictions made with this model.
5. Conclusions
In this work, we presented a new ground truth segmentation dataset for substations, consisting of 15 object classes commonly found in them. The dataset was carefully annotated and curated by domain experts to ensure its accuracy and relevance for automating inspections and maintenance tasks. We believe that this dataset will be a valuable resource for researchers and practitioners in the field, enabling the development and evaluation of new computer vision algorithms for substation monitoring and management. Furthermore, beyond its original purpose, this dataset serves as a fundamental building block for diverse applications and future research endeavors, such as instance segmentation, real-time anomaly detection, facilitating object recognition under diverse conditions and exploring potential applications in other domains.
To demonstrate the utility of the dataset, we also presented a technical validation study in which we validated a weakly supervised model made to detect a specific type of substation equipment, the recloser. This study showed that this dataset serves the intended purpose of testing and validation of segmentation models related to substations. By using a small amount of labeled data from our dataset to augment automatic segmentation, we show that this dataset can also be used to train models.
In order to facilitate further exploration and replication of our research, we have made the code for training the DeepLabV3+ model [
19] on our custom dataset, as well as the scripts utilized in implementing the SDI method [
20], openly accessible on GitHub. Those resources serve as
Supplementary Material for individuals interested in exploring our work further or seeking to apply similar approaches in other domains.
In conclusion, we believe that our ground truth segmentation dataset for substations represents a valuable contribution to the field of computer vision for power systems. By providing a standardized and high-quality dataset that can serve as a benchmark for future comparative studies, allowing researchers to assess the performance of their algorithms, we hope to foster further research and development in this area, ultimately leading to more efficient and reliable management of the electrical power grid.
Author Contributions
Conceptualization, A.A.P.G., F.I.S.G., N.B. and L.G.F.; methodology, A.A.P.G., F.I.S.G., N.B. and L.G.F.; software, A.A.P.G., L.G.F., F.I.S.G. and N.B.; validation, A.A.P.G., F.I.S.G., N.B., L.G.F. and F.G.S.M.; formal analysis, A.A.P.G., F.I.S.G., N.B., F.G.S.M. and L.G.F.; investigation, A.A.P.G., F.I.S.G., N.B., F.G.S.M. and L.G.F.; resources, A.A.P.G., E.F.R.R. and F.G.S.M.; data curation, A.A.P.G., F.I.S.G., N.B., F.G.S.M. and E.F.R.R.; writing—original draft preparation, A.A.P.G., F.I.S.G., N.B. and E.F.R.R.; writing—review and editing, A.A.P.G., F.I.S.G., N.B. and E.F.R.R.; visualization, A.A.P.G. and E.F.R.R.; supervision, E.F.R.R. and A.P.; project administration, E.F.R.R., F.G.S.M. and A.P.; funding acquisition, E.F.R.R., F.G.S.M. and A.P. All authors have read and agreed to the published version of the manuscript.
Funding
This research was funded with R&D resources provided by COPEL-DIS and regulated by ANEEL, grant number PD-2866-0528/2020. The article processing charge was funded by UTFPR DAELT and UTFPR PPGSE.
Institutional Review Board Statement
Not applicable.
Informed Consent Statement
Not applicable.
Data Availability Statement
Acknowledgments
The authors would like to thank UTFPR for the support, funding and infrastructure made available for the development of this research and COPEL-DIS for the support through project PD-2866-0528/2020—Development of a Methodology for Automatic Analysis of Thermal Images. We also would like to express our deepest appreciation to the team of annotators who worked diligently to produce the semantic labels for our dataset. Their hard work, dedication and attention to detail were critical to the success of this project.
Conflicts of Interest
The authors declare no conflict of interest.
References
- LeCun, Y.; Bengio, Y.; Hinton, G. Deep learning. Nature 2015, 521, 436–444. [Google Scholar] [CrossRef] [PubMed]
- Wang, H.; Zhou, B.; Zhang, X. Research on the Remote Maintenance System Architecture for the Rapid Development of Smart Substation in China. IEEE Trans. Power Deliv. 2018, 33, 1845–1852. [Google Scholar] [CrossRef]
- Zheng, H.; Cui, Y.; Yang, W.; Li, J.; Ji, L.; Ping, Y.; Hu, S.; Chen, X. An Infrared Image Detection Method of Substation Equipment Combining Iresgroup Structure and CenterNet. IEEE Trans. Power Deliv. 2022, 37, 4757–4765. [Google Scholar] [CrossRef]
- Ullah, I.; Yang, F.; Khan, R.; Liu, L.; Yang, H.; Gao, B.; Sun, K. Predictive Maintenance of Power Substation Equipment by Infrared Thermography Using a Machine-Learning Approach. Energies 2017, 10, 1987. [Google Scholar] [CrossRef] [Green Version]
- Lu, X.; Quan, W.; Gao, S.; Zhang, G.; Feng, K.; Lin, G.; Chen, J.X. A Segmentation-Based Multitask Learning Approach for Isolating Switch State Recognition in High-Speed Railway Traction Substation. IEEE Trans. Intell. Transp. Syst. 2022, 23, 15922–15939. [Google Scholar] [CrossRef]
- Tiancheng, Z.; Ying, Y.; Jinhai, S.; Zhihao, X.; Jiashuai, L. Infrared Image Segmentation Method of Current Transformer Based on DeepLabv3+ Network. In Proceedings of the 2022 IEEE 5th International Electrical and Energy Conference (CIEEC), Nangjing, China, 27–29 May 2022; Volume 1, pp. 3111–3115. [Google Scholar] [CrossRef]
- Li, X.; Su, H.; Liu, G. Insulator Defect Recognition Based on Global Detection and Local Segmentation. IEEE Access 2020, 8, 59934–59946. [Google Scholar] [CrossRef]
- Hong, S.; Noh, H.; Han, B. Decoupled Deep Neural Network for Semi-supervised Semantic Segmentation. Adv. Neural Inf. Process. Syst. 2015, 28, 1495–1503. [Google Scholar] [CrossRef]
- Chan, L.; Hosseini, M.S.; Plataniotis, K.N. A Comprehensive Analysis of Weakly-Supervised Semantic Segmentation in Different Image Domains. Int. J. Comput. Vis. 2021, 129, 361–384. [Google Scholar] [CrossRef]
- Xu, J.; Schwing, A.G.; Urtasun, R. Learning to Segment Under Various Forms of Weak Supervision. In Proceedings of the 2015 IEEE Conference on Computer Vision and Pattern Recognition (CVPR), Boston, MA, USA, 7–12 June 2015; Volume 1, pp. 3781–3790. [Google Scholar] [CrossRef]
- Wang, T.; Liu, W.; Zhao, J.; Guo, X.; Terzija, V. A rough set-based bio-inspired fault diagnosis method for electrical substations. Int. J. Electr. Power Energy Syst. 2020, 119, 105961. [Google Scholar] [CrossRef]
- Chattopadhyay, A.; Ukil, A.; Jap, D.; Bhasin, S. Toward Threat of Implementation Attacks on Substation Security: Case Study on Fault Detection and Isolation. IEEE Trans. Ind. Inform. 2018, 14, 2442–2451. [Google Scholar] [CrossRef]
- Kentaro, W. Labelme: Image Polygonal Annotation with Python. Version 4.6.0. Zenodo 2022. [Google Scholar] [CrossRef]
- Wilkinson, M.D.; Dumontier, M.; Aalbersberg, I.J.; Appleton, G.; Axton, M.; Baak, A.; Blomberg, N.; Boiten, J.W.; da Silva Santos, L.B.; Bourne, P.E.; et al. The FAIR Guiding Principles for Scientific Data Management and Stewardship. Sci. Data 2016, 3, 160018. [Google Scholar] [CrossRef] [PubMed] [Green Version]
- Chen, L.C.; Papandreou, G.; Schroff, F.; Adam, H. Rethinking Atrous Convolution for Semantic Image Segmentation. arXiv 2017, arXiv:1706.05587. [Google Scholar] [CrossRef]
- Khoreva, A.; Benenson, R.; Hosang, J.; Hein, M.; Schiele, B. Simple does it: Weakly Supervised Instance and Semantic Segmentation. In Proceedings of the IEEE Conference on Computer Vision and Pattern Recognition, Honolulu, HI, USA, 21–26 July 2017; Volume 1, pp. 1665–1674. [Google Scholar] [CrossRef] [Green Version]
- Rother, C.; Kolmogorov, V.; Blake, A. GrabCut: Interactive Foreground Extraction using Iterated Graph Cuts. ACM Trans. Graph. (SIGGRAPH) 2004, 23, 309–314. [Google Scholar] [CrossRef]
- Krähenbühl, P.; Koltun, V. Efficient Inference in Fully Connected CRFs with Gaussian Edge Potentials. Adv. Neural Inf. Process. Syst. 2012, 24, 109–117. [Google Scholar]
- Gomes, A.A.P. Deeplabv3 Custom Dataset, Version 1.0; GitHub: San Francisco, CA, USA, 2023. Available online: https://github.com/andreas-apg/deeplabv3-custom-dataset(accessed on 29 June 2023).
- Gomes, A.A.P. Simple Does It Utils, Version 1.0; GitHub: San Francisco, CA, USA, 2023. Available online: https://github.com/andreas-apg/simple-does-it-utils(accessed on 29 June 2023).
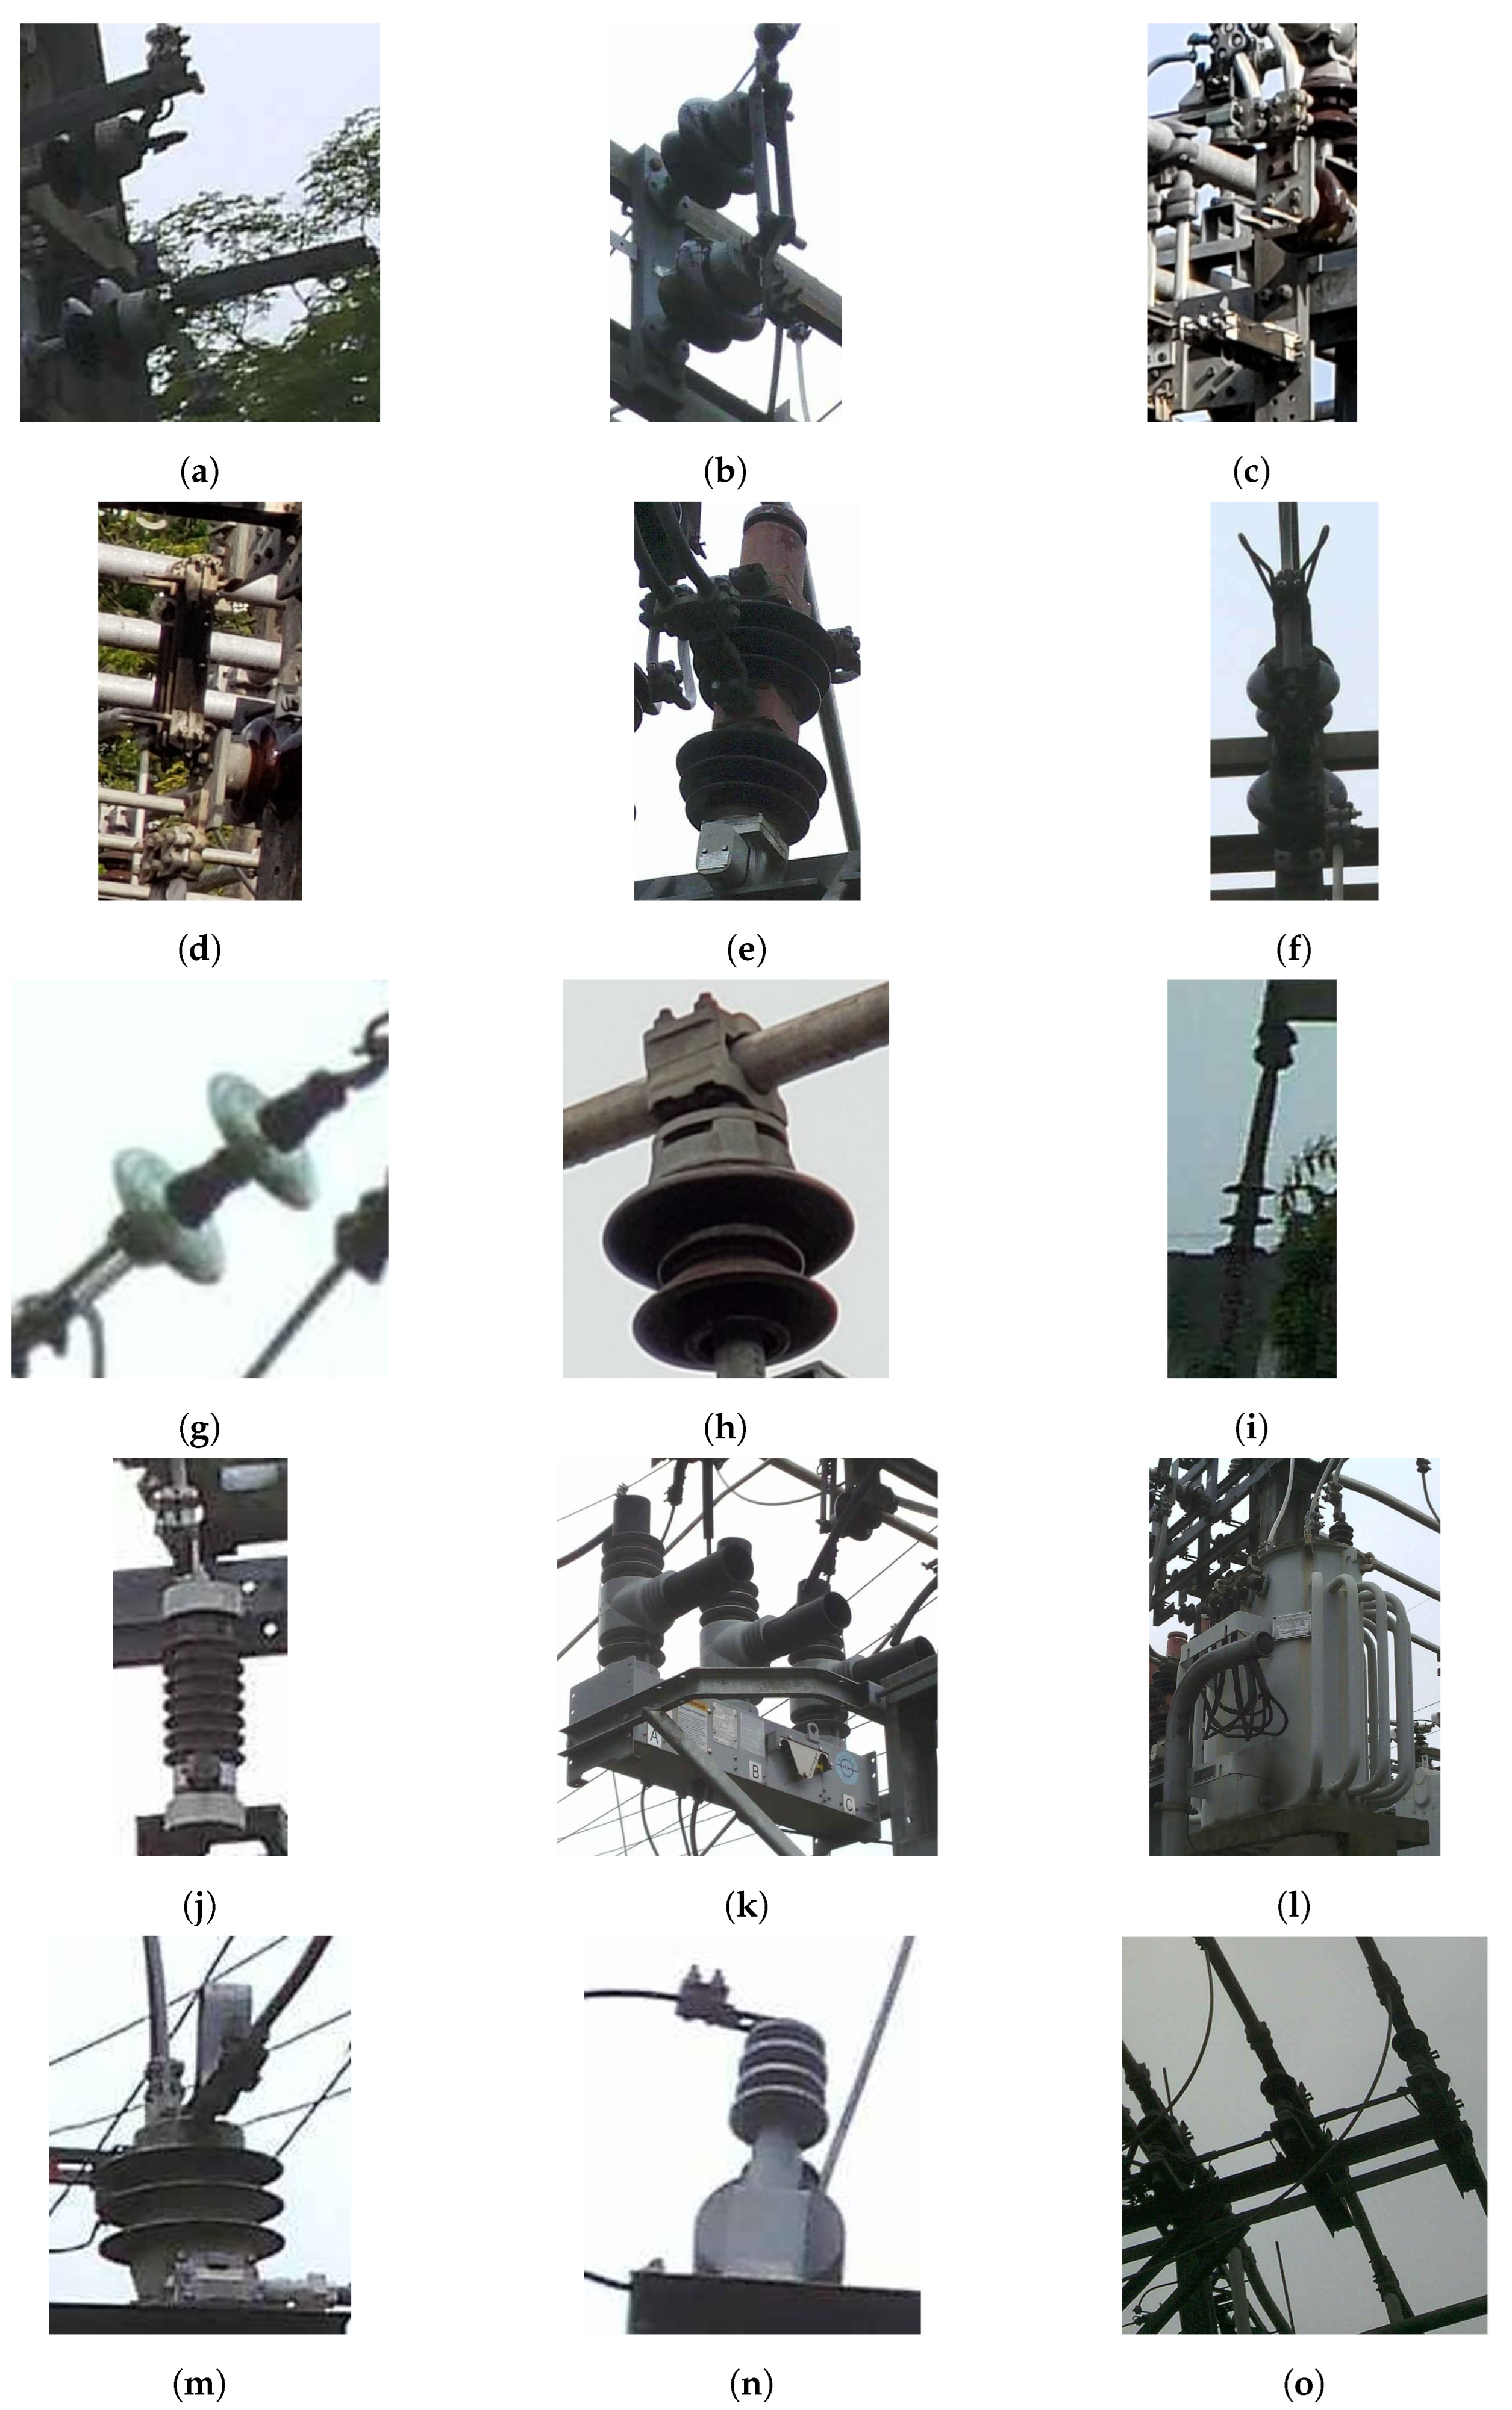
Figure 1.
An example for each of the 15 classes present in the dataset. (a) Open blade disconnect switch. (b) Closed blade disconnect switch. (c) Open tandem disconnect switch. (d) Closed tandem disconnect switch. (e) Breaker. (f) Fuse disconnect switch. (g) Glass disc insulator. (h) Porcelain pin insulator. (i) Muffle. (j) Lightning arrester. (k) Recloser. (l) Power transformer. (m) Current transformer. (n) Potential transformer. (o) Tripolar disconnect switch.
Figure 2.
Masks present in this dataset. The mask types for (a) are shown in (b–d). (a) Original image. (b) 14-class mask. (c) Porcelain pin insulator mask. (d) 15-class mask.
Figure 2.
Masks present in this dataset. The mask types for (a) are shown in (b–d). (a) Original image. (b) 14-class mask. (c) Porcelain pin insulator mask. (d) 15-class mask.
Figure 3.
A technician capturing images using the FLIR T540 camera.
Figure 3.
A technician capturing images using the FLIR T540 camera.
Figure 4.
A photo of our AGV equipped with the FLIR A700 (marked with the red box) and the FLIR A310 (the white one, with two separate lenses) cameras in a substation floor. The A310 was not used to take any photos for this dataset, but was used for pan-tilt purposes for other mounted cameras.
Figure 4.
A photo of our AGV equipped with the FLIR A700 (marked with the red box) and the FLIR A310 (the white one, with two separate lenses) cameras in a substation floor. The A310 was not used to take any photos for this dataset, but was used for pan-tilt purposes for other mounted cameras.
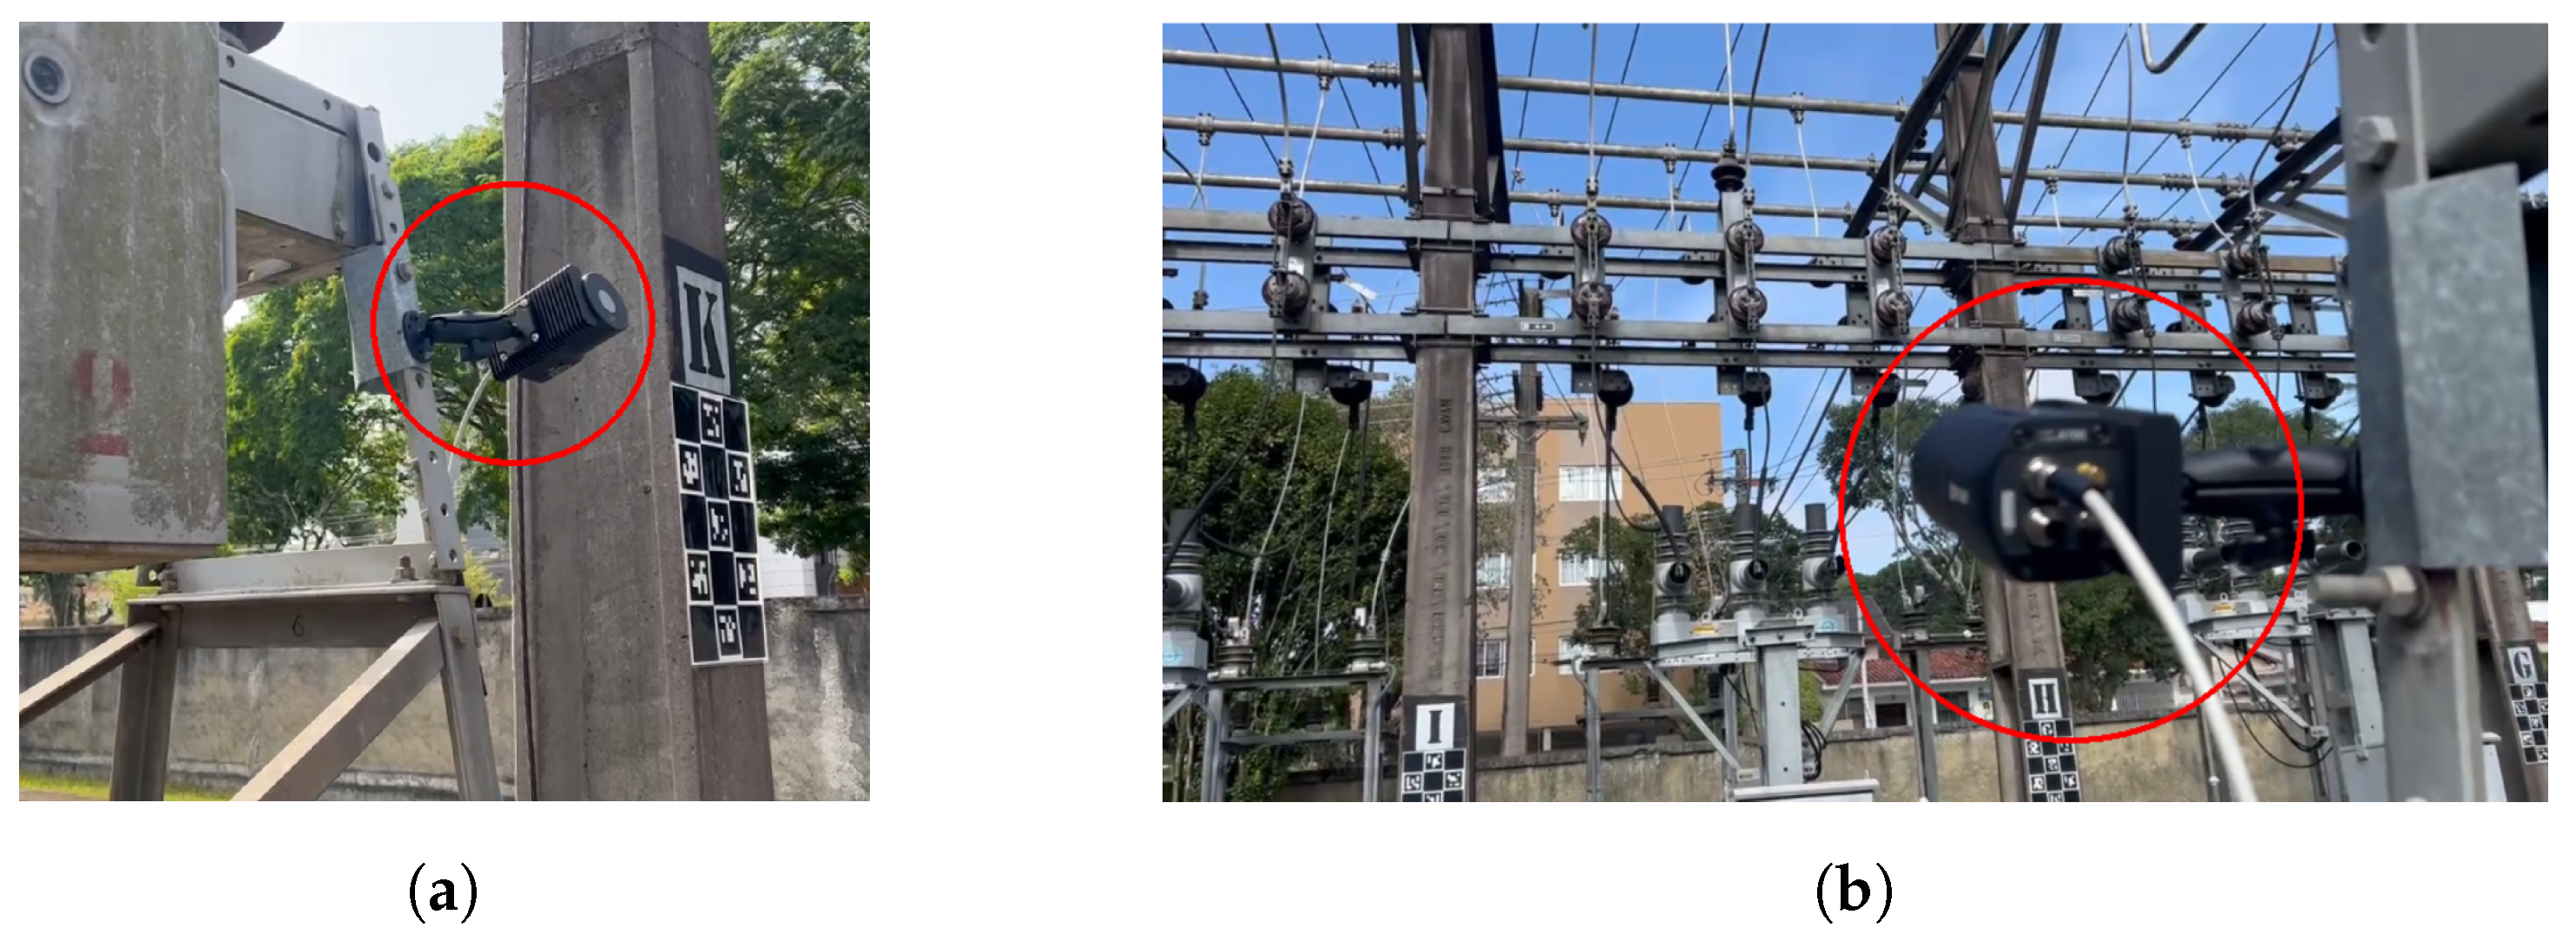
Figure 5.
Photos of the A700 fixed in the substation. The camera is encircled in red in both subimages. (a) Front view of the A700. (b) Back view of the A700 showing objects in its field of view.
Figure 5.
Photos of the A700 fixed in the substation. The camera is encircled in red in both subimages. (a) Front view of the A700. (b) Back view of the A700 showing objects in its field of view.
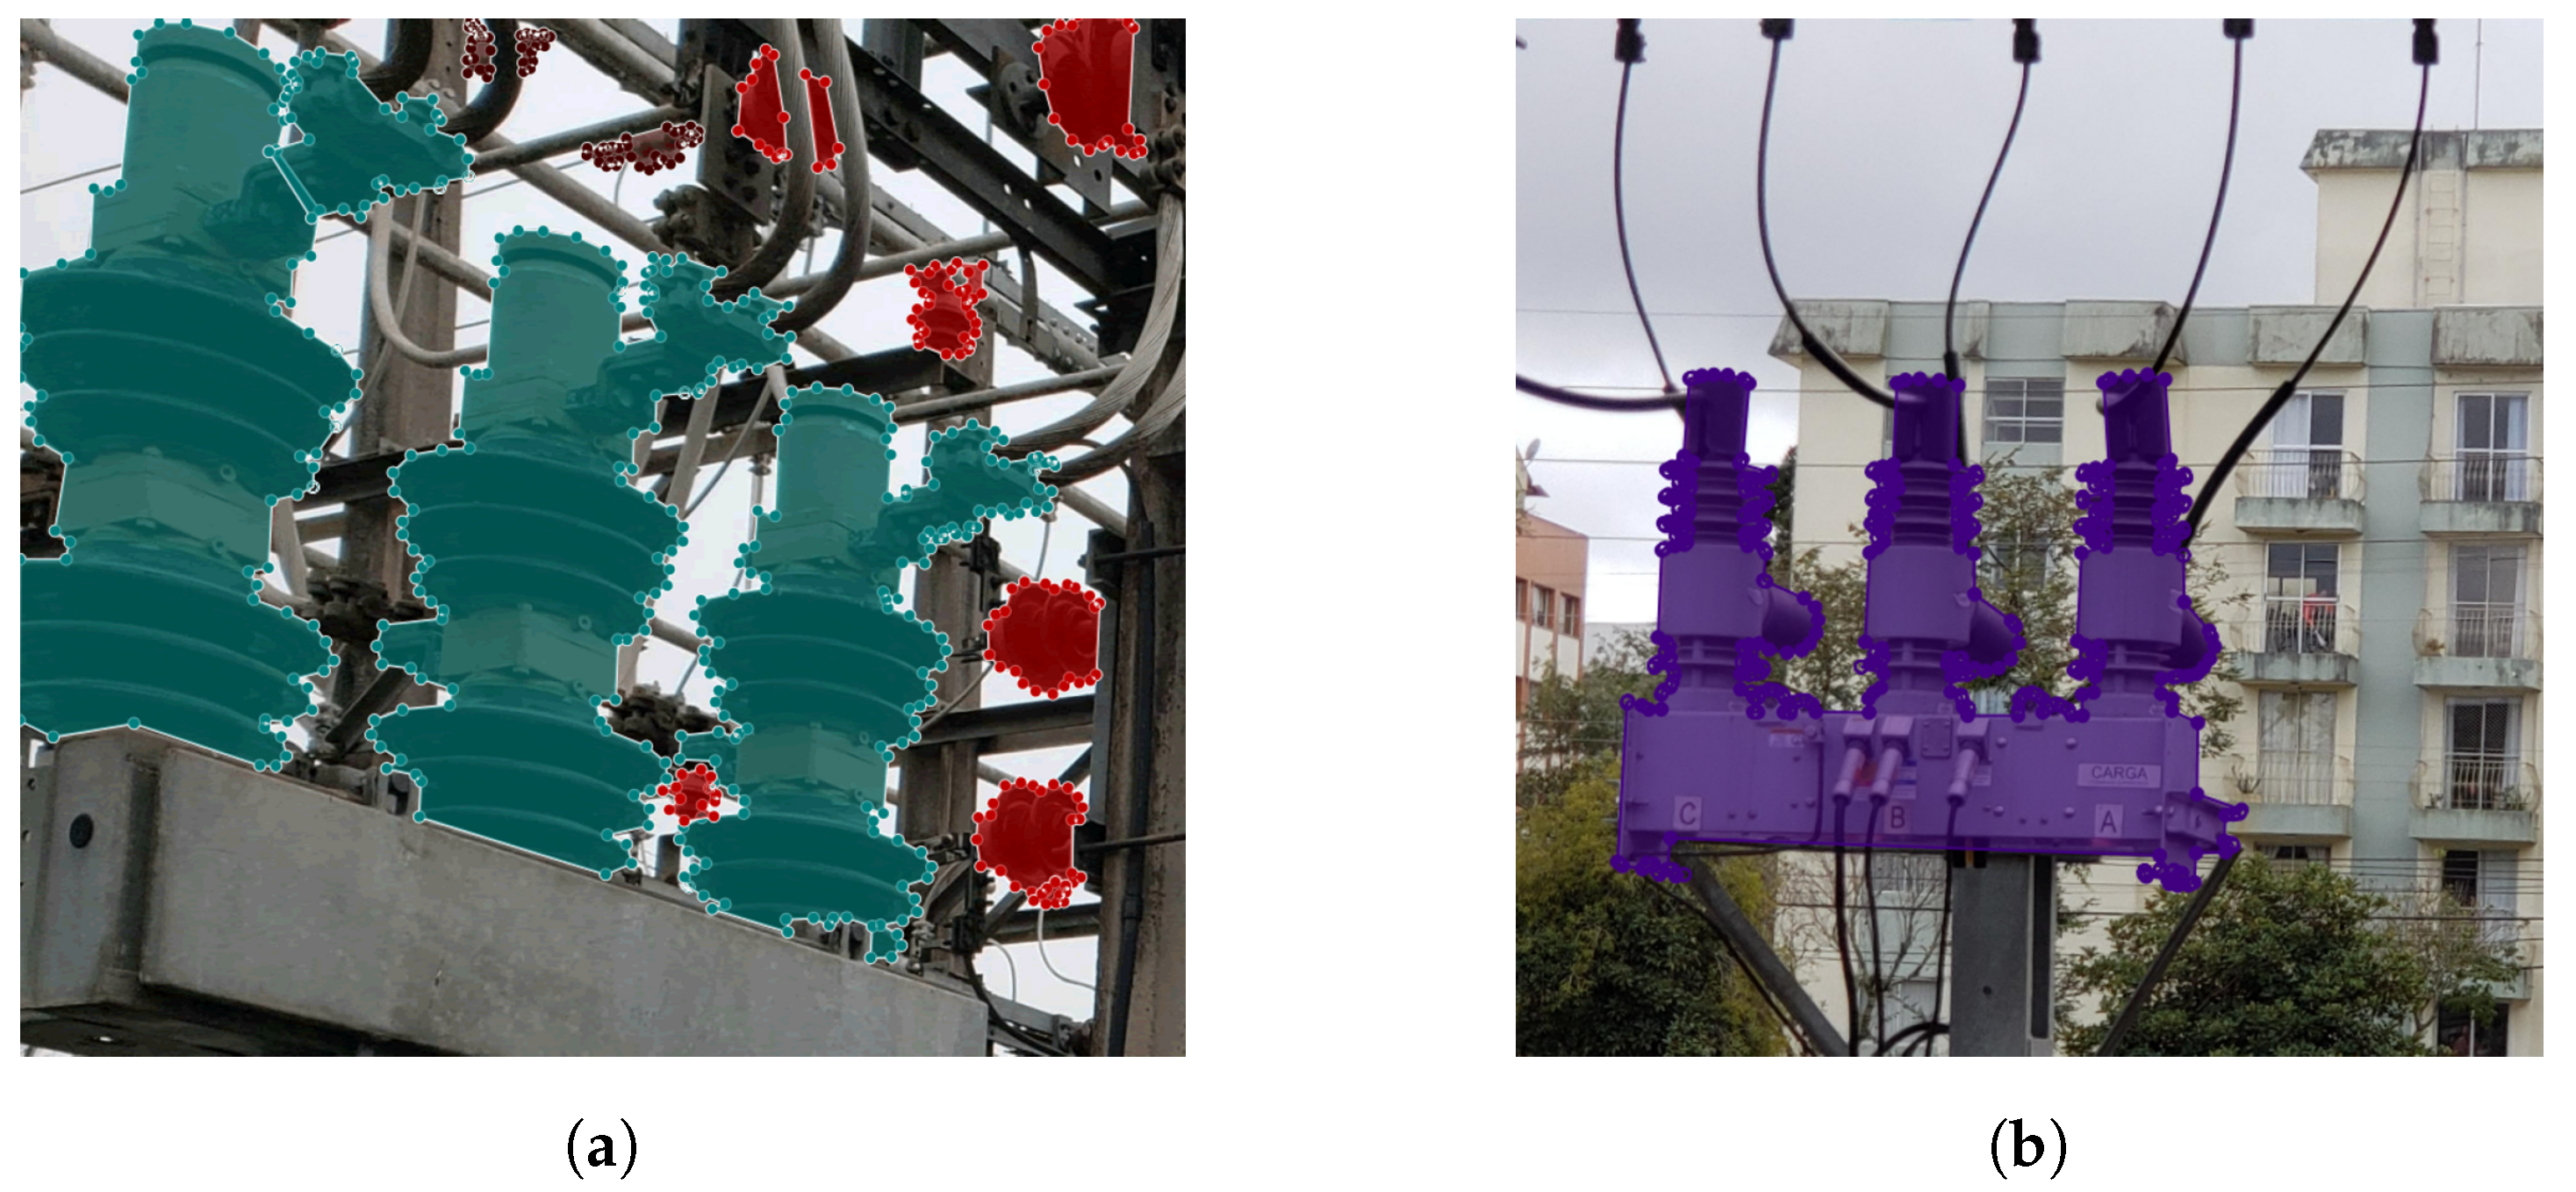
Figure 6.
Examples of manual annotation for semantic segmentation using LabelMe. The colors used by LabelMe have no relation to the colors used in the masks from
Table 3. (
a) Insulators (red) and breakers (green). (
b) A recloser (purple).
Figure 6.
Examples of manual annotation for semantic segmentation using LabelMe. The colors used by LabelMe have no relation to the colors used in the masks from
Table 3. (
a) Insulators (red) and breakers (green). (
b) A recloser (purple).
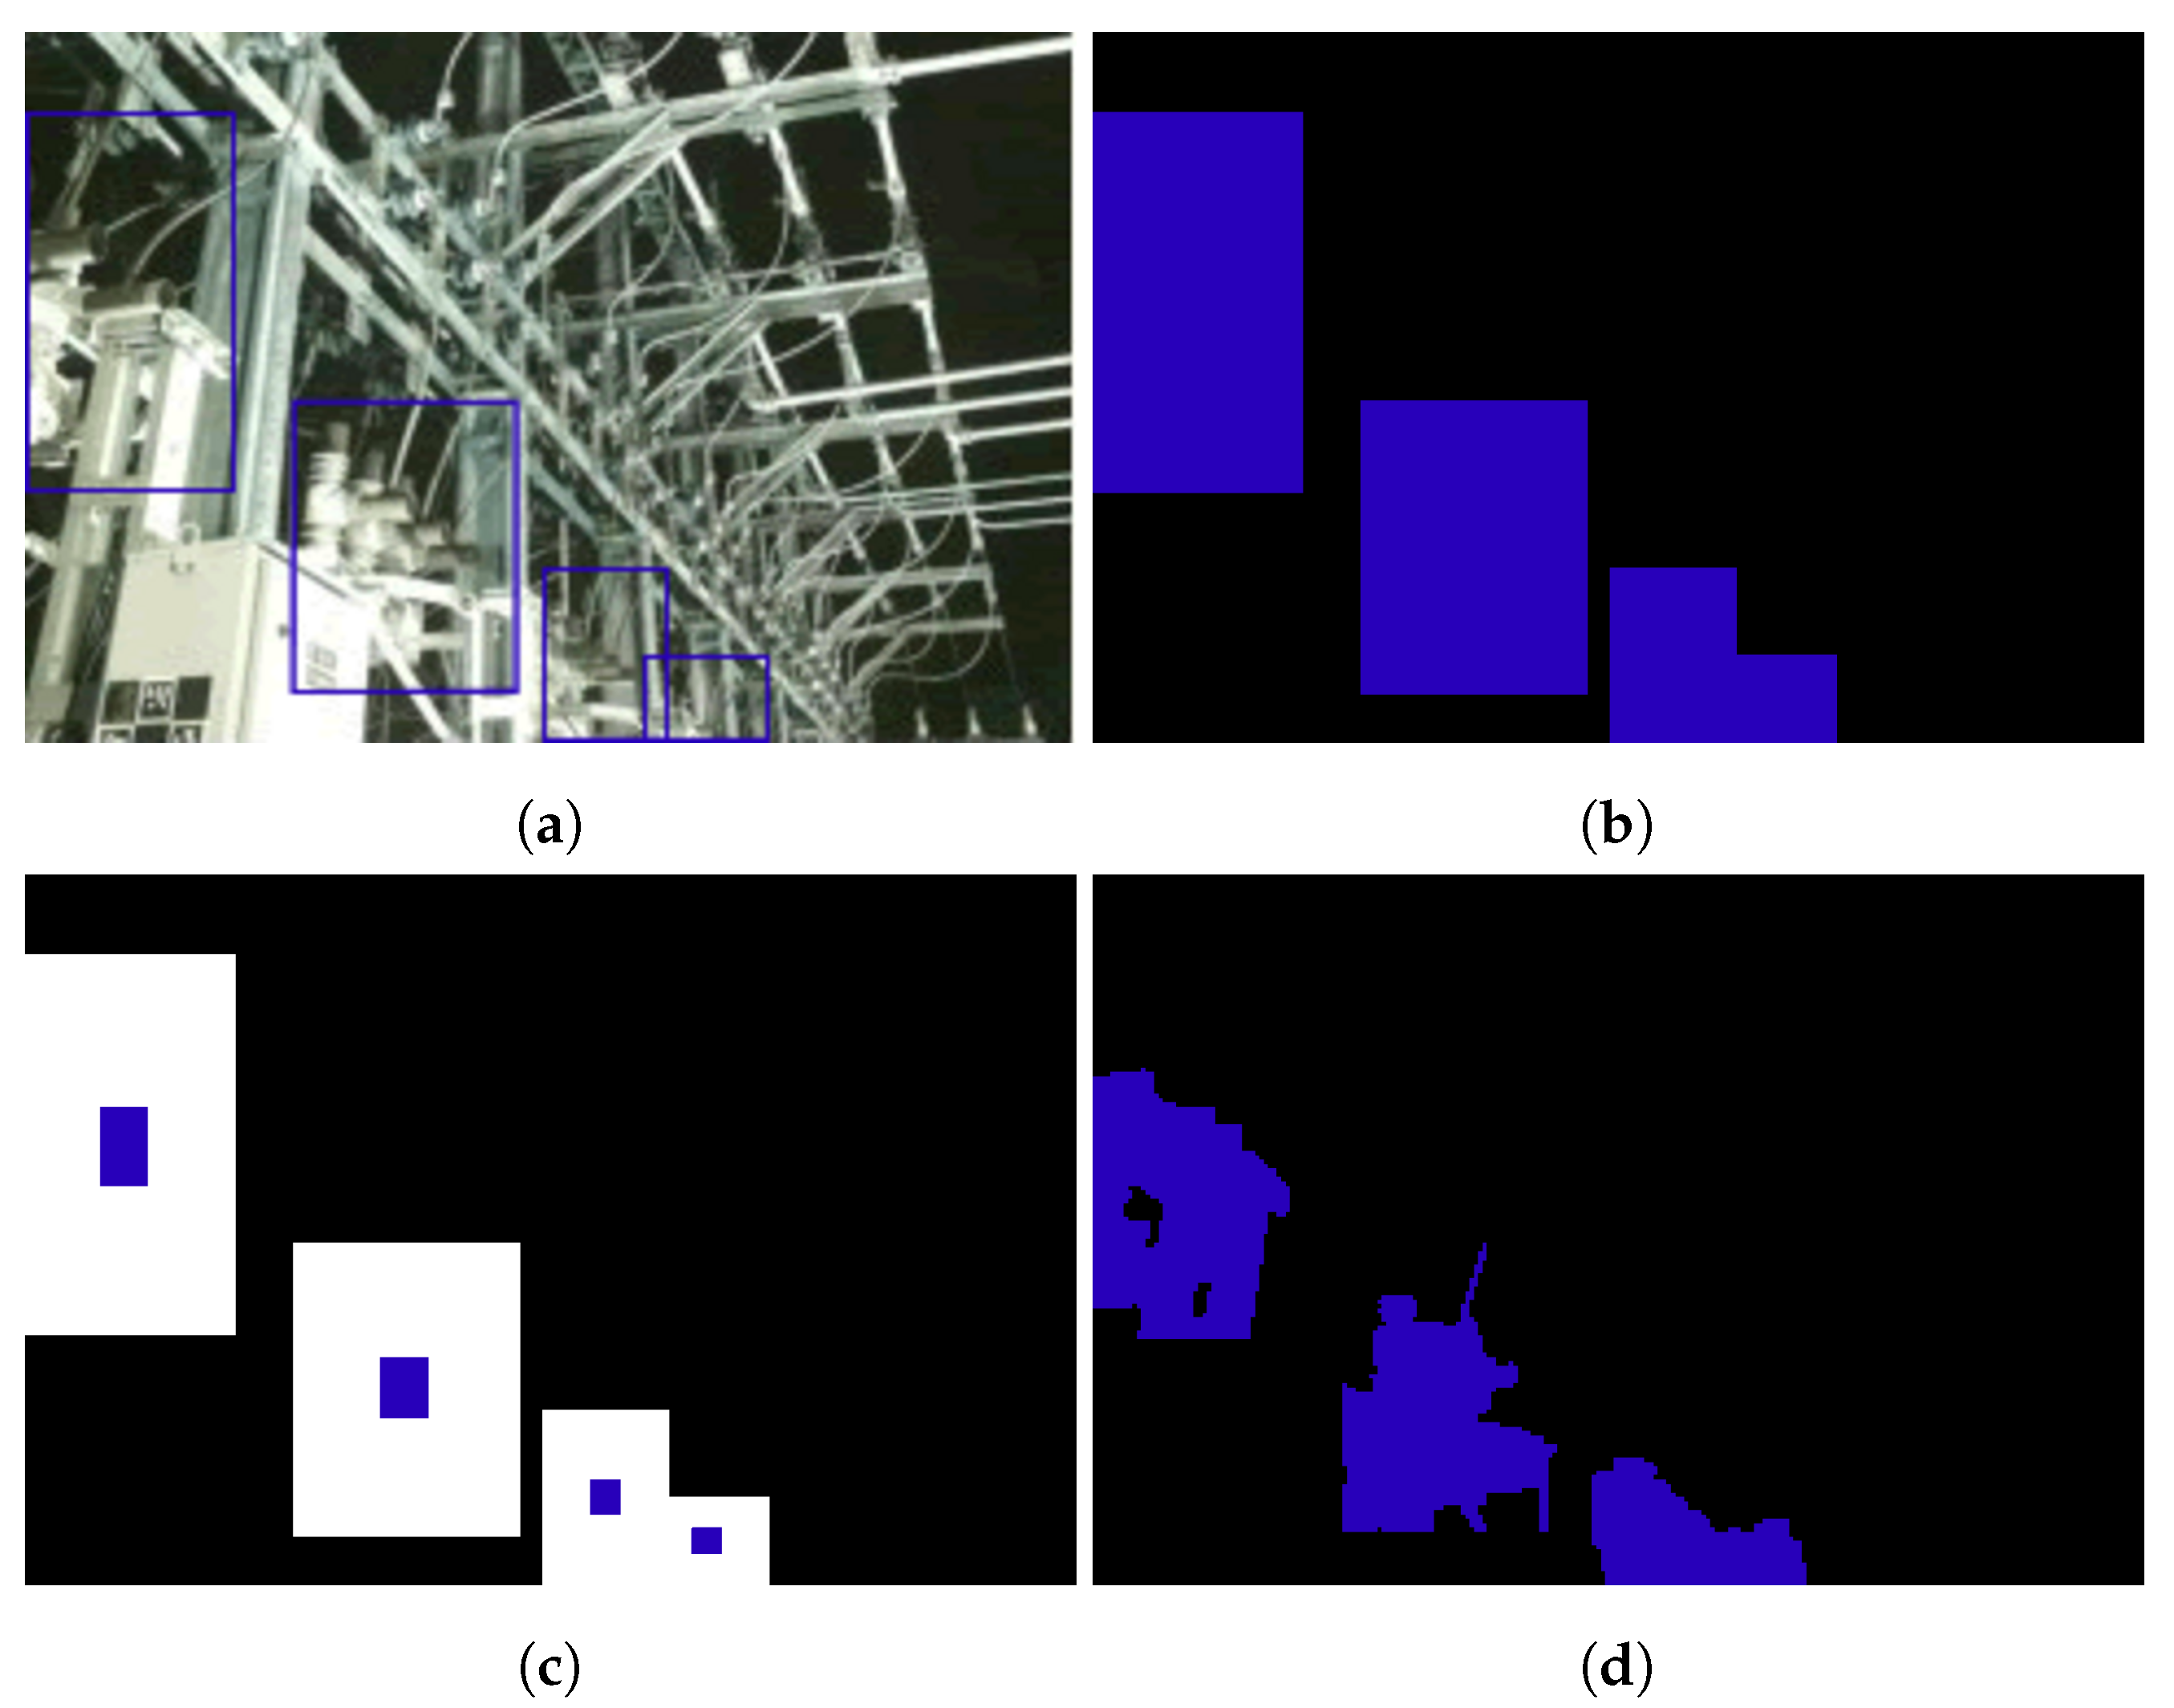
Figure 7.
Segmentation masks for object detection: (a) shows the original box annotations, (b–d) show the results of applying different mask generation techniques to the original annotations. (a) Original box annotations. (b) Box mask. (c) Boxi mask. (d) GrabCut mask.
Figure 7.
Segmentation masks for object detection: (a) shows the original box annotations, (b–d) show the results of applying different mask generation techniques to the original annotations. (a) Original box annotations. (b) Box mask. (c) Boxi mask. (d) GrabCut mask.
Figure 8.
Evolution of recloser IoU for the Box, Boxi and GrabCut methods evaluated using the test set. The best and worst IoU scores for each method are shown with arrows.
Figure 8.
Evolution of recloser IoU for the Box, Boxi and GrabCut methods evaluated using the test set. The best and worst IoU scores for each method are shown with arrows.
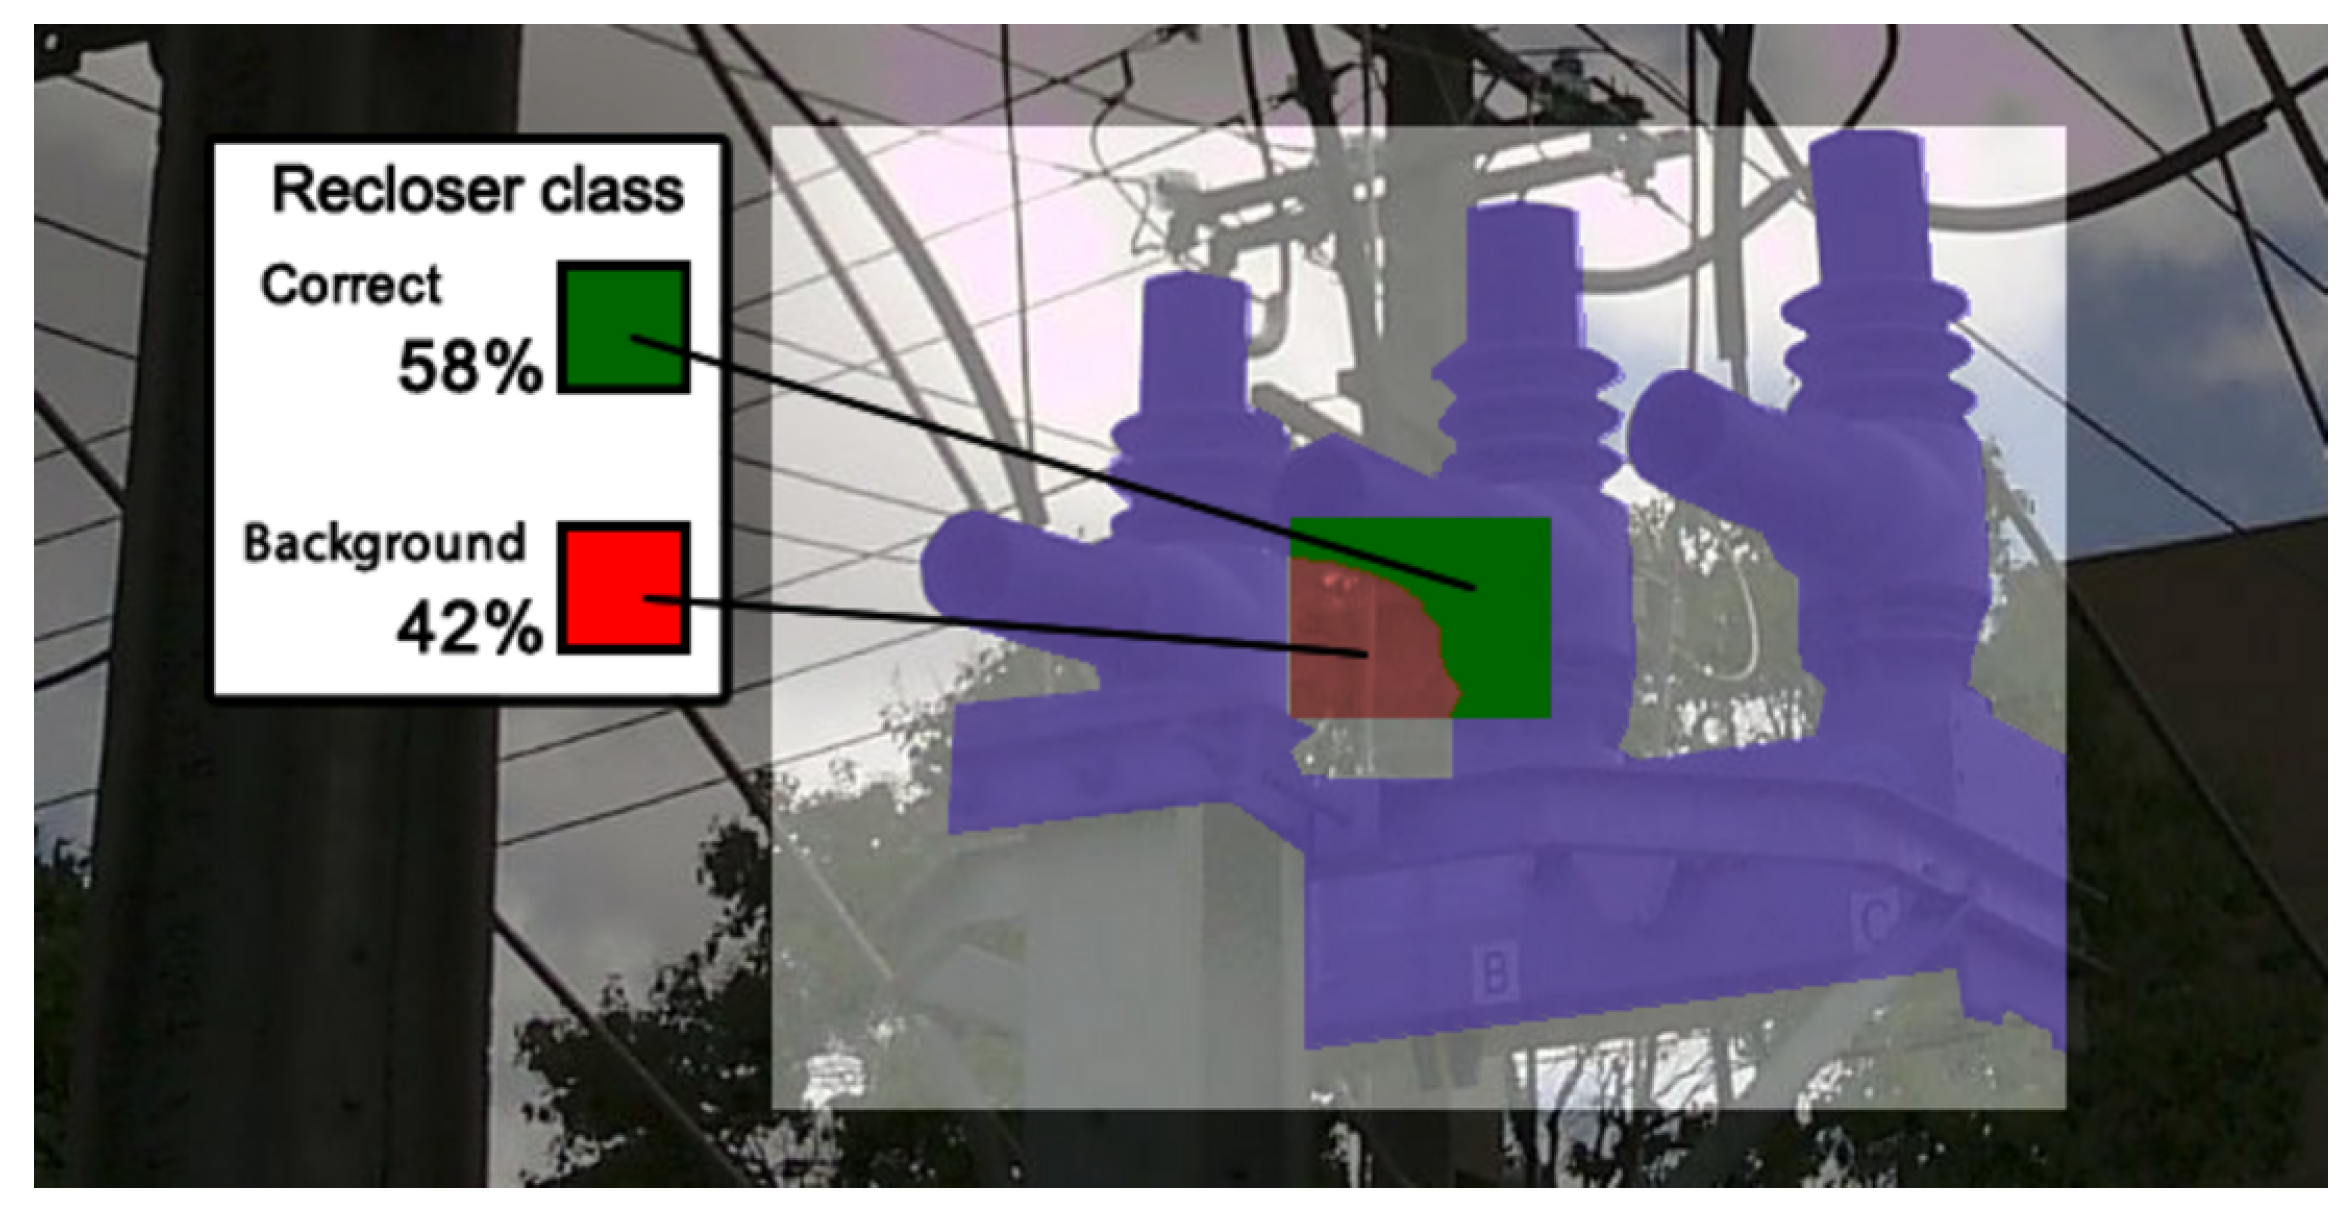
Figure 9.
Example of how Boxi is ill-suited for the recloser object class, with the ground truth outlining the object in purple. In this case, of the 20% innermost portion of the white box that should identify the object class, 42% of the total area is actually background, represented here in red.
Figure 9.
Example of how Boxi is ill-suited for the recloser object class, with the ground truth outlining the object in purple. In this case, of the 20% innermost portion of the white box that should identify the object class, 42% of the total area is actually background, represented here in red.
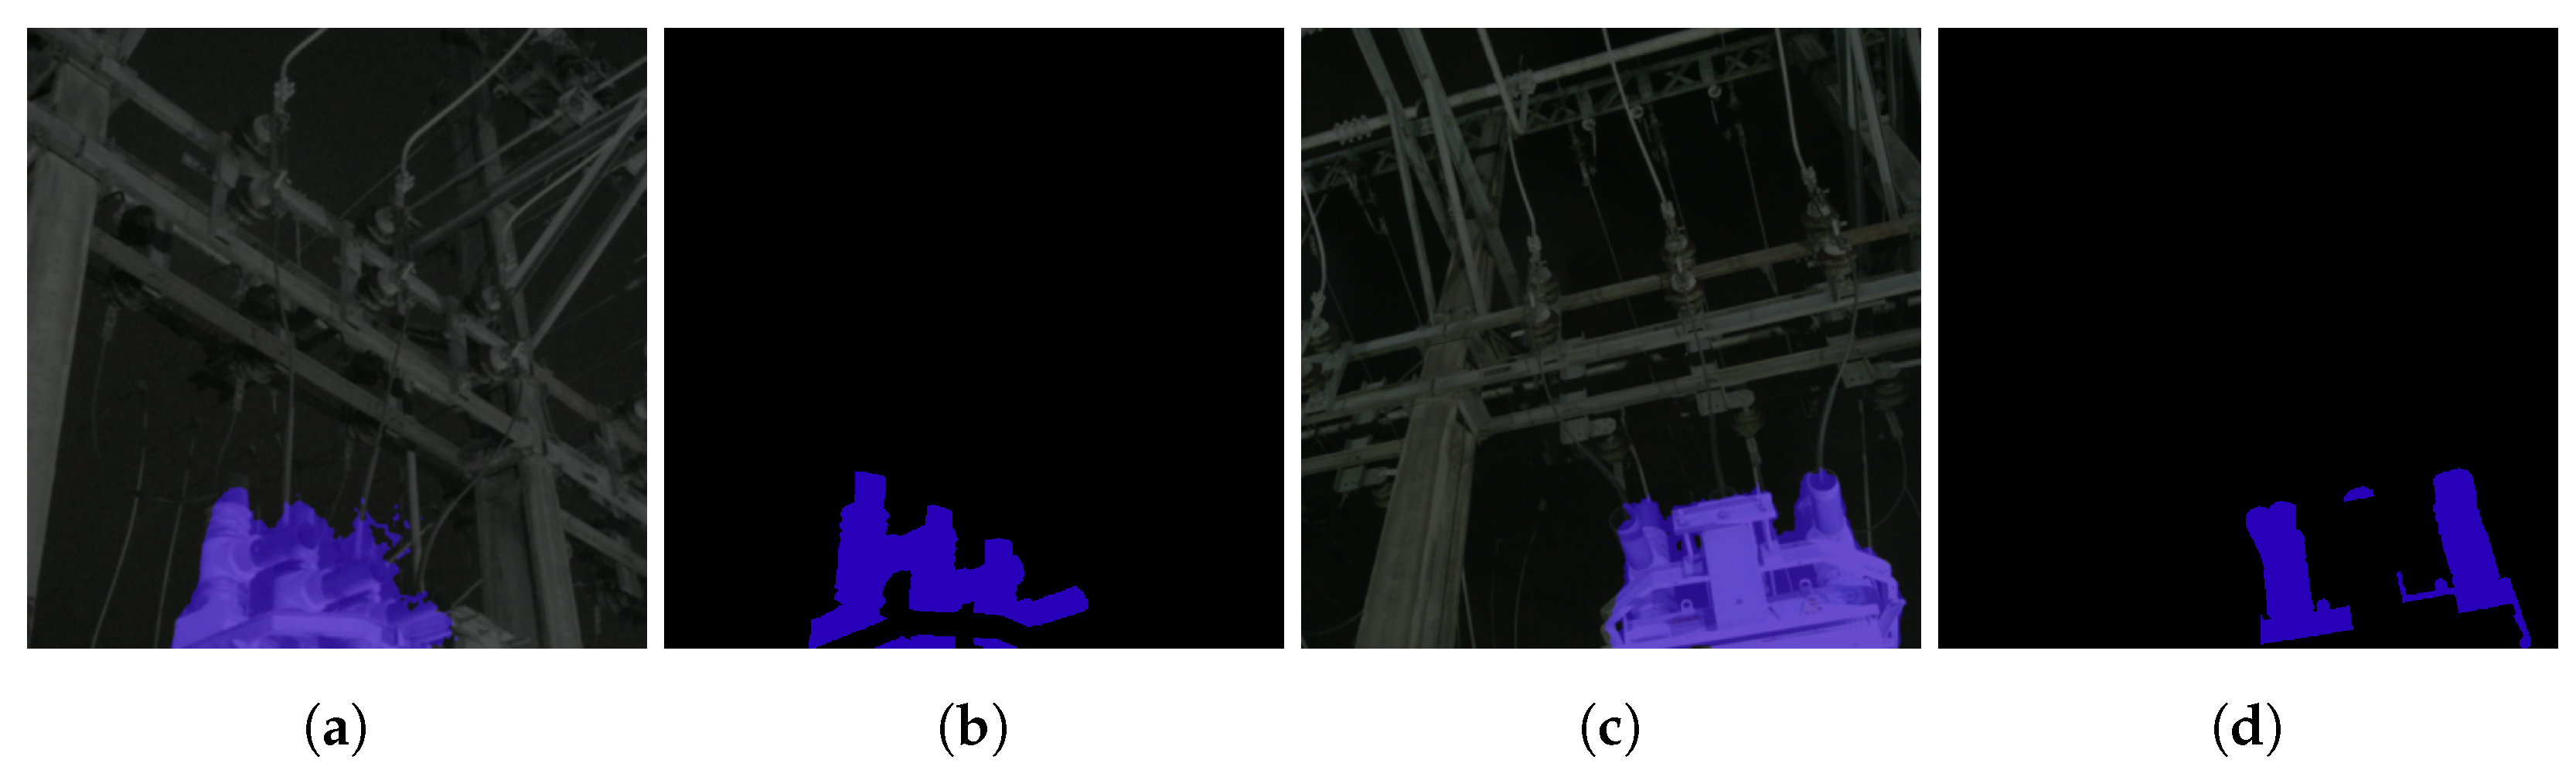
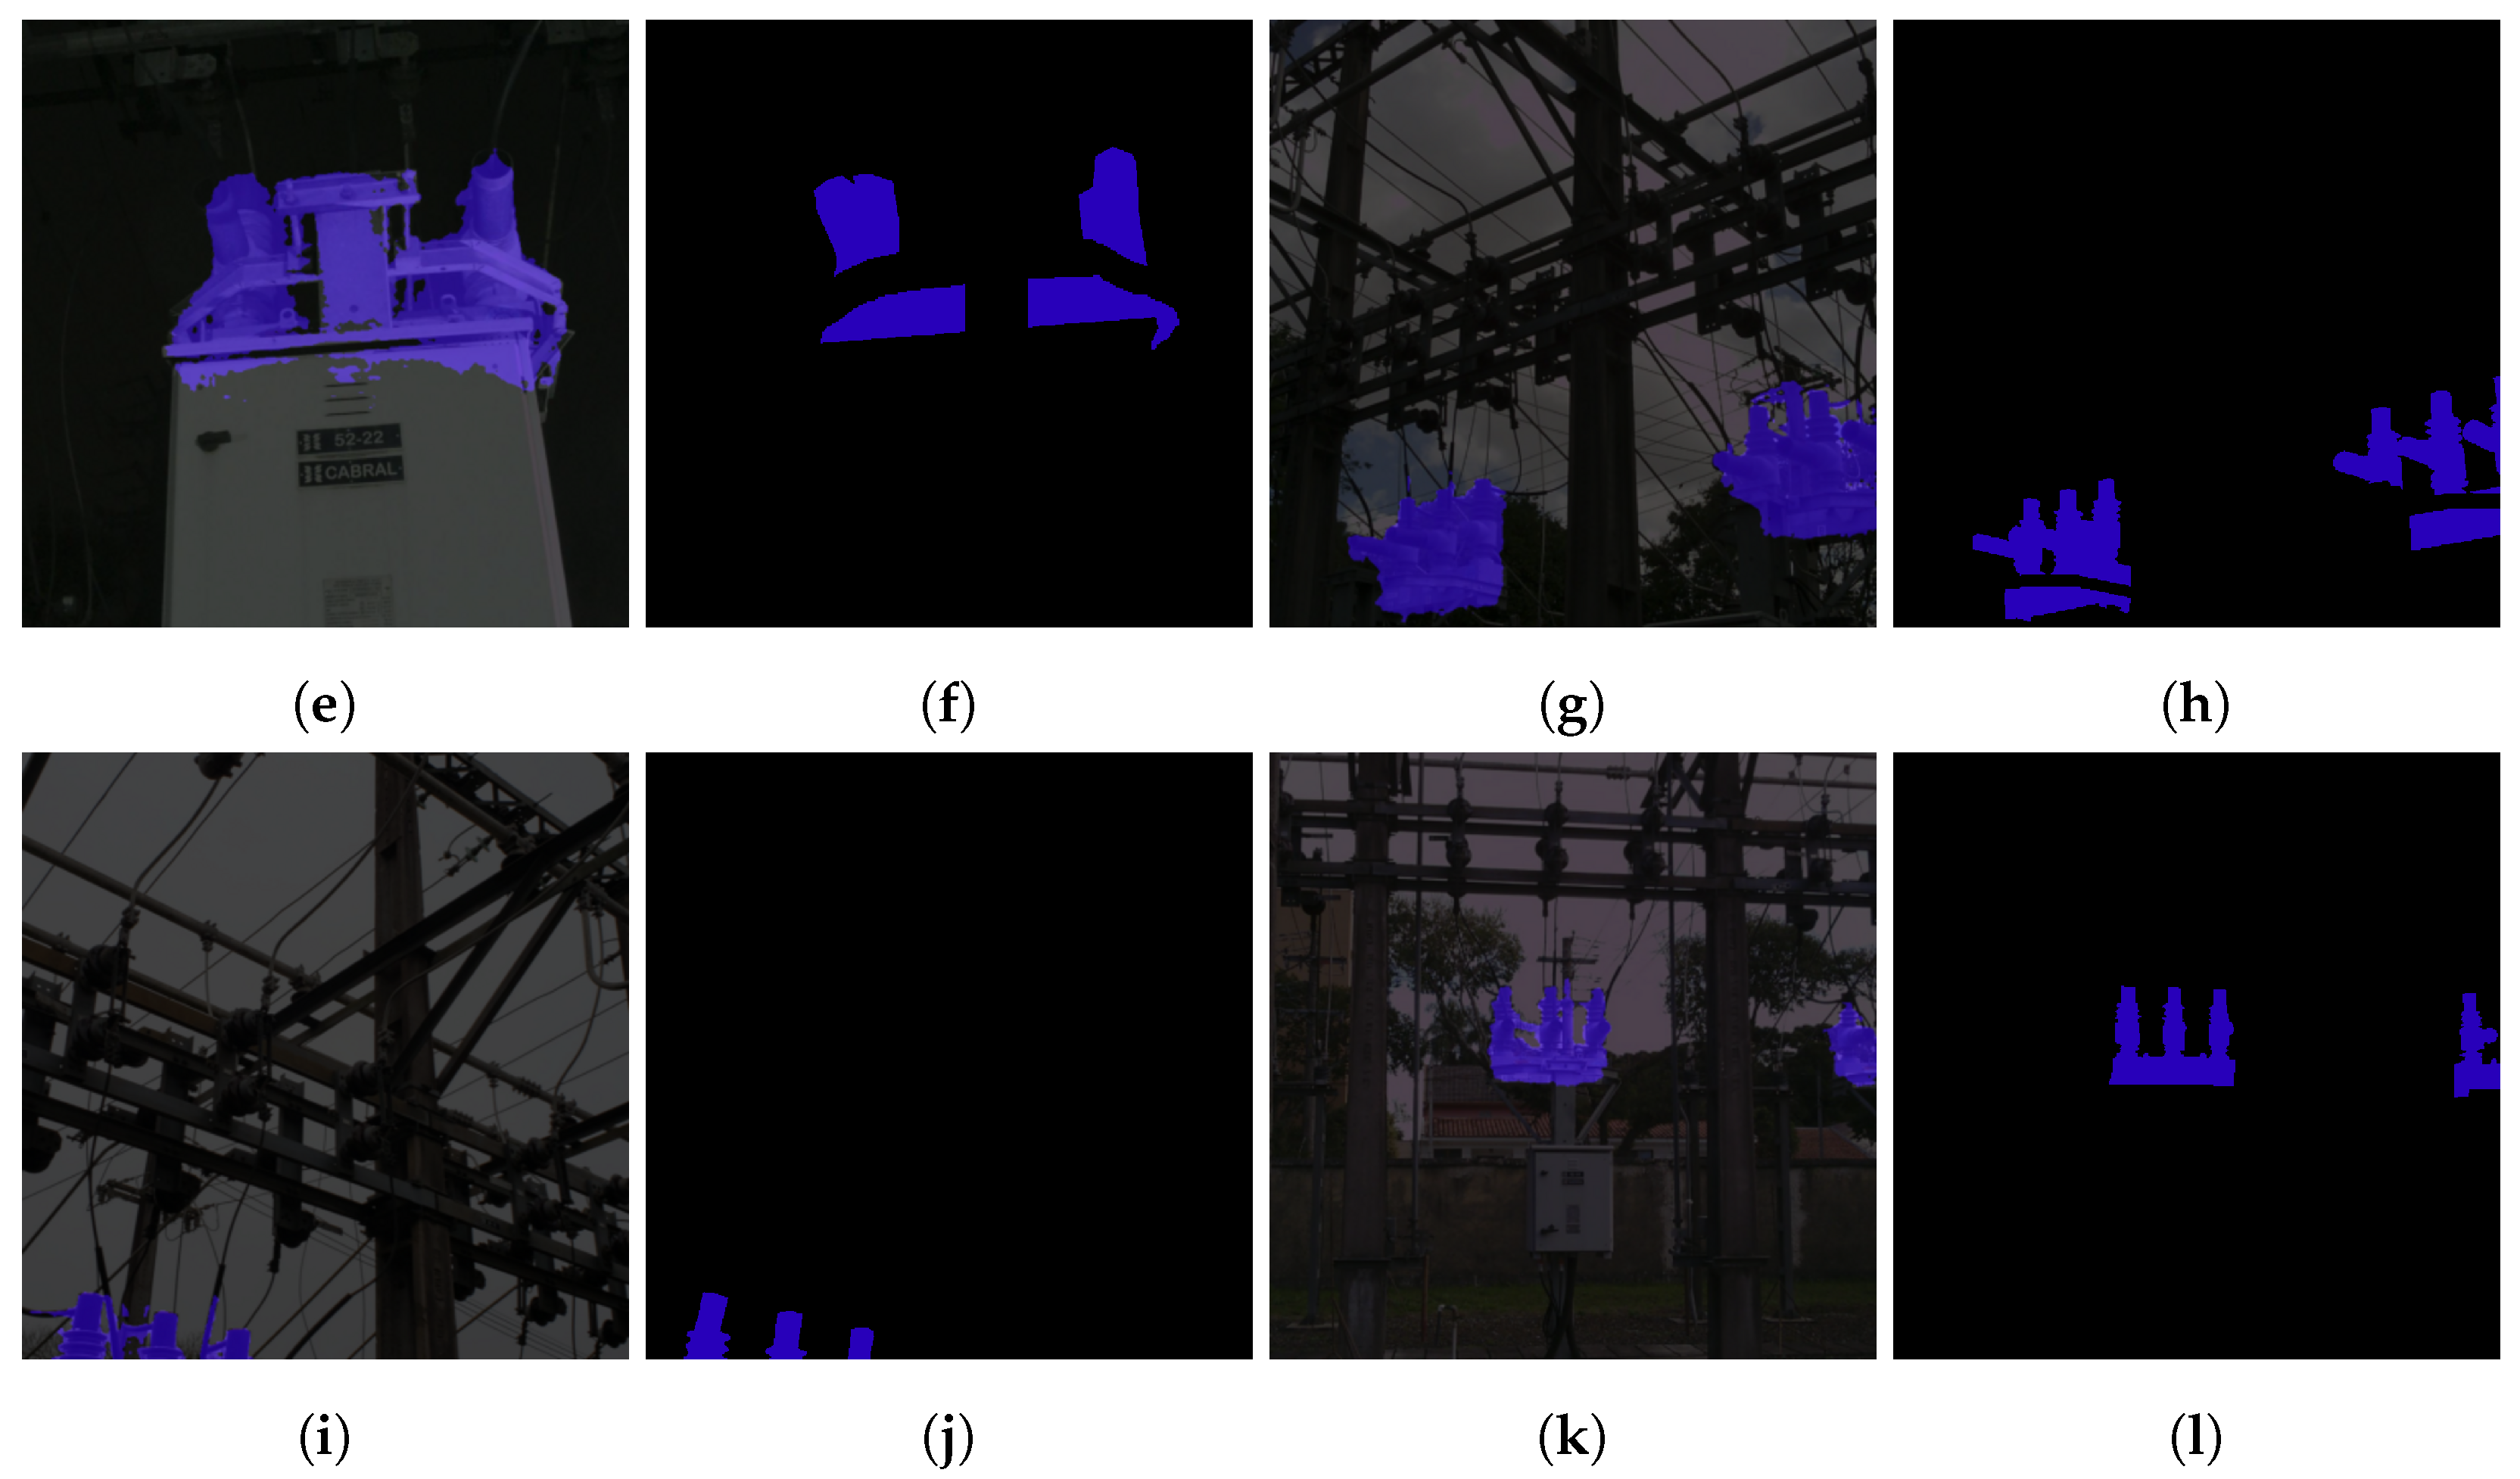
Figure 10.
Comparison between predictions from the bigger mixed dataset model and their respective ground truths. (a) Prediction overlay. (b) Groundtruth for (a). (c) Prediction overlay. (d) Groundtruth for (c). (e) Prediction overlay. (f) Groundtruth for (e). (g) Prediction overlay. (h) Groundtruth for (g). (i) Prediction overlay. (j) Groundtruth for (i). (k) Prediction overlay. (l) Groundtruth for (k).
Table 1.
Dataset distribution based on source.
Table 1.
Dataset distribution based on source.
| Source | Camera | Quantity |
|---|
| Human (Morning) | Misc, T540 | 682 |
| AGV (Morning and afternoon) | A700 | 230 |
| AGV (Night, light) | A700 | 360 |
| AGV (Night, no light) | A700 | 348 |
| Fixed (Morning and afternoon) | A700 | 32 |
| Fixed (Night, light) | A700 | 8 |
Table 2.
Resolutions and occurrences of the 1660 images in this dataset.
Table 2.
Resolutions and occurrences of the 1660 images in this dataset.
| Resolution | Occurrences |
|---|
| 1280 × 960 | 887 |
| 2592 × 1944 | 268 |
| 2880 × 2160 | 266 |
| 4032 × 3024 | 98 |
| 4000 × 3000 | 36 |
| 640 × 480 | 31 |
| 4624 × 3468 | 28 |
| 2048 × 1536 | 27 |
| 704 × 480 | 10 |
| 1156 × 867 | 4 |
| 1280 × 720 | 2 |
| 2324 × 1440 | 1 |
| 4624 × 2604 | 1 |
| 4672 × 3504 | 1 |
Table 3.
Object classes, number of instances in the dataset and their colors in RGB values used for the .png segmentation masks.
Table 3.
Object classes, number of instances in the dataset and their colors in RGB values used for the .png segmentation masks.
| Class | Instances | RGB | Color |
|---|
| Background | - | (000, 000, 000) | |
| Open blade disconnect switch | 310 | (162, 000, 255) | |
| Closed blade disconnect switch | 5243 | (097, 016, 162) | |
| Open tandem disconnect switch | 1599 | (081, 162, 000) | |
| Closed tandem disconnect switch | 966 | (048, 097, 165) | |
| Breaker | 980 | (121, 121, 121) | |
| Fuse disconnect switch | 355 | (255, 097, 178) | |
| Glass disc insulator | 3185 | (154, 032, 121) | |
| Porcelain pin insulator | 26,499 | (255, 255, 125) | |
| Muffle | 1354 | (162, 243, 162) | |
| Lightning arrester | 1976 | (143, 211, 255) | |
| Recloser | 2331 | (040, 000, 186) | |
| Power transformer | 768 | (255, 182, 000) | |
| Current transformer | 2136 | (138, 138, 000) | |
| Potential transformer | 654 | (162, 048, 000) | |
| Tripolar disconnect switch | 2349 | (162, 000, 096) | |
Table 4.
Variables used in Algorithm 1.
Table 4.
Variables used in Algorithm 1.
| Variable | Description |
|---|
| image | Current image in the dataset |
| image_name | Name of the current image |
| shapes | json field with multiple polygon objects |
| polygon | Current polygon in the shapes field |
| RGB_value | RGB color value associated with the polygon.label field |
| points | Polygonal point coordinates from polygon.points field |
Table 5.
Cut-off IoU thresholds to reset a mask to a previous state.
Table 5.
Cut-off IoU thresholds to reset a mask to a previous state.
| Class | Area Threshold |
|---|
| Disconnect switches | <25% |
| Power transformer | <80% |
| Other classes | <50% |
Table 6.
Splitting of recloser dataset into training, validation and testing.
Table 6.
Splitting of recloser dataset into training, validation and testing.
| Subset | All Images | Recloser Images | Recloser Instances |
|---|
| Total | 1660 | 861 | 2331 |
| Train | 331 | 174 | 486 |
| Validation | 663 | 326 | 879 |
| Test | 664 | 361 | 966 |
Table 7.
Training set splits.
Table 7.
Training set splits.
| Dataset | Images | Recloser Instances |
|---|
| Fully generated dataset | 2363 | 3589 |
| Mixed dataset | 2694 | 4075 |
| Bigger mixed dataset | 3369 | 4750 |
Table 8.
Performance of the models augmented with weak supervision.
Table 8.
Performance of the models augmented with weak supervision.
| Dataset | Images | Recloser Boxes | Recloser IoU |
|---|
| Mixed dataset | 2694 | 4075 | 0.617 |
| Bigger mixed dataset | 3369 | 4750 | 0.629 |
| Disclaimer/Publisher’s Note: The statements, opinions and data contained in all publications are solely those of the individual author(s) and contributor(s) and not of MDPI and/or the editor(s). MDPI and/or the editor(s) disclaim responsibility for any injury to people or property resulting from any ideas, methods, instructions or products referred to in the content. |
© 2023 by the authors. Licensee MDPI, Basel, Switzerland. This article is an open access article distributed under the terms and conditions of the Creative Commons Attribution (CC BY) license (https://creativecommons.org/licenses/by/4.0/).


 ,
, 


