
Physical Contact between Torulaspora delbrueckii and Saccharomyces cerevisiae Alters Cell Growth and Molecular Interactions in Grape Must
 , and
, and
Abstract
:1. Introduction
2. Materials and Methods
2.1. Yeast Strains and Pre-Cultures
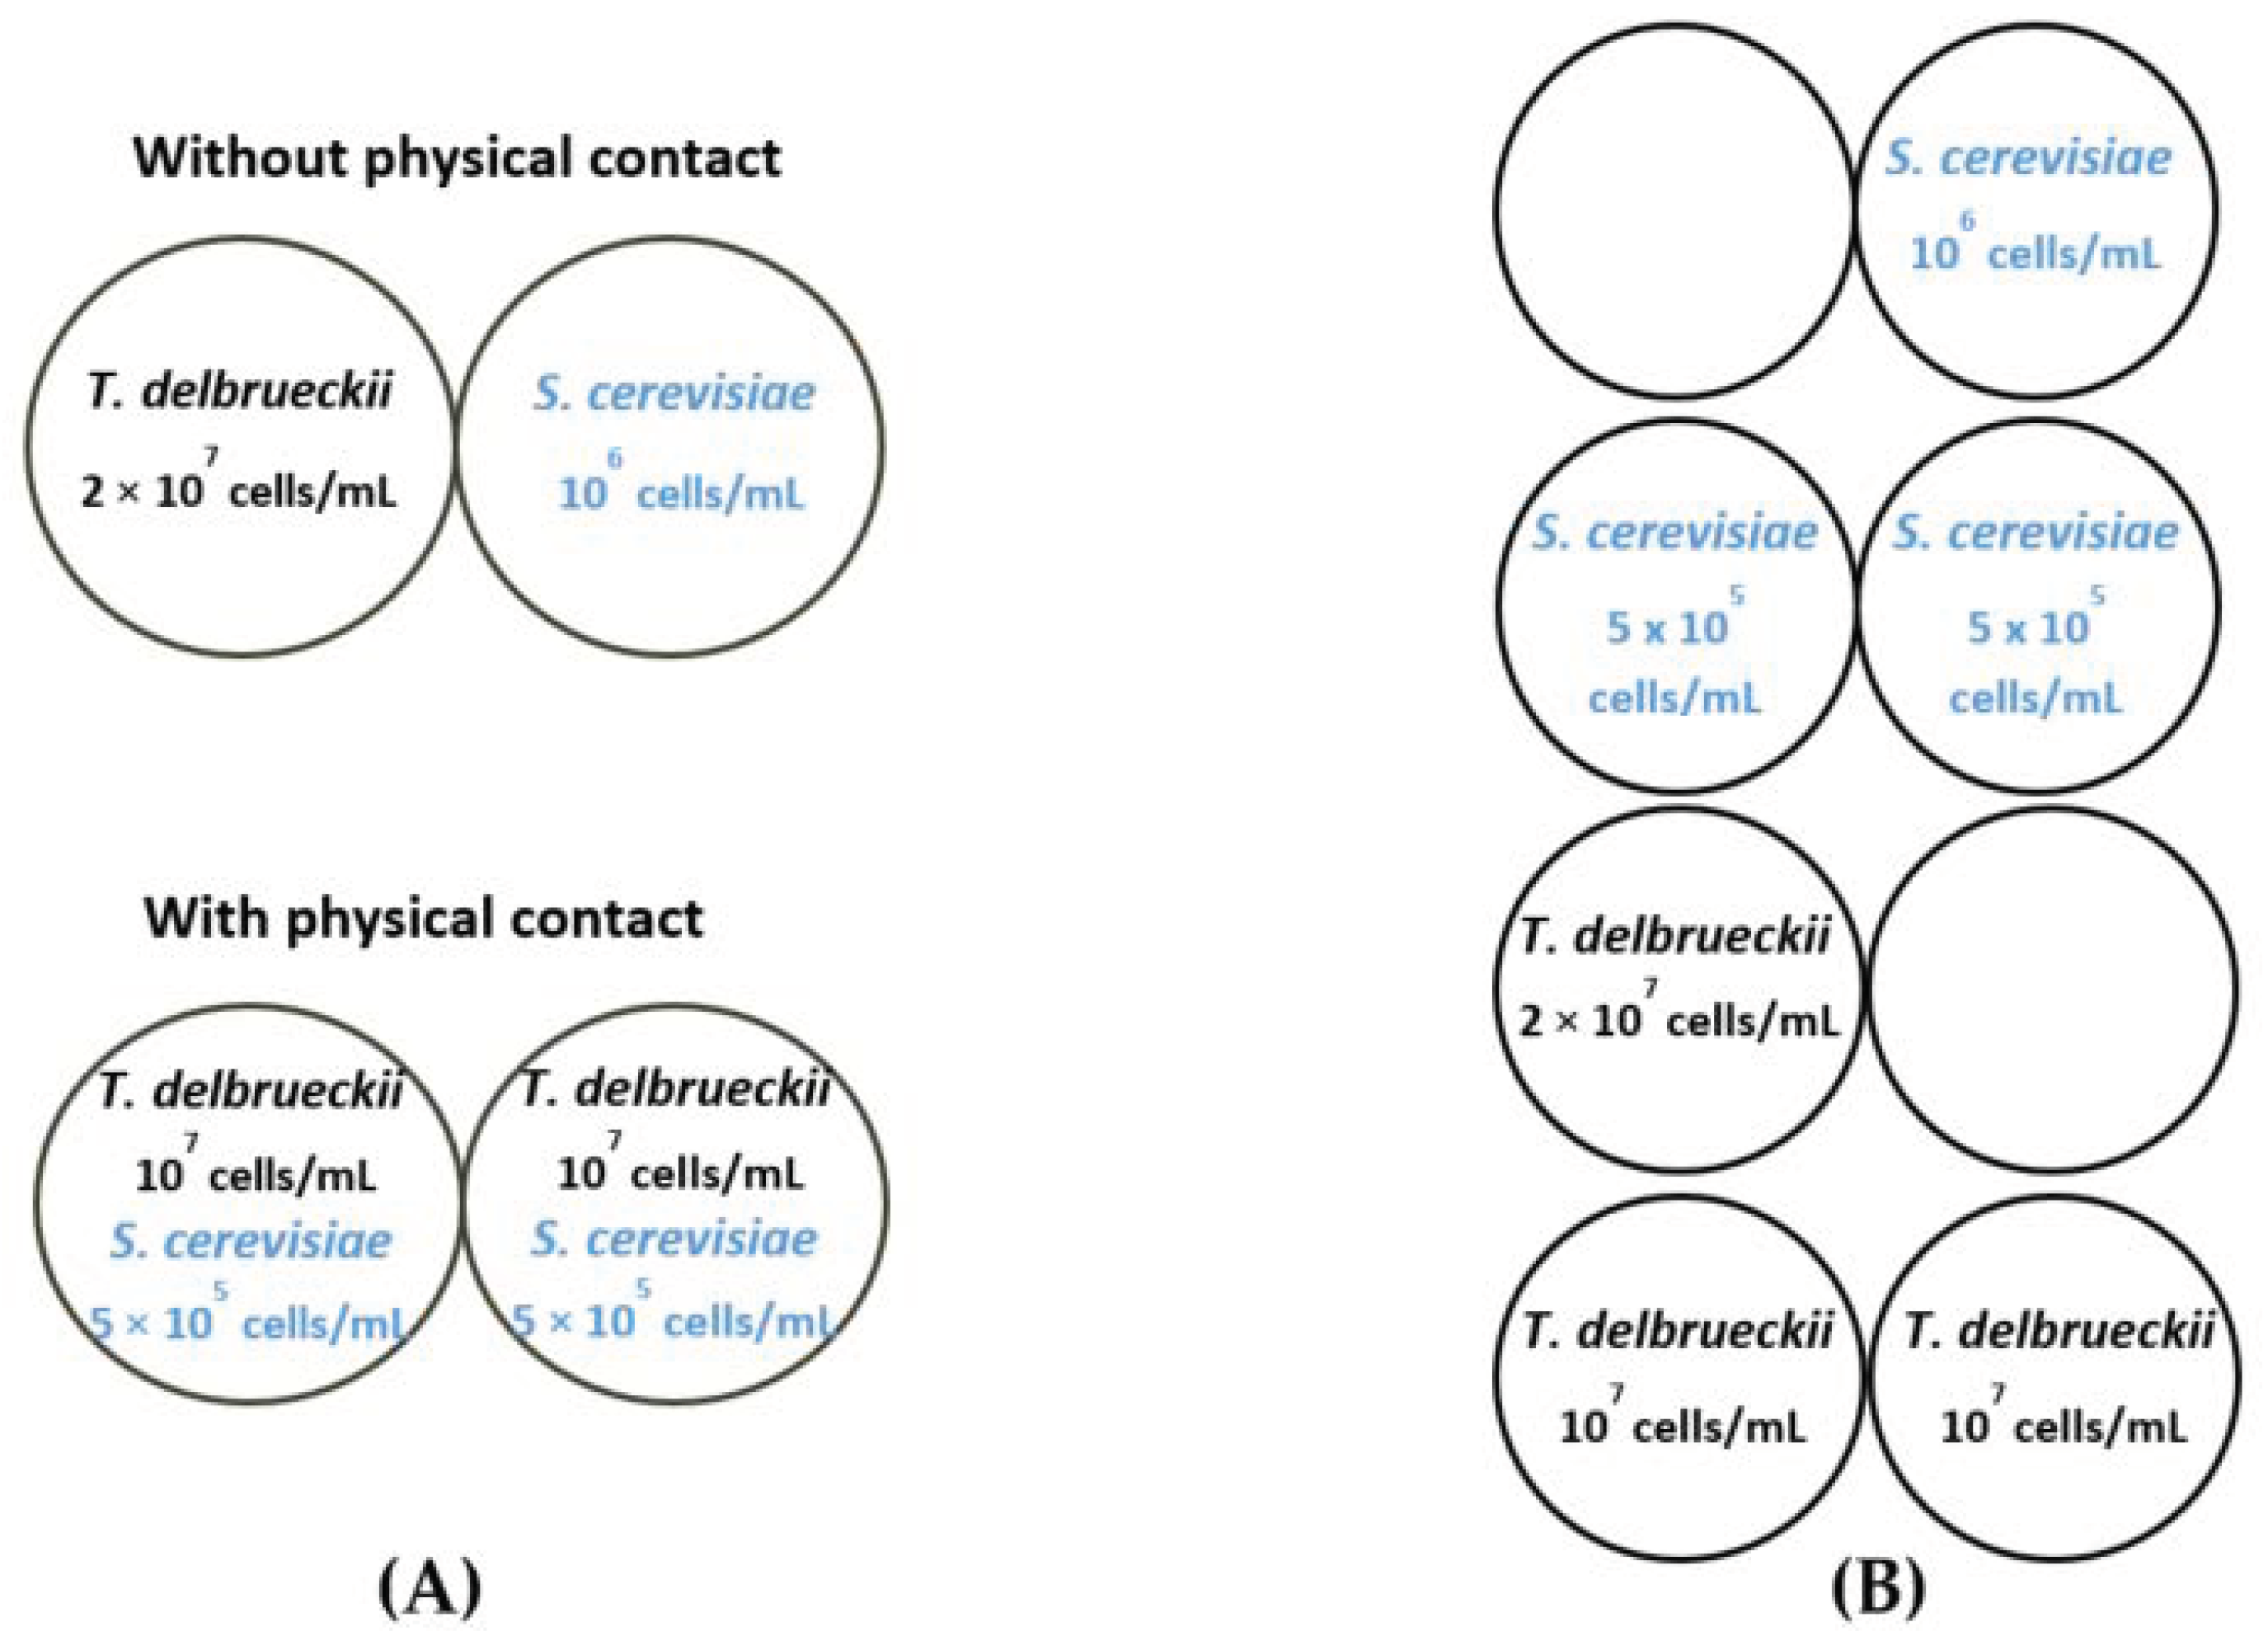
2.2. Fermentations in a Bioreactor with a Double Compartment
2.2.1. Bioreactor
2.2.2. Fermentation Medium
2.2.3. Modalities
2.3. Volatile Thiol Analysis
2.4. Ester Analysis
2.5. Classic Wine Analysis
2.6. Data Analysis
2.7. Proteomics
2.7.1. Protein Extraction and Digestion
2.7.2. LC-MS/MS Analysis
2.7.3. Data Availability
2.7.4. Protein Identification
2.7.5. Peptide and Protein Quantification
2.7.6. Statistical Analysis of Proteomic Data
3. Results
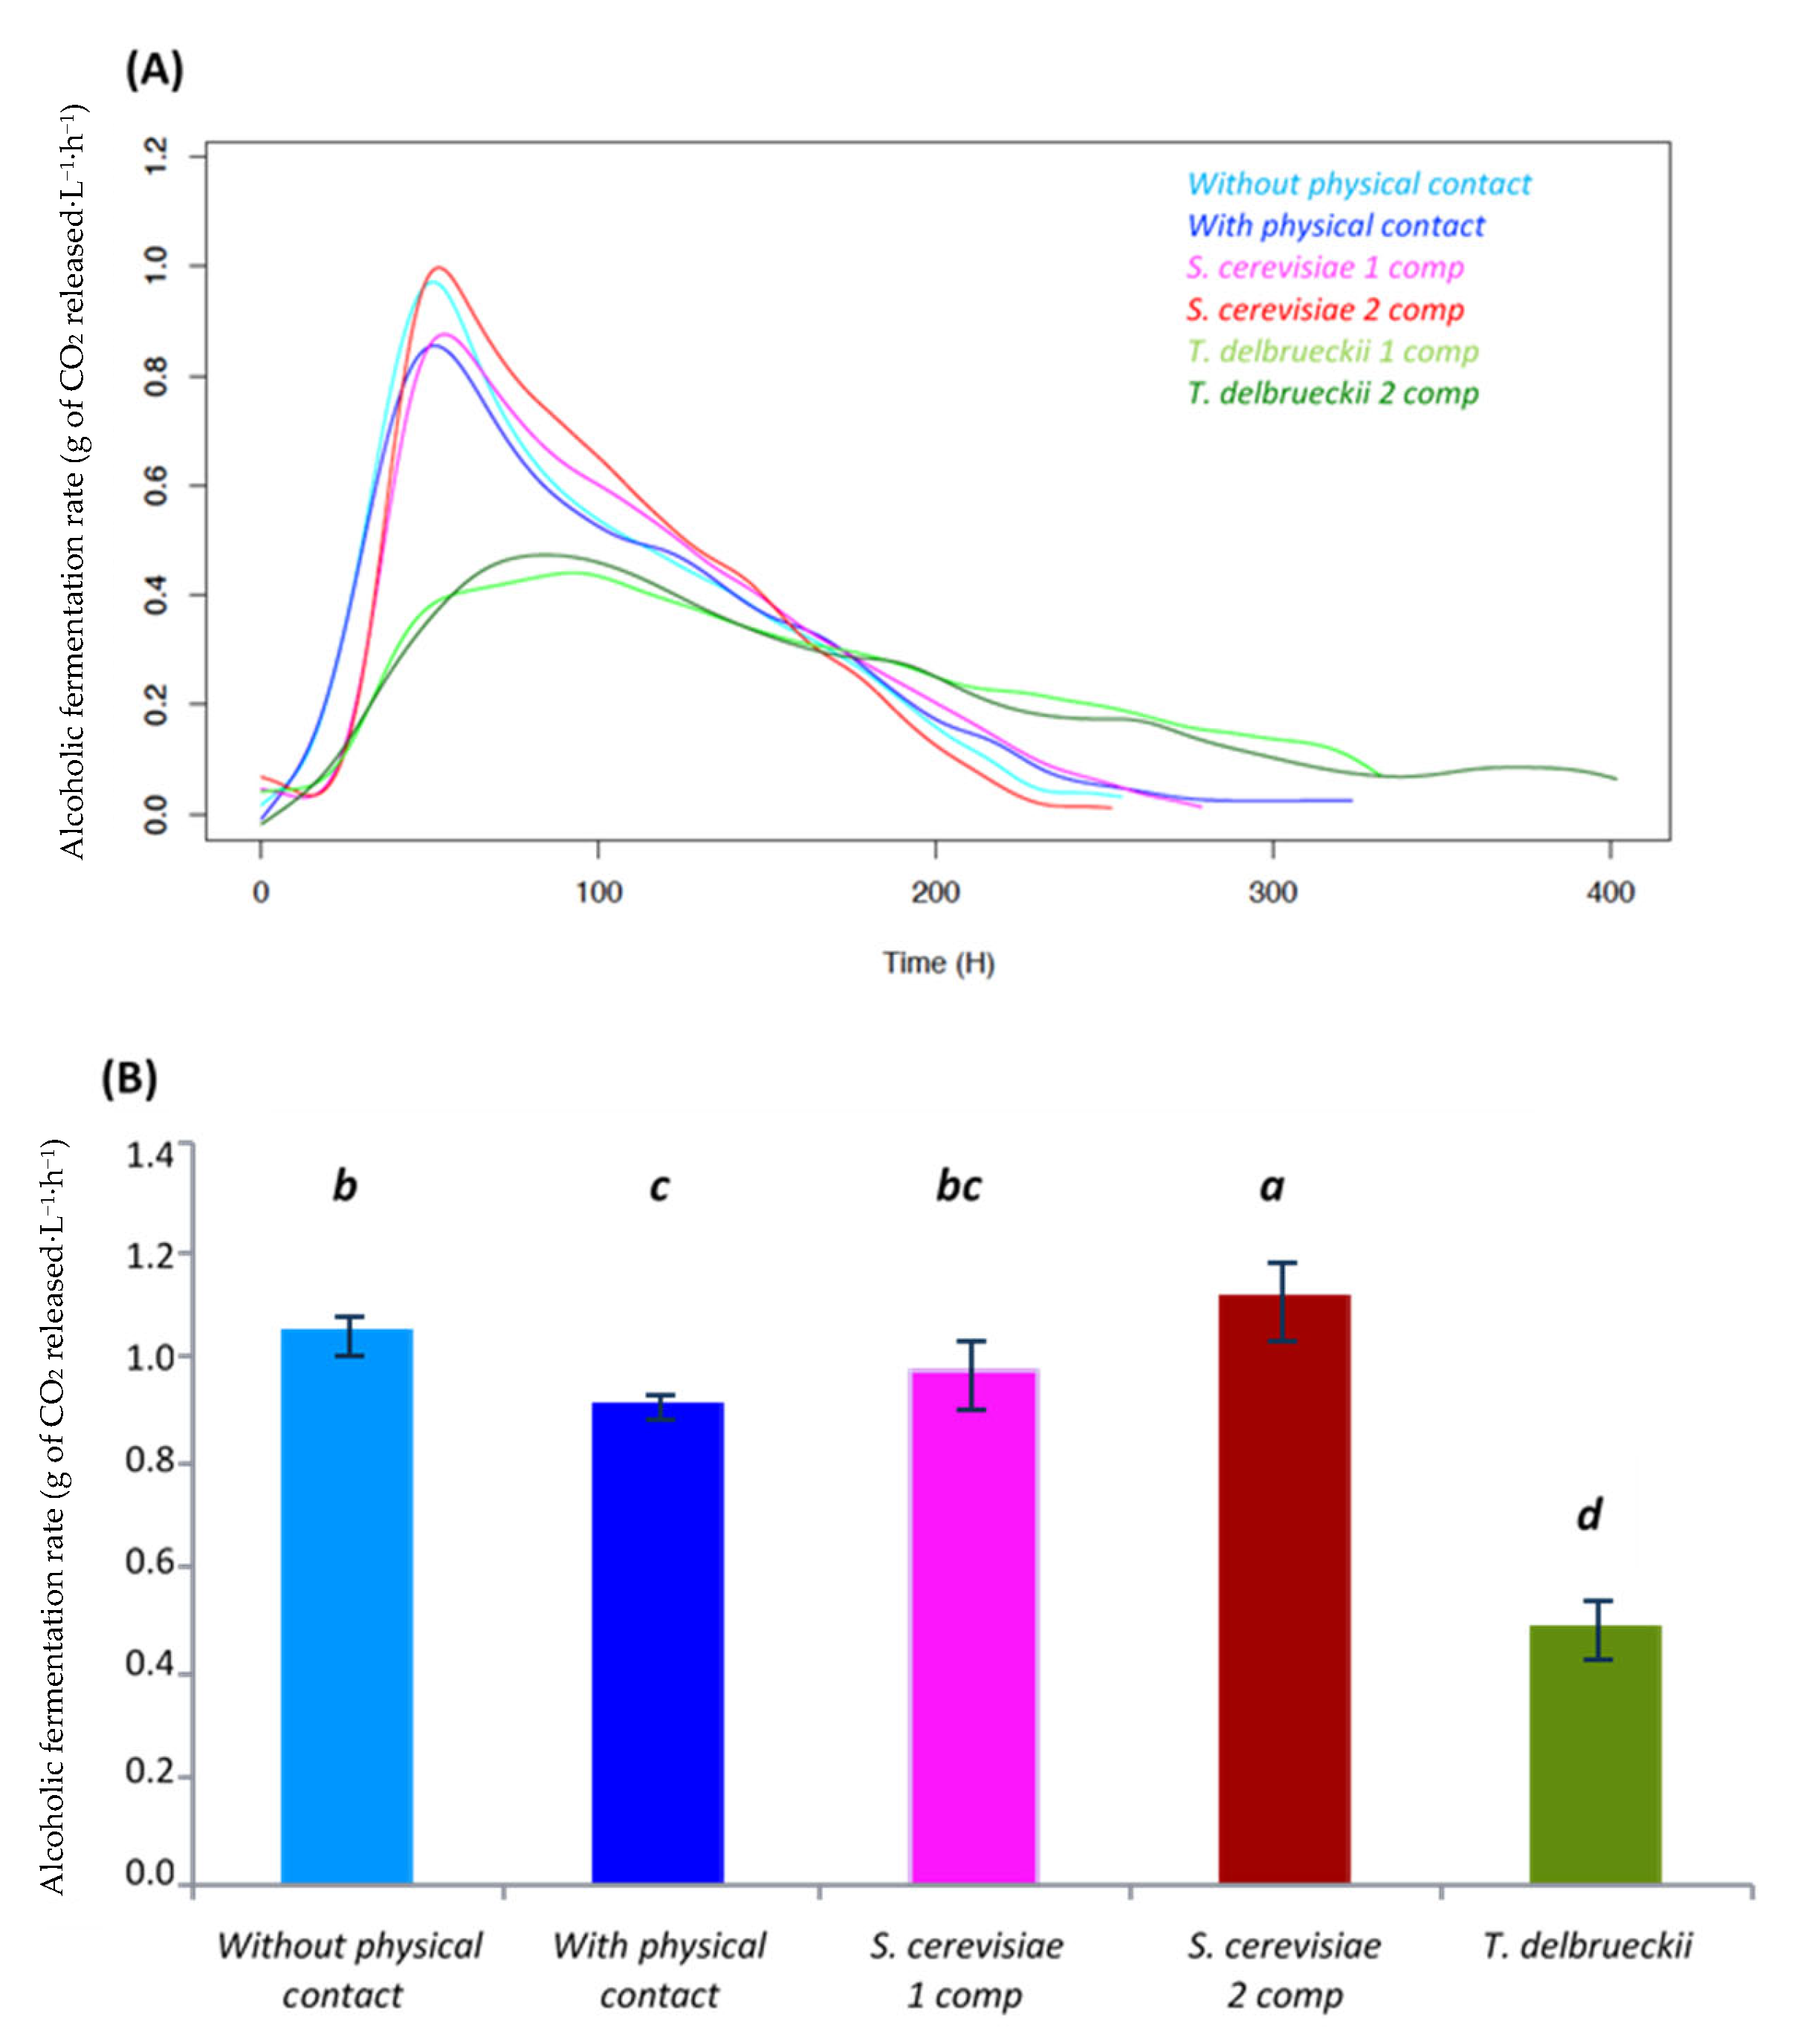
3.1. Analysis of Growth Parameters, Alcoholic Fermentation Kinetics and Wine Composition
3.1.1. Density Effect
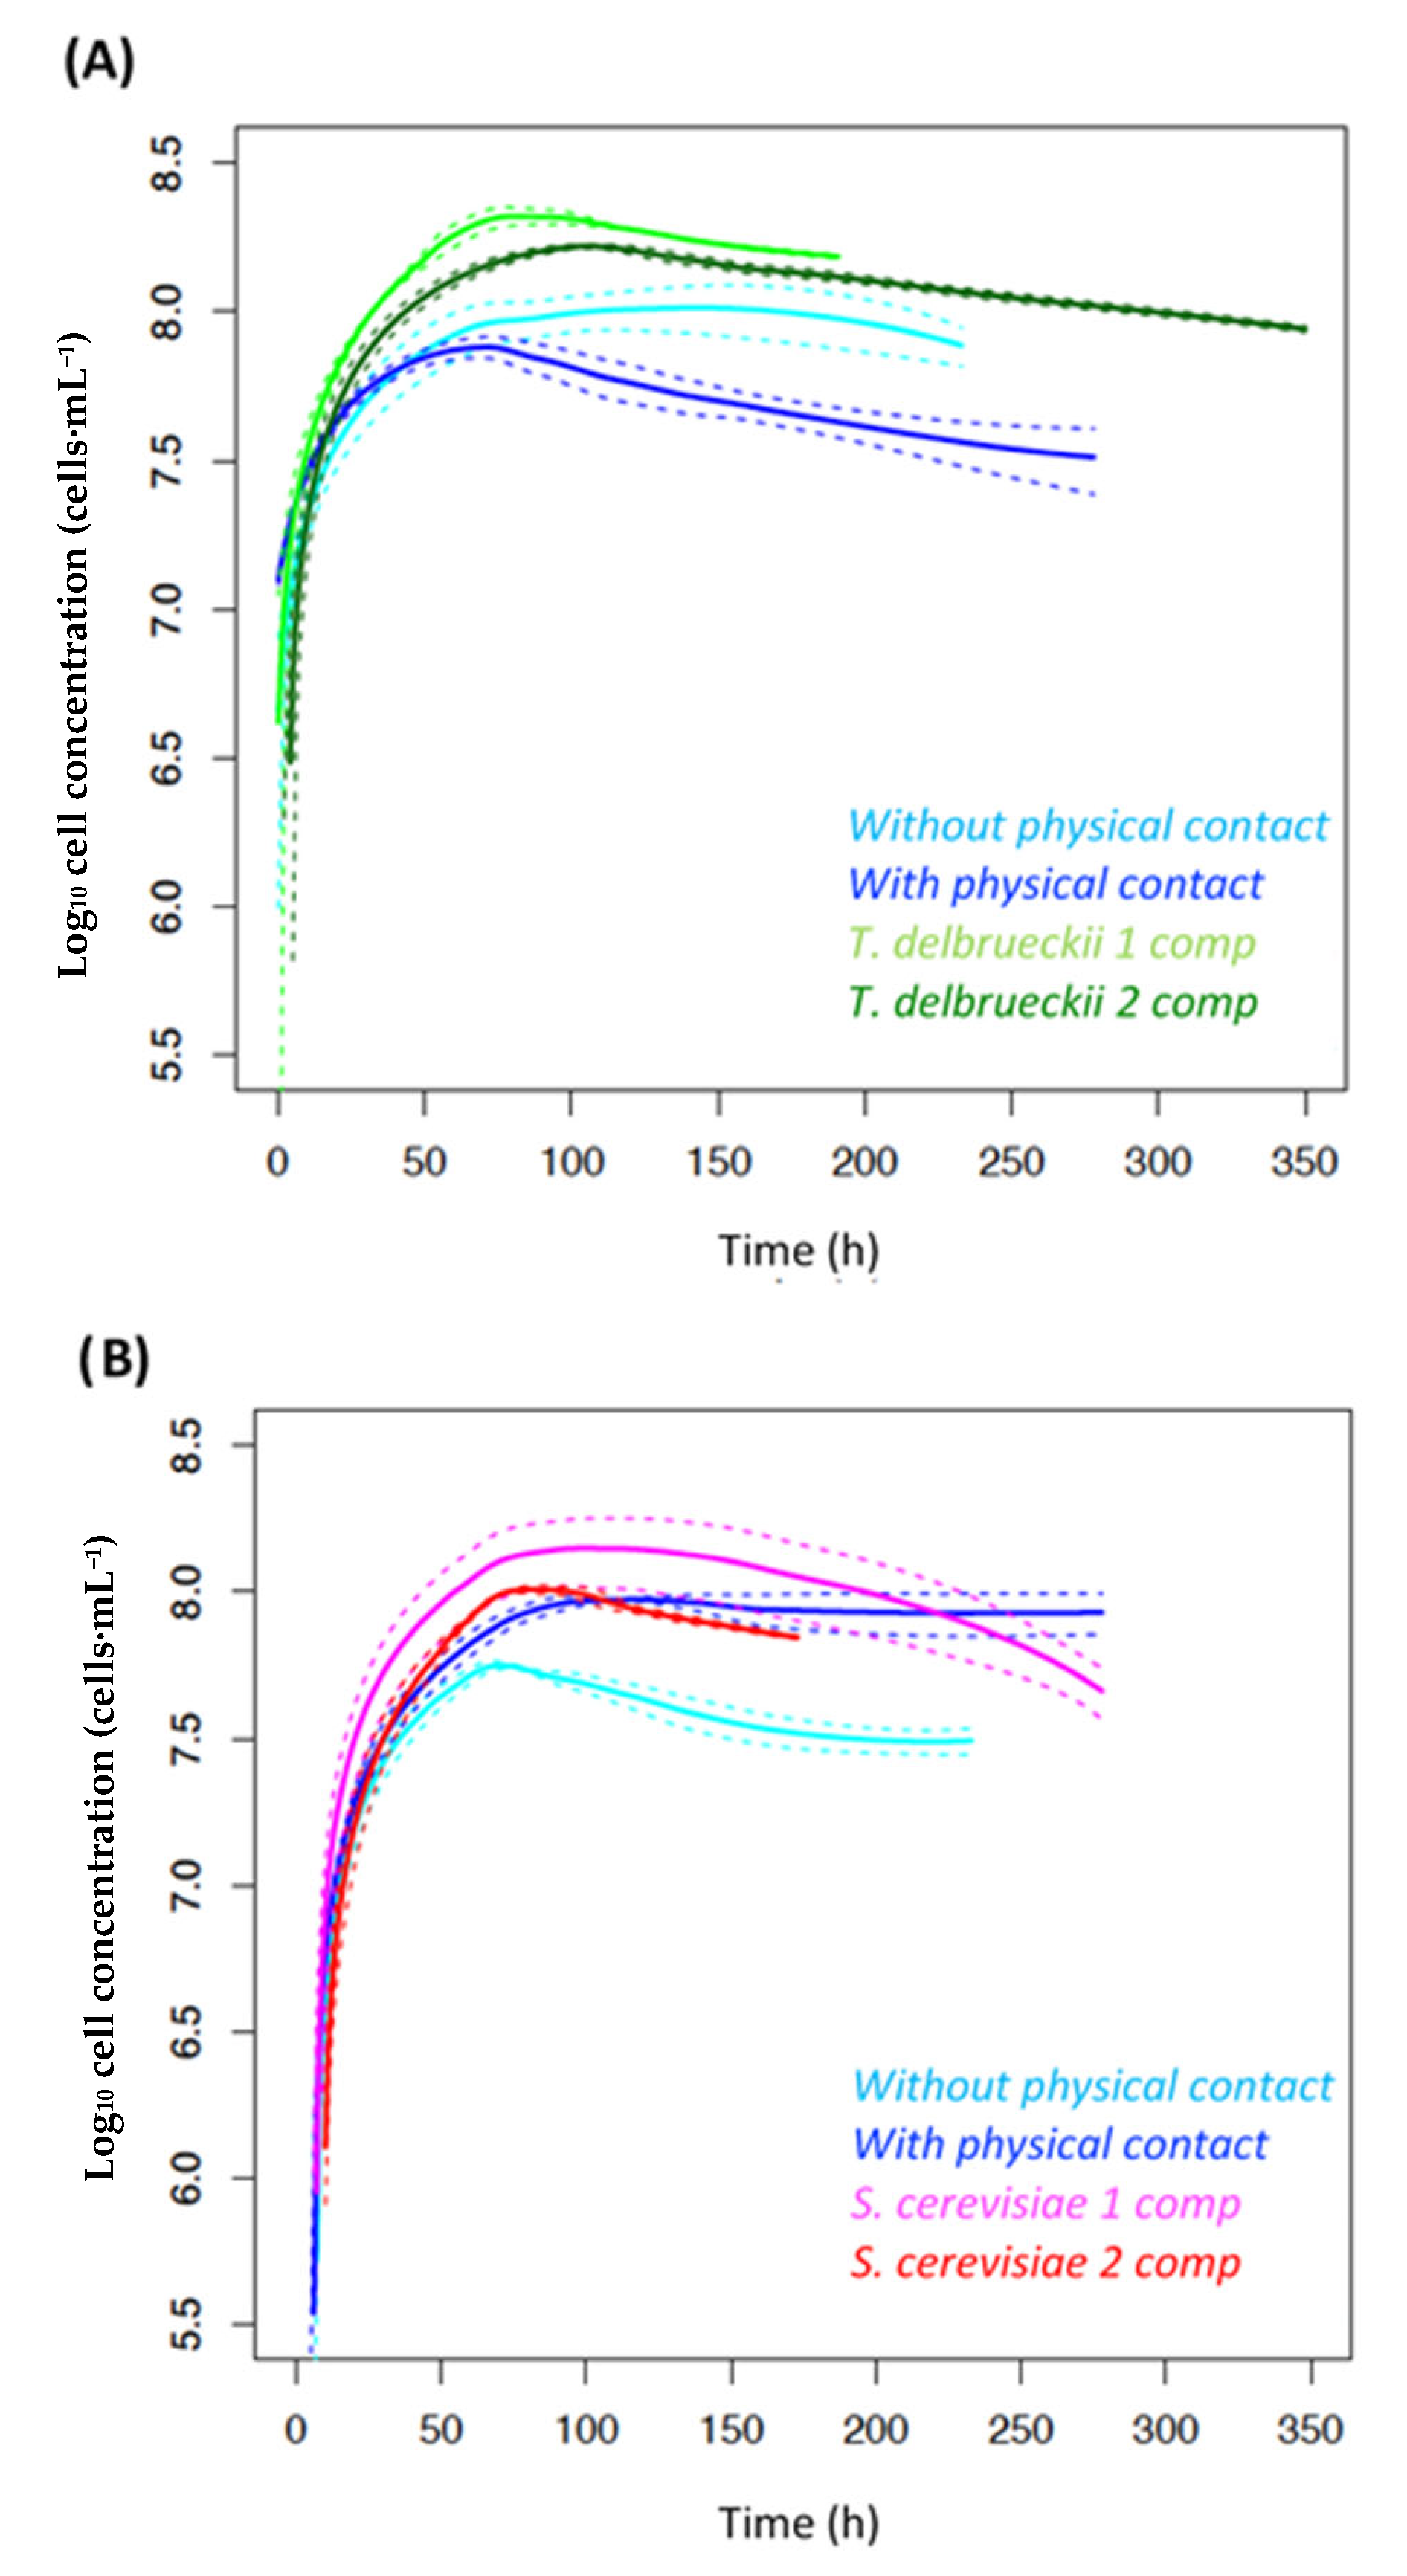
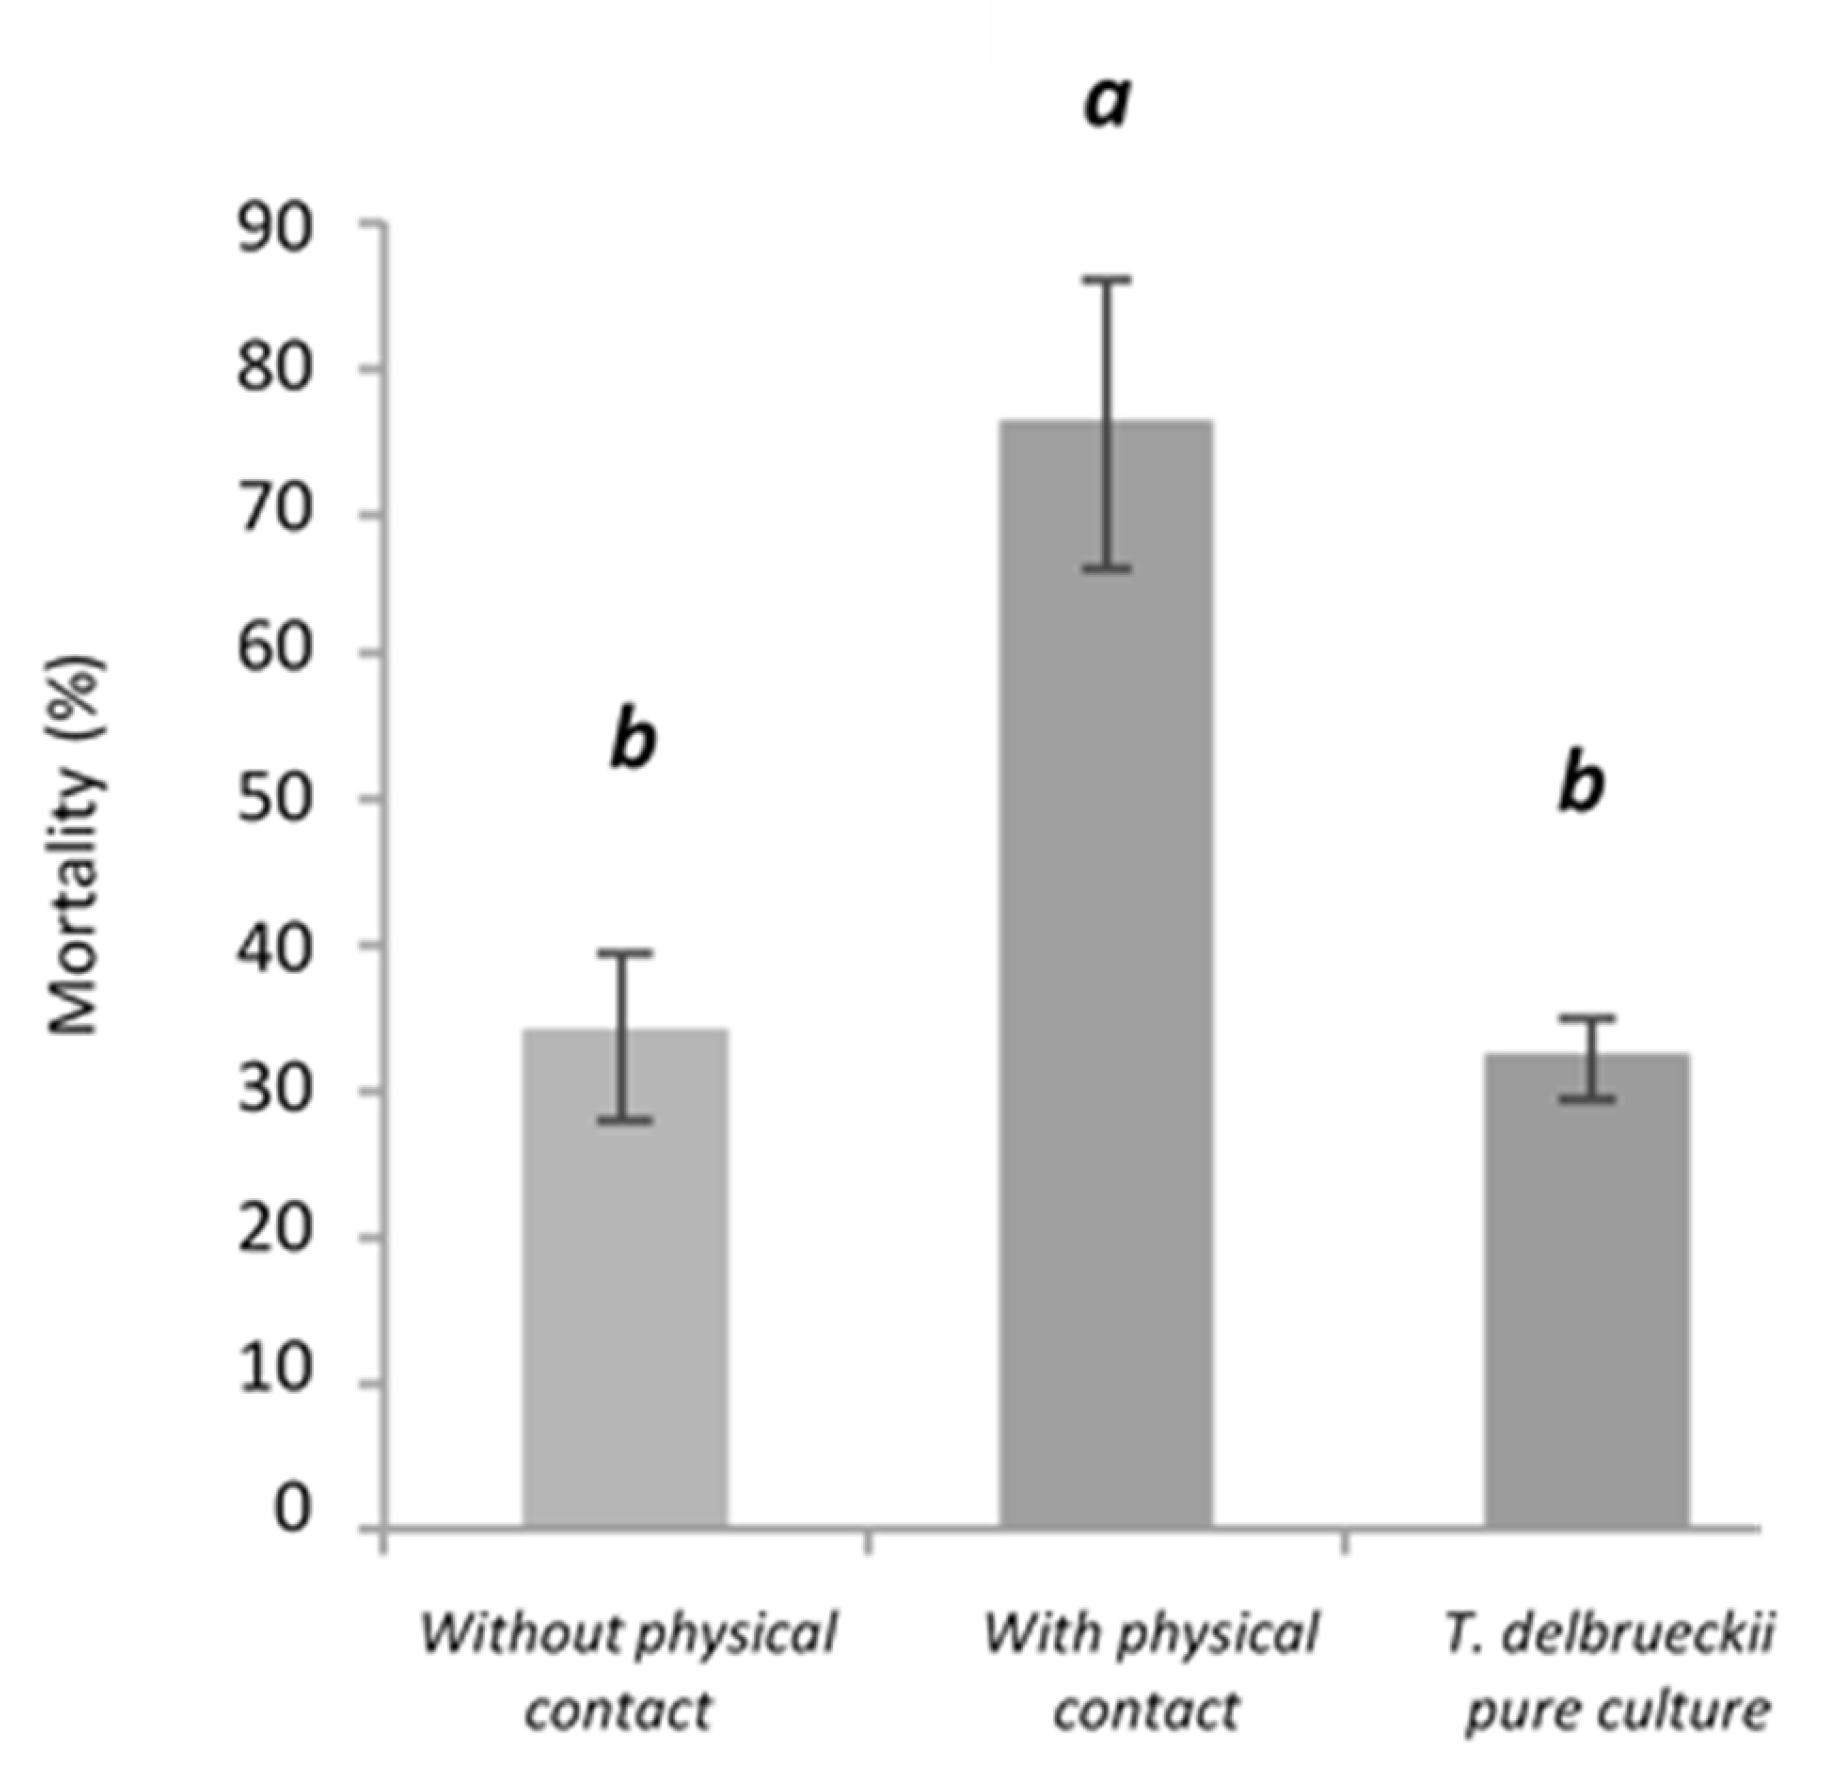
3.1.2. Interactions between T. delbrueckii and S. cerevisiae
- Alcoholic fermentation kinetics
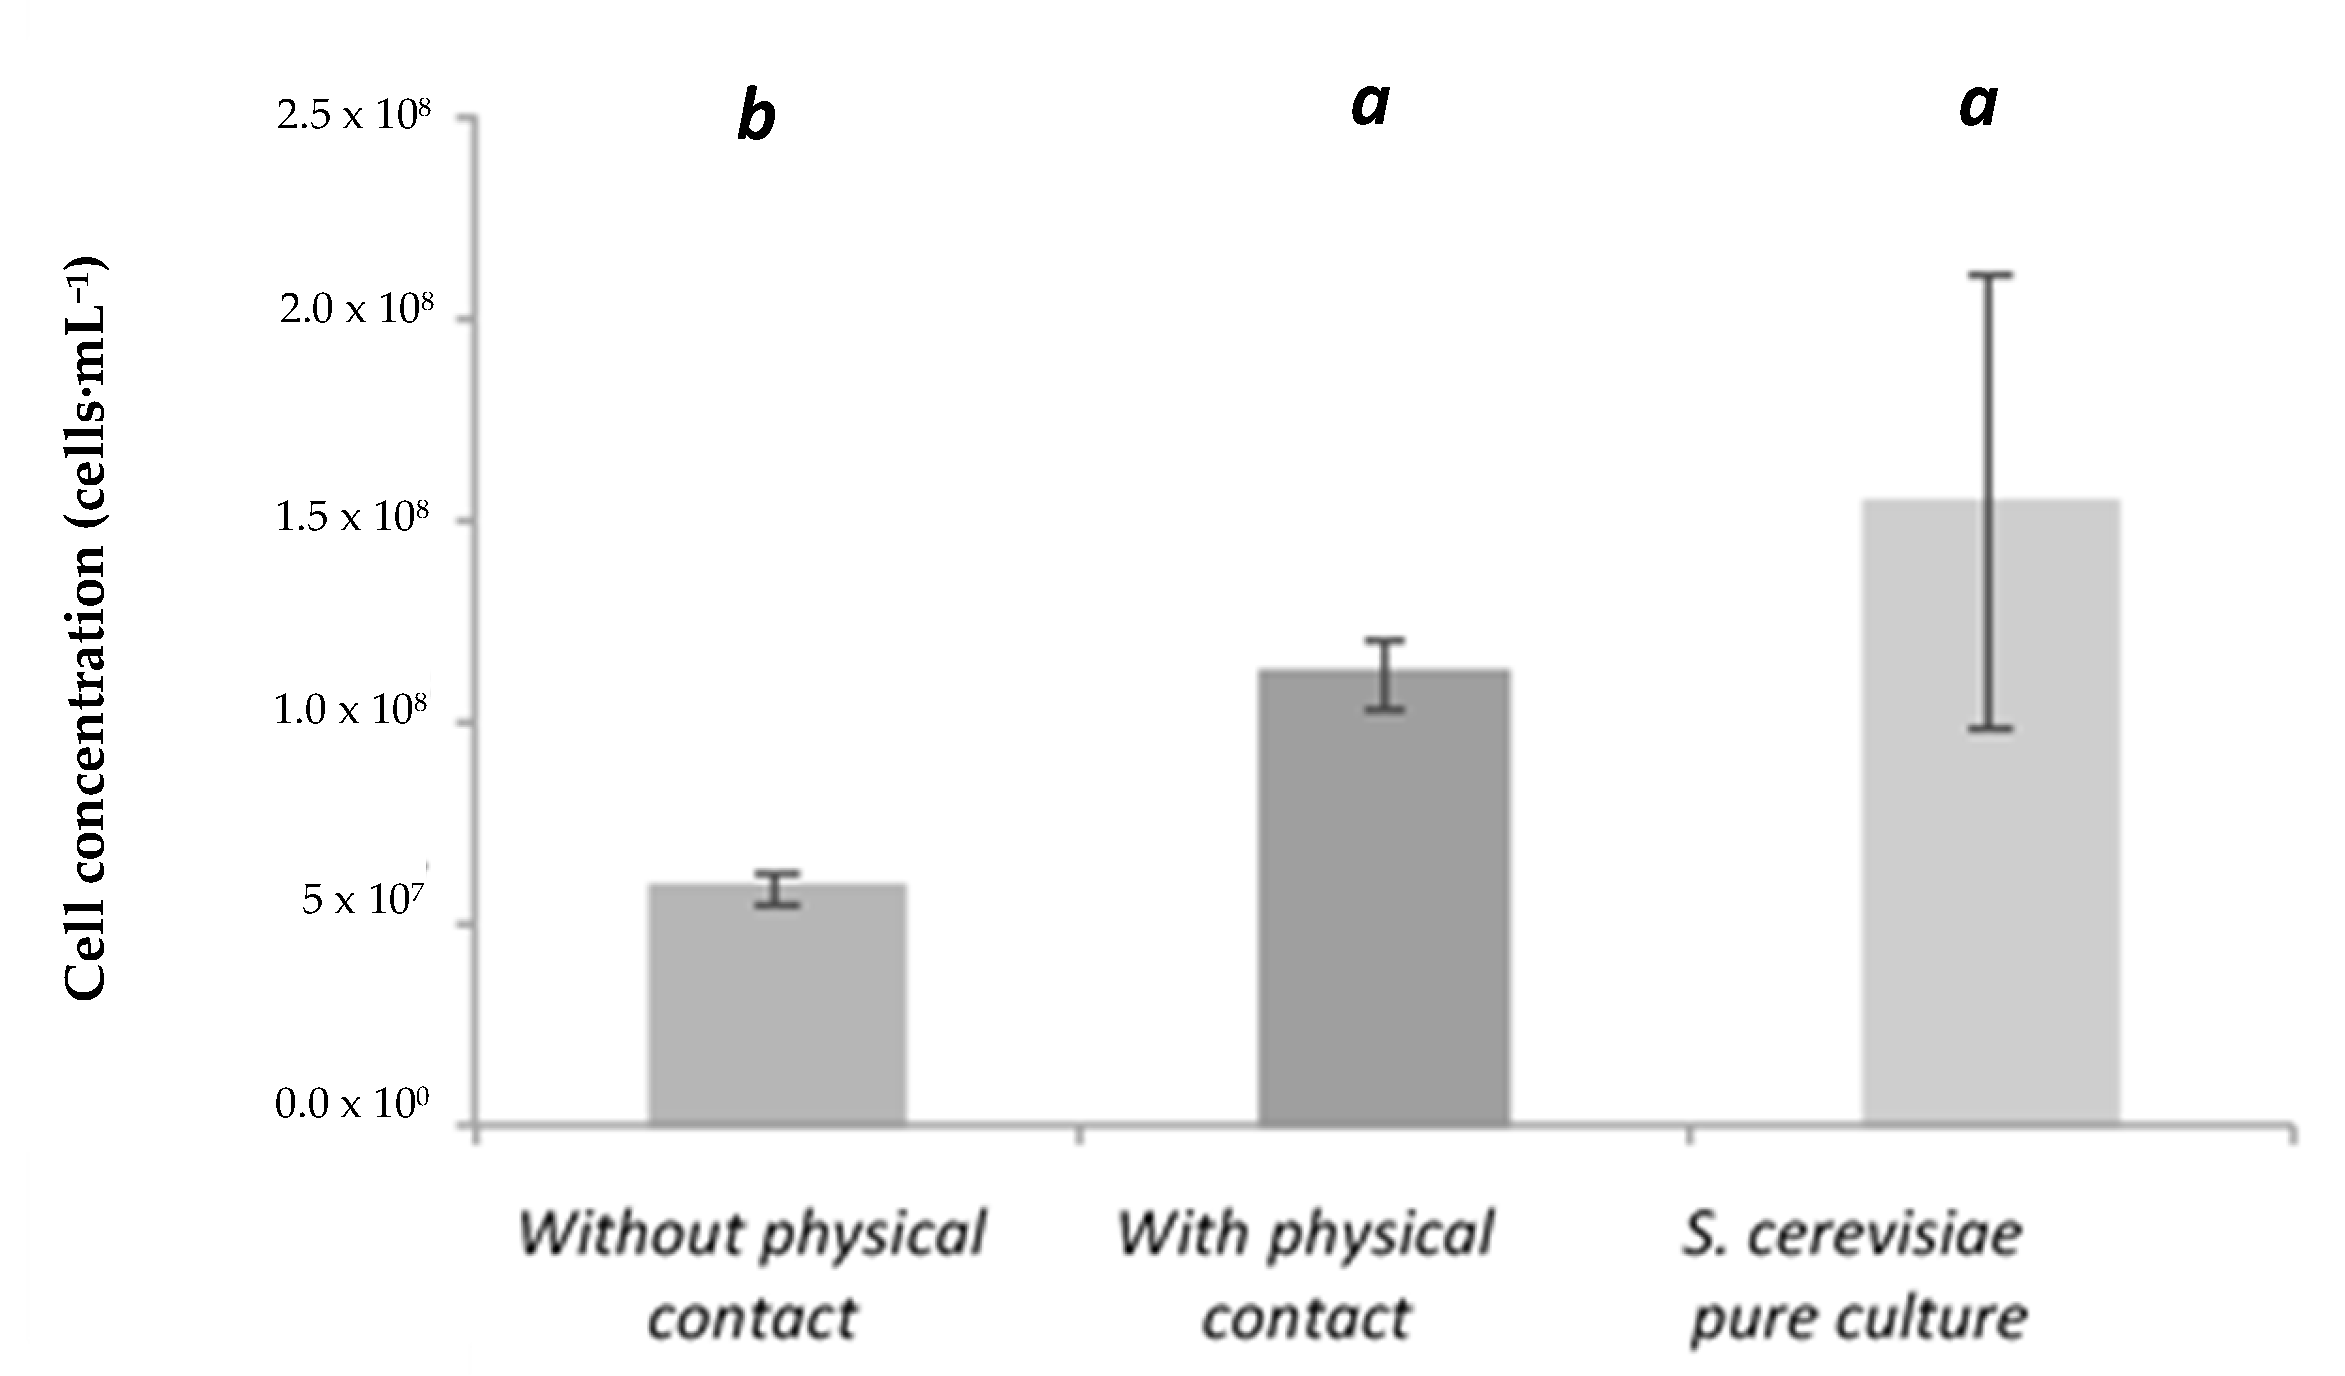
- Growth kinetics
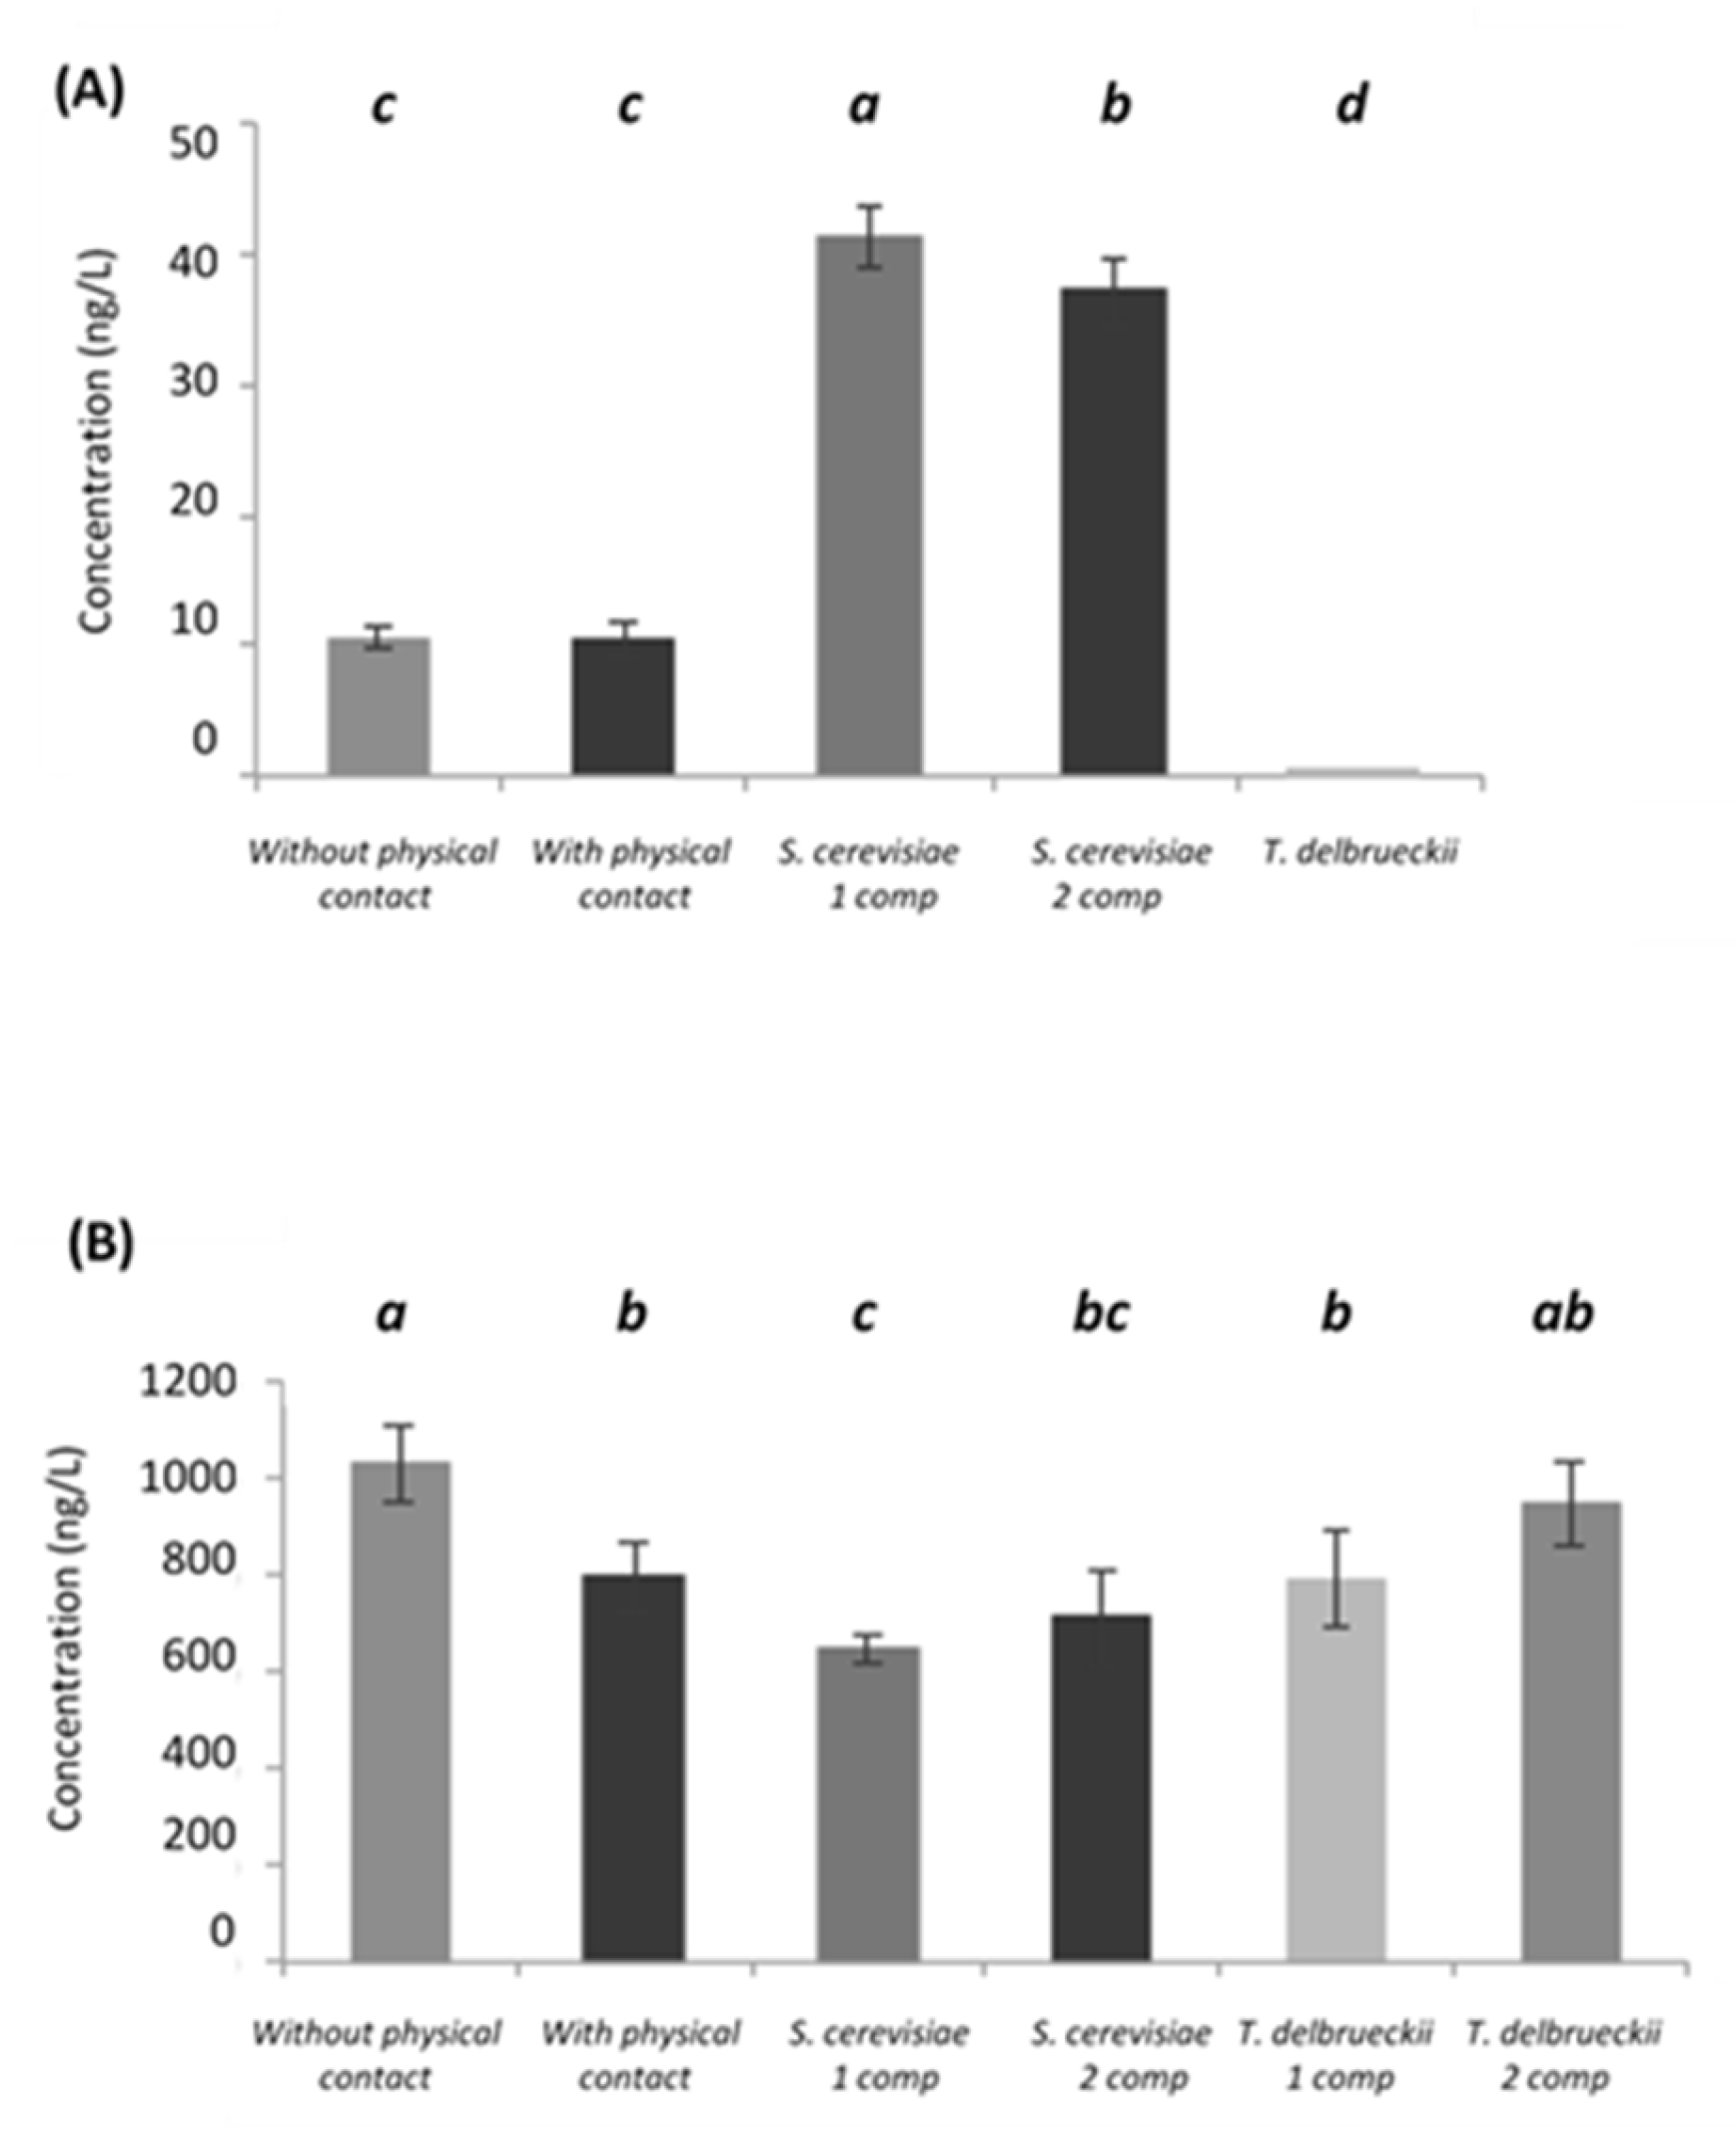
- Volatile thiols
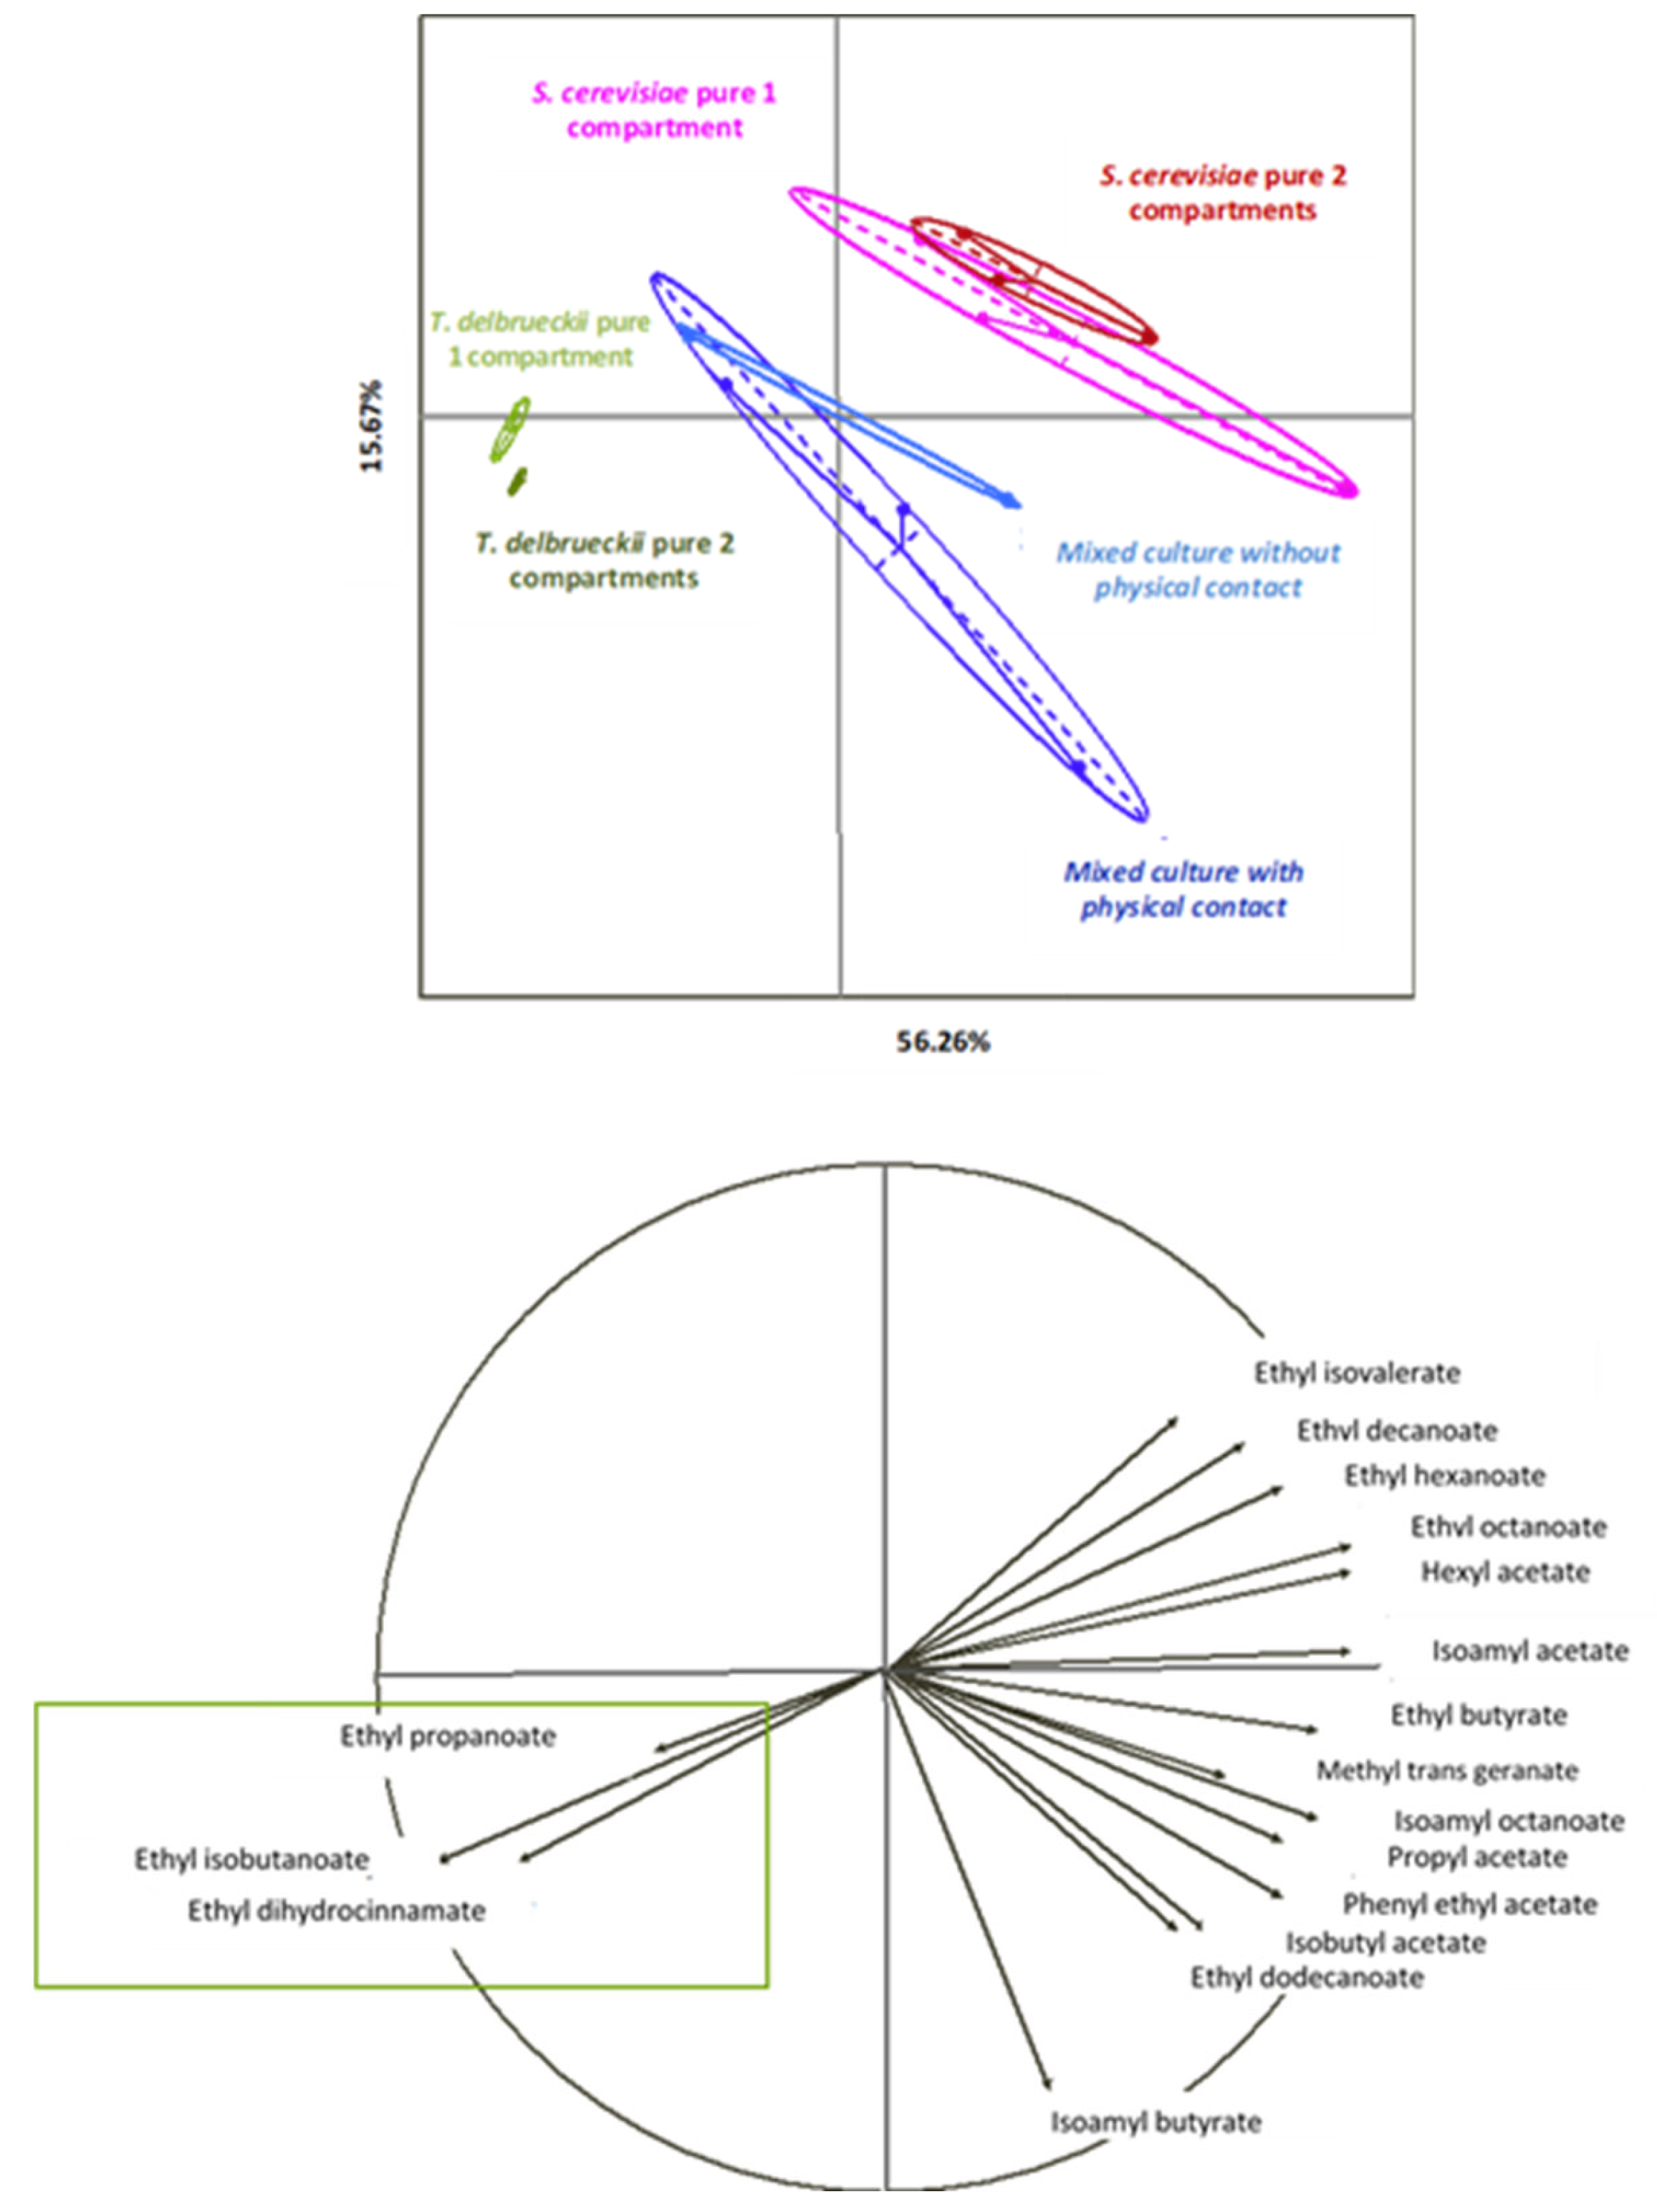
- Esters
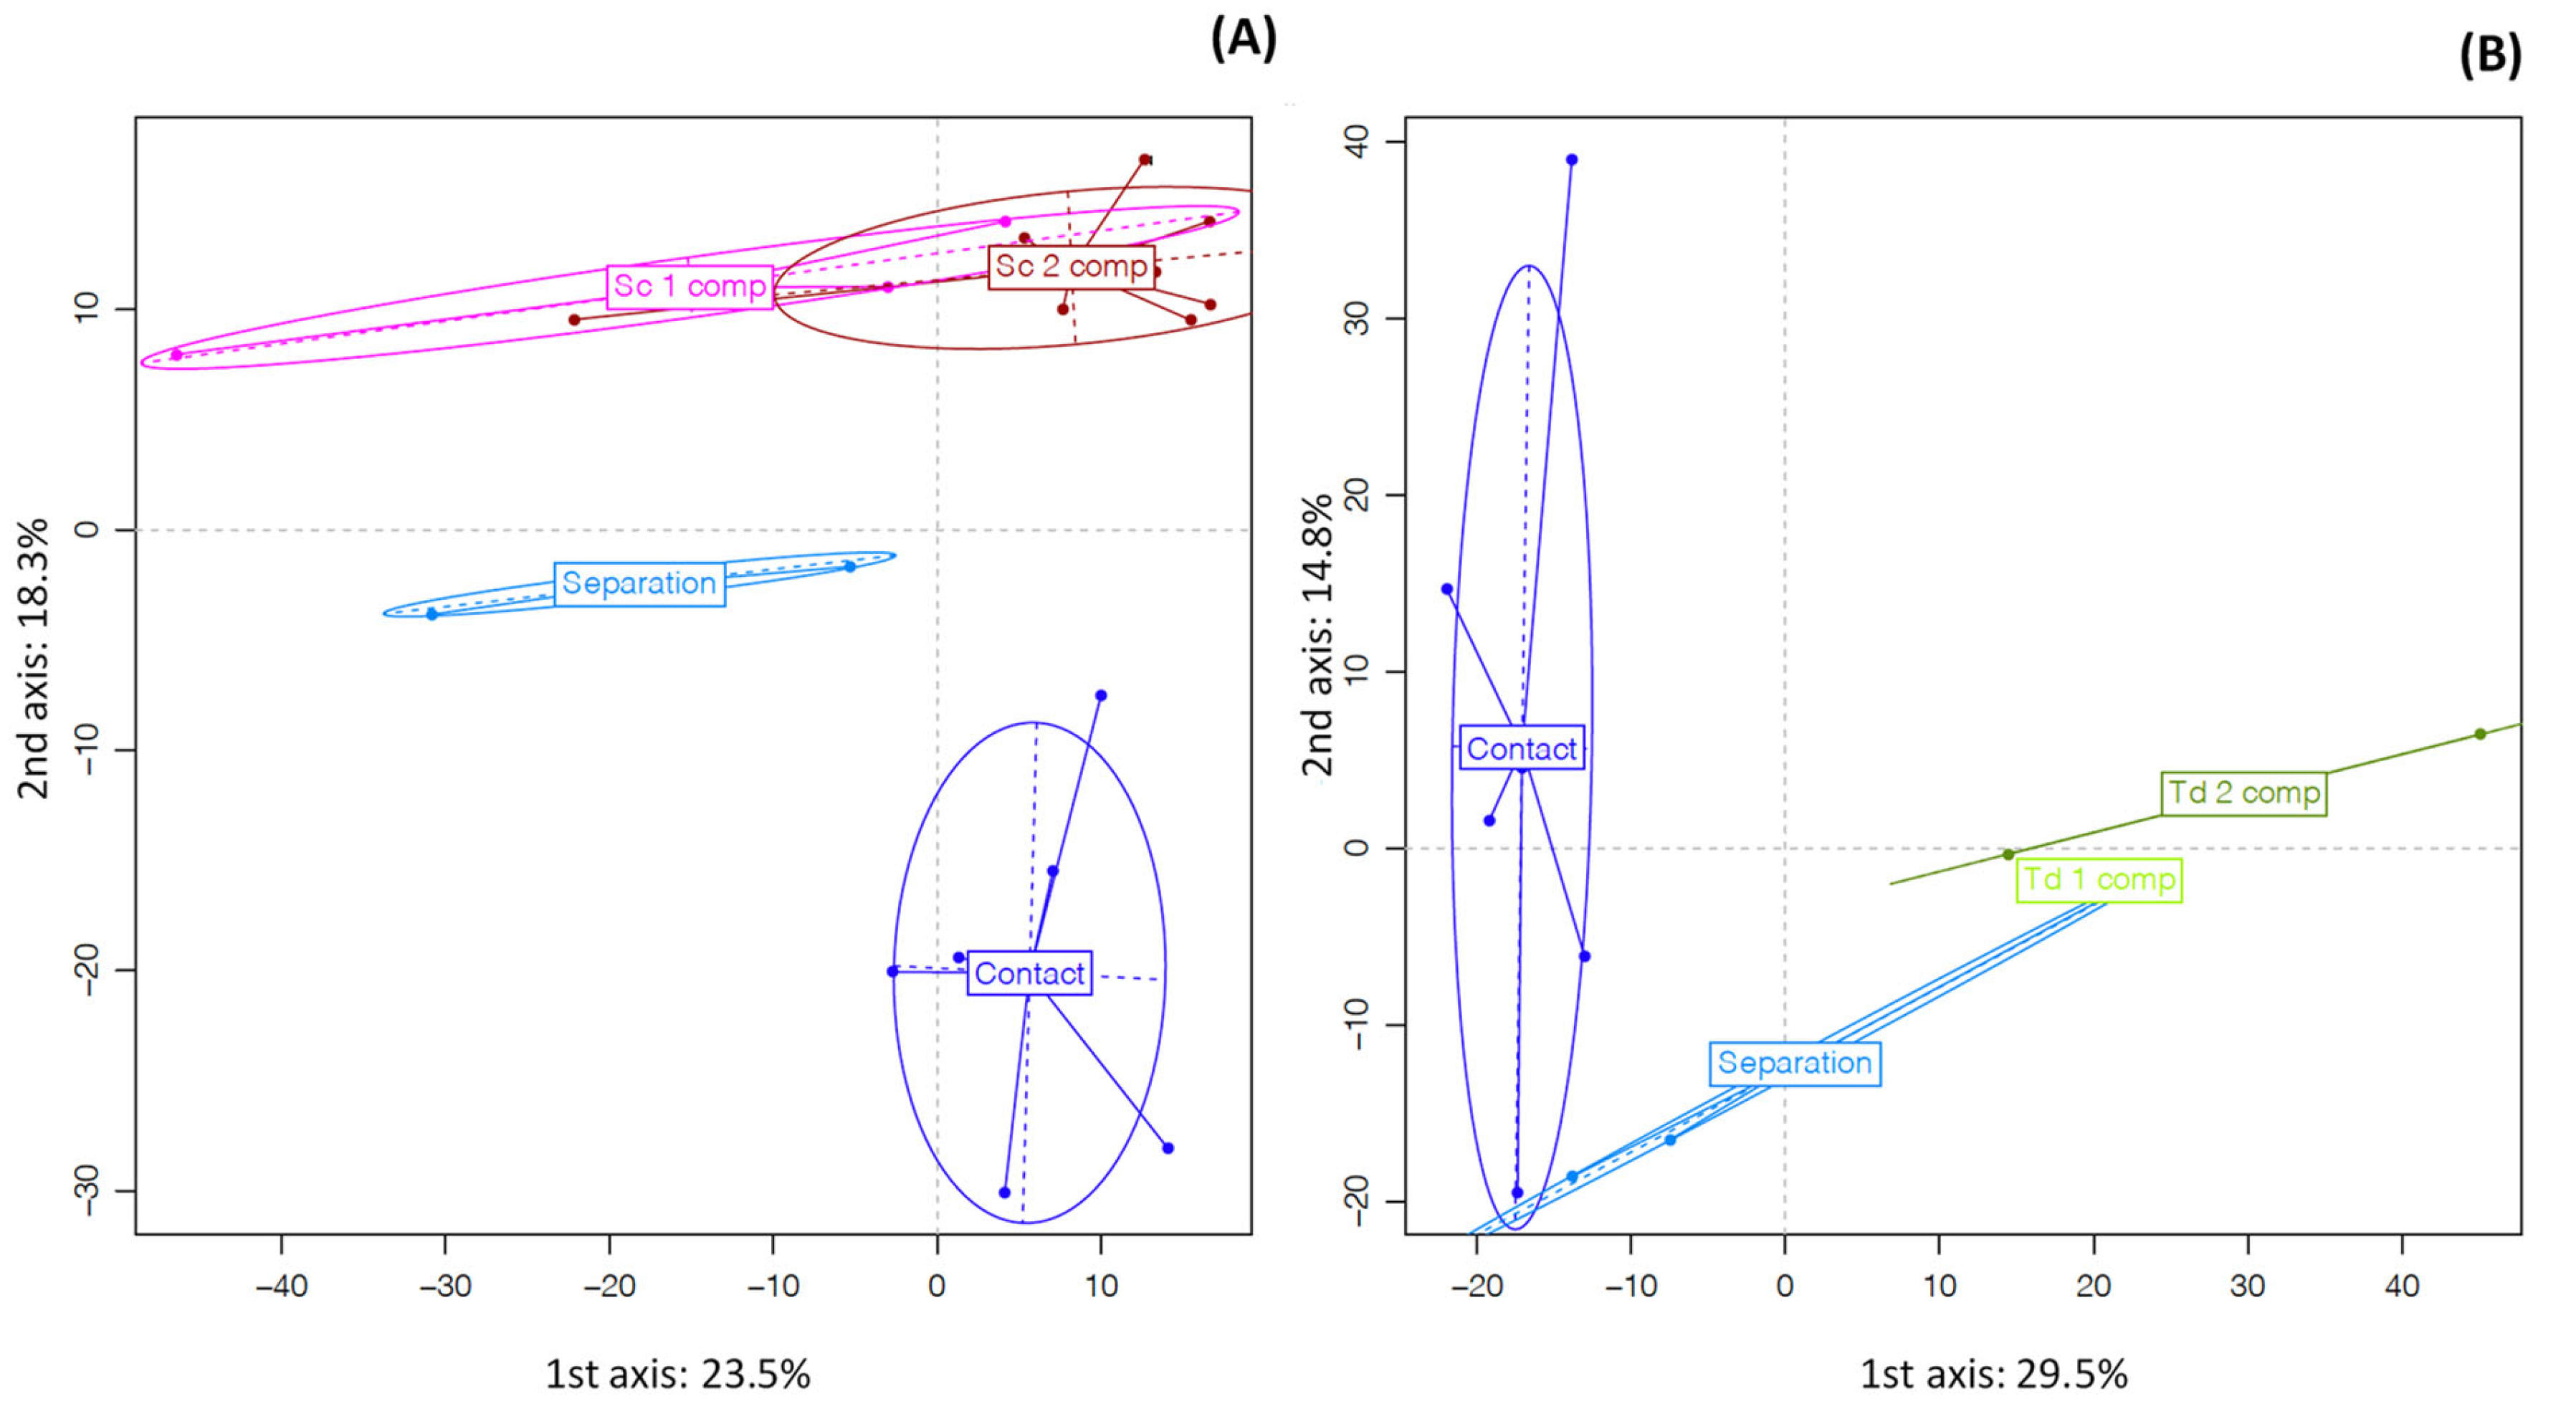
3.2. Proteomic Analysis
4. Discussion
4.1. Interaction Mechanisms between T. delbrueckii and S. cerevisiae
4.1.1. Density Effect
4.1.2. Interaction by Cell–Cell Contact
4.1.3. Volatile Thiol Composition
4.1.4. Ester Composition
4.2. Proteomic Analysis
5. Conclusions
Supplementary Materials
Author Contributions
Funding
Data Availability Statement
Acknowledgments
Conflicts of Interest
References
- Combina, M.; Mercado, L.; Borgo, P.; Elia, A.; Jofre, V.; Ganga, A.; Martinez, C.; Catania, C. Yeasts associated to Malbec grape berries from Mendoza, Argentina. J. Appl. Microbiol. 2005, 98, 1055–1061. [Google Scholar] [CrossRef] [PubMed]
- Fleet, G.H.; Prakitchaiwattana, C.; Beh, A.L.; Heard, G. The yeast ecology of wine grapes. In Biodiversity and Biotecnology of Wine Yeasts; Research Signpost: Ahmedabad, India, 2002; pp. 1–17. [Google Scholar]
- Jolly, N.; Augustyn, O.; Pretorius, I. The Occurrence of Non-Saccharomyces cerevisiae Yeast Species Over Three Vintages in Four Vineyards and Grape Musts from Four Production Regions of the Western Cape, South Africa. S. Afr. J. Enol. Vitic. 2003, 24, 35–42. [Google Scholar] [CrossRef]
- Li, S.-S.; Cheng, C.; Li, Z.; Chen, J.-Y.; Yan, B.; Han, B.-Z.; Reeves, M. Yeast species associated with wine grapes in China. Int. J. Food Microbiol. 2010, 138, 85–90. [Google Scholar] [CrossRef] [PubMed]
- Martini, A.; Ciani, M.; Scorzetti, G. Direct Enumeration and Isolation of Wine Yeasts from Grape Surfaces. Am. J. Enol. Vitic. 1996, 47, 435–440. [Google Scholar] [CrossRef]
- Jemec, K.P.; Cadez, N.; Zagorc, T.; Bubic, V.; Zupec, A.; Raspor, P. Yeast population dynamics in five spontaneous fermentations of Malvasia must. Food Microbiol. 2001, 18, 247–259. [Google Scholar] [CrossRef]
- Zott, K.; Claisse, O.; Lucas, P.; Coulon, J.; Lonvaud-Funel, A.; Masneuf-Pomarede, I. Characterization of the yeast ecosystem in grape must and wine using real-time PCR. Food Microbiol. 2010, 27, 559–567. [Google Scholar] [CrossRef]
- Vejarano, R.; Gil-Calderón, A. Commercially Available Non-Saccharomyces Yeasts for Winemaking: Current Market, Advantages over Saccharomyces, Biocompatibility, and Safety. Fermentation 2021, 7, 171. [Google Scholar] [CrossRef]
- Balmaseda, A.; Rozès, N.; Bordons, A.; Reguant, C. The use of Torulaspora delbrueckii to improve malolactic fermentation. Microb. Biotechnol. 2023. online ahead of print. [Google Scholar] [CrossRef]
- Renault, P.; Miot-Sertier, C.; Marullo, P.; Hernández-Orte, P.; Lagarrigue, L.; Lonvaud-Funel, A.; Bely, M. Genetic characterization and phenotypic variability in Torulaspora delbrueckii species: Potential applications in the wine industry. Int. J. Food Microbiol. 2009, 134, 201–210. [Google Scholar] [CrossRef]
- Herraiz, T.; Reglero, G.; Herraiz, M.; Martin-Alvarez, P.J.; Cabezudo, M.D. The Influence of the Yeast and Type of Culture on the Volatile Composition of Wines Fermented without Sulfur Dioxide. Am. J. Enol. Vitic. 1990, 41, 313–318. [Google Scholar] [CrossRef]
- Ciani, M.; Beco, L.; Comitini, F. Fermentation behaviour and metabolic interactions of multistarter wine yeast fermentations. Int. J. Food Microbiol. 2006, 108, 239–245. [Google Scholar] [CrossRef] [PubMed]
- Bely, M.; Stoeckle, P.; Masneuf-Pomarède, I.; Dubourdieu, D. Impact of mixed Torulaspora delbrueckii–Saccharomyces cerevisiae culture on high-sugar fermentation. Int. J. Food Microbiol. 2008, 122, 312–320. [Google Scholar] [CrossRef] [PubMed]
- Sadoudi, M.; Tourdot-Maréchal, R.; Rousseaux, S.; Steyer, D.; Gallardo-Chacón, J.-J.; Ballester, J.; Vichi, S.; Guérin-Schneider, R.; Caixach, J.; Alexandre, H. Yeast–yeast interactions revealed by aromatic profile analysis of Sauvignon Blanc wine fermented by single or co-culture of non-Saccharomyces and Saccharomyces yeasts. Food Microbiol. 2012, 32, 243–253. [Google Scholar] [CrossRef] [PubMed]
- Azzolini, M.; Tosi, E.; Lorenzini, M.; Finato, F.; Zapparoli, G. Contribution to the aroma of white wines by controlled Torulaspora delbrueckii cultures in association with Saccharomyces cerevisiae. World J. Microbiol. Biotechnol. 2014, 31, 277–293. [Google Scholar] [CrossRef] [PubMed]
- Renault, P.; Coulon, J.; de Revel, G.; Barbe, J.-C.; Bely, M. Increase of fruity aroma during mixed T. delbrueckii/S. cerevisiae wine fermentation is linked to specific esters enhancement. Int. J. Food Microbiol. 2015, 207, 40–48. [Google Scholar] [CrossRef]
- Benito, S. The impact of Torulaspora delbrueckii yeast in winemaking. Appl. Microbiol. Biotechnol. 2018, 102, 3081–3094. [Google Scholar] [CrossRef]
- Zhang, B.-Q.; Luan, Y.; Duan, C.-Q.; Yan, G.-L. Use of Torulaspora delbrueckii Co-fermentation with Two Saccharomyces cerevisiae Strains with Different Aromatic Characteristic to Improve the Diversity of Red Wine Aroma Profile. Front. Microbiol. 2018, 9, 606. [Google Scholar] [CrossRef]
- Vejarano, R. Non-Saccharomyces in Winemaking: Source of Mannoproteins, Nitrogen, Enzymes, and Antimicrobial Compounds. Fermentation 2020, 6, 76. [Google Scholar] [CrossRef]
- Domizio, P.; Liu, Y.; Bisson, L.; Barile, D. Use of non-Saccharomyces wine yeasts as novel sources of mannoproteins in wine. Food Microbiol. 2014, 43, 5–15. [Google Scholar] [CrossRef]
- Ciani, M.; Comitini, F.; Mannazzu, I.; Domizio, P. Controlled mixed culture fermentation: A new perspective on the use of non-Saccharomyces yeasts in winemaking. FEMS Yeast Res. 2010, 10, 123–133. [Google Scholar] [CrossRef]
- Fleet, G. Yeasts interactions and wine flavour. Int. J. Food Microbiol. 2003, 86, 11–22. [Google Scholar] [CrossRef] [PubMed]
- Conacher, C.G.; Rossouw, D.; Bauer, F.F.B. Peer pressure: Evolutionary responses to biotic pressures in wine yeasts. FEMS Yeast Res. 2019, 19, foz072. [Google Scholar] [CrossRef] [PubMed]
- Bordet, F.; Joran, A.; Klein, G.; Roullier-Gall, C.; Alexandre, H. Yeast–Yeast Interactions: Mechanisms, Methodologies and Impact on Composition. Microorganisms 2020, 8, 600. [Google Scholar] [CrossRef] [PubMed]
- Bisson, L. Stuck and Sluggish Fermentations. Am. J. Enol. Vitic. 1999, 50, 107–119. [Google Scholar] [CrossRef]
- Medina, K.; Boido, E.; Dellacassa, E.; Carrau, F. Growth of non-Saccharomyces yeasts affects nutrient availability for Saccharomyces cerevisiae during wine fermentation. Int. J. Food Microbiol. 2012, 157, 245–250. [Google Scholar] [CrossRef]
- Nissen, P.; Nielsen, D.; Arneborg, N. Viable Saccharomyces cerevisiae cells at high concentrations cause early growth arrest of non-Saccharomyces yeasts in mixed cultures by a cell-cell contact-mediated mechanism. Yeast 2003, 20, 331–341. [Google Scholar] [CrossRef]
- Nissen, P.; Arneborg, N. Characterization of early deaths of non-Saccharomyces yeasts in mixed cultures with Saccharomyces cerevisiae. Arch. Microbiol. 2003, 180, 257–263. [Google Scholar] [CrossRef]
- Renault, P.E.; Albertin, W.; Bely, M. An innovative tool reveals interaction mechanisms among yeast populations under oenological conditions. Appl. Microbiol. Biotechnol. 2013, 97, 4105–4119. [Google Scholar] [CrossRef]
- Taillandier, P.; Lai, Q.P.; Julien-Ortiz, A.; Brandam, C. Interactions between Torulaspora delbrueckii and Saccharomyces cerevisiae in wine fermentation: Influence of inoculation and nitrogen content. World J. Microbiol. Biotechnol. 2014, 30, 1959–1967. [Google Scholar] [CrossRef]
- Tronchoni, J.; Curiel, J.A.; Morales, P.; Torres-Pérez, R.; Gonzalez, R. Early transcriptional response to biotic stress in mixed starter fermentations involving Saccharomyces cerevisiae and Torulaspora delbrueckii. Int. J. Food Microbiol. 2017, 241, 60–68. [Google Scholar] [CrossRef]
- Curiel, J.A.; Morales, P.; Gonzalez, R.; Tronchoni, J. Different Non-Saccharomyces Yeast Species Stimulate Nutrient Consumption in S. cerevisiae Mixed Cultures. Front. Microbiol. 2017, 8, 2121. [Google Scholar] [CrossRef] [PubMed]
- Conacher, C.G.; Naidoo-Blassoples, R.K.; Rossouw, D.; Bauer, F.F. A Transcriptomic Analysis of Higher-Order Ecological Interactions in a Eukaryotic Model Microbial Ecosystem. mSphere 2022, 7, e0043622. [Google Scholar] [CrossRef] [PubMed]
- Bely, M.; Sablayrolles, J.M.; Barre, P. Description of Alcoholic Fermentation Kinetics: Its Variability and Significance. Am. J. Enol. Vitic. 1990, 41, 319–324. [Google Scholar] [CrossRef]
- Bely, M.; Sablayrolles, J.-M.; Barre, P. Automatic detection of assimilable nitrogen deficiencies during alcoholic fermentation in oenological conditions. J. Ferment. Bioeng. 1990, 70, 246–252. [Google Scholar] [CrossRef]
- Tominaga, T.; Dubourdieu, D. A Novel Method for Quantification of 2-Methyl-3-furanthiol and 2-Furanmethanethiol in Wines Made from Vitis vinifera Grape Varieties. J. Agric. Food Chem. 2005, 54, 29–33. [Google Scholar] [CrossRef] [PubMed]
- Tominaga, T.; des Gachons, C.P.; Dubourdieu, D. A new type of flavor precursors in Vitis vinifera L. cv. Sauvignon blanc: S-cysteine conjugates. J. Agric. Food Chem. 1998, 46, 5215–5219. [Google Scholar] [CrossRef]
- Tominaga, T.; Baltenweck-Guyot, R.; Gachons, C.P.D.; Dubourdieu, D. Contribution of Volatile Thiols to the Aromas of White Wines Made from Several Vitis vinifera Grape Varieties. Am. J. Enol. Vitic. 2000, 51, 178–181. [Google Scholar] [CrossRef]
- Antalick, G.; Perello, M.-C.; de Revel, G. Development, validation and application of a specific method for the quantitative determination of wine esters by headspace-solid-phase microextraction-gas chromatography-mass spectrometry. Food Chem. 2010, 121, 1236–1245. [Google Scholar] [CrossRef]
- Pate, J.B.; Lodge, J.P.; Wartburg, A.F. Effect of Pararosaniline in the Trace Determination of Sulfur Dioxide. Anal. Chem. 1962, 34, 1660–1662. [Google Scholar] [CrossRef]
- Blein-Nicolas, M.; Albertin, W.; Valot, B.; Marullo, P.; Sicard, D.; Giraud, C.; Huet, S.; Bourgais, A.; Dillmann, C.; de Vienne, D.; et al. Yeast Proteome Variations Reveal Different Adaptive Responses to Grape Must Fermentation. Mol. Biol. Evol. 2013, 30, 1368–1383. [Google Scholar] [CrossRef]
- Kessner, D.; Chambers, M.; Burke, R.; Agus, D.; Mallick, P. ProteoWizard: Open source software for rapid proteomics tools development. Bioinformatics 2008, 24, 2534–2536. [Google Scholar] [CrossRef] [PubMed]
- Perez-Riverol, Y.; Vizcaíno, J.A.; Griss, J. Future Prospects of Spectral Clustering Approaches in Proteomics. Proteomics 2018, 18, e1700454. [Google Scholar] [CrossRef] [PubMed]
- Langella, O.; Valot, B.; Balliau, T.; Blein-Nicolas, M.; Bonhomme, L.; Zivy, M. X!TandemPipeline: A Tool to Manage Sequence Redundancy for Protein Inference and Phosphosite Identification. J. Proteome Res. 2016, 16, 494–503. [Google Scholar] [CrossRef] [PubMed]
- Valot, B.; Langella, O.; Nano, E.; Zivy, M. MassChroQ: A versatile tool for mass spectrometry quantification. Proteomics 2011, 11, 3572–3577. [Google Scholar] [CrossRef] [PubMed]
- Dray, S.; Dufour, A.-B. Theade4Package: Implementing the Duality Diagram for Ecologists. J. Stat. Softw. 2007, 22, 1–20. [Google Scholar] [CrossRef]
- Benjamini, Y.; Hochberg, Y. Controlling the False Discovery Rate: A Practical and Powerful Approach to Multiple Testing. J. R. Stat. Soc. Ser. B Methodol. 1995, 57, 289–300. [Google Scholar] [CrossRef]
- Yu, G.; He, Q.-Y. ReactomePA: An R/Bioconductor package for reactome pathway analysis and visualization. Mol. Biosyst. 2015, 12, 477–479. [Google Scholar] [CrossRef]
- Zott, K.; Thibon, C.; Bely, M.; Lonvaud-Funel, A.; Dubourdieu, D.; Masneuf-Pomarede, I. The grape must non-Saccharomyces microbial community: Impact on volatile thiol release. Int. J. Food Microbiol. 2011, 151, 210–215. [Google Scholar] [CrossRef]
- Ciani, M.; Maccarelli, F. Oenological properties of non-Saccharomyces yeasts associated with wine-making. World J. Microbiol. Biotechnol. 1997, 14, 199–203. [Google Scholar] [CrossRef]
- Jolly, N.; Augustyn, O.; Pretorius, I. The Effect of Non-Saccharomyces Yeasts on Fermentation and Wine Quality. S. Afr. J. Enol. Vitic. 2003, 24, 55–62. [Google Scholar] [CrossRef]
- Jolly, N.; Augustyn, O.; Pretorius, I. The Role and Use of Non-Saccharomyces Yeasts in Wine Production. S. Afr. J. Enol. Vitic. 2017, 27, 15–39. [Google Scholar] [CrossRef]
- Morata, A.; Escott, C.; Bañuelos, M.A.; Loira, I.; del Fresno, J.M.; González, C.; Suárez-Lepe, J.A. Contribution of Non-Saccharomyces Yeasts to Wine Freshness. A Review. Biomolecules 2019, 10, 34. [Google Scholar] [CrossRef] [PubMed]
- Cabrera, M.J.; Moreno, J.; Ortega, J.M.; Medina, M. Formation of ethanol, higher alcohols, esters, and terpenes by five yeast strains in musts from Pedro Ximenez grapes in various degrees of ripeness. Am. J. Enol. Vitic. 1988, 39, 283–287. [Google Scholar] [CrossRef]
- Ciani, M.; Picciotti, G. The growth kinetics and fermentation behaviour of some non-Saccharomyces yeasts associated with wine-making. Biotechnol. Lett. 1995, 17, 1247–1250. [Google Scholar] [CrossRef]
- Martinez, J.; Toledano, F.; Milla’n, C.; Ortega, J. Development of alcoholic fermentation in non-sterile musts from ‘Pedro Ximenez’ grapes inoculated with pure cultures of selected yeasts. Food Microbiol. 1990, 7, 217–225. [Google Scholar] [CrossRef]
- Peynaud, E. Sur la formation d’acétate d’éthyle par les levures du vin. Ind. Agric. Aliment. 1956, 73, 253–257. [Google Scholar]
- Plata, C.; Millán, C.; Mauricio, J.; Ortega, J. Formation of ethyl acetate and isoamyl acetate by various species of wine yeasts. Food Microbiol. 2003, 20, 217–224. [Google Scholar] [CrossRef]
- Shinohara, T.; Kubodera, S.; Yanagida, F. Distribution of phenolic yeasts and production of phenolic off-flavors in wine fermentation. J. Biosci. Bioeng. 2000, 90, 90–97. [Google Scholar] [CrossRef] [PubMed]
- Charoenchai, C.; Fleet, G.; Henschke, P.; Todd, B. Screening of non-Saccharomyces wine yeasts for the presence of extracellular hydrolytic enzymes. Aust. J. Grape Wine Res. 1997, 3, 2–8. [Google Scholar] [CrossRef]
- Hernandezorte, P.; Cersosimo, M.; Loscos, N.; Cacho, J.; Garciamoruno, E.; Ferreira, V. The development of varietal aroma from non-floral grapes by yeasts of different genera. Food Chem. 2008, 107, 1064–1077. [Google Scholar] [CrossRef]
- Comitini, F.; Gobbi, M.; Domizio, P.; Romani, C.; Lencioni, L.; Mannazzu, I.; Ciani, M. Selected non-Saccharomyces wine yeasts in controlled multistarter fermentations with Saccharomyces cerevisiae. Food Microbiol. 2011, 28, 873–882. [Google Scholar] [CrossRef]
- Azzolini, M.; Fedrizzi, B.; Tosi, E.; Finato, F.; Vagnoli, P.; Scrinzi, C.; Zapparoli, G. Effects of Torulaspora delbrueckii and Saccharomyces cerevisiae mixed cultures on fermentation and aroma of Amarone wine. Eur. Food Res. Technol. 2012, 235, 303–313. [Google Scholar] [CrossRef]
- Fredrickson, A.G. Behavior of mixed cultures of microorganisms. Annu. Rev. Microbiol. 1977, 31, 63–88. [Google Scholar] [CrossRef] [PubMed]
- Strehaiano, P.; Nehme, N.; Renouf, V.; Lonvaud-Funel, A.; Mathieu, F.; Taillandier, P. Microbial interactions in winemaking. In Current Topics on Bioprocesses in Food Industry; Asiatech Publishers Inc.: Singapore, 2008; pp. 296–311. [Google Scholar]
- Albergaria, H.; Francisco, D.; Gori, K.; Arneborg, N.; Gírio, F. Saccharomyces cerevisiae CCMI 885 secretes peptides that inhibit the growth of some non-Saccharomyces wine-related strains. Appl. Microbiol. Biotechnol. 2010, 86, 965–972. [Google Scholar] [CrossRef] [PubMed]
- Hansen, E.H.; Nissen, P.; Sommer, P.; Nielsen, J.; Arneborg, N. The effect of oxygen on the survival of non-Saccharomyces yeasts during mixed culture fermentations of grape juice with Saccharomyces cerevisiae. J. Appl. Microbiol. 2001, 91, 541–547. [Google Scholar] [CrossRef] [PubMed]
- Ciani, M.; Comitini, F. Yeast interactions in multi-starter wine fermentation. Curr. Opin. Food Sci. 2015, 1, 1–6. [Google Scholar] [CrossRef]
- Kemsawasd, V.; Branco, P.; Almeida, M.G.; Caldeira, J.; Albergaria, H.; Arneborg, N. Cell-to-cell contact and antimicrobial peptides play a combined role in the death of Lachanchea thermotolerans during mixed-culture alcoholic fermentation with Saccharomyces cerevisiae. FEMS Microbiol. Lett. 2015, 362, fnv103. [Google Scholar] [CrossRef]
- Beaufort, S. Comparaison des Phénomènes d’Interactions Directes/Indirectes Lors de Co-Cultures Entre des Levures Saccharomyces et non–Saccharomyces. In Proceedings of the 10ème Symposium International d’Œnologie de Bordeaux, Bordeaux, France, 10–15 July 2015. [Google Scholar]
- Miller, M.B.; Bassler, B.L. Quorum Sensing in Bacteria. Annu. Rev. Microbiol. 2001, 55, 165–199. [Google Scholar] [CrossRef]
- Coetzee, C.; du Toit, W.J. A comprehensive review on Sauvignon blanc aroma with a focus on certain positive volatile thiols. Food Res. Int. 2012, 45, 287–298. [Google Scholar] [CrossRef]
- Darriet, P.; Tominaga, T.; Lavigne, V.; Boidron, J.-N.; Dubourdieu, D. Identification of a powerful aromatic component of Vitis vinifera L. var. sauvignon wines: 4-mercapto-4-methylpentan-2-one. Flavour Fragr. J. 1995, 10, 385–392. [Google Scholar] [CrossRef]
- Fedrizzi, B.; Pardon, K.H.; Sefton, M.A.; Elsey, G.M.; Jeffery, D.W. First Identification of 4-S-Glutathionyl-4-methylpentan-2-one, a Potential Precursor of 4-Mercapto-4-methylpentan-2-one, in Sauvignon Blanc Juice. J. Agric. Food Chem. 2009, 57, 991–995. [Google Scholar] [CrossRef] [PubMed]
- Howell, K.; Swiegers, J.H.; Elsey, G.M.; Siebert, T.E.; Bartowsky, E.J.; Fleet, G.H.; Pretorius, I.S.; de Barros Lopes, M.A. Variation in 4-mercapto-4-methyl-pentan-2-one release by Saccharomyces cerevisiae commercial wine strains. FEMS Microbiol. Lett. 2004, 240, 125–129. [Google Scholar] [CrossRef] [PubMed]
- Gachons, C.P.D.; Tominaga, T.; Dubourdieu, D. Sulfur Aroma Precursor Present inS-glutathione Conjugate Form: Identification ofS-3-(Hexan-1-ol)-glutathione in Must from Vitis vinifera L. cv. Sauvignon Blanc. J. Agric. Food Chem. 2002, 50, 4076–4079. [Google Scholar] [CrossRef] [PubMed]
- Roland, A.; Schneider, R.; Razungles, A.; Cavelier, F. Varietal Thiols in Wine: Discovery, Analysis and Applications. Chem. Rev. 2011, 111, 7355–7376. [Google Scholar] [CrossRef]
- Subileau, M.; Schneider, R.; Salmon, J.M.; Degryse, E. New Insights on 3-Mercaptohexanol (3MH) Biogenesis in Sauvignon Blanc Wines: Cys-3MH and (E)-Hexen-2-al Are Not the Major Precursors. J. Agric. Food Chem. 2008, 56, 9230–9235. [Google Scholar] [CrossRef]
- Murat, M.-L.; Masneuf, I.; Darriet, P.; Lavigne, V.; Tominaga, T.; Dubourdieu, D. Effect of Saccharomyces cerevisiae Yeast Strains on the Liberation of Volatile Thiols in Sauvignon blanc Wine. Am. J. Enol. Vitic. 2001, 52, 136–139. [Google Scholar] [CrossRef]
- Anfang, N.; Brajkovich, M.; Goddard, M. Co-fermentation with Pichia kluyveri increases varietal thiol concentrations in Sauvignon Blanc. Aust. J. Grape Wine Res. 2009, 15, 1–8. [Google Scholar] [CrossRef]
- Renault, P.; Coulon, J.; Moine, V.; Thibon, C.; Bely, M. Enhanced 3-Sulfanylhexan-1-ol Production in Sequential Mixed Fermentation with Torulaspora delbrueckii/Saccharomyces cerevisiae Reveals a Situation of Synergistic Interaction between Two Industrial Strains. Front. Microbiol. 2016, 7, 293. [Google Scholar] [CrossRef]
- Viana, F.; Gil, J.V.; Genovés, S.; Vallés, S.; Manzanares, P. Rational selection of non-Saccharomyces wine yeasts for mixed starters based on ester formation and enological traits. Food Microbiol. 2008, 25, 778–785. [Google Scholar] [CrossRef]
- Chant, J.; Herskowitz, I. Genetic control of bud site selection in yeast by a set of gene products that constitute a morphogenetic pathway. Cell 1991, 65, 1203–1212. [Google Scholar] [CrossRef]
- Park, H.-O.; Kang, P.J.; Rachfal, A.W. Localization of the Rsr1/Bud1 GTPase Involved in Selection of a Proper Growth Site in Yeast. J. Biol. Chem. 2002, 277, 26721–26724. [Google Scholar] [CrossRef] [PubMed]
- Cohen, G.; Fessl, F.; Traczyk, A.; Rytka, J.; Ruis, H. Isolation of the catalase A gene of Saccharomyces cerevisiae by complementation of the cta1 mutation. Mol. Genet. Genom. 1985, 200, 74–79. [Google Scholar] [CrossRef] [PubMed]
- Jamieson, D.J. Oxidative stress responses of the yeast Saccharomyces cerevisiae. Yeast 1998, 14, 1511–1527. [Google Scholar] [CrossRef]
- Kuge, S.; Jones, N. YAP1 dependent activation of TRX2 is essential for the response of Saccharomyces cerevisiae to oxidative stress by hydroperoxides. J. Eur. Mol. Biol. 1994, 13, 655–664. [Google Scholar] [CrossRef]
- Pedrajas, J.R.; Kosmidou, E.; Miranda-Vizuete, A.; Gustafsson, J.; Wright, A.P.H.; Spyrou, G. Identification and Functional Characterization of a Novel Mitochondrial Thioredoxin System in Saccharomyces cerevisiae. Perspect. Surg. 1999, 274, 6366–6373. [Google Scholar] [CrossRef]
- Collinson, E.J.; Wheeler, G.L.; Garrido, E.O.; Avery, A.M.; Avery, S.V.; Grant, C.M. The Yeast Glutaredoxins Are Active as Glutathione Peroxidases. J. Biol. Chem. 2002, 277, 16712–16717. [Google Scholar] [CrossRef]
- Costa, V.; Reis, E.; Quintanilha, A.; Moradasferreira, P. Acquisition of Ethanol Tolerance in Saccharomyces cerevisiae: The Key Role of the Mitochondrial Superoxide Dismutase. Arch. Biochem. Biophys. 1993, 300, 608–614. [Google Scholar] [CrossRef]
- Grant, C.M.; MacIver, F.H.; Dawes, I.W.; Martin, M.; Roy, C.; Montcourrier, P.; Sahuquet, A.; Mangeat, P. Glutathione synthetase is dispensable for growth under both normal and oxidative stress conditions in the yeast Saccharomyces cerevisiae due to an accumulation of the dipeptide gamma-glutamylcysteine. Mol. Biol. Cell 1997, 8, 1699–1707. [Google Scholar] [CrossRef]
- Inoue, Y.; Matsuda, T.; Sugiyama, K.-I.; Izawa, S.; Kimura, A. Genetic Analysis of Glutathione Peroxidase in Oxidative Stress Response of Saccharomyces cerevisiae. Perspect. Surg. 1999, 274, 27002–27009. [Google Scholar] [CrossRef]
- Longo, V.D.; Gralla, E.B.; Valentine, J.S. Superoxide Dismutase Activity Is Essential for Stationary Phase Survival in Saccharomyces cerevisiae: Mitochondrial production of toxic oxygen species in vivo. Pediatrics 1996, 271, 12275–12280. [Google Scholar] [CrossRef]
- van Loon, A.P.; Pesold-Hurt, B.; Schatz, G. A yeast mutant lacking mitochondrial manganese-superoxide dismutase is hypersensitive to oxygen. Proc. Natl. Acad. Sci. USA 1986, 83, 3820–3824. [Google Scholar] [CrossRef] [PubMed]
- Luikenhuis, S.; Perrone, G.; Dawes, I.W.; Grant, C.M. The Yeast Saccharomyces cerevisiae Contains Two Glutaredoxin Genes That Are Required for Protection against Reactive Oxygen Species. Mol. Biol. Cell 1998, 9, 1081–1091. [Google Scholar] [CrossRef] [PubMed]
- Reddi, A.R.; Culotta, V.C. SOD1 Integrates Signals from Oxygen and Glucose to Repress Respiration. Cell 2013, 152, 224–235. [Google Scholar] [CrossRef] [PubMed]
- Wong, C.-M.; Zhou, Y.; Ng, R.W.M.; Kung, H.-F.; Jin, D.-Y. Cooperation of Yeast Peroxiredoxins Tsa1p and Tsa2p in the Cellular Defense against Oxidative and Nitrosative Stress. J. Biol. Chem. 2002, 277, 5385–5394. [Google Scholar] [CrossRef] [PubMed]
- Boveris, A. [57] Determination of the production of superoxide radicals and hydrogen peroxide in mitochondria. Methods Enzymol. 1984, 105, 429–435. [Google Scholar] [CrossRef]
- Halliwell, B. The Biological Significance of Oxygen-Derived Species. In Active Oxygen in Biochemistry; Valentine, J.S., Foote, C.S., Greenberg, A., Liebman, J.F., Eds.; Springer: Dordrecht, The Netherlands, 1995; pp. 313–335. [Google Scholar] [CrossRef]


| Mixed Cultures with Physical Contact | Mixed Cultures without Physical Contact | S. cerevisiae One Compartment | S. cerevisiae Two Compartments | T. delbrueckii One Compartment | T. delbrueckii Two Compartments | |
|---|---|---|---|---|---|---|
| Isoamyl aetate | 1246.61 ab ± 79.1 | 1344.82 a ± 11.23 | 1273.52 ab ± 37 | 1156.10 a ± 18.1 | 1.57 c ± 0.7 | 5.08 c ± 2.33 |
| Hexyl acetate | 52.65 bc ± 5.05 | 62.65 ab ± 5.90 | 58.69 ab ± 4.94 | 66.85 a ± 2.70 | 0.22 d ± 0.01 | 2.31 d ± 0.74 |
| Phenylethyl acetate | 303.50 b ± 54.9 | 297.50 b ± 72.89 | 413.41 a ± 46.5 | 254.88 b ± 65.9 | 3.10 c ± 1.78 | 1.24 c ± 0.68 |
| Isobutyl acetate | 48.87 a ± 5.00 | 45.60 a ± 1.68 | 40.45 a ± 6.83 | 31.97 ab ± 7.06 | 26.86 b ± 0.56 | 18.5 b ± 2.94 |
| Ethyl propanoate | 173.41 a ± 53.0 | 199.19 a ± 3.69 | 60.52 b ± 5.75 | 56.52 b ± 1.34 | 134.55 a ± 41.36 | 108 a ± 11.39 |
| Ethyl isobutanoate | 48.35 bc ± 3.98 | 51.35 bc ± 11.42 | 8.94 c ± 2.58 | 11.93 c ± 1.83 | 134.55 a ± 1.21 | 82.9 b ± 14.02 |
| Ethyl hexanoate | 215.87 a ± 60.4 | 243.31 a ± 26.07 | 237.07 a ± 105 | 330.72 a ± 40.3 | 50.67 b ± 11.4 | 55.2 b ± 6.93 |
| Ethyl octanoate | 119.86 b ± 0.61 | 165.87 b ± 26.93 | 232.09 a ± 23.3 | 230.35 a ± 0.35 | 4.01 c ± 0.37 | 6.65 c ± 5.29 |
| Ethyl decanoate | 16.95 b ± 1.35 | 17.42 bc ± 5.06 | 42.38 a ± 6.36 | 48.94 a ± 0.34 | 24.17 d ± 3.30 | 7.4 d ± 1.43 |
| Ethyl dihydrocinnamate | 2.55 c ± 0.89 | 3.95 b ± 0.87 | 0.60 e ± 0.20 | 1.46 d ± 0.25 | 13.60 a ± 9.62 | 9.99 a ± 0.65 |
| ANOVA | Modalities Compared | Number of Significant Proteins | |
|---|---|---|---|
| S. cerevisiae (1186 Proteins) | T. delbrueckii (1477 Proteins) | ||
| I | Pure culture with one compartment vs. pure culturewith two compartments | 0 | 0 |
| II | Pure culture with one compartment vs. pure culturewith two compartments vs. mixed culture without physical contact | 8 | 0 |
| III | “Pure culture” (one compartment; two compartments; mixed culture without physical contact) vs. mixed cultures with physical contact | 209 (132 proteins more abundant in contact, 77 less abundant) | 84 (33 proteins more abundant in contact, 51 less abundant) |
Disclaimer/Publisher’s Note: The statements, opinions and data contained in all publications are solely those of the individual author(s) and contributor(s) and not of MDPI and/or the editor(s). MDPI and/or the editor(s) disclaim responsibility for any injury to people or property resulting from any ideas, methods, instructions or products referred to in the content. |
© 2023 by the authors. Licensee MDPI, Basel, Switzerland. This article is an open access article distributed under the terms and conditions of the Creative Commons Attribution (CC BY) license (https://creativecommons.org/licenses/by/4.0/).
Share and Cite
Chasseriaud, L.; Albertin, W.; Blein-Nicolas, M.; Balliau, T.; Zivy, M.; Coulon, J.; Bely, M. Physical Contact between Torulaspora delbrueckii and Saccharomyces cerevisiae Alters Cell Growth and Molecular Interactions in Grape Must. Beverages 2023, 9, 81. https://doi.org/10.3390/beverages9030081
Chasseriaud L, Albertin W, Blein-Nicolas M, Balliau T, Zivy M, Coulon J, Bely M. Physical Contact between Torulaspora delbrueckii and Saccharomyces cerevisiae Alters Cell Growth and Molecular Interactions in Grape Must. Beverages. 2023; 9(3):81. https://doi.org/10.3390/beverages9030081
Chicago/Turabian StyleChasseriaud, Laura, Warren Albertin, Mélisande Blein-Nicolas, Thierry Balliau, Michel Zivy, Joana Coulon, and Marina Bely. 2023. "Physical Contact between Torulaspora delbrueckii and Saccharomyces cerevisiae Alters Cell Growth and Molecular Interactions in Grape Must" Beverages 9, no. 3: 81. https://doi.org/10.3390/beverages9030081