Article

When Does Milk Spoil? The Use of Rejection Threshold Methodology to Investigate the Influence of Total Microbial Numbers on the Acceptability of Fresh Chilled Pasteurised Milk

Department of Food Science, University of Otago, 276 Leith Walk, Dunedin 9054, New Zealand
*
Author to whom correspondence should be addressed.
Beverages 2023, 9(2), 53; https://doi.org/10.3390/beverages9020053
Submission received: 8 April 2023 / Revised: 11 June 2023 / Accepted: 13 June 2023 / Published: 19 June 2023
(This article belongs to the Section Beverage Technology Fermentation and Microbiology)

Abstract

:
The consumer rejection threshold (RjT) method was applied to determine the total microbial numbers (TMNs) where consumers find that the quality of whole fresh chilled pasteurised milk (WFCPM) and skim milk (Trim) stored at 4.5 ± 0.5 °C is no longer acceptable. Food spoilage progression was supported by measurements of VOCs and the terms consumers used to describe the ageing fresh chilled pasteurised milk (FCPM). RjTs for TMN of 7.43 and 7.34 log10 CFU.mL−1 for WFCPM and Trim, respectively were derived using Hill’s equation from a series of paired preference tests comparing fresh and aged milks (3–26 days) assessed by consumers (WFCPM, n = 55; Trim, n = 52). A poor relationship between storage time and TMN was found, owing mainly to batch-to-batch and within-batch variation in the milk’s post-pasteurization contamination (PPC) levels. At the RjT, there was a significant change in the signal intensities for a number of spoilage-related VOCs that occurred in the FCPM headspace (p ≤ 0.05), which were measured using proton transfer reaction–mass spectrometry (PTR-MS), including m/z 33, 45, 47, 61, 63, 69, 71, 87, and 89, tentatively identified as methanol; acetaldehyde; ethanol; acetate (acetic acid and acetate esters); dimethyl sulphide (DMS); isoprene, furan, and aldehydes; 2-butanone; and pentanal and butyrates (butyric acid and butyrate esters), respectively. Consumers described the milks at TMN greater than the RjTs using terms like off, expired, sour, spoilt or rancid. This multidisciplinary study has provided data on the importance of PPC and subsequent increases in TMN on VOCs associated with FCPM and consumer’s preferences and highlighted the value of measuring a range of variables when investigating consumer’s perception of food quality and shelf-life.

1. Introduction

Consumers determine their liking of food based primarily on its sensory characteristics (e.g., flavour, odour) and nutritional value (e.g., protein content) [1,2]. In many Western countries, fresh chilled pasteurised milk (FCPM) is more desirable to consumers than UHT milk, owing to the absence of the pronounced cooked flavour of UHT milk, its fresh-like character, and perceived higher nutritional value owing to the relatively lower temperatures required for pasteurisation [3]. However, incidences of post-pasteurisation contamination (PPC), the term used to describe the recontamination of FCPM by microorganisms from the filling environment (e.g., fillers, surfaces, workers, etc.), considerably limit the shelf life of FCPM, which is generally commercially stated as being up to 14 days [4,5]. During storage, microorganisms (particularly psychrotrophs) degrade FCPM components (i.e., protein, lipids) and produce VOCs that alter the milk’s natural flavour and odour [6,7]. The concentration of these VOCs (off-flavours) in the headspace of FCPM correlates negatively with consumers’ liking of FCPM [8].
In a previous study that measured headspace VOCs and total microbial numbers (TMNs) in milk as it aged, Silcock, et al. [9] found that there was a non-linear relationship between microbial numbers and VOCs and that changes in the VOC concentrations in the headspace of milk started only after a threshold number of bacteria ranging between 6 and 8 log10 CFU.mL−1 was reached. The relationship between TMNs and VOCs was subsequently confirmed in a study in which UHT milk (n = 8) was inoculated with pure inoculums (isolated from aged FCPM) of Pseudomonas fluorescens (two strains tested), Chrysenobacterium sp., or mixed cultures of two or all three of the bacterial strains held at 4.5 °C for up to 26 days [10]. In general, it is believed as the concentration of off-flavours increases in milk, consumers’ liking decreases until they refuse to drink the milk because it is “off” or spoiled.
The rejection threshold (RjT) is defined as the lowest concentration of a compound (or analytical attribute) that affects consumer preferences [11]. The RjT is determined using a combination of two research approaches, the paired preference method and the constant stimuli threshold procedure, to determine the point (stimuli level) at which a food product is deemed unacceptable and, consequently, rejected by consumers. This approach has previously been applied to determine changes in consumer preferences due to sensory defects in wine [11,12], where the RjT was used to determine the threshold of 2,4,6-trichloroanisole (TCA) concentration at which consumers would begin to reject the wine. Torrico et al. [13] used the RjT to identify that the amount of sucrose (the stimuli) in strawberry-flavoured yoghurt can be reduced by more than 50% without affecting the physicochemical characteristics of the yoghurt or the preference of consumers (i.e., reaching the RjT).
The paired preference test is used to determine a consumer’s preference for one product directly against another. The technique is designed to identify the sample that is preferred by asking a simple question, “which do you prefer?” [14,15]. In this technique, although subjects might like or dislike both of the presented products, they must state a preference for one due to the general design of forced choice [15,16].
A consumer panel is considered one of the most appropriate tools to determine a product’s shelf life, as consumers assess acceptability through the unconscious detection of the analytical attributes of the product [17,18]. In the present study, a panel of regular FCPM consumers was used to assess changes in FCP M during storage.
The present study uses the concept of the rejection threshold (RjT) within a consumer-centric approach to test the hypothesis that once TMN exceeds a threshold number, consumers will decide that the milk quality will no longer be acceptable. The changes in the VOC composition of milk and the terms consumers would use to describe FCPM as it ages at 4 °C in combination with the RjT and microbial analyses will assist in better understanding the progression of food spoilage and what underpins consumer’s decisions to reject a product. This is the first study to apply the rejection threshold methodology to understand how total microbial numbers influence consumers’ perceived quality of pasteurised milk.

2. Materials and Methods

2.1. Milk Samples

Whole fresh chilled pasteurised milk (WFCPM: fat 3.18–3.28%; protein 2.98–3.10%) and Trim (known as skim milk in North America) milk (fat 0.25–0.40%; protein 3.5–3.6%) in 1 L HDPE translucent bottles were obtained from a local supermarket (Dunedin, New Zealand) at various times and stored at 4.5 ± 0.5 °C so as to obtain, on the day of each testing session, milk with an age of 7, 14, 16, 18, 20, 21, 22, 23, 24, 25, or 26 days after bottling. Fresh milk (3 days post-bottling) was obtained on each evaluation day and used as the reference milk. Note that the “fresh” milk used was 3 days post-bottling, as this was the time it took for FCPM to be available from the supermarket after transport from the processor. Aliquots of 12 × 25, 1 ×10, and 1 × 100 mL of milk were withdrawn from each milk bottle every evaluation day and were used for sensory, microbial, and VOC composition analyses, respectively. The milk aliquots taken for the analysis of VOC composition were frozen at −18 °C prior to evaluation.
FCPM samples (25 mL) used for the consumer testing were poured into 50 mL plastic cups, covered with plastic lids, placed on trays, and kept at 4.5 ± 0.5 °C overnight. The milk samples were placed at room temperature for 30 min prior to the sensory evaluation sessions.

2.2. Determination of the Total Microbial Numbers (TMNs) in FCPM

Total microbial numbers in WFCPM and Trim milk samples were determined each evaluation day using standard microbiological methods whereby dilutions of FCPM (0.1% peptone) were spread plated in triplicate onto plate count agar plates (Becton, Dickinson and Company, Franklin Lakes, NJ, USA). Plates were incubated at 25 °C for 72 hr before the numbers of colonies were counted. Results were expressed as log10 colony-forming units per mL of FCPM (log10 CFU.mL−1 milk).

2.3. Changes in the VOC Composition of FCPM during Storage

The VOC composition of WFCPM and Trim milk samples was determined following the completion of the sensory and microbial analyses according to the method described by Silcock, et al. [9] using PTR-MS (Ionicon Analytic, Innsbruck, Austria). Frozen FCPM (100 mL) was thawed (4.5 ± 0.5 °C) for 18 h and sub-samples (50 mL) were warmed in a water bath at 25 °C for 15 min and added to 500 mL glass bottles (Schott Duran®, Germany). Headspace air was sampled over a mass range of m/z 20–185 using a dwell time of 100 ms per m/z under drift tube conditions of 600 V, drift pressure of 2.2 mbar, temperature 70 °C, and E/N value of 136 Td (1 Td [Townsend] = 10–17 V cm2). Each measurement took a total time of 11.5 min and involved the measurement of a total of 15 cycles. The empty bottle was flushed with clean air for 3 min at a flow rate of 500 sccm, the bottle was connected to the PTR-MS, 5 cycles were measured as background, and then the milk sample was added followed by further flushing with clean air for 3 min at a flow rate of 500 sccm. The flow rate was adjusted to about 50 sccm, the was bottle reconnected to the PTR-MS and flushed for a further 82.5 s, and then 10 cycles were measured.
For all samples and background measurements, the normalised counts per second (n-cps) of each m/z were calculated over the range of m/z 20–185 by correcting the variation in the signal of the primary ion (H3O+) and its water cluster (H2O.H3O+) and the variation in the drift tube pressure, as detailed in Silcock, et al. [9].
Tentative identification of VOCs contributing to each m/z detected by PTR-MS was based on previous studies [9,10], where solid-phase microextraction gas chromatography–mass spectrometry (GC–MS) analyses were carried out on a subset of samples. In these studies, compounds were tentatively identified based on matching the mass spectra of detected compounds with spectra in the NIST-08 MS library (National Institute of Standards, Gaithersburg, MD, USA).

2.4. Participants

A total of 107 regular milk consumers (WFCPM: 55; Trim: 52) over the age of 18 were recruited. A regular milk consumer was defined as an individual who, on average, consumed one or more litres of milk a week in any form (e.g., cold or heated, mixed with cereals, or added to other beverages). In a screening questionnaire, an individual’s milk consumption behaviour was determined by asking the type (WFCPM or Trim), the volume, and the way (e.g., plain, added to hot drinks, etc.) they normally consumed milk. Individuals with a history of allergies or health issues related to the consumption of milk or milk products, pregnant women, individuals with critical health conditions, individuals who did not meet the definition of a regular milk consumer, or those under the age of 18 years were thanked for their interest and excluded from participation in the study.
Eligible participants were allocated to one of the designated two groups based on their milk type preference (i.e., WFCPM or Trim) as declared in the screening questionnaire. Before the commencement of each evaluation session, all participants were again provided with the information sheet and informed consent was obtained. Upon the completion of an evaluation session, each participant was given an NZD 20 supermarket voucher as a reimbursement towards the costs associated with travelling to the session. Ethical approval for this study was obtained from the University of Otago Human Ethics Committee and The Ngāi Tahu Research Consultation Committee.

2.5. Procedure

As part of this study, the number of microorganisms (stimuli) required at an RjT of 50% was estimated. Each participant carried out forced preference tests on 12 pairs of milk. The first test pair was considered a warm-up, consisting of two 3-day-old FCPM, the results from which were disregarded from further analyses. The remaining 11 pairs consisted of a fresh (3-day-old) reference milk and an aged FCPM sample stored for (t) days and served in order of increasing age, where t = 7, 14, 16, 18, 20, 21, 22, 23, 24, 25, or 26 days after bottling. The order of the reference and aged FCPM was randomised within each pair. WFCPM was evaluated in the first week and, in the second week, Trim milk was evaluated. For each milk type, evaluations were carried out over five consecutive days, with one testing session a day. For each testing session, a total of 10 to 12 subjects evaluated 12 test sets (fresh vs. aged). For WFCPM and Trim, there should have been 55 and 52 responses for each pair (selecting either fresh (3-day milk) or the aged samples) at the end of the study. However, over the course of the experiment, some milk production dates were unavailable, which meant the milk could not be stored for the required number of days to fill the sessions with all the appropriately aged milk samples. These missing samples were D16, D23 (S1); D24 (S2); D18, D25 (S3); D26 (S4); and D20 (S5) for WFCPM, and D18 (S1); D20, D22 (S3); D21, D23 (S4); and D22, D24 (S5) for Trim, where S(n) is the session number and D(t) is the milk storage time. These samples were substituted with fresh (3-day) milk to maintain a constant number of testing sets across all sessions (n = 12); however, results from these test sets were excluded from further analyses.
When presented with a test set, participants were instructed to indicate which sample they preferred. To explore qualitative reasons for the rejection of FCPM, after each test set, participants were asked to indicate why they preferred one sample to the other to generate terminology that describes the consumer preference for FCPM. Participants were given a 30 s break between each test set to avoid fatigue. Water and water crackers were provided for palate cleansing between samples. Participants were provided with plastic spittoons to spit out the tested sample, if required. Each consumer completed the test in a single session. Data was collected using Compusense-Five version 4.0 (Compusense Inc., Guelph, ON, Canada). All evaluations were carried out under white light in individual booths.

2.6. Data Analyses

2.6.1. Changes in the VOC Composition of FCPM during Storage by Multifactor Analysis of Variance (ANOVA)

Changes in the normalised signal intensities of m/z from the headspace of FCPM were analysed by multifactor ANOVA, using the general linear model (GLM) procedure. Data from each FCPM type was analysed separately. The normalised signal intensities for the m/z were used as the dependent variables, while storage time, session, and storage time × session interaction were included as fixed factors. Normalised counts of the m/z from the PTR-MS datasets that were not significantly different between storage days were excluded from further data analyses (p > 0.05). In addition, m/z that did not represent a real signal of actual changes in the VOC composition of FCPM (<10 n-cps) were not included in the results and were omitted from further analysis. Post-hoc Tukey’s HSD test was used for the comparison of significant m/z. Evaluations were based on a significance level of p ≤ 0.05.

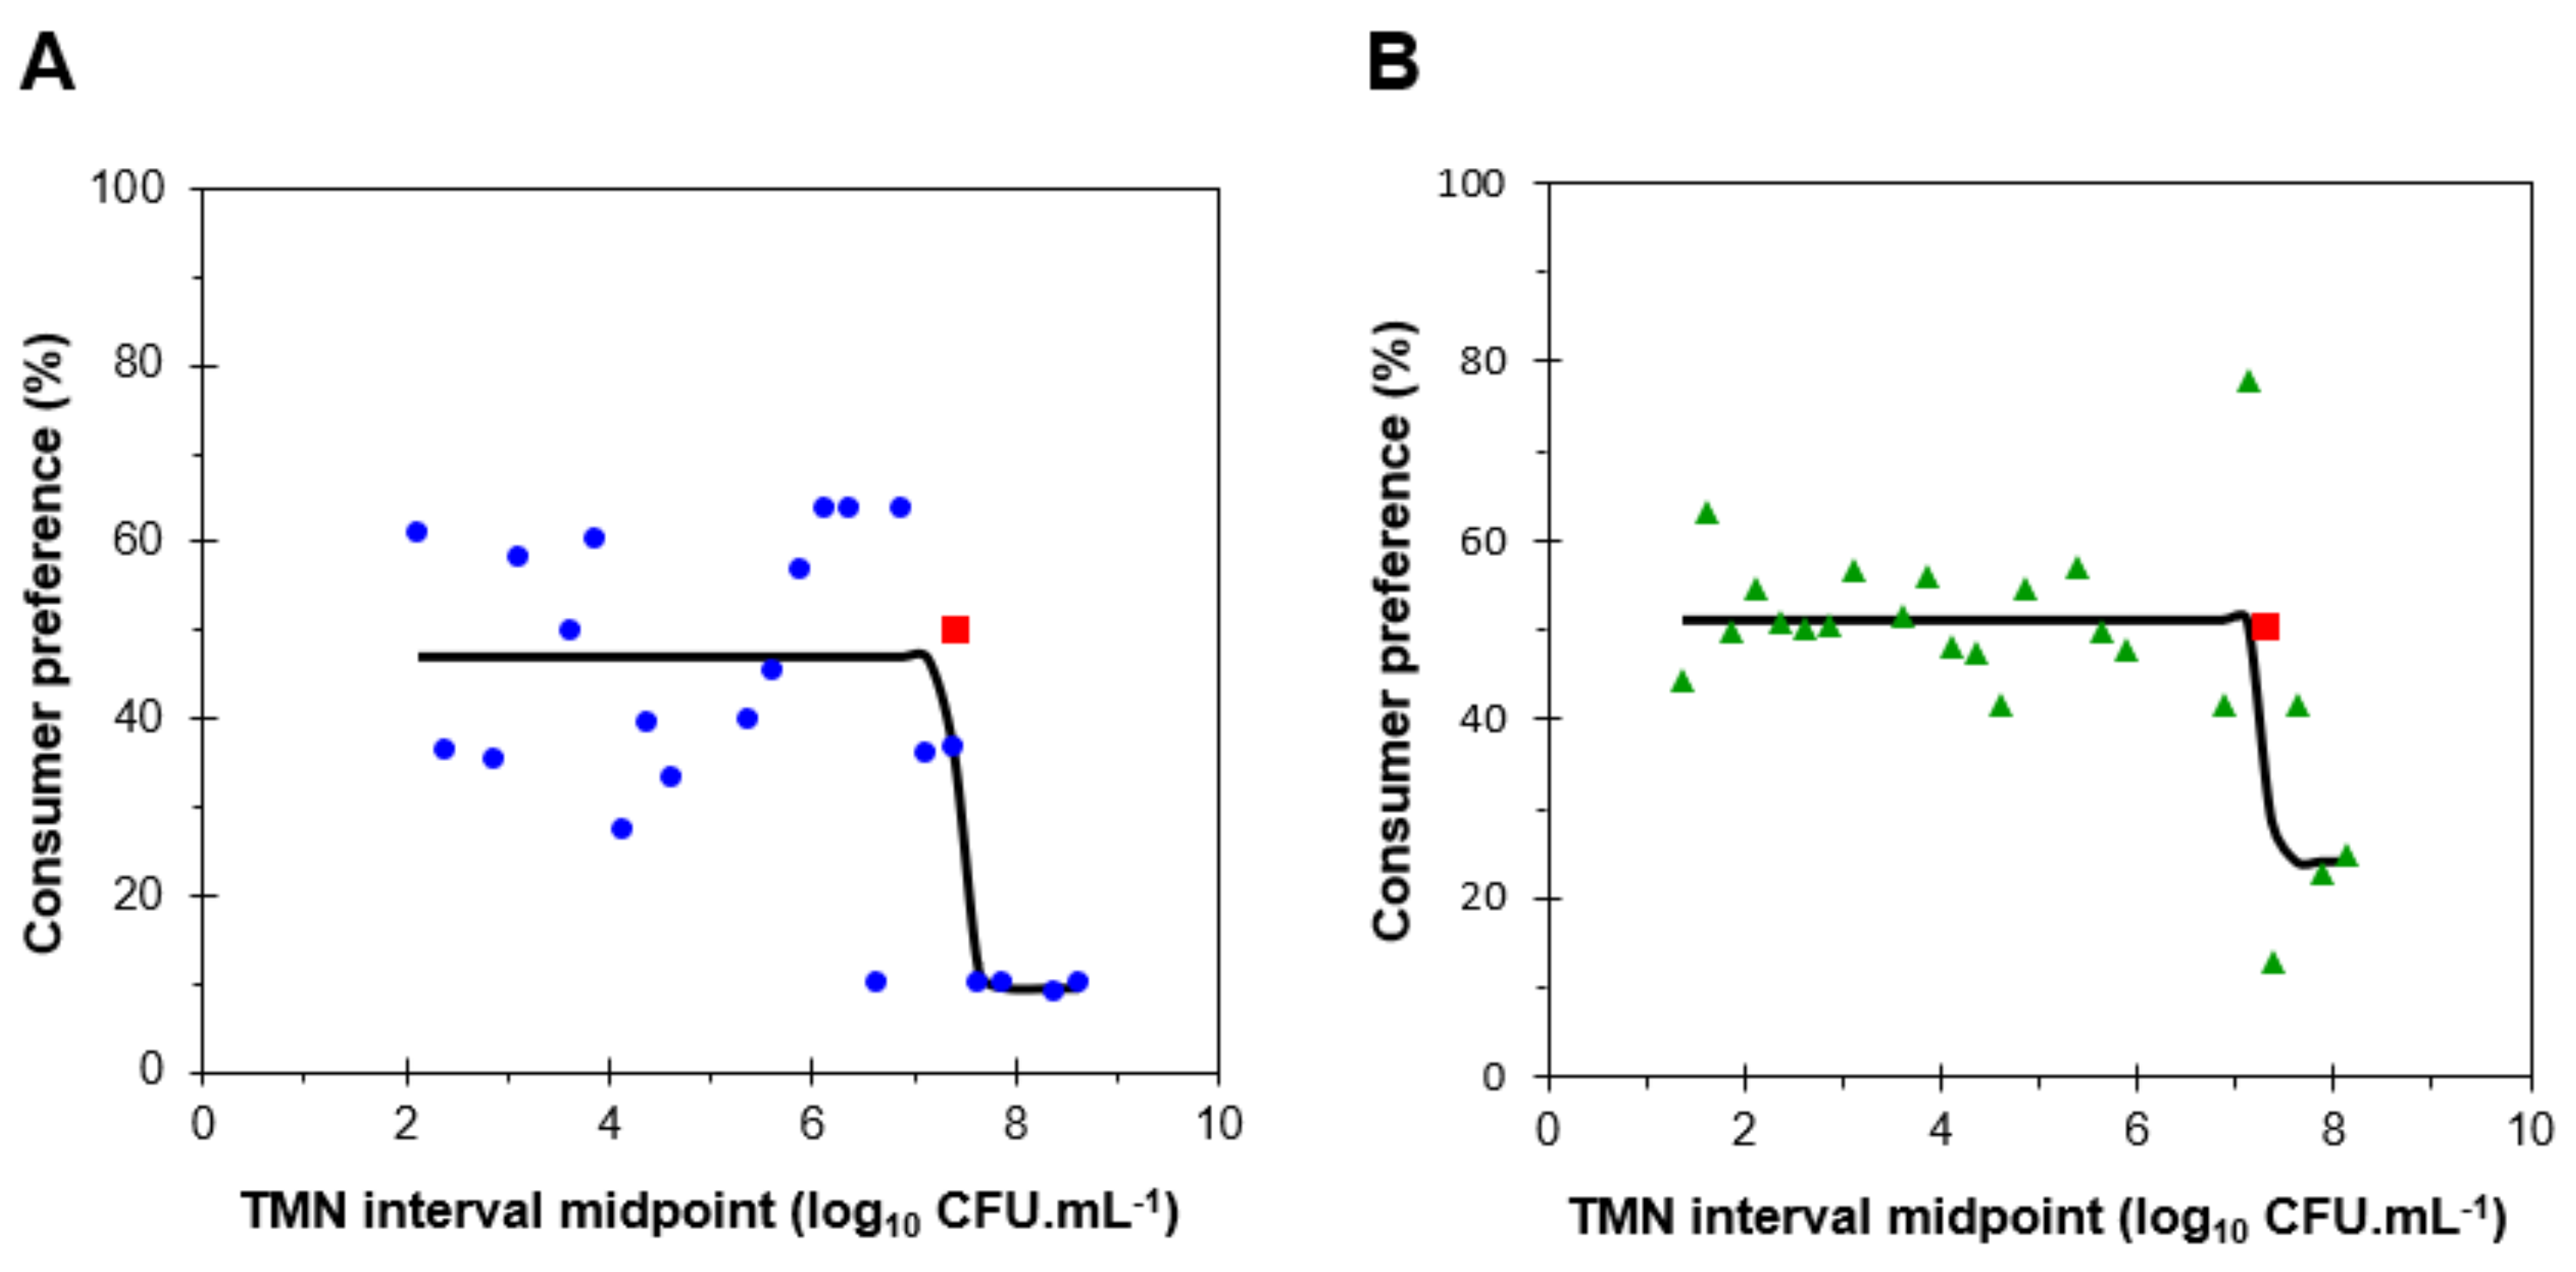
2.6.2. Consumers’ Rejection Threshold (RjT)

Consumers’ preference expressed as a percentage for the aged FCPM sample for each pair was calculated using Equation (1) below:
%   Preference ( t )   day   FCPM = Number   of   participants   preferred   ( t )   day   FCPM Total   number   of   participants   evaluating   the   sample   × 100
The RjT corresponds to the point where 50% of the consumers reject a product above chance (p < 0.05) (i.e., RjT50, classically known as EC50). To determine the RjT for each FCPM type, % preference was calculated for each aged milk within each session and expressed relative to the TMN rather than time. The % preference was then aggregated into 0.25 log10 CFU.mL−1 intervals using the data from all sessions. The average preference (%) over 0.25 log10 CFU.mL−1 intervals was plotted, and a sigmoid variable slope using the dose-response function was fitted to the data using GraphPad Prism 8.0 (GraphPad Software 8.0c, San Diego, CA, USA) based on Hill’s equation presented below [19,20]:
Y = Min + [ ( Max Min ) 1 + 10 ( logRjT 50 X ) × Hill   Slope ]

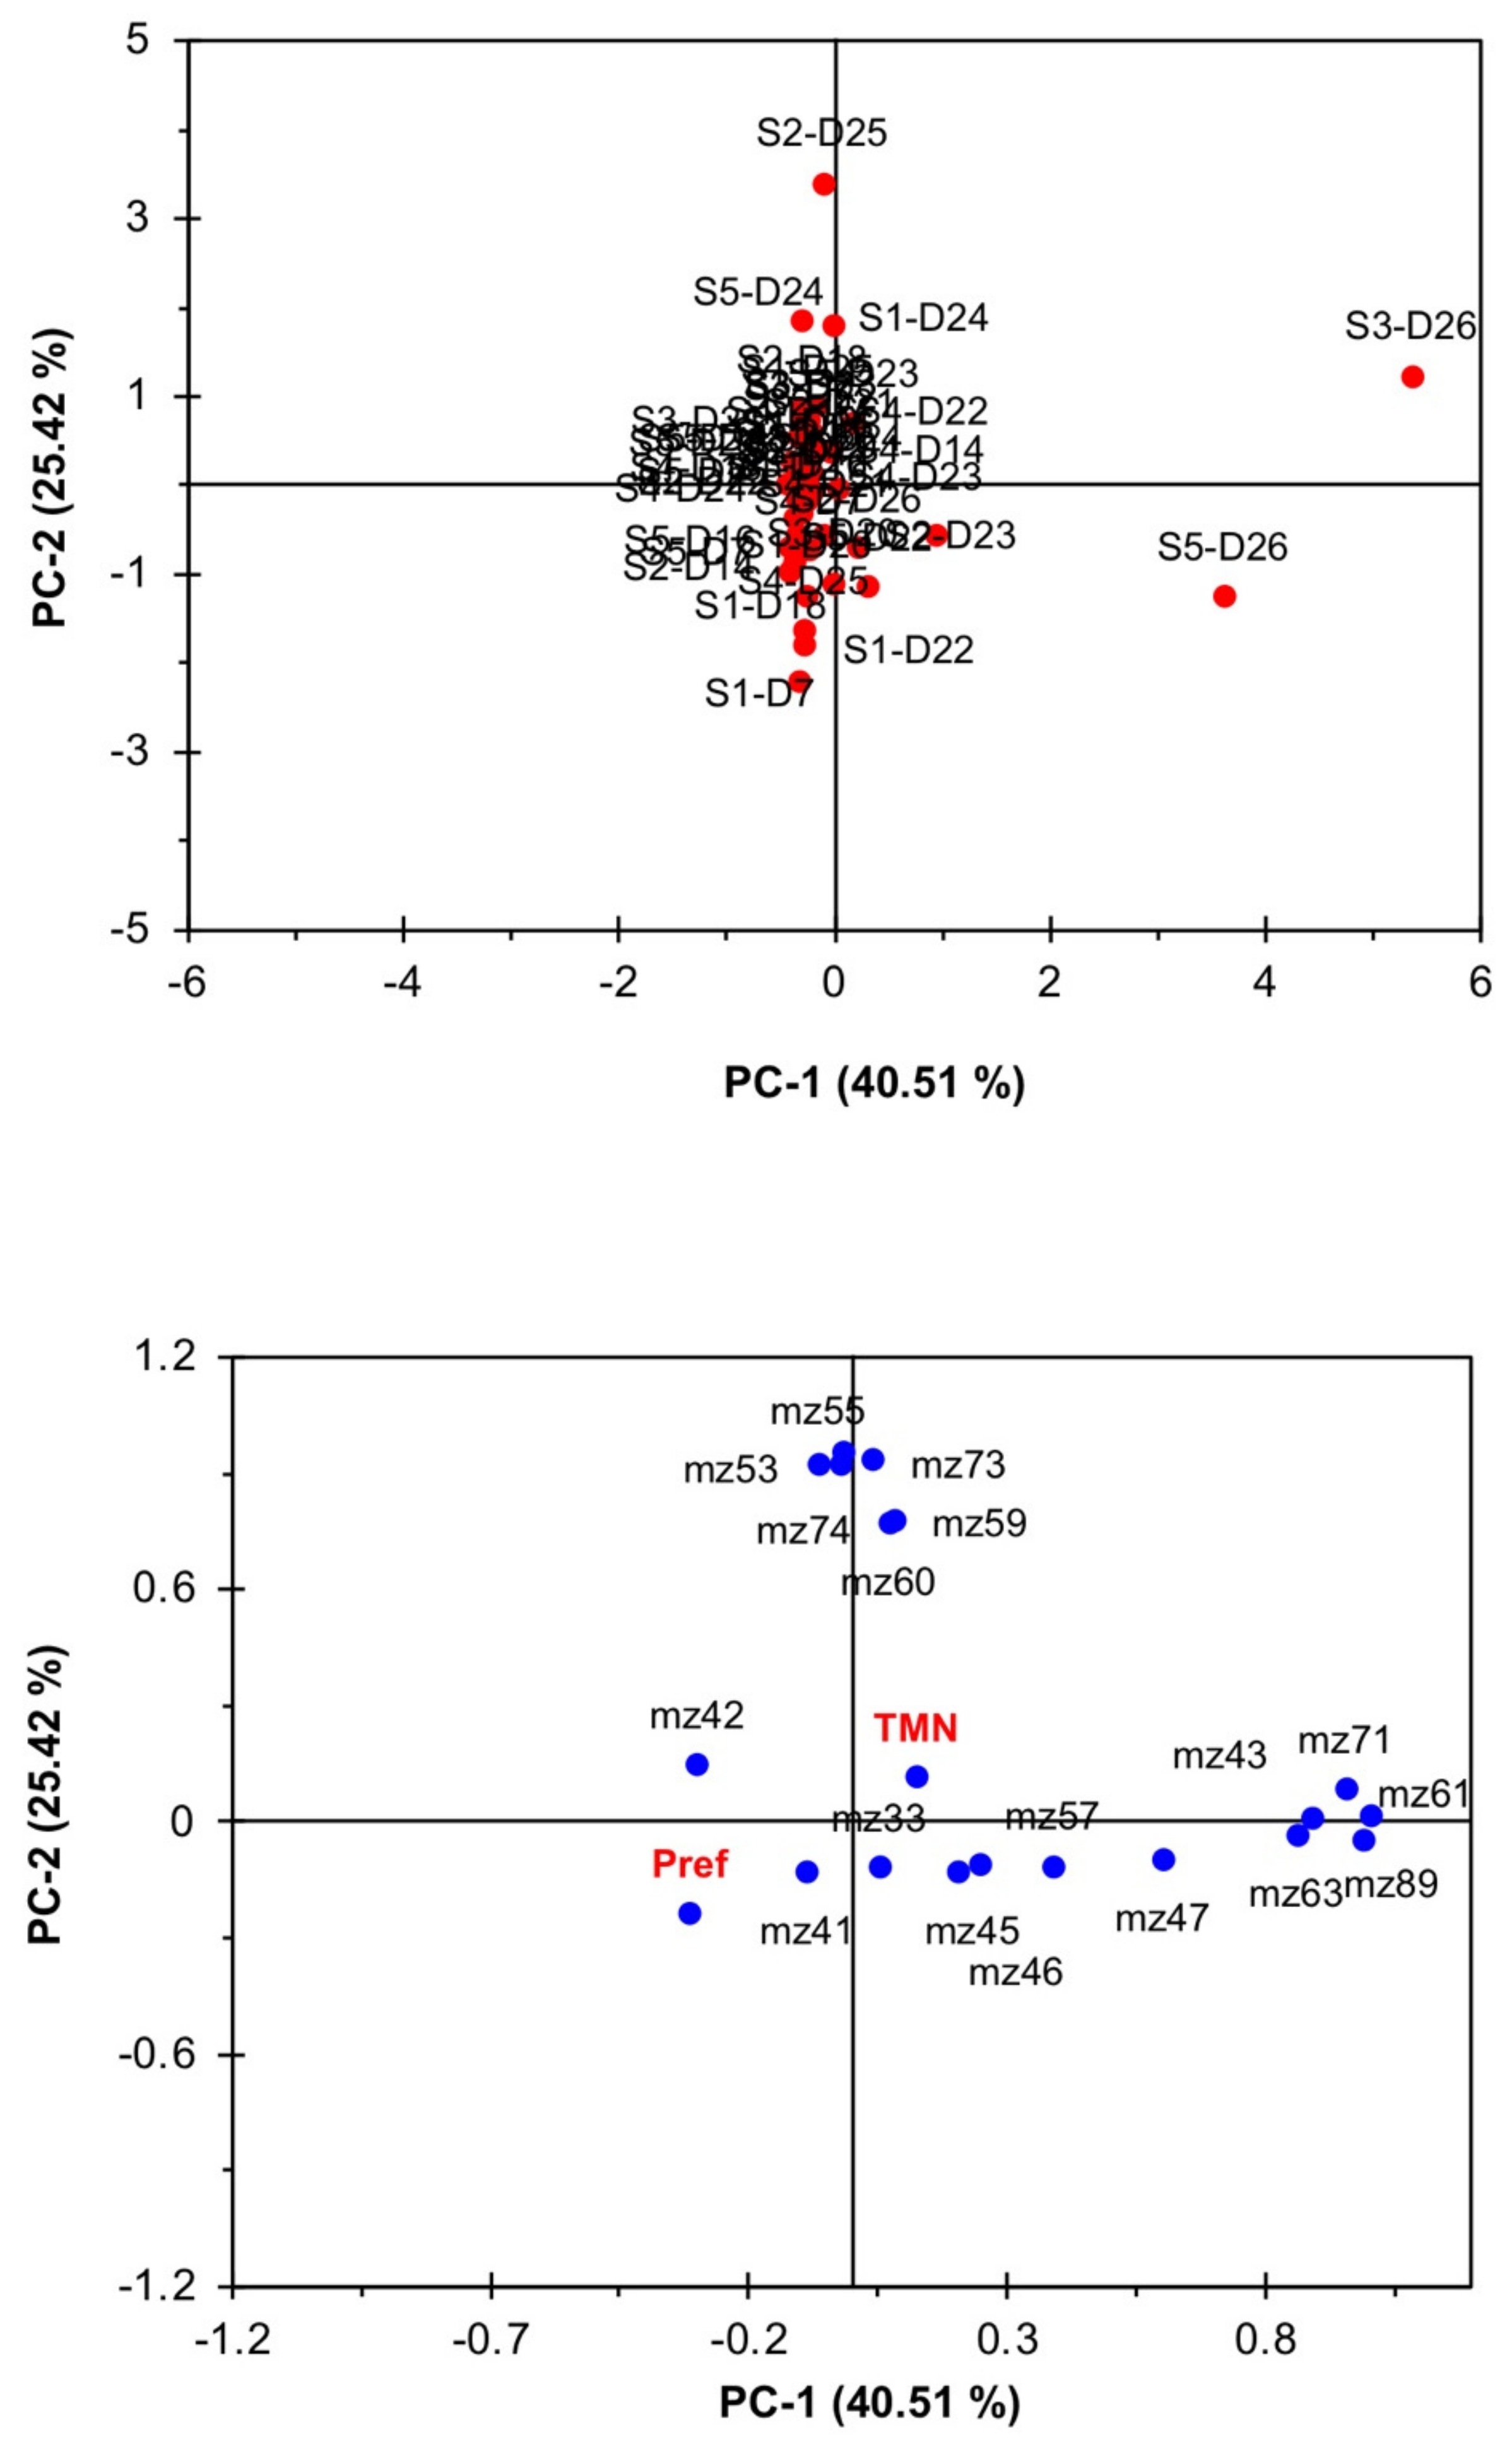
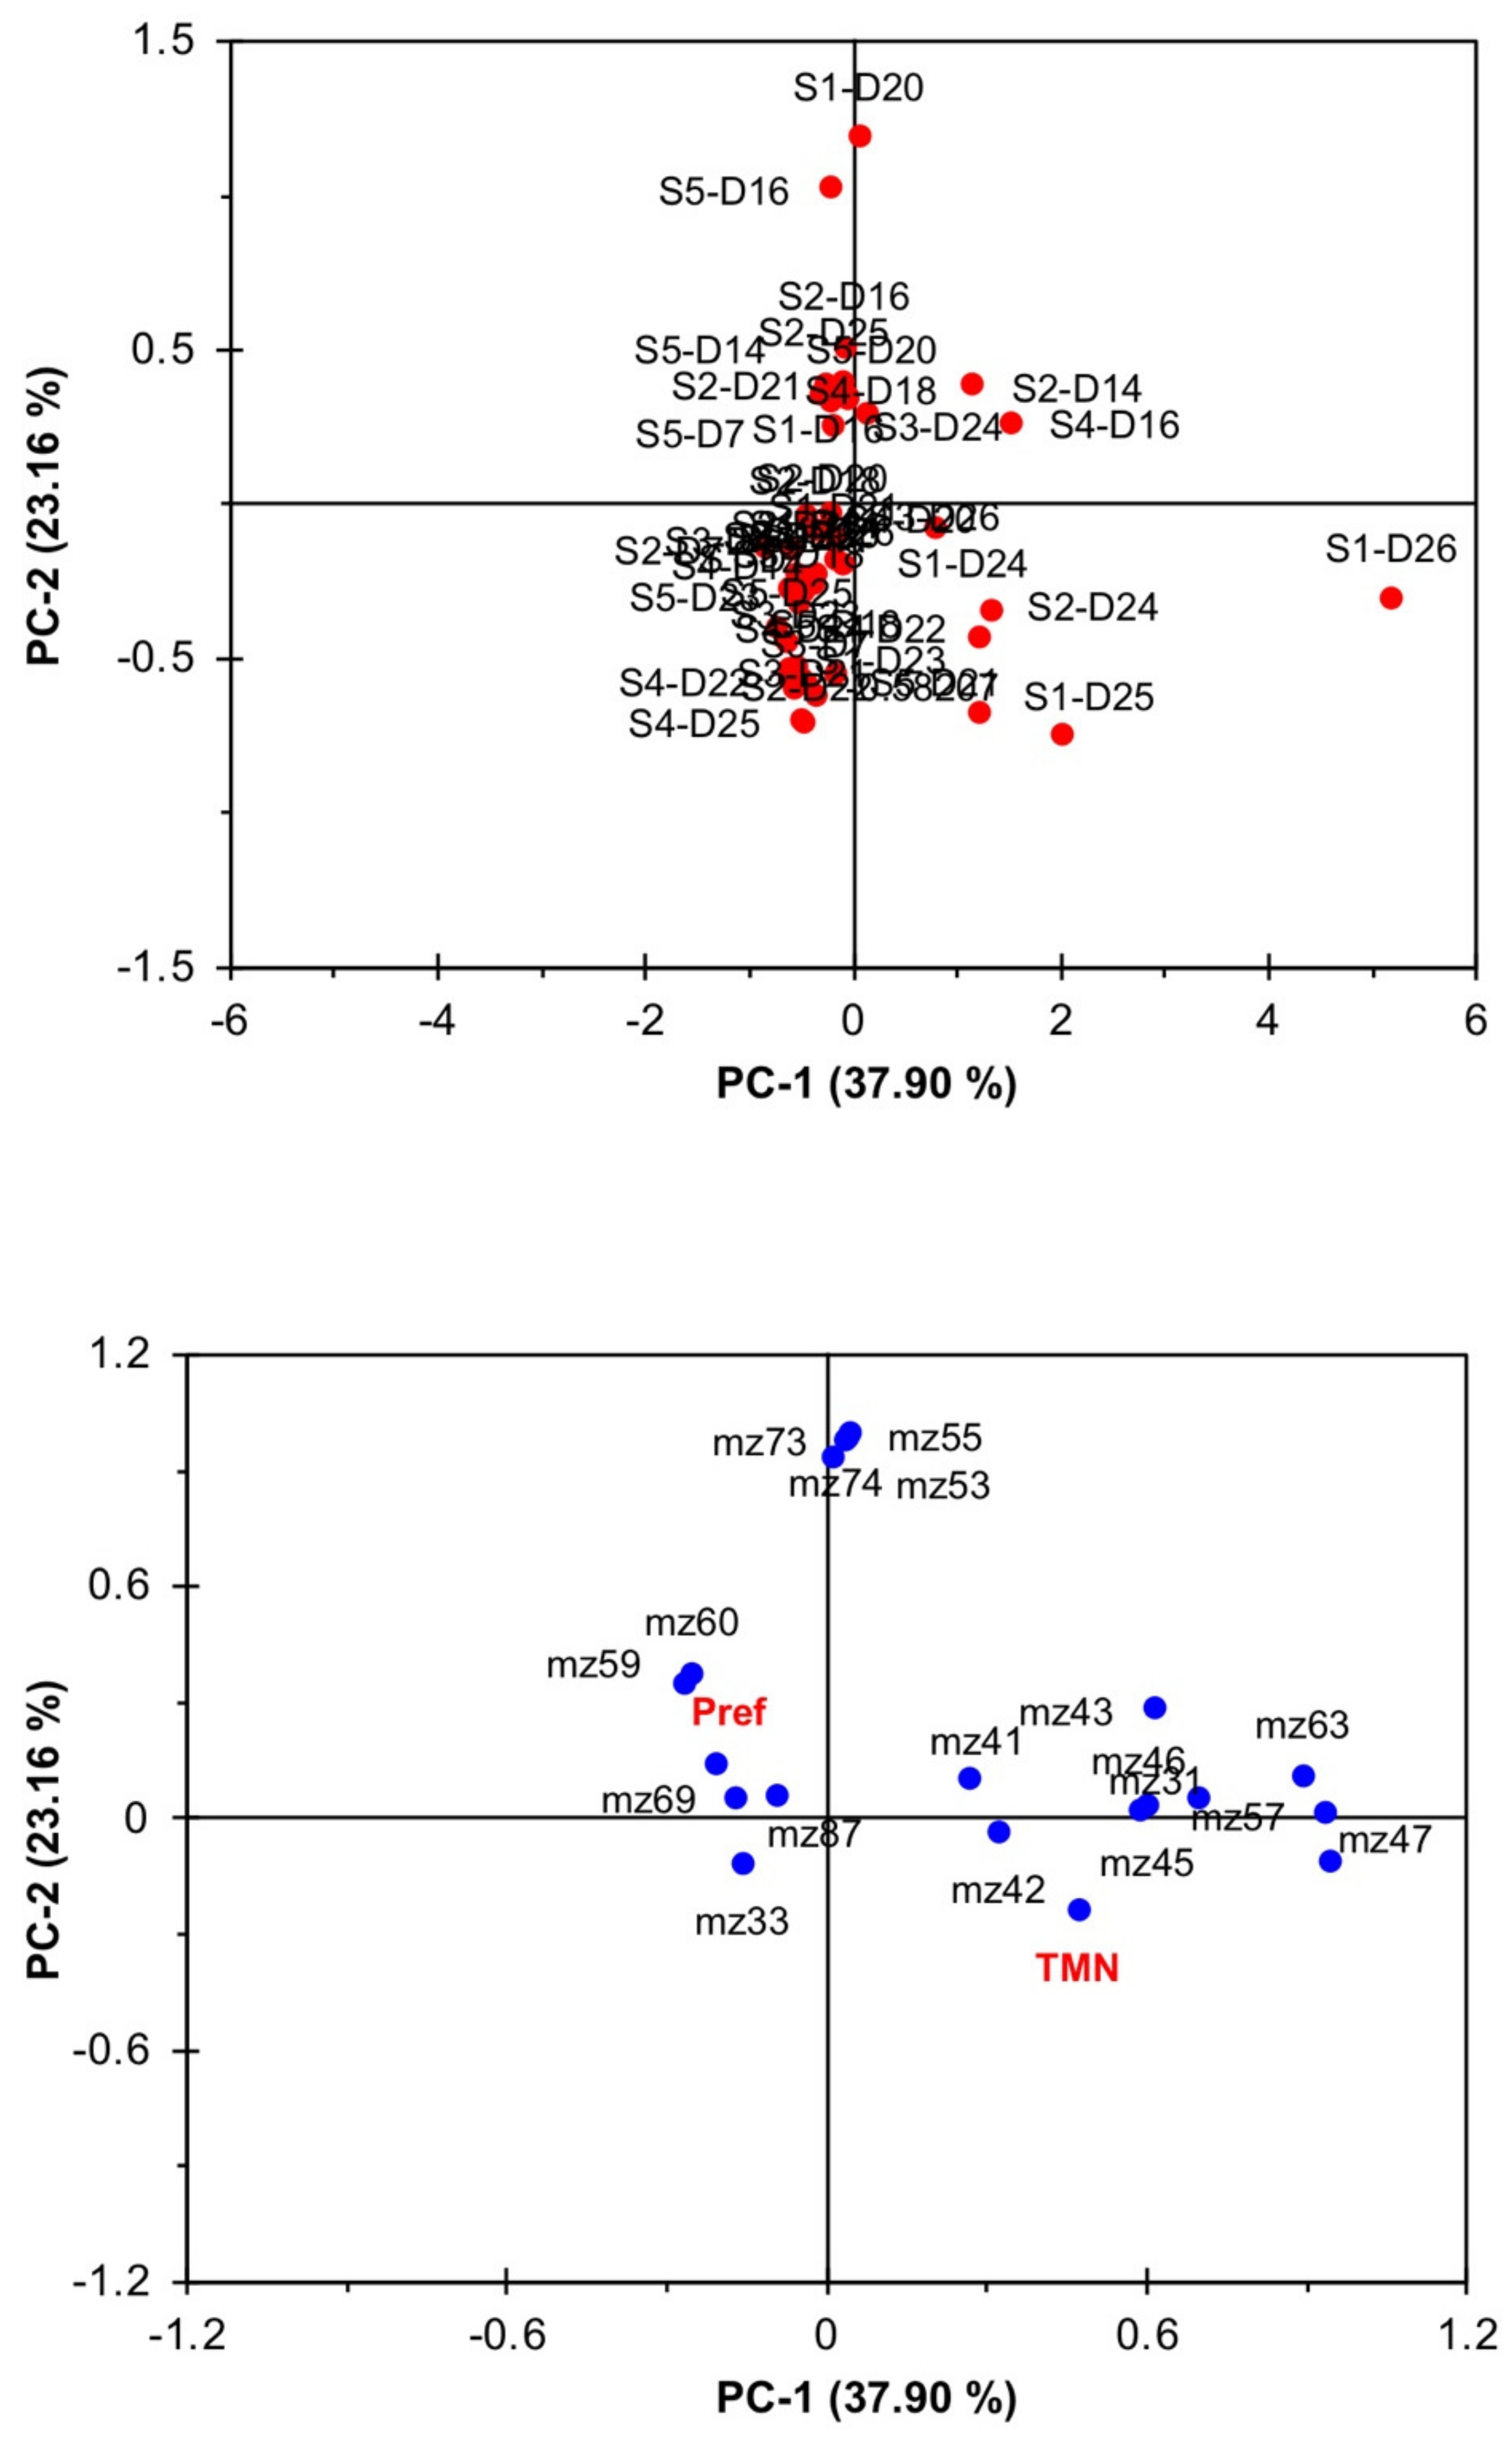
2.6.3. Studying the Interrelationship between Storage Time, TMN, VOC Composition and Consumers’ Preference Using Principal Component Analysis (PCA)

To investigate the interrelationship between storage time, changes in TMN, VOC composition, and consumers’ preference for aged FCPM, a principal component analysis (PCA) was carried out using as the active variables the data from the TMN, preference (%), and the significant m/z results from the statistical analyses (IBM SPSS Statistics version 20, SPSS Inc., Chicago, IL, USA). Separate PCAs were carried out on the WFCPM and Trim milk datasets. Data were rotated using the direct oblimin method to allow for correlation between factors. Analyses were carried out on the basis of Pearson’s correlation matrix to allow for direct comparisons between the datasets despite differences in their numerical range.

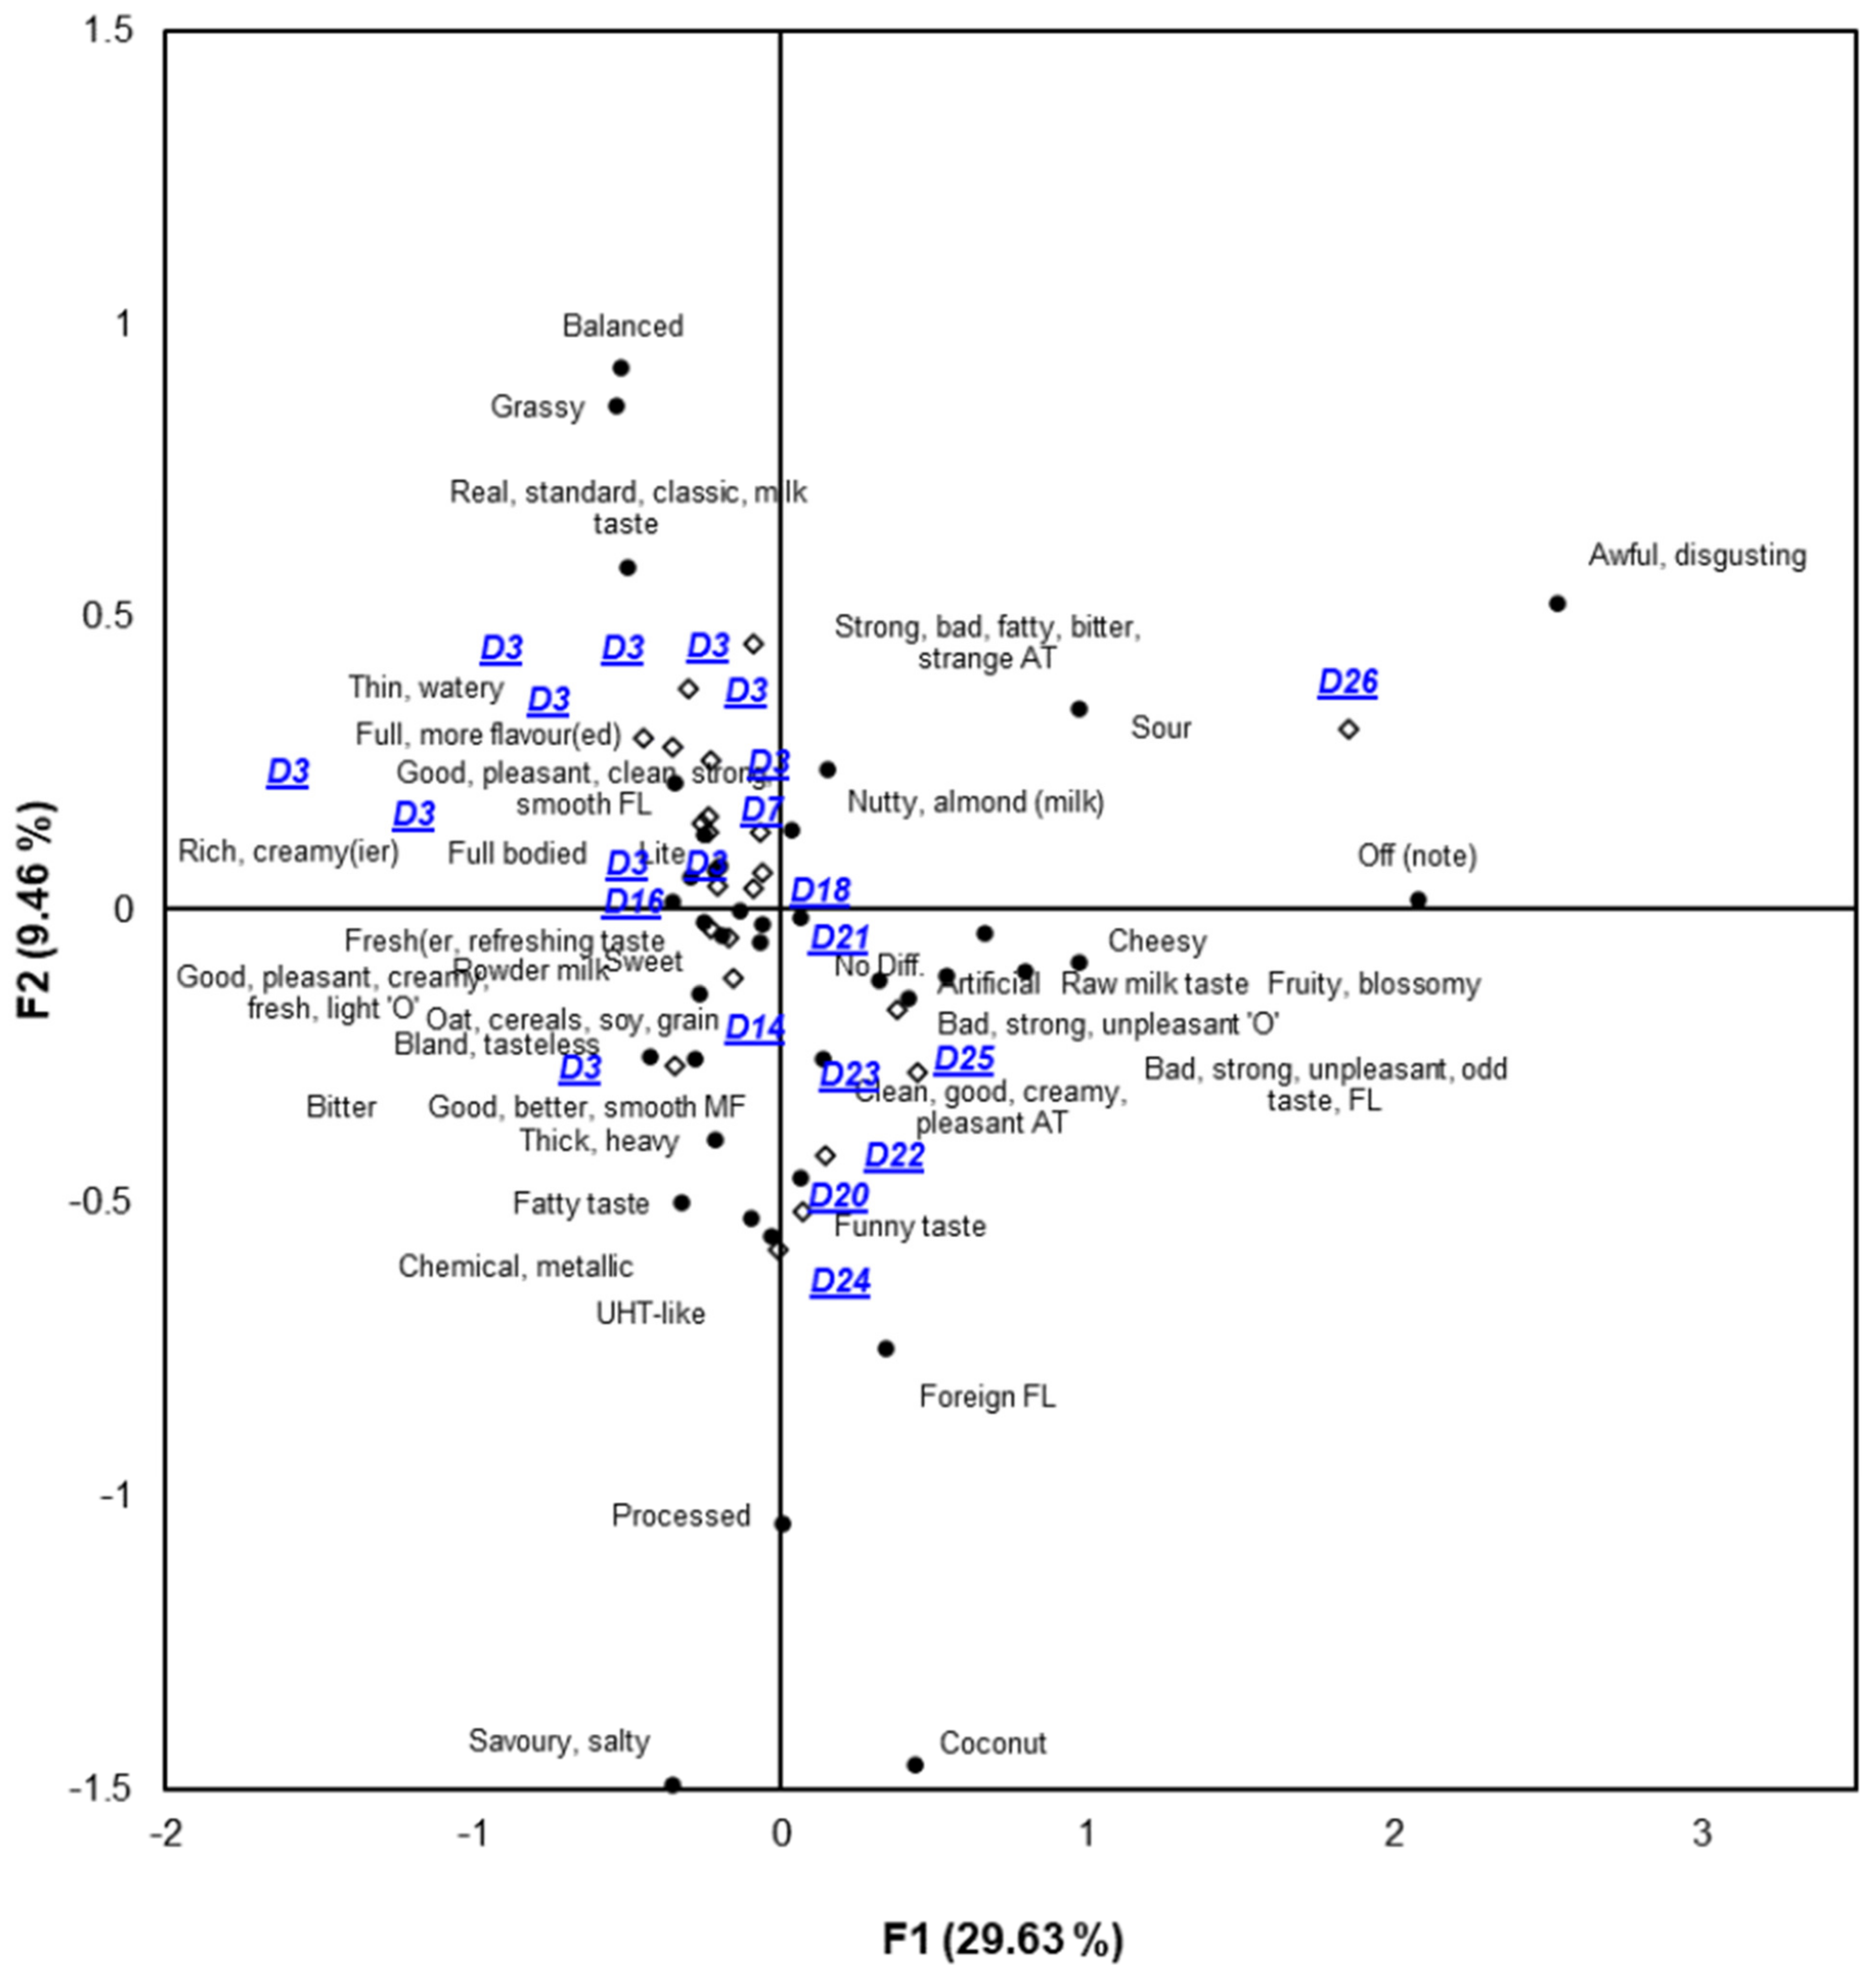
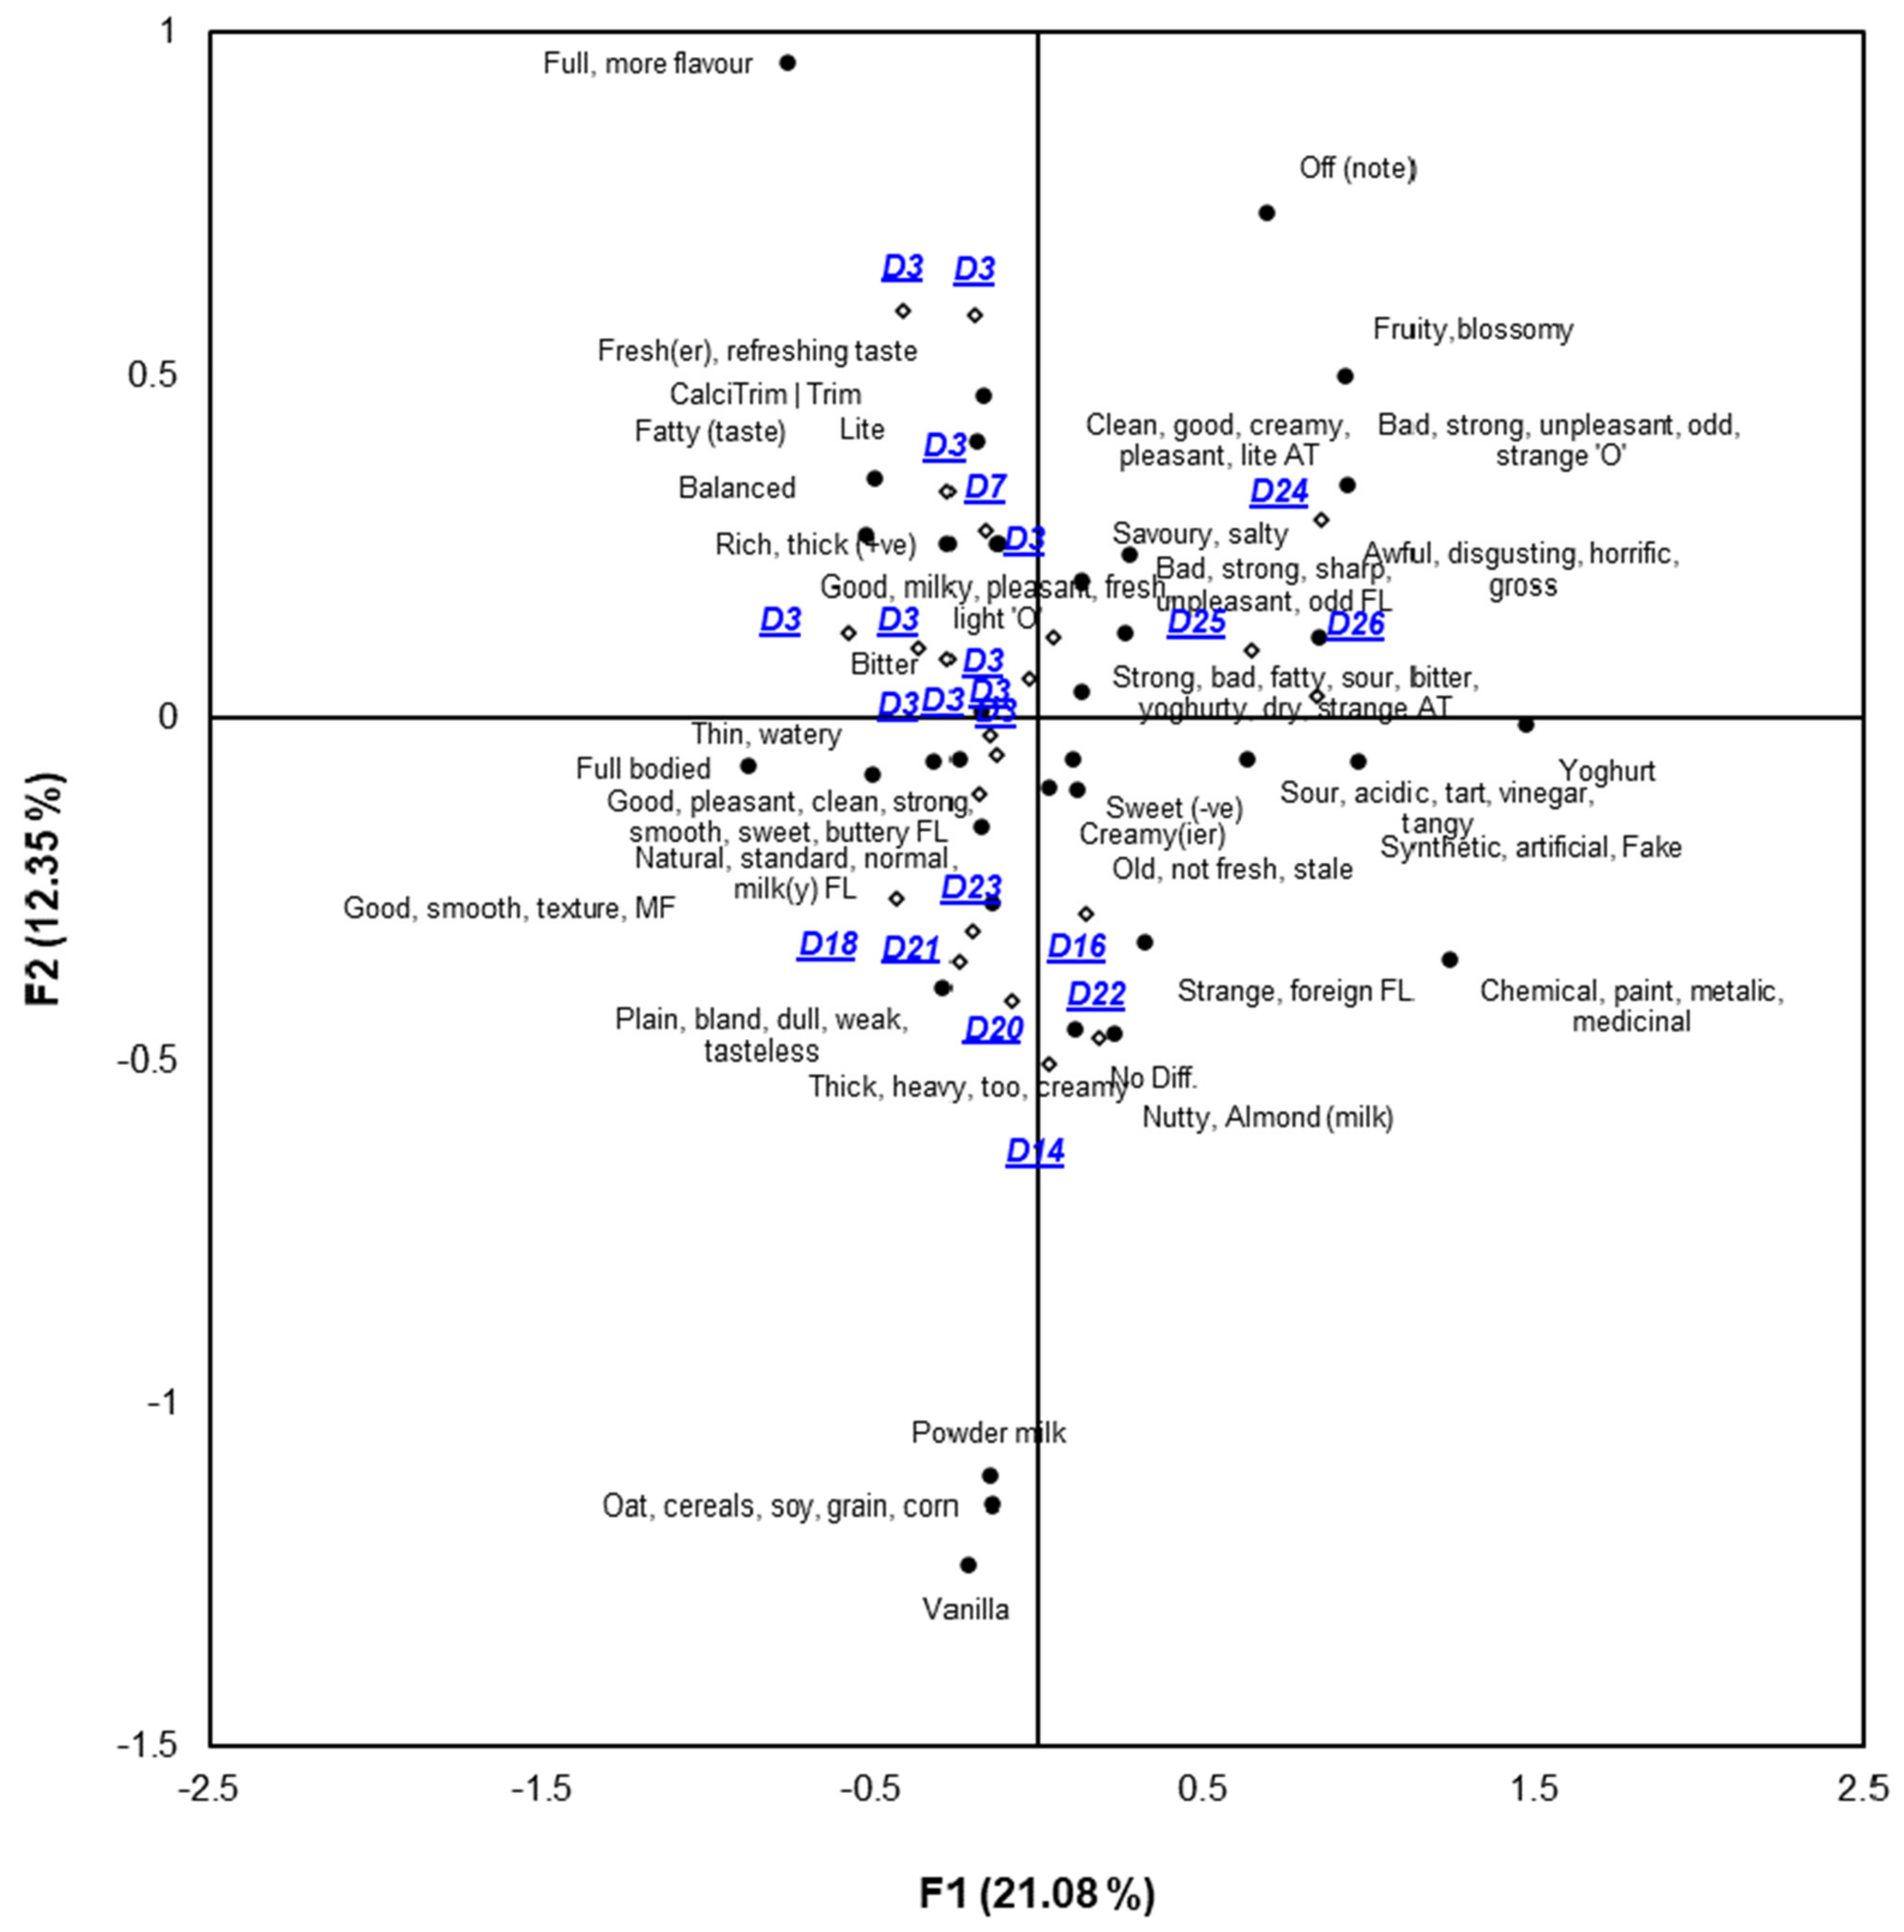
2.6.4. Studying the Relationship between Storage Time and Consumers’ Terms Using Correspondence Analysis (CA)

Preparation of Contingency Table

For each type of FCPM, the qualitative terms used by consumers to describe their liking of FCPM samples were analysed by manually extracting and consolidating the terms into groups of liking and disliking terms (attributes). This resulted in a two-way product-by-word table that consisted of n rows (R) (representing FCPM stored between 3 and 26 days) and n columns (C) (representing consumers’ terms for each FCPM sample). Each cell (RiCi) showed the frequency of the term used to describe FCPM stored for t days across all the sessions. The terms were consolidated into a final contingency table consisting of 22 rows (11 sets of fresh and aged milk) and 39 and 37 columns for WFCPM and Trim, respectively. An example of data consolidation of one set (pair) of fresh and aged FCPM is explained below:
A consumer selected the 3-day-old sample as their choice of preference and stated that it seemed fuller, had more taste, and was not as flat. From the statement, three terms were extracted: “full bodied” and “good taste” for the preferred sample and flat for the rejected sample. The consolidated list of terms used to describe the two types of FCPM used in the current study is presented in Table 1.

Correspondence Analysis (CA)

Correspondence analysis (CA) was applied to the contingency table to visualise the relationship between storage time (FCPM samples) and consumers’ terms. CA is a compositional technique that is developed to test for significant association of two or more categorical variables within a data matrix using the chi-square test (χ2), which can be visualised jointly in bi-dimensional graphs.

3. Results

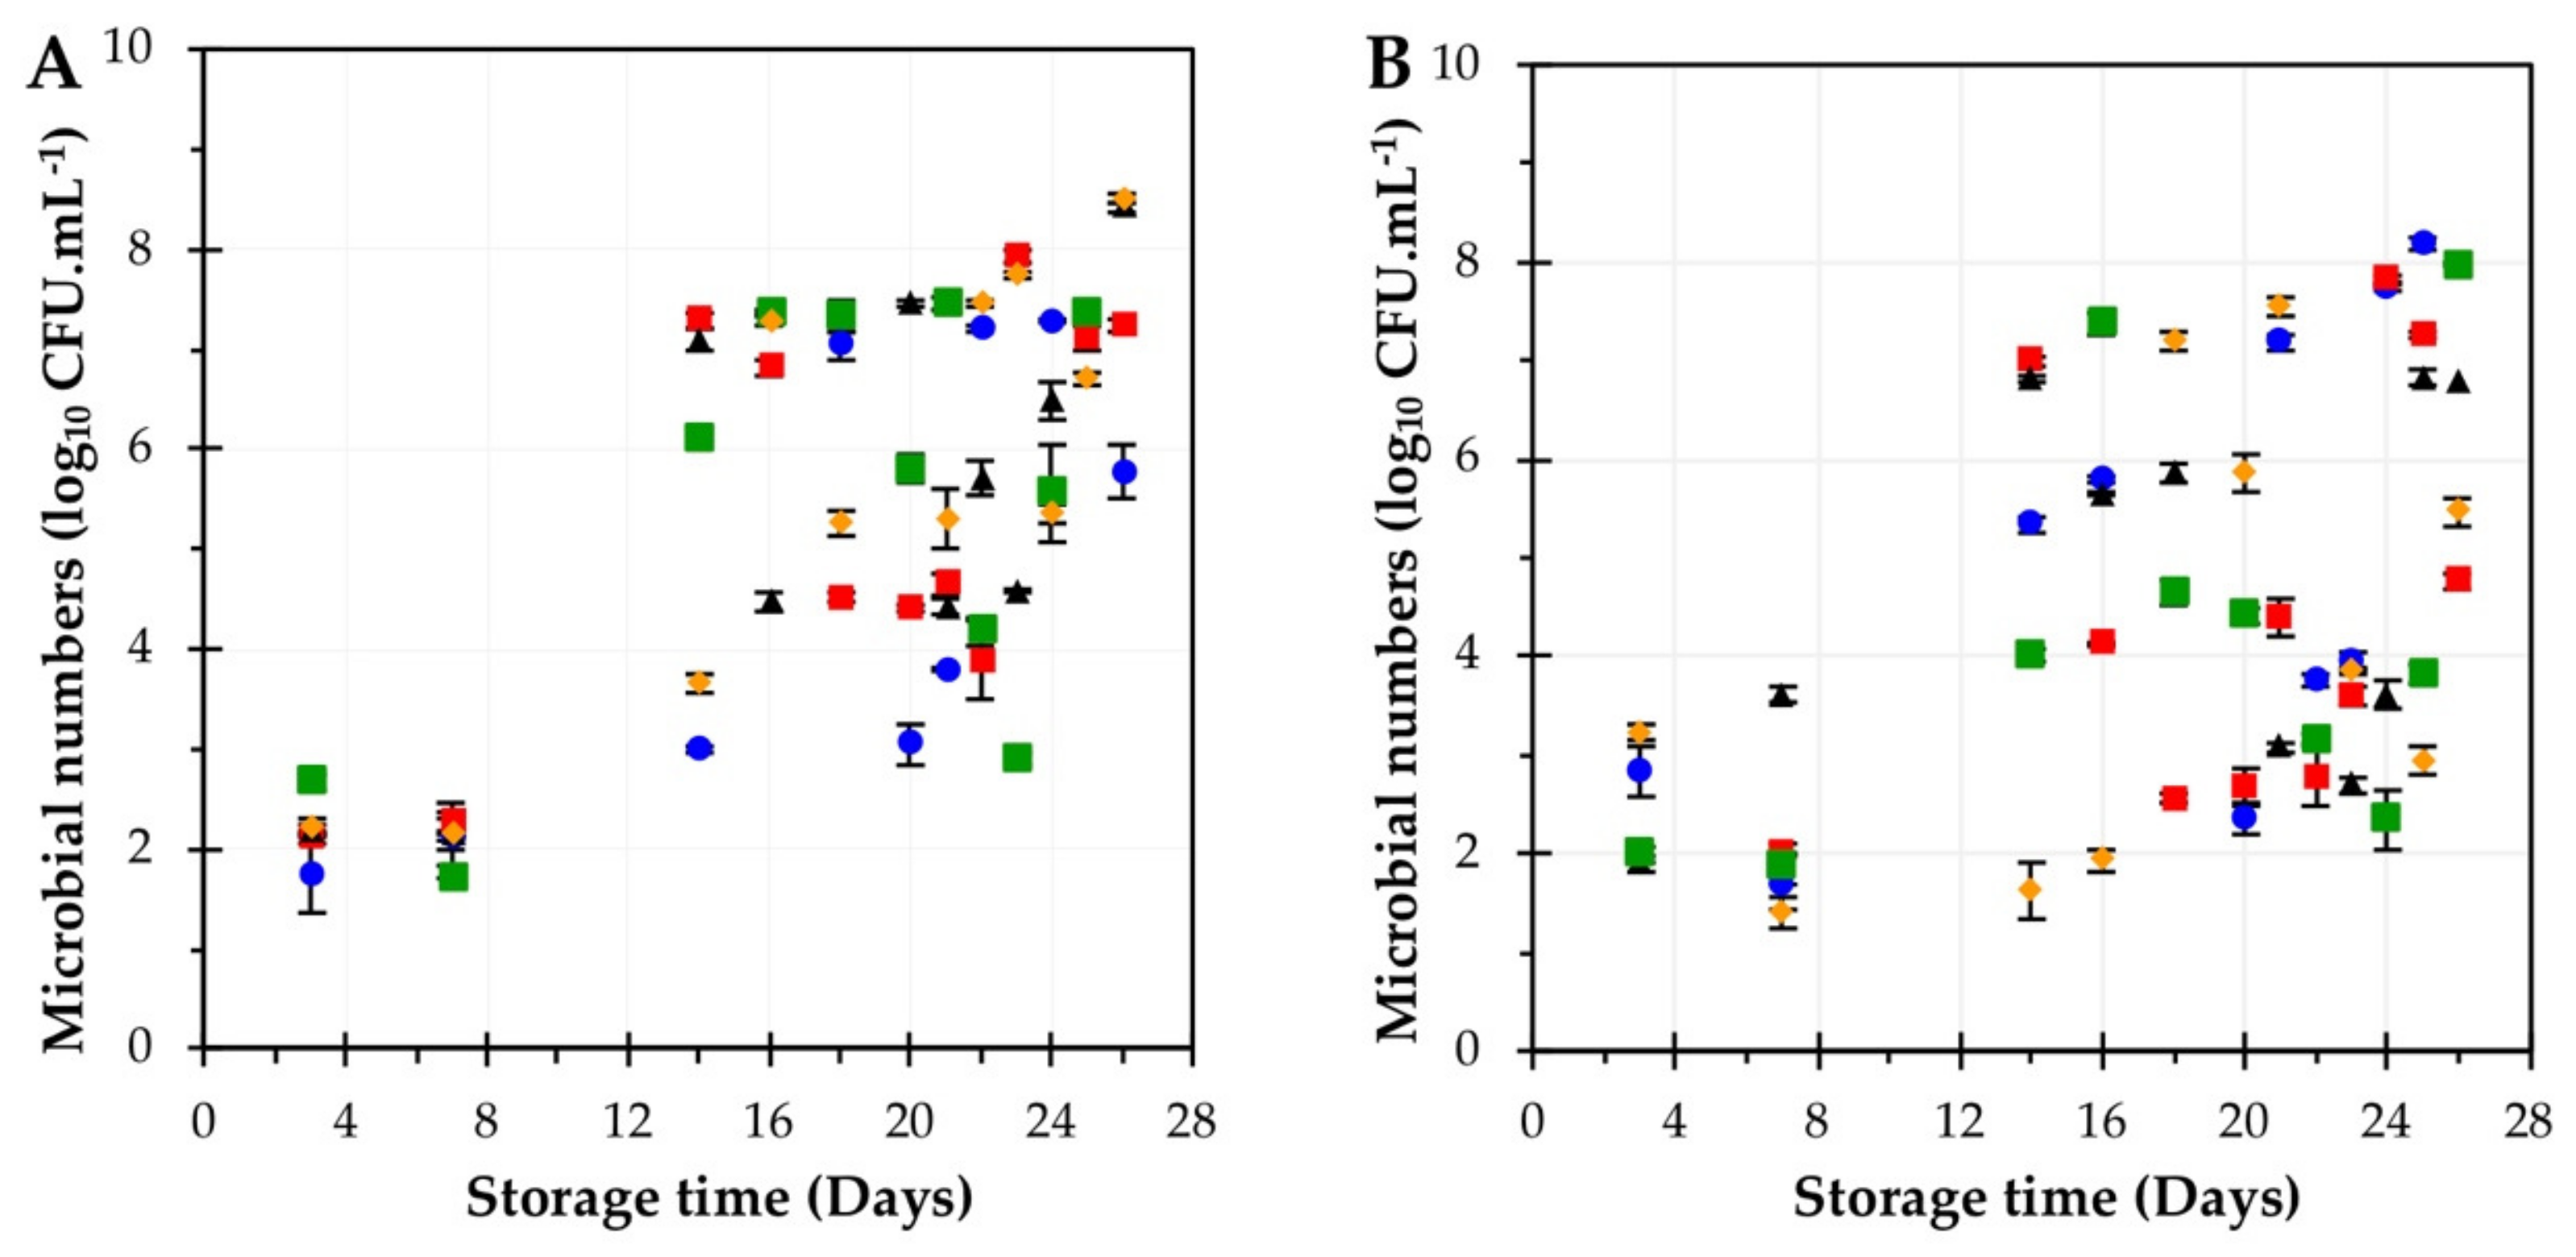
3.1. Determination of the Total Microbial Numbers (TMNs) in FCPM

The initial (day 3) numbers of microorganisms in the two types of milk used across all testing sessions ranged between 1.75–2.68 log10 CFU.mL−1 in WFCPM (Figure 1A) and 1.90–3.23 log10 CFU.mL−1 in Trim (Figure 1B). The variation in these initial numbers present in the milk was due to post-pasteurisation contamination with vegetative bacteria from the production environment, which grow naturally over time during the storage of FCPM at 4 °C with no external intervention. The highest TMN in the two types of milk recorded between 3 and 26 days was 8.51 log10 CFU.mL−1 on 26 days for WFCPM tested during session 5 (S5-D26) and 8.18 log10 CFU.mL−1 on 25 days for Trim tested during session 1 (S1-D25), respectively. Although these two samples had the highest TMN, other WFCPM and Trim samples in the present study had TMN close to, or higher than 8 log10 CFU.mL−1.
Variation in the microbial populations between and within the different batches (i.e., bottle-to-bottle or batch-to-batch) of FCPM (both WFCPM and Trim) was observed. This variation was independent of the storage time of FCPM samples (Figure 1A,B). For instance, the TMN in WFCPM stored for 23 days and tested on Session 4 (S4-D23) was approximately 3 log10 CFU.mL−1 lower than the TMN in WFCPM stored for 14 days and tested during the same session (S4-D14). Variation was also noticed in FCPM stored for the same time but tested across different sessions. For example, the TMN in Trim milk stored for 25 days and tested across sessions 1 to 5 varied from 2.94 to 8.18 log10 CFU.mL−1. This variation between and within the different batches meant that it was not possible to determine a temporal relationship between the TMN and storage time. Moreover, the variation in the TMN was observed in both WFCPM and Trim and appeared to be associated with the intermittent PPC and the growth characteristics of these contaminating microorganisms. The likely source of PPC could be from the filling machines, workers, surfaces, and the surrounding environment at the dairy processing plant, which are deemed potential contamination hubs.

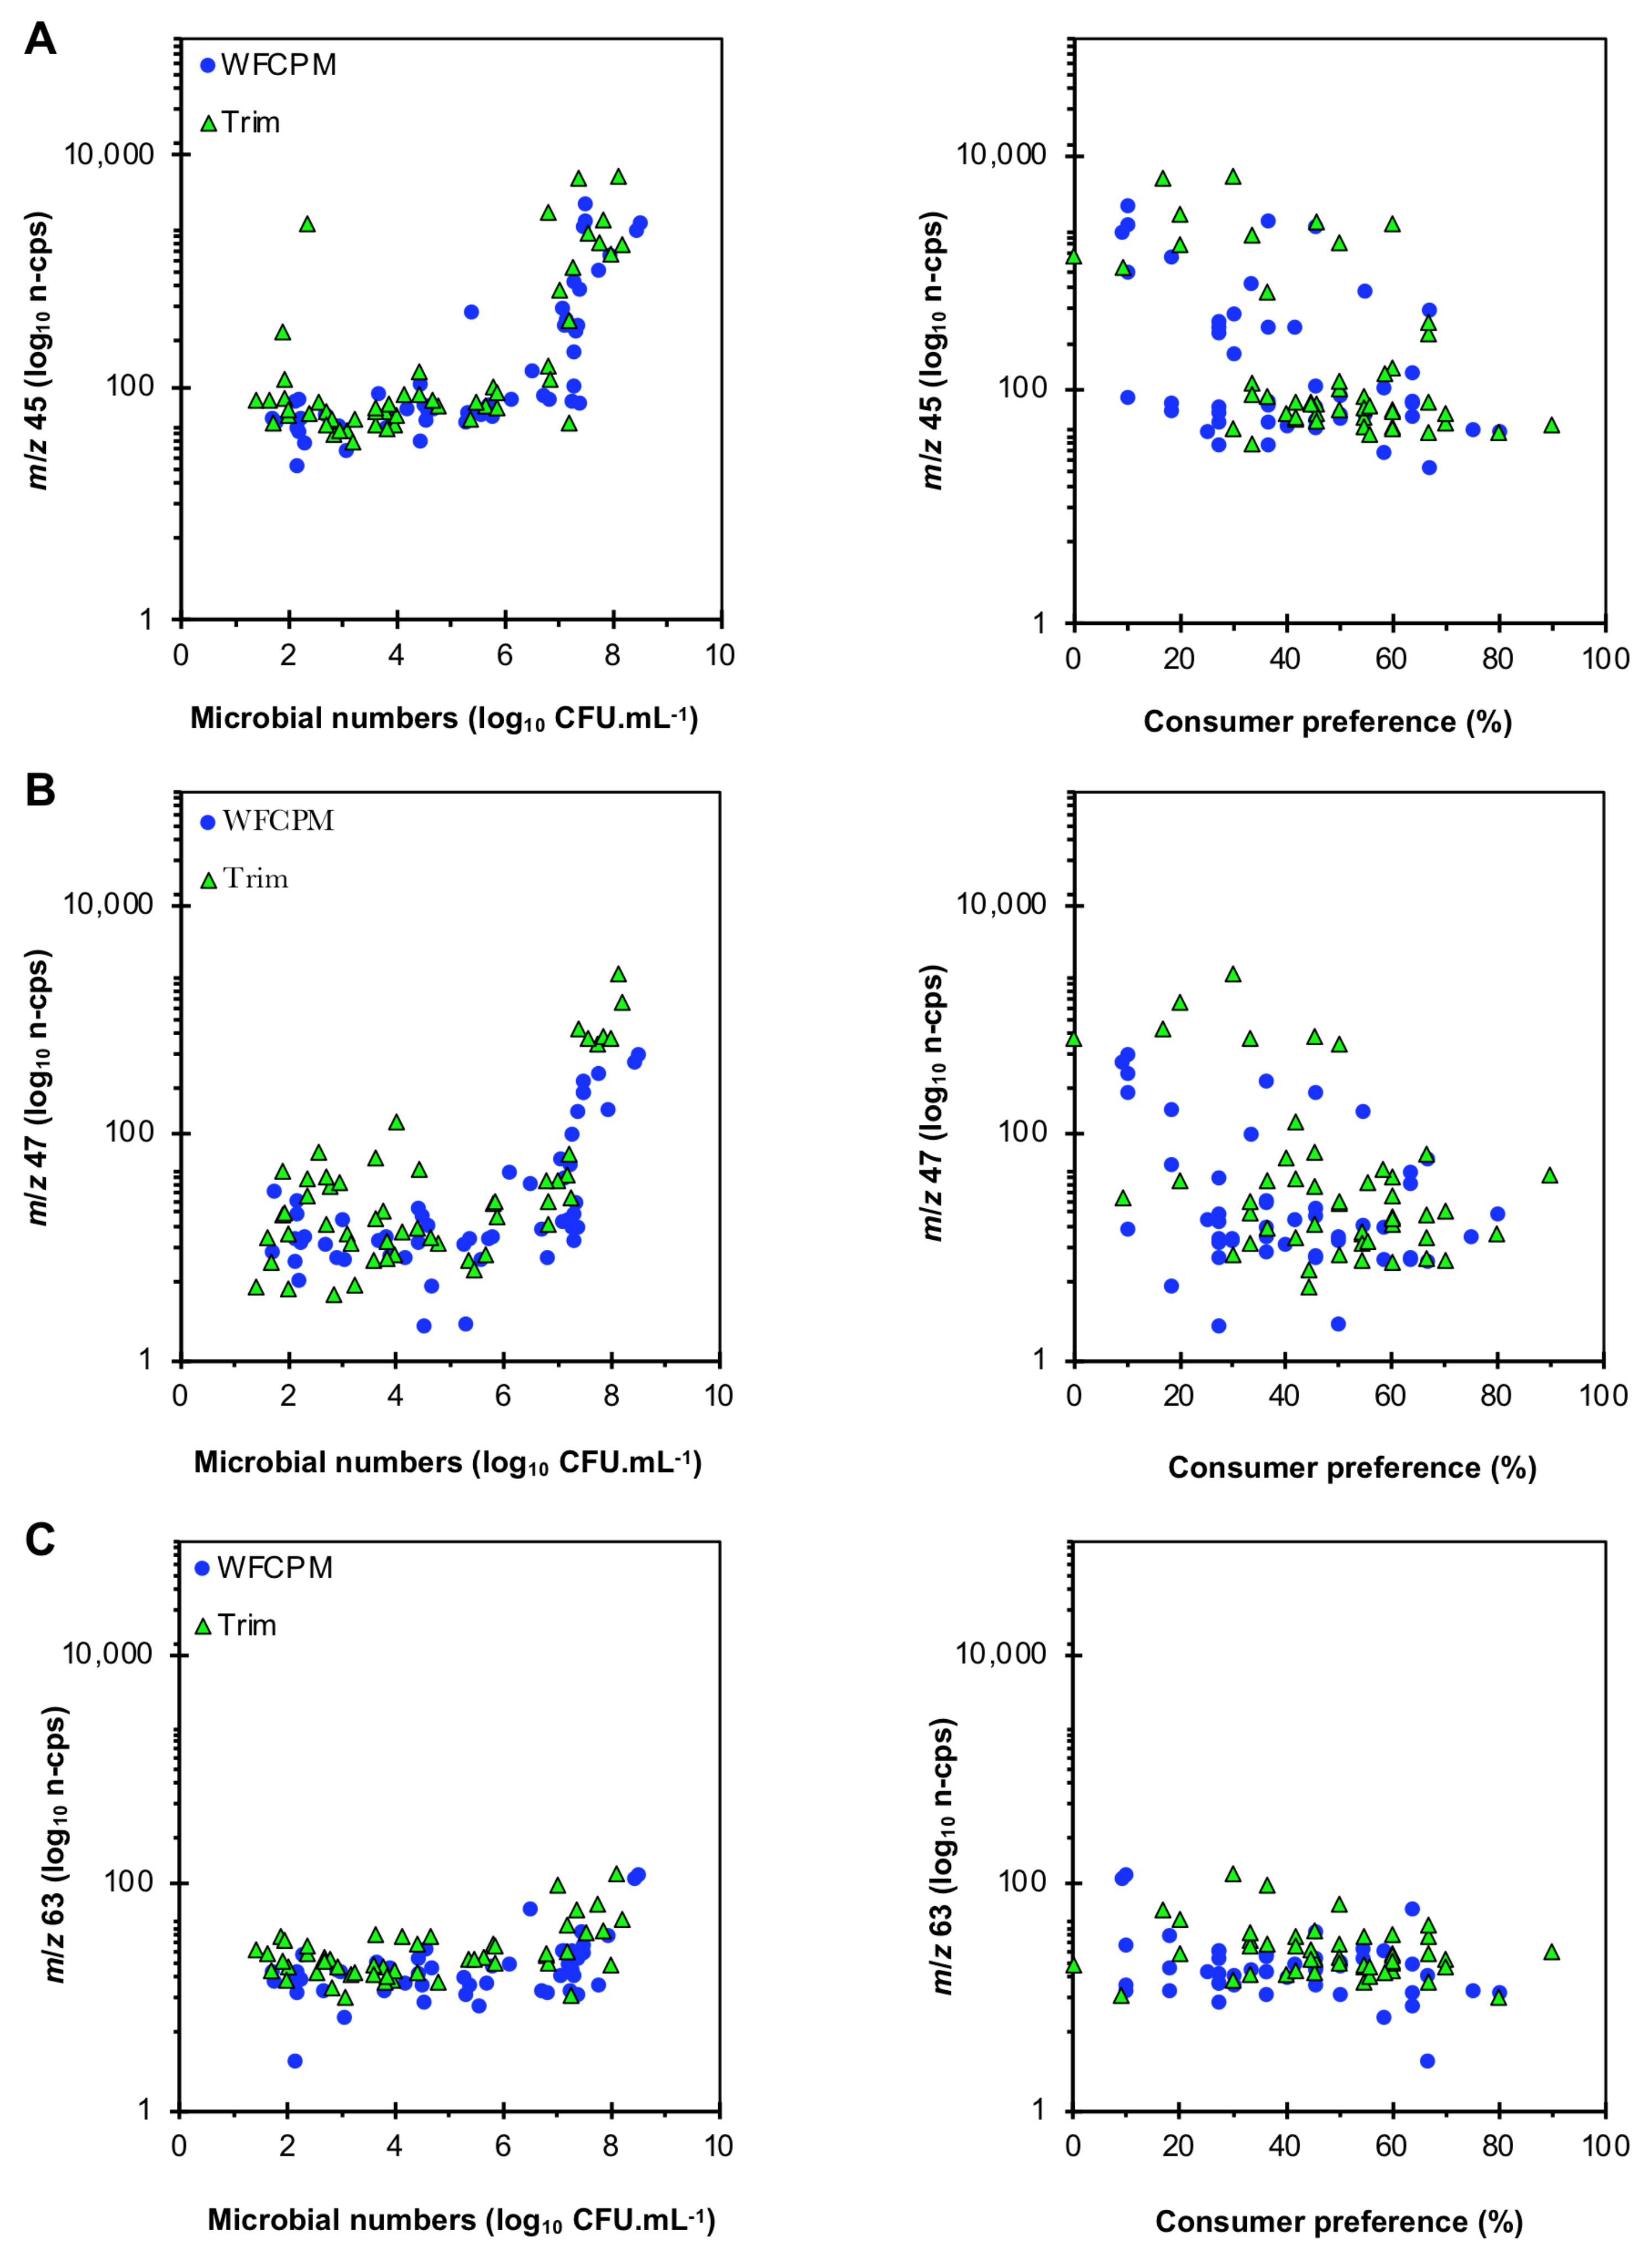
3.2. Changes in the VOC Composition of FCPM during Storage

The multifactor ANOVAs of the normalised PTR-MS datasets revealed significant storage time, consumer testing session, and storage time × consumer testing session interaction effects on the VOC composition of WFCPM and Trim (p ≤ 0.05). The significant consumer testing session and storage time × consumer testing session effects show that the VOC composition of aged FCPM was different between sessions and that the VOCs in each session did not change the same way as the milk storage time increased. This variability in VOCs resulted from the differences in the numbers of and potentially the types of microorganisms that contaminated FCPM post-pasteurization referred to in Section 3.1, which were expected to generate different types and concentrations of VOC in the headspace of FCPM. This result also shows that within the trial design that VOCs in milk can change independently of time.
Data analyses showed that the headspace of both WFCPM and Trim milk was characterised by significant (p < 0.05) changes in the intensities of a total of 21 m/z as a function of storage time (the period milk was held at chilled storage). These m/z belonged to different chemical classes (e.g., alcohols, ketones, aldehydes, carboxylic acids) and included m/z 41, 43, 45, 61, 63, 71, and 89 (tentative ID for m/z: various alcohols and esters; acetaldehyde; acetic acid or acetate esters; dimethyl sulphide (DMS); butyric acid; and fragments of butyrate esters, respectively). These VOCs have been previously detected in the headspace of FCPM and contribute sensory characters such as yoghurt, feedy, cheesy, and slightly sweet. A list of all the significant m/z found in the headspace of WFCP and Trim milk in the current study, their tentative identifications, and their sensory descriptors from the literature are presented in Table 2.
Qualitative differences in the VOC composition were observed between the two FCPM types, as a number of m/z were found to change significantly with storage time in the headspace of one but not the other milk (Tables S1 and S2). For example, changes in the signal intensities for m/z 61, 71, and 89 significantly changed over time in the headspace of WFCPM but not Trim (p ≤ 0.05), whereas significant changes in the signal intensities for m/z 69 and 87 were found in Trim only (p ≤ 0.05). Quantitative differences in the VOC composition in the two types of milk were also detected. For instance, the signal intensity for m/z 33, on average, was lower in the headspace of WFCPM compared to Trim milk. These qualitative and quantitative differences are ascribed to the microbial population (types and numbers) that contaminated the bottles/batches and their interactions [10], as well as the stage of spoilage rather than to differences in the storage time and/or differences in the composition of WFCPM and Trim. Furthermore, the bottle/batch variations affected not only the TMNs, as shown in Section 3.1, but also the VOC composition of FCPM, resulting in the lack of a clear trend in the changes occurring in the significant m/z in the two types of FCPM due to the weak relationship between changes in VOC composition and storage time. An example of this is seen in the signal intensity for m/z 43, which sometimes increased over time or initially increased before decreasing again, as shown in Tables S1 and S2.

3.3. Changes in Consumers’ Preference of FCPM during Storage

The percentage of consumers preferring the reference milk (i.e., fresh 3-day FCPM) over aged milk were 59.6 and 57% for WFCPM and Trim, respectively. It was observed that VOCs increased in the headspace of FCPM in response to the increasing numbers of microorganisms but not necessarily in response to a longer storage time. These observations meant that an accurate RjT50 could not be predicted based on a direct storage time-preference function for either of the two milk types. Interestingly, a trend in preference for fresh over aged FCPM was not observed at microbial numbers of less than 7 log10 CFU.mL−1 (Figure 1A,B). However, a general trend appeared when the TMN in FCPM samples was greater than 7 log10 CFU.mL−1, at which consumers tended to reject aged FCPM (Figure 1A,B). Hill’s equation was used to fit a sigmoidal line in the data to determine the RjT, where 50% (corresponds to 25% consumer preference for the aged sample) of consumers consistently reject FCPM (Figure 2A,B). The analysis revealed that the RjT for WFCPM and Trim milk was 7.43 and 7.34 log10 CFU.mL−1, respectively.
The increase in the TMN in FCPM samples (>7 log10 CFU.mL−1) corresponded to an increase in the signal intensity for a number of VOCs and a decrease in the proportion of consumers preferring the milk with high TMN, which shows that spoilage had occurred at and beyond the RjT values in the two milk types. While the relationship between the signal intensity of some of the m/z that significantly changed, and the TMN appeared to be positive, the relationship between signal intensity of the same m/z and consumer preference for the milk with high TMN were negative. For example, the signal intensity for m/z 45, 47, and 63 (tentative ID: acetaldehyde, ethanol, and DMS) increased by 85, 81, and 42% when the TMN increased from 7 log10 to 8.51 log10 CFU.mL−1. The negative relationship reflects the decrease in consumer preference for milk with high TMN as the abundance of these VOCs increases. Figure 3A–C shows the TMN and consumer preference separately plotted against the signal intensities for m/z 45, 47, and 63.
For the two milk types used in the current study, PCA separated samples based on their VOC composition rather than storage time. For WFCPM, the first two components explained 65.94% of the total variation, with 40.51% explained on PC-1 and 25.42% on PC-2. The PCA plots showed that the majority of the samples tested over the five sessions clustered in the centroid of the plot (Figure 4). However, samples S3-D26 and S5-D26 were positively loaded on PC-1. These two samples had the highest TMN (8.42, and 8.51 log10 CFU.mL−1, respectively) and higher signal intensities for m/z 43, 45, 47, 57, 61, 63, 71, and 89 compared to all other WFCPM samples tested over the five sessions (Figure 4). Further, consumers showed very low preference for these two kinds of milk compared to the control (9.09% and 10%, respectively) (Figure 2A), and samples within this storage time were described using negative terms including awful, gross flavour, off, expired, sour, spoilt, rancid, and bad smell or taste.
The headspace of WFCPM samples positively loaded on PC-2 (25.42%) had high signal intensities for m/z 53, 55, 59, 60, 73, and 74. These samples had a relatively low percentage of consumers’ preference (~30%) and higher numbers of microorganisms (Figure 4). Consumers described those samples as having a strong taste, off, unpleasant, oily, fatty, terrible, sweet (-ve), cheesy, and chemical. WFCPM samples that were negatively loaded on PC-2 had higher signal intensities for m/z 41, with high percentages of consumers’ preference and variable numbers of microorganisms, and consumers described these samples as being rich, full-flavoured, sweet, creamy, smooth texture, and good smell or taste.
For Trim milk, PC-1 and PC-2 explained 61.06% of the total variation in the data. Trim milk samples loaded positively on PC-1 (37.90%); in particular, S1-D26 and S4-D16 had higher numbers of microorganisms and higher signal intensities for m/z 31, 41, 42, 43, 45, 46, 47, 57, and 63 (Figure 5). Consumers described these samples as being yoghurty, tangy, unpleasant, coconut, chemical, and having a bad taste or smell. A group of Trim milk samples, in particular S1-D20 and S5-D16, were discriminated from the main group of samples towards the positive end of PC-2 (23.16%). These samples had lower numbers of microorganisms (TMN < 5 log10 CFU.mL−1) and higher signal intensities for m/z 53, 55, 73, and 74, and were described by consumers as being fatty, off, corn, smelly, odd taste, sour, drying, and having a bad aftertaste. The remaining samples were loaded negatively on both components on the PCA plot. These samples had variable numbers of microorganisms and higher signal intensities for m/z 33, 59, 60, 69, and 87. Consumers described these samples using terms such as almond (milk), nutty, natural, pleasant, nice, refreshing, and creamy. In terms of consumers’ preference, all samples clustered into the three groups (i.e., samples positively loaded on PC-1 and PC-2, and negatively loaded on both PCs) had variable preference percentages.
When explaining their preference, consumers frequently used terms that described FCPM flavour (e.g., pleasant, chemical), texture (e.g., creamy, thick, watery, etc.), and/or odour (e.g., pleasant, sharp). In the CA, there was a significant (p ≤ 0.05) difference in the frequency of consumers’ term use between the aged WFCPM (χ2 = 968.64) and Trim (χ2 = 831.86) milk.
The first two factors of the CA yielded a total inertia of 39.09 and 33.43% for WFCPM and Trim milk, respectively. For the two milk types, the terms related to consumer disliking were positively loaded on F1, while the terms related to liking were negatively loaded on F1 in the CA plots. Reference FCPM (3 days) corresponded closely to liking terms, including good flavour, pleasant, standard milk flavour, rich (creamy), and fresh (Figure 6 and Figure 7). Overall, the CA plots showed a trend towards a separation based on the storage time. This can be seen as a change in the frequency of terms used, where terms used to describe FCPM held between 14 and 20 days were a mixture of positive (e.g., good, smooth texture) and negative (e.g., chemical or artificial taste); however, negative terms were most frequently used after 20 days of storage. This result was in agreement with the separation patterns shown in the PCA plots (Figure 4 and Figure 5) and was supported by the calculated RjT using Hill’s equation, as shown in Figure 2.

4. Discussion

The starting point of this research was to determine the length of storage time required before consumers start to reject FCPM. The approach used was based on the assumption that there would be a direct relationship between time and the TMN during storage. However, due to the variability in the number of microorganisms detected in the tested FCPM samples (both WFCPM and Trim) owing to PPC, no direct relationship between the TMN and storage time was observed. This lack of relationship can be seen in the results of the microbiological analyses in this study where 49 (WFCPM (n = 21) Trim (n = 28)) out of 76 milk samples (~64%) that were stored for more than 14 days had a TMN of less than 7 log10 CFU.mL−1. The changes in VOC composition for these samples with a TMN of less than 7 log10 CFU.mL−1 stored for more than 14 days, in general, did not show a reduction in consumer preference. This result indicates that the 14-day limit displayed on FCPM bottles is a conservative quality indicator, rather than a definite timeline of the shelf life of FCPM. More interestingly, the present study revealed that the shelf life of FCPM is related to changes in the VOC composition of FCPM induced by microbial growth, presumably due to gram-negative psychrotrophs (e.g., Pseudomonas sp.). These entered FCPM through PPC, and when numbers were sufficiently high gave rise to the subsequent perceivable sensory characteristics (detected and/or identified). Consequently, PPC is the main obstacle that needs to be controlled before an extended FCPM shelf life can be proposed or consistently achieved.
The initial (3-day) TMN of both FCPM types ranged between 1.75 and 2.68 log10 CFU.mL−1. This variation in the initial TMN, although not able to predict the shelf life of FCPM during storage, indicated that a variation due to the incidence of PPC exists, which could be linked to a potentially longer shelf life should PPC be able to be consistently controlled. Although gram-negative psychrotrophs are killed by pasteurisation, they are ubiquitous in the FCPM processing environment and can re-contaminate pasteurised FCPM through pipelines, filler heads, surfaces, and bulk milk tanks [6,25].
Plotting consumers’ preferences versus the TMN provided a better understanding of the shelf life of FCPM than plotting preference versus storage time. Furthermore, fitting a Sigmoidal line to the data using Hill’s equation showed that when the TMN was less than 7 log10 CFU.mL−1, consumers showed no clear pattern in preference for FCPM; however, they started to reject FCPM once the TMN reached the RjT limit, where they constantly showed no or minimal preference towards an FCPM sample and described it using terms indicating a dislike response. Unfortunately, there was only a small number of observations with a TMN higher than 7 log10 CFU.mL−1 (WFCPM n = 19; Trim n = 10), as microbial numbers in the aged milks (TMN < 7 log10 CFU.mL−1) either increased at a slower rate or may have initially been present in lower numbers; therefore, extending the storage time of the milk to 26 days (12 days beyond the current use-by date) was a good approach since it enabled a clearer determination of the RjT.
The RjT values obtained for WFCPM and Trim milk in the present study support the data presented by Zahar, et al. [26] who reported a relationship between the TMN and the acceptance of different brands of FCPM stored at different temperatures using a trained panel. The panellists were asked to rate the acceptability of milk samples on a scale of 1 to 10, with the rejection of FCPM occurring when the TMN exceeded 7 log10 CFU.mL−1. Similarly, when Petrus, et al. [27] tested the keeping quality of FCPM at different temperatures. They found that a total mesophilic (i.e., TMNs) and psychrotrophic count of 7 log10 CFU.mL−1 and 6 log10 CFU.mL−1, respectively, which represented the upper limits of acceptability for maintaining the sensory quality (determined by a trained panel) of FCPM regardless of storage temperature. However, when using a trained panel it is not possible to robustly determine acceptability, as the panellists are not naive consumers and the number of panellists is not representative of a consumer sample [14].
Unlike in the current study, previous research using the rejection threshold used a predetermined stimuli concentration range to calculate the RjT at a point where either a significant change in consumers’ preference occurred or when 50% of consumers rejected the product [11,12,13,19]. The concentrations of the stimuli at each measurement point in the present study (i.e., changes in TMN, or VOCs abundance) were neither equal nor predetermined and depended upon the extent of PPC incidence (the numbers and species of the contaminating microorganisms).
In the present study, perceivable changes in the VOC composition of FCPM occurred at a high TMN, which suggests that the contaminating microorganisms produced off-odours that affected consumers’ preference, as illustrated in Figure 3. The abundance of spoilage related VOCs increased rapidly as the TMNs reached the point where consumers started to reject FCPM. A high percentage of consumers disliked FCPM, which had a VOC composition containing high signal intensities of m/z 41, 45, 47, 53, 55, 57, 61, 63, 71, and 89. These m/z are tentatively identified as a mixture of alcohols, aldehydes, ketones, and volatile acids, and are generated through various biochemical pathways as by-products of the metabolic activities (i.e., lipolysis and proteolysis) of microorganisms in FCPM [28,29,30,31]. The detection of these VOCs has previously been ascribed to spoilage [9,31,32,33,34]. Furthermore, the increase in the signal intensities for some or all these m/z, particularly m/z 71 and 89, coincided with consumers’ rejection of FCPM. Note that the rejection might not be only associated with the accumulation of these VOCs, as these VOCs may be correlated with other undetected VOCs that contribute undesirable sensory attributes and are below the limit of detection of the PTR-MS.
A TMN of 7 log10 CFU.mL−1 has previously been reported as the point where VOCs start to rapidly change (spoilage) in different chilled food, including FCPM [9,23,25,31,35] and meat [21,22]. Other authors have stated that it is the tendency of certain species of microorganisms to produce off-odours during growth rather than their numbers in food, which is important in spoilage [10,36]. In reality, it is likely that the rate of spoilage is due to a combination of the nature of VOCs produced by the microbial strains present, their numbers, and their ability to grow in food under the given storage conditions (e.g., temperature, atmosphere).
Relating chemical data to consumers’ perceptions allows for a better understanding of the differences between products to be obtained [37,38]. PCAs were applied to study the interrelationship between microbial quality, VOC composition, and consumers’ preference for the two types of FCPM. The PCA showed that for the two milk types, changes in consumers’ preferences occurred in a similar fashion. Spoilage occurred concurrently with the accumulation of m/z 43, 45, 47, 61, 63, 71, and 89 in the headspace of FCPM at TMNs equal to or exceeding 7 log10 CFU.mL−1. Those m/z were tentatively identified as fragments of ketones, esters and alcohols; acetaldehyde; ethanol, acetic acid and acetate esters; DMS; fragments of butyric acid; and butyrate esters and butyric acid (Table 2). Furthermore, m/z 43, 45, 47, 61, 63, 71, and 89 contributed to a number of off-notes such as yoghurt, feedy, cowy, vinegar, sulfur, unclean, vomit, and cheesy [24,39]. Consumers tended to reject FCPM with a higher TMNs using stronger disliking terms such as awful, gross, spoilt, expired, and rancid. These two stages of spoilage suggest that changes in the sensory characteristics of FCPM occur as a result of the changes in the headspace VOCs. A sub-group of samples was also identified where a higher gas phase abundance of m/z 53, 55, 59, and 73 in Trim milk was present. These m/z were tentatively related to a wide range of alcohols and carbonyl compounds (ketones and aldehydes) (Table 2) and could possibly result from the effect of feed, chemical, or raw milk quality. Terms used to describe this milk included unpleasant, tangy, chemical, bland, strong taste, and fatty. Based on their loadings, these samples were not associated with lower preference. Furthermore, although the numbers of microorganisms in these FCPMs varied, they were less than 7 log10 CFU.mL−1.
Low total inertias in the CA were probably due to the low frequency for a number of the terms used, which occurred as a result of the zero entries when only a small number of consumers tended to use a specific term [40]. In general, total inertia above 20% is considered adequate for data representations [41].

5. Conclusions

Regular consumers of two types of FCPM, namely WFCPM and Trim, were used to assess changes in consumers’ preference for FCPM stored at 4.5 ± 0.5 °C for between 3 and 26 days. Due to the naturally occurring variability in the total number of microorganisms in the VOC composition within and between FCPM batches owing to differing initial levels of post-pasteurisation contamination, a significant relationship between FCM storage time and the TMN was not observed. However, a series of paired preference tests comparing the control fresh milk and aged milk stored for up to 26 days found that consumers’ preference shifted once the TMN exceeded a critical value, which was referred to in this study as the RjT. At a TMN greater than or equal to the RjT, participants started to use terms to describe the aged FCPM, which indicated dislike and corresponded to an increase in the signal intensities for a number of spoilage-related VOCs in the headspace of FCPM. The ability to attribute changes in the sensory properties of FCPM owing to the build-up of VOC in its headspace from the higher TMN has provided a better understanding of why consumers reject FCPM during chilled storage. The novel multidisciplinary approach used in this study has provided data on how increases in TMNs and changes in VOCs affect consumer preference, thereby highlighting the applicability of this approach to assess shelf life and/or the effectiveness of techniques designed to enhance shelf life.

Supplementary Materials

The following supporting information can be downloaded at https://www.mdpi.com/article/10.3390/beverages9020053/s1, Table S1: ANOVA results and mean intensities (n-cps) of the significant volatile mass ions (p ≤ 0.05) detected in the headspace of WFCPM milk by proton transfer reaction–mass spectrometry analysis during refrigerated storage at 4.5 ± 0.5 °C between 3 and 26 days (n = 5); Table S2: ANOVA results and mean intensities (n-cps) of the significant volatile mass ions (p ≤ 0.05) detected in the headspace of Trim milk by proton transfer reaction–mass spectrometry analysis during refrigerated storage at 4.5 ± 0.5 °C between 3 and 26 days (n = 5).

Author Contributions

Conceptualisation, M.A., P.J.B. and P.S.; methodology, M.A., P.J.B., K.L. and P.S.; software, P.S.; data curation, M.A. and P.S.; data analysis, M.A. and P.S.; writing—original draft preparation, M.A.; writing—review and editing, M.A., P.J.B., P.S. and K.L.; supervision, P.J.B., P.S. and K.L; project administration, P.J.B. All authors have read and agreed to the published version of the manuscript.

Funding

M. Alothman received a UoO Doctoral Scholarship.

Institutional Review Board Statement

All subjects gave their informed consent for inclusion before they participated in the study. The study was conducted in accordance with the Declaration of Helsinki, and the protocol was approved by the University of Otago Human Ethics Committee (project identification code reference 12/160).

Data Availability Statement

The data presented in this study are available on request from the corresponding author. The data are not publicly available due to restrictions associated with our ethics application.

Conflicts of Interest

The authors declare no conflict of interest.

Abbreviations

(W)FCPM: (whole) fresh chilled pasteurised milk; Trim: skimmed milk (fat 0.25–0.40%); VOC: volatile organic compound; PTR-MS: proton transfer reaction–mass spectrometry; RjT: rejection threshold; PPM: part per million; TMN: total microbial number; CFU: colony-forming unit; sccm: standard cubic centimetre per minute; n-cps: normalised counts per second; GLM: general linear model; PCA: principal component analysis; CA: correspondence analysis; PPC: post-pasteurization contamination; and m/z: mass-to-charge ratio.

References

  1. Santos, M.V.; Ma, Y.; Caplan, Z.; Barbano, D.M. Sensory threshold of off-flavors caused by proteolysis and lipolysis in milk. J. Dairy Sci. 2003, 86, 1601–1607. [Google Scholar] [CrossRef] [PubMed] [Green Version]
  2. Chen, P.-J.; Antonelli, M. Conceptual models of food choice: Influential factors related to foods, individual differences, and society. Foods 2020, 9, 1898. [Google Scholar] [CrossRef] [PubMed]
  3. Lacroix, M.; Bon, C.; Bos, C.; Léonil, J.; Benamouzig, R.; Luengo, C.; Fauquant, J.; Tomé, D.; Gaudichon, C. Ultra High Temperature Treatment, but Not Pasteurization, Affects the Postprandial Kinetics of Milk Proteins in Humans1,2. J. Nutr. 2008, 138, 2342–2347. [Google Scholar] [CrossRef] [PubMed] [Green Version]
  4. Ansari, J.A.; Ismail, M.; Farid, M. Extension of shelf life of pasteurized trim milk using ultraviolet treatment. J. Food Saf. 2020, 40, e12768. [Google Scholar] [CrossRef]
  5. Chawla, R.; Sivakumar, S.; Mishra, S.K.; Kaur, H.; Anurag, R.K. Modified atmosphere packaging for milk cake: Assessment of ideal gas composition for extending shelf life. Br. Food J. 2021, 123, 2893–2906. [Google Scholar] [CrossRef]
  6. Samaržija, D.; Zamberlin, Š.; Pogačić, T. Psychrotrophic bacteria and their negativeeffects on milk and dairy products quality. Mljekarstvo 2012, 62, 77–95. [Google Scholar]
  7. Poghossian, A.; Geissler, H.; Schöning, M.J. Rapid methods and sensors for milk quality monitoring and spoilage detection. Biosens. Bioelectron. 2019, 140, 111272. [Google Scholar] [CrossRef]
  8. Lester, S.; Cornacchia, L.; Corbier, C.; Hurst, K.; Ayed, C.; Taylor, M.A.; Fisk, I. Age group determines the acceptability of protein derived off-flavour. Food Qual. Prefer. 2021, 91, 104212. [Google Scholar] [CrossRef]
  9. Silcock, P.; Alothman, M.; Zardin, E.; Heenan, S.; Siefarth, C.; Bremer, P.J.; Beauchamp, J. Microbially induced changes in the volatile constituents of fresh chilled pasteurised milk during storage. Food Packag. Shelf Life 2014, 2, 81–90. [Google Scholar] [CrossRef]
  10. Alothman, M.; Lusk, K.A.; Silcock, P.; Bremer, P.J. Comparing PTR-MS profile of milk inoculated with pure or mixed cultures of spoilage bacteria. Food Microbiol. 2017, 64, 155–163. [Google Scholar] [CrossRef]
  11. Prescott, J.; Norris, L.; Kunst, M.; Kim, S. Estimating a “consumer rejection threshold” for cork taint in white wine. Food Qual. Prefer. 2005, 16, 345–349. [Google Scholar] [CrossRef]
  12. Saliba, A.J.; Bullock, J.; Hardie, W.J. Consumer rejection threshold for 1,8-cineole (eucalyptol) in Australian red wine. Food Qual. Prefer. 2009, 20, 500–504. [Google Scholar] [CrossRef]
  13. Torrico, D.D.; Tam, J.; Fuentes, S.; Gonzalez Viejo, C.; Dunshea, F.R. Consumer rejection threshold, acceptability rates, physicochemical properties, and shelf-life of strawberry-flavored yogurts with reductions of sugar. J. Sci. Food Agric. 2020, 100, 3024–3035. [Google Scholar] [CrossRef]
  14. Lawless, H.T.; Heymann, H. Preference testing. In Sensory Evaluation of Food; Food Science Text Series; Springer: New York, NY, USA, 2010; pp. 303–324. [Google Scholar]
  15. Issa Mattos, D.; Martins Silva Ramos, É. Bayesian paired comparison with the bpcs package. Behav. Res. Methods 2022, 54, 2025–2045. [Google Scholar] [CrossRef]
  16. Drake, M.A. Invited review: Sensory analysis of dairy foods. J. Dairy Sci. 2007, 90, 4925–4937. [Google Scholar] [CrossRef] [Green Version]
  17. Hough, G.; Sánchez, R.H.; Garbarini de Pablo, G.; Sánchez, R.G.; Calderón Villaplana, S.; Giménez, A.M.; Gámbaro, A. Consumer acceptability versus trained sensory panel scores of powdered milk shelf-life defects. J. Dairy Sci. 2002, 85, 2075–2080. [Google Scholar] [CrossRef] [Green Version]
  18. Giménez, A.; Ares, F.; Ares, G. Sensory shelf-life estimation: A review of current methodological approaches. Food Res. Int. 2012, 49, 311–325. [Google Scholar] [CrossRef]
  19. Harwood, M.L.; Ziegler, G.R.; Hayes, J.E. Rejection thresholds in chocolate milk: Evidence for segmentation. Food Qual. Prefer. 2012, 26, 128–133. [Google Scholar] [CrossRef]
  20. Campo, E.; Saenz-Navajas, M.P.; Cacho, J.; Ferreira, V. Consumer rejection threshold of ethyl phenylacetate and phenylacetic acid, compounds responsible for the sweet-like off odour in wines made from sour rotten grapes. Aust. J. Grape Wine Res. 2012, 18, 280–286. [Google Scholar] [CrossRef]
  21. Dainty, R.H.; Mackey, B.M. The relationship between the phenotypic properties of bacteria from chill-stored meat and spoilage processes. J. Appl. Bacteriol. 1992, 73, 103s–114s. [Google Scholar] [CrossRef]
  22. Rodríguez-Calleja, J.M.; García-López, M.-L.; Santos, J.A.; Otero, A. Development of the aerobic spoilage flora of chilled rabbit meat. Meat Sci. 2005, 70, 389–394. [Google Scholar] [CrossRef] [PubMed]
  23. Urbach, G. Headspace volatiles from cold-stored raw milk. Aust. J. Dairy Technol. 1990, 45, 80–85. [Google Scholar]
  24. Badings, H.T. Milk. In Volatile Compounds in Foods and Beverages; Maarse, H., Ed.; Marcel Dekker: New York, NY, USA, 1991; pp. 91–106. [Google Scholar]
  25. Reichler, S.J.; Murphy, S.I.; Erickson, A.W.; Martin, N.H.; Snyder, A.B.; Wiedmann, M. Interventions designed to control postpasteurization contamination in high-temperature, short-time-pasteurized fluid milk processing facilities: A case study on the effect of employee training, clean-in-place chemical modification, and preventive maintenance programs. J. Dairy Sci. 2020, 103, 7569–7584. [Google Scholar] [PubMed]
  26. Zahar, M.; Tatini, S.R.; Hmama, A.; Fousshi, S. Effect of storage temperature on the keeping quality of commercially pasteurized milk. Rev. Maroc. Sci. Agron. Vétérinaires 1996, 16, 5–10. [Google Scholar]
  27. Petrus, R.R.; Loiola, C.G.; Oliveira, C.A.F. Microbiological shelf life of pasteurized milk in bottle and pouch. J. Food Sci. 2010, 75, M36–M40. [Google Scholar] [CrossRef]
  28. Fromm, H.I.; Boor, K.J. Characterization of pasteurized fluid milk shelf-life attributes. J. Food Sci. 2004, 69, M207–M214. [Google Scholar] [CrossRef]
  29. Smit, G.; Johan, E.T.v.H.V.; Smit, B.A.; Ayad, E.H.E.; Engels, W.J.M. Fermentative formation of flavour compounds by lactic acid bacteria. Aust. J. Dairy Technol. 2002, 57, 61. [Google Scholar]
  30. Vallejo-Cordoba, B.; Nakai, S. Using a simultaneous factor optimization approach for detection of volatiles in milk by dynamic headspace gas chromatographic analysis. J. Agric. Food Chem. 1993, 41, 2378–2384. [Google Scholar] [CrossRef]
  31. Ziyaina, M.; Rasco, B.; Coffey, T.; Ünlü, G.; Sablani, S.S. Colorimetric detection of volatile organic compounds for shelf-life monitoring of milk. Food Control 2019, 100, 220–226. [Google Scholar] [CrossRef]
  32. Bassette, R.; Bawdon, R.E.; Claydon, T.J. Production of volatile materials in milk by some species of bacteria. J. Dairy Sci. 1967, 50, 167–171. [Google Scholar] [CrossRef]
  33. Cormier, F.; Raymond, Y.; Champagne, C.P.; Morin, A. Analysis of odor-active volatiles from Pseudomonas fragi grown in milk. J. Agric. Food Chem. 1991, 39, 159–161. [Google Scholar] [CrossRef]
  34. Magan, N.; Pavlou, A.; Chrysanthakis, I. Milk-sense: A volatile sensing system recognises spoilage bacteria and yeasts in milk. Sens. Actuators B Chem. 2001, 72, 28–34. [Google Scholar] [CrossRef]
  35. Urbach, G.; Milne, T. The concentration of volatiles in pasteurized milk as a function of storage time and storage temperature—A possible indicator of keeping quality. Aust. J. Dairy Technol. 1987, 42, 53–58. [Google Scholar]
  36. Sørhaug, T.; Stepaniak, L. Psychrotrophs and their enzymes in milk and dairy products: Quality aspects. Trends Food Sci. Technol. 1997, 8, 35–41. [Google Scholar] [CrossRef]
  37. Baldwin, E.A.; Plotto, A.; Goodner, K. Shelf-life versus flavour-life for fruits and vegetables: How to evaluate this complex trait. Stewart Postharvest Rev. 2007, 3, 1–10. [Google Scholar]
  38. Delicato, C.; Schouteten, J.J.; Dewettinck, K.; Gellynck, X.; Tzompa-Sosa, D.A. Consumers’ perception of bakery products with insect fat as partial butter replacement. Food Qual. Prefer. 2020, 79, 103755. [Google Scholar] [CrossRef]
  39. Cadwallader, K.R.; Singh, T.K. Flavours and Off-Flavours in Milk and Dairy Products. In Advanced Dairy Chemistry; McSweeney, P., Fox, P.F., Eds.; Springer: New York, NY, USA, 2009; pp. 631–690. [Google Scholar]
  40. ten Kleij, F.; Musters, P.A.D. Text analysis of open-ended survey responses: A complementary method to preference mapping. Food Qual. Prefer. 2003, 14, 43–52. [Google Scholar] [CrossRef]
  41. Mazzocchi, M. Correspondence Analysis. In Statistics for Marketing and Consumer Research; SAGE Publications, Ltd.: London, UK, 2008; pp. 300–314. [Google Scholar]
Figure 1. Total microbial numbers (TMNs) in (A) WFCPM and (B) Trim milk stored at 4.5 ± 0.5 °C between 3 and 26 days tested during consumer preference sessions 1 to 5; where the colour of the symbol represents the session from where the milk was taken for testing ( Session 1; Session 2; ▲ Session 3; Session 4; Session 5). 5. Each data point is the mean value of 3 TMN readings from one bottle (n = 3). Vertical error bars represent the standard deviation of the mean.
Beverages 09 00053 g001
Figure 2. The rejection threshold (RjT) values and sigmoidal fit to the average preference (%) over 0.25 log10 CFU.mL−1 intervals in (A) WFCPM and (B) Trim milk. : where 50% of consumers reject the milk, RjT; : average preference (%) over a 0.25 log10 CFU.mL−1 interval for WFCPM; : average preference (%) over a 0.25 log10 CFU.mL−1 interval for Trim milk.
Beverages 09 00053 g002
Figure 3. Changes in the signal intensity for (A) m/z 45, (B) m/z 47, and (C) m/z 63 in the headspace of WFCPM and Trim milk as a function of the TMN and the effect on consumers’ preference.
Beverages 09 00053 g003
Figure 4. PCA of WFCPM samples stored at 4.5 ± 0.5 °C between 3 and 26 days showing the interrelationship between the volatile organic compounds (VOCs) that significantly differed, total microbial numbers (TMNs), and % consumer preference (Pref). Scores are for individual WFCPM samples (coded S(n)-D(t), S(n): session number, and D(t): storage time in days), and loadings are for the VOCs that significantly differed, TMNs, and Pref.
Beverages 09 00053 g004
Figure 5. PCA of Trim samples stored at 4.5 ± 0.5 °C between 3 and 26 days showing the relationship between the volatile organic compounds (VOCs) that significantly differed, total microbial numbers (TMNs) and % consumers’ preference (Pref). Scores are for individual Trim samples (coded S(n)-D(t), S(n): session number, and D(t): storage time in days), and loadings are for VOCs that significantly differed, TMNs and Pref.
Beverages 09 00053 g005
Figure 6. Correspondence analysis map of consumers’ terms used to describe WFCPM stored at 4.5 ± 0.5 °C between 3 and 26 days. WFCPM samples are coded as D(t), storage time in days.
Beverages 09 00053 g006
Figure 7. Correspondence analysis map of consumers’ terms used to describe Trim stored at 4.5 ± 0.5 °C between 3 and 26 days. Trim samples are coded as D(t), storage time in days.
Beverages 09 00053 g007
Table 1. Terms used to describe WFCPM and Trim milk by participants.
Terms
Nutty, almond (milk)Powder milk
Oat, cereals, soy, grain, cornVanilla
Off (note)Bad, strong, unpleasant, odd, strange odour
Plain, bland, dull, weak, tastelessBad, strong, sharp, unpleasant, odd flavour
Old, not fresh, staleGood, pleasant, clean, strong, smooth, sweet, buttery flavour
Fruity, blossomySavoury, salty
Awful, disgusting, horrific, grossFull-bodied
No difference Fatty (taste)
Strange, foreign flavourGrassy
LiteProcessed
Milk powderThin, watery
BalancedThick, heavy, too creamy
YoghurtSour, acidic, tart, vinegar, tangy
Fatty, rich, thick (+ve)Strong, bad, fatty, bitter, yoghurt, dry, strange aftertaste
Full, more flavour(ed)Clean, good, creamy, pleasant, lite aftertaste
Lingering (+ve)Natural, standard, normal, milk(y) flavour
Creamy(ier)Good, milky, pleasant, fresh, light odour
Sweet (-ve)Synthetic, artificial, fake
Good, smooth texture, mouthfeelChemical, paint, metallic, medicinal
CalciTrim, TrimRaw milk taste
CoconutBitter
Fresh(er), refreshing tasteFatty (taste)
Strange, foreign flavourFresh(er), refreshing taste
LiteBitter
Calcitrim, TrimCheesy
Chemical, paint, metallic, medicinal
Table 2. Tentative identification and descriptors of the significant volatile mass ions (p ≤ 0.05) detected in the headspace of WFCPM and Trim milk stored at 4.5 ± 0.5 °C between 3 and 26 days and tested during sessions 1 to 5.
m/zTentative Identification aSensory Profile; Contribution to Off-Flavours b
31Ethanol fr. c; alcohol fr.
33Methanol
41Pentane; alcohols; and esters fr.
42NI d
43Ketones, esters, and alcohols fr.
45AcetaldehydeYoghurt
46Isotopologue of m/z 45
47EthanolFeed; slightly sweet
53NI
55Alkenyl fr.; water cluster
57Ketones, esters, and alcohols fr.
59AcetoneCowy; feed
60Isotopologue of m/z 59
61Acetic acid; acetate esters fr.Vinegar
63Dimethyl sulfide (DMS)Cowy; sulfur; cooked cabbage; unclean
69Isoprene; furan; aldehydes fr.
71Water cluster of butenal; fr. butyric acid and butyrate esters, or 2-pentanol; alkane
732-butanoneFeed
74NI
872-pentanone; pentanal
89Butyric acid; fr of butyrate esters (predominantly ethyl butyrate); 2-methyl-1-butanol; ethyl acetateVomit; cheesy; unclean; off-flavour
a: [21,22]; b: [23,24]; c: fr.: fragment; d: NI: not identified.
Disclaimer/Publisher’s Note: The statements, opinions and data contained in all publications are solely those of the individual author(s) and contributor(s) and not of MDPI and/or the editor(s). MDPI and/or the editor(s) disclaim responsibility for any injury to people or property resulting from any ideas, methods, instructions or products referred to in the content.

