Article

Optimization of Hempseed-Added Kombucha for Increasing the Antioxidant Capacity, Protein Concentration, and Total Phenolic Content

by
Samanta Reyes-Flores
1,
Taísa Sabrina Silva Pereira
1,* and
Milena Maria Ramírez-Rodrigues
2,*
1
Department of Chemical, Food and Environmental Engineering, Universidad de las Américas Puebla, Ex hacienda Santa Catarina Mártir SN, San Andrés Cholula 72810, Puebla, Mexico
2
Department of Bioengineering, Tecnológico de Monterrey, Vía Atlixcáyotl 5718, Reserva Territorial Atlixcáyotl, Puebla 72453, Puebla, Mexico
*
Authors to whom correspondence should be addressed.
Beverages 2023, 9(2), 50; https://doi.org/10.3390/beverages9020050
Submission received: 11 April 2023 / Revised: 30 May 2023 / Accepted: 1 June 2023 / Published: 12 June 2023

Abstract

:
To enhance the effects of kombucha’s beneficial compounds and their functional properties, studies on kombucha fermentation using alternatives ingredients are needed. The aim of this study was to formulate and optimize kombucha using hempseed as a high antioxidant, phenolic compound, and protein contributor. An experimental central composite design (CCD) with response surface methodology (RSM) was used for maximizing the antioxidant capacity (AC), total phenolic content (TPC), and protein concentrations (PC) of this product. The optimized infusion concentrations were observed at 0.017% of hempseeds and 0.00046% of black tea leaves. AC was determined by the DPPH+ assay in microplate. TPC was determined in microplate using the Folin–Ciocalteu method. PC was determined by Peterson’s modification of the micro-Lowry method. The optimized kombucha results were 0.134 ± 0.002 mg Trolox Eq/mL for AC, 0.473 ± 0.027 mg GA Eq/mL for TPC, and 6.535 ± 0.477 μg/mL of PC. RSM can be developed to optimize the formulation of kombuchas to increase the amounts of desirables compounds. This study demonstrated that hempseeds added to kombucha have a higher antioxidant capacity, total phenolic content, and protein concentration than traditional kombucha.

1. Introduction

Kombucha is a fermented tea beverage made with the use of SCOBY (Symbiotic Culture of Bacteria and Yeast) and it is prepared by combining an infused solution of tea and sugar and the starter culture from previous fermentation. Different tea leaf types can be applied to produce kombucha, such as green, red, black, or yellow tea. However, black tea and sucrose are the most popular and traditional ingredients [1,2]. During the fermentation process, species comprising of mixed cultures vary, generally including bacterial species of the genus Acetobacter, Gluconobacter, as well as several species of Saccharomyces and other types of yeast. Within a culture, anaerobic fermentation of ethanol carried out by yeast, anaerobic fermentation of organic acid carried out by bacteria, and aerobic oxidation of ethanol to acetate carried out by bacteria along an oxygen gradient can be performed simultaneously. The fermentation process takes place at room temperature (22 °C to 25 °C) for a period of 7 to 14 days [3].
Kombuchas have reported the presence of beneficial compounds coming from the raw material and from the oxidation of polyphenols during fermentation. In most cases, kombucha contains organic acids, B vitamins, antioxidants, and trace minerals. Some studies show that these compounds have antimicrobial, antioxidant, anticarcinogenic, antidiabetic, anti-inflammatory, and cholesterol-reducing properties [4,5,6]. Additionally, there is an increased use of secondary added ingredients in beverages, such as chia, quinoa, and hempseeds, due to their nutritional and beneficial properties to enhance those properties. Specifically, hempseeds contain protein and antioxidant compounds that could exhibit beneficial properties [7,8].
The tendency of variation and adaptations of kombucha formulations with different ingredients sources, including fruits, leaves, and seeds, has been tested for the production of new functional beverages [9,10]. However, currently, there are no reported studies on the development of kombucha based on the addition of hempseeds into the infusion process prior to fermentation. The extraction in water from hempseeds have shown a rich profile of phytochemicals with high antioxidant properties, such as lignanamidas and hydroxycinnamic acids [11,12].
The type of substrate and sugar, water-to-solids ratio, type of tea leaves, and the ingredients added during the second fermentation may influence the final properties of kombucha variants, such as the content of antioxidant compounds, sugars, and protein concentration (e.g., fruits) [13,14]. Previous research tests on hempseeds have shown their potential as a protein source and as a compound with antioxidant capacity. Thus these seeds could be used as a substrate for producing kombucha [10,13,15].
The optimization of a formulation by means of experimental design (DOE), such as a response surface methodology (RSM), are statistical methods that solve multiple equations of different experiments to measure the relationship between a response and multiple variables to fit a first-/second-order polynomial by a least significance technique. Response optimization helps to identify the configuration values of variables that, in combination, optimize an individual response or a set of responses. It is useful when the impact of multiple variables on a response needs to be evaluated. The optimized values result from fitting the mathematical model to each response evaluated. As a product of carrying out the design, the results can be illustrated as contour plots. The contour plots can be used to study the response surfaces and summarize the optimal parameters. Usually, the most common DOE applied to optimize a formulation or create product prototypes are central composite designs. The main advantage of applying this methodology in comparison with a traditional formulation is the decrease in cost, and they reduce testing time by the number of tests carried out during experimentation [16,17]. The aim of this study was to optimize the formulation of a hempseed-added kombucha, using hempseeds as an alternative substrate in order to increase the antioxidant capacity, total phenolic content (TPC), and protein concentration.

2. Materials and Methods

2.1. Materials

2.1.1. Plant Materials

Orange pekoe black tea leaves (Camellia sinensis) of Vahdam® were obtained from China. The hempseeds hearts (Cannabis sativa sativa) were obtained through Manitoba Harvest® from Manitoba, Canada.

2.1.2. Chemicals

1,1-diphenyl-2-picryl-hydrazylradical (DPPH*), 6-hydroxy-2,5,7,8-etramethylchromane-2-carboxylic acid (Trolox), ethanol reagent (C2H6O), Folin and Ciocalteu’s phenol reagent 2 N, Trichloroacetic Acid Solution 72% (w/v) (TCA), Lowry Reagent, 0.15% Deoxycholate (DOC) Solution 0.15%, and albumin protein standard were purchased from Sigma-Aldrich Inc., USA. All other chemicals were of analytical grade, sodium nitrite (NaNO2), sodium hydroxide (NaOH), buffer solution pH 4, and buffer solution pH 7.

2.2. Experimental Design

This study used a CCD to find the optimum combination of black tea leaves and hempseeds for brewing kombucha. Regression data analysis and design of experiments (DOE) were carried out using Minitab 17 Statistical software (Minitab LLC., States College, PA, USA). The DOE were developed by establishing two factors using a RSM, including five center points and two replicates. Thirteen experiments in duplicates were conducted for the optimization of the kombucha formulation (Table 1). The factors were hempseeds concentration (0.01% to 0.02%) and black tea leaves concentration (0.001% to 0.004%). Once the response surface data were obtained, model optimization was performed to identify the values of the hempseeds and black tea leaves concentration settings to increase AC, TPC and PC. Response data were expressed as contour plots (2D representation) to show the relationship between each response against hempseed concentration and black tea leaves concentration. Dark red, yellow, and green tones showed higher values in response, light green tones showed medium values in response, blue tones showed low values in response, and dark blue tones showed very low values in response.

2.3. Preparation of Kombucha

The SCOBY for the kombucha fermentation process was grown from scratch from a Synergy® kombucha. Briefly, the beverage was placed in a glass container with a cloth lid and incubated at room temperature in a dark place for 4 weeks. Subsequently, the tea substrate was refreshed every week to favor inoculum growth. Tea solution was prepared by dissolving sucrose (50 g/L) in deionized water. Then, the tea solution was infused with hempseeds and tea leaves at 95 ± 3 °C for 30 min, stirring constantly. Following stirring, the infused tea was separated through filtration using a 11 μm medium-flow filter paper (Whatman, Little Chalfont, Buckinghamshire, United Kingdom). The SCOBY (24 g/L) were added to ferment the infused tea and kept under aseptic conditions. Fermentation was carried out at 22 ± 3 °C for 10 days. Each type of kombucha was brewed in duplicate, and once the fermentation was finished, the samples were filtered and stored frozen at 0 ± 2 °C until further analysis.

2.4. Total Phenolic Content (TPC)

Determination of polyphenols was performed according to Ramírez-Rodrigues. Total phenolics were estimated using the Folin–Ciocalteu colorimetric method. Briefly, 200 µL of the sample was diluted with 1 mL of distilled water and 250 µL of undiluted Folin–Ciocalteu reagent. Immediately, 2.5 mL 7% (w/v) Na2CO3 was added. Then, a standing time was taken (90 min) in the dark. The absorbance was measured at 760 nm using a UV-Vis spectrophotometer model Multiskan Sky Microplate (Thermo Fischer Scientific, Waltham, MA, USA) and compared to a pre-prepared gallic acid calibration curve (R2 > 0.94). Determinations were performed in triplicate. Results were expressed as milligram of gallic acid equivalents (GAE) per mL of extract (0–800 mg/L of gallic acid) [18].

2.5. Antioxidant Capacity (AC)

The total antioxidant capacity of the samples was measured using spectrophotometric assays and the DPPH+ radical (2,2-diphenyl-1-picrylhydrazyl) method. The antioxidant capacity of samples was measured according to Jakubczyk et al. and Jiménez-González and Guerrero-Beltrán [3,19], respectively. Shortly, the spectral absorbance was measured at 517 nm using a UV-Vis spectrophotometer model Multiskan Sky Microplate (Thermo Fischer Scientific, Waltham, MA, USA). All assays were performed in triplicate. The absorbance values were used to calculate the percentage of inhibition (I%).
I % = A o A s A o   ×   100
Ao is the absorbance value of 2000 μL of DPPH with 100 μL of water, and As is the absorbance of the DPPH sample mixture.
The results of the antioxidant capacity were calculated as mg of Trolox equivalents (TE) per gram of sample (mg TE/g) in dry basis.
A n t i o x i d a n t   c a p a c i t y   m g T E g = I % b m   ×   d i l u t i o n   f a c t o r
b is the intercept (1.771), and m is the slope (0.565 1/ppm) of a standard curve (R2 = 0.991) with concentrations of Trolox (0–100 ppm).

2.6. Protein Concentration Determination (PC)

The protein concentration was determined using the Peterson modification of micro-Lowry’s method according to Ramírez-Rodrigues et al. [18]. In brief, an aliquot of 500 μL of protein solution of each sample was used. Then each sample was mixed with 50 μL of deoxycholate solution (0.15%) and a standing time was taken (15 min). Next, each sample was mixed with 50 μL of trichloroacetic acid (72%) for 10 min. Afterwards, the samples were centrifuged at 5000 rpm at room temperature for 15 min. The supernatant was eliminated, and the precipitated protein was added in Lowry’s solution and each sample was allowed to stand for 15 min at room temperature, then 250 μL of Folin–Ciocalteu reagent was added, and a standing time was taken (30 min) at room temperature. Then, the samples were homogenized using a vortex and 200 μL aliquots were transferred into a microplate. Finally, the absorbance was measured using a UV-Vis spectrophotometer model Multiskan Sky Microplate (Thermo Fischer Scientific) at 720 nm. All assays were performed in triplicate. The absorbance values were used to calculate the protein concentration according to the calibration curve (R2 > 0.98) (25–500 μg/mL Bovine Serum Albumin).

2.7. Characterization of Optimized Kombucha

Once the optimized kombucha samples and control samples were obtained, physicochemical parameters such as soluble solids content, pH, and alcohol content were determined. The soluble solid content was measured by using a brixometer (Reichert Technologies, Buffalo, NY, USA. The results were expressed as °Brix. The pH of all samples was determined by a pH meter, HI5522-02 (Hanna Instruments, Woonsocket, RI, USA). The alcohol content was measured using an alcohol densimeter, K8805 (KESSLER, West Babylon, NY, USA). The alcoholometer was immersed in the liquid and the result was read from the Gay–Lussac Scale, and then the values were expressed in percentage.

2.8. Statistical Analysis

In all the experiments, 26 samples were analyzed, and all the assays were carried out in triplicate. The results were expressed as mean values and standard deviation (SD). The ANOVA and statistical analysis were performed using Minitab software, version 19.2020 (Minitab Inc., State College, PA, USA) with a 95% of confidence, and a subsequent comparison of means with the Tukey test for optimized and control samples.

3. Results

After the 26 experiments and the control were carried out, the results of TPC, antioxidant capacity, and protein concentration were obtained for each of the samples expressed in mg GA Eq/mL, mg Trolox Eq/mL, and µg/mL, respectively (Table 2). The model shows that the hempseed addition plays a significant role in determining the final total phenolic content (p = 0.017) and protein content (p = 0.012), while the values of antioxidant capacity (p = 0.062) were not significantly different. Moreover, the concentration of black tea leaves did not have a significant role in the responses of the experiments within 95% confidence interval of experimental values.
As Table 3 shows, the total phenolic content and antioxidant capacity from hempseed-added kombucha obtained the highest results at concentration ratio of black tea leaves and hempseeds of 0.02% and 0.001%, respectively, in sample 6, and 0.015% and 0.025%, respectively, in sample 13. The first formulation achieved TPC 0.907 ± 0.0001 mg GA Eq/mL and DPPH+ 0.146 ± 0.1078 mg Trolox Eq/mL. The second formulation was able to obtain TPC 0.881 ± 0.0001 mg GA Eq/mL and DPPH+ 0.141 ± 0.9091 mg Trolox Eq/mL values. Furthermore, the best results of protein concentration in hempseed-added kombucha showed the highest results of 0.02% and 0.001%, respectively, for sample 6, and 0.02% and 0.001%, respectively, for sample 3. The first formulation achieved 7.828 ± 0.0400 µg/mL and the second formulation obtained 6.842 ± 0.0650 µg/mL.

Optimized Kombucha

The optimization resulted in an increase in protein concentration, total phenolic content, and antioxidant capacity with increasing hempseeds concentration. The optimum predictive results of protein concentration, total phenolic content, and antioxidant capacity (Table 3) from hempseed-added kombucha showed the highest results at concentration ratio for black tea leaves and hempseeds of 0.017% and 0.0046%, respectively, where the optimized values obtained were 0.1560 mg Trolox Eq/mL for antioxidant capacity, 0.5636 mg GA Eq/mL for TPC, and 7.8491 µg/mL for PC.
The ANOVA results for the selected responses are reported in Table 4. Relatively high values for the coefficient of determination (R2 > 0.8) obtained for all responses according to hempseeds concentration indicate a good fit of experimental data.
Table 5 shows the values obtained for the physicochemical determinations. It is observed that the pH of the optimized kombucha were 2.72 and 2.68, while the pH value of the control beverage was 2.62. All pH values were in accordance with the requirements of kombucha production, since the pH must be between 2.5 and 3.5 for food safety issues [4,13,20]. Similarly, the values obtained for alcohol content respect the regulation for non-alcoholic fermented beverages (content less than 0.05%) [1,13,20]. Lastly, the values of total soluble solids after fermentation were within the range reported by several authors [1,3,4,5,14]. It shows that the values of pH, total soluble solids, alcohol content, and antioxidant capacity were not significantly different (p > 0.07) between optimized kombucha and control sample, while the total phenolic content and protein content (p < 0.016) were significantly different.
Corroboration experiments were performed using the predicted conditions derived from RSM (Table 6). The experimental verification data demonstrated that the values were reasonably close to the prediction, confirming the validity and adequacy of the predicted models. Moreover, the experiments showed that the predicted values of AC, TPC, and PC for the model with hempseed-added kombucha could be satisfactorily achieved within a 95% confidence interval of experimental values.

4. Discussion

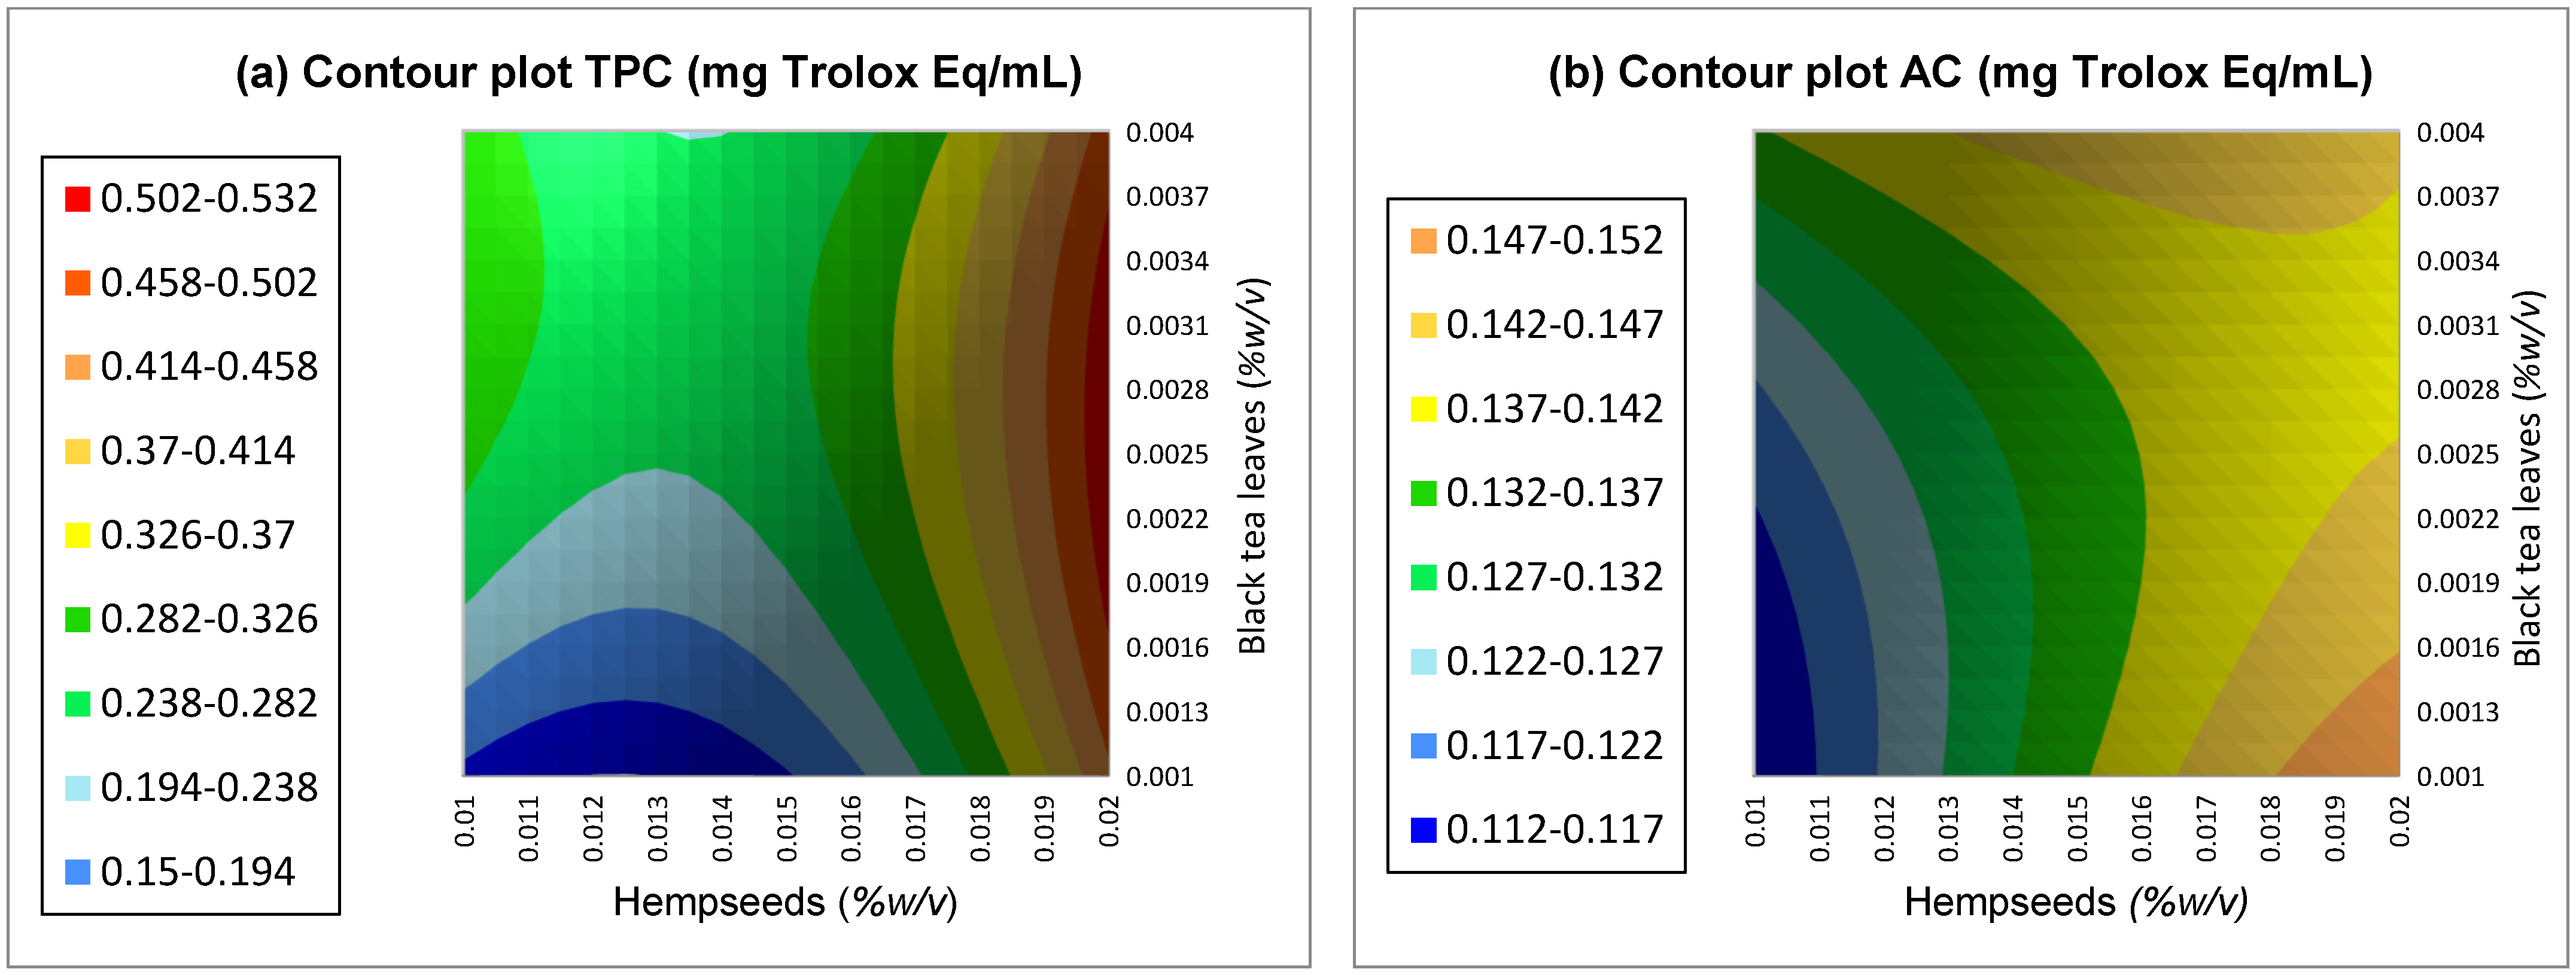
4.1. Total Phenolic Content and Antioxidant Capacity Determination

The changes in concentration of total phenolic compounds and antioxidant capacity in kombucha samples are shown in Figure 1. Total phenolic compounds progressively increased with increasing hempseed and black tea leaves concentrations. Phenolic compounds are known as high-level antioxidants because of their ability to scavenge free-radicals of oxygen, superoxide free-radicals, and hydroxyl radicals [3,21]. The increased concentration of phenolic compounds in kombucha samples might be subjected to (1) the acidic environment during kombucha fermentation leading to the degradation of complex polyphenols into small molecules, which in turn results in the increase in total phenolic compounds, (2) the enzymes liberated by bacteria and yeast in tea fungus consortium and their role in the breakdown of phenolic compounds [5,21], (3) the content of polyphenols and flavonoids (theaflavins and thearubgins) sourced form black tea leaves [4,22], and (4) the phenolic compounds from hempseeds (including bioactive compounds such as hydroxycinnamic acids, hydroxybenzoic acids, flavonoids, and lignanamides) [23,24]. In addition, the high amount of total phenolic compounds in kombucha samples could be attributed to pH values in the range of 2.3–3.6. Zhu et al. [25] and Jhoo et al. [26] have reported that flavonoids and most phenolic compounds have higher stability under those values and are unstable in alkaline solution.
As well, the DPPH+ scavenging abilities of kombucha samples were progressively increased with increasing hempseeds and black tea leaves concentration. Maximum increase was observed at 0.015% of hempseeds and 0.0025% of black tea leaves. The increased potential against DPPH+ radicals might be explained by the contribution of compounds from the black tea leaves and hempseeds. First, black tea leaves have been shown to contribute soluble and stable compounds with antioxidant capacity at temperatures 70 °C to 75 °C and at pH similar to the substrate for kombucha brewing [22,26]. Secondly, hempseeds have been reported to present high antioxidant capacity in products similar to the substrate for kombucha brewing, such as hempseed-fermented milks [23,27], whole-hempseeds beverages [28], and blended milks [29].

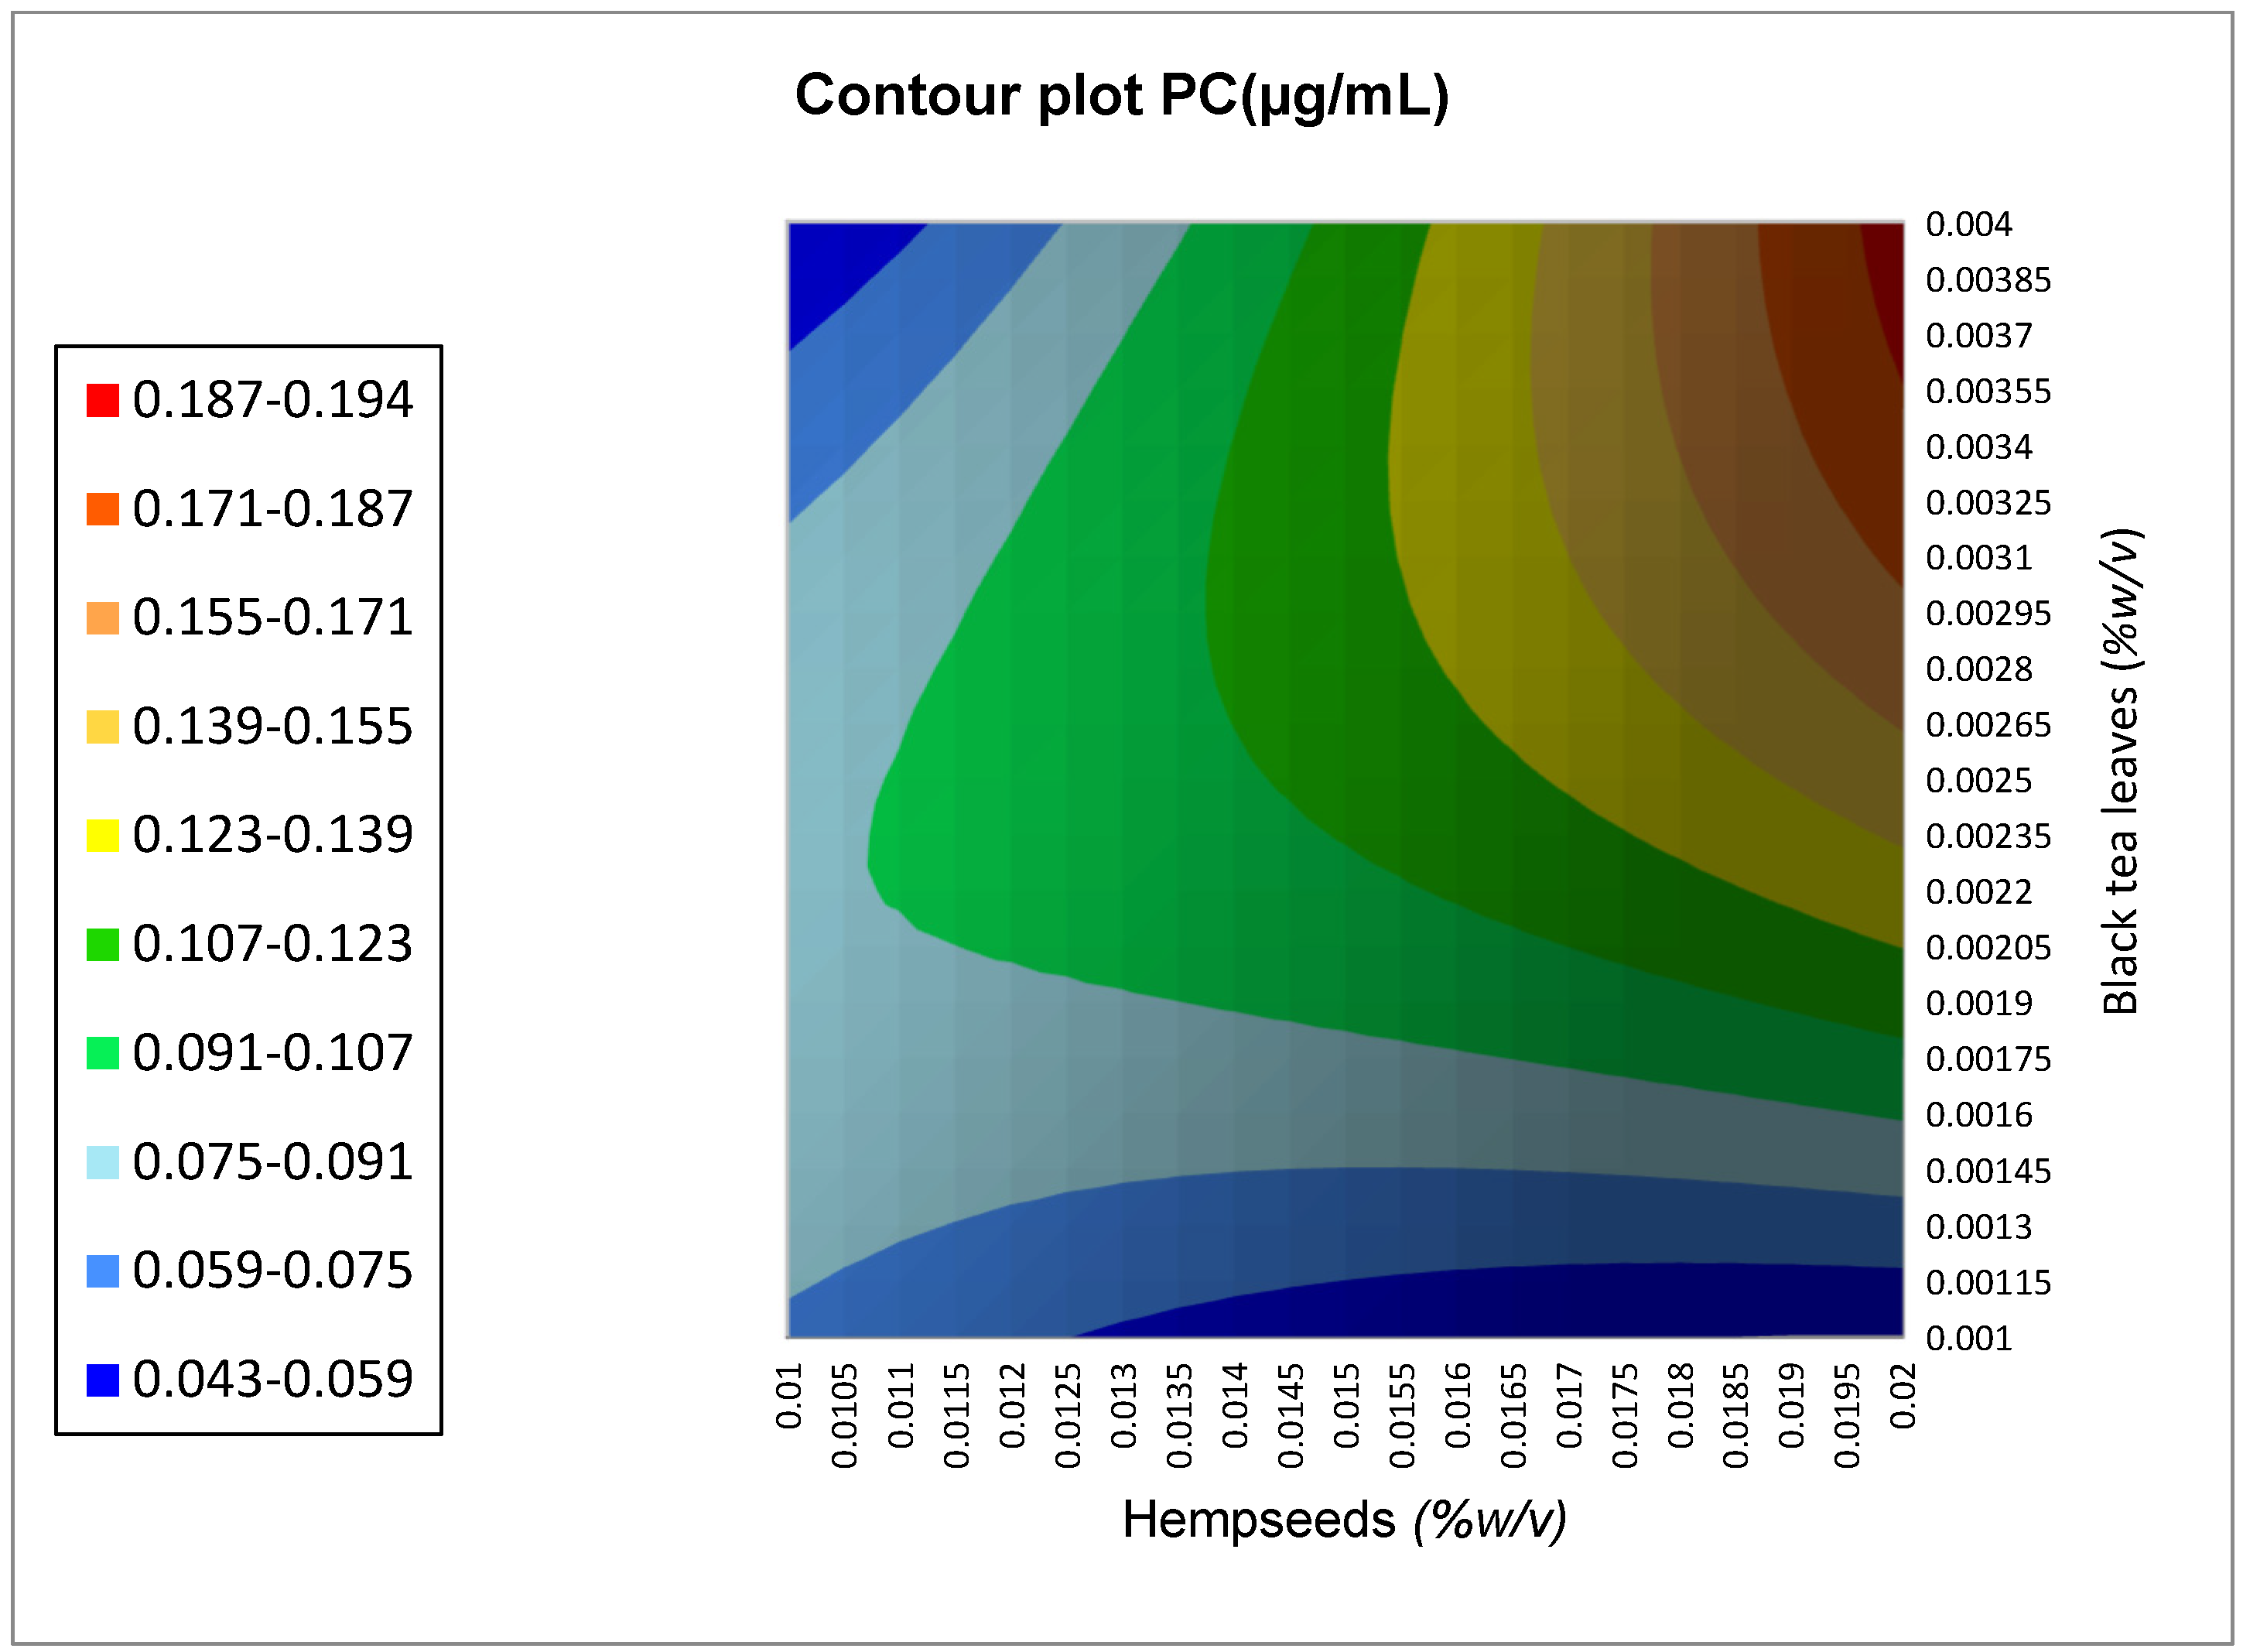
4.2. Protein Concentration Determination

Likewise, Figure 2 displays the tendency of protein concentration in kombucha samples. It progressively increased with the addition of hempseeds, and it decreased in value with the addition of black tea leaves. Maximum increase (7.828 µg/mL) was observed at 0.02% of hempseeds and 0.001% of black tea leaves. The behavior might be explained by the presence of hemp proteins, albumin and globulins. These proteins display a 60% pH-solubility profile at pH 3 [30], close to the usual kombucha pH values. Additionally, those proteins show an isoelectric point at about pH 5.0 [31].

4.3. Characterization of Optimized Kombucha

The pH of kombucha samples were between 2.62 and 2.72 after 10 days of fermentation due to increased concentration of organic acids produced during the fermentation process by bacteria and yeasts in the tea fungus consortium. It has been reported that fermentation broth shows buffer capacity. That is because the obtained water solution of carbon dioxide dissociates and produces the amphiprotic hydrocarbonate anion, which easily reacts with hydrogen ions from organic acids, preventing further changes in the H+ concentration and contributing to a buffer character of the system [32,33]. The pH values were according to Narko et al. [16], Murphye et al. [20], and Jayabalan et al. [2] where they reported that pH values must be between 2.5 to 3.3 to prevent other pathogenic bacteria from growing. Finally, alcohol content was in accordance with the Alcohol and Tobacco Tax and Trade Bureau [34], where it is indicated that the alcohol content of kombuchas should not exceed 0.5%, i.e., not to exceed 0.5 mL of alcohol per 100 mL of kombucha.

5. Conclusions

The conclusions for the optimization process of hempseed-added kombucha are described as follows:
This study demonstrated that hempseed-added kombuchas have a higher antioxidant capacity, total phenolic content, and protein concentration than a traditional kombucha, which indicates that the addition of new ingredients in the beverage formulation improves the nutritional content of the beverage.
The optimum condition for maximizing protein concentration, total phenolic compound content, and antioxidant capacity was obtained when the concentration of black tea leaves and hempseeds were (a) 0.017% and 0.0046%, respectively, and (b) 0.018% and 0.0004%, respectively.
The presented design analysis suggests that the concentration ratio of hempseeds have significant influence on the values of protein concentration and total phenolic compound content. Therefore, the design of experiments and the model optimization process are useful for the formulation of new products with customized target responses according to consumption objectives. Specifically, RSM can be developed as a reference to optimize the formulation of kombuchas to increase the amounts of desirables compounds.
To study further applications of the optimized formulation, it will be necessary to implement a sensory study of the optimized kombucha beverages.

Author Contributions

Conceptualization S.R.-F., T.S.S.P. and M.M.R.-R.; methodology, S.R.-F., T.S.S.P. and M.M.R.-R.; software, S.R.-F. and T.S.S.P.; validation, S.R.-F., T.S.S.P. and M.M.R.-R.; formal analysis, S.R.-F.; investigation, S.R.-F., T.S.S.P. and M.M.R.-R.; writing—original draft preparation, S.R.-F.; writing—review and editing, T.S.S.P. and M.M.R.-R.; supervision, T.S.S.P. and M.M.R.-R. All authors have read and agreed to the published version of the manuscript.

Funding

This research was funded by CONCYTEP.

Data Availability Statement

The data presented in this study is available in the article.

Acknowledgments

The authors thank the Consejo Nacional de Ciencia y Tecnología (CONAHCyT) and the Universidad de las Américas Puebla for financial support for their doctoral studies in Food Science. We thank the Consejo de Ciencia y Tecnología del Estado de Puebla (CONCYTEP) for funding the development of the project.

Conflicts of Interest

The authors declare no conflict of interest.

References

  1. Dutta, H.; Paul, S.K. Kombucha Drink: Production, Quality, and Safety Aspects. In Production and Management of Beverages; Grumezescu, A.M., Holban, A.M., Eds.; Woodhead Publishing: Sawston, UK, 2019; pp. 259–288. ISBN 978-0-12-815260-7. [Google Scholar]
  2. Jayabalan, R.; Malbaša, R.V.; Lončar, E.S.; Vitas, J.S.; Sathishkumar, M. A Review on Kombucha Tea—Microbiology, Composition, Fermentation, Beneficial Effects, Toxicity, and Tea Fungus. Compr. Rev. Food Sci. Food Saf. 2014, 13, 538–550. [Google Scholar] [CrossRef]
  3. Jakubczyk, K.; Kałduńska, J.; Kochman, J.; Janda, K. Chemical Profile and Antioxidant Activity of the Kombucha Beverage Derived from White, Green, Black and Red Tea. Antioxidants 2020, 9, 447. [Google Scholar] [CrossRef] [PubMed]
  4. Goh, W.N.; Rosma, A.; Kaur, B.; Fazilah, A.; Karim, A.; Bhat, R. Fermentation of Black Tea Broth (Kombucha): I. Effects of Sucrose Concentration and Fermentation Time on the Yield of Microbial Cellulose. Int. Food Res. J. 2012, 19, 109–117. [Google Scholar]
  5. Hsieh, Y.; Chiu, M.-C.; Chou, J.-Y. Efficacy of the Kombucha Beverage Derived from Green, Black, and Pu’er Teas on Chemical Profile and Antioxidant Activity. J. Food Qual. 2021, 2021, e1735959. [Google Scholar] [CrossRef]
  6. Torán-Pereg, P.; del Noval, B.; Valenzuela, S.; Martinez, J.; Prado, D.; Perisé, R.; Arboleya, J.C. Microbiological and Sensory Characterization of Kombucha SCOBY for Culinary Applications. Int. J. Gastron. Food Sci. 2021, 23, 100314. [Google Scholar] [CrossRef]
  7. Bakowska-Barczak, A.; de Larminat, M.-A.; Kolodziejczyk, P.P. The Application of Flax and Hempseed in Food, Nutraceutical and Personal Care Products. In Handbook of Natural Fibres, 2nd ed.; Kozłowski, R.M., Mackiewicz-Talarczyk, M., Eds.; The Textile Institute Book Series; Woodhead Publishing: Sawston, UK, 2020; pp. 557–590. ISBN 978-0-12-818782-1. [Google Scholar]
  8. Leonard, W.; Zhang, P.; Ying, D.; Fang, Z. Hempseed in Food Industry: Nutritional Value, Health Benefits, and Industrial Applications. Compr. Rev. Food Sci. Food Saf. 2020, 19, 282–308. [Google Scholar] [CrossRef] [Green Version]
  9. Battikh, H.; Bakhrouf, A.; Ammar, E. Antimicrobial Effect of Kombucha Analogues. LWT-Food Sci. Technol. 2012, 47, 71–77. [Google Scholar] [CrossRef]
  10. Kim, J.; Adhikari, K. Current Trends in Kombucha: Marketing Perspectives and the Need for Improved Sensory Research. Beverages 2020, 6, 15. [Google Scholar] [CrossRef] [Green Version]
  11. Crescente, G.; Piccolella, S.; Esposito, A.; Scognamiglio, M.; Fiorentino, A.; Pacifico, S. Chemical Composition and Nutraceutical Properties of Hempseed: An Ancient Food with Actual Functional Value. Phytochem. Rev. 2018, 17, 733–749. [Google Scholar] [CrossRef]
  12. Martinez, J.R.; la Paz, S.M.; la Puerta, R.D.; García-Giménez, M.D.; Fernández-Arche, M.Á. Characterization of Bioactive Compounds in Defatted Hempseed (Cannabis sativa L.) by UHPLC-HRMS/MS and Anti-Inflammatory Activity in Primary Human Monocytes. Food Funct. 2020, 11, 4057–4066. [Google Scholar] [CrossRef]
  13. de Miranda, J.F.; Ruiz, L.F.; Silva, C.B.; Uekane, T.M.; Silva, K.A.; Gonzalez, A.G.M.; Fernandes, F.F.; Lima, A.R. Kombucha: A Review of Substrates, Regulations, Composition, and Biological Properties. J. Food Sci. 2022, 87, 503–527. [Google Scholar] [CrossRef] [PubMed]
  14. Jayabalan, R.; Malini, K.; Sathishkumar, M.; Swaminathan, K.; Yun, S.-E. Biochemical Characteristics of Tea Fungus Produced during Kombucha Fermentation. Food Sci. Biotechnol. 2010, 19, 843–847. [Google Scholar] [CrossRef]
  15. Holzapfel, W. Advances in Fermented Foods and Beverages: Improving Quality, Technologies and Health Benefits; Elsevier: Amsterdam, The Netherlands, 2014; ISBN 978-1-78242-024-8. [Google Scholar]
  16. Narko, T.; Wibowo, M.S.; Damayanti, S.; Wibowo, I.; Hadiyat, M.A. Optimization of Robusta Green Coffee Fermentation Using Response Surface Methodology. Coffee Sci. 2020, 15, e151671. [Google Scholar] [CrossRef]
  17. Bakhaidar, R.B.; Naveen, N.R.; Basim, P.; Murshid, S.S.; Kurakula, M.; Alamoudi, A.J.; Bukhary, D.M.; Jali, A.M.; Majrashi, M.A.; Alshehri, S.; et al. Response Surface Methodology (RSM) Powered Formulation Development, Optimization and Evaluation of Thiolated Based Mucoadhesive Nanocrystals for Local Delivery of Simvastatin. Polymers 2022, 14, 5184. [Google Scholar] [CrossRef]
  18. Ramírez-Rodrigues, M.M.; Estrada-Beristain, C.; Metri-Ojeda, J.; Pérez-Alva, A.; Baigts-Allende, D.K. Spirulina Platensis Protein as Sustainable Ingredient for Nutritional Food Products Development. Sustainability 2021, 13, 6849. [Google Scholar] [CrossRef]
  19. Jiménez-González, O.; Guerrero-Beltrán, J.Á. Microencapsulates by Spray of Lacticaseibacillus rhamnosus GG from Fermented Whole or Skimmed Cow’s Milk Added with Mexican Honeysuckle (Justicia spicigera) Extract Using Mesquite Gum as Carrier Agent. Heliyon 2022, 8, e10733. [Google Scholar] [CrossRef]
  20. Murphy, T.E.; Walia, K.; Farber, J.M. Safety Aspects and Guidance for Consumerson the Safe Preparation, Handling and Storage of Kombucha—A Fermented Tea Beverage. Food Prot. Trends 2018, 38, 329–337. [Google Scholar]
  21. Jayabalan, R.; Subathradevi, P.; Marimuthu, S.; Sathishkumar, M.; Swaminathan, K. Changes in Free-Radical Scavenging Ability of Kombucha Tea during Fermentation. Food Chem. 2008, 109, 227–234. [Google Scholar] [CrossRef]
  22. Stewart, A.J.; Mullen, W.; Crozier, A. On-Line High-Performance Liquid Chromatography Analysis of the Antioxidant Activity of Phenolic Compounds in Green and Black Tea. Mol. Nutr. Food Res. 2005, 49, 52–60. [Google Scholar] [CrossRef] [PubMed]
  23. Nissen, L.; Demircan, B.; Taneyo-Saa, D.L.; Gianotti, A. Gianotti Shift of Aromatic Profile in Probiotic Hemp Drink Formulations: A Metabolomic Approach. Microorganisms 2019, 7, 509. [Google Scholar] [CrossRef] [PubMed] [Green Version]
  24. Oseyko, M.; Sova, N.; Lutsenko, M.; Kalyna, V. Chemical Aspects of the Composition of Industrial Hemp Seed Products. Ukr. Food J. 2019, 8, 544–559. [Google Scholar] [CrossRef]
  25. Zhu, Q.Y.; Zhang, A.; Tsang, D.; Huang, Y.; Chen, Z.Y. Stability of Green Tea Catechins. J. Agric. Food Chem. 1997, 45, 4624–4628. [Google Scholar] [CrossRef]
  26. Jhoo, J.-W.; Lo, C.-Y.; Li, S.; Sang, S.; Ang, C.Y.W.; Heinze, T.M.; Ho, C.-T. Stability of Black Tea Polyphenol, Theaflavin, and Identification of Theanaphthoquinone as Its Major Radical Reaction Product. J. Agric. Food Chem. 2005, 53, 6146–6150. [Google Scholar] [CrossRef] [PubMed]
  27. Szparaga, A.; Tabor, S.; Kocira, S.; Czerwińska, E.; Kuboń, M.; Płóciennik, B.; Findura, P. Survivability of Probiotic Bacteria in Model Systems of Non-Fermented and Fermented Coconut and Hemp Milks. Sustainability 2019, 11, 6093. [Google Scholar] [CrossRef] [Green Version]
  28. Bartkiene, E.; Zokaityte, E.; Lele, V.; Sakiene, V.; Zavistanaviciute, P.; Klupsaite, D.; Bendoraitiene, J.; Navikaite-Snipaitiene, V.; Ruzauskas, M. Technology and Characterisation of Whole Hemp Seed Beverages Prepared from Ultrasonicated and Fermented Whole Seed Paste. Int. J. Food Sci. Technol. 2020, 55, 406–419. [Google Scholar] [CrossRef]
  29. Nissen, L.; di Carlo, E.; Gianotti, A. Prebiotic Potential of Hemp Blended Drinks Fermented by Probiotics. Food Res. Int. 2020, 131, 109029. [Google Scholar] [CrossRef]
  30. Tang, C.-H.; Ten, Z.; Wang, X.-S.; Yang, X.-Q. Physicochemical and Functional Properties of Hemp (Cannabis sativa L.) Protein Isolate. J. Agric. Food Chem. 2006, 54, 8945–8950. [Google Scholar] [CrossRef]
  31. Malomo, S.A.; Rotimi, E.A. A Comparative Study of the Structural and Functional Properties of Isolated Hemp Seed (Cannabis sativa L.) Albumin and Globulin Fraction. Food Hydrocoll. 2015, 43, 743–752. [Google Scholar] [CrossRef]
  32. Chen, C.; Liu, B.Y. Changes in Major Components of Tea Fungus Metabolites during Prolonged Fermentation. J. Appl. Microbiol. 2000, 89, 834–839. [Google Scholar] [CrossRef]
  33. Sreeramulu, G.; Zhu, Y.; Knol, W. Kombucha Fermentation and Its Antimicrobial Activity. J. Agric. Food Chem. 2000, 48, 2589–2594. [Google Scholar] [CrossRef]
  34. TTBGov-Kombucha General. Available online: https://www.ttb.gov/kombucha/kombucha-general (accessed on 29 September 2022).
Figure 1. Contour plot for Total Phenolic Content (a) and Antioxidant Capacity DPPH+ assay (b) of kombucha samples.
Beverages 09 00050 g001
Figure 2. Contour plot for Protein Concentrations of kombucha’s samples.
Beverages 09 00050 g002
Table 1. Codification of the research variables in the experimental design.
FactorsLowHigh
−11
Hempseeds concentration (% w/v)0.010.02
Black tea leaves concentration (% w/v)0.0010.004
Table 2. Responses table for different experimental conditions.
Independent VariablesResponse Variables
SamplesHempseeds (% w/v)Black Tea Leaves (% w/v)AC (DPPH+ mg Trolox Eq/mL)TPC (mg GA Eq/mL)PC (µg/mL)
10.02210.00250.142 ± 0.1070.376 ± 0.0016.073 ± 0.032
20.02210.00250.146 ± 0.1070.260 ± 0.0196.001 ± 0.019
30.020.0010.118 ± 0.1070.167 ± 0.0016.842 ± 0.065
40.020.0040.112 ± 0.0770.324 ± 0.0014.148 ± 0.004
50.020.0040.117 ± 0.1070.136 ± 0.0024.080 ± 0.006
60.020.0010.146 ± 0.1070.907 ± 0.0017.828 ± 0.040
70.0150.00250.138 ± 0.3230.483 ± 0.0014.001 ± 0.019
80.0150.00040.134 ± 0.3700.290 ± 0.0064.908 ± 0.002
90.0150.00460.139 ± 0.1070.129 ± 0.0184.128 ± 0.001
100.0150.00250.108 ± 0.6460.126 ± 0.0024.990 ± 0.003
110.0150.00250.143 ± 0.4310.187 ± 0.0014.459 ± 0.013
120.0150.00250.141 ± 0.5380.394 ± 0.0035.908 ± 0.006
130.0150.00460.141 ± 0.9090.881 ± 0.0015.586 ± 0.004
140.0150.00250.135 ± 0.0770.181 ± 0.0025.772± 0.001
150.0150.00250.141 ± 0.5860.107 ± 0.0174.148 ± 0.004
160.0150.00250.148 ± 0.5380.336 ± 0.0024.120 ± 0.003
170.0150.00250.147 ± 0.5380.382 ± 0.0015.459 ± 0.013
180.0150.00250.139 ± 0.2150.393 ± 0.0055.772 ± 0.001
190.0150.00250.140 ± 0.3830.277 ± 0.0015.291 ± 0.009
200.0150.00040.142 ± 0.7710.193 ± 0.0034.328 ± 0.022
210.010.0040.138 ± 0.3230.353 ± 0.0014.041 ± 0.003
220.010.0010.128 ± 0.3130.266 ± 0.0031.073 ± 0.032
230.010.0040.103± 0.3230.105 ± 0.0011.842 ± 0.052
240.010.0010.143 ± 0.6850.287 ± 0.0050.341 ± 0.002
250.00790.00250.149 ± 0.5980.179 ± 0.0021.337 ± 0.066
260.00790.00250.145 ± 0.9690.309 ± 0.0021.041 ± 0.001
Control00.00250.134 ± 0.2150.206 ± 0.0050.356 ± 0.002
All data were reported as mean values ± the standard deviations (SD) with a p < 0.05. AC is antioxidant capacity, TPC is total phenolic compounds, and PC is protein concentration.
Table 3. Optimized kombucha formulation.
Hempseeds (% w/v)Black Tea Leaves (% w/v)AC
(mg Trolox Eq/mL)
TPC
(mg GA Eq/mL)
PC (µg/mL)Fit
0.01700.00460.15600.56367.84910.8347
AC is antioxidant capacity, TPC is total phenolic compounds, and PC is protein concentration.
Table 4. Analysis of variance (ANOVA) and regression model for the response of kombucha formulations according to hempseeds concentration.
ResponseANOVARegression Model
dfAdj SSAdj MSp-ValueR2S
AC (mg Trolox Eq/mL)50.00180.00030.00340.870.0097
TPC (mg GA Eq/mL)50.03440.06880.03770.800.0168
PC (µg/mL)50.00300.00600.01760.840.0080
df is degrees of freedom, SS is sum of squares, MS is mean square, R-squared describes the model fitting, S represents the standard deviation of the distance between the data values and the fitted value, AC is antioxidant capacity, TPC is total phenolic compounds, and PC is protein concentration.
Table 5. Physicochemical parameters, total phenolic content, antioxidant capacity, and protein concentration of optimized and control kombucha formulations.
SampleHempseeds (% w/v)Black Tea LeavespH°BrixAlcohol (% v/v)AC
(mg Trolox Eq/mL)
TPC
(mg GA Eq/mL)
PC
(µg/mL)
(% w/v)
Optimized kombucha0.0170.00462.68 ± 0.006 a2.9 ± 0.005 a0.047 ± 0.0901 a0.139 ± 0.1078 a0.426 ± 0.0933 a4.118 ± 0.1041 a
Control00.00252.62 ± 0.011 a3.1 ± 0.022 a0.044 ± 0.0003 a0.150 ± 0.2155 a0.206 ± 0.0005 b0.356 ± 0.0022 b
All data were reported as mean values ± the standard deviations (SD) with a p < 0.05. Different letters indicate statistically significant differences between samples (p < 0.05). AC is antioxidant capacity, TPC is total phenolic compounds, and PC is protein concentration.
Table 6. Comparison of physicochemical parameters, total phenolic content, antioxidant capacity, and protein concentration of kombucha samples based on experimental analysis and RSM calculations.
AC (mg Trolox Eq/mL)
ExpRSMPercentage of ratio (%)
0.139 ± 0.10780.156089.10
TPC (mg GA Eq/mL)
ExpRSMPercentage of ratio (%)
0.426 ± 0.09330.563675.58
PC (µg/mL)
ExpRSMPercentage of ratio (%)
6.118 ± 0.10417.849177.94
All data were reported as mean values ± the standard deviations (SD) with a p < 0.05. AC is antioxidant capacity, TPC is total phenolic compounds, PC is protein concentration, Exp is experimental method, and RSM is response surface method.
Disclaimer/Publisher’s Note: The statements, opinions and data contained in all publications are solely those of the individual author(s) and contributor(s) and not of MDPI and/or the editor(s). MDPI and/or the editor(s) disclaim responsibility for any injury to people or property resulting from any ideas, methods, instructions or products referred to in the content.

