Article

Evaluating the Effect of Adding Selected Herbs, Spices, and Fruits to Fermented Olympus Mountain Tea (Sideritis scardica) Kombucha Sweetened with Thyme Honey: Assessment of Physicochemical and Functional Properties

by
Ioannis Geraris Kartelias
,
Ioannis Panagiotakopoulos
,
Constantina Nasopoulou
and
Haralabos Christos Karantonis
*
Laboratory of Food Chemistry and of Technology and Quality of Animal Origin Food, Department of Food Science and Nutrition, School of the Environment, University of the Aegean, 81400 Myrina, Greece
*
Author to whom correspondence should be addressed.
Beverages 2024, 10(1), 9; https://doi.org/10.3390/beverages10010009
Submission received: 30 November 2023 / Revised: 25 December 2023 / Accepted: 12 January 2024 / Published: 15 January 2024
(This article belongs to the Section Tea, Coffee, Water, and Other Non-Alcoholic Beverages)

Abstract

:
This study examined the effects of adding herbs, spices, and fruits into fermented Olympus Mountain tea (Sideritis scardica) kombucha using thyme honey as a sweetener. This study evaluated how these additions affected the tea’s physical, chemical, and functional characteristics. Two different enrichments were proposed: a “Golden Mountain tea and honey Kombucha” (KG) with fresh ginger, turmeric powder, and lemon zest and juice and a “Red Mountain tea and honey Kombucha” (KR) with dried hibiscus calyces, rose petals, and lavender blossoms. In KR, the levels of vitamin C increased from 33.2 ± 2.7 to 48.4 ± 4.5. Additionally, the levels of calcium increased from 31.0 ± 1.2 to 55.7 ± 1.2, while the levels of potassium practically doubled from 64.7 ± 0.6 to 115.7 ± 2.5. An increased potassium concentration was observed in KG, and ionic iron was found for the first time after both enrichments. The total phenolic and flavonoid contents, along with antioxidant capacity, as assessed by the ABTS and DPPH methods, were found to be substantially enhanced in KR. In KG, the total phenolic content increased, together with antioxidant activity, as assessed by ABTS. Enrichment with hibiscus calyces, rose petals, and lavender blossoms significantly increased inhibitory effects against α-amylase, α-glucosidase, acetylcholinesterase, and butyrylcholinesterase. On the other hand, enrichment with ginger, turmeric, and lemon zest and juice decreased inhibitory effects against α-glucosidase and increased those against α-amylase, acetylcholinesterase, and butyrylcholinesterase. KR had the strongest enzyme-inhibiting activity, with its α-glucosidase-inhibiting activity increased by approximately 18 times. Therefore, enrichment with selected herbs, spices, and fruits can transform fermented Olympus Mountain tea kombucha sweetened with honey into a novel beverage with enhanced functional properties.

Graphical Abstract

1. Introduction

The functional beverage market has increased steadily over the past decade. Although functional beverages are readily accessible, there remains a necessity to investigate novel mixtures of ingredients and techniques to augment bioactivity in consumer goods. Studies have characterized kombucha as a functional beverage with numerous bioactive properties [1]. Herbs, spices, and fruits make an excellent choice for producing beverages with functional properties. According to a recent study [2], the use of medicinal herbs may enhance the recognition of kombucha as a functional beverage product. Herbs and spices are exceptional sources of phenolic compounds, ascorbic acid, and carotenoids, which have shown high antioxidant activity [3,4,5,6].
Hibiscus sabdariffa is used in foods, herbal drinks, and medicine. In vitro [7] and in vivo [8] studies revealed hibiscus calyces’ antioxidant, hepatoprotective, and anti-diabetic activities [9]. Among 30 medicinal plant teas examined, tea made from rose blossoms was shown to have one of the most potent antioxidant activities [10], but also anti-inflammatory, analgesic [11], antibacterial [12,13], antiviral [14], and antifungal effects [12]. Lavender blossoms are a good source of phenolic compounds and anthocyanins [15]. Ginger has traditionally been ingested as a seasoning and botanical remedy for an extended period [16]. It has been discovered that ginger exhibits a variety of biological activities, including antioxidant properties [17] and anti-inflammatory [18], antimicrobial [19], and anticancer activities [20]. In addition, studies have indicated that ginger may have beneficial properties for preventing and treating various illnesses, such as neurodegenerative diseases [21], cardiovascular diseases [22], obesity [23], diabetes mellitus [24], chemotherapy-induced nausea and emesis [25], and respiratory disorders [26]. Lemon zest contains a high concentration of phenolic compounds [27,28]. Turmeric has been used as a dye and spice, and its good antioxidant activity has previously been demonstrated [29].
Based on the above, we aimed to enrich fermented Olympus Mountain tea kombucha with honey with herbs, spices, and fruits to produce two novel beverages with upgraded functional properties. Two proposals, designated with colors, were given for the enrichment of fermented Olympus Mountain tea kombucha sweetened with honey: a “Golden Mountain tea and honey Kombucha” (KG), seeking to impart a fruity aroma and taste from lemon and ginger and a deeper shade of yellow from turmeric, and a “Red Mountain tea with honey Kombucha” (KR), aiming for a floral character by enriching it with rose petals and lavender blossoms and for a red color from hibiscus calyces.

2. Materials and Methods

2.1. Materials

Greek organic Sideritis scardica and hibiscus calyces originating from Egypt were purchased from a local market in Athens (www.evripidou.gr, accessed on 15 September 2023, Athens, Greece). Greek organic lavender blossoms were provided by a local market in Crete (www.bachari.gr, accessed on 15 September 2023, Heraklion, Greece). Greek red rose petals were purchased from a local market in Veria (www.Herbstore.gr, accessed on 15 September 2023, Veria, Greece). Thyme honey (Lemnian Land, 2022) was willingly provided by a local beekeeping cooperative (Myrina, Greece). An organic kombucha culture was acquired from a company located in Cumbria (UK). Tap water underwent filtration using an AQUA-PURE filter (3M Hellas MEPE, Maroussi, Greece). All chemicals and enzymes used in this study were obtained from Sigma–Aldrich (St. Louis, MO, USA).

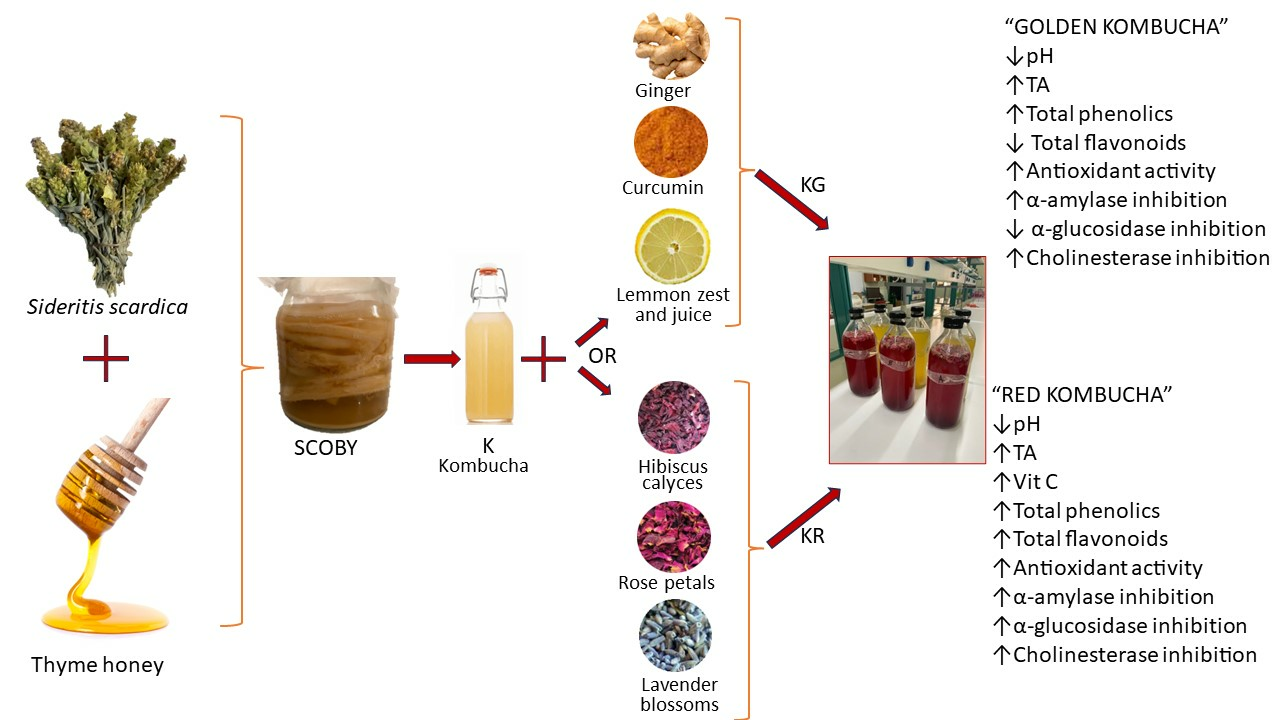
2.2. Preparation of the Beverages
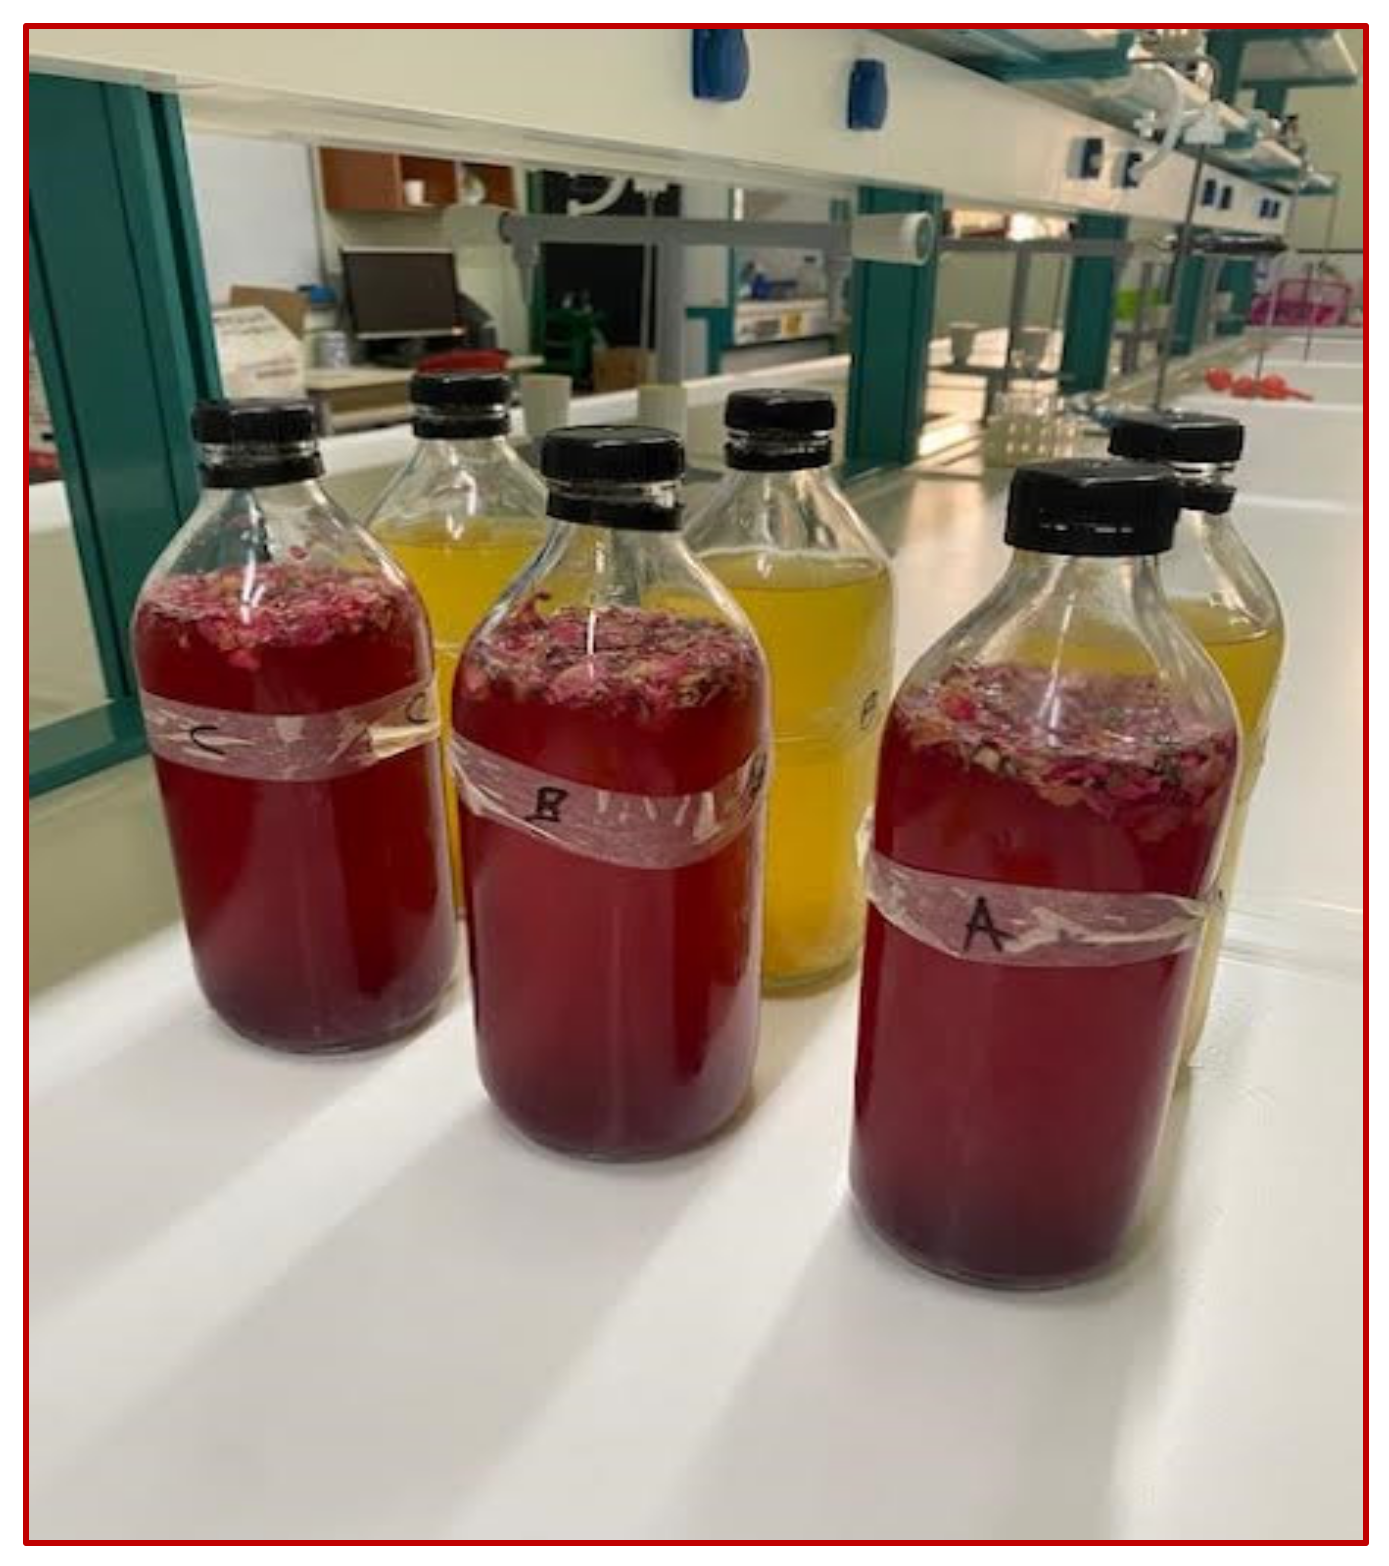
After the preparation of a fermented Olympus Mountain tea kombucha with honey (K) in three replications (A, B, C) as previously described [30], herbs, spices, and fruit were added (Figure 1). The aim was not to overpower the aroma of kombucha with Mountain tea and honey completely, so the maximum quantity of herbs, spices, and fruits for enrichment was set at 0.5% w/w (equal to the amount of Mountain tea added).
The proposed recipe for KG was 0.3% fresh ginger, 0.15% lemon zest, 0.04% lemon juice, and 0.01% ground turmeric, and for KR, it was 0.25% ground hibiscus calyces, 0.2% rose petals, and 0.05% lavender blossoms. After the addition of these ingredients, the drinks were bottled in the refrigerator for 48 h. Then, filtration and re-bottling were performed (AG, BG, and CG samples for KG; AR, BR, and CR samples for KR).

2.3. Sampling

After preparing the beverage samples K, KG, and KR, three replicates of each sample (A, B, C, AG, BG, CG, AR, BR, CR) were carried out (Table 1).
An analysis was conducted on the beverages before and after enrichment to determine the pH value; titratable acidity; color; content of sugars, ethanol, organic acids, minerals, vitamin C, total phenolics, and total flavonoids; α-amylase and α-glucosidase inhibition activities; anticholinesterase activity; and antioxidant activity. Before analysis, the kombucha was centrifuged at 5000× g for 10 min, and the resultant supernatant was kept at −40 °C until further examination.

2.4. Analysis of Color

The color of the beverages was determined using a Lovibond LC 100 spectropolarimeter with the SV 100 Kit (Tintometer® Group, Amesbury, England). The device recorded L (lightness), a (redness), and b (yellowness) values. The total color difference was calculated using the equation Δ E = Δ L 2 + Δ α 2 + Δ b 2 . The distinction in color between the samples pre- and post-enrichment can be categorized as not obvious (0–0.5), slightly noticeable (0.5–1.5), noticeable (1.5–3.0), clearly visible (3.0–6.0), or great (>6.0) based on the value of ΔE [31].

2.5. Determination of Active and Titratable Acidities

The pH values were determined using an electronic pH meter calibrated at pH 4.0 and 7.0, (Consort C931, Consort bvba, Turnhout, Belgium). CO2 was removed from the fermentation broth to determine the titratable acidity [32]. Then, a 20-mL sample was taken and titrated with NaOH 0.1 mol/L. The resulting titratable acidity levels were expressed in g/L of acetic acid in each sample.

2.6. Determination of Sugars, Ethanol, Organic Acids, and Minerals

Ethanol was quantified using the K-ETOH enzymatic kit (Megazyme, International Ireland Limited, Ayr, Scotland, U.K.), which has been validated for use in kombucha fermented drinks. In summary, ethanol undergoes oxidation to become acetaldehyde by the action of alcohol dehydrogenase. Subsequently, acetaldehyde is further oxidized by acetaldehyde dehydrogenase, resulting in the production of NADH, which is ultimately measured.
The contents of sugars, organic acids, and minerals were determined using enzymatic kits and an enzymatic analyzer (Miura One, TDI, Barcelona, Spain).

2.7. Vitamin C

Vitamin C was assessed using a photometric technique, as previously described [33], with some modifications. Concisely, a total of 1.0 mL of the beverage was sampled both before and after the enrichment process in 3.0% metaphosphoric acid, and these samples were then pooled with 9.0 mL of oxalic acid in EDTA, 2.0 mL of 50% sulfuric acid, and 4.0 mL of 5.0% ammonium molybdate and mixed thoroughly. Absorbance was measured at λ = 705 nm at room temperature for 3.0 min using a spectrophotometer (Lambda 25, Perkin Elmer, Norwalk, CT, USA). Vitamin C was used as a calibration standard; the results were expressed in mg/L.

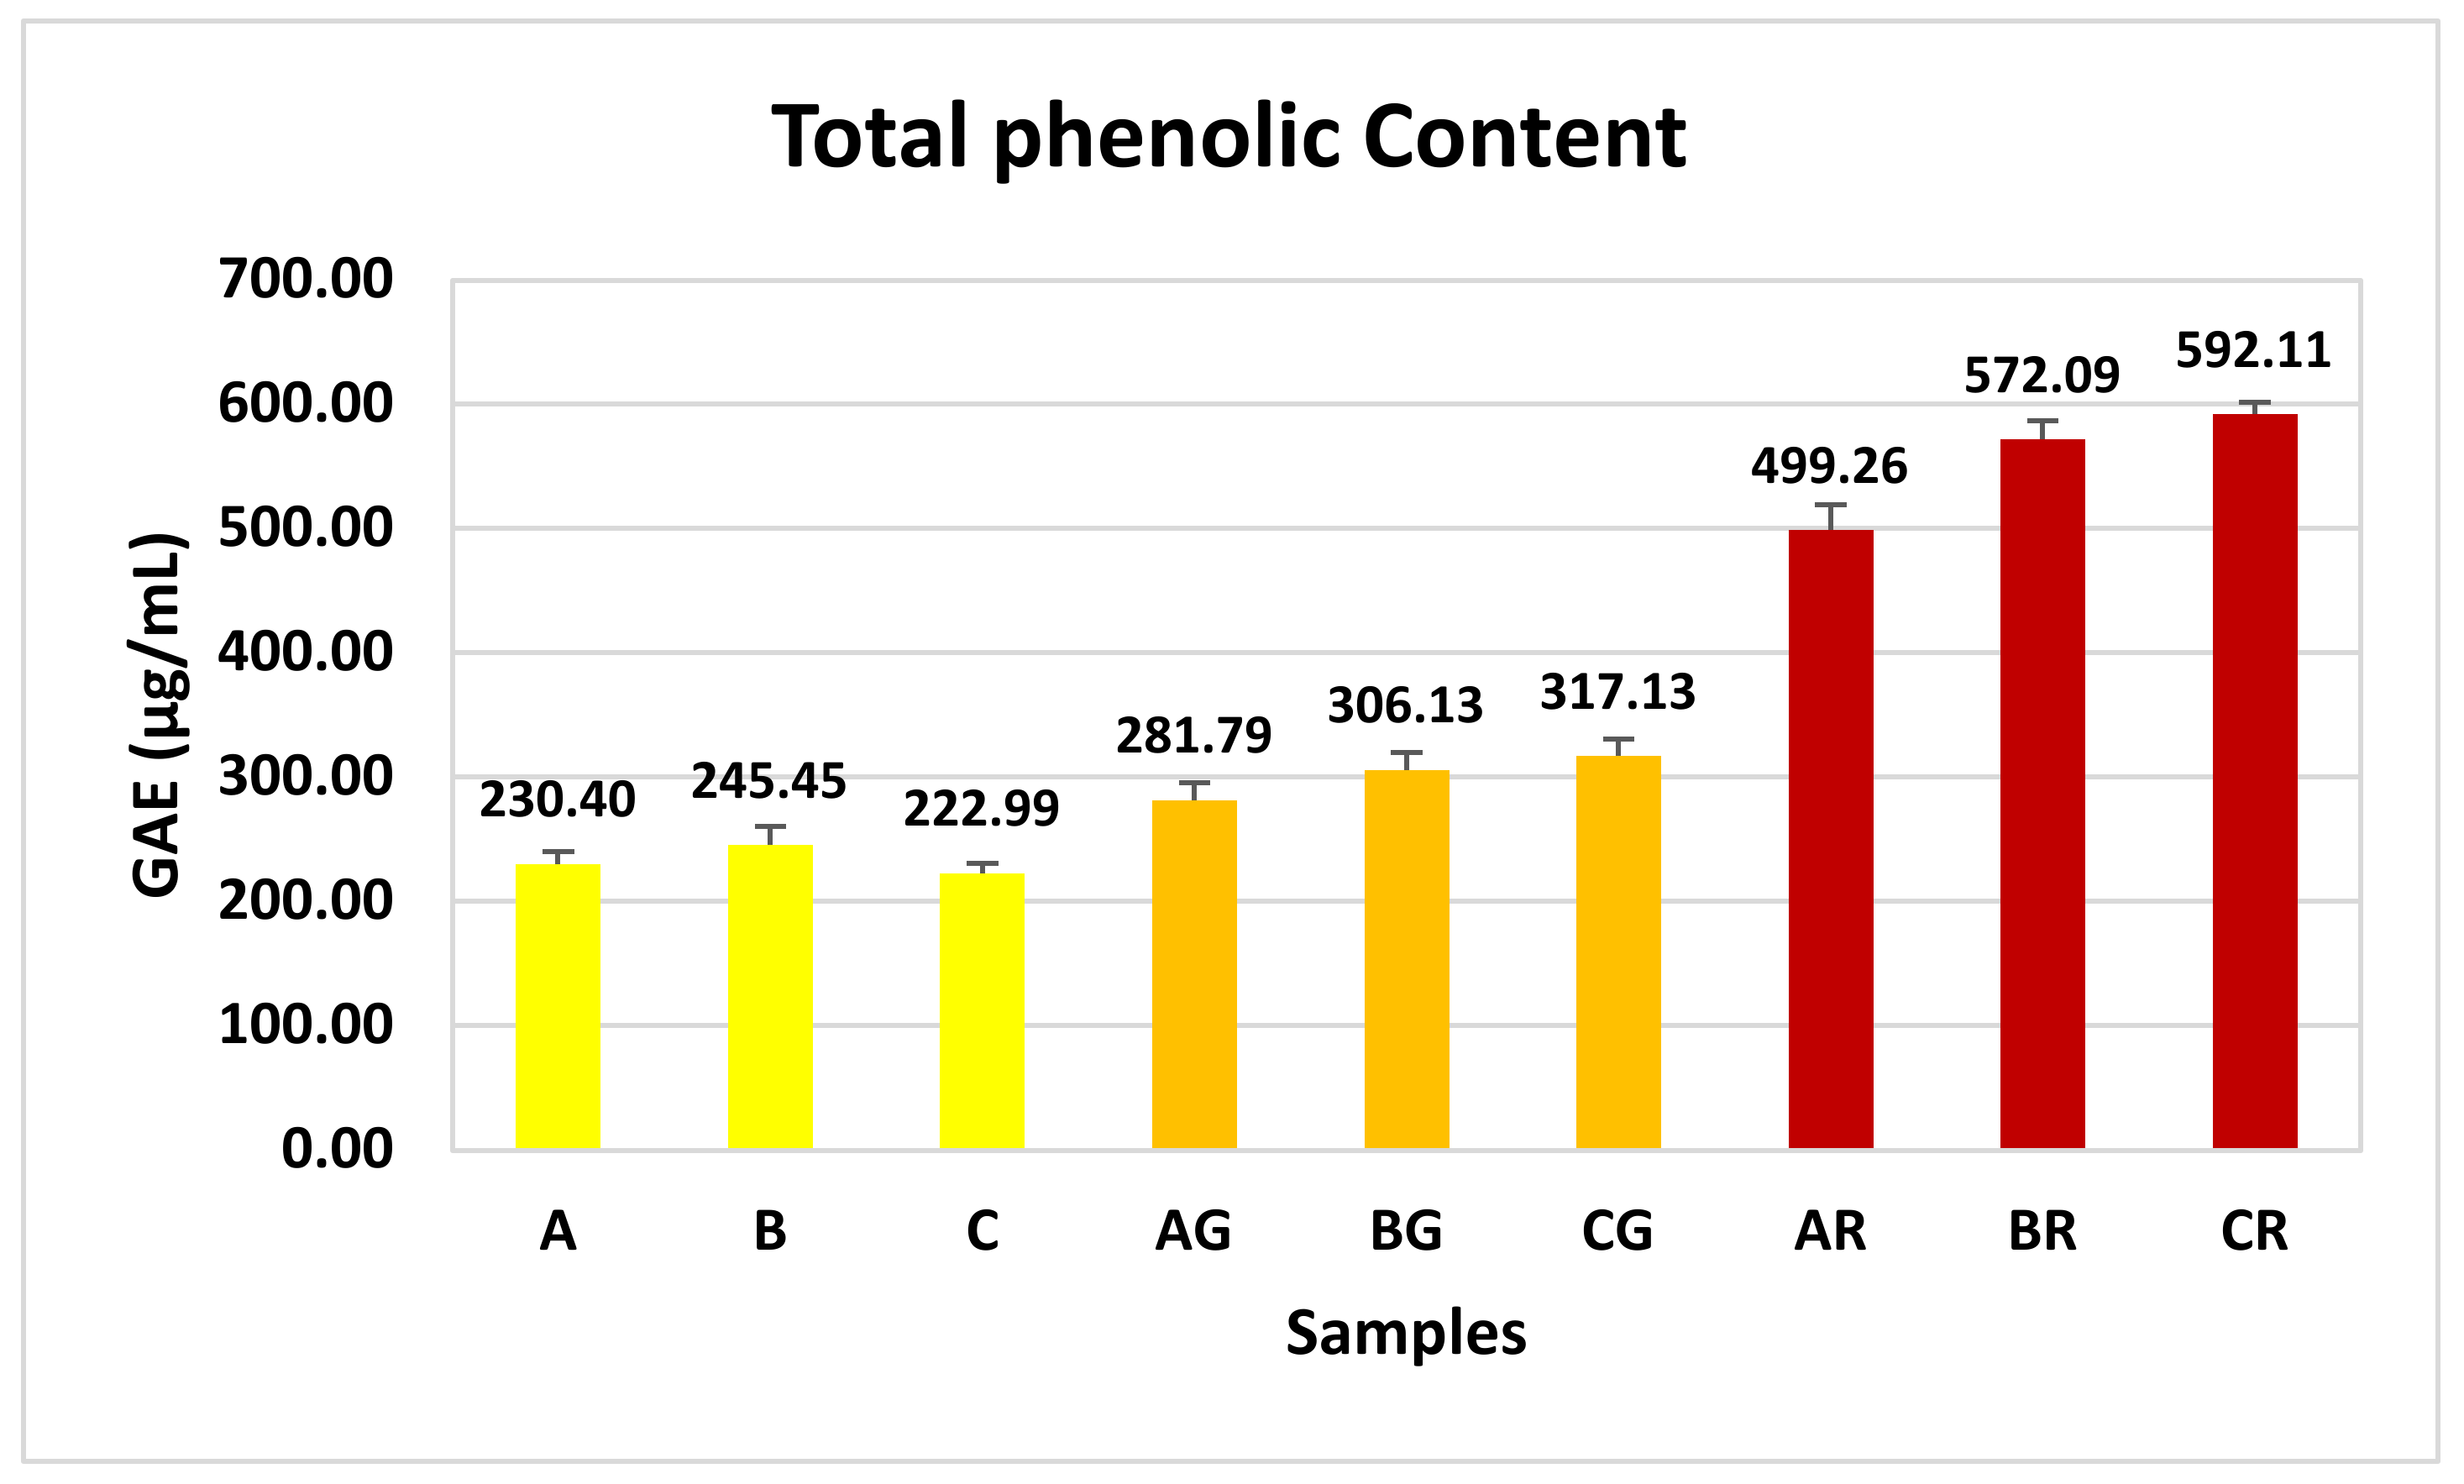
2.8. Content of Total Phenolics

The Folin–Ciocalteu technique [34] was employed to determine the total phenolic content. Gallic acid served as a calibration standard, and the outcomes were quantified as micrograms of gallic acid equivalents (GAE) per milliliter.

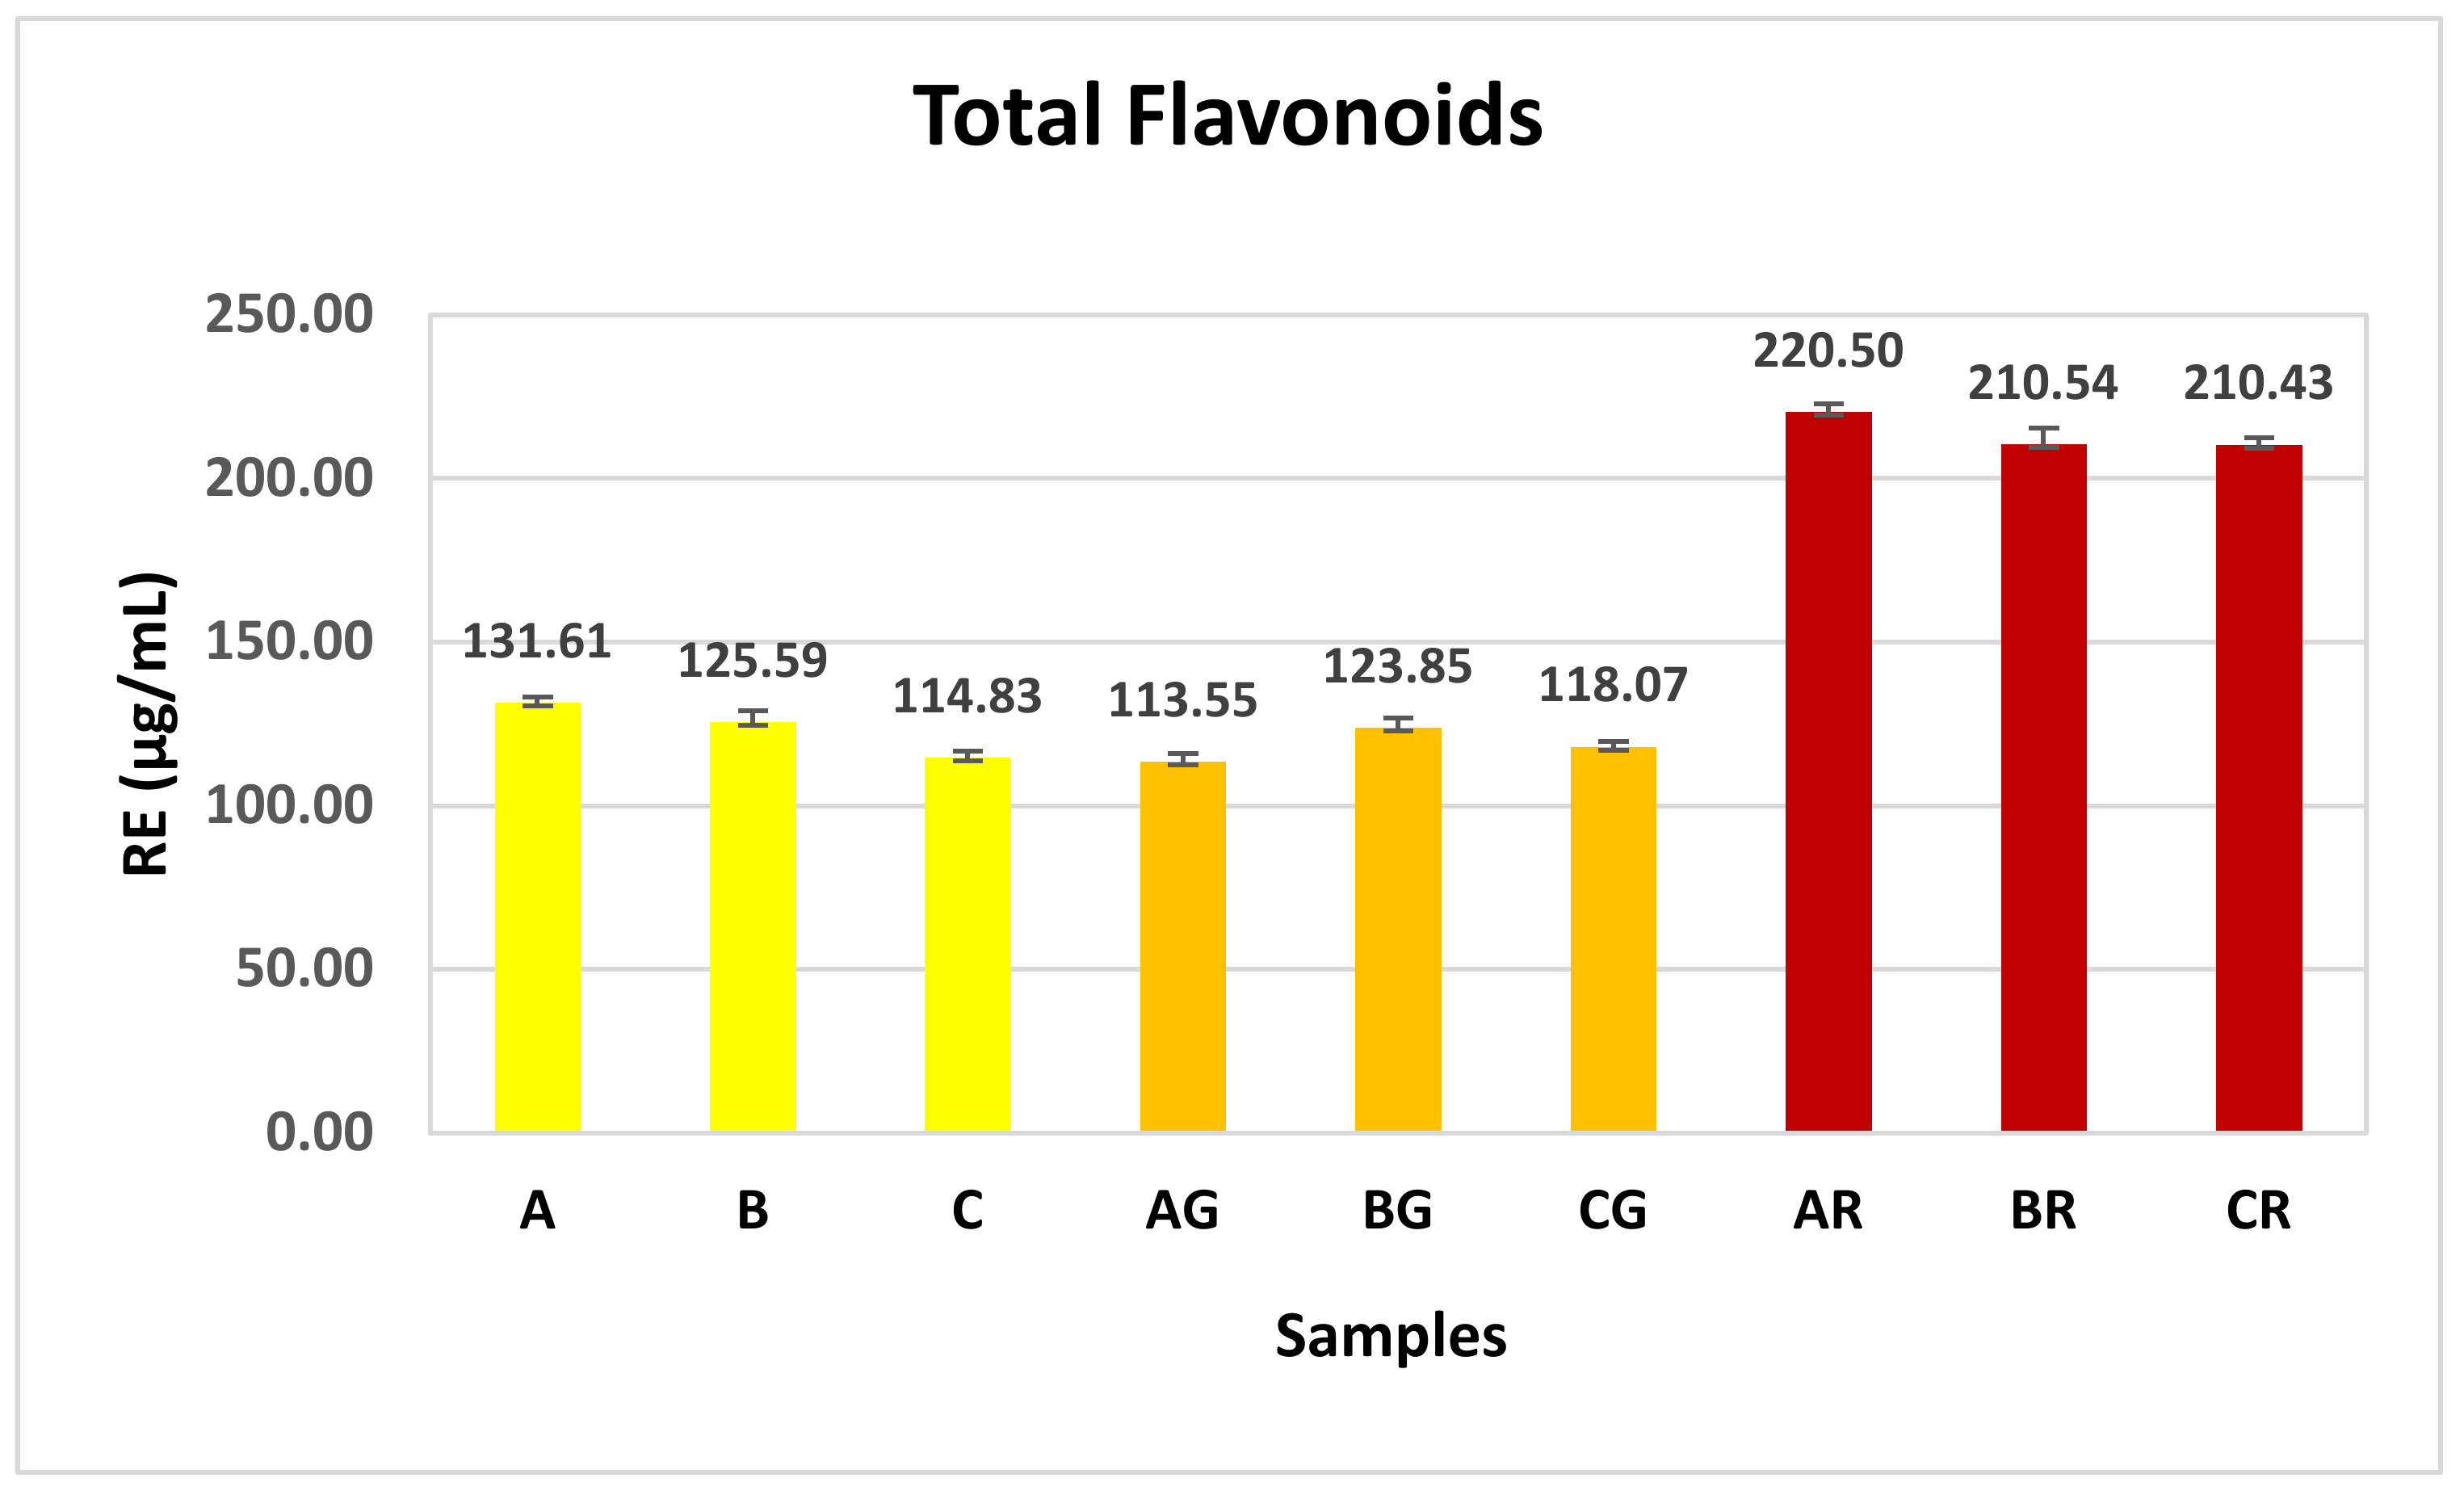
2.9. Content of Total Flavonoids

Flavonoid content was estimated using a colorimetric assay [35]. Rutin was employed as a reference standard for calibration purposes, and the outcomes were quantified in terms of micrograms of rutin equivalents (RE) per milliliter.

2.10. Determination of Antioxidant Activity

The antioxidant capacity of kombucha beverages was evaluated by ABTS and DPPH assays. The DPPH assay was conducted according to the methodology described by Kwon et al. [36], while the ABTS assay followed Xia et al.’s [37] protocol. The inhibition of DPPH or ABTS●+ was evaluated using the formula % inhibition activity = [(Abs control − Abs sample)/Abs control] × 100, followed by plotting the percentage of inhibition against the sample amount in μL to determine the amount for 50% inhibition (IC50).

2.11. α-Glucosidase and α-Amylase Inhibition Assays

2.11.1. α-Glucosidase Inhibition Assay

The α-glucosidase inhibition evaluation was carried out using the methodology described by Kwon et al. [36] with some modifications. At first, 15.0 and 20.0 µL of the samples were mixed with 0.1 M phosphate buffer (pH 6.9, 700 μL) containing 10 μL of α-glucosidase solution (33.3 U/mL). The mixture was then incubated at 37 °C for 10 min. Next, 50.0 μL of a 5 mM solution of p-nitrophenyl-α-D-glucopyranoside in 0.1 M phosphate buffer (pH 6.9) was added to each well. The mixtures were finally incubated at 25 °C for 5 min, followed by absorbance measurement at 405 nm (SPECTROstar Nano, BMG Labtech, Ortenberg, Germany). The % inhibition was evaluated using the following equation: % inhibition = [(Abs reference − Abs sample)/Abs reference] × 100. The IC50 was estimated for each sample using a linear regression method with the data from the % inhibition results.

2.11.2. α-Amylase Inhibition Assay

The Caraway–Somogyi iodine/potassium iodide (IKI) method was used to determine the α-amylase inhibitory activity, as previously described [38], with some modifications. Firstly, a 200–250 μL sample solution was mixed with 1000 μL α-amylase solution, made in phosphate buffer with a pH value of 6.9 in 6.0 mM sodium chloride. The mixture was then subjected to an incubation period of 10 min at 37 °C. After this, the reaction was initiated by adding 500 μL of starch solution, 0.5% w/v in concentration. A blank was also prepared by adding a sample solution to all the reaction reagents except for the enzyme (α-amylase) solution. The reaction mixture was incubated for an additional 10.0 min at 37 °C, and then 250 μL of 1.0 M HCl was added to terminate the reaction. Next, an iodine–potassium iodide solution of 1000 μL was added. The sample and the blank absorbances were read at 630 nm (Lambda 25, Perkin Elmer, Norwalk, CT, USA). First, the α-amylase inhibitory activity was expressed as a percentage of inhibition by dividing the sample absorbance by the blank absorbance. % inhibition = [(Abs reference − Abs sample)/Abs reference] × 100. The IC50 values were determined by fitting a straight line (linear regression) to the data obtained from the percentage inhibition values.

2.12. Anticholinesterase Assays: Ache and Bche Inhibition

A spectrophotometric method [39] with some modifications was used to determine acetylcholinesterase (AChE) and butyrylcholinesterase (BChE) activities. In summary, a total of 1500 μL of 0.1 mM sodium phosphate buffer with a pH of 8.0, 50 μL of DTNB, 200 μL of the sample, and 25.0 μL of enzyme solution were combined and allowed to react for 15.0 min at a temperature of 25.0 degrees Celsius. Subsequently, 10.0 μL of either ACTHI or BCTHI was introduced. The final blend was incubated at a temperature of 25 °C for 25.0 min, and the absorbance was recorded at a wavelength of 412 nm. A blank was prepared and measured without extract. The enzyme activity inhibition percentage was calculated as follows: % inhibition = 100 × (Abs blank − Abs sample)/Abs blank. The final cholinesterase activity was presented in terms of the IC50 values, expressed as the mean ± standard deviation of three replicate values.

2.13. Statistical Analysis

All results were presented as the mean ± standard deviation (SD) of three replicates. The level of statistical significance among the means was analyzed using one-way ANOVA, an independent sample test, using SPSS. The correlation coefficients developed by Pearson and Spearman were used to assess correlations. The confidence limits were established with a significance level of p < 0.05.

3. Results and Discussion

3.1. Macroscopic Changes Due to the Addition of Herbs, Spices, and Fruits: Color Changes

Minutes after the addition of the hibiscus calyces, the rose petals, and the lavender blossoms, a bright red color began to spread into the broth. Adding ginger, curcumin, lemon zest, and juice made the color difference less apparent macroscopically but noticeable with deeper shades of yellow. The outcomes of the alterations in the chromatic parameter validated the visual assessment and are shown in Table 2. The ΔE values of fermented Olympus Mountain tea kombucha with honey (K) and KR exceeded 6, indicating a significant degree of color variation. Moreover, the chromatic parameter a (redness) significantly increased (p < 0.05). The red color is attributed to delphinidin, an anthocyanidin abundant in hibiscus calyces that appears red in an acidic environment [40]. As pH increases, this primary plant pigment changes from red to purple, blue, and bluish green. The ΔΕ values of K and KG were 1.84, indicating a “noticeable” color difference. Furthermore, the chromatic parameter b (yellowness) showed an increase.

3.2. PH and TA

The changes in pH and titratable acidity between K (samples A, B, and C), KR (samples AR, BR, and CR), and KG (AG, BG, and CG) are shown in Table 3. Each value was obtained from three observations. The pH values decreased significantly (p < 0.05) after the enrichment with herbs, roots, and fruits.
The pH readings fall within the acceptable range of 2.5 to 4.2 for human consumption [41].
Following the enrichment, a statistically significant rise in the titratable acidity (p < 0.05) was detected in both KG (AG, BG, CG) and KR (AR, BR, CR). TA average values expressed in acetic acid (g/L). The decline in pH levels and the rise in acidity are assumed to be more due to the enrichment than the fermentation because the enrichment occurred in the fridge (temperature < 6.0 °C) and the fermentation slows down or stops at low temperatures. More specifically, organic and phenolic acids in herbs, spices, and fruits are infused into the broth after their addition. The hibiscus calyx extract contains many organic acids, including hibiscus acid as a major compound and oxalic and ascorbic acid as minor compounds [40]. The ascorbic acid content in calyces varies greatly between fresh (6.7–14 mg/100 g) and dried calyces (260–280 mg/100 g) [42]. Major organic acids in hibiscus extract are hydroxycitric acid, hibiscus acid, and their derivatives found in leaves and calyces [9,43,44,45,46,47]. In addition, hibiscus calyces contain chlorogenic acid, protocatechuic acid, and pelargonic acid, amongst others [40,48]. Free gallic acid was found in teas prepared from various rose cultivars [49]. In the study presented in [50], large amounts of phenolic acids were demonstrated in rose petal extracts. More specifically, large amounts of gallic acid (9.55 mg to 1.00 ×10³ mg of dry extract) were followed by smaller quantities of protocatechuic, gentisic, and coumaric acids. Organic acids are present in ginger. In addition, lemon fruits contain several nutrients, such as citric acid and ascorbic acid [51].

3.3. Changes in Sugars, Ethanol, Organic Acids, Minerals, and Vitamin C

3.3.1. Sugars

The total sugar content remained unchanged at 42 ± 0.0 g/L in all samples as the enrichment occurred at fridge temperatures, indicating that the fermentation stopped or slowed down (Table 4).
The glucose values were 20.4 ± 0.7, 20.1 ± 0.8, and 18.6 ± 0.7 g/L for samples A, B, and C, respectively. After the enrichment with hibiscus calyces, rose petals, and lavender blossoms, no significant changes were observed in the values (20.1 ± 0.6, 20.1 ± 0.7, and 18.3 ± 0.8 for AR, BR, and CR, respectively). No significant changes were observed in the values after the enrichment with ginger, turmeric, lemon zest, and juice (19.8 ± 0.9, 20.1 ± 0.6, and 18 ± 0.9 for AG, BG, and CG, respectively).
The fructose values were 17.1 ± 0.8 and 18.6 ± 1 g/L for A and B and 21.0 ± 0.9 g/L for C. After the enrichment with hibiscus calyces, rose petals, and lavender blossoms, no significant changes were observed in the values (16.8 ± 0.9, 18.6 ± 0.8, and 19.4 ± 1 for AR, BR, and CR, respectively). No significant changes were observed in the values after the enrichment with ginger, turmeric, lemon zest, and juice (16.5 ± 0.9, 18.3 ± 0.9, and 19.5 ± 0.9 for AG, BG, and CG, respectively).

3.3.2. Acids

No significant differences (p > 0.05) were observed in the acetic and gluconic acid values after enrichment. The concentration of citric acid significantly increased in KG, from an average of 0.04 ± 0 g/L in K to 0.66 ± 0.05 g/L. The presence of lemon zest and juice in KG explains the above. Citric acid is one of the nutrients in lemon fruits, as noted by [51].

3.3.3. Ethanol

The ethanol content showed no statistically significant changes (p > 0.05). The ethanol values of the beverage after the fermentation and enrichment were less than 1.0% v/v.

3.3.4. Minerals

The analysis of trace elements in K detected the presence of calcium and potassium quantities of 31.0 ± 1.2 g/L and 64.0 ± 2.2 g/L, respectively, which almost doubled (55.7 ± 1.2 g/L and 115.7 ± 2.5 g/L) after the enrichment with hibiscus, rose petals, and lavender blossoms. An increase in potassium concentration (72.3 ± 1.5 g/L) was also observed after the enrichment with ginger, turmeric, lemon zest, and juice. Finally, iron was found for the first time after the enrichments in KG (0.13 ± 0.05 g/L) and KR (0.10 ± 0.04 g/L).
The above can be explained by the concentration of minerals in the herbs, spices, and fruits added to the kombucha fermented beverage. For example, hibiscus calyces are rich in calcium, potassium, and iron [42,52]. Moreover, rose petals contain potassium, calcium, and iron, amongst other minerals [53]. In another study [54], potassium and iron were present in appreciable amounts in ginger and turmeric. Potassium has also been detected in lemon peels [55].

3.3.5. Vitamin C

An increase in the vitamin C content that is statistically significant (p < 0.05) was detected after the addition of hibiscus calyces, rose petals, and lavender blossoms. The average vitamin C content increased from 33.22 ± 2.67 mg/L in K to 48.39 ± 4.55 mg/L in KR. On the other hand, after the addition of ginger, curcumin, lemon zest, and juice, the vitamin C concentration did not exhibit a statistically significant variation (p > 0.05). The richness of vitamin C in the infused hibiscus calyces can explain the significant increase in vitamin C content in KR. Hibiscus calyces contain ascorbic acid, with concentrations ranging significantly between fresh (6.7–14 mg/100 g) and dried calyces (260–280 mg/100 g) [42]. On the contrary, the insignificant change in the vitamin C content in KG is due to the very small quantity of fresh lemon juice added (0.04% w/w), combined with the average concentration of vitamin C in lemon juice, 32.7 mg in 100 mL [56].

3.4. Changes in Total Phenolic Compounds, Flavonoids, and Phenolic Profile

The total phenolic compounds increased statistically significantly (p < 0.05) after the addition of herbs, spices, and fruits. As shown in Figure 2, the total phenolic content in K (samples A, B, and C) increased after the enrichment from 235.8 ± 14.25 μg GAE/mL to 301.7 ± 20.2 and 542 ± 38.6 μg GAE/mL for KG (samples AG, BG, and CG) and KR (samples AR, BR, and CR), respectively.
The explanation lies in the infused phenolic compounds from the herbs, spices, lemon zest, and juice in the fermented Olympus Mountain tea kombucha sweetened with thyme honey. In a previous study [50], a high phenolic content was found in rose petals, with tannins making up a substantial part. Other writers have previously reported significant quantities of tannins [57,58,59]. Most of the rose teas examined had a total phenolic component level that was either equivalent to or greater than that seen in green tea [49]. In addition, lavender blooms serve as a valuable reservoir of phenolic chemicals and anthocyanins [15]. Turmeric and ginger, when dried, contain high levels of phenolic curcuminoids such as curcumin, dimethoxycurcumin, and bisdemethoxycurcumin, as well as spicy phenolic compounds including gingerol and shogaol [60]. Likewise, lemon zest contains a high concentration of phenolic compounds [27,28].
After the addition of hibiscus, rose petals, and lavender (samples AR, BR, and CR), a statistically significant increase in the average values of the flavonoid content (p < 0.05) was recorded, from 123.4 ± 8.3 to 213.8 ± 5.8 μg RE/mL (Figure 3). On the other hand, the average value of total flavonoids decreased from 123.4 ± 8.3 to 118.5 ± 5 μg RE/mL. However, this difference was not statistically significant (p > 0.05) after the addition of ginger, turmeric, lemon zest, and juice (samples AG, BG, and CG).
The rich flavonoid content of the herbs infused can explain the significant increase in flavonoids in KR. Large amounts of flavonoids in rose petals have been previously demonstrated [50], where LC-ESI-MS/MS analysis revealed the presence of nine flavonoid glycosides, primarily quercetin and kaempferol derivatives. Hibiscus calyces contain flavonoids like hibiscitrin, sabdaritrin, gossypitrin, gossytrin, other gossypetin glucosides, quercetin, and luteolin [40,48]. The hibiscus calyces contain pigments called anthocyanins, which are flavonoid derivatives that change color depending on the pH [40]. Several studies have identified delphinidin-3-sambubioside (delphinidin-3-O-(2-O-b-D-xylopyranosyl)-b-D-glucopyranose) and cyanidin-3-sambubioside (cyanidin-3-O-(2-O-b-D-xylopyranosyl)-b-D-glucopyranoside) as the major anthocyanins present in extracts from hibiscus calyces [9,43,46,61,62,63]. The statistically insignificant change in the flavonoid content after the enrichment with ginger, turmeric, lemon zest, and juice could be explained by the small quantities added, the fact that ginger and lemon are in a fresh state, the considerably low flavonoid content of the above, and the acidic environment of K. Previous research indicated that the acidic nature of the fermented kombucha beverage led to the breakdown of flavonoids [64]. Also, a decreased flavonoid content of Olympus Mountain tea sweetened with honey after kombucha fermentation has been previously reported [30].

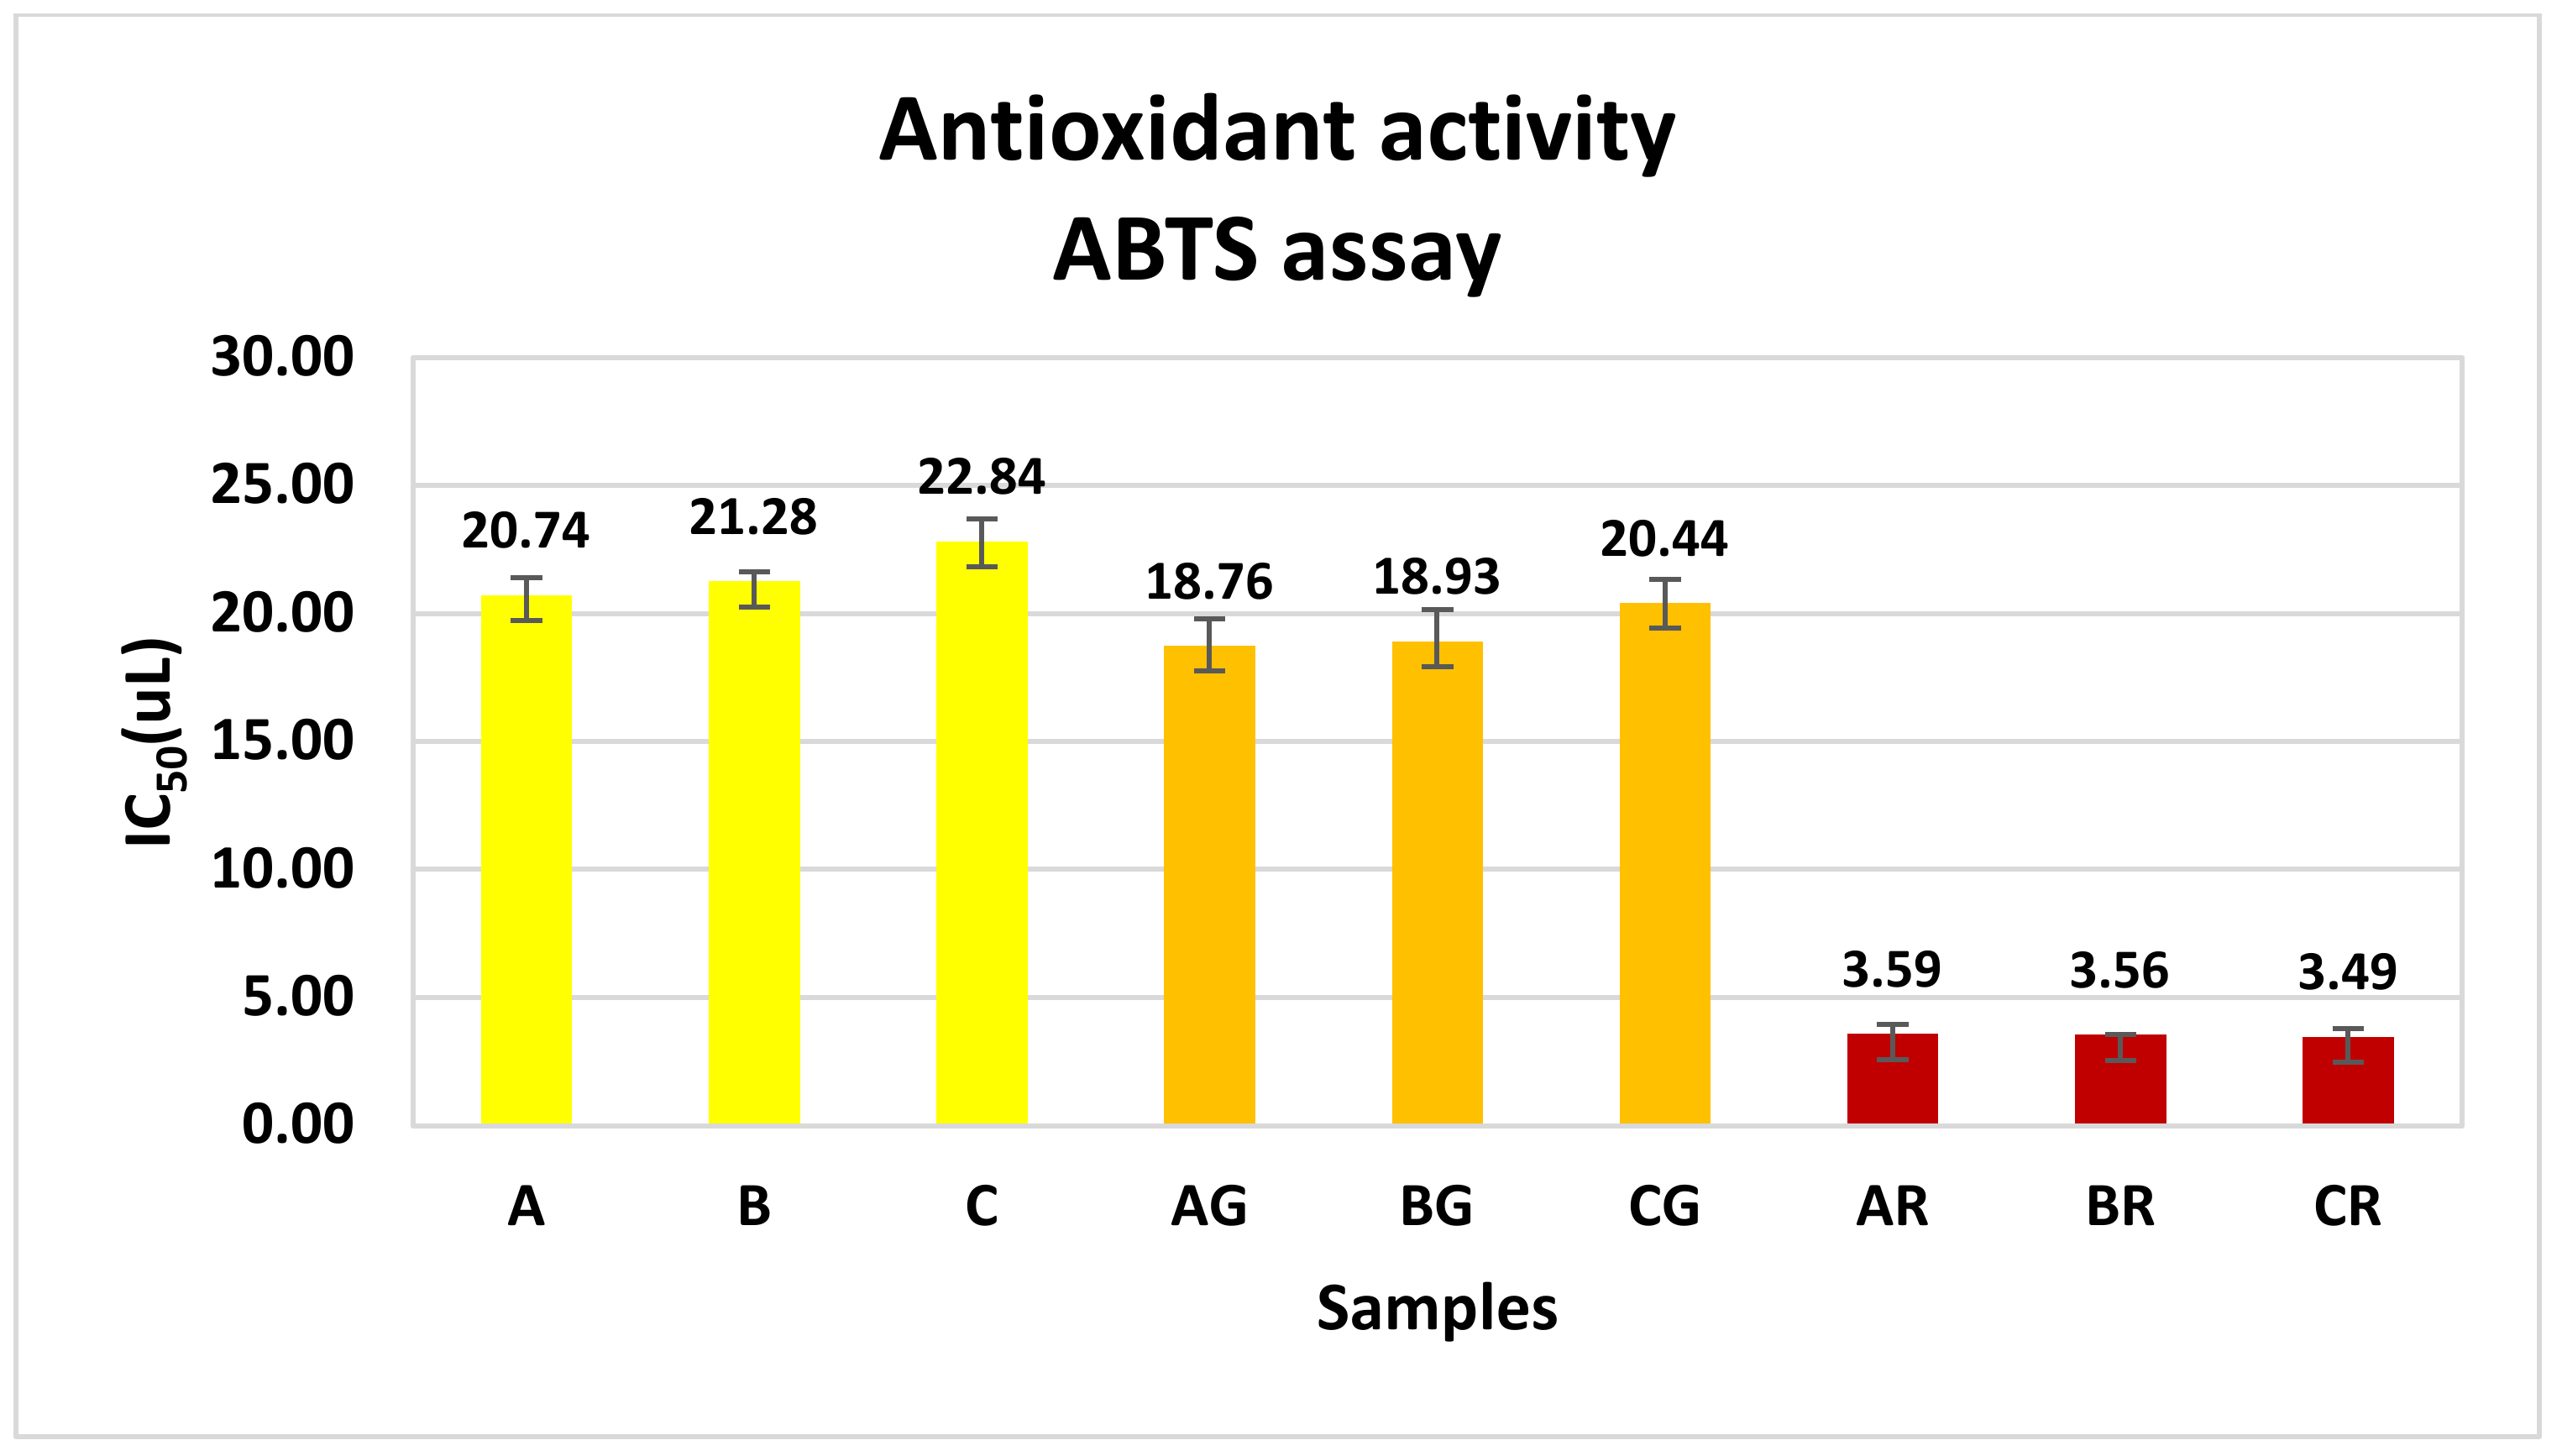
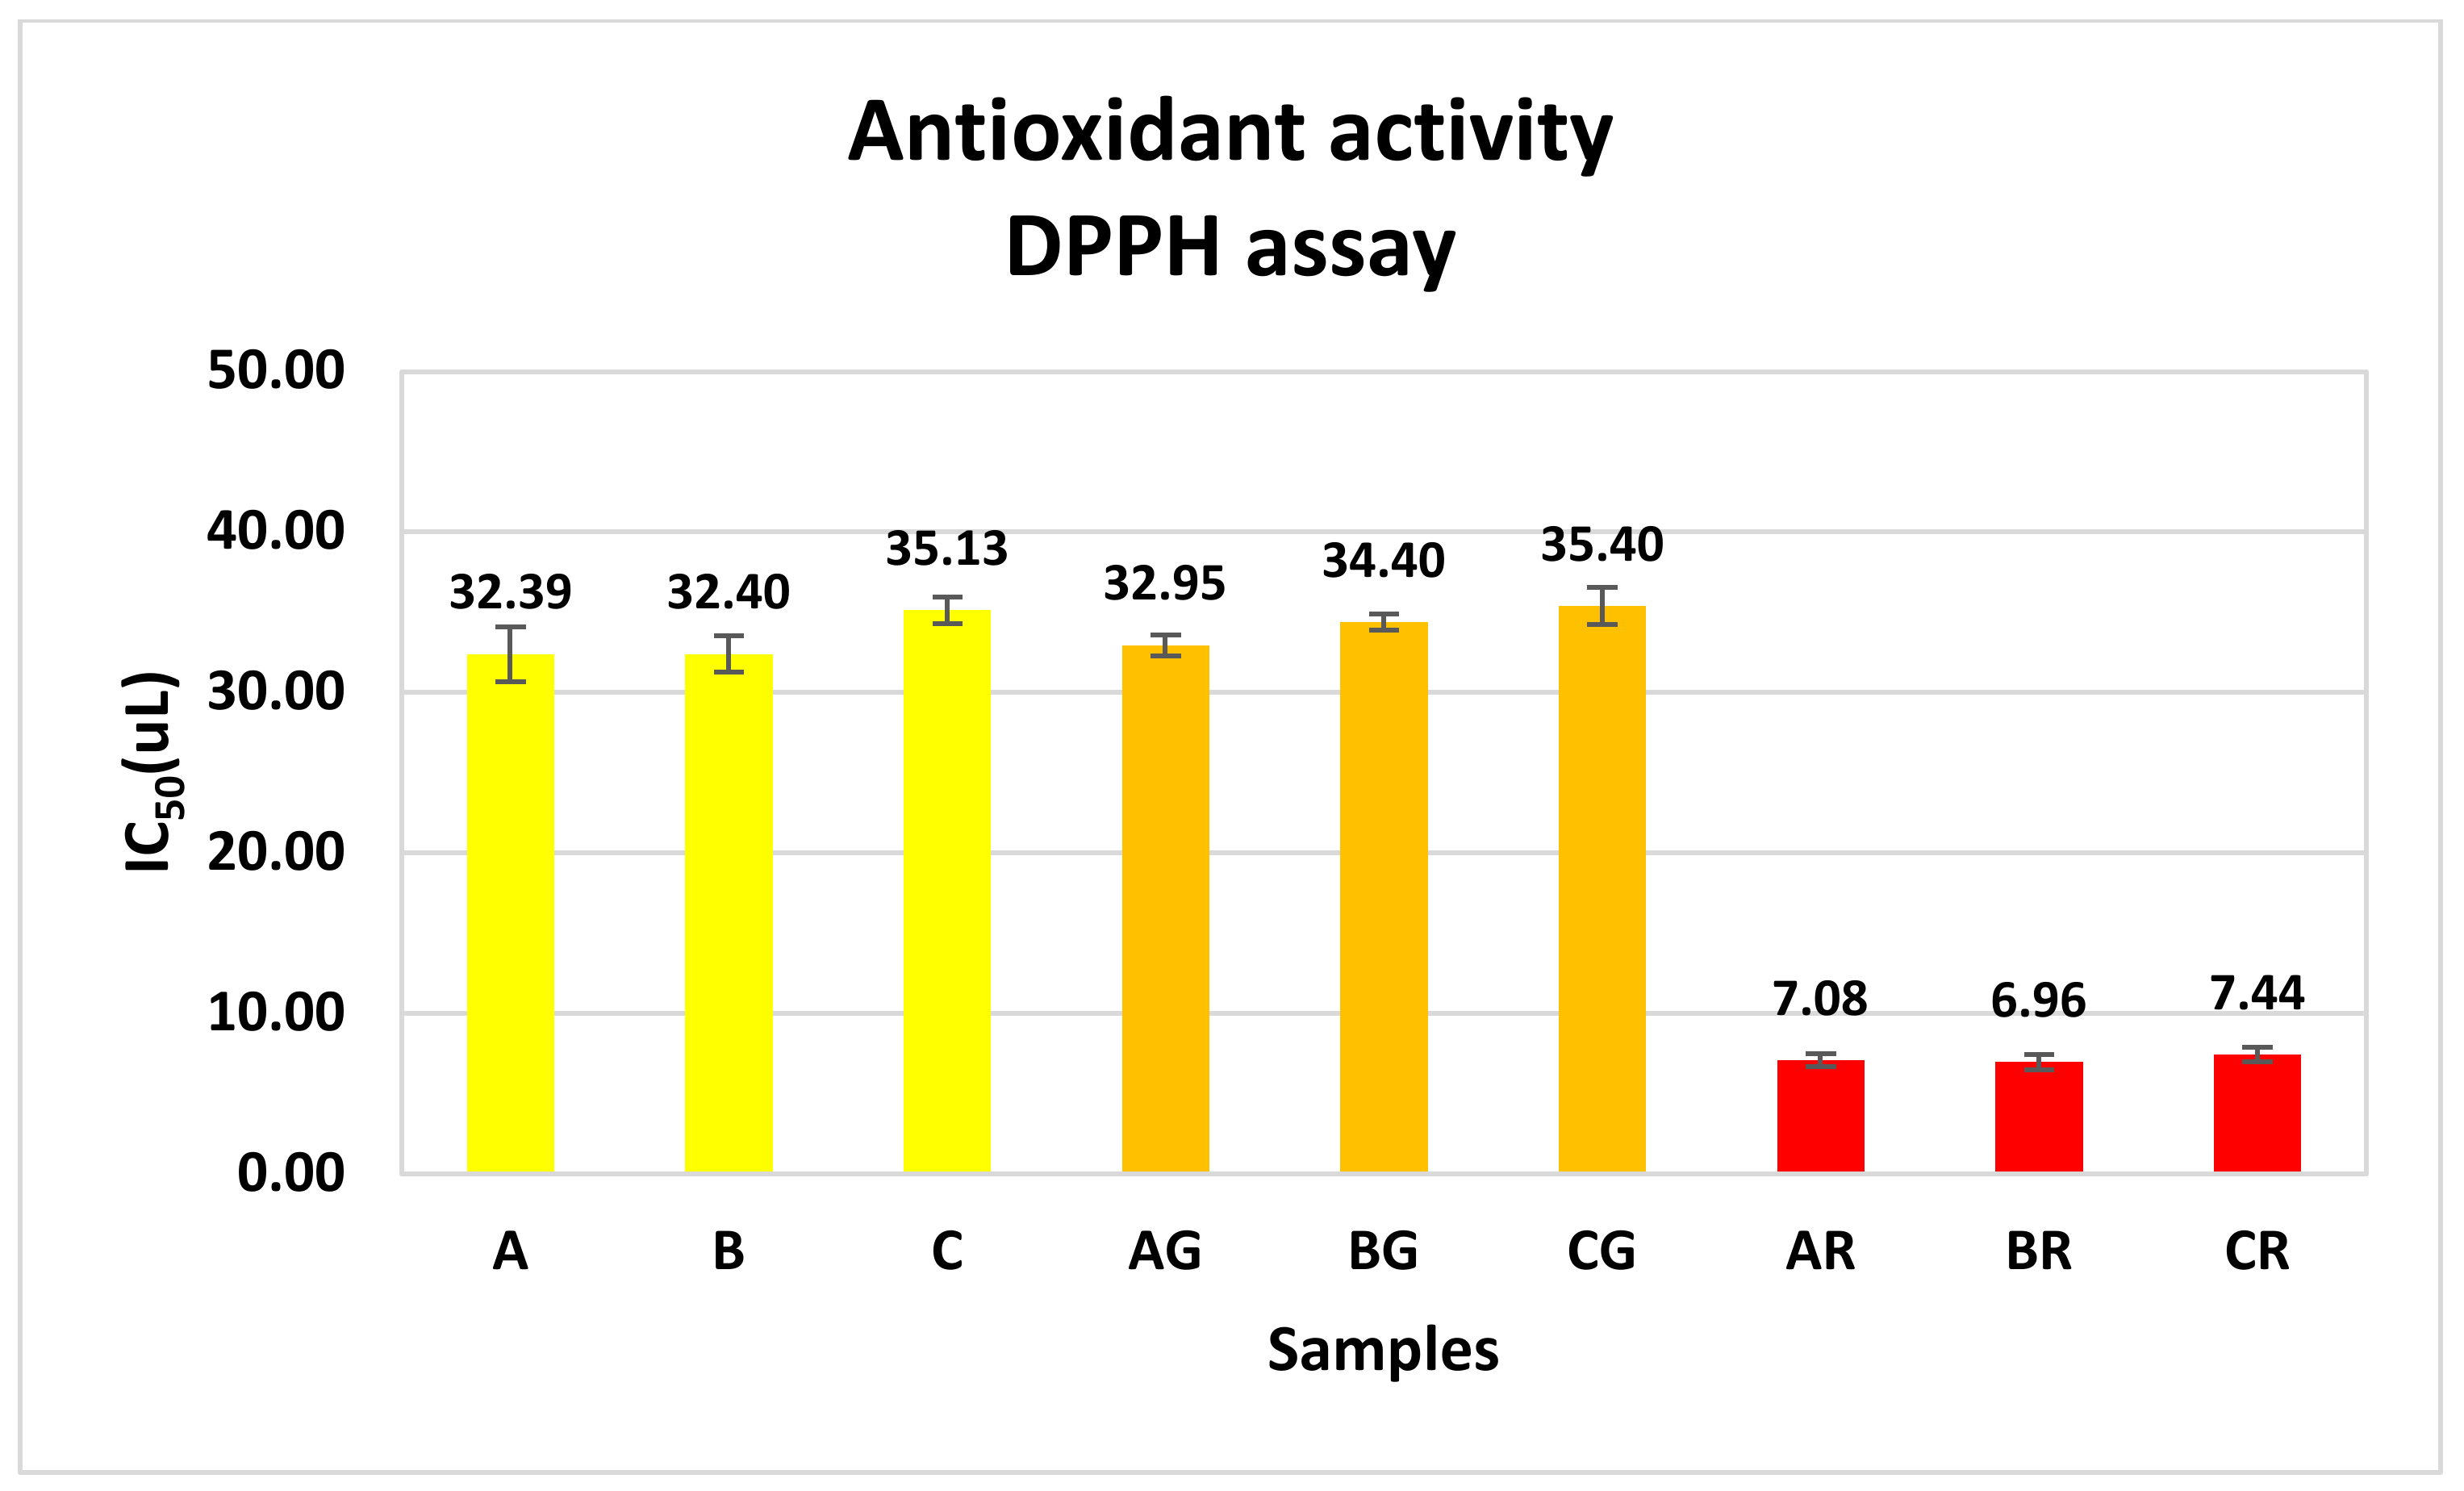
3.5. Evaluation of Antioxidant Activity

The antioxidant capacity of K was assessed using two distinct assays, namely the DPPH and ABTS assays. This assessment was conducted before and after the addition of herbs, spices, lemon zest, and juice. The antioxidant properties of all samples are given in Figure 4 and Figure 5, and the results are expressed as IC50 values.
The IC50 values of antioxidants for ABTS exhibited a substantial drop (p < 0.05) after the enrichment process for both KG and KR, indicating an increase in antioxidant activity. Furthermore, the addition of hibiscus, rose petals, and lavender flowers resulted in a statistically significant reduction in the IC50 values (p < 0.05) as determined by the DPPH test. In contrast, ginger, turmeric, lemon zest, and juice did not result in any substantial alteration (p > 0.05) in the antioxidant activity as determined by the DPPH test. The IC50 values for ABTS of K, KG, and KR were estimated to be 21.62 ± 1.11, 19.38 ± 1.22, and 3.55 ± 0.25 μL. For DPPH, the values were 33.30 ± 1.76, 34.25 ± 1.28, and 7.16 ± 0.44 μL, respectively.
Stratil et al. [65] observed that a high total phenolic content enhances antioxidant activity. Moreover, our study demonstrated a rise in total phenolic content (TPC) following the incorporation of herbs, spices, and fruits. This finding elucidates the augmentation of antioxidant activity.
This study’s robust negative correlation between total phenolic content (TPC) and antioxidant activity, as measured by the IC50 values obtained from the ABTS experiment (Spearman’s correlation coefficient = −0.843, p < 0.01), further supports this claim. Furthermore, a moderate negative correlation was seen between the levels of total flavonoids and the IC50 values obtained from the ABTS experiment. This association was quantified using Spearman’s connection coefficient, which was calculated at −0.574 (p < 0.01). In line with our previous study [30], we found a significant negative correlation between the total phenolic content and ABTS IC50 values (Pearson’s correlation coefficient = −0.837, p < 0.01). Additionally, we observed a moderate negative correlation between the total flavonoids and ABTS IC50 values (Pearson’s correlation coefficient = −0.370, p ≤ 0.05) during the fermentation of Olympus Mountain tea sweetened with honey in the kombucha process.
On the other hand, DPPH IC50 values had a strong negative correlation with total flavonoids (Spearman’s correlation coefficient = −0.811, p < 0.01) and a medium correlation with total phenolic content (Spearman’s correlation coefficient = −0.683, p < 0.01).
Several studies have shown that extracts of hibiscus calyces have a potent antioxidant effect [66,67,68,69]. Moreover, rose petal teas exhibited high antioxidant activity, comparable to green and black teas [49]. Lavender blossoms also have a notable concentration of phenolic compounds and anthocyanins with antioxidant potential [15]. Ginger extracts have significant antioxidant activity equivalent to that of commercial antioxidant preservatives [70,71]. Both turmeric and ginger are rich sources of antioxidant compounds [54]. Lemon peels also have a considerable concentration of total phenols and antioxidant activity [27]. All the above indicates that herbs, spices, and fruits added to the beverage passed their antioxidant activities to the beverage.
Especially after the addition of hibiscus, rose petals, and lavender to K, there was an increase in TPC by 2.3 times, while the IC50 values decreased by 6.10 and 4.65 times for the ABTS and DPPH assays, respectively. This might suggest the existence of an additive or even a synergistic antioxidant activity between phenolic substances.

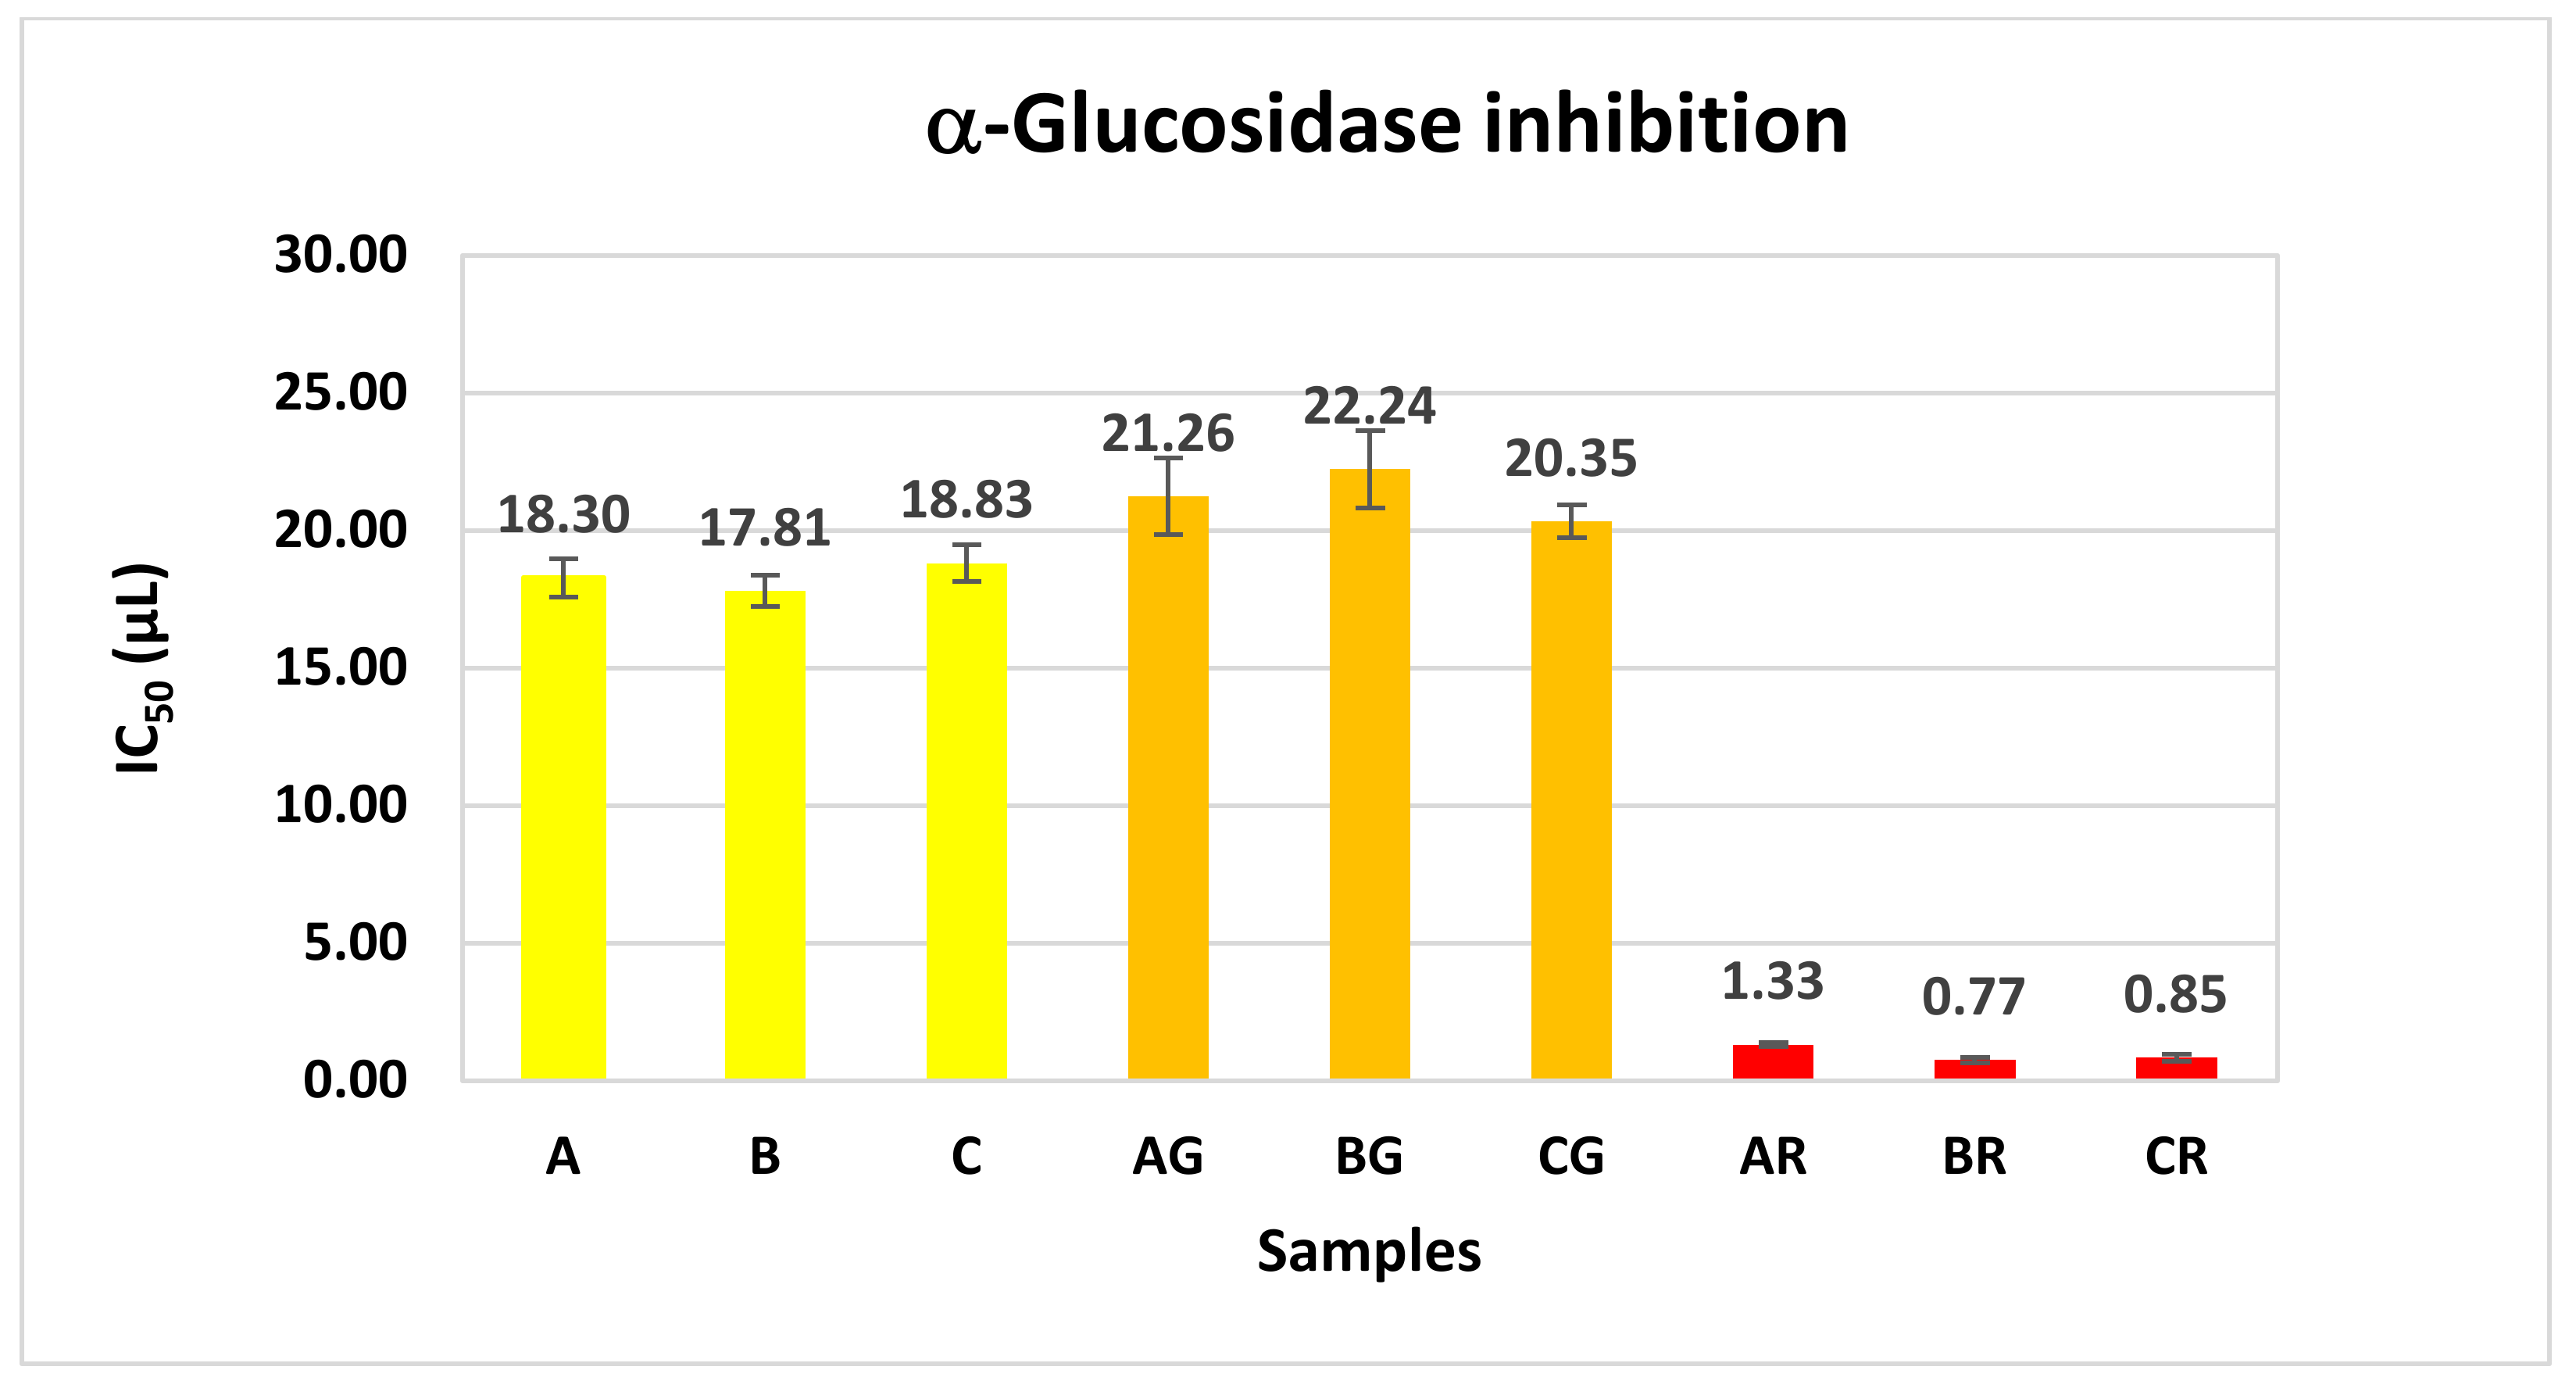
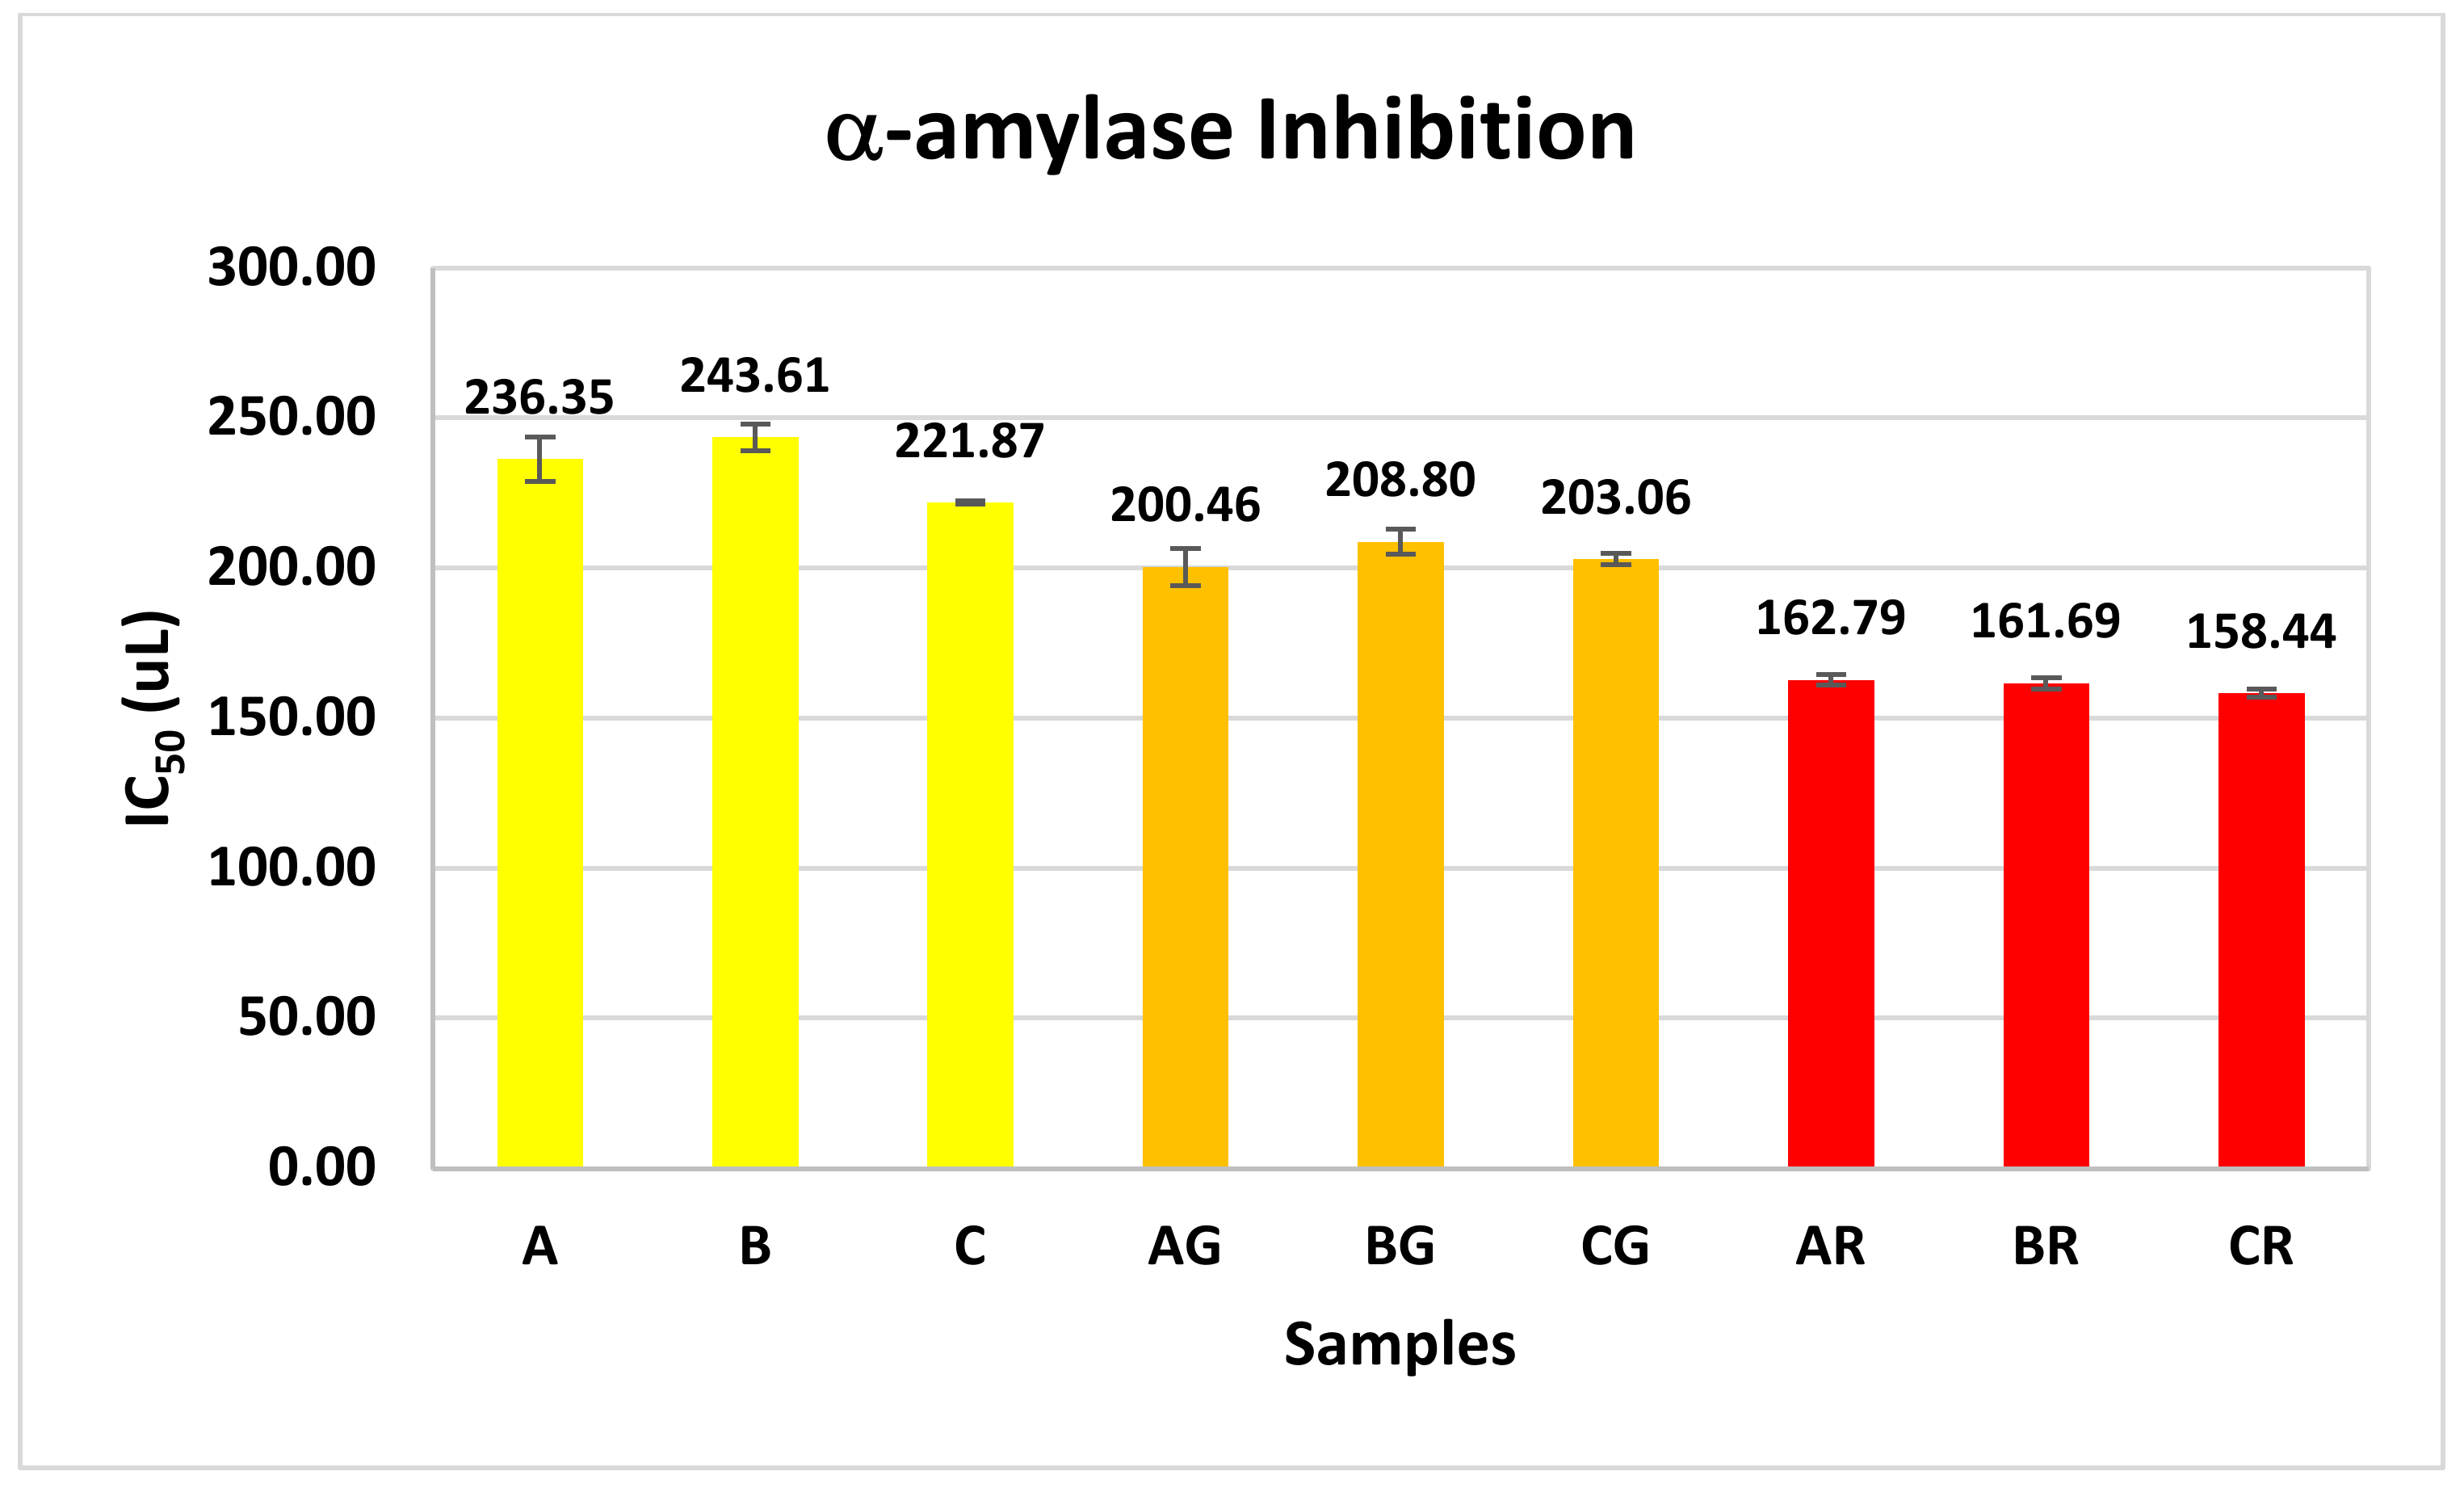
3.6. α-Glucosidase and α-Amylase Inhibition Assays

Previous scientific studies have demonstrated that extracts obtained from plants, including infusions and phytochemicals such as polyphenols, can substitute synthetic inhibitors for α-amylase and α-glucosidase [72,73]. Moreover, phenolic substances can control the metabolism of carbohydrates and lipids by suppressing the functions of α-glucosidase and α-amylase. These enzymes are inhibited by their ability to chelate, alter the structure, and restrict biological functions [74,75].
α-amylase and α-glucosidase play a crucial role in the metabolism of carbohydrates. Thus, by suppressing the activity of these enzymes, the rate at which glucose is absorbed into the bloodstream would decrease, ultimately leading to a reduction in glucose in the blood. The α-glucosidase IC50 values are presented in Figure 6. The IC50 values in the samples (AG, BG, and CG) after the addition of ginger, turmeric, lemon zest, and juice exhibited statistically significant increases (p < 0.05); therefore, the α-glucosidase inhibitory activity decreased after the addition. On the other hand, in the samples (AR, BR, CR) where hibiscus, rose petals, and lavender were added, a statistically significant decrease was observed, and the α-glucosidase inhibitory activity increased by approximately 18 times. The robust α-glucosidase inhibition is due to the herbs added.
Indeed, hibiscus calyces have a potent anti-diabetic effect [9]. Furthermore, all aqueous preparations of hibiscus demonstrated significant efficacy as inhibitors of α-glucosidase, with IC50 values lower than the positive control acarbose [76]. Also, Gholamhoseinian et al. [77] found that Rosa damascena extract had an intensive inhibitory effect on α-glucosidase.
The IC50 values of α-glucosidase inhibition showed a strong negative correlation (Spearman’s correlation coefficient = −0.739, p ≤ 0.01) with the values of total flavonoids and a strong positive correlation (Spearman’s correlation coefficient = 0.738, p ≤ 0.01) with the IC50 values of the DPPH assay. That indicates an increase in the inhibition of α-glucosidase with the rise in the number of flavonoids and the DPPH antioxidant capacity of the samples. The IC50 α-glucosidase inhibition values exhibited a medium negative correlation with total phenolic compounds (Pearson’s correlation coefficient = −0.505, p < 0.01), and a medium positive correlation with ABTS IC50 values (Pearson’s correlation coefficient = 0.456, p < 0.05). Similarly, according to the Pearson correlation results, medicinal plants’ total phenolic content and antioxidant activity were moderately correlated to the α-glucosidase inhibitory activity (r = 0.39 and r = 0.34, respectively) [78].
In a previous study, it was shown that cold maceration is optimal for preserving anthocyanins and that a strong correlation was observed between the IC50 values of a cold-macerated tea preparation and its content of delphinidin (R2 = 0.996, p < 0.05) [76]. Those results demonstrated the advantage of cold extraction methods in preparing hibiscus tea as a hypoglycemic agent. So, it can be assumed that optimum results were achieved in our study regarding anthocyanins in the kombucha fermented beverage after the addition of herbs for 48 h at low temperatures. The α-amylase IC50 values are shown in Figure 7. The IC50 values in all the samples after the enrichment (AG, BG, CG, AR, BR, CR) exhibited a decrease (p < 0.05), and therefore, the α-amylase inhibitory activity increased.
The IC50 values of α-amylase inhibition showed a strong negative correlation (Spearman’s correlation coefficient = −0.887, p < 0.01) with the content of total phenolics and a strong positive correlation (Spearman’s correlation coefficient = 0.831, p < 0.01) with the IC50 values of the ABTS assay. That indicates an increase in the inhibition of α-amylase with the rise in the total phenolic content and the ABTS antioxidant capacity of the samples. The above agrees with previous studies [30,37,79].
Hibiscus calyces have a potent anti-diabetic effect [9]. Furthermore, research has shown that hibiscus extract is a very effective inhibitor of pancreatic α-amylase [80]. Comparable findings were seen for hibiscus acid (hibiscus-type (2S,3R)-hydroxy citric acid lactone) [81], which inhibited pancreatic α-amylase and intestinal α-glucosidase enzymes [82].
The IC50 α-amylase inhibition values exhibited a medium negative correlation with total flavonoids (Pearson’s correlation coefficient = −0.467, p < 0.01) and a medium positive correlation with DDPH IC50 values (Pearson’s correlation coefficient = 0.538, p < 0.01). α-amylase inhibition, in contrast with α-glucosidase, correlates more with total phenolic content than flavonoids in the sample. Suppressing the activity of α-amylase hinders the release of maltose from starch, resulting in a delay in the conversion to glucose and a reduction in postprandial plasma glucose levels. α-glucosidase inhibition retards the liberation of D-glucose from oligosaccharides and disaccharides, resulting in a postponement of glucose absorption and a reduction in postprandial plasma glucose levels [83]. Therefore, adding herbs, spices, and fruits, especially hibiscus, rose petals, and lavender, to fermented Olympus Mountain tea kombucha creates a new functional beverage that could have an anti-diabetic effect.
Further studies are required to demonstrate therapeutic potential for human health.

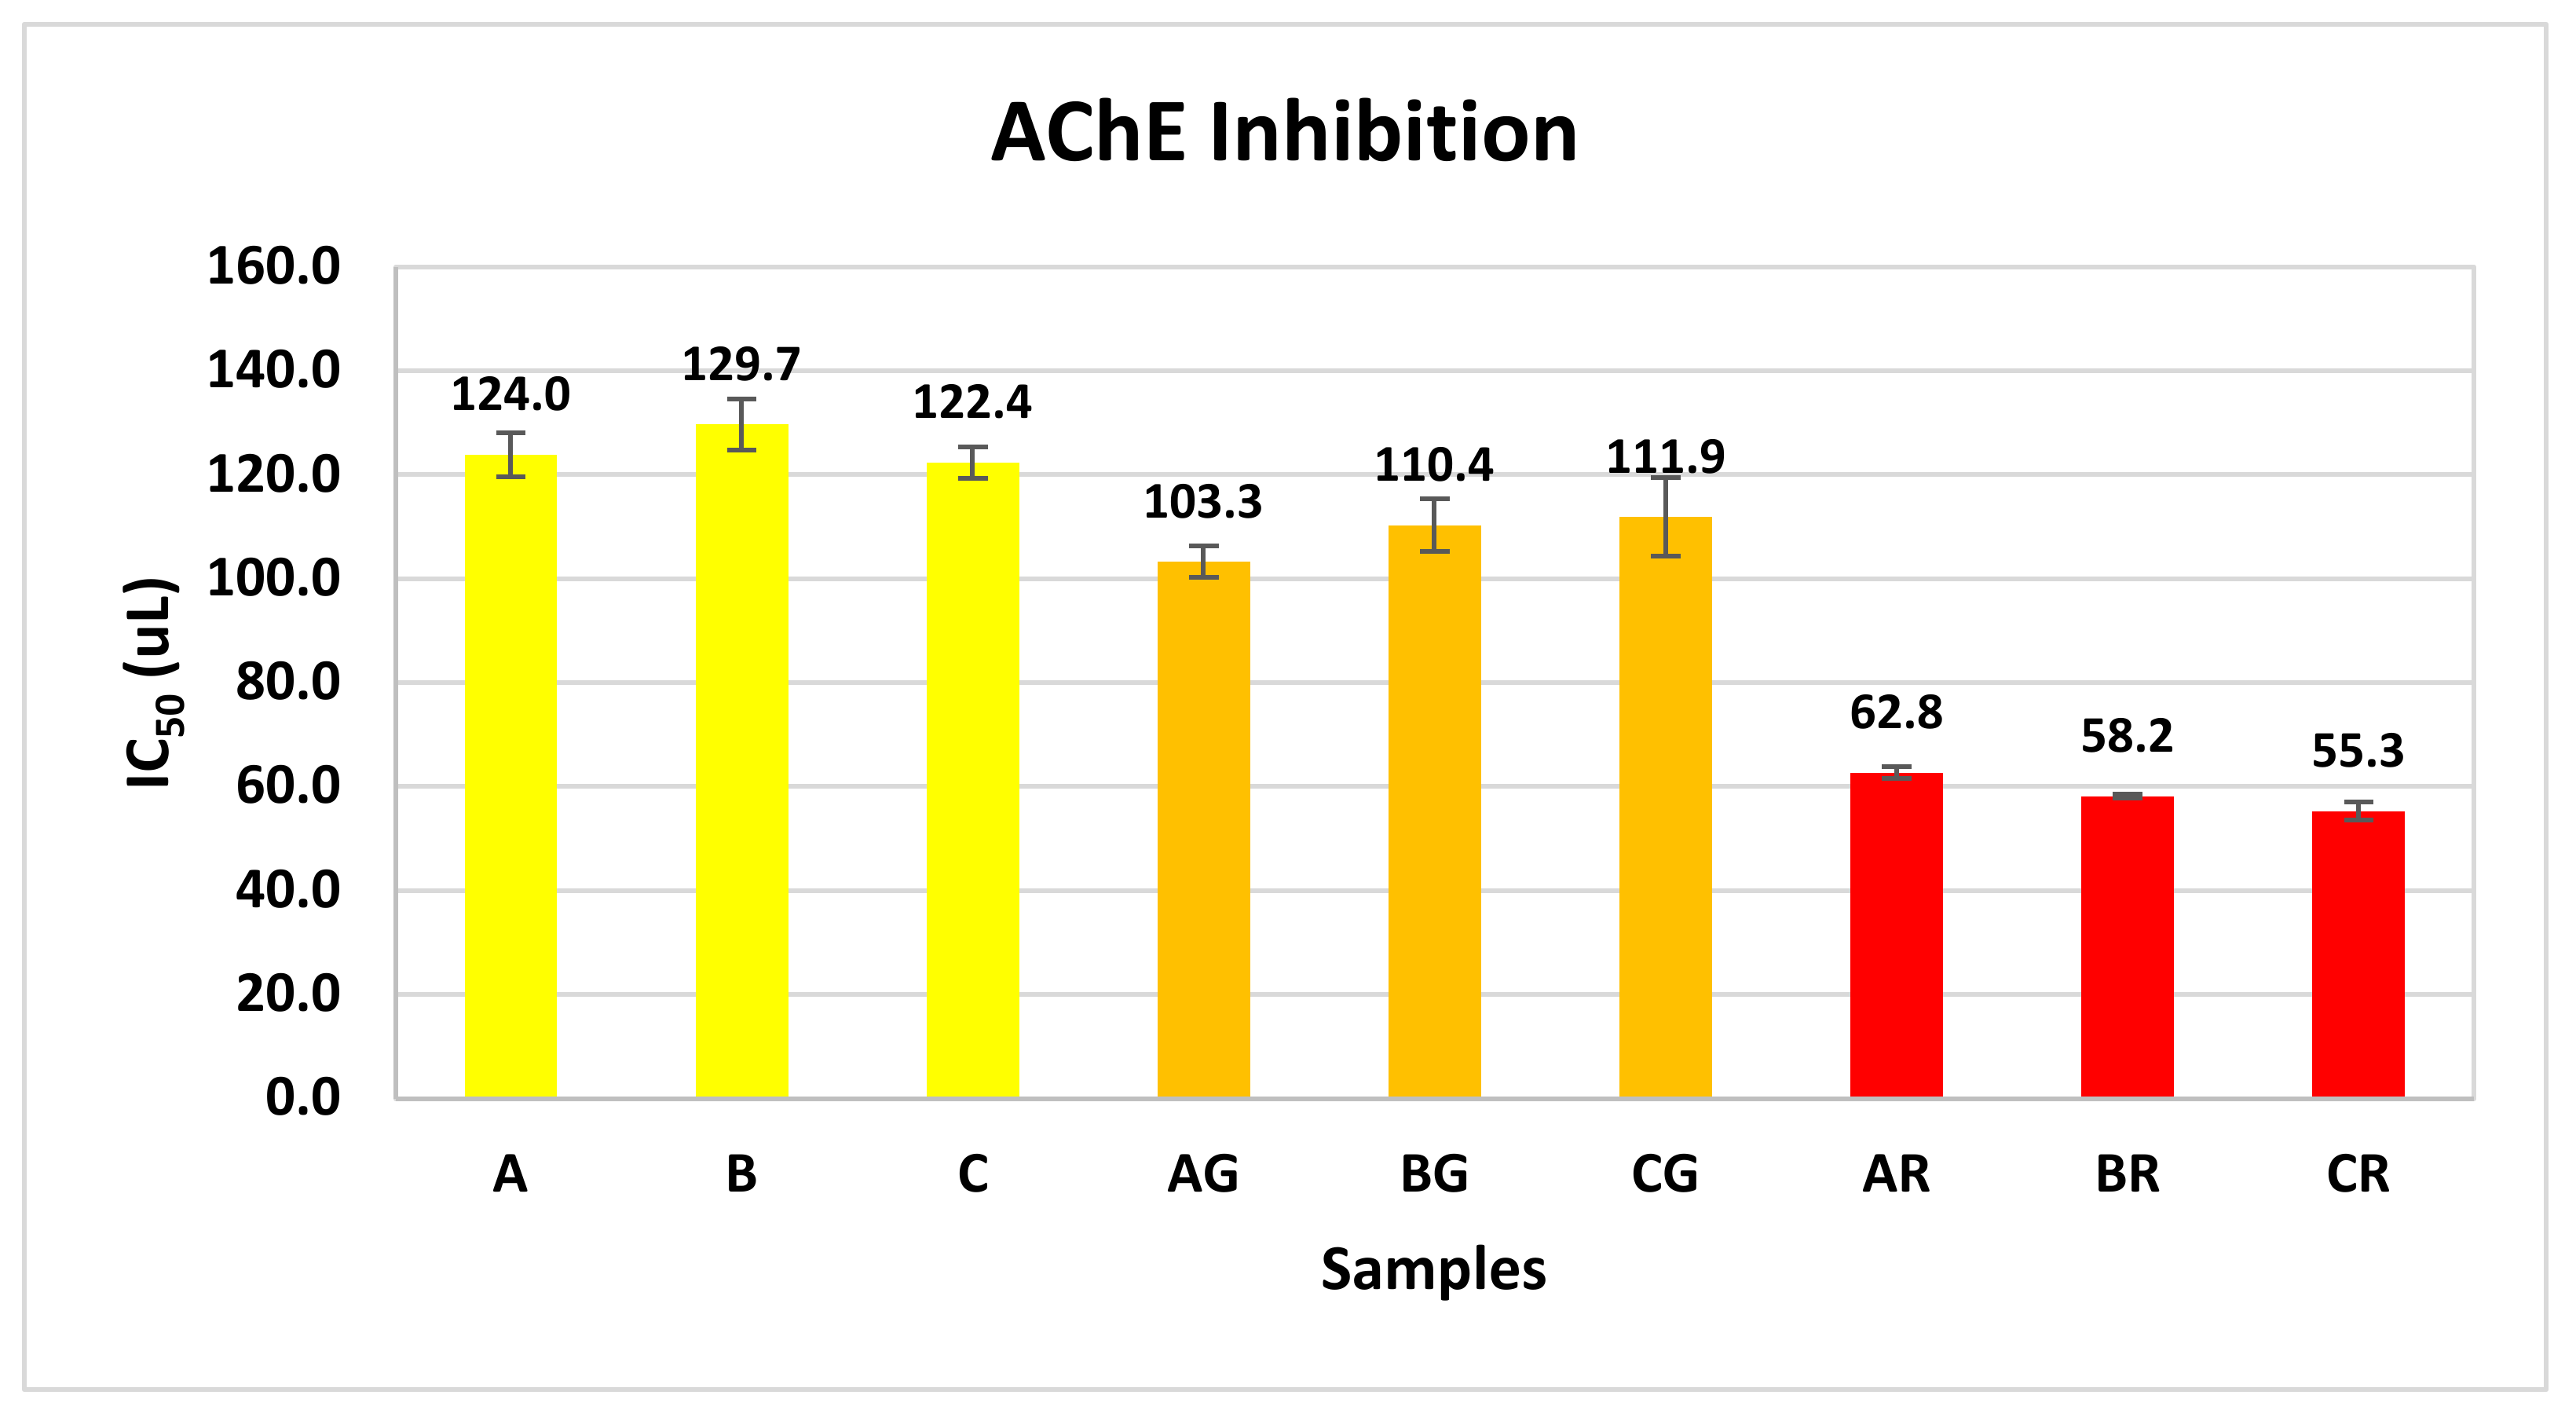
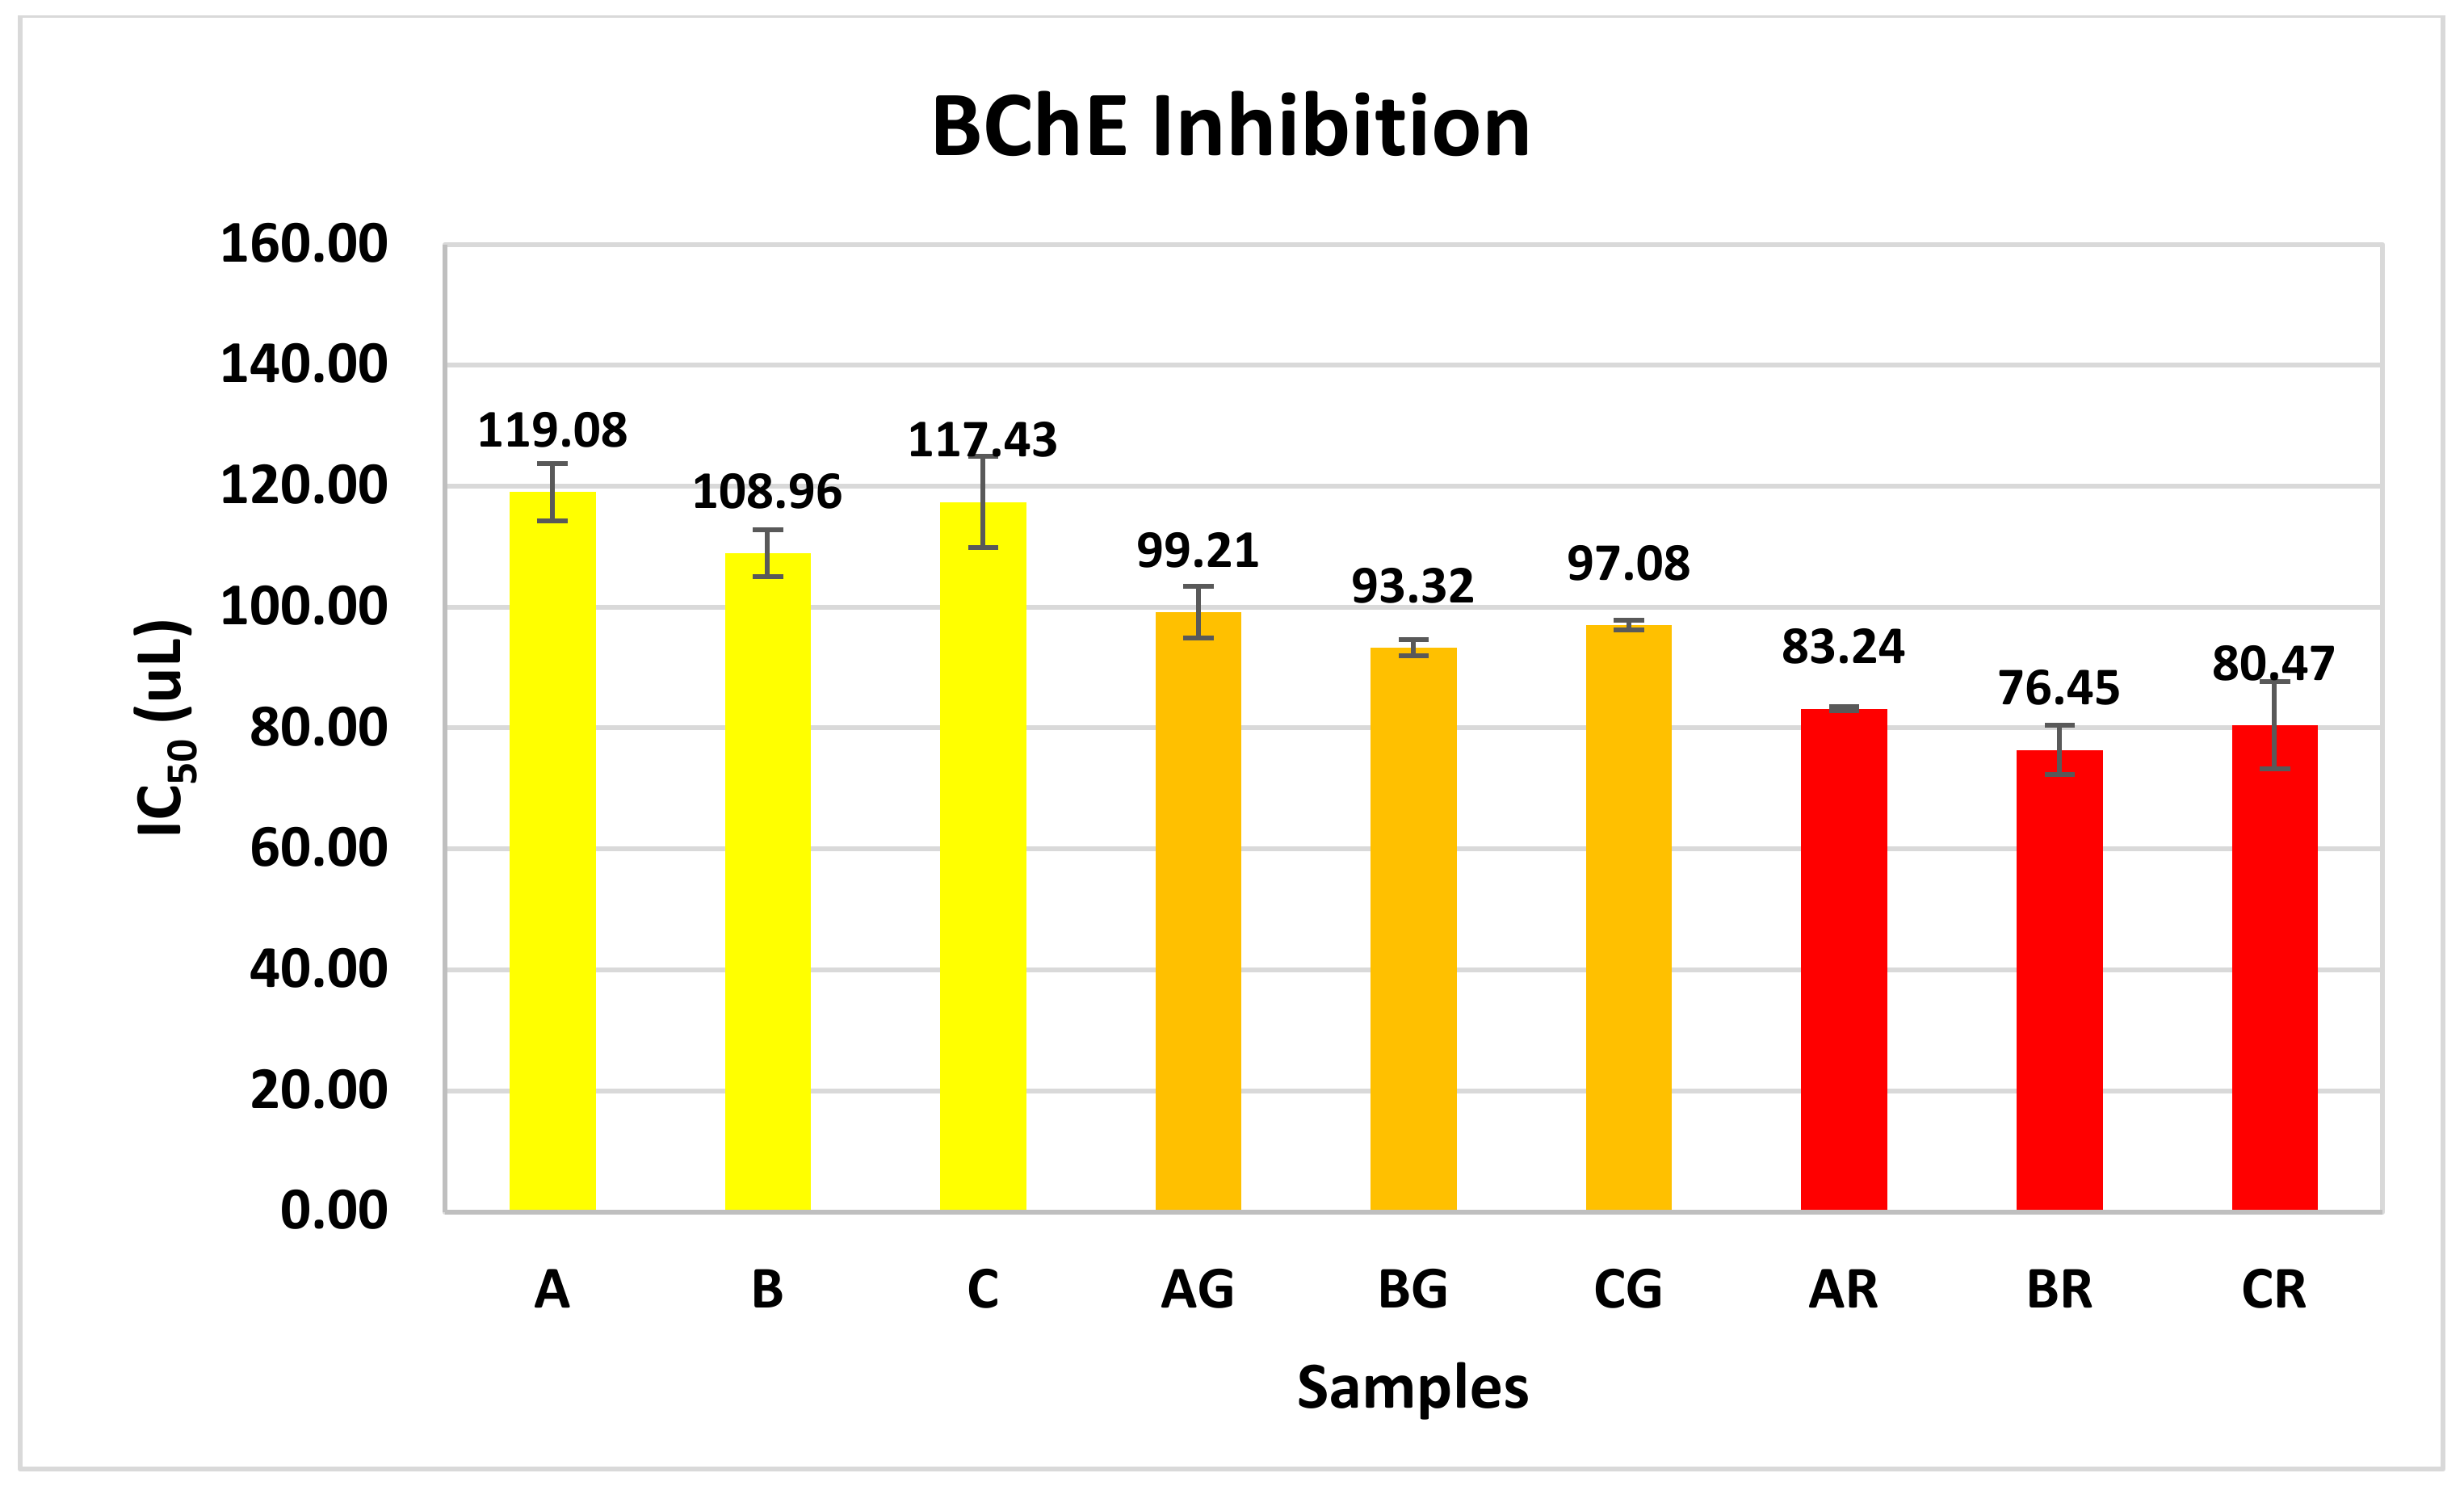
3.7. Cholinesterase Inhibition Assays

The inhibition of cholinesterases is a common strategy for treating Alzheimer’s disease.
The acetylcholinesterase (AChE) and butyrylcholinesterase (BChE) inhibitory activity values (IC50) are shown in Figure 8 and Figure 9, respectively. The IC50 values in all the samples after the enrichment (AG, BG, CG, AR, BR, CR) exhibited a statistical decrease (p < 0.05). Consequently, the inhibitory activities of AChE and BchE were enhanced. The above can be attributed to the bioactive compounds of the spices and spices added, and more specifically to the hibiscus calyces, the rose petals, and the ginger root.
The extract from hibiscus calyces has been shown to have inhibitory effects on the activities of AchE and BchE [84]. Furthermore, it was shown that phenolic chemicals in the extract of hibiscus calyces may be responsible for its inhibitory actions on AchE and BchE in a study indicating that hibiscus extracts have dual inhibitory effects, which might be more potent in treating and controlling Alzheimer’s disease by inhibiting AchE and BchE, demonstrating symptomatic effectiveness [85]. As mentioned earlier, flavonoids, including quercetin, quercitrin, and rutin, function as competitive inhibitors of AchE and BchE by preventing their substrates from attaching to the active site of the enzyme [85,86]. Furthermore, these compounds have a structural resemblance to synthetic medicines like rivastigmine, enabling them to attach to the peripheral anionic site of the enzyme via their aromatic rings and hydroxyl groups. Furthermore, it was discovered that rose petal tea is a powerful inhibitor of acetylcholinesterase, with a 61.63% suppression of the enzyme [87].
The bioactive compounds present in ginger root have been shown to exert anti-AChE activity [88]. In addition, the total extract of dry ginger has been shown to have anti-AChE and anti-BChE activities [89]. Moreover, water extracts of red and white ginger root have been reported to inhibit AChE in a dose-dependent manner [90]. This protective effect may be attributed to ginger root flavonoids, tannins, alkaloids, and terpenoids. Separate research [91] showcased the AChE inhibitory properties of some active constituents found in ginger extracts, compared to donepezil, a pharmaceutical medicine used for treating Alzheimer’s disease (AD) that also inhibits AChE. Additionally, ginger compounds have been observed to inhibit the activity of BChE [92].
The IC50 values of AChE and BChE inhibition showed a strong negative correlation (Spearman’s correlation coefficient AChE = −0.873, Spearman’s correlation coefficient BChE = −0.922, p < 0.01) with the values of total phenolic content and a strong positive correlation (Spearman’s correlation coefficient AChE = 0.877, Spearman’s correlation coefficient BChE = 0.872, p < 0.01) with the IC50 values of the ABTS assay. That indicates an increase in the inhibition of AChE and BChE with the rise in the samples’ total phenolic content and the ABTS antioxidant capacity. The AChE and BChE IC50 inhibition values exhibited a medium negative correlation with total flavonoids (Spearman’s correlation coefficient AChE = −0.502, Spearman’s correlation coefficient BChE = −0.608, p < 0.01) and a medium positive correlation with DDPH IC50 values (Spearman’s correlation coefficient AChE = 0.580, Spearman’s correlation coefficient BChE = 0.596, p < 0.01). AChE and BChE inhibition correlate more with total phenolic content than flavonoids in the sample. The above observations are consistent with previous studies [93,94,95,96,97,98,99]. Furthermore, a prior investigation [100] established a correlation between the significant anti-AChE activity seen in the examined honey varieties and their substantial antioxidant activities, which subsequently resulted in high total phenolic content (TPC) in the analyzed types of honey.

4. Conclusions

This study aimed to evaluate the effects of adding herbs, spices, and fruits to fermented Olympus Mountain tea kombucha with honey and the changes that occur in its physicochemical and functional properties. Two different enrichments were proposed: a “Golden Mountain tea and honey Kombucha” (KG) with fresh ginger, turmeric powder, lemon zest, and juice and a “Red Mountain tea and honey Kombucha” (KR) with dried hibiscus calyces, rose petals, and lavender blossoms. In KR, the levels of vitamin C increased from 33.2 ± 2.7 to 48.4 ± 4.5. Additionally, the levels of calcium increased from 31.0 ± 1.2 to 55.7 ± 1.2, while the levels of potassium practically doubled from 64.7 ± 0.6 to 115.7 ± 2.5. An increased potassium concentration was observed in KG, and ionic iron was found for the first time after both enrichments. The total phenolic and flavonoid contents, along with the antioxidant capacity, as assessed by the ABTS and DPPH methods, were substantially enhanced in KR. In KG, the total phenolic content and the antioxidant activity increased, as assessed by ABTS. The enrichment with hibiscus calyces, rose petals, and lavender blossoms significantly increased the inhibitory effect against α-amylase, α-glucosidase, acetylcholinesterase, and butyrylcholinesterase. On the other hand, the enrichment with ginger, turmeric, lemon zest, and juice decreased the inhibition effect against α-glucosidase and increased it against α-amylase, acetylcholinesterase, and butyrylcholinesterase. KR had the strongest inhibitory activity of all the enzymes studied, with the α-glucosidase inhibitory activity increasing by approximately 18 times. The results showed that enrichment with herbs, spices, and fruits could transform the fermented Olympus Mountain tea kombucha sweetened with honey into a unique beverage with improved functional characteristics. More research will investigate the role of each herb, spice, and fruit in the antioxidant and enzyme inhibitory activities and, particularly, the combination of hibiscus, rose petals, and lavender blossoms in greatly enhancing the beverage’s functionality. Also, further in vivo studies are needed to investigate the anti-diabetic properties of the beverages and the potential role that they could play in Alzheimer’s treatment as cholinesterase inhibitors.

Author Contributions

Conceptualization, I.G.K. and H.C.K.; methodology I.G.K., H.C.K. and C.N.; software, I.G.K.; validation, I.G.K., H.C.K. and C.N.; investigation, I.G.K., H.C.K. and I.P.; resources, H.C.K. and C.N.; data curation I.G.K., H.C.K. and C.N.; writing—original draft preparation, I.G.K.; writing—review and editing H.C.K. and C.N.; supervision, H.C.K.; project administration, H.C.K.; funding acquisition, H.C.K. and C.N. All authors have read and agreed to the published version of the manuscript.

Funding

This research was funded by EPAnEk-NRSF 2014–2020; Operational Program “Competitiveness, Entrepreneurship and Innovation”, Call 111 “Support of Regional Excellence” in the context of the implementation of the program: AGRICA II: AGrifood Research and Innovation Network of Excellence of the Aegean, which is co-financed by the European Regional Development Fund (ERDF), MIS code: 5046750.

Data Availability Statement

Data are contained within the article.

Conflicts of Interest

The authors declare no conflict of interest. The funders had no role in the design of the study; in the collection, analyses, or interpretation of data; in the writing of the manuscript; or in the decision to publish the results.

References

  1. Watawana, M.I.; Jayawardena, N.; Waisundara, V.Y. Enhancement of the Functional Properties of Coffee Through Fermentation by “Tea Fungus” (Kombucha). J. Food Process Preserv. 2015, 39, 2596–2603. [Google Scholar] [CrossRef]
  2. Shahbazi, H.; Hashemi Gahruie, H.; Golmakani, M.-T.; Eskandari, M.H.; Movahedi, M. Effect of Medicinal Plant Type and Concentration on Physicochemical, Antioxidant, Antimicrobial, and Sensorial Properties of Kombucha. Food Sci. Nutr. 2018, 6, 2568–2577. [Google Scholar] [CrossRef]
  3. Zheng, W.; Wang, S.Y. Antioxidant Activity and Phenolic Compounds in Selected Herbs. J. Agric. Food Chem. 2001, 49, 5165–5170. [Google Scholar] [CrossRef]
  4. Cousins, M.; Adelberg, J.; Chen, F.; Rieck, J. Antioxidant Capacity of Fresh and Dried Rhizomes from Four Clones of Turmeric (Curcuma longa L.) Grown in Vitro. Ind. Crops Prod. 2007, 25, 129–135. [Google Scholar] [CrossRef]
  5. Hinneburg, I.; Damien Dorman, H.J.; Hiltunen, R. Antioxidant Activities of Extracts from Selected Culinary Herbs and Spices. Food Chem. 2006, 97, 122–129. [Google Scholar] [CrossRef]
  6. Kumar, G.S.; Nayaka, H.; Dharmesh, S.M.; Salimath, P.V. Free and Bound Phenolic Antioxidants in Amla (Emblica officinalis) and Turmeric (Curcuma longa). J. Food Compos. Anal. 2006, 19, 446–452. [Google Scholar] [CrossRef]
  7. Mohd-Esa, N.; Hern, F.S.; Ismail, A.; Yee, C.L. Antioxidant Activity in Different Parts of Roselle (Hibiscus sabdariffa L.) Extracts and Potential Exploitation of the Seeds. Food Chem. 2010, 122, 1055–1060. [Google Scholar] [CrossRef]
  8. Usoh, I.F.; Ekaidem, I.S.; Etim, O.E.; Akpan, H.D.; Akpan, E.J.; Fakoya, A. Antioxidant and Hepatoprotective Effects of Dried Flower Extracts of Hibiscus sabdariffa L. On Rats Treated with Carbon Tetrachloride. J. Appl. Pharm. Sci. 2012, 2, 156–159. [Google Scholar] [CrossRef]
  9. Peng, C.-H.; Chyau, C.-C.; Chan, K.-C.; Chan, T.-H.; Wang, C.-J.; Huang, C.-N. Hibiscus sabdariffa Polyphenolic Extract Inhibits Hyperglycemia, Hyperlipidemia, and Glycation-Oxidative Stress While Improving Insulin Resistance. J. Agric. Food Chem. 2011, 59, 9901–9909. [Google Scholar] [CrossRef]
  10. VanderJagt, T.J.; Ghattas, R.; VanderJagt, D.J.; Crossey, M.; Glew, R.H. Comparison of the Total Antioxidant Content of 30 Widely Used Medicinal Plants of New Mexico. Life Sci. 2002, 70, 1035–1040. [Google Scholar] [CrossRef]
  11. Choi, E.-M.; Hwang, J.-K. Investigations of Anti-Inflammatory and Antinociceptive Activities of Piper Cubeba, Physalis Angulata and Rosa Hybrida. J. Ethnopharmacol. 2003, 89, 171–175. [Google Scholar] [CrossRef]
  12. Anesini, C.; Perez, C. Screening of Plants Used in Argentine Folk Medicine for Antimicrobial Activity. J. Ethnopharmacol. 1993, 39, 119–128. [Google Scholar] [CrossRef] [PubMed]
  13. Perez, C.; Anesini, C. In Vitro Antibacterial Activity of Argentine Folk Medicinal Plants against Salmonella typhi. J. Ethnopharmacol. 1994, 44, 41–46. [Google Scholar] [CrossRef] [PubMed]
  14. Mahmood, N.; Piacente, S.; Pizza, C.; Burke, A.; Khan, A.I.; Hayt, A.J. The Anti-HIV Activity and Mechanisms of Action of Pure Compounds Isolated from Rosa damascena. Biochem. Biophys. Res. Commun. 1996, 229, 73–79. [Google Scholar] [CrossRef] [PubMed]
  15. Nurzynska-Wierdak, R.; Zawislak, G. Chemical Composition and Antioxidant Activity of Lavender (Lavandula angustifolia Mill.) Aboveground Parts. Acta Sci. Pol. Hortorum Cultus 2016, 15, 225–241. [Google Scholar]
  16. Han, Y.A.; Song, C.W.; Koh, W.S.; Yon, G.H.; Kim, Y.S.; Ryu, S.Y.; Kwon, H.J.; Lee, K.H. Anti-Inflammatory Effects of the Zingiber officinale Roscoe Constituent 12-Dehydrogingerdione in Lipopolysaccharide-Stimulated Raw 264.7 Cells. Phytother. Res. 2013, 27, 1200–1205. [Google Scholar] [CrossRef]
  17. Nile, S.H.; Park, S.W. Chromatographic Analysis, Antioxidant, Anti-Inflammatory, and Xanthine Oxidase Inhibitory Activities of Ginger Extracts and Its Reference Compounds. Ind. Crops Prod. 2015, 70, 238–244. [Google Scholar] [CrossRef]
  18. Zhang, M.; Viennois, E.; Prasad, M.; Zhang, Y.; Wang, L.; Zhang, Z.; Han, M.K.; Xiao, B.; Xu, C.; Srinivasan, S.; et al. Edible Ginger-Derived Nanoparticles: A Novel Therapeutic Approach for the Prevention and Treatment of Inflammatory Bowel Disease and Colitis-Associated Cancer. Biomaterials 2016, 101, 321–340. [Google Scholar] [CrossRef]
  19. Vijendra Kumar, N.; Murthy, P.S.; Manjunatha, J.R.; Bettadaiah, B.K. Synthesis and Quorum Sensing Inhibitory Activity of Key Phenolic Compounds of Ginger and Their Derivatives. Food Chem. 2014, 159, 451–457. [Google Scholar] [CrossRef]
  20. Citronberg, J.; Bostick, R.; Ahearn, T.; Turgeon, D.K.; Ruffin, M.T.; Djuric, Z.; Sen, A.; Brenner, D.E.; Zick, S.M. Effects of Ginger Supplementation on Cell-Cycle Biomarkers in the Normal-Appearing Colonic Mucosa of Patients at Increased Risk for Colorectal Cancer: Results from a Pilot, Randomized, and Controlled Trial. Cancer Prev. Res. 2013, 6, 271–281. [Google Scholar] [CrossRef]
  21. Ho, S.-C.; Chang, K.-S.; Lin, C.-C. Anti-Neuroinflammatory Capacity of Fresh Ginger Is Attributed Mainly to 10-Gingerol. Food Chem. 2013, 141, 3183–3191. [Google Scholar] [CrossRef]
  22. Akinyemi, A.J.; Thome, G.R.; Morsch, V.M.; Stefanello, N.; da Costa, P.; Cardoso, A.; Goularte, J.F.; Belló-Klein, A.; Akindahunsi, A.A.; Oboh, G. Effect of Dietary Supplementation of Ginger and Turmeric Rhizomes on Ectonucleotidases, Adenosine Deaminase and Acetylcholinesterase Activities in Synaptosomes from the Cerebral Cortex of Hypertensive Rats. J. Appl. Biomed. 2016, 14, 59–70. [Google Scholar] [CrossRef]
  23. Suk, S.; Kwon, G.T.; Lee, E.; Jang, W.J.; Yang, H.; Kim, J.H.; Thimmegowda, N.R.; Chung, M.-Y.; Kwon, J.Y.; Yang, S.; et al. Gingerenone A, a Polyphenol Present in Ginger, Suppresses Obesity and Adipose Tissue Inflammation in High-Fat Diet-Fed Mice. Mol. Nutr. Food Res. 2017, 61, 1700139. [Google Scholar] [CrossRef]
  24. Wei, C.-K.; Tsai, Y.-H.; Korinek, M.; Hung, P.-H.; El-Shazly, M.; Cheng, Y.-B.; Wu, Y.-C.; Hsieh, T.-J.; Chang, F.-R. 6-Paradol and 6-Shogaol, the Pungent Compounds of Ginger, Promote Glucose Utilization in Adipocytes and Myotubes, and 6-Paradol Reduces Blood Glucose in High-Fat Diet-Fed Mice. Int. J. Mol. Sci. 2017, 18, 168. [Google Scholar] [CrossRef]
  25. Walstab, J.; Krüger, D.; Stark, T.; Hofmann, T.; Demir, I.E.; Ceyhan, G.O.; Feistel, B.; Schemann, M.; Niesler, B. Ginger and Its Pungent Constituents Non-Competitively Inhibit Activation of Human Recombinant and Native 5-HT3 Receptors of Enteric Neurons. Neurogastroenterol. Motil. 2013, 25, 439–447, e302. [Google Scholar] [CrossRef] [PubMed]
  26. Townsend, E.A.; Siviski, M.E.; Zhang, Y.; Xu, C.; Hoonjan, B.; Emala, C.W. Effects of Ginger and Its Constituents on Airway Smooth Muscle Relaxation and Calcium Regulation. Am. J. Respir. Cell Mol. Biol. 2013, 48, 157–163. [Google Scholar] [CrossRef] [PubMed]
  27. Al-Qassabi, J.S.A.; Weli, A.M.; Hossain, M.A. Comparison of Total Phenols Content and Antioxidant Potential of Peel Extracts of Local and Imported Lemons Samples. Sustain. Chem. Pharm. 2018, 8, 71–75. [Google Scholar] [CrossRef]
  28. Diankov, S.; Karsheva, M.; Hinkov, I. Extraction of Natural Antioxidants from Lemon Peels. Kinetics and Antioxidant Capacity. J. Univ. Chem. Technol. Metall. 2011, 46, 315–319. [Google Scholar]
  29. Kaur, C.; Kapoor, H.C. Anti-oxidant Activity and Total Phenolic Content of Some Asian Vegetables. Int. J. Food Sci. Technol. 2002, 37, 153–161. [Google Scholar] [CrossRef]
  30. Geraris Kartelias, I.; Karantonis, H.C.; Giaouris, E.; Panagiotakopoulos, I.; Nasopoulou, C. Kombucha Fermentation of Olympus Mountain Tea (Sideritis scardica) Sweetened with Thyme Honey: Physicochemical Analysis and Evaluation of Functional Properties. Foods 2023, 12, 3496. [Google Scholar] [CrossRef]
  31. Zou, C.; Li, R.-Y.; Chen, J.-X.; Wang, F.; Gao, Y.; Fu, Y.-Q.; Xu, Y.-Q.; Yin, J.-F. Zijuan Tea- Based Kombucha: Physicochemical, Sensorial, and Antioxidant Profile. Food Chem. 2021, 363, 130322. [Google Scholar] [CrossRef]
  32. Chakravorty, S.; Bhattacharya, S.; Chatzinotas, A.; Chakraborty, W.; Bhattacharya, D.; Gachhui, R. Kombucha Tea Fermentation: Microbial and Biochemical Dynamics. Int. J. Food Microbiol. 2016, 220, 63–72. [Google Scholar] [CrossRef]
  33. Bajaj, K.L.; Kaur, G. Spectrophotometric Determination of L-Ascorbic Acid in Vegetables and Fruits. Analyst 1981, 106, 117–120. [Google Scholar] [CrossRef] [PubMed]
  34. Singleton, V.L.; Orthofer, R.; Lamuela-Raventós, R.M. Analysis of Total Phenols and Other Oxidation Substrates and Antioxidants by Means of Folin-Ciocalteu Reagent. In Methods in Enzymology; Elsevier: Amsterdam, The Netherlands, 1999; Volume 299, pp. 152–178. ISBN 0076-6879. [Google Scholar]
  35. Markham, K.R. Flavones, Flavonols and Their Glycosides. In Methods in Plant Biochemistry; Elsevier: Amsterdam, The Netherlands, 1989; Volume 1, pp. 197–235. ISBN 1059-7522. [Google Scholar]
  36. Kwon, Y.-I.; Apostolidis, E.; Kim, Y.-C.; Shetty, K. Health Benefits of Traditional Corn, Beans, and Pumpkin: In Vitro Studies for Hyperglycemia and Hypertension Management. J. Med. Food 2007, 10, 266–275. [Google Scholar] [CrossRef] [PubMed]
  37. Xia, X.; Dai, Y.; Wu, H.; Liu, X.; Wang, Y.; Yin, L.; Wang, Z.; Li, X.; Zhou, J. Kombucha Fermentation Enhances the Health-Promoting Properties of Soymilk Beverage. J. Funct. Foods 2019, 62, 103549. [Google Scholar] [CrossRef]
  38. Yang, X.-W.; Huang, M.-Z.; Jin, Y.-S.; Sun, L.-N.; Song, Y.; Chen, H.-S. Phenolics from Bidens Bipinnata and Their Amylase Inhibitory Properties. Fitoterapia 2012, 83, 1169–1175. [Google Scholar] [CrossRef] [PubMed]
  39. Ellman, G.L.; Courtney, K.D.; Andres, V., Jr.; Featherstone, R.M. A New and Rapid Colorimetric Determination of Acetylcholinesterase Activity. Biochem. Pharmacol. 1961, 7, 88–90. [Google Scholar] [CrossRef] [PubMed]
  40. Da-Costa-Rocha, I.; Bonnlaender, B.; Sievers, H.; Pischel, I.; Heinrich, M. Hibiscus sabdariffa L.—A Phytochemical and Pharmacological Review. Food Chem. 2014, 165, 424–443. [Google Scholar] [CrossRef]
  41. Nummer, B.A. Kombucha Brewing under the Food and Drug Administration Model Food Code: Risk Analysis and Processing Guidance. J. Environ. Health 2013, 76, 8–11. [Google Scholar]
  42. Ismail, A.; Ikram, E.H.K.; Nazri, H.S.M. Roselle (Hibiscus sabdariffa L.) Seeds Nutritional Composition Protein Quality and Health Benefits. Food 2008, 2, 1–16. [Google Scholar]
  43. Herranz-López, M.; Fernández-Arroyo, S.; Pérez-Sanchez, A.; Barrajón-Catalán, E.; Beltrán-Debón, R.; Menéndez, J.A.; Alonso-Villaverde, C.; Segura-Carretero, A.; Joven, J.; Micol, V. Synergism of Plant-Derived Polyphenols in Adipogenesis: Perspectives and Implications. Phytomedicine 2012, 19, 253–261. [Google Scholar] [CrossRef] [PubMed]
  44. Ramírez-Rodrigues, M.M.; Balaban, M.O.; Marshall, M.R.; Rouseff, R.L. Hot and Cold Water Infusion Aroma Profilesof Hibiscus sabdariffa: Fresh Compared with Dried. J. Food Sci. 2011, 76, C212–C217. [Google Scholar] [CrossRef]
  45. Ramirez-Rodrigues, M.M.; Plaza, M.L.; Azeredo, A.; Balaban, M.O.; Marshall, M.R. Physicochemical and Phytochemical Properties of Cold and Hot Water Extraction from Hibiscus sabdariffa. J. Food Sci. 2011, 76, C428–C435. [Google Scholar] [CrossRef]
  46. Beltrán-Debón, R.; Alonso-Villaverde, C.; Aragones, G.; Rodriguez-Medina, I.; Rull, A.; Micol, V.; Segura-Carretero, A.; Fernández-Gutiérrez, A.; Camps, J.; Joven, J. The Aqueous Extract of Hibiscus sabdariffa Calices Modulates the Production of Monocyte Chemoattractant Protein-1 in Humans. Phytomedicine 2010, 17, 186–191. [Google Scholar] [CrossRef]
  47. Rodríguez-Medina, I.C.; Beltrán-Debón, R.; Molina, V.M.; Alonso-Villaverde, C.; Joven, J.; Menéndez, J.A.; Segura-Carretero, A.; Fernández-Gutiérrez, A. Direct Characterization of Aqueous Extract of Hibiscus sabdariffa Using HPLC with Diode Array Detection Coupled to ESI and Ion Trap MS. J. Sep. Sci. 2009, 32, 3441–3448. [Google Scholar] [CrossRef]
  48. McKay, D.L.; Chen, C.-Y.O.; Saltzman, E.; Blumberg, J.B. Hibiscus sabdariffa L. Tea (Tisane) Lowers Blood Pressure in Prehypertensive and Mildly Hypertensive Adults. J. Nutr. 2010, 140, 298–303. [Google Scholar] [CrossRef] [PubMed]
  49. Vinokur, Y.; Rodov, V.; Reznick, N.; Goldman, G.; Horev, B.; Umiel, N.; Friedman, H. Rose Petal Tea as an Antioxidant-Rich Beverage: Cultivar Effects. J. Food Sci. 2006, 71, S42–S47. [Google Scholar] [CrossRef]
  50. Nowak, R.; Olech, M.; Pecio, L.; Oleszek, W.; Los, R.; Malm, A.; Rzymowska, J. Cytotoxic, Antioxidant, Antimicrobial Properties and Chemical Composition of Rose Petals. J. Sci. Food Agric. 2014, 94, 560–567. [Google Scholar] [CrossRef]
  51. Miyake, Y.; Yamamoto, K.; Morimitsu, Y.; Osawa, T. Isolation of C-Glucosylflavone from Lemon Peel and Antioxidative Activity of Flavonoid Compounds in Lemon Fruit. J. Agric. Food Chem. 1997, 45, 4619–4623. [Google Scholar] [CrossRef]
  52. Babalola, S.O.; Babalola, A.O.; Aworh, O.C. Compositional Attributes of the Calyces of Roselle (Hibiscus sabdariffa L.). J. Food Technol. Afr. 2001, 6, 133–134. [Google Scholar] [CrossRef]
  53. Rădulescu, L.; Bordean, D.-M.; Hădărugă, N.G.; Megyesi, C.I.; Rinovetz, A.E. Nutritional Data Evaluation Study on Rose Petals, Ginger Root and Lemon. J. Agroaliment. Proc. Technol. 2021, 27, 515–520. [Google Scholar]
  54. Mushtaq, Z.; Tahir Nadeem, M.; Arshad, M.U.; Saeed, F.; Ahmed, M.H.; Bader Ul Ain, H.; Javed, A.; Anjum, F.M.; Hussain, S. Exploring the Biochemical and Antioxidant Potential of Ginger (Adric) and Turmeric (Haldi). Int. J. Food Prop. 2019, 22, 1642–1651. [Google Scholar] [CrossRef]
  55. Kaur, R.; Kaur, N.; Singh, H.; Sangha, M.K. Compositional Differences in Peel and Juice of Cracked and Normal Fruits of Lemon (Citrus limon Burm.). J. Agric. Sci. Technol. 2022, 24, 861–872. [Google Scholar]
  56. Manuha, M.I.; Paranagama, P.A.; Nageeb, B.M. Quantitative Analysis of Vitamin C in Lime and Lemon in Vitro: Verification of Vitamin C on the Impairment of Obesity. Int. J. Adv. Sci. Res. Eng. 2019, 5, 157–161. [Google Scholar] [CrossRef]
  57. Hashidoko, Y. The Phytochemistry of Rosa Rugosa. Phytochemistry 1996, 43, 535–549. [Google Scholar] [CrossRef]
  58. Ochir, S.; Park, B.; Nishizawa, M.; Kanazawa, T.; Funaki, M.; Yamagishi, T. Simultaneous Determination of Hydrolysable Tannins in the Petals of Rosa rugosa and Allied Plants. J. Nat. Med. 2010, 64, 383–387. [Google Scholar] [CrossRef] [PubMed]
  59. Kamijo, M.; Kanazawa, T.; Funaki, M.; Nishizawa, M.; Yamagishi, T. Effects of Rosa rugosa Petals on Intestinal Bacteria. Biosci. Biotechnol. Biochem. 2008, 72, 773–777. [Google Scholar] [CrossRef] [PubMed]
  60. Frankel, E.N.; Meyer, A.S. The Problems of Using One-Dimensional Methods to Evaluate Multifunctional Food and Biological Antioxidants. J. Sci. Food Agric. 2000, 80, 1925–1941. [Google Scholar] [CrossRef]
  61. Alarcon-Aguilar, F.J.; Zamilpa, A.; Perez-Garcia, M.D.; Almanza-Perez, J.C.; Romero-Nuñez, E.; Campos-Sepulveda, E.A.; Vazquez-Carrillo, L.I.; Roman-Ramos, R. Effect of Hibiscus sabdariffa on Obesity in MSG Mice. J. Ethnopharmacol. 2007, 114, 66–71. [Google Scholar] [CrossRef]
  62. Alarcón-Alonso, J.; Zamilpa, A.; Aguilar, F.A.; Herrera-Ruiz, M.; Tortoriello, J.; Jimenez-Ferrer, E. Pharmacological Characterization of the Diuretic Effect of Hibiscus sabdariffa Linn (Malvaceae) Extract. J. Ethnopharmacol. 2012, 139, 751–756. [Google Scholar] [CrossRef]
  63. Degenhardt, A.; Knapp, H.; Winterhalter, P. Separation and Purification of Anthocyanins by High-Speed Countercurrent Chromatography and Screening for Antioxidant Activity. J. Agric. Food Chem. 2000, 48, 338–343. [Google Scholar] [CrossRef] [PubMed]
  64. Vitas, J.; Malbaša, R.; Jokić, A.; Lončar, E.; Milanović, S. ANN and RSM Modelling of Antioxidant Characteristics of Kombucha Fermented Milk Beverages with Peppermint. Mljekarstvo Časopis Za Unaprjeđenje Proizv. I Prerade Mlijeka 2018, 68, 116–125. [Google Scholar] [CrossRef]
  65. Stratil, P.; Klejdus, B.; Kubáň, V. Determination of Phenolic Compounds and Their Antioxidant Activity in Fruits and Cereals. Talanta 2007, 71, 1741–1751. [Google Scholar] [CrossRef] [PubMed]
  66. Hirunpanich, V.; Utaipat, A.; Morales, N.P.; Bunyapraphatsara, N.; Sato, H.; Herunsalee, A.; Suthisisang, C. Antioxidant Effects of Aqueous Extracts from Dried Calyx of Hibiscus sabdariffa Linn. (Roselle) in Vitro Using Rat Low-Density Lipoprotein (LDL). Biol. Pharm. Bull. 2005, 28, 481–484. [Google Scholar] [CrossRef] [PubMed]
  67. Sáyago-Ayerdi, S.G.; Arranz, S.; Serrano, J.; Goñi, I. Dietary Fiber Content and Associated Antioxidant Compounds in Roselle Flower (Hibiscus sabdariffa L.) Beverage. J. Agric. Food Chem. 2007, 55, 7886–7890. [Google Scholar] [CrossRef] [PubMed]
  68. Tseng, T.-H.; Kao, E.-S.; Chu, C.-Y.; Chou, F.-P.; Lin Wu, H.-W.; Wang, C.-J. Protective Effects of Dried Flower Extracts of Hibiscus sabdariffa L. against Oxidative Stress in Rat Primary Hepatocytes. Food Chem. Toxicol. 1997, 35, 1159–1164. [Google Scholar] [CrossRef]
  69. Olalye, M.T.; Rocha, J.B.T. Commonly Used Tropical Medicinal Plants Exhibt Distinct in Vitro Antioxidant Activities against Hepatotoxins in Rat Liver. Exp. Toxicol. Pathol. 2007, 58, 433–438. [Google Scholar] [CrossRef]
  70. Govindarajan, V.S. Ginger—Chemistry, Technology, and Quality Evaluation: Part 2. Crit. Rev. Food Sci. Nutr. 1983, 17, 189–258. [Google Scholar] [CrossRef]
  71. Govindarajan, V.S. Ginger—Chemistry, Technology, and Quality Evaluation: Part 1. Crit. Rev. Food Sci. Nutr. 1983, 17, 1–96. [Google Scholar] [CrossRef]
  72. Custódio, L.; Patarra, J.; Alberício, F.; Neng, N.R.; Nogueira, J.M.F.; Romano, A. In Vitro Antioxidant and Inhibitory Activity of Water Decoctions of Carob Tree (Ceratonia siliqua L.) on Cholinesterases, α-Amylase and α-Glucosidase. Nat. Prod. Res. 2015, 29, 2155–2159. [Google Scholar] [CrossRef]
  73. Mata, R.; Cristians, S.; Escandón-Rivera, S.; Juárez-Reyes, K.; Rivero-Cruz, I. Mexican Antidiabetic Herbs: Valuable Sources of Inhibitors of α-Glucosidases. J. Nat. Prod. 2013, 76, 468–483. [Google Scholar] [CrossRef] [PubMed]
  74. Lin, D.; Xiao, M.; Zhao, J.; Li, Z.; Xing, B.; Li, X.; Kong, M.; Li, L.; Zhang, Q.; Liu, Y.; et al. An Overview of Plant Phenolic Compounds and Their Importance in Human Nutrition and Management of Type 2 Diabetes. Molecules 2016, 21, 1374. [Google Scholar] [CrossRef] [PubMed]
  75. Nagappan, H.; Pee, P.P.; Kee, S.H.Y.; Ow, J.T.; Yan, S.W.; Chew, L.Y.; Kong, K.W. Malaysian Brown Seaweeds Sargassum Siliquosum and Sargassum Polycystum: Low Density Lipoprotein (LDL) Oxidation, Angiotensin Converting Enzyme (ACE), α-Amylase, and α-Glucosidase Inhibition Activities. Food Res. Int. 2017, 99, 950–958. [Google Scholar] [CrossRef] [PubMed]
  76. Rasheed, D.M.; Porzel, A.; Frolov, A.; El Seedi, H.R.; Wessjohann, L.A.; Farag, M.A. Comparative Analysis of Hibiscus sabdariffa (Roselle) Hot and Cold Extracts in Respect to Their Potential for α-Glucosidase Inhibition. Food Chem. 2018, 250, 236–244. [Google Scholar] [CrossRef] [PubMed]
  77. Gholamhoseinian, A.; Fallah, H.; Sharifi far, F. Inhibitory Effect of Methanol Extract of Rosa damascena Mill. Flowers on α-Glucosidase Activity and Postprandial Hyperglycemia in Normal and Diabetic Rats. Phytomedicine 2009, 16, 935–941. [Google Scholar] [CrossRef]
  78. Ranilla, L.G.; Kwon, Y.-I.; Apostolidis, E.; Shetty, K. Phenolic Compounds, Antioxidant Activity and in Vitro Inhibitory Potential against Key Enzymes Relevant for Hyperglycemia and Hypertension of Commonly Used Medicinal Plants, Herbs and Spices in Latin America. Bioresour. Technol. 2010, 101, 4676–4689. [Google Scholar] [CrossRef] [PubMed]
  79. Bei, Q.; Chen, G.; Liu, Y.; Zhang, Y.; Wu, Z. Improving Phenolic Compositions and Bioactivity of Oats by Enzymatic Hydrolysis and Microbial Fermentation. J. Funct. Foods 2018, 47, 512–520. [Google Scholar] [CrossRef]
  80. Adisakwattana, S.; Ruengsamran, T.; Kampa, P.; Sompong, W. In Vitro Inhibitory Effects of Plant-Based Foods and Their Combinations on Intestinal α-Glucosidase and Pancreatic α-Amylase. BMC Complement. Altern. Med. 2012, 12, 110. [Google Scholar] [CrossRef]
  81. Yamada, T.; Hida, H.; Yamada, Y. Chemistry, Physiological Properties, and Microbial Production of Hydroxycitric Acid. Appl. Microbiol. Biotechnol. 2007, 75, 977–982. [Google Scholar] [CrossRef]
  82. Hansawasdi, C.; Kawabata, J.; Kasai, T. α-Amylase Inhibitors from Roselle (Hibiscus sabdariffa Linn.) Tea. Biosci. Biotechnol. Biochem. 2000, 64, 1041–1043. [Google Scholar] [CrossRef]
  83. Wu, X.; Beecher, G.R.; Holden, J.M.; Haytowitz, D.B.; Gebhardt, S.E.; Prior, R.L. Lipophilic and Hydrophilic Antioxidant Capacities of Common Foods in the United States. J. Agric. Food Chem. 2004, 52, 4026–4037. [Google Scholar] [CrossRef] [PubMed]
  84. Oboh, G.; Adewuni, T.M.; Ademiluyi, A.O.; Olasehinde, T.A.; Ademosun, A.O. Phenolic Constituents and Inhibitory Effects of Hibiscus sabdariffa L. (Sorrel) Calyx on Cholinergic, Monoaminergic, and Purinergic Enzyme Activities. J. Diet. Suppl. 2018, 15, 910–922. [Google Scholar] [CrossRef] [PubMed]
  85. Nordberg, A.; Ballard, C.; Bullock, R.; Darreh-Shori, T.; Somogyi, M. A Review of Butyrylcholinesterase as a Therapeutic Target in the Treatment of Alzheimer’s Disease. Prim. Care Companion CNS Disord. 2013, 15, 26731. [Google Scholar] [CrossRef] [PubMed]
  86. Roseiro, L.B.; Rauter, A.P.; Serralheiro, M.L.M. Polyphenols as Acetylcholinesterase Inhibitors: Structural Specificity and Impact on Human Disease. Nutr. Aging 2012, 1, 99–111. [Google Scholar] [CrossRef]
  87. Olech, M.; Nowak, R.; Załuski, D.; Kapusta, I.; Amarowicz, R.; Oleszek, W. Hyaluronidase, Acetylcholinesterase Inhibiting Potential, Antioxidant Activity, and LC-ESI-MS/MS Analysis of Polyphenolics of Rose (Rosa rugosa Thunb.) Teas and Tinctures. Int. J. Food Prop. 2017, 20, S16–S25. [Google Scholar] [CrossRef]
  88. Tung, B.T.; Thu, D.K.; Thu, N.T.K.; Hai, N.T. Antioxidant and Acetylcholinesterase Inhibitory Activities of Ginger Root (Zingiber officinale Roscoe) Extract. J. Complement. Integr. Med. 2017, 14, 20160116. [Google Scholar] [CrossRef]
  89. Mathew, M.; Subramanian, S. In Vitro Evaluation of Anti-Alzheimer Effects of Dry Ginger (Zingiber officinale Roscoe) Extract. Indian. J. Exp. Biol. 2014, 52, 606–612. [Google Scholar]
  90. Oboh, G.; Ademiluyi, A.O.; Akinyemi, A.J. Inhibition of Acetylcholinesterase Activities and Some Pro-Oxidant Induced Lipid Peroxidation in Rat Brain by Two Varieties of Ginger (Zingiber officinale). Exp. Toxicol. Pathol. 2012, 64, 315–319. [Google Scholar] [CrossRef]
  91. Cuya, T.; Baptista, L.; Celmar Costa França, T. A Molecular Dynamics Study of Components of the Ginger (Zingiber officinale) Extract inside Human Acetylcholinesterase: Implications for Alzheimer Disease. J. Biomol. Struct. Dyn. 2018, 36, 3843–3855. [Google Scholar] [CrossRef]
  92. Cuya, T.; França, T.C.C. A Molecular Modeling Study of Components of the Ginger (Zingiber officinale) Extract inside Human Butyrylcholinesterase: Implications for Alzheimer Disease. J. Biomol. Struct. Dyn. 2020, 38, 2809–2815. [Google Scholar] [CrossRef]
  93. Ali Reza, A.S.M.; Hossain, M.S.; Akhter, S.; Rahman, M.R.; Nasrin, M.S.; Uddin, M.J.; Sadik, G.; Khurshid Alam, A.H.M. In Vitro Antioxidant and Cholinesterase Inhibitory Activities of Elatostema papillosum Leaves and Correlation with Their Phytochemical Profiles: A Study Relevant to the Treatment of Alzheimer’s Disease. BMC Complement. Altern. Med. 2018, 18, 123. [Google Scholar] [CrossRef]
  94. Amessis-Ouchemoukh, N.; Madani, K.; Falé, P.L.V.; Serralheiro, M.L.; Araújo, M.E.M. Antioxidant Capacity and Phenolic Contents of Some Mediterranean Medicinal Plants and Their Potential Role in the Inhibition of Cyclooxygenase-1 and Acetylcholinesterase Activities. Ind. Crops Prod. 2014, 53, 6–15. [Google Scholar] [CrossRef]
  95. Baranowska-Wójcik, E.; Szwajgier, D.; Winiarska-Mieczan, A. Honey as the Potential Natural Source of Cholinesterase Inhibitors in Alzheimer’s Disease. Plant Foods Human. Nutr. 2020, 75, 30–32. [Google Scholar] [CrossRef] [PubMed]
  96. Lim, Y.J.; Oh, C.-S.; Park, Y.-D.; Eom, S.H.; Kim, D.-O.; Kim, U.-J.; Cho, Y.-S. Physiological Components of Kiwifruits with in Vitro Antioxidant and Acetylcholinesterase Inhibitory Activities. Food Sci. Biotechnol. 2014, 23, 943–949. [Google Scholar] [CrossRef]
  97. Papandreou, M.A.; Dimakopoulou, A.; Linardaki, Z.I.; Cordopatis, P.; Klimis-Zacas, D.; Margarity, M.; Lamari, F.N. Effect of a Polyphenol-Rich Wild Blueberry Extract on Cognitive Performance of Mice, Brain Antioxidant Markers and Acetylcholinesterase Activity. Behav. Brain Res. 2009, 198, 352–358. [Google Scholar] [CrossRef]
  98. Szwajgier, D.; Baranowska-Wójcik, E.; Winiarska-Mieczan, A.; Gajowniczek-Ałasa, D. Honeys as Possible Sources of Cholinesterase Inhibitors. Nutrients 2022, 14, 2969. [Google Scholar] [CrossRef]
  99. Zaidi, H.; Ouchemoukh, S.; Amessis-Ouchemoukh, N.; Debbache, N.; Pacheco, R.; Serralheiro, M.L.; Araujo, M.E. Biological Properties of Phenolic Compound Extracts in Selected Algerian Honeys—The Inhibition of Acetylcholinesterase and α-Glucosidase Activities. Eur. J. Integr. Med. 2019, 25, 77–84. [Google Scholar] [CrossRef]
  100. Philip, Y.; Mohd Fadzelly, A.B. Antioxidative and acetylcholinesterase inhibitor potential of selected honey of Sabah, Malaysian Borneo. Int. Food Res. J. 2015, 22, 1953–1960. [Google Scholar]
Figure 1. Fermented Olympus Mountain tea kombucha and honey after the addition of herbs, spices, and fruit.
Beverages 10 00009 g001
Figure 2. Total phenolic content in kombucha samples before (A, B, C) and after enrichment (AG, BG, CG, AR, BR, CR). Results are reported as mean ± standard deviation in gallic acid equivalents (GAE) of three independent measurements.
Beverages 10 00009 g002
Figure 3. Total flavonoid content in kombucha samples before (A, B, C) and after enrichment (AG, BG, CG, AR, BR, CR). Results are reported as mean ± standard deviation in rutin equivalents (RE) of three independent measurements.
Beverages 10 00009 g003
Figure 4. Antioxidant activity was evaluated by the ABTS assay before (A, B, C) and after enrichment (AG, BG, CG, AR, BR, CR). Data are presented as mean ± standard deviation in the amount (μL) required for 50% scavenging of ABTS●+ (IC50) for three independent measurements.
Beverages 10 00009 g004
Figure 5. Antioxidant activity based on DPPH assay in samples before (A, B, C) and after enrichment (AG, BG, CG, AR, BR, CR). Data are presented as mean ± standard deviation in the amount (μL) required for 50% scavenging of DPPH (IC50) for three independent measurements.
Beverages 10 00009 g005
Figure 6. α-Glucosidase inhibition from samples before (A, B, C) and after (AG, BG, CG, AR, BR, CR) enrichment. Data are presented as mean ± standard deviation in the amounts (μL) required for 50% inhibition of α-glucosidase for three independent measurements.
Beverages 10 00009 g006
Figure 7. Inhibition of α-amylase from samples before (A, B, C) and after (AG, BG, CG, AR, BR, CR) enrichment. Results are presented as mean ± standard deviation in the amount (μL) required for 50% inhibition of α-amylase for three independent measurements.
Beverages 10 00009 g007
Figure 8. AChE inhibition from samples before (A, B, C) and after (AG, BG, CG, AR, BR, CR) enrichment. Data are presented as mean ± standard deviation in the amount (μL) required for 50% inhibition of acetylcholinesterase for three independent measurements.
Beverages 10 00009 g008
Figure 9. BChE inhibition from OMTWH kombucha samples before (A, B, C) and after (AG, BG, CG, AR, BR, CR) enrichment. Data are presented as mean ± standard deviation in the amount (μL) required for 50% inhibition of butyrylcholinesterase for three independent measurements.
Beverages 10 00009 g009
Table 1. A sampling of studied kombucha beverages.
ReplicationKKGKR
1AAGAR
2BBGBR
3CBGCR
Table 2. Chromatic parameters of K before and after enrichment (KR, KG).
Chromatic ParameterKKRKG
L66.5 ± 0.1 a41.8 ± 0.3 b67.3 ± 0.1 c
a−4.1 ± 0.2 d39.1 ± 0.4 c−4.8 ± 0.1 d
b22.0 ± 0.3 e23.7 ± 0.1 f23.5 ± 0.1 g
Different letters in each row indicate a significant difference (p < 0.05).
Table 3. Values of pH and titratable acidity of K, KG, and KR.
SamplepHTA (Acetic Acid g/L)
A3.06 ± 0.024.45 ± 0.02
AG3.00 ± 0.014.68 ± 0.01
AR2.96 ± 0.014.71 ± 0.02
B3.02 ± 0.014.69 ± 0.04
BG2.96 ± 0.024.86 ± 0.02
BR2.94 ± 0.015.10 ± 0.04
C2.96 ± 0.034.24 ± 0.05
CG2.87 ± 0.014.35 ± 0.02
CR2.85 ± 0.014.42 ± 0.01
Data for each sample represents the mean value ± standard deviation of three measurements.
Table 4. Content of total sugars (glucose and fructose) in beverage samples.
SampleGlucose (g/L)Fructose (g/L)
A20.4 ± 0.717.1 ± 0.8
AG19.8 ± 0.916.5 ± 0.9
AR20.1 ± 0.616.8 ± 0.9
B20.1 ± 0.818.6 ± 1
BG20.1 ± 0.618.3 ± 0.9
BR20.1 ± 0.718.6 ± 0.8
C18.6 ± 0.721 ± 0.9
CG18 ± 0.919.5 ± 0.9
CR18.3 ± 0.819.4 ± 1
Disclaimer/Publisher’s Note: The statements, opinions and data contained in all publications are solely those of the individual author(s) and contributor(s) and not of MDPI and/or the editor(s). MDPI and/or the editor(s) disclaim responsibility for any injury to people or property resulting from any ideas, methods, instructions or products referred to in the content.

