
Enhancement of Coffee Quality Attributes by Combining Processing Methods and Varieties

Faculty of Physical-Mathematical Sciences, Autonomous University of Sinaloa, Culiacan 80040, Sinaloa, Mexico
Beverages 2024, 10(1), 10; https://doi.org/10.3390/beverages10010010
Submission received: 20 October 2023
/
Revised: 22 December 2023
/
Accepted: 12 January 2024
/
Published: 18 January 2024
(This article belongs to the Section Tea, Coffee, Water, and Other Non-Alcoholic Beverages)
Abstract
:The intricate framework of attributes that define coffee quality, from varietals to processing methods, presents a comprehensive array of sensory experiences that influence consumption patterns. This research delves into the complex relationship between the characteristics of coffee beans, specifically varietal distinctions, applied processing methodologies, and the resulting sensory attributes, across both Arabica and Robusta species. Utilizing comprehensive linear mixed model analyses, this study examines the sensory intricacies, with a notable emphasis on flavor, aroma, and acidity, and their correlation with different countries of origin. Drawing from a diverse dataset that encompasses various global regions, our findings underscore the pivotal role of regional nuances in shaping the sensory evaluation of coffee. While Arabica beans exhibited certain distinct sensory attributes anchored to specific processing methods and regions, Robusta beans presented variations that were more nuanced. The results align with the existing literature, emphasizing the integral role of regional influences in coffee evaluations. This study reveals that specific Arabica varieties, such as Bourbon and Pacamara, enhance flavor when processed using the ‘Natural/Dry’ method. Meanwhile, certain Robusta beans processed with one of the methods showcased improved flavor scores. These insights provide the coffee industry with targeted strategies, reshaping cultivation and processing to meet discerning consumer preferences.
1. Introduction
Aspects of coffee such as flavor, aroma, and acidity, referred to collectively as ‘quality’, have always been a focal point for both consumers and producers [1]. The dynamism in the coffee industry, influenced by shifts in climate change [2], sustainability efforts, and evolving consumer preferences [3], has made understanding these quality attributes more vital than ever.
Flavor, a complex blend of taste and aroma, hinges on the coffee bean type, terroir, and processing methods. Frank et al. (2007) highlighted chemical compounds’ role in shaping flavor, connecting processing to the sensory experience [4]. Aroma, intertwined with flavor, is vital. Bhumiratana et al. (2011) explained that volatile compounds in coffee beans transform into aroma during brewing, often forming the initial sensory interaction [5]. Lastly, the often-misunderstood attribute of acidity is of paramount importance. It bestows brightness upon coffee, skillfully countering the inherent bitterness and sweetness. Bertrand et al. (2006) unveiled the variations in acidity levels among coffee varieties, underscoring its critical role in a comprehensive evaluation of coffee [3].
Historically, regions like the elevated Ethiopian highlands, the assumed birthplace of coffee, have made indelible imprints on the industry. The transition from these ancient origins to the widespread popularity in 17th-century Europe exemplifies coffee’s socio-economic impact on various cultures and communities [6]. For instance, countries like Brazil, Colombia, and Vietnam are now dominant players in the coffee production sphere [7,8]. However, intricate challenges, such as trade imbalances and coffee economies, along with variations in commodity prices, exert a profound impact on their coffee industries. Enhancing this product becomes crucial, particularly amidst a market depression for coffee, even as specialty coffee continues to retain its commercial appeal [9,10].
Highlighting the evolution in coffee processing, Ethiopia’s ancient sun-drying methods and Brazil’s contemporary wet processing offer insights into the progression of techniques and their influence on coffee attributes. The prevalent preference for Colombia’s premium Arabica and Vietnam’s robust Robusta export market underscores the significant economic implications of coffee quality and type [11,12].
Numerous studies have explored the influence of processing methods and varietals on coffee quality attributes. For instance, Velazquez et al. [13] identified that beans processed using the wet method presented a richer sensory profile with notable acidity compared to those processed using the dry method. On the varietal front, Bertrand et al. [3] noted differences in the chemical composition between Arabica and Robusta beans, with the latter generally containing higher caffeine levels [14]. Despite these findings, significant gaps in our understanding of these relationships persist. Many studies, such as that by Wild et al. [15], have predominantly focused on specific processing methods, often neglecting to consider the myriad of other methods employed globally. Additionally, the majority of the existing research tends to emphasize either Arabica or Robusta without providing a comprehensive examination of the wide variety of beans in cultivation [16]. There is also a noticeable deficiency in studies utilizing quantitative approaches for analyzing sensory evaluation data, which might offer more nuanced insights.
With the goal of understanding how processing methods and coffee variety choices affect sensory attributes and, consequently, perceived quality, this study embarks on a methodical exploration. Grounded in the hypothesis that these factors significantly influence coffee’s sensory profile, which in turn shapes its appeal to consumers, we harness data from an extensive database maintained by the Coffee Quality Institute (https://www.coffeeinstitute.org/, accessed on 17 July 2023). Using a quantitative analysis through regression techniques, this research evaluates sensory assessments conducted by seasoned coffee experts. Ultimately, our objective is to pinpoint the determinants of coffee quality, discern the differences brought about by processing methods and varieties, and evaluate consumer inclinations. In doing so, we anticipate offering valuable insights that can guide stakeholders in refining production practices and navigating the global coffee market more strategically.
2. Materials and Methods
We sourced our data from the Coffee Quality Institute, a globally recognized institution dedicated to the study and promotion of coffee quality. As of January 2023, the dataset from CQI was accessible on the Kaggle platform (https://www.kaggle.com/datasets/volpatto/coffee-quality-database-from-cqi, accessed on 17 July 2023). This adoption of the CQI database is consistent with methodologies applied in recent academic investigations, such as the approach detailed by Fernandes et al. [17].
The database encompasses assessments of quality attributes for both Arabica and Robusta coffee species, with 1310 records for Arabica compared to a more limited set of 28 records for Robusta. Discrepancies in sample sizes may stem from Arabica producers’ keen interest in specialty evaluations, suggesting a need to bolster Robusta coffee assessments. To address potential biases arising from this data disparity, we analyzed the scores for Arabica and Robusta independently, ensuring each species was evaluated on its own merits without being influenced by the imbalance in the record count.
Attributes recorded in the database include sensory characteristics, such as aroma, taste, aftertaste, acidity, body, balance, uniformity, cleanliness, and sweetness. Specifically, we focus on studying the attributes of acidity, aroma, flavor, and total cup points, which were measured using a standardized 10-point scale, a practice widely accepted in coffee quality assessments. In contrast, the ‘Total Cup Points’ were assessed on a different scale, ranging from 0 to 100, offering a broader perspective on the overall quality of the coffee. To ensure a meaningful comparison across these varied scoring ranges, we employed a z-score normalization technique. This normalization process allows us to standardize the data, aligning all attributes within a common framework for a more accurate analysis and interpretation. The database also delves into the physical attributes of coffee beans, encompassing details on humidity, defects, and color. Provenance attributes such as the owner, country of origin, ranch, overseeing company, production region, batch number, and detailed processing methods are also incorporated, providing an in-depth view from bean origin to sensory evaluation.
To decode the relationship between coffee quality attributes and their country of origin, we utilized a mixed linear regression model [18]. In this model, the region was deemed a random-effect variable, pertinent to both Arabica and Robusta species, while other attributes were treated as fixed effects. Our secondary analytical model probed into the correlation between coffee quality attributes, the specific coffee variant, and its respective processing method. Both the country of origin and region were treated as random effects in this model. The decision to classify these as random effects stems from the need to account for intrinsic variability within different countries and regions that could influence coffee quality.
Before modeling, the distribution of our datasets was comprehensively assessed. In cases where data subsets did not adhere to a Gaussian distribution, we applied various transformations, including square, inverse, and logarithmic methods. When data subsets were unresponsive to these transformations, we presented medians and interquartile ranges instead of the traditional means and standard deviations. To examine the relationships between the attribute scores, we utilized Spearman’s rank correlation, which is a non-parametric method that is robust to non-normality and potential outliers. It is crucial to note that our analysis implemented a filtering criterion, considering only countries (or varieties or processing methods) that had more than 20 scores. After identifying attributes that demonstrated significant relationships across countries, post hoc analyses will be conducted to further specify differences between particular nations. In accordance with conventional practices, we established a p-value threshold of 0.05 to ascertain statistical significance.
3. Results
3.1. Arabica Coffee Quality Assessment
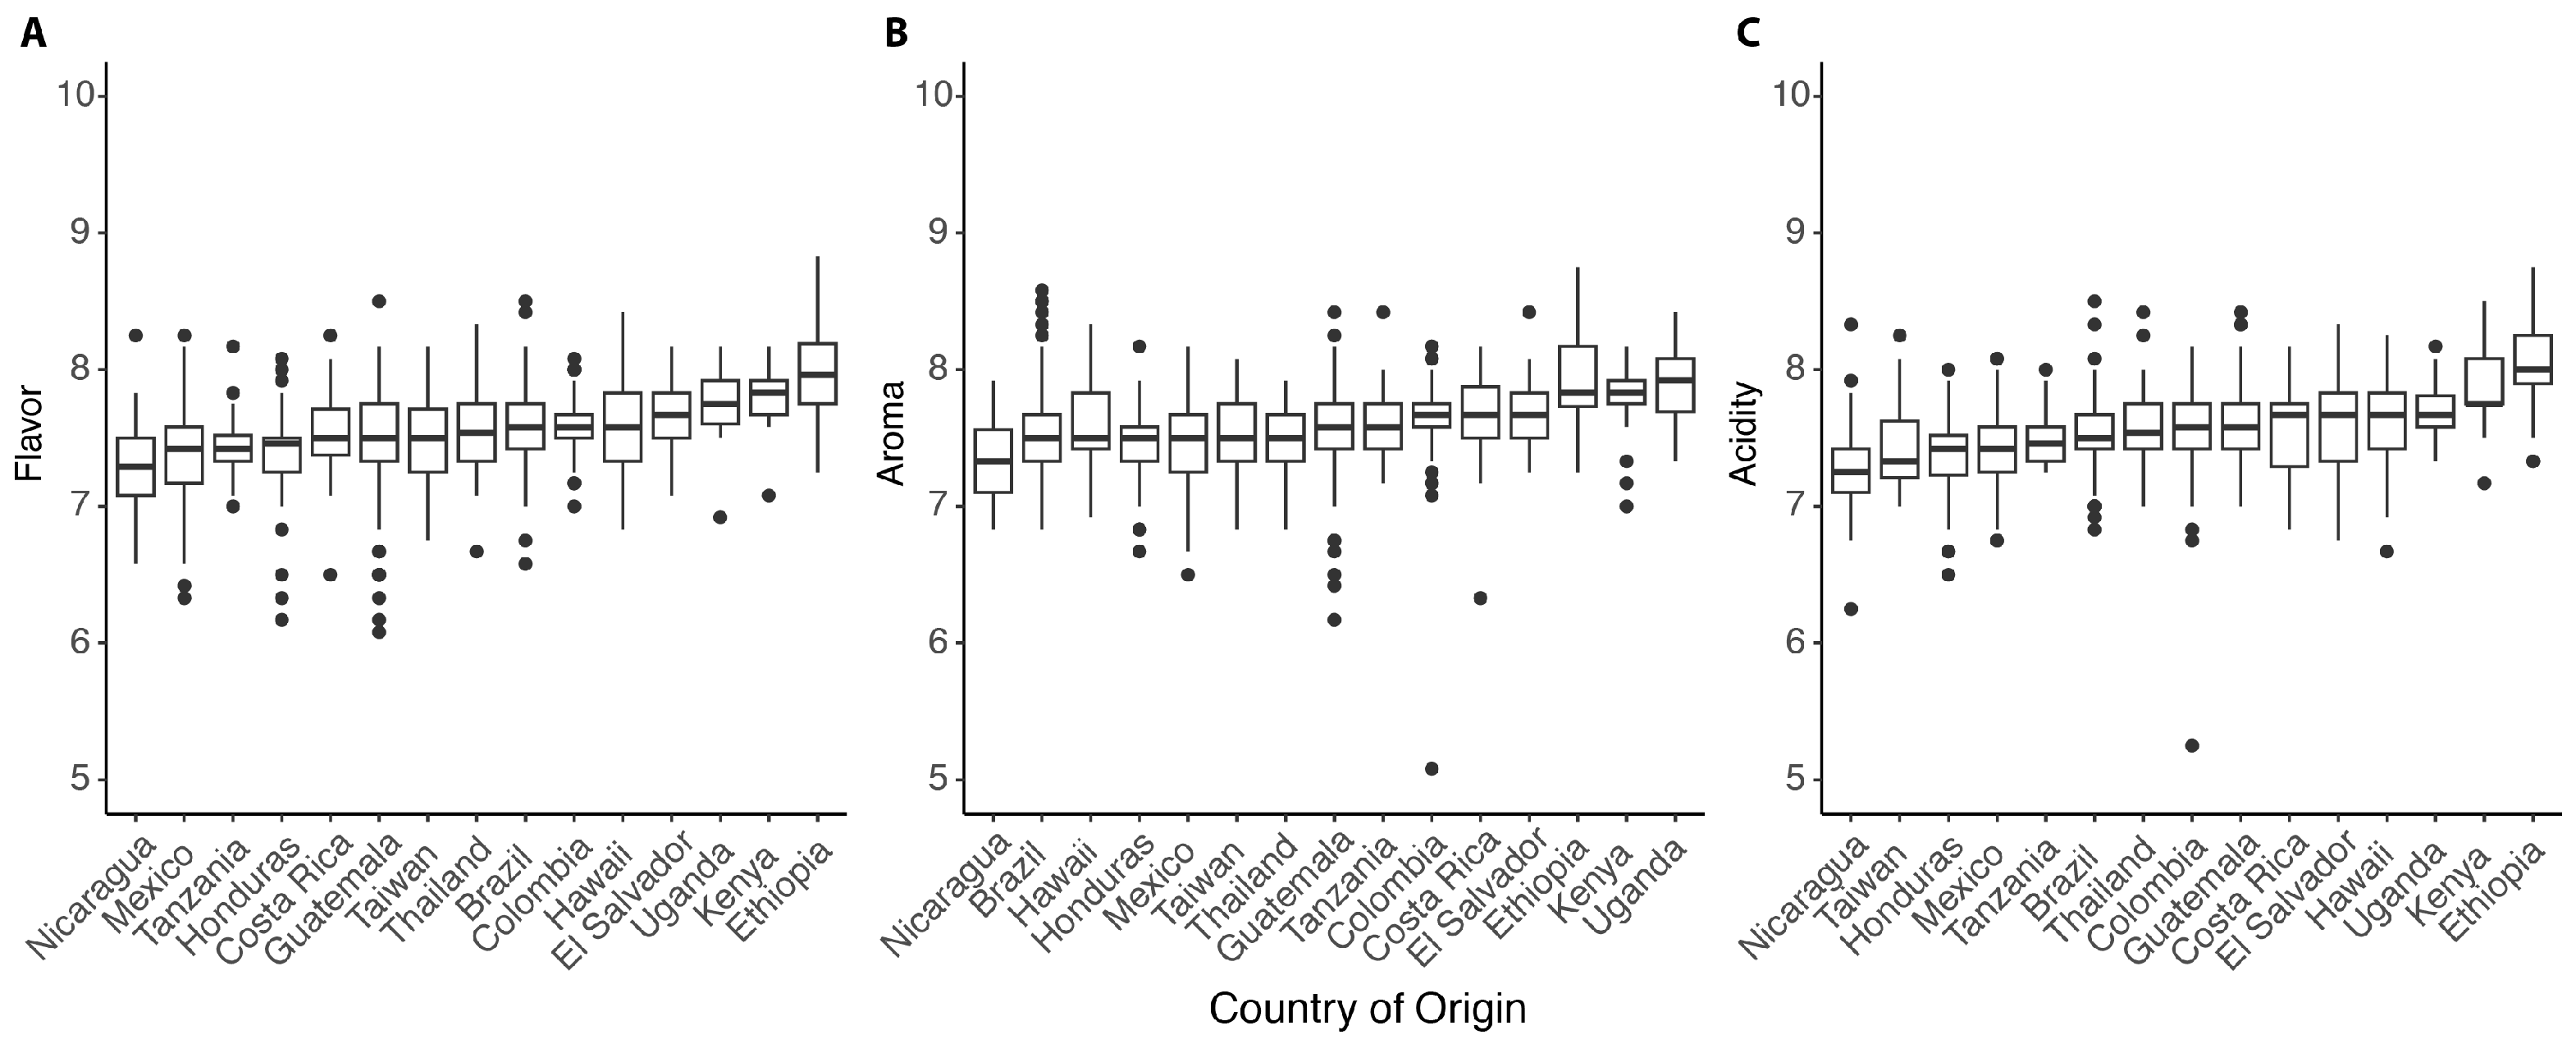
The coffee rated highest worldwide in terms of quality attributes comes from Ethiopia. Please refer to Table 1 and Table A1, Table A2, Table A3 of Appendix A for additional information. Many Ethiopian coffees showcase the highest median values for various coffee quality attributes, with the median scores as follows: acidity (7.58), aroma (7.58), flavor (7.96), and total cup points (85.2). The value for flavor stands out as the highest among all attributes. It is important to note that none of the variable’s data followed a normal distribution, even after transformations. Contrastingly, while coffees from Nicaragua exhibit the lowest median values, 50% of their evaluations still fall within the 80 to 84 point range (see Figure 1). Despite being the lowest, they remain classified as specialty coffee [19].
In Africa, compared to Ethiopia’s stringent standards [20], Kenya closely follows, marking notable median values of 7.83 in both aroma and flavor and a total cup points score of 84.58, which is a minor decrement of 0.7%. Tanzania, although not reaching the heights of Ethiopia and Kenya [21,22], still maintains a competitive stance, with a 0.25 decrement in aroma (7.58) and total cup points of 82.17. Finally, Uganda, while not leading, exhibits consistent quality as evidenced by its total cup points of 83.875, underlining its commitment to coffee quality.
In the Latin American context, Brazil and Colombia are prominent figures in coffee production [23,24]. When benchmarked against Ethiopia’s standard values—an aroma of 7.96, acidity of 8.0, and flavor at 7.83—both nations exhibit strong performances, though they slightly lag behind. Specifically, Colombia’s median acidity and flavor values are close to Ethiopia’s, showing reductions of 5% and 4%, respectively. Its aroma is also competitive, trailing by just 2%. Meanwhile, Brazil’s aroma and flavor come close to matching Ethiopia’s, with a modest 4% reduction, but there is a more noticeable 6% drop in acidity. Overall, while Ethiopia sets the bar high with its attributes, Brazil and Colombia are not significantly behind, showcasing their prowess in producing high-quality coffee. The next set of countries, Costa Rica, El Salvador, Guatemala, Honduras, and Mexico, maintain closely aligned median scores. For instance, Guatemala, with its aroma and flavor values within 5% of Ethiopia’s benchmarks, records total cup points of 82.5, only 2.46 points below Ethiopia. Honduras, with a slightly lower aroma and a 6% reduced acidity compared to Ethiopia, registers a score of 81.67. Mexico trails closely with total cup points of 81.625, its aroma and acidity being 7% less than the Ethiopian gold standard. Meanwhile, although Nicaragua has the lowest score among this group, its rich heritage in coffee cultivation suggests a solid foundation for continued quality production.
In the Asian and Pacific regions, when benchmarked against Ethiopia’s acclaimed standards, Hawaii comes close, registering a minor decrement of 3% in aroma (7.58), a 4% drop in acidity, and an equal decline in flavor (7.67). Thailand, although not on par with Ethiopia or Hawaii, remains competitive with a decrement of 5% in aroma (7.42) and a 6% decline in acidity. The flavor is not far off, trailing by just 5%. Taiwan, meanwhile, manifests a clear deviation from Ethiopia’s benchmarks, marking a 6% decrease in aroma (7.33), and a 9% decline in both acidity and flavor (7.25 each). Yet, these deviations underscore each country’s unique flavor profile and commitment to coffee quality.
3.1.1. Relationship of the Arabica Coffee among Countries
Distinct countries display pronounced differences in flavor scores in comparison to Brazil, the largest producer of Arabica coffee. The mixed model facilitates a thorough exploration of the differences among countries by considering score attributes as the dependent variable, country of origin as the fixed effect, and region as the random variable. Specifically, a shift to Uganda unveils a remarkable alteration in flavor scores by approximately 0.21119 units, which is statistically significant (t = 2.674 and p = 0.008). Moreover, Ethiopia indicates a significant increment in flavor scores by 0.46706 units relative to the reference country, demonstrating high statistical significance (t = 6.718 and p < 0.001). On the contrary, Nicaragua reveals a decline in flavor scores by −0.24554 units, also with statistical relevance (t = 2.939 and p = 0.0037). This implies that, while the flavor profile of coffee from Uganda and Ethiopia might be perceived as enhanced, this variation sets it apart from the reference country’s flavor profile in a statistically significant manner. Furthermore, the intrinsic role played by the random effects in the model cannot be sidelined. The variance ascribed to ‘Region’ is established at 0.009713, which unambiguously signals the variability in flavor scores inherent within distinct regions. This brings to the fore the inference that while discernments at the country level are unarguably evident, regional nuances cast a substantial influence on the flavor profile of the coffee. In essence, delving into these regional peculiarities could shed further light on the multi-dimensional aspects of coffee flavor.
Turning our attention to the aroma attribute, the linear mixed model reveals notable variations in scores across different countries as well, also establishing Brazil as the baseline. Significant variations in aroma scores are observed in countries such as Ethiopia (t = 4.714 and p = 5.85 × ), Uganda (t = 4.270 and p = 3.05 × ), and Kenya (t = 2.608 and p = 0.00976), among others. Notably, Ethiopia and Uganda present particularly elevated aroma scores compared to Brazil (see Figure 1). However, variations in other countries like Colombia (p = 0.82506) and El Salvador (p = 0.41188) were not statistically significant, suggesting that their aroma scores do not markedly differ from the baseline, Brazil. Furthermore, the role of random effects in the model is evident. With the variance attributed to ‘Region’ being 0.01433, there is an indication of variability in aroma scores within specific regions. This accentuates that, while differences at the country level are discernible, regional factors significantly contribute to the aroma of the coffee. Consequently, recognizing these regional intricacies might offer a deeper understanding of the aroma’s variability.
Shifting our focus to the attribute of acidity, a thorough exploration via the linear mixed model distinctly illuminates the existence of statistically significant variations in acidity scores across diverse countries, maintaining Brazil as the analytical baseline for comparative evaluation. On average, transitioning from the reference country, Colombia, to others showcases a range of shifts in acidity levels. Significant variations in acidity levels are found in countries, such as Ethiopia (t = 7.931 and p = 3.48 × ), Kenya (t = 4.934 and p = 1.50 × ), Guatemala (t = 3.452 and p = 0.000722), and Nicaragua (t = 2.915 and p = 0.003863), among others. Ethiopia and Kenya, notably, exhibit particularly high acidity levels in contrast to the reference. The role of random effects within the model is also manifest. With the variance attributed to ‘Region’ being 0.01514, there is evidence of variability in the acidity levels within certain regions.
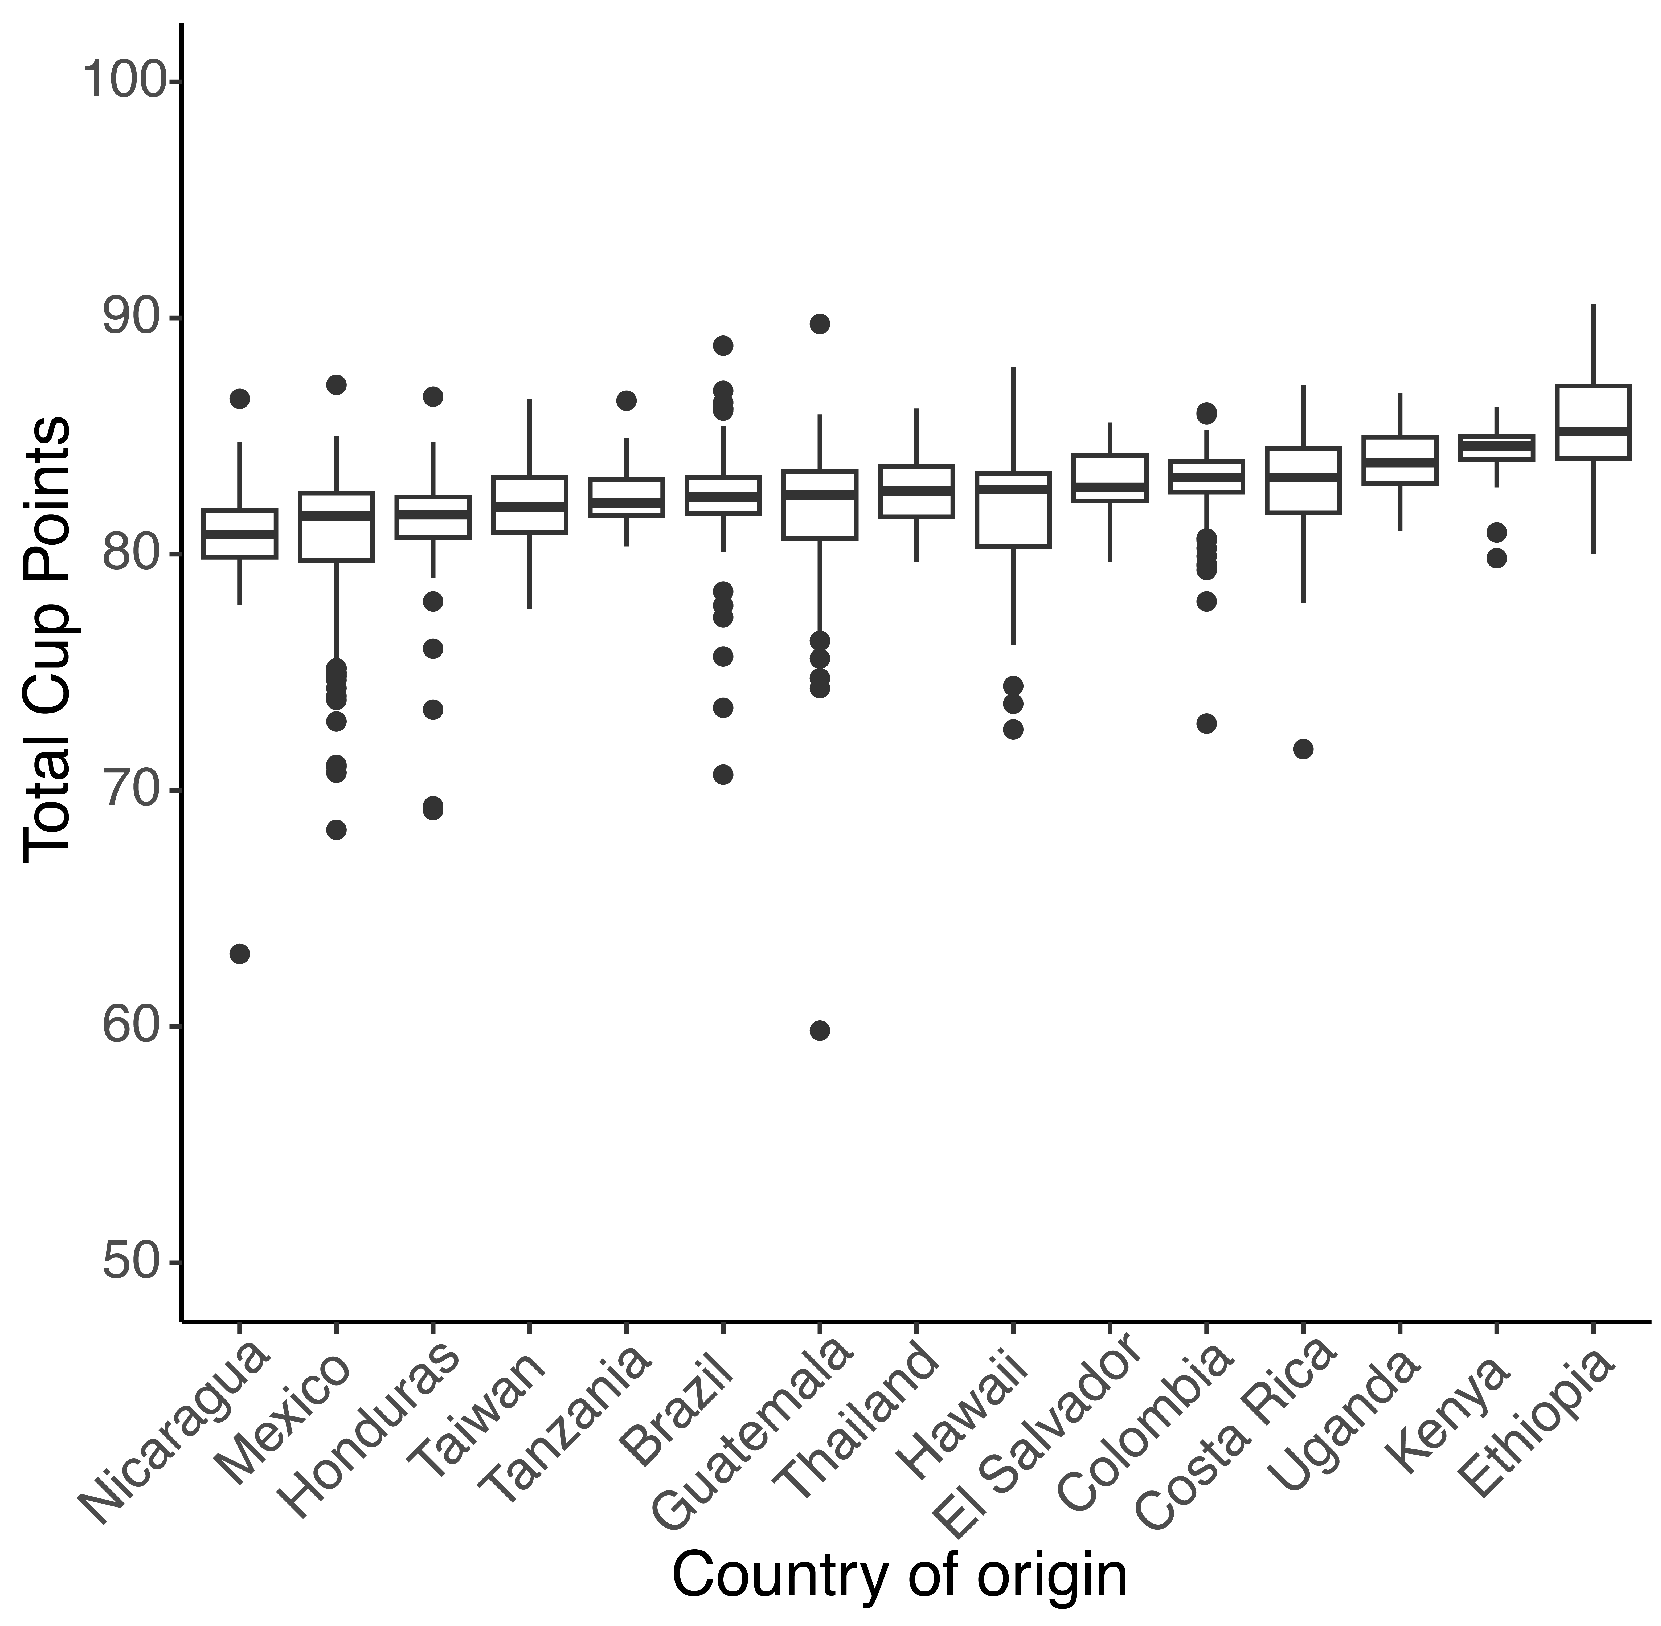
Lastly, by delving into the linear mixed model, centered particularly on the total cup points (see Figure 2), one discerns statistically significant differences in cupping scores across various countries, employing Brazil as a reference baseline. Transitioning on average from Brazil to other nations unveils distinct variances in the total cup point scores. Specifically, notable differences in cupping scores are observed for countries, such as Ethiopia (t = 5.591 and p = 1.08 × ), Kenya (t = 3.006 and p = 0.00296), Honduras (t = 2.215 and p = 0.02824), Mexico (t = 3.860 and p = 0.00017), Nicaragua (t = 3.149 and p = 0.00187), and Uganda (t = 2.856 and p = 0.00472), among others. Particularly, Ethiopia and Kenya exhibit exceptionally high cupping scores compared to Colombia, while Honduras, Mexico, and Nicaragua present lower scores. Moreover, the role of random effects in the model is pronounced, with the variance attributed to ‘Region’ being 0.7978, which indicates the existence of variability in the cupping scores within specific regions. This highlights that, while variations at the country level are noticeable, regional factors also significantly influence the overall cup quality, exhibiting a similar behavior to the scores of the flavor, acidity, and aroma attributes.
3.1.2. Interactions between Arabica Coffee Attributes and the Varieties and Processing Methods
The complex interrelation between the flavor of coffee beans, their respective varieties (see Table 2 and Table A4, Table A5, Table A6 in Appendix A), and the applied processing methodologies (see Table 3 and Table A7, Table A8, Table A9 in Appendix A) has been meticulously analyzed using a linear mixed model, considering the interaction between varieties and processing methods as a fixed effect while hierarchically incorporating the country of origin and region as random effects. The baseline flavor score was anchored at 7.587 (t = 135.462 and p < 0.001). Regarding processing methods, a potential flavor decline was noted for the ‘Natural/Dry’ method (t = 1.651 and p = 0.099), while the ‘Other’ method significantly reduced it (t = 2.274 and p = 0.023). Pertaining to bean varieties, significant enhancements in flavor were recognized in the Bourbon (t = 2.329 and p = 0.020) and Yellow Bourbon (t = 2.125 and p = 0.034) varieties, whereas Typica was associated with a significant reduction in flavor (t = 3.385 and p = 0.001).
An in-depth exploration of the interactions between processing methods and bean varieties revealed subtle impacts on flavor profiles. For instance, a noteworthy flavor reduction was identified in the interaction of the ‘Washed/Wet’ method with the Bourbon variety (t = 2.574 and p = 0.010). Contrarily, interactions such as the ‘Natural/Dry’ method and Typica variety significantly enhanced the flavor (t = 4.000 and p < 0.001). Furthermore, the ‘Other’ processing method, when interacted with Typica, also significantly uplifted the flavor (t = 3.400 and p = 0.001), whereas it, when combined with the ‘Washed/Wet’ method and Typica variety, showcased considerable flavor enhancement (t = 2.971 and p = 0.003). Moreover, an interaction leading to a significant flavor decline involved the ‘Washed/Wet’ method and the Yellow Bourbon variety (t = 2.348 and p = 0.019).
In the linear model focused on aroma, we note significant variations in the aroma scores among different processing methods and coffee varieties. For instance, when juxtaposed with the baseline, a notable observation is the ‘Other’ method employed with the ‘Bourbon’ variety, which discerned a spike in the aroma scores (t = 2.510 and p = 0.012234). In a similar vein, an appreciable uptick was identified utilizing the ‘Other’ method with the ‘Caturra’ variety (t = 2.404 and p = 0.016514). Moreover, integrating the ‘Other’ method with the ‘Typica’ variety was related to a prominent ascent in aroma (t = 4.295 and p = 1.94 × ). Conversely, applying the ‘Natural/Dry’ method in tandem with the ‘Yellow Bourbon’ variety witnessed a marked decrement in aroma scores (t = 4.185 and p = 3.25 × ). Furthermore, an intriguingly conspicuous reduction was detected when the ‘Washed/Wet’ method was amalgamated with the ‘Yellow Bourbon’ variety (t = 3.023 and p = 0.002574). Additionally, numerous other combinations of processing methods and varieties disclosed statistically significant influences on the aroma scores, thereby underlining the importance of these variables’ interaction in shaping the aroma profile of the coffee. It is pivotal to acknowledge that these results underscore the nuanced interaction between processing methods and Arabica coffee varieties in determining aroma outcomes, thereby substantiating that a strategic pairing between them can either amplify or attenuate aroma attributes effectively.
Drawing from the model’s findings, there are distinct statistical variations in the acidity scores based on processing methods and coffee varieties. Initially, establishing a foundational understanding, the intercept revealed a substantial score of 7.562 (t = 122.092 and p < 2 × ). A variety of nuanced alterations in the acidity scores unfolded depending on the processing method and variety deployed. Specifically, when parsing through the various combinations, engaging with the ‘Bourbon’ variety reflected a statistically significant upturn in the score (t = 2.150 and p = 0.0318). Alternatively, employing the ‘Caturra’ variety similarly navigated the score toward an increase (t = 2.35 and p = 0.0187). Delving deeper into the interaction between methods and varieties, discerning instances of notable statistical relevance are visible. Particularly, a score decrease was observed in the interaction of the ‘Washed/Wet’ processing method with the ‘Bourbon’ variety (t = 2.510 and p = 0.0122). The collaboration of the ‘Washed/Wet’ method with the ‘Caturra’ variety similarly instigated a decrement in the score (t = 2.319 and p = 0.0206). In another blend of method and variety, specifically the ‘Washed/Wet’ method with ‘Yellow Bourbon,’ there was a notable decline in the score (t = 2.136 and p = 0.0329). It is pertinent to mention that while these instances harness statistical significance, various other interactions and factors did not reach a level of statistical relevance, revealing the complexity and nuance within the interactions of the processing methods and varieties in affecting acidity scores.
Lastly, the exploration into the interaction between various coffee varieties and processing methods, particularly regarding the total cup points, unveils nuanced insights. Specifically, the ‘Washed/Wet’ method interacting with the ‘Bourbon’ variety manifested a decrement in total cup points (t = 3.687 and p = 0.011899). In a striking contrast, employing the ‘Natural/Dry’ method alongside ‘Catuai’ signified an amplification (t = 3.388 and p = 0.000733). Additionally, the interaction of the ‘Natural/Dry’ method with ‘Typica’ demonstrated a statistically significant uplift (t = 2.641 and p = 0.008435), and a similar trend was perceived with the ‘Other’ method used with ‘Typica’ (t = 2.235 and p = 0.025677). A particularly compelling result was recorded with the ‘Washed/Wet’ method paired with ‘Yellow Bourbon,’ which exhibited a discernible reduction (t = 2.480 and p = 0.013304). To encapsulate, these varied interactions between the employed processing methods and coffee varieties have exerted a profound impact on the total cup points, rendering the matter worthy of further exploration and analysis in future research endeavors.
The exploration of various attributes and qualitative distinctions among Arabica coffees leads us to another crucial discussion about another well-known species in the coffee taxonomy, Coffea canephora, commonly known as Robusta. While the preceding sections shed light on the vibrant and diverse profiles of Arabica varieties, the exploration of Robusta coffee allows us to contrast and comprehend the variations and similarities that span across these two species, each esteemed in distinct echelons of the coffee industry.
3.2. Robusta Coffee Quality Assessment
In the subsequent examination of the Robusta species’ coffee attributes, particularly from regions such as India and Uganda, discernible distinctions become apparent when based upon their median values (Table 4 and Table A10, Table A11, Table A12 in Appendix A). Robusta coffee from India is distinguished by its notable attributes, exhibiting median scores for aroma (7.67), flavor (7.75), acidity (7.75), and cupper points (7.83). Its total cup points reach 81.58, underscoring India’s prominent stature in cultivating a robust and vibrant Robusta coffee. Uganda, originating from the African coffee belt, upholds consistent quality in its Robusta beans, as indicated by key median attributes: aroma (7.83), flavor (7.79), acidity (7.75), and cupper points (7.71). These metrics echo Uganda’s unwavering dedication to coffee excellence, with its total cup points for Robusta registering at 81.625. This subtly surpasses India, spotlighting Uganda’s competitive position in the international coffee arena.
In a detailed comparison between India and Uganda, notable distinctions emerge in the medians of aroma, flavor, and acidity, highlighting the potent coffee profiles exhibited by these nations. Specifically, examining the attribute of aroma, India’s median outpaces Uganda’s, albeit marginally. A similar pattern is observed in acidity, where India takes a slender lead. Conversely, when exploring the flavor attribute, Uganda demonstrates a slight advantage over India. These nuanced differences between the two countries illuminate the rich and varied coffee experiences offered by each, inviting coffee connoisseurs to delve into a delightful spectrum of flavors and aromas.
Zooming out to the broader coffee landscape, it is pivotal to mention that datasets from Angola (n = 1), Ecuador (), and Vietnam () were not considered due to the constraint of a singular or two scores, limiting a holistic portrayal of coffee quality from these nations. Moreover, when contrasting with the Arabica species, Robusta has fewer scores per country, signifying varied representation across coffee species. The analysis now shifts from median value comparisons to an exploration of the mixed model for the Robusta species, providing additional insights into its diverse attributes.
Relationship of the Robusta Coffee Attributes between Uganda and India
An assessment of the sensory attributes of coffee, specifically flavor, aroma, and acidity, through linear mixed models with respect to the country of origin (considering ‘Region’ as a random effect), reveals certain patterns: flavor scores exhibit variability among countries when benchmarked against the reference baseline of 7.6250. Specifically, Indian coffee displays a marginal decrease in flavor by about 0.3186 units, although this difference is not statistically significant (t = 0.818 and p = 0.453). In contrast, Ugandan coffee portrays a subtle ascent in flavor scores, elevating by nearly 0.1146 units. Yet again, this variation does not attain statistical significance (t = 0.329 and p = 0.756). A subsequent post hoc analysis reveals a minimal flavor score difference between India and Uganda, emphasizing the non-significant distinction (t = 1.260 and p = 0.2351). The ‘Region’ plays a pivotal role in flavor differentiation, accounting for a variance of 0.08957, underscoring the indispensable impact of regional peculiarities on coffee flavor.
Shifting focus to aroma, distinct aroma scores manifest among countries against a reference baseline of 7.6323. The aroma intensity of Ugandan coffee marginally exceeds that of the reference country by about 0.2122 units. Nevertheless, this nuanced distinction does not hold statistical weight (t = 1.185 and p = 0.302). Analogous to the flavor findings, the regional variability, represented by a variance of 0.03046, accentuates the profound influence regions wield on aroma composition, necessitating a deeper understanding of these regional idiosyncrasies to grasp the coffee aroma spectrum comprehensively.
An inspection of the acidity attribute, particularly against a baseline of 7.6650, reveals divergences among countries in sensory scores. A closer look at coffee from India indicates a marginal decrement by approximately 0.05298 units; however, this deviation does not attain statistical significance (t = 0.256 and p = 0.816). Concurrently, coffee from Uganda demonstrates an augmentation in scores by a proximate 0.04661 units, which is a change that similarly does not achieve statistical significance (t = 0.239 and p = 0.822). Further, a subsequent post hoc analysis fails to underscore any substantial cupping score differential between India and Uganda, thereby rendering the variances inconsequential (t = 0.6 and p = 0.6128). ‘Region’ unfurls as a significant variable, displaying a variance of 0.01080, thereby highlighting the pivotal role individual regions perpetuate in sculpting the cupping properties of coffee.
Examining the results from the linear mixed model, specifically centered on the total cup points, statistically significant disparities in cupping scores across different countries were identified, utilizing Brazil as a foundational reference. The transition in total cup point scores from Brazil to other countries, on average, reveals various distinct disparities. Particularly, India and Uganda, under scrutiny, exhibit differences in cupping scores, with the latter offering a compelling study. Specifically, shifting focus to Uganda, a notable alteration in the total cup point scores by approximately 3.4223 units was observed, which, however, did not meet the threshold for statistical significance (t = 1.374 and p = 0.229). A post hoc analysis, employing Tukey’s adjustment, contrasted the coffee quality scores between India and Uganda, revealing an estimate of −3.02, a standard error of 1.91, and degrees of freedom approximating 4.76, with a t-ratio and p-value of 1.577 and 0.1785, respectively. Furthermore, while the variance attributed to the ‘Region’ (4.491) in the model is notably pronounced, showcasing a robust influence of regional factors on the overall cup quality, it also introduces a discernible variability within specific coffee-producing regions, paralleling the observed behavior of the flavor, acidity, and aroma attribute scores. Therefore, it remains imperative to recognize that while variations at the country level are discernible, regional nuances also play a significant role in dictating the overall quality of the cup, especially amidst the exploration of coffee attributes, like the flavor, acidity, and aroma.
In summation, while country-specific variances in coffee attributes are palpable, they often fall short of statistical significance. Moreover, regional differences exert a profound influence on these attributes, highlighting the complexity and multifaceted nature of coffee sensory evaluations.
4. Discussion
The dynamic relationship between coffee bean attributes, specifically varietal distinctions and processing techniques, remains a nascent field of academic inquiry. Our research adds a substantive dimension to this emerging discourse among scholars, agronomists, and coffee specialists. Employing rigorous linear mixed model analyses for both Arabica and Robusta species, we highlight several pivotal observations. Specifically, with Arabica beans, the ‘Natural/Dry’ processing technique indicated a potential deterioration in flavor (t = 1.752 and p = 0.080). Notably, the integration of the ‘Washed/Wet’ method with the Bourbon variety led to a marked decrease in flavor (t = 2.586 and p = 0.010). Conversely, for Robusta beans, a certain processing technique yielded a significant flavor enhancement, evidenced by an increase of 0.3881 units (t = 3.782 and p = 0.00179).
4.1. Countries’ Interactions of Coffee Attributes
The results presented offer a meticulous exploration into the variability in the sensory attributes of coffee, chiefly focused on aroma, acidity, and flavor, against different countries of origin. These findings, with their careful consideration of the regional influences, provide a robust platform for understanding the multi-dimensional aspects of coffee evaluation. For Arabica coffee, distinct flavor differences are evident across countries, although the variation concerning Uganda was not statistically significant (t = 1.621 and p = 0.17). This is in line with Mussatto et al., who observed flavor variability based on origin [25].
In terms of aroma, our study reveals substantial variations across countries like Ethiopia (t = 7.563 and p = 3.11 × ) and Uganda (t = 6.619 and p = 2.31 × ) for Arabica species. This aligns with the work of Ref. [26], where specific origins were identified as having distinct aroma profiles, thus reinforcing our findings [27]. The highlighted acidity variations, particularly with Ethiopia (t = 7.185 and p = 2.53 × ) and Kenya (t = 4.388 and p = 1.69 × ), align with the findings of Ref. [1], who also observed pronounced acidity differences based on geographical origin. Significantly, even though roasting was not the focus of this analysis, it is crucial for coffee’s organoleptic properties. The findings from Ref. [28] underscored the influence of the preparation method and roasting temperature on the total polyphenol content in coffee beverages [28]. Lightly roasted coffee showed the highest phenolic content. The Hario V60 preparation method yielded the highest polyphenol content across roasting temperatures. Furthermore, neither the pH nor titratable acidity correlated with the coffee’s sensory aspect of acidity. Importantly, antioxidant activity depends on both the preparation and cultivation region [28]. The role of the regional variance in this parameter, as indicated by a variance of 0.7665, mirrors the results documented by Ref. [29], emphasizing the intricate interplay of regional nuances in coffee evaluation. Thus, aroma, as an attribute, is influenced not only by the region but also by other chemical properties that exert a significant impact on it. For future studies, it would be beneficial to incorporate the roaster properties of the coffee beans into this database.
Acidity in coffee, discerned notably within beans from Ethiopia (t = 7.563 and p = 3.11 × ) and Uganda (t = 6.619 and p = 2.31 × ), showcases the implicit impact of the geographical origin on the aromatic attributes of Arabica species, a subject thoroughly canvassed in coffee research [1,3]. Ethiopia, known for its diverse Arabica varieties and high-altitude cultivation, often presents beans with pronounced, bright acidity, an observation underpinned by the prior research of Ref. [3]. Comparatively, Ugandan beans interact diversely with their own unique climatic and soil conditions, crafting a distinct acidity and flavor profile. In comparison to wine research, where terroir—the interplay of geography, geology, and climate—is known to significantly influence flavor profiles [30], coffee beans demonstrate a similar intricate connection between their geographical origin and resultant sensory attributes. However, these complexities in coffee acidity profiles are also modulated by factors such as varietal characteristics, cultivation practices, and post-harvest processes, suggesting a multifaceted arena that warrants further exploration and comparative analysis across diverse beverage commodities and global coffee-producing regions [3,13].
Turning our attention to Robusta, the results predominantly illustrate variations that, while perceptible, frequently lack statistical significance. We posit that this may be occasioned by both a limited number of scores per country and a constrained quantity of participating countries. The flavor differentiation between Indian and Ugandan coffee, despite their apparent differences, resonates with the study by Ref. [31], which also underlined the non-significant distinctions in flavor between certain origins. The aroma intensity variation for Ugandan coffee, while subtle, is in line with the findings of Ref. [32] suggesting that even minor variations can be discerned by trained panels, though they might not always reach statistical significance. For acidity, our observation that differences between countries like India and Uganda were not statistically significant complements the research by Ref. [33], who also emphasized the role of regional variations overshadowing country-specific discrepancies.
In sum, our results, while providing nuanced insights into the sensory attributes of Arabica and Robusta, concurrently underscore the paramountcy of regional influences. This intricate relationship between country of origin and regional idiosyncrasies showcases the layered complexity inherent in coffee sensory evaluations and reiterates the findings of previous scholars in the field. The significance of geographical nuances in sensory evaluation, once established, necessitates a thorough investigation into other critical determinants that shape coffee’s sensory profile. Beyond origin, factors such as processing methods and specific coffee varieties exert considerable influence over the final taste and aroma of the brew.
4.2. Mixing Coffee Varieties and Processing Methods
The aroma, flavor, and overall quality of coffee are influenced by a myriad of factors. Key among these are the processing methods employed and the specific coffee variety (see Table 2 and Table 3). As deduced from our findings, these factors not only independently influence sensory perceptions but also interact synergistically to shape the sensory profile of the coffee, especially for the Arabica type.
In line with our findings, Ref. [1] observed that processing methods substantially impact flavor and aroma in Arabica coffee, which is in agreement with the pronounced flavor profile differences seen with the ‘Natural/Dry’ and ‘Other’ processing methods in our study. Coffee varieties, as evidenced by our results and echoed by [34], can either enhance or diminish flavor. Our findings, for instance, highlight how Bourbon and Pacamara varieties intensify flavor, while Typica reduces it. This agrees with [31] who found that certain varieties such as Bourbon tend to produce coffee with richer flavors than others [34].
Similarly, the variability in aroma scores observed in our study, particularly with the interplay of the ‘Other’ processing method and varieties like ‘Bourbon’ and ‘Caturra’, are consistent with the findings of Ref. [5]. They also observed that processing methods significantly influence aroma intensity in Arabica coffee. Acidity, another crucial attribute, was found in our study to vary significantly among countries, especially in Ethiopia and Kenya. This aligns with a study by Ref. [25] that reported geographical origin as a significant determinant of coffee acidity.
When focusing on Robusta, our results hint at subtler variations than observed in Arabica, especially in aroma and flavor. The minimal flavor score difference between India and Uganda, and the nuanced aroma distinction in Ugandan coffee, are consistent with observations by Silva et al. (2013). They found that regional factors might exert more profound influences on Robusta’s sensory profile than the processing methods or bean variety per se [5].
In summary, our findings underscore the intricate interplay of processing methods and coffee variety on sensory attributes, particularly for Arabica. These results emphasize the need for a harmonized approach in coffee production and processing, taking into consideration the synergistic effects of variety and processing methods. Such considerations are crucial for stakeholders aiming to produce coffee with distinct and desired sensory profiles. Given the nuanced interplay of the sensory attributes discussed, it is evident that the evaluation of coffee’s quality is intricate. While individual factors like processing methods and variety play significant roles, it is also essential to consider how all these sensory attributes cumulatively affect the final perception of the coffee.
4.3. Capturing Coffee’s Entire Experience through a Singular Parameter
The exploration of coffee’s multifaceted nature through sensory evaluations has long captivated researchers and industry professionals alike. The aforementioned interrelations underscore the richness and complexity of coffee evaluation. While metrics like the total cup points offer a consolidated gauge of coffee quality, drawing on the aggregated sum of various sensory attributes, it is crucial to recognize the inherent trade-offs associated with such amalgamated assessments. Ref. [35] extensively investigated coffee’s aroma and identified over 800 volatile compounds contributing to its multifaceted olfactory profile [36]. This revelation accentuates how each sensory component carries its unique complexity, which could potentially be overshadowed when compressed into an overarching metric, like total cup points.
Furthermore, Ref. [4] emphasized the importance of acidity in coffee, detailing its various forms and origins. Acidity, often mistaken for sourness by consumers, plays a pivotal role in a coffee’s brightness and overall profile. Thus, when evaluating coffee through total cup points, the nuanced differences in acidity might get submerged within the overall score, potentially leading to an underestimation of its significance. Furthermore, while an integrated score like total cup points can streamline evaluations, especially for commercial purposes catering to a broader audience, it also poses a risk of oversimplifying the intricacies of each sensory attribute. Such compression might not always capture the layered subtleties, as noted by Ref. [30], who stressed the rich tapestry of flavors present in coffee. Therefore, while the holistic nature of a metric like total cup points is undoubtedly invaluable, allowing for standardization across the industry and easier comparative analyses, it is also paramount to appreciate and dissect the individual components that cumulatively contribute to the final perception [37,38,39]. Recognizing this duality ensures a more comprehensive and nuanced understanding of coffee’s rich sensory landscape.
5. Final Remarks
This study has meticulously delved into the intricate sensory dimensions of coffee, shedding light on the profound interplay between processing methods and coffee varieties. Our findings elucidate how certain combinations of these factors can either augment or, in some instances, diminish the quality attributes of coffee. The insights of esteemed scholars like Ref. [4] further underscore the importance of understanding individual attributes, such as acidity, within this context.
The evidence presented here suggests that the synthesis of processing methods and specific coffee varieties can lead to unprecedented flavors, aromas, and overall profiles, offering potential pathways to craft unique and high-quality coffee experiences. Conversely, some combinations might not yield the desired sensory outcomes, emphasizing the need for a nuanced approach in coffee production.
While aggregated metrics like the total cup points offer a consolidated lens through which coffee quality can be viewed, our research underscores the importance of a more detailed analysis. Such granularity is essential to fully appreciate the nuances that each sensory attribute and their interactions bring to the overall coffee experience. As the coffee industry continues to evolve, it is crucial for stakeholders to strike a balance between holistic evaluations and the depth of sensory examination. This balance will ensure that both the art and science of coffee evaluation progress in tandem, enabling producers to fine-tune their offerings and cater to the multifaceted demands of global coffee connoisseurs.
Funding
This research received no external funding.
Data Availability Statement
The information about the database and details regarding the analyzed data were presented in the Introduction and Materials and Methods sections of the manuscript. For data availability, we have followed the MDPI Research Data Policies, and all relevant data supporting our reported results can be found in the publicly archived datasets mentioned in the Materials and Methods section.
Acknowledgments
I express my gratitude to the team at Laboratorio Central de la Oficina de Calidades de Café-Almacafé S.A. I also thank Latte Que Late Coffee Shop for their valuable recommendation to undertake this study.
Conflicts of Interest
The author declares no conflicts of interest.
Appendix A
This supplementary section provides a meticulous exploration of the median values and range across all parameters from our exhaustive database. For clarity and streamlined navigation, we have strategically divided the tables. Initially, the data centers on the Arabica species, gradually shifting focus to Robusta as you delve deeper.

Table A1.
Quality attributes by country of origin for the Arabica coffee species of records across countries.
Table A1.
Quality attributes by country of origin for the Arabica coffee species of records across countries.
| Country of Origin | N | Aroma | Flavor | Acidity | Total Cup Points |
|---|---|---|---|---|---|
| Brazil | 132 | 7.5 (6.83–8.58) | 7.58 (6.58–8.5) | 7.5 (6.83–8.5) | 82.42 (70.67–88.83) |
| Burundi | 2 | 7.415 (7.08–7.75) | 7.46 (7.25–7.67) | 7.415 (7.33–7.5) | 81.83 (80.33–83.33) |
| China | 16 | 7.67 (6.92–8.25) | 7.625 (7.08–8.17) | 83.17 (78–87.25) | |
| Colombia | 183 | 7.67 (5.08–8.17) | 7.58 (7–8.08) | 7.58 (5.25–8.17) | 83.25 (72.83–86) |
| Costa Rica | 51 | 7.67 (6.33–8.17) | 7.5 (6.5–8.25) | 7.67 (6.83–8.17) | 83.25 (71.75–87.17) |
| Cote d’Ivoire | 1 | 7.42 (7.42–7.42) | 7.25 (7.25–7.25) | 7 (7–7) | 79.33 (79.33–79.33) |
| Ecuador | 1 | 7.5 (7.5–7.5) | 7.67 (7.67–7.67) | 7.75 (7.75–7.75) | 83.83 (83.83–83.83) |
| El Salvador | 21 | 7.67 (7.25–8.42) | 7.67 (7.08–8.17) | 7.67 (6.75–8.33) | 82.83 (79.67–85.58) |
| Ethiopia | 44 | 7.83 (7.25–8.75) | 7.96 (7.25–8.83) | 8 (7.33–8.75) | 85.205 (80–90.58) |
| Guatemala | 181 | 7.58 (6.17–8.42) | 7.5 (6.08–8.5) | 7.58 (7–8.42) | 82.5 (59.83–89.75) |
| Haiti | 6 | 7.17 (6.75–7.58) | 6.915 (6.58–7.5) | 7.21 (6.67–7.5) | 79 (67.92–83.33) |
| Honduras | 52 | 7.5 (6.67–8.17) | 7.46 (6.17–8.08) | 7.42 (6.5–8) | 81.67 (69.17–86.67) |
| India | 1 | 7.67 (7.67–7.67) | 7.33 (7.33–7.33) | 6.67 (6.67–6.67) | 76.83 (76.83–76.83) |
| Indonesia | 20 | 7.71 (6.92–8.33) | 7.58 (6.83–8.25) | 7.58 (6.08–8) | 82.665 (76.17–87.42) |
| Japan | 1 | 7.75 (7.75–7.75) | 7.75 (7.75–7.75) | 7.42 (7.42–7.42) | 84.67 (84.67–84.67) |
| Kenya | 25 | 7.83 (7–8.17) | 7.83 (7.08–8.17) | 7.75 (7.17–8.5) | 84.58 (79.83–86.25) |
| Laos | 3 | 7.42 (7.42–7.67) | 7.5 (7.33–7.67) | 7.33 (7.17–7.42) | 82 (80.83–82.67) |
| Malawi | 11 | 7.58 (7.33–7.75) | 7.42 (7.17–7.58) | 7.42 (7.08–7.58) | 81.58 (80.67–82.75) |
| Mauritius | 1 | 7.25 (7.25–7.25) | 7.25 (7.25–7.25) | 7.17 (7.17–7.17) | 80.5 (80.5–80.5) |
| Mexico | 236 | 7.5 (6.5–8.17) | 7.42 (6.33–8.25) | 7.42 (6.75–8.08) | 81.625 (68.33–87.17) |
| Myanmar | 8 | 7.21 (6.92–8) | 7.375 (7–7.58) | 7.42 (7–7.58) | 80.625 (80–81.83) |
| Nicaragua | 26 | 7.33 (6.83–7.92) | 7.29 (6.58–8.25) | 7.25 (6.25–8.33) | 80.835 (63.08–86.58) |
| Panama | 4 | 7.71 (7.25–8) | 7.585 (7.33–8) | 7.705 (7.33–8.08) | 84.125 (80.75–85.83) |
| P–NG 1 | 1 | 8.33 (8.33–8.33) | 8.42 (8.42–8.42) | 8.33 (8.33–8.33) | 85.75 (85.75–85.75) |
| Peru | 10 | 7.67 (7–8.42) | 7.665 (7.08–8.5) | 7.71 (7.25–8.5) | 82.795 (77–88.75) |
| Philippines | 5 | 7.25 (6.83–8.08) | 7.33 (6.5–7.58) | 7.33 (6.92–7.58) | 81.33 (75.83–82.92) |
| Rwanda | 1 | 7.83 (7.83–7.83) | 7.92 (7.92–7.92) | 7.83 (7.83–7.83) | 82.83 (82.83–82.83) |
| Taiwan | 75 | 7.5 (6.83–8.08) | 7.5 (6.75–8.17) | 7.33 (7–8.25) | 82 (77.67–86.58) |
| Tanzania | 40 | 7.58 (7.17–8.42) | 7.42 (7–8.17) | 7.46 (7.25–8) | 82.17 (80.33–86.5) |
| Thailand | 32 | 7.5 (6.83–7.92) | 7.54 (6.67–8.33) | 7.54 (7–8.42) | 82.67 (79.67–86.17) |
| Uganda | 26 | 7.92 (7.33–8.42) | 7.75 (6.92–8.17) | 7.67 (7.33–8.17) | 83.875 (81–86.83) |
| United States | 8 | 8 (7.42–8.25) | 8.29 (7.17–8.67) | 8.17 (7.42–8.5) | 87.165 (81.08–87.92) |
| USA–H 2 | 73 | 7.5 (6.92–8.33) | 7.58 (6.83–8.42) | 7.67 (6.67–8.25) | 82.75 (72.58–87.92) |
| USA–PR 3 | 4 | 7.67 (7.42–7.83) | 7.625 (7.08–7.83) | 7.625 (7.33–7.83) | 82.04 (79.08–83.75) |
| Vietnam | 7 | 7.58 (7–7.75) | 7.42 (7.08–8) | 7.5 (7.08–7.58) | 82.83 (80.17–83.17) |
| Zambia | 1 | 7.67 (7.67–7.67) | 7.08 (7.08–7.08) | 7.33 (7.33–7.33) | 81.92 (81.92–81.92) |
1 Papua New Guinea. 2 United States (Puerto Rico). 3 United States (Hawaii).
Table A2.
Quality attributes by country of origin for the Arabica coffee species of records across countries.
Table A2.
Quality attributes by country of origin for the Arabica coffee species of records across countries.
| Country of Origin | N | Aftertaste | Body | Balance | Uniformity |
|---|---|---|---|---|---|
| Brazil | 132 | 7.42 (6.58–8.42) | 7.5 (6.83–8.33) | 7.5 (6.42–8.33) | 10 (6–10) |
| Burundi | 2 | 7.25 (7.17–7.33) | 7.29 (7.08–7.5) | 7.415 (7.08–7.75) | 10 (10–10) |
| China | 16 | 7.46 (6.83–8.08) | 7.625 (7.17–7.92) | 7.625 (7–8) | 10 (9.33–10) |
| Colombia | 183 | 7.58 (6.75–8) | 7.67 (5.25–8.08) | 7.67 (7.17–8.58) | 10 (6.67–10) |
| Costa Rica | 51 | 7.5 (6.33–8) | 7.5 (6.33–8.08) | 7.67 (6.5–8.58) | 10 (6.67–10) |
| Cote d’Ivoire | 1 | 6.83 (6.83–6.83) | 7.33 (7.33–7.33) | 7.08 (7.08–7.08) | 9.33 (9.33–9.33) |
| Ecuador | 1 | 7.58 (7.58–7.58) | 7.83 (7.83–7.83) | 7.83 (7.83–7.83) | 10 (10–10) |
| El Salvador | 21 | 7.5 (7–8.17) | 7.58 (7.17–8) | 7.67 (7.17–8.42) | 10 (9.33–10) |
| Ethiopia | 44 | 7.83 (7.17–8.67) | 7.92 (7.33–8.58) | 7.92 (7.17–8.75) | 10 (8.67–10) |
| Guatemala | 181 | 7.33 (6.17–8.42) | 7.5 (6.33–8.33) | 7.5 (6.58–8.58) | 10 (8–10) |
| Haiti | 6 | 7.165 (6.42–7.67) | 7.205 (6.92–7.83) | 7.125 (6.67–7.42) | 10 (9.33–10) |
| Honduras | 52 | 7.21 (6.17–8.08) | 7.42 (6.5–8.08) | 7.33 (6.17–8) | 10 (8–10) |
| India | 1 | 7.17 (7.17–7.17) | 7.17 (7.17–7.17) | 7.42 (7.42–7.42) | 9.33 (9.33–9.33) |
| Indonesia | 20 | 7.46 (6.5–7.83) | 7.58 (6.92–8.5) | 7.54 (6.33–8.42) | 10 (9.33–10) |
| Japan | 1 | 7.75 (7.75–7.75) | 8.08 (8.08–8.08) | 7.83 (7.83–7.83) | 10 (10–10) |
| Kenya | 25 | 7.75 (7–8) | 7.75 (7.25–8) | 7.75 (7.25–8.5) | 10 (9.33–10) |
| Laos | 3 | 7.25 (7.17–7.42) | 7.42 (7.17–7.5) | 7.5 (7.25–7.5) | 10 (10–10) |
| Malawi | 11 | 7.33 (6.92–7.42) | 7.33 (7.08–7.58) | 7.42 (7.17–7.5) | 10 (10–10) |
| Mauritius | 1 | 7.17 (7.17–7.17) | 7.25 (7.25–7.25) | 7.17 (7.17–7.17) | 10 (10–10) |
| Mexico | 236 | 7.25 (6.17–8.17) | 7.42 (6.75–7.92) | 7.33 (6.5–8.75) | 10 (6–10) |
| Myanmar | 8 | 7.04 (7–7.5) | 7.29 (7.08–7.5) | 7.08 (6.92–7.33) | 10 (10–10) |
| Nicaragua | 26 | 7.17 (6.33–8) | 7.42 (6.42–8) | 7.25 (6.08–8.08) | 10 (6–10) |
| Panama | 4 | 7.665 (7.17–7.92) | 7.585 (7.33–7.83) | 7.875 (7.17–8.58) | 10 (10–10) |
| P–NG 1 | 1 | 7.83 (7.83–7.83) | 8 (8–8) | 8.25 (8.25–8.25) | 9.33 (9.33–9.33) |
| Peru | 10 | 7.54 (7–8.33) | 7.92 (7.42–8.25) | 7.58 (7.42–8.25) | 9.665 (8.67–10) |
| Philippines | 5 | 7.42 (6.5–7.67) | 7.33 (6.75–7.58) | 7.5 (7–7.5) | 10 (9.33–10) |
| Rwanda | 1 | 7.75 (7.75–7.75) | 7.75 (7.75–7.75) | 7.75 (7.75–7.75) | 9.33 (9.33–9.33) |
| Taiwan | 75 | 7.33 (6.58–8) | 7.5 (7–8.33) | 7.33 (6.92–8.25) | 10 (6.67–10) |
| Tanzania | 40 | 7.42 (7–8.17) | 7.5 (7.17–7.75) | 7.46 (7.08–8) | 10 (10–10) |
| Thailand | 32 | 7.5 (6.83–8.17) | 7.58 (7.08–8.17) | 7.5 (6.92–8.17) | 10 (8.67–10) |
| Uganda | 26 | 7.58 (7.17–8.17) | 7.67 (7.33–8.25) | 7.67 (7.42–7.92) | 10 (10–10) |
| United States | 8 | 8.125 (7.25–8.58) | 8.04 (7.25–8.25) | 8.04 (7.33–8.17) | 10 (10–10) |
| USA–H 2 | 73 | 7.5 (6.83–8.25) | 7.67 (6.75–8.25) | 7.67 (6.83–8.25) | 10 (6.67–10) |
| USA–PR 3 | 4 | 7.67 (6.75–7.83) | 7.665 (7.33–8) | 7.75 (6.92–8.17) | 9.665 (6.67–10) |
| Vietnam | 7 | 7.25 (7.08–7.58) | 7.58 (7.42–8.08) | 7.42 (7.08–8.58) | 10 (8.67–10) |
| Zambia | 1 | 7.42 (7.42–7.42) | 7.75 (7.75–7.75) | 7.42 (7.42–7.42) | 10 (10–10) |
1 Papua New Guinea. 2 United States (Puerto Rico). 3 United States (Hawaii).
Table A3.
Quality attributes by country of origin for the Arabica coffee species of records across countries.
Table A3.
Quality attributes by country of origin for the Arabica coffee species of records across countries.
| Country of Origin | N | Clean Cup | Sweetness | Cupper Points | Moisture |
|---|---|---|---|---|---|
| Brazil | 132 | 10 (6–10) | 10 (6.67–10) | 7.5 (6.67–8.5) | 0.11 (0–0.12) |
| Burundi | 2 | 10 (10–10) | 10 (10–10) | 7.58 (7.33–7.83) | 0.06 (0–0.12) |
| China | 16 | 10 (9.33–10) | 10 (9.33–10) | 7.67 (7.08–8.42) | 0.1 (0–0.17) |
| Colombia | 183 | 10 (6.67–10) | 10 (6.67–10) | 7.58 (6.92–8.5) | 0.08 (0–0.22) |
| Costa Rica | 51 | 10 (6.67–10) | 10 (6.67–10) | 7.67 (6.25–8.42) | 0.1 (0–0.13) |
| Cote d’Ivoire | 1 | 10 (10–10) | 10 (10–10) | 7.08 (7.08–7.08) | 0.13 (0.13–0.13) |
| Ecuador | 1 | 10 (10–10) | 10 (10–10) | 7.67 (7.67–7.67) | 0.09 (0.09–0.09) |
| El Salvador | 21 | 10 (9.33–10) | 10 (9.33–10) | 7.58 (7–8) | 0 (0–0.15) |
| Ethiopia | 44 | 10 (9.33–10) | 10 (8.67–10) | 8 (7.08–9) | 0.1 (0–0.2) |
| Guatemala | 181 | 10 (1.33–10) | 10 (1.33–10) | 7.42 (6–9.25) | 0.11 (0–0.17) |
| Haiti | 6 | 10 (5.33–10) | 10 (6–10) | 7.04 (6.42–7.83) | 0.11 (0.08–0.14) |
| Honduras | 52 | 10 (8–10) | 10 (8–10) | 7.33 (6.33–8.25) | 0.11 (0.09–0.13) |
| India | 1 | 10 (10–10) | 6.67 (6.67–6.67) | 7.42 (7.42–7.42) | 0 (0–0) |
| Indonesia | 20 | 10 (9.33–10) | 10 (9.33–10) | 7.54 (5.17–8.33) | 0.12 (0–0.15) |
| Japan | 1 | 10 (10–10) | 10 (10–10) | 8.08 (8.08–8.08) | 0.12 (0.12–0.12) |
| Kenya | 25 | 10 (9.33–10) | 10 (9.33–10) | 7.83 (5.42–8.17) | 0.11 (0–0.13) |
| Laos | 3 | 10 (10–10) | 10 (10–10) | 7.5 (7.33–7.58) | 0.12 (0–0.13) |
| Malawi | 11 | 10 (10–10) | 10 (10–10) | 7.33 (7.17–7.67) | 0.12 (0.12–0.13) |
| Mauritius | 1 | 10 (10–10) | 10 (10–10) | 7.25 (7.25–7.25) | 0.12 (0.12–0.12) |
| Mexico | 236 | 10 (0–10) | 10 (8–10) | 7.33 (6.42–8.58) | 0.12 (0–0.17) |
| Myanmar | 8 | 10 (10–10) | 10 (10–10) | 7.21 (6.83–7.42) | 0 (0–0.11) |
| Nicaragua | 26 | 10 (6–10) | 10 (6–10) | 7.25 (6.17–8.5) | 0.105 (0.07–0.18) |
| Panama | 4 | 10 (10–10) | 10 (10–10) | 7.705 (7.17–8) | 0.085 (0–0.11) |
| P–NG 1 | 1 | 9.33 (9.33–9.33) | 10 (10–10) | 7.92 (7.92–7.92) | 0.12 (0.12–0.12) |
| Peru | 10 | 10 (5.33–10) | 10 (9.33–10) | 7.5 (7–8.5) | 0.1 (0–0.12) |
| Philippines | 5 | 10 (10–10) | 10 (9.33–10) | 7.33 (6.67–7.5) | 0.11 (0–0.14) |
| Rwanda | 1 | 9.33 (9.33–9.33) | 9.33 (9.33–9.33) | 8 (8–8) | 0.11 (0.11–0.11) |
| Taiwan | 75 | 10 (9.33–10) | 10 (8.67–10) | 7.33 (5.25–10) | 0.11 (0–0.14) |
| Tanzania | 40 | 10 (10–10) | 10 (10–10) | 7.5 (7.08–8.17) | 0.12 (0–0.13) |
| Thailand | 32 | 10 (8.67–10) | 10 (9.33–10) | 7.5 (6.83–8.42) | 0.115 (0–0.28) |
| Uganda | 26 | 10 (10–10) | 10 (10–10) | 7.67 (7.42–8.17) | 0.12 (0–0.13) |
| United States | 8 | 10 (10–10) | 10 (10–10) | 8.17 (7.17–8.5) | 0 (0–0) |
| USA–H 2 | 73 | 10 (6.67–10) | 10 (6–10) | 7.58 (6.75–8.58) | 0.05 (0–0.13) |
| USA–PR 3 | 4 | 9.665 (9.33–10) | 10 (9.33–10) | 7.585 (6.92–8.5) | 0.06 (0–0.13) |
| Vietnam | 7 | 10 (10–10) | 10 (10–10) | 7.67 (7.25–8) | 0.07 (0–0.12) |
| Zambia | 1 | 10 (10–10) | 10 (10–10) | 7.25 (7.25–7.25) | 0 (0–0) |
1 Papua New Guinea. 2 United States (Puerto Rico). 3 United States (Hawaii).
Table A4.
Scores for acidity, aroma, and flavor of coffee varieties, delineated by various attributes and country of origin.
Table A4.
Scores for acidity, aroma, and flavor of coffee varieties, delineated by various attributes and country of origin.
| Variety | N | Acidity | Aroma | Flavor | Total Cup Points |
|---|---|---|---|---|---|
| Arusha | 5 | 7.25 (7–7.5) | 7.67 (7.08–7.75) | 7.5 (7.33–7.58) | 82.42 (80.75–83) |
| Blue Mountain | 1 | 7.75 (7.75–7.75) | 7.75 (7.75–7.75) | 7.58 (7.58–7.58) | 82.67 (82.67–82.67) |
| Bourbon | 223 | 7.58 (6.83–8.42) | 7.58 (6.17–8.5) | 7.5 (6.08–8.5) | 82.33 (68.33–89.75) |
| Catimor | 4 | 7.46 (7.42–7.67) | 7.585 (7.5–7.83) | 7.665 (7.42–7.75) | 83.67 (81.58–84.25) |
| Catuai | 69 | 7.5 (6.5–8.33) | 7.5 (6.67–8.5) | 7.5 (6.17–8) | 81.92 (59.83–85.83) |
| Caturra | 248 | 7.58 (5.25–8.25) | 7.67 (5.08–8.25) | 7.58 (6.5–8.33) | 83.17 (63.08–87.17) |
| Ethiopian Heirlooms | 1 | 7.5 (7.5–7.5) | 7.58 (7.58–7.58) | 7.58 (7.58–7.58) | 82.92 (82.92–82.92) |
| Ethiopian Yirgacheffe | 2 | 8 (7.83–8.17) | 8.125 (8.08–8.17) | 8 (7.83–8.17) | 85.96 (84.67–87.25) |
| Gesha | 2 | 7.79 (7.75–7.83) | 7.665 (7.5–7.83) | 7.835 (7.75–7.92) | 84.085 (84–84.17) |
| Hawaiian Kona | 44 | 7.58 (6.92–8) | 7.5 (6.92–8.08) | 7.5 (6.92–8.17) | 82.625 (72.58–86.25) |
| Marigojipe | 1 | 7.5 (7.5–7.5) | 7.33 (7.33–7.33) | 7.5 (7.5–7.5) | 81.58 (81.58–81.58) |
| Moka Peaberry | 1 | 7.83 (7.83–7.83) | 7.08 (7.08–7.08) | 7.5 (7.5–7.5) | 82.92 (82.92–82.92) |
| Mundo Novo | 32 | 7.5 (6.83–7.92) | 7.54 (6.75–8) | 7.5 (6.92–8) | 82 (71.08–85) |
| Other | 79 | 7.5 (6.75–8.58) | 7.58 (7.08–8.75) | 7.42 (6.5–8.67) | 82.5 (75.17–89.92) |
| Pacamara | 8 | 7.67 (7–8.08) | 7.665 (7.33–7.92) | 7.71 (7.25–8.17) | 83.335 (75.5–85.33) |
| Pacas | 13 | 7.67 (6.83–7.92) | 7.58 (6.83–7.75) | 7.5 (6.83–7.83) | 82.33 (73.42–84.58) |
| Peaberry | 5 | 7.58 (7–7.92) | 7.67 (7.17–7.83) | 7.25 (7–7.83) | 81.42 (79.67–84.58) |
| Ruiru 11 | 2 | 7.545 (7.42–7.67) | 7.71 (7.67–7.75) | 7.46 (7.25–7.67) | 82.96 (82.42–83.5) |
| SL14 | 17 | 7.67 (7.33–8.17) | 7.83 (7.33–8.42) | 7.67 (6.92–8.17) | 83.42 (81–86.83) |
| SL28 | 14 | 7.75 (7.5–8.5) | 7.75 (7.17–8.08) | 7.75 (7.58–8.17) | 84.25 (80.92–86.08) |
| SL34 | 8 | 8 (7.17–8.25) | 7.875 (7–8.08) | 7.83 (7.08–8.08) | 84.875 (79.83–86.25) |
| Sumatra | 1 | 8.25 (8.25–8.25) | 8 (8–8) | 8 (8–8) | 86.58 (86.58–86.58) |
| Typica | 200 | 7.42 (6.75–8.33) | 7.5 (6.67–8.08) | 7.42 (6.33–8.17) | 81.54 (70.75–85.33) |
| Yellow Bourbon | 35 | 7.5 (6.92–8) | 7.42 (6.92–8.42) | 7.58 (7–8) | 82.42 (78–86.17) |
Table A5.
Scores for aftertaste, body, balance, and uniformity of coffee varieties, delineated by various attributes and country of origin.
Table A5.
Scores for aftertaste, body, balance, and uniformity of coffee varieties, delineated by various attributes and country of origin.
| Variety | N | Aftertaste | Body | Balance | Uniformity |
|---|---|---|---|---|---|
| Arusha | 5 | 7.42 (7.17–7.5) | 7.5 (7.33–7.75) | 7.58 (7.42–7.75) | 10 (10–10) |
| Blue Mountain | 1 | 7.25 (7.25–7.25) | 7.67 (7.67–7.67) | 7.58 (7.58–7.58) | 10 (10–10) |
| Bourbon | 223 | 7.33 (6.17–8.42) | 7.5 (6.33–8.33) | 7.5 (6.5–8.42) | 10 (8–10) |
| Catimor | 4 | 7.625 (7.08–7.75) | 7.71 (7.5–7.83) | 7.67 (7.33–7.83) | 10 (10–10) |
| Catuai | 69 | 7.33 (6.17–8) | 7.42 (6.5–7.92) | 7.42 (6.17–8) | 10 (8–10) |
| Caturra | 248 | 7.5 (6.33–8.08) | 7.58 (6.33–8.17) | 7.58 (6.08–8.58) | 10 (6–10) |
| Ethiopian Heirlooms | 1 | 7.5 (7.5–7.5) | 7.58 (7.58–7.58) | 7.58 (7.58–7.58) | 10 (10–10) |
| Ethiopian Yirgacheffe | 2 | 7.875 (7.75–8) | 7.83 (7.58–8.08) | 8 (7.67–8.33) | 10 (10–10) |
| Gesha | 2 | 7.625 (7.58–7.67) | 7.54 (7.33–7.75) | 7.79 (7.75–7.83) | 10 (10–10) |
| Hawaiian Kona | 44 | 7.5 (6.83–8) | 7.67 (6.92–8.08) | 7.67 (6.83–8.25) | 10 (6.67–10) |
| Marigojipe | 1 | 7.25 (7.25–7.25) | 7.5 (7.5–7.5) | 7.17 (7.17–7.17) | 10 (10–10) |
| Moka Peaberry | 1 | 7.5 (7.5–7.5) | 7.75 (7.75–7.75) | 7.67 (7.67–7.67) | 10 (10–10) |
| Mundo Novo | 32 | 7.375 (6.67–7.83) | 7.46 (7.08–7.83) | 7.46 (7–8) | 10 (9.33–10) |
| Other | 79 | 7.42 (6.58–8.5) | 7.5 (7–8.42) | 7.5 (6.83–8.58) | 10 (8.67–10) |
| Pacamara | 8 | 7.545 (6.92–7.83) | 7.46 (7.17–7.83) | 7.54 (6.83–8.58) | 10 (8–10) |
| Pacas | 13 | 7.25 (6.67–7.67) | 7.42 (7–7.75) | 7.5 (6.83–7.83) | 10 (8–10) |
| Peaberry | 5 | 7.33 (7–7.83) | 7.58 (7.17–7.92) | 7.42 (6.92–7.83) | 10 (10–10) |
| Ruiru 11 | 2 | 7.5 (7.42–7.58) | 7.67 (7.67–7.67) | 7.5 (7.42–7.58) | 10 (10–10) |
| SL14 | 17 | 7.58 (7.17–8.17) | 7.67 (7.33–8.25) | 7.67 (7.42–7.92) | 10 (10–10) |
| SL28 | 14 | 7.71 (7.42–8) | 7.75 (7.25–8) | 7.75 (7.5–8.5) | 10 (9.33–10) |
| SL34 | 8 | 7.75 (7–8) | 7.875 (7.25–8) | 7.75 (7.25–7.92) | 10 (10–10) |
| Sumatra | 1 | 8 (8–8) | 8 (8–8) | 8.17 (8.17–8.17) | 10 (10–10) |
| Typica | 200 | 7.33 (6.17–8) | 7.42 (6.75–8.33) | 7.33 (6.58–8.25) | 10 (6–10) |
| Yellow Bourbon | 35 | 7.42 (6.83–8) | 7.5 (6.92–8.33) | 7.5 (7.17–8.17) | 10 (6.67–10) |
Table A6.
Scores for clean cup, sweetness, cupper points, and moisture of coffee varieties, delineated by various attributes and country of origin.
Table A6.
Scores for clean cup, sweetness, cupper points, and moisture of coffee varieties, delineated by various attributes and country of origin.
| Variety | N | Clean Cup | Sweetness | Cupper Points | Moisture |
|---|---|---|---|---|---|
| Arusha | 5 | 10 (10–10) | 10 (10–10) | 7.5 (6.92–7.75) | 0.11 (0–0.13) |
| Blue Mountain | 1 | 10 (10–10) | 10 (10–10) | 7.08 (7.08–7.08) | 0 (0–0) |
| Bourbon | 223 | 10 (0–10) | 10 (6.67–10) | 7.5 (6–9.25) | 0.11 (0–0.16) |
| Catimor | 4 | 10 (10–10) | 10 (10–10) | 7.75 (7.33–8) | 0.115 (0.1–0.13) |
| Catuai | 69 | 10 (1.33–10) | 10 (1.33–10) | 7.42 (6.33–8.17) | 0.11 (0–0.13) |
| Caturra | 248 | 10 (6–10) | 10 (6–10) | 7.58 (6.17–8.5) | 0.11 (0–0.13) |
| Ethiopian Heirlooms | 1 | 10 (10–10) | 10 (10–10) | 7.58 (7.58–7.58) | 0 (0–0) |
| Ethiopian Yirgacheffe | 2 | 10 (10–10) | 10 (10–10) | 8.125 (7.92–8.33) | 0.05 (0–0.1) |
| Gesha | 2 | 10 (10–10) | 10 (10–10) | 7.835 (7.75–7.92) | 0.105 (0.1–0.11) |
| Hawaiian Kona | 44 | 10 (6.67–10) | 10 (6.67–10) | 7.5 (6.92–8.33) | 0.1 (0–0.12) |
| Marigojipe | 1 | 10 (10–10) | 10 (10–10) | 7.33 (7.33–7.33) | 0.11 (0.11–0.11) |
| Moka Peaberry | 1 | 10 (10–10) | 10 (10–10) | 7.58 (7.58–7.58) | 0.11 (0.11–0.11) |
| Mundo Novo | 32 | 10 (2.67–10) | 10 (9.33–10) | 7.42 (6.58–8) | 0.12 (0–0.14) |
| Other | 79 | 10 (6.67–10) | 10 (8–10) | 7.5 (6.58–8.58) | 0.12 (0–0.13) |
| Pacamara | 8 | 10 (8–10) | 10 (10–10) | 7.75 (6.83–7.83) | 0.115 (0–0.14) |
| Pacas | 13 | 10 (8–10) | 10 (8–10) | 7.33 (6.67–7.83) | 0.11 (0–0.13) |
| Peaberry | 5 | 10 (10–10) | 10 (10–10) | 7.17 (6.83–7.92) | 0.01 (0–0.11) |
| Ruiru 11 | 2 | 10 (10–10) | 10 (10–10) | 7.58 (7.58–7.58) | 0.13 (0.13–0.13) |
| SL14 | 17 | 10 (10–10) | 10 (10–10) | 7.67 (7.42–8.17) | 0.12 (0.1–0.12) |
| SL28 | 14 | 10 (9.33–10) | 10 (9.33–10) | 7.79 (5.42–8.17) | 0.11 (0–0.11) |
| SL34 | 8 | 10 (10–10) | 10 (10–10) | 7.83 (7.08–8.08) | 0.055 (0–0.13) |
| Sumatra | 1 | 10 (10–10) | 10 (10–10) | 8.17 (8.17–8.17) | 0 (0–0) |
| Typica | 200 | 10 (2.67–10) | 10 (8–10) | 7.33 (5.25–8.17) | 0.11 (0–0.17) |
| Yellow Bourbon | 35 | 10 (9.33–10) | 10 (9.33–10) | 7.58 (7–8.25) | 0.08 (0–0.12) |
Table A7.
Processing method and attributes per country of origin.
| Processing Method | N | Acidity | Flavor | Aroma | Total Cup Points |
|---|---|---|---|---|---|
| Natural/dry | 251 | 7.58 (6.08–8.5) | 7.58 (6.58–8.67) | 7.58 (6.75–8.58) | 82.75 (67.92–89) |
| Other | 26 | 7.46 (6.25–7.92) | 7.46 (6.58–7.83) | 7.46 (7.17–7.83) | 81.83 (63.08–84.67) |
| Pulped natural/honey | 14 | 7.5 (7.17–8.25) | 7.54 (7.17–8) | 7.5 (7.17–8) | 82.665 (80.08–86.58) |
| Semi-washed/semi-pulped | 56 | 7.5 (7–8.08) | 7.54 (6.92–8.17) | 7.58 (7.08–8.5) | 82.5 (78.75–86.08) |
| Washed/wet | 812 | 7.5 (5.25–8.75) | 7.5 (6.08–8.83) | 7.58 (5.08–8.75) | 82.42 (59.83–90.58) |
Table A8.
Processing method and attributes per country of origin.
| Processing Method | N | Aftertaste | Body | Balance | Uniformity |
|---|---|---|---|---|---|
| Natural/dry | 251 | 7.5 (6.42–8.5) | 7.58 (6.83–8.5) | 7.58 (6.33–8.58) | 10 (6–10) |
| Other | 26 | 7.42 (6.33–7.83) | 7.42 (6.42–7.92) | 7.46 (6.08–8.58) | 10 (6–10) |
| Pulped natural/honey | 14 | 7.54 (7–8) | 7.625 (7.25–8.08) | 7.46 (7.17–8.17) | 10 (10–10) |
| Semi-washed/semi-pulped | 56 | 7.5 (6.92–8) | 7.5 (7.08–8.33) | 7.5 (7–8.25) | 10 (8.67–10) |
| Washed/wet | 812 | 7.42 (6.17–8.67) | 7.5 (6.33–8.5) | 7.5 (6.17–8.58) | 10 (6–10) |
Table A9.
Processing method and attributes per country of origin.
| Processing Method | N | Clean Cup | Sweetness | Cupper Points | Moisture |
|---|---|---|---|---|---|
| Natural/dry | 251 | 10 (6–10) | 10 (6–10) | 7.58 (5.25–8.67) | 0.11 (0–0.15) |
| Other | 26 | 10 (6–10) | 10 (6–10) | 7.42 (5.17–8) | 0.11 (0–0.13) |
| Pulped natural/honey | 14 | 10 (10–10) | 10 (10–10) | 7.5 (7.08–8.17) | 0.11 (0–0.12) |
| Semi-washed/semi-pulped | 56 | 10 (9.33–10) | 10 (9.33–10) | 7.5 (7–8.42) | 0.11 (0–0.14) |
| Washed/wet | 812 | 10 (0–10) | 10 (1.33–10) | 7.5 (5.42–8.75) | 0.11 (0–0.17) |
Table A10.
Quality attributes by country of origin for the Robusta coffee species. Median and range provided in parentheses.
Table A10.
Quality attributes by country of origin for the Robusta coffee species. Median and range provided in parentheses.
| Country of Origin | N | Acidity | Aroma | Flavor | Total Cup Points |
|---|---|---|---|---|---|
| India | 14 | 7.75 (7.17–8) | 7.67 (7.42–8) | 7.75 (6.83–7.92) | 81.58 (75.08–83.5) |
| Uganda | 10 | 7.75 (7.5–7.92) | 7.83 (7.33–8.33) | 7.79 (7.42–8.08) | 81.625 (80.5–83.75) |
Table A11.
Quality attributes by country of origin for the Robusta coffee species. Median and range provided in parentheses.
Table A11.
Quality attributes by country of origin for the Robusta coffee species. Median and range provided in parentheses.
| Country of Origin | N | Aftertaste | Aroma | Balance | Uniformity |
|---|---|---|---|---|---|
| India | 14 | 7.67 (6.75–7.92) | 7.67 (7.42–8) | 7.71 (7–8) | 10 (9.33–10) |
| Uganda | 10 | 7.75 (7.33–7.92) | 7.83 (7.33–8.33) | 7.67 (7.5–7.92) | 10 (10–10) |
Table A12.
Quality attributes by country of origin for the Robusta coffee species. Median and range provided in parentheses.
Table A12.
Quality attributes by country of origin for the Robusta coffee species. Median and range provided in parentheses.
| Country of Origin | N | Clean Cup | Sweetness | Cupper Points | Moisture |
|---|---|---|---|---|---|
| India | 14 | 10 (9.33–10) | 7.75 (7.08–8) | 7.83 (6.92–8.33) | 0 (0–0.13) |
| Uganda | 10 | 10 (10–10) | 7.71 (7.58–8) | 7.71 (7.42–8.08) | 0.12 (0.11–0.12) |
References
- Avelino, J.; Barboza, B.; Araya, J.C.; Fonseca, C.; Davrieux, F.; Guyot, B.; Cilas, C. Effects of slope exposure, altitude and yield on coffee quality in two altitude terroirs of Costa Rica, Orosi and Santa María de Dota. J. Sci. Food Agric. 2005, 85, 1869–1876. [Google Scholar] [CrossRef]
- Haile, M. The harvest and post-harvest management practices’ impact on coffee quality. In Coffee-Production and Research; IntechOpen: London, UK, 2019; pp. 1–18. [Google Scholar]
- Bertrand, B.; Vaast, P.; Alpizar, E.; Etienne, H.; Davrieux, F.; Charmetant, P. Comparison of bean biochemical composition and beverage quality of Arabica hybrids involving Sudanese-Ethiopian origins with traditional varieties at various elevations in Central America. Tree Physiol. 2006, 26, 1239–1248. [Google Scholar]
- Frank, O.; Blumberg, S.; Kunert, C.; Zehentbauer, G.; Hofmann, T. Structure determination and sensory analysis of bitter-tasting 4-vinylcatechol oligomers and their identification in roasted coffee by means of LC-MS/MS. J. Agric. Food Chem. 2007, 55, 1945–1954. [Google Scholar] [CrossRef]
- Bhumiratana, N.; Adhikari, K.; Chambers, E. Evolution of sensory aroma attributes from coffee beans to brewed coffee. LWT Food Sci. Technol. 2011, 44, 2185–2192. [Google Scholar] [CrossRef]
- Choi, M.; Choi, W.; Park, J.; Lim, J.; Kwon, S. Determination of coffee origins by integrated metabolomic approach of combining multiple analytical data. Food Chem. 2010, 121, 1260–1268. [Google Scholar] [CrossRef]
- Silva, S.; Queiroz, D.; Ferreira, W.; Corrêa, P.; Rufino, J. Mapping the potential beverage quality of coffee produced in the Zona da Mata, Minas Gerais, Brazil. J. Sci. Food Agric. 2016, 96, 3098–3108. [Google Scholar] [CrossRef] [PubMed]
- Oberthür, T.; Läderach, P.; Posada, H.; Fisher, M.; Samper, L.; Illera, J.; Collet, L.; Moreno, E.; Alarcón, R.; Villegas, A.; et al. Regional relationships between inherent coffee quality and growing environment for denomination of origin labels in Nariño and Cauca, Colombia. Food Policy 2011, 36, 783–794. [Google Scholar] [CrossRef]
- Ponte, S. The ‘Latte Revolution’? Regulation, Markets and Consumption in the Global Coffee Chain. World Dev. 2002, 30, 1099–1122. [Google Scholar] [CrossRef]
- van Keulen, M.; Kirchherr, J. The implementation of the Circular Economy: Barriers and enablers in the coffee value chain. J. Clean. Prod. 2021, 281, 125033. [Google Scholar] [CrossRef]
- Mora-Plazas, M.; Gómez, L.; Miles, D.; Parra, D.; Taillie, L. Nutrition Quality of Packaged Foods in Bogotá, Colombia: A Comparison of Two Nutrient Profile Models. Nutrients 2019, 11, 1011. [Google Scholar] [CrossRef]
- Durevall, D. Demand for coffee in Sweden: The role of prices, preferences and market power. Food Policy 2007, 32, 566–584. [Google Scholar] [CrossRef]
- Velásquez, S.; Banchón, C. Influence of pre-and post-harvest factors on the organoleptic and physicochemical quality of coffee: A short review. J. Food Sci. Technol. 2022, 60, 2526–2538. [Google Scholar] [CrossRef]
- Pendergrast, M. Uncommon Grounds: The History of Coffee and How It Transformed Our World; Basic Books: New York, NY, USA, 2010. [Google Scholar]
- Wild, A. Coffee: A Dark History; WW Norton & Company: New York, NY, USA, 2005. [Google Scholar]
- Kinro, G.Y. A Cup of Aloha: The Kona Coffee Epic; University of Hawaii Press: Honolulu, HI, USA, 2003. [Google Scholar]
- Fernandes, E.A.D.N.; Sarries, G.A.; Mazola, Y.T.; De Lima, R.C.; Furlan, G.N.; Bacchi, M.A. Machine learning to support geographical origin traceability of Coffea Arabica. Adv. Artif. Intell. Mach. Learn. 2022, 2, 273–287. [Google Scholar] [CrossRef]
- Bates, D.; Mächler, M.; Bolker, B.; Walker, S. Fitting linear mixed-effects models using lme4. arXiv 2014, arXiv:1406.5823. [Google Scholar]
- Belchior, V.; Botelho, B.; Casal, S.; Oliveira, L.; Franca, A. FTIR and Chemometrics as Effective Tools in Predicting the Quality of Specialty Coffees. Food Anal. Methods 2020, 13, 275–283. [Google Scholar] [CrossRef]
- Mitiku, F.; Nyssen, J.; Maertens, M. Certification of semi-forest coffee as a land-sharing strategy in Ethiopia. Ecol. Econ. 2018, 145, 194–204. [Google Scholar] [CrossRef]
- Gove, A.; Hyler, K.; Nemomisa, S.; Shimelis, A. Ethiopian coffee cultivation—Implications for bird conservation and environmental certification. Conserv. Lett. 2008, 1, 208–216. [Google Scholar] [CrossRef]
- Rijsbergen, B.; Elbers, W.; Ruben, R.; Njuguna, S. The ambivalent impact of coffee certification on farmers’ welfare: A matched panel approach for cooperatives in Central Kenya. World Dev. 2016, 77, 277–292. [Google Scholar] [CrossRef]
- Ceballos-Sierra, F.; Dall’erba, S. The effect of climate variability on Colombian coffee productivity: A dynamic panel model approach. Agric. Syst. 2021, 190, 103126. [Google Scholar] [CrossRef]
- Almeida, L.; Zylbersztajn, D. Key Success Factors in the Brazilian Coffee Agrichain: Present and Future Challenges. Int. J. Food Syst. Dyn. 2017, 8, 45–53. [Google Scholar] [CrossRef]
- Mussatto, S.I.; Machado, E.M.S.; Martins, S.; Teixeira, J.A. Production, Composition, and Application of Coffee and Its Industrial Residues. Food Bioprocess Technol. 2011, 4, 661–672. [Google Scholar] [CrossRef]
- Yang, S.; Li, C.; Mei, Y.; Liu, W.; Liu, R.; Chen, W.; Xu, K. Determination of the Geographical Origin of Coffee Beans Using Terahertz Spectroscopy Combined with Machine Learning Methods. Front. Nutr. 2021, 8, 627. [Google Scholar] [CrossRef]
- Zakidou, P.; Plati, F.; Matsakidou, A.; Varka, E.-M.; Blekas, G.; Paraskevopoulou, A. Single Origin Coffee Aroma: From Optimized Flavor Protocols and Coffee Customization to Instrumental Volatile Characterization and Chemometrics. Molecules 2021, 26, 4609. [Google Scholar] [CrossRef]
- Várady, M.; Hrušková, T.; Popelka, P. Effect of preparation method and roasting temperature on total polyphenol content in coffee beverages. Czech J. Food Sci. 2020, 38, 417–421. [Google Scholar]
- Donfrancesco, B.; Guzmán, N.; Chambers, E. Similarities and differences in sensory properties of high quality Arabica coffee in a small region of Colombia. Food Res. Int. 2019, 116, 645–651. [Google Scholar] [CrossRef] [PubMed]
- Clarke, R.; Vitzthum, O. Coffee: Recent Developments; John Wiley & Sons: Hoboken, NJ, USA, 2008. [Google Scholar]
- Münchow, M.; Alstrup, J.; Steen, I.; Giacalone, D. Roasting Conditions and Coffee Flavor: A Multi-Study Empirical Investigation. Beverages 2020, 6, 29. [Google Scholar] [CrossRef]
- Carvalho Neto, D.P.d.; Gonot-Schoupinsky, X.P.; Gonot-Schoupinsky, F.N. Coffee as a Naturally Beneficial and Sustainable Ingredient in Personal Care Products: A Systematic Scoping Review of the Evidence. Front. Sustain. 2021, 2, 697092. [Google Scholar] [CrossRef]
- Yeager, S.E.; Batali, M.E.; Guinard, J.-X.; Ristenpart, W.D. Acids in coffee: A review of sensory measurements and meta-analysis of chemical composition. Crit. Rev. Food Sci. Nutr. 2023, 63, 1010–1036. [Google Scholar] [CrossRef]
- Seninde, D.R.; Chambers, E. Coffee Flavor: A Review. Beverages 2020, 6, 44. [Google Scholar] [CrossRef]
- Semmelroch, P.; Grosch, W. Studies on Character Impact Odorants of Coffee Brews. J. Agric. Food Chem. 1996, 44, 537–543. [Google Scholar] [CrossRef]
- Flament, I. Coffee Flavor Chemistry; John Wiley & Sons: Hoboken, NJ, USA, 2001. [Google Scholar]
- Poole, R.; Ewings, S.; Parkes, J.; Fallowfield, J.; Roderick, P. Misclassification of coffee consumption data and the development of a standardised coffee unit measure. BMJ Nutr. Prev. Health 2019, 2, 11–19. [Google Scholar] [CrossRef] [PubMed]
- Livio, J.; Hodhod, R. AI Cupper: A Fuzzy Expert System for Sensorial Evaluation of Coffee Bean Attributes to Derive Quality Scoring. IEEE Trans. Fuzzy Syst. 2018, 26, 3418–3427. [Google Scholar] [CrossRef]
- Rice, R. A place unbecoming: The coffee farm of northern Latin America. Geogr. Rev. 1999, 89, 554–579. [Google Scholar] [CrossRef]
Figure 1.
Scores of the flavor (A), aroma (B), and acidity (C) attributes relative to country of origin, ordered from lowest to highest.
Figure 1.
Scores of the flavor (A), aroma (B), and acidity (C) attributes relative to country of origin, ordered from lowest to highest.

Figure 2.
Scores of the total cup points by country of origin, ordered from lowest to highest, showcasing comparative coffee quality across different regions.
Figure 2.
Scores of the total cup points by country of origin, ordered from lowest to highest, showcasing comparative coffee quality across different regions.

Table 1.
Quality attributes by country of origin for the Arabica coffee species. Median and range scores are presented in parentheses. N represents the number of records across countries.
Table 1.
Quality attributes by country of origin for the Arabica coffee species. Median and range scores are presented in parentheses. N represents the number of records across countries.
| Country of Origin | N | Acidity | Aroma | Flavor | Total Cup Points |
|---|---|---|---|---|---|
| Brazil | 132 | 7.5 (6.83–8.5) | 7.5 (6.83–8.58) | 7.58 (6.5–8.5) | 82.4 (70.6–88.8) |
| Colombia | 183 | 7.58 (5.2–8.1) | 7.67 (5.08–8.17) | 7.58 (7–8.08) | 83.2 (72.8–8) |
| Costa Rica | 51 | 7.67 (6.8–8.1) | 7.67 (6.33–8.17) | 7.5 (6.5–8.2) | 83.2 (71.7–87.1) |
| El Salvador | 21 | 7.67 (6.75–8.3) | 7.67 (7.25–8.42) | 7.67 (7.08–8.17) | 82.8 (79.6–85.5) |
| Ethiopia | 44 | 8 (7.33–8.75) | 7.83 (7.25–8.75) | 7.96 (7.25–8.83) | 85.2 (80–90.5) |
| Guatemala | 181 | 7.58 (7–8.42) | 7.58 (6.17–8.42) | 7.5 (6.08–8.5) | 82.5 (59.8–89.7) |
| Honduras | 52 | 7.42 (6.5–8) | 7.5 (6.67–8.17) | 7.46 (6.17–8.08) | 81.6 (69.1–86.6) |
| Indonesia | 20 | 7.58 (6.08–8) | 7.71 (6.92–8.33) | 7.58 (6.83–8.25) | 82.6 (76.1–87.4) |
| Kenya | 25 | 7.75 (7.17–8.5) | 7.83 (7–8.17) | 7.83 (7.08–8.17) | 84.5 (79.8–86.2) |
| Mexico | 236 | 7.42 (6.75–8.08) | 7.5 (6.5–8.17) | 7.42 (6.33–8.25) | 81.62 (68.3–87.1) |
| Nicaragua | 26 | 7.25 (6.25–8.33) | 7.33 (6.83–7.92) | 7.29 (6.58–8.25) | 80.83 (63.0–86.5) |
| Taiwan | 75 | 7.33 (7–8.25) | 7.5 (6.83–8.08) | 7.5 (6.75–8.17) | 82 (77.6–86.5) |
| Tanzania | 40 | 7.46 (7.25–8) | 7.58 (7.17–8.42) | 7.42 (7–8.17) | 82.1 (80.3–86.5) |
| Thailand | 32 | 7.54 (7–8.42) | 7.5 (6.83–7.92) | 7.54 (6.67–8.33) | 82.6 (79.6–86.1) |
| Uganda | 26 | 7.67 (7.33–8.17) | 7.92 (7.33–8.42) | 7.75 (6.92–8.17) | 83.8 (81–86.8) |
| Hawaii | 73 | 7.67 (6.67–8.25) | 7.5 (6.92–8.33) | 7.58 (6.83–8.42) | 82.7 (72.5–87.9) |
Table 2.
Scores for acidity, aroma, and flavor of coffee varieties, delineated by various attributes and country of origin. Scores are presented as median and range (in parentheses). N represents the number of records across countries.
Table 2.
Scores for acidity, aroma, and flavor of coffee varieties, delineated by various attributes and country of origin. Scores are presented as median and range (in parentheses). N represents the number of records across countries.
| Variety | N | Acidity | Aroma | Flavor | Total Cup Points |
|---|---|---|---|---|---|
| Bourbon | 223 | 7.58 (6.83–8.42) | 7.58 (6.17–8.5) | 7.5 (6.08–8.5) | 82.33 (68.33–89.75) |
| Catuai | 69 | 7.5 (6.5–8.33) | 7.5 (6.67–8.5) | 7.5 (6.17–8) | 81.92 (59.83–85.83) |
| Caturra | 248 | 7.58 (5.25–8.2) | 7.67 (5.08–8.25) | 7.58 (6.5–8.33) | 83.17 (63.08–87.17) |
| Hawaiian Kona | 44 | 7.58 (6.92–8) | 7.5 (6.92–8.08) | 7.5 (6.92–8.17) | 82.625 (72.58–86.25) |
| Mundo Novo | 32 | 7.5 (6.83–7.92) | 7.54 (6.75–8) | 7.5 (6.92–8) | 82 (71.08–85) |
| Other | 79 | 7.5 (6.75–8.58) | 7.58 (7.08–8.75) | 7.42 (6.5–8.67) | 82.5 (75.17–89.92) |
| Typica | 200 | 7.42 (6.75–8.3) | 7.5 (6.67–8.08) | 7.42 (6.33–8.17) | 81.54 (70.75–85.33) |
| Yellow Bourbon | 35 | 7.5 (6.92–8) | 7.42 (6.92–8.42) | 7.58 (7–8) | 82.42 (78–86.17) |
Table 3.
Scores of coffee processing method based on different attributes. Median and range in parenthesis. N represent the number of records across countries.
Table 3.
Scores of coffee processing method based on different attributes. Median and range in parenthesis. N represent the number of records across countries.
| Processing Method | N | Acidity | Aroma | Flavor | Total Cup Points |
|---|---|---|---|---|---|
| Natural/Dry | 251 | 7.58 (6.08–8.5) | 7.58 (6.75–8.58) | 7.58 (6.58–8.67) | 82.75 (67.92–89) |
| Other | 26 | 7.46 (6.25–7.92) | 7.46 (7.17–7.83) | 7.46 (6.58–7.83) | 81.83 (63.08–84.67) |
| PN/H | 14 | 7.5 (7.17–8.25) | 7.5 (7.17–8) | 7.54 (7.17–8) | 82.665 (80.08–86.58) |
| SW/SP | 56 | 7.5 (7–8.08) | 7.58 (7.08–8.5) | 7.54 (6.92–8.17) | 82.5 (78.75–86.08) |
| Washed/Wet | 812 | 7.5 (5.25–8.75) | 7.58 (5.08–8.75) | 7.5 (6.08–8.83) | 82.42 (59.83–90.58) |
PN/H: pulped natural/honey; SW/SP: semi-washed/semi-pulped.
Table 4.
Quality attributes by country of origin for the Robusta coffee species. Median and range provided in parentheses. N represents the number of records across countries.
Table 4.
Quality attributes by country of origin for the Robusta coffee species. Median and range provided in parentheses. N represents the number of records across countries.
| Country of Origin | N | Acidity | Aroma | Flavor | Total Cup Points |
|---|---|---|---|---|---|
| India | 14 | 7.75 (7.17–8) | 7.67 (7.42–8) | 7.75 (6.83–7.92) | 81.58 (75.08–83.5) |
| Uganda | 10 | 7.75 (7.5–7.92) | 7.83 (7.33–8.33) | 7.79 (7.42–8.08) | 81.625 (80.5–83.75) |
Disclaimer/Publisher’s Note: The statements, opinions and data contained in all publications are solely those of the individual author(s) and contributor(s) and not of MDPI and/or the editor(s). MDPI and/or the editor(s) disclaim responsibility for any injury to people or property resulting from any ideas, methods, instructions or products referred to in the content. |
© 2024 by the author. Licensee MDPI, Basel, Switzerland. This article is an open access article distributed under the terms and conditions of the Creative Commons Attribution (CC BY) license (https://creativecommons.org/licenses/by/4.0/).
Share and Cite
MDPI and ACS Style
Teran, E. Enhancement of Coffee Quality Attributes by Combining Processing Methods and Varieties. Beverages 2024, 10, 10. https://doi.org/10.3390/beverages10010010
AMA Style
Teran E. Enhancement of Coffee Quality Attributes by Combining Processing Methods and Varieties. Beverages. 2024; 10(1):10. https://doi.org/10.3390/beverages10010010
Chicago/Turabian StyleTeran, Emiliano. 2024. "Enhancement of Coffee Quality Attributes by Combining Processing Methods and Varieties" Beverages 10, no. 1: 10. https://doi.org/10.3390/beverages10010010
Note that from the first issue of 2016, this journal uses article numbers instead of page numbers. See further details here.