Article

A Rapid Method to Predict Beer Shelf Life Using an MS-Based e-Nose

Department of Analytical Chemistry and Organic Chemistry, Chemometrics and Sensorics for Analytical Solutions (CHEMOSENS), Universitat Rovira i Virgili, Campus Sescelades, 43007 Tarragona, Spain
*
Author to whom correspondence should be addressed.
Beverages 2024, 10(1), 11; https://doi.org/10.3390/beverages10010011
Submission received: 2 November 2023 / Revised: 16 January 2024 / Accepted: 17 January 2024 / Published: 22 January 2024
(This article belongs to the Section Malting, Brewing and Beer)

Abstract

:
A rapid and efficient technique was applied, which used an electronic nose based on a mass detector (MS-based e-nose) combined with headspace solid-phase microextraction sampling and chemometric tools to classify beer samples between fresh and aged and between samples contained in aluminium cans or glass bottles, and to predict the shelf life of beer. The mass spectra obtained from the MS-based e-nose contained details about volatile compounds and were recorded as the abundance of each ion at different mass-to-charge (m/z) ratios. The analysis was performed on 53 naturally aged samples for eleven months without light and with a controlled temperature of around 14 °C ± 0.5 °C. Principal component analysis (PCA) was performed on the data and showed a grouping of samples between fresh and aged. Partial least square discriminant analysis (PLS-DA) allowed the discrimination of fresh from aged beers but could not discriminate between the samples according to the type of packaging. Finally, partial least squares regression (PLSR) proved to be an effective method for predicting beer shelf life.

1. Introduction

Beer aroma is defined by an intricate blend of volatile compounds that exhibit a diverse range in nature and concentration levels. Chemical compounds derived from raw ingredients such as malt, hops, and yeast are extracted during the brewing process [1]. The influence of each compound on the sensory experience of the final product depends on the balance between its concentration level and sensory threshold. This directly affects their odour activity [2].
Beer aroma is one of the most determinant factors of its quality. During its shelf life, the beer undergoes chemical reactions that can affect the aroma, leading to a decrease in sensory quality [3]. Due to its complexity, beer ageing is considered an important quality issue for the brewing industry since the rate of chemical reactions that occur during beer storage is determined by internal (e.g., raw material, brewing techniques, oxygen content, pH, and key odorants), and external factors (e.g., packaging, vibration, temperature, and light) [3,4,5,6].
To evaluate the aroma of a beer during its shelf life, different methods based on specialised equipment, such as gas chromatography (GC), gas chromatography–mass spectrometry (GC-MS), gas chromatography with olfactometric detection (GC-O), and high-performance liquid chromatography (HPLC), among others, can be used [7,8]. Ncube et al. [9] studied the deterioration of an opaque traditional African beer using stir bar sorptive extraction and gas chromatography–high-resolution mass spectrometry. The study aimed to detect and monitor the changes in 84 volatile compounds throughout the day/shelf-life period. An additional example of the use of the gas chromatography technique is demonstrated in the research conducted by Ferreira et al. [10], where the authors monitored the impact of storage conditions on the chemical profile in beer samples using headspace solid-phase microextraction gas chromatography coupled to mass spectrometry (HS-SPME-GC/MS) and HS-SPME-GC-O. Samples were subjected to a controlled temperature of 37 °C ± 1 °C for 7 and 14 days to replicate warm storage conditions. Additionally, samples were stored at 20 °C ± 1 °C and 4 °C ± 1 °C.
In some cases, a sensory panel is used in combination with instrumental and physicochemical methods to identify and quantify the aroma descriptors in beer. In the study of Schubert et al. [11], the authors analysed the evolution of some volatiles present in lager and India pale ale (IPA) in different storage conditions (room temperature, cold storage, and forced ageing) to understand how the ageing process influences the chemistry and flavour of hoppy ale-style beers. The authors used gas chromatography and physicochemical and sensory analyses to evaluate the samples. The authors concluded that noticeable increases in certain staling aldehydes were observed during storage. Moreover, the concentration of some volatiles in the hop aroma, such as terpenoids (e.g., linalool and geraniol), remained relatively constant throughout storage, mitigating the perception of “oxidised” qualities in ales with high concentrations of these compounds. By contrast, the hop aroma in certain ales was influenced by more volatile compounds, such as esters, known for their lower stability. Wauters et al. [12] tracked the evolution of 41 key aroma compounds during the ageing of a re-fermented beer using gas chromatographic techniques and sensory analysis. The authors used headspace gas chromatography with flame ionisation detection (HS-GC-FID) and HS-SPME-GC-MS to quantify esters and alcohol, as well as aldehydes and terpenes, respectively. The sensory analysis performed was a similarity test via a set of forced-choice triangle tests in a randomised block design. Barnet and Shellhammer [13] evaluated the impact of dissolved oxygen and ageing on dry-hopped aroma stability in beer using gas chromatography and sensory analysis to understand the degree to which this dissolved oxygen affects the chemistry of dry-hopped beer. In the study, commercially brewed dry-hopped beers were dosed with oxygen to create a range of dissolved oxygen concentrations from approximately 40 to 250 µg/L and then stored at 3 °C and 30 °C. In addition to physicochemical analysis, GC–MS was used to measure the hop aromas, and a trained panel was used to describe the samples. Another example of using these techniques to evaluate the aroma profile during ageing can be found in Saison et al. [14], where the effect of 26 staling compounds on the flavour of aged beer was studied by determining their threshold values to assess the impact of these chemical compounds on beer flavour. The authors used an untrained and a trained panel to determine the threshold of added substances and headspace solid-phase microextraction coupled to gas chromatography–mass spectrometry (HS-SPME/GC–MS) to determine the concentration of flavour compounds. Additionally, a trained panel of eight members was used to perform a sensory analysis of fresh and forced-aged beers. In a previous study [15], we applied gas chromatography with mass spectrometric detection (GC–MS) in combination with a sensory evaluation test to monitor and compare the evolution of the aroma profile in beer stored in aluminium cans and glass bottles during the natural ageing of beer under controlled conditions of light and temperature. The results showed that through olfactometric analysis, panellists were able to distinguish each beer by the type of container. On the other hand, the results from the instrumental analysis indicated that the samples could not be distinguished based on the type of container but rather by the duration of the ageing process. A prediction model was built to determine the ageing time of the samples with an error of 1.1 months.
Due to the costly and time-consuming nature of the chromatographic and sensory analysis approaches, particularly the latter, which is susceptible to assessor fatigue and subjectivity, alternatives are sought [7,16,17,18]. In this paper, we propose an alternative method centred on using an electronic nose (e-nose) based on the mass spectrometry (MS) detector. An e-nose is a device designed to mimic the human sense of odour by analysing the chemical signature of volatile compounds [19,20]. The sensor array output is processed through pattern recognition algorithms that analyse the unique pattern of sensor responses, creating a distinctive fingerprint of the volatile fraction in the sample [21]. In the case of an MS-based e-nose, the responses are the abundances of the total fragmented ions at different mass-to-charge (m/z) ratios without prior chromatographic separation [22]. The e-nose combined with headspace solid-phase microextraction (HS-SPME) as a sampling system provides a representative mass spectrometric fingerprint of the volatile fraction of the sample. As the MS-based e-nose has proven to be an efficient and rapid method to classify and characterise beers from different factories and brands using the aroma profile of the product [6,23,24,25,26], in this study, we propose to investigate whether the technique is also capable of classifying beer according to the type of container, aluminium can or glass bottle, and the time of storage, fresh or aged. We also aimed to build a prediction model of the beer’s shelf life and compare the results with those obtained in our previous study to confirm the efficacy of this technique.

2. Materials and Methods

2.1. Samples

Since one of the aims of this study was to confirm the efficacy of the MS-based e-nose to predict each beer’s shelf life by comparing the results with those obtained in our previous study [15], all the samples used in both studies were of the same commercial brand and were received from the brewery company or bought in a supermarket and stored at the same time in the same storage conditions described below. The samples were analysed in three periods during their shelf life: fresh, after 6 months of ageing, and after 11 months of ageing.
For this study, a total of 108 samples of commercial lager-styled beers packaged in aluminium cans (54 samples) and glass bottles (54 samples) were sourced directly from a local brewery in optimal freshness, featured an alcohol content of 5.4% v.v., and were employed in controlled natural ageing experiments. The samples were aged for 11 months without light at 14 °C ± 0.5 °C. Eighteen samples were used in each ageing period analysis.
Additionally, forty lager beers of the same brand (20 in aluminium cans and 20 in glass bottles) were bought in optimal freshness (less than one month of packaging) from a local supermarket to have fresh samples when analysed after 6 and 11 months of storage.
Before analysis, ultrasonication at 0 °C (to avoid the loss of aroma compounds) was employed to degas all beer samples for 15 min. The preparation and analysis of each sample was performed in triplicate.

2.2. Sampling System: Headspace Solid-Phase Microextraction (HS-SPME)

The SPME holder, for manual sampling, and the StableFlex Divinylbenzene/Carboxen/Polydimethylsiloxane (DVB/CAR/PDMS) 50/30 μm fibre used in this investigation were purchased from Supelco (Bellefonte, PA, USA). Before use, all fibres underwent conditioning, and they were thermally cleaned between analyses by placing them into the GC injection port at the temperature specified by the producer.
The conditions for headspace extraction were 10 mL of sample placed into a 20 mL glass vial with 3.2 g of NaCl to achieve saturation. The vials were tightly sealed with PFTE/silicone septa in a nitrogen atmosphere. In order to establish the equilibrium of volatile compounds between the liquid and the headspace, the samples were maintained at 40 °C for 15 min. Then, the extraction and concentration of the volatile compounds using the HS-SPME were carried out under continuous magnetic stirring at 40 °C for 1 h.

2.3. MS-Based e-Nose Analysis

Beer samples were analysed using an MS-based e-nose from Agilent Technologies (Palo Alto, CA, USA), composed of a 7890B gas chromatograph system coupled to a 5777B mass spectrometer detector equipped with a high-efficiency source (HES) analyser. As the role of the gas chromatograph was to convey the volatiles from the injection port to the MS detector, the HP-5MS apolar analytical column (30 m × 0.25 mm × 0.25 µm) was kept at an appropriate temperature to ensure the rapid transfer of volatiles to the MS within less than 5 min, thereby preventing chromatographic separation. The oven temperature program, designed to transfer the volatiles to the MS within the shortest timeframe, was 70 °C (1 min), 70 °C·min−1 to 180 °C (2.5 min). The carrier gas was helium with a flow rate of 1.6 mL·min−1. The injection was made at 270 °C in the splitless mode for 1 min using an inlet of 1.5 mm i.d. The mass spectra were recorded by electronic impact (EI) ionisation at 70 eV with a temperature of 230 °C in the ion source and 150 °C in the mass quadrupole. The mass-to-charge ratio range (m/z) used was 50–150. Ratios below 50 m/z were excluded from the analysis to prevent interference from ethanol, the most abundant volatile compound (approx. 5%).

2.4. Chemometric Methods

The mass spectra fingerprints obtained from the analysis contain information about the whole volatile fraction of the sample and are presented on a plot illustrating the mass fragments (m/z) along the selected mass range on the X-axis, with the ion abundances for the mass fragments depicted on the Y-axis.
The data obtained were exported from the HS-SPME MS-based e-nose to an Excel table and were structured in a matrix of 53 rows (samples) × 100 columns (m/z ratios). The chromatographic values of the matrix were the values of the m/z ratios. Before the chemometric analysis, the spectra were pre-processed, as the difference between the highest and lowest peaks was significant, thus, affecting the analysis. The values of each m/z were divided by the total sum of the m/z values contained in the matrix. Then, the data were auto-scaled (i.e., mean-centred and standardised to unit variance).
First, principal component analysis (PCA) was applied to the matrix to visualise the data and to detect sample groups or trends. Then, partial least squares discriminant analysis (PLS-DA) was used to discriminate between fresh and aged beers and beer contained in aluminium cans or glass bottles. Finally, partial least squares regression (PLSR) was used to build a model relating the mass spectra to the ageing months, that is, to predict the freshness of the product during its shelf-life under optimal storage conditions and independently of the type of packaging.
All calculations were performed using PLS Toolbox v8.7 (Eigenvector Research Inc., Eaglerock, LA, USA) with MATLAB R2021a (The MathWorks, Natick, MA, USA).

3. Results

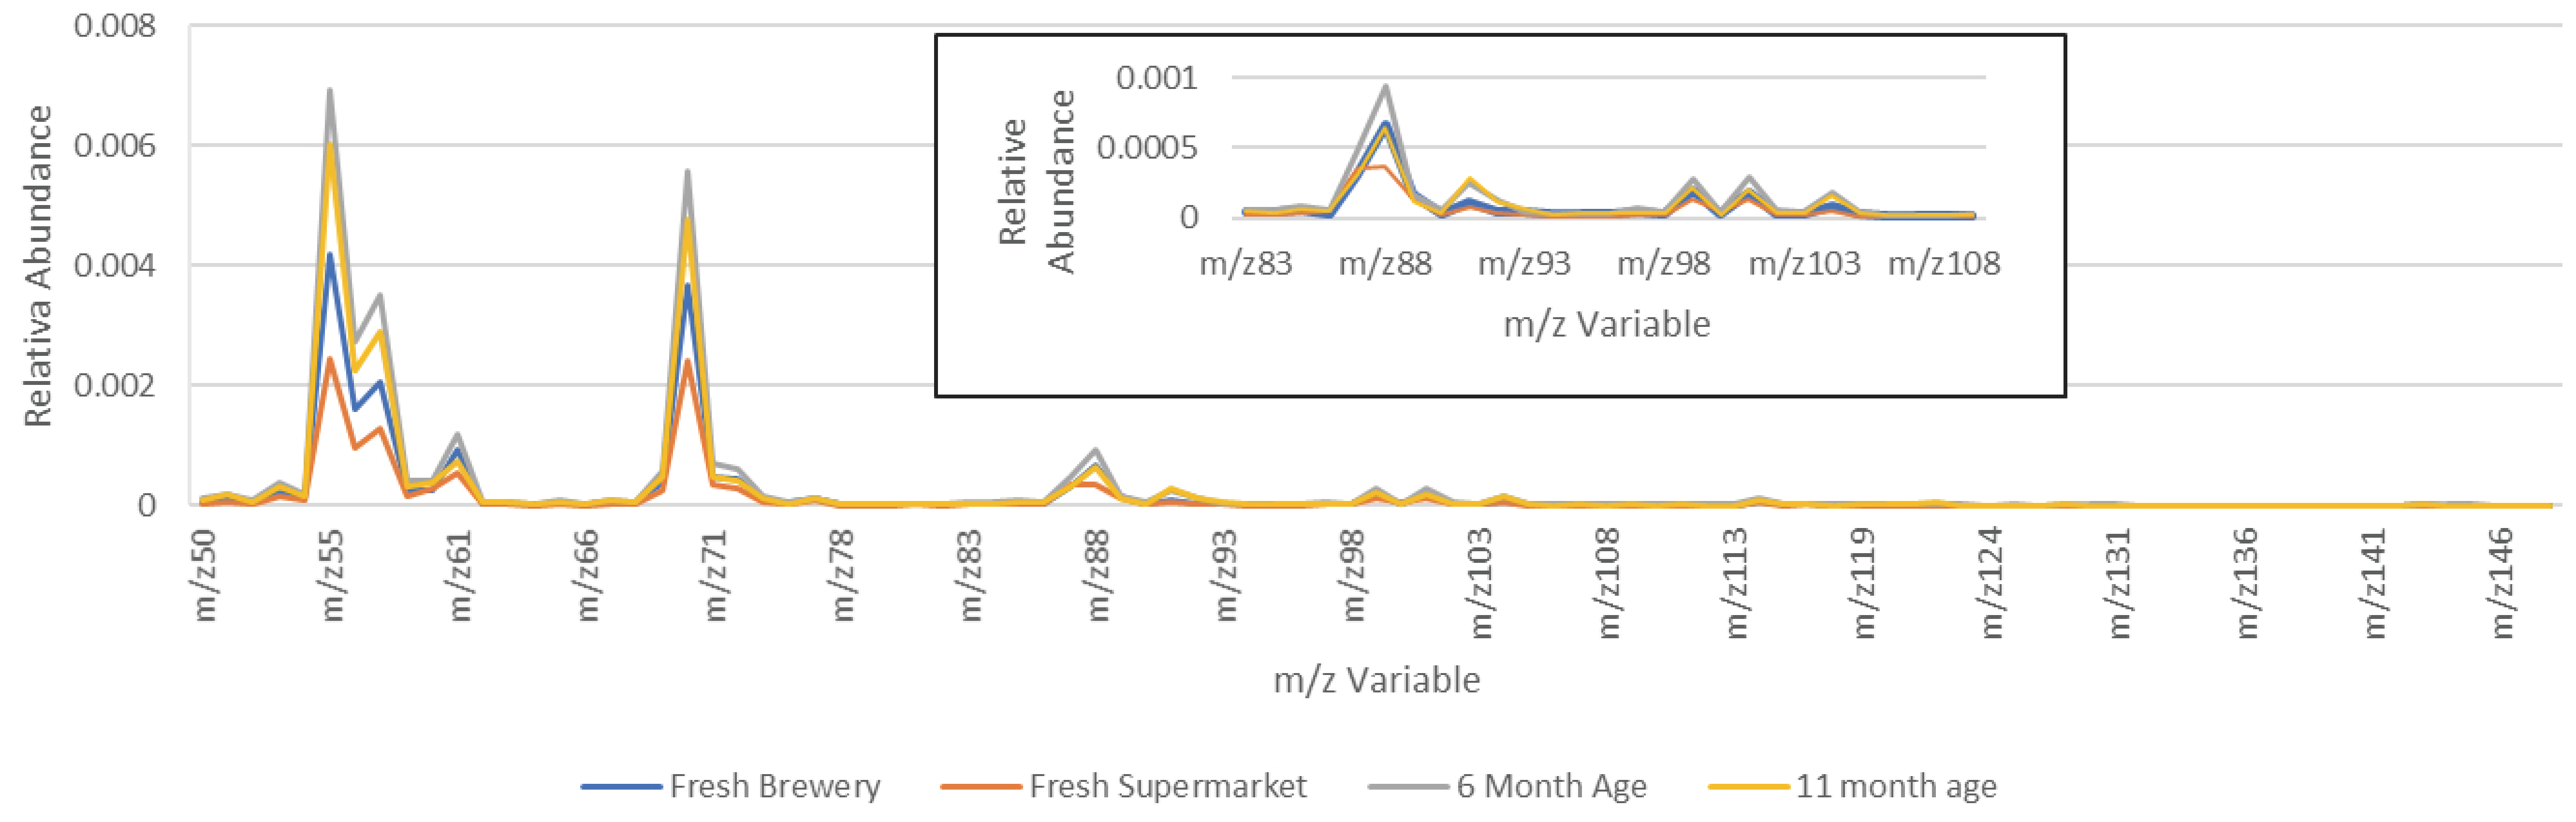
3.1. MS-Based e-Nose Analysis

The configuration of the HS-SPME sampling system is thought to maximise the sensitivity of the analysis, as SPME allows extracting and, unlike a static headspace, concentrating analytes in a single step. Although there is no strict chromatographic separation with the MS-based e-nose, there is a delay during the transfer of the volatile fraction from the injection port to the mass spectrometer. The mass spectrum is the sum of the abundances for every ion recorded in the time interval during the volatile transfer from the injector to the mass spectrometer plotted against their mass-to-charge ratios (m/z). As mentioned above, the range of m/z used was from 50 to 150 to avoid the effect of ethanol (m/z = 45 and 46) and because the main aromatic compounds in beer have fragment ions in that m/z range.
Figure 1 shows the mass spectrum of a given sample at different ageing times. In this figure, it can be observed that the mass spectra of the fresh samples from the brewery and the supermarket are different from each other. It can also be observed that the samples aged 6 and 11 months show just a slight variation in the peak area of some m/z ratios.

3.2. Chemometric Methods

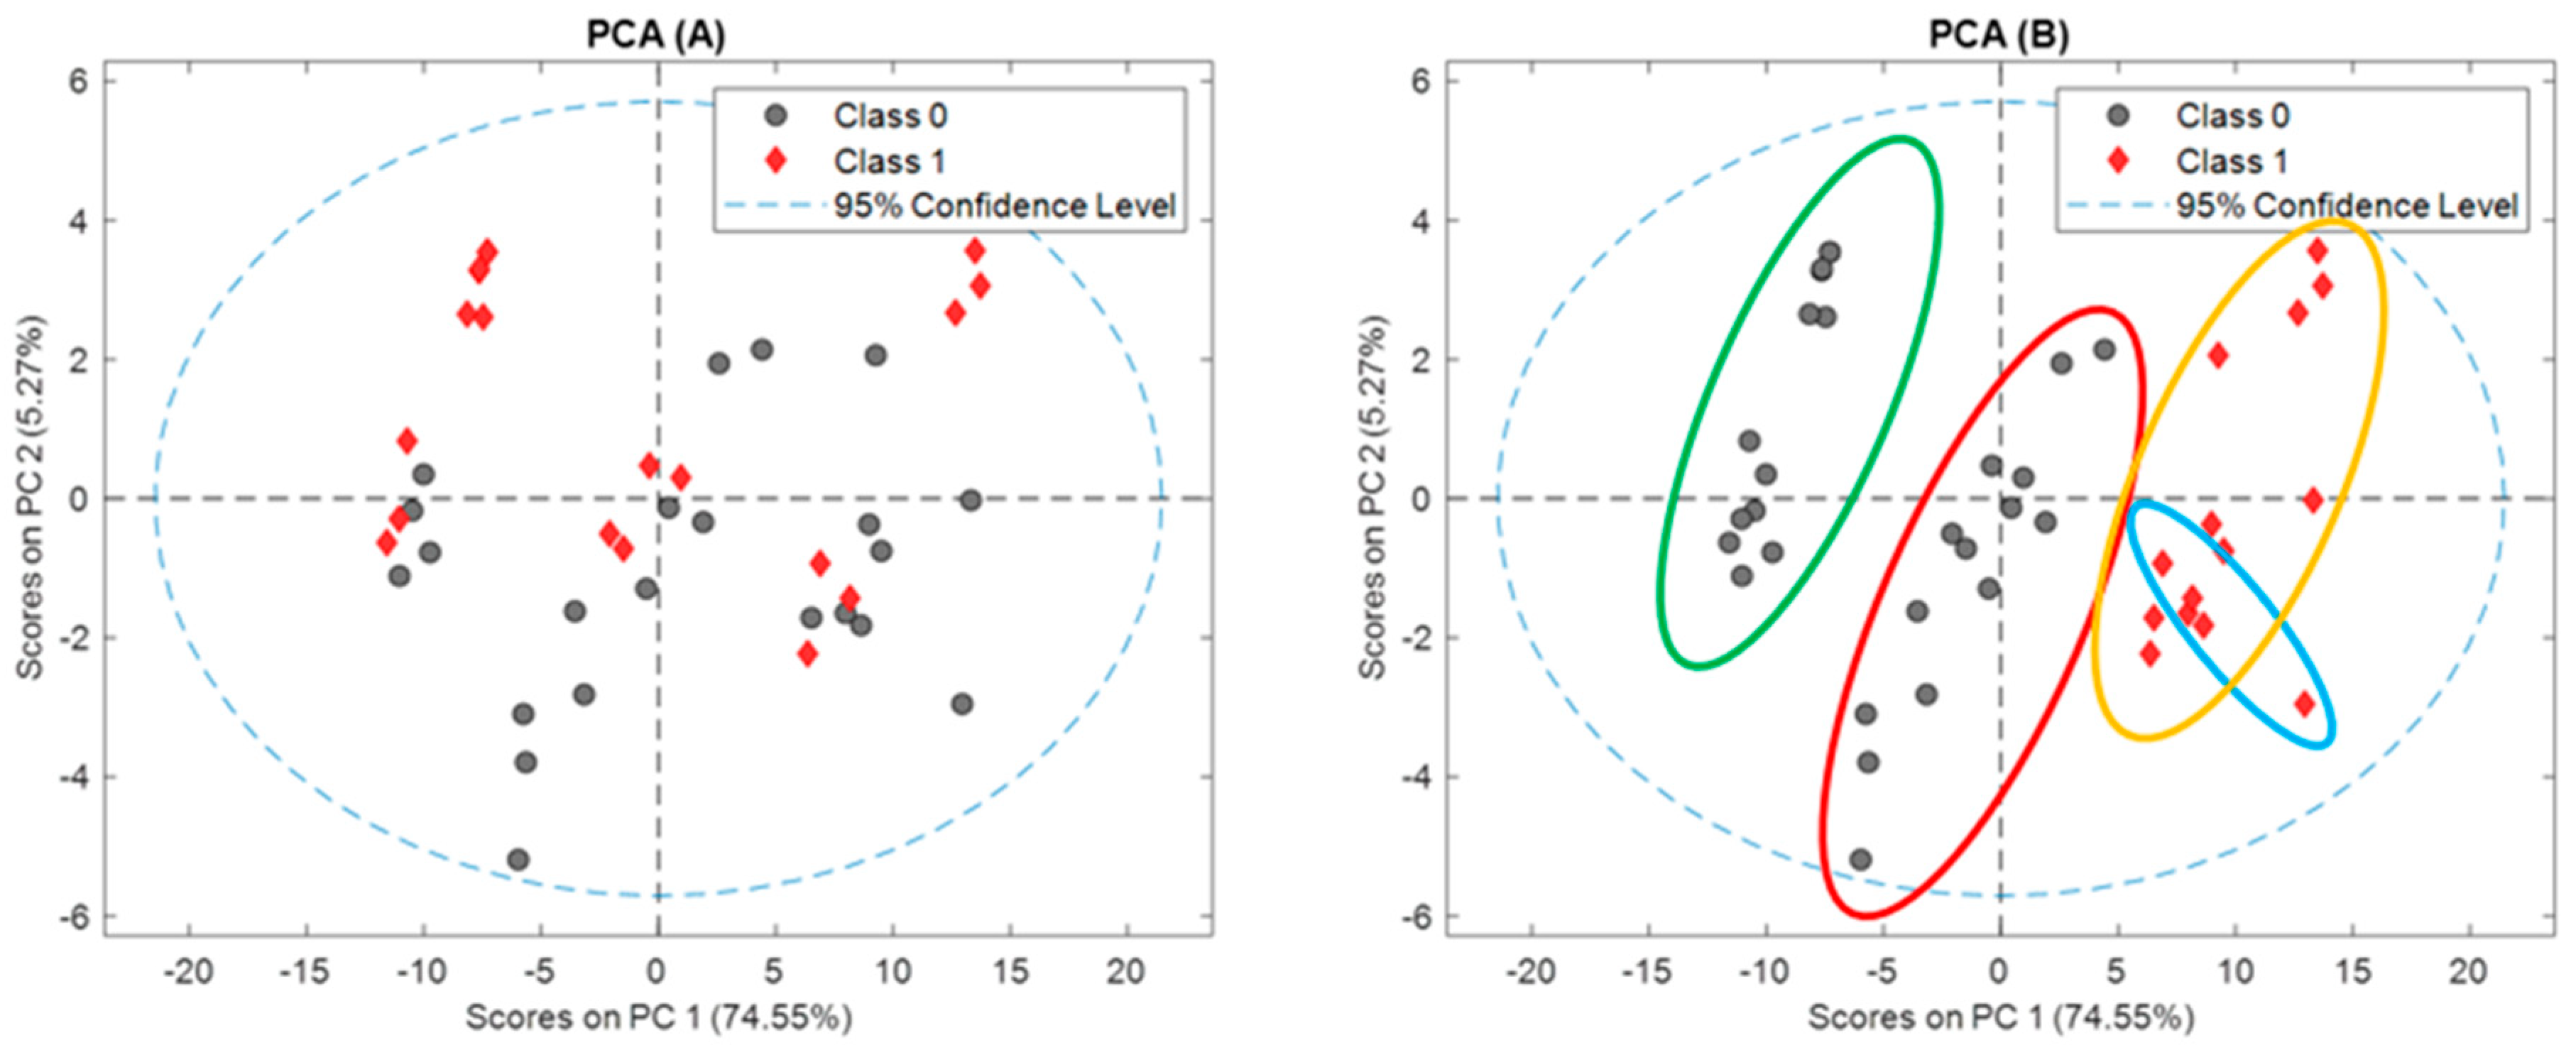
3.2.1. Principal Component Analysis (PCA)

PCA was used for a preliminary observation of the MS data. This chemometric tool reduces the dimensionality of the original data matrix by compressing the information into a few new variables called principal components (PCs), which helps to reveal groups and trends in the data and highlight outlier samples. The two main plots obtained from PCA are the score and loading plots, which show the projection of the samples and variables onto the new PC space, respectively.
A first PCA was applied to the complete dataset and revealed the presence of outlier samples. After careful inspection of the data, we observed that the spectrum of some samples was different (lower abundance values) from other samples in the same group, so we decided to remove these samples and perform the analyses. Figure 2 shows the PCA score plot of the new dataset for the first two PCs.
It can be observed that the two first PCs can explain 80% of the original information. In Figure 2A, we can observe no grouping between the aluminium cans or glass bottles. On the other hand, in Figure 2B, the first principal component (PC1) shows a separation between the fresh and aged samples: The fresh samples from the brewery resided more in the centre, and the fresh samples bought in a supermarket were more to the left of the plot. The six and eleven-month-aged samples on the right side of the plot appear to cluster together.

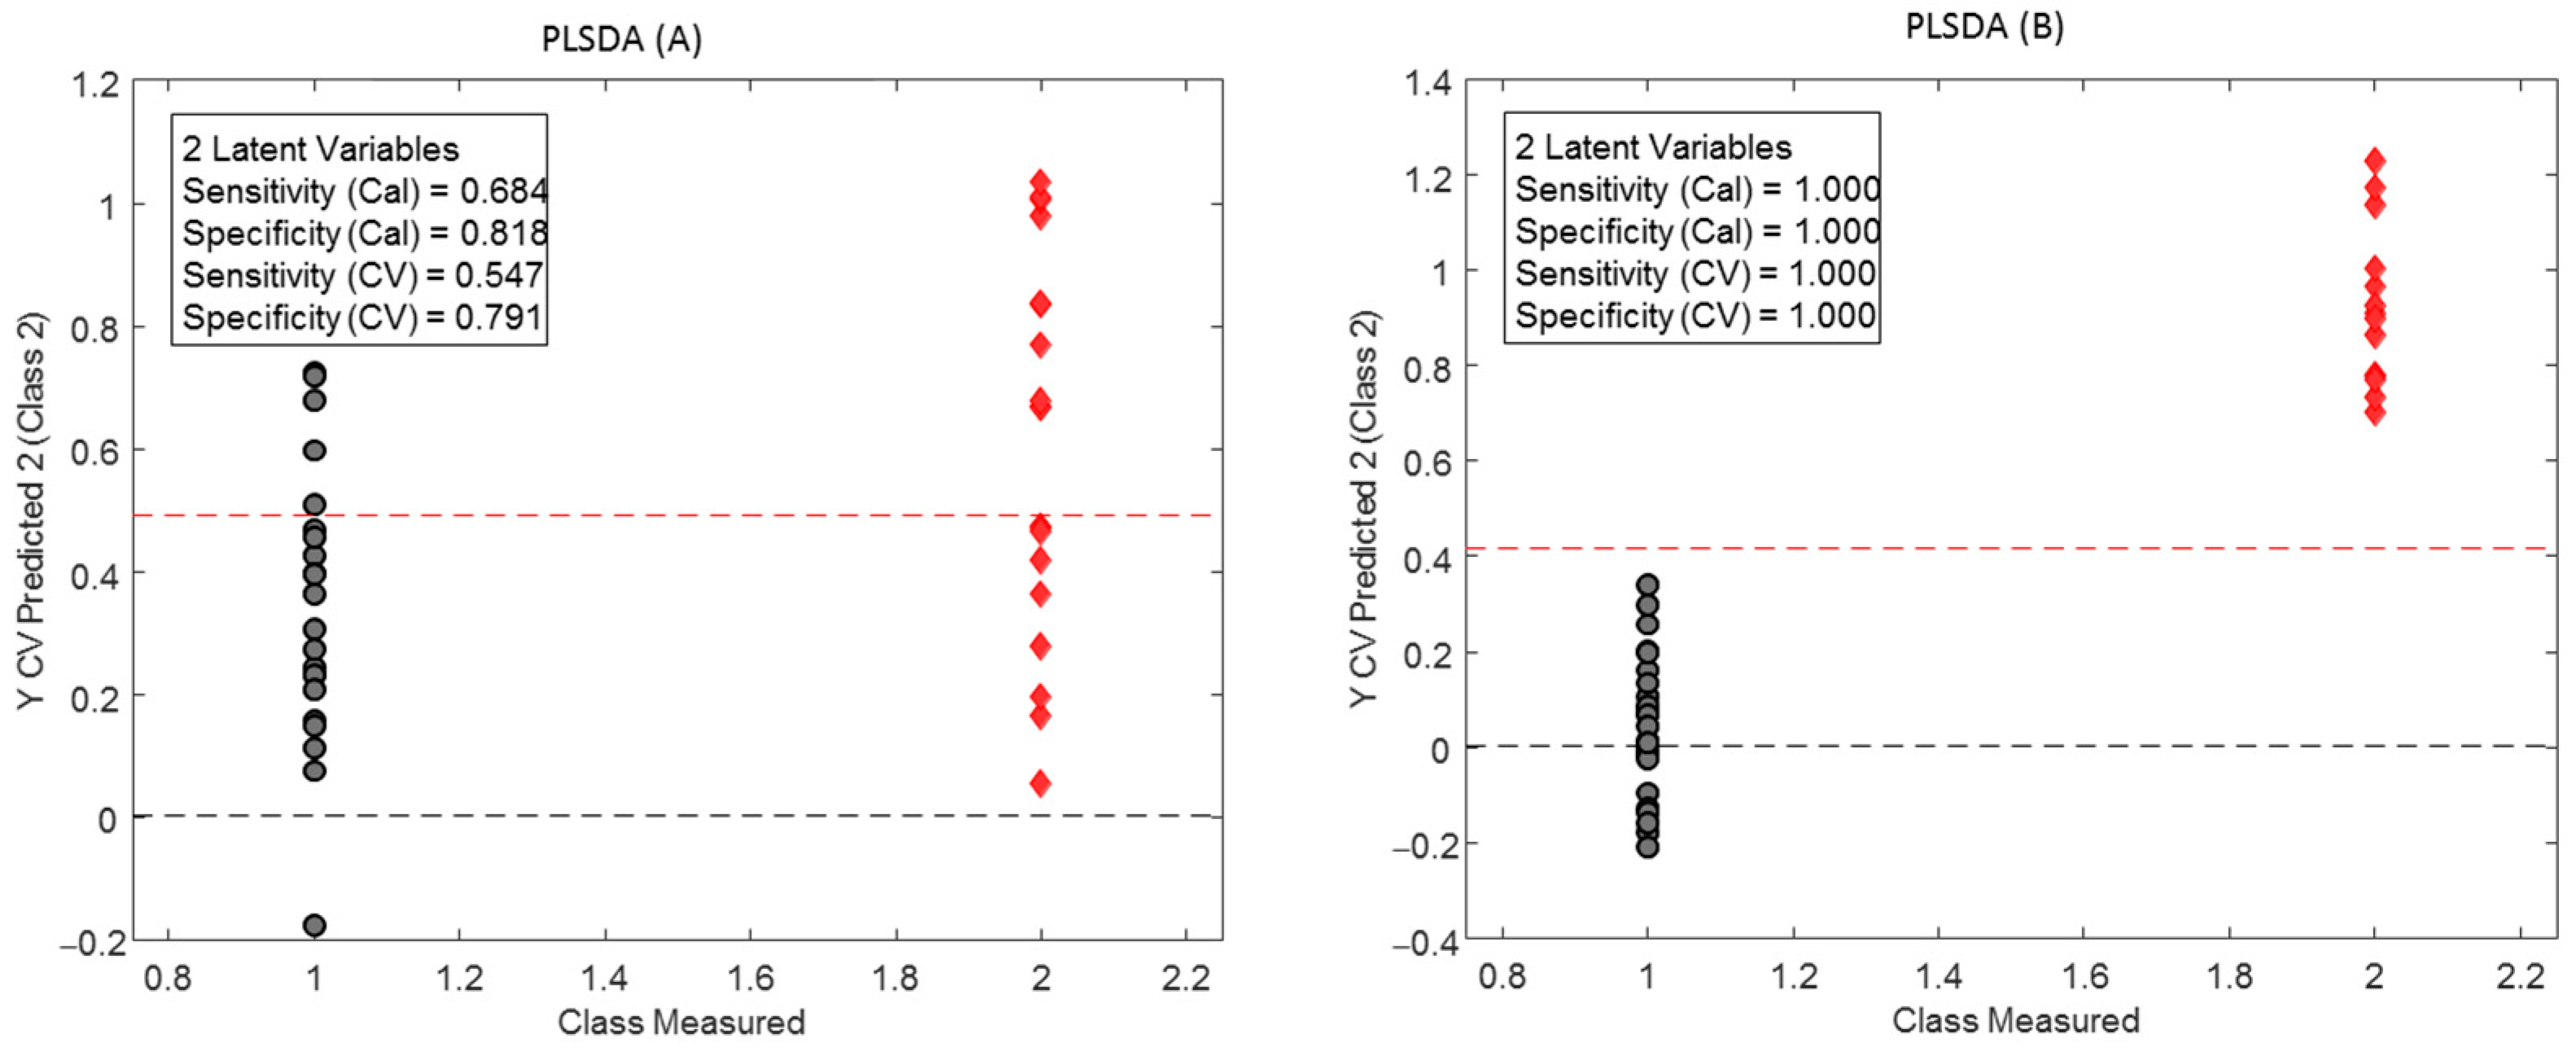
3.2.2. Partial Least Squares Discriminant Analysis (PLS-DA)

Based on the promising PCA results, where some differentiation was observed between samples according to ageing time, we decided to apply PLS-DA to check if we could discriminate the data set between samples packaged in aluminium cans and glass bottles and between fresh and aged samples.
PLS-DA is a discriminant method that is based on the partial least squares regression (PLSR) algorithm described below. To classify the samples, the PLS-DA model is built by correlating the matrix X of predictor variables (abundances at the different m/z ratios in this case) with a vector y of dummy variables, zeros and ones, in a two-class problem, as in this work. In the first case, a value of 0 was assigned to aluminium cans and 1 to glass bottles. In the second case, the value 0 was assigned to the fresh samples and 1 to the aged samples. The PLS-DA models were built with auto-scaled spectra and validated using the random subsets cross-validation technique. The optimal number of latent variables (LVs) of the model was determined based on the minimum number of misclassified samples in the cross-validation set, resulting in models with two LVs (model fresh vs. aged samples) and two LVs (model aluminium cans vs. glass bottles). Figure 3 shows the results of the classification models. Figure 3A shows that the PLS-DA model could not discriminate between samples packaged in aluminium cans and glass bottles, with 14 misclassified samples in the validation set. However, the model in Figure 3B shows that PLS-DA allows discriminating fresh from aged beers, with a 100% correct classification for the validation set of samples.
A classification model was attempted to classify the samples aged 6 and 11 months, motivated by the observation that these samples tended to cluster together (PCA shown in Figure 2B). However, the accuracy of this classification model was not satisfactory.

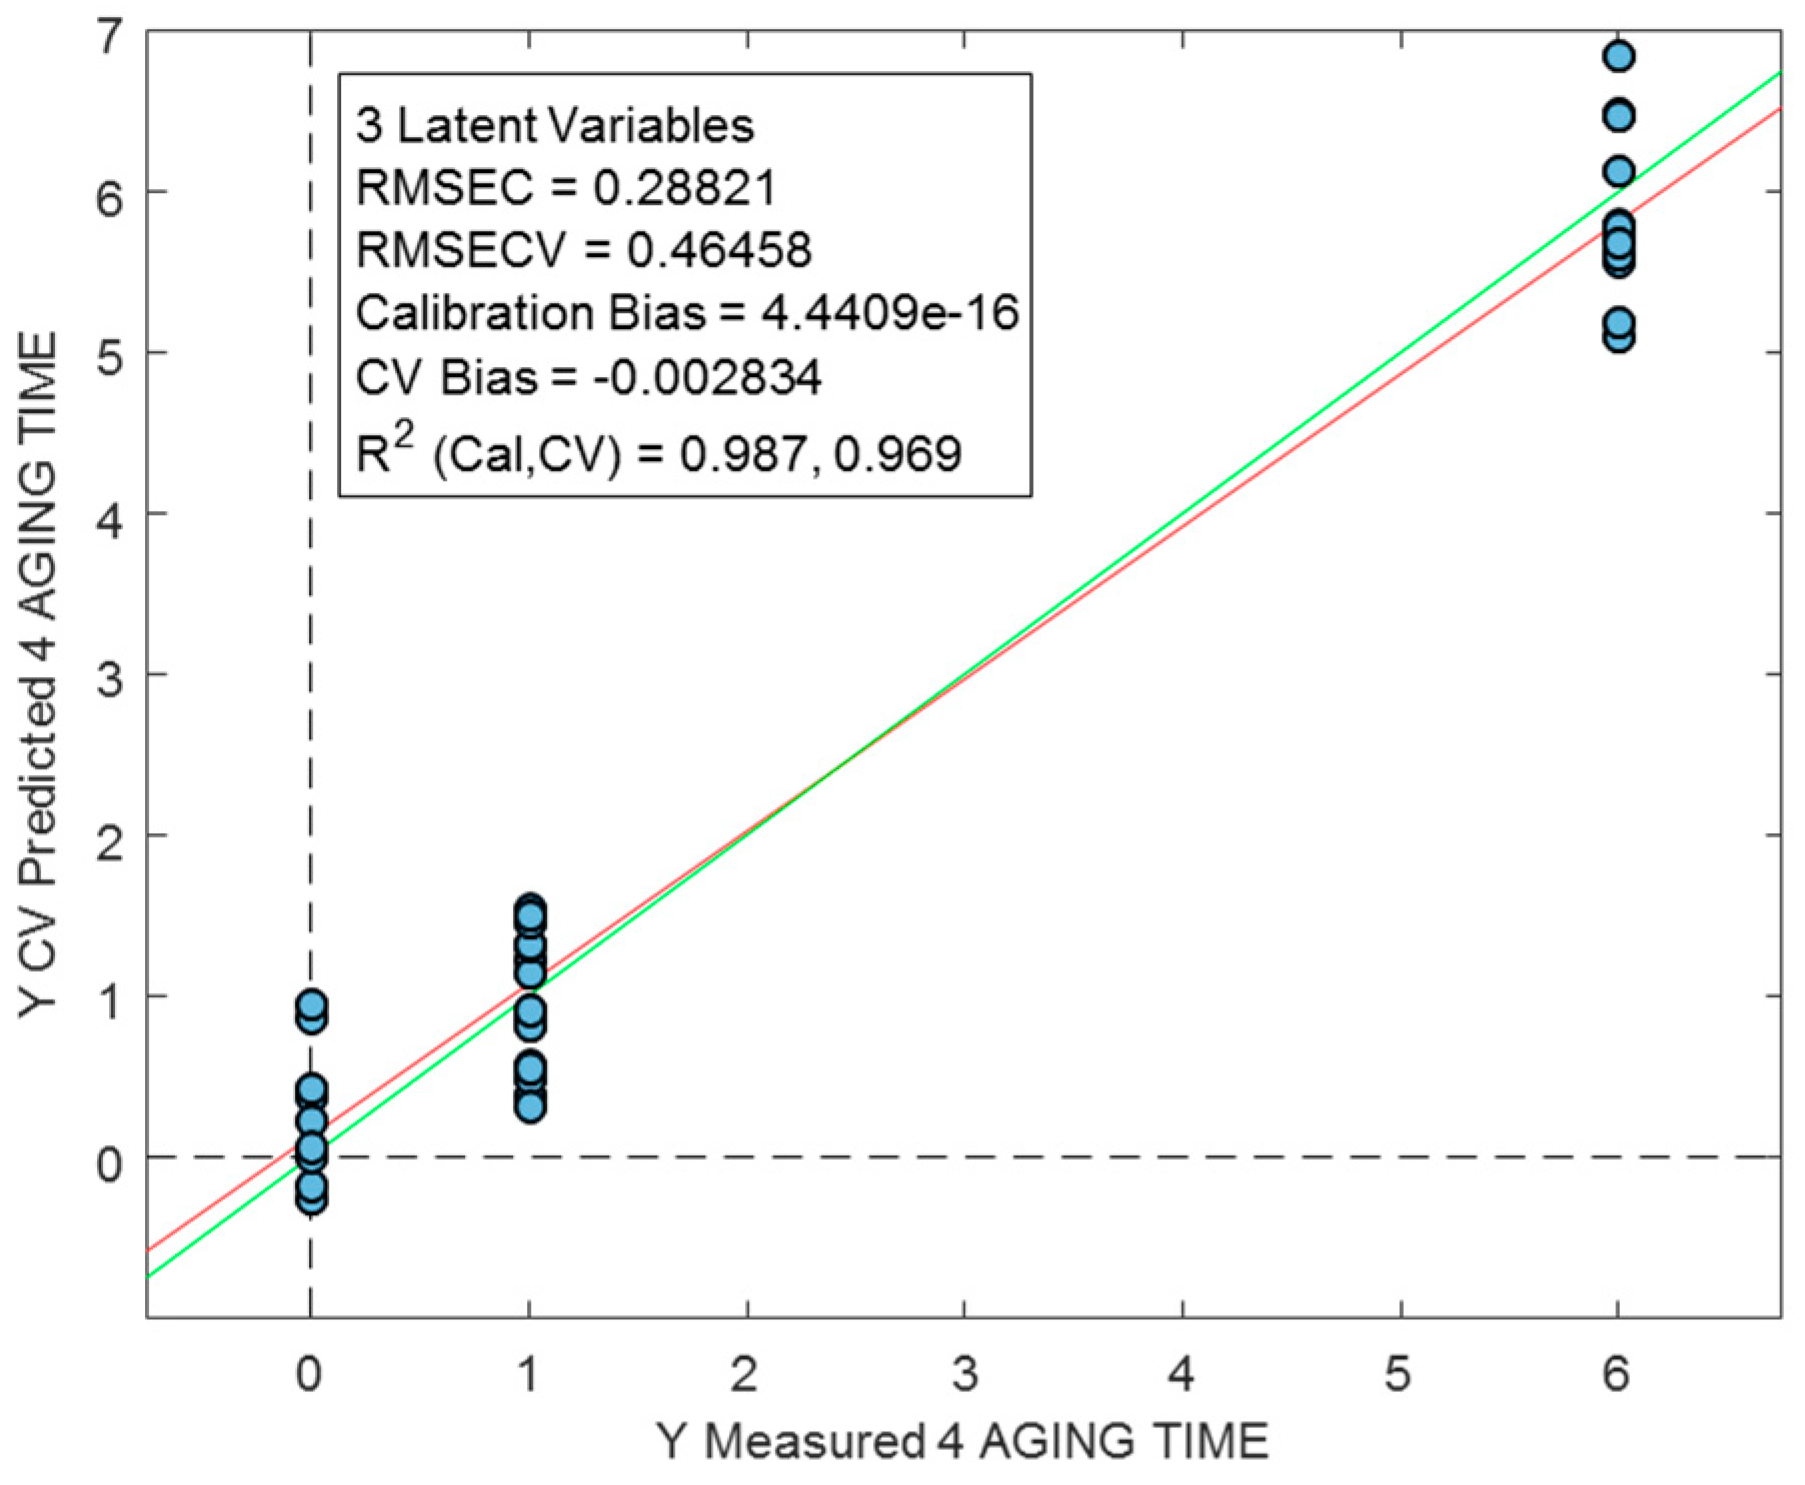
3.2.3. Partial Least Squares Regression (PLSR)

Finally, in order to predict beer shelf life, PLSR was used. The best model was found using three ageing classes: Class 1: 0 months (fresh samples from a brewery), Class 2: 1 month (fresh samples from a supermarket), and Class 3: 6 and 11 months aged samples. A regression model was built between the X-matrix (abundances of the different m/z ratios) and a y-vector containing the ageing classes: Class 1, Class 2, and Class 3. The model was cross-validated using random subsets. The optimal number of latent variables (LVs) of the model was determined based on the minimum value of the prediction error for the cross-validation set and expressed as the root mean square error of cross-validation (RMSECV):
R M S E C V = i n t ( y t , i y ^ t , i ) 2 n t
y ^ t , i is the months predicted by the models, y t , i is the actual months, and nt is the number of samples in the cross-validation set. RMSECV is an estimation of the average error to be expected in future predictions when the calibration model is applied to new samples.
Figure 4 shows the plot for the predicted vs. actual values for the validation set and some model parameters. The average prediction error to be expected for ageing time using this model is around 0.46 months for a model with three LVs. This means that a beer less than 11 months old could be safely predicted to be within its shelf life (1 year).

4. Discussion

By observing the chemometric results of the PCA in Figure 2, it could be seen that the samples clustered according to their freshness but not according to the type of packaging used (aluminium can or glass bottle), as in our previous study mentioned above. The mass spectra of the samples in Figure 1 exhibit slight variations corresponding to the degree of product ageing. This trend was assessed and verified by the PLS-DA models. Two PLS-DA models were developed to classify samples based on their type of packaging (aluminium can and glass bottle) and their shelf-life ageing (fresh vs. aged). The results showed that the PLS-DA model can classify samples based on their ageing with a success rate of 100% but cannot classify the samples based on their type of packaging, misclassifying 35% of the samples.
During beer shelf life, the balance between the aromatic compounds of the volatile matrix changes; thus, the aromatic profile of a freshly packaged beer is not the same as that of a beer that has been stored [27]. Beer flavour begins to decline almost immediately after the production process concludes [28]. According to the literature [28,29,30,31], the changes during storage in the volatile matrix of a beer that leads to the degradation of its aroma are directly related to the storage conditions of light and temperature. Paternoster et al. [31] created a model to simulate the impact of temperature and time on the sensory quality of lager beer. The authors analysed data from lager beers stored between 20 and 30 °C for up to 365 days. The results indicate that at the lowest temperature, the degradation of the quality of a lager beer occurs to some extent. On the other hand, at 30 °C, the sensory quality of the product degrades faster, thus, reducing its shelf life. This could explain the difference between the fresh samples from the brewery and those bought in the supermarket. The samples delivered from the brewery were kept in darkness at a controlled temperature of 14 °C ± 0.5 °C. In contrast, samples bought in the supermarket were kept in the conditions of light and temperature imposed by the supermarket, that is, exposed to light and kept at room temperature (20 °C ± 0.5 °C). Therefore, varying storage conditions can result in different sensory attributes.
Beer flavour evolves over time due to chemical reactions that involve the consumption of reactants. The speed of this process diminishes as the available reactants become restricted following a period of ageing [31]. This observation could explain the pattern of grouping observed in the PCA plot—Figure 2B—for the six- and 11-month samples. The alterations in the volatile composition of the samples after six months of ageing could have been less pronounced compared to the changes observed in the samples up to that point. Consequently, this led to the volatile composition of the 11-month samples resembling that of the samples aged 6 months.
The evolution and stability of beer flavour during its shelf life and the speed with which this evolution occurs depend on factors such as raw materials, content of dissolved oxygen, light, and temperature. Although aluminium cans and glass bottles share the common purpose of protecting and preserving the product’s quality, they inherently differ in terms of material composition, UV light protection, oxygen pick-up, and permeability [27,32,33]. According to Fromuth et al. [27], the differences between aluminium cans and glass bottles affect the potential risk of numerous chemical reactions during ageing, considering the type of container as a variable that affects beer flavour stability. They studied the impact of the type of container on beer stability by employing a non-targeted metabolomic strategy in two relevant styles of craft beer—amber ale and India pale ale (IPA). Notable differences between cans and bottles were found in amber ale beer, whereas such differences were not observed in IPA beer, leading to the conclusion that the influence of packaging depends on beer style. The results from this study help clarify the reason for the non-distinction between cans and bottles in our chemometric study. This stands in contrast to other studies involving the lager-styled beers [32,33], where beers in aluminium cans and glass bottles exhibit significant differences in the volatile matrix during ageing. In other words, the manner in which beer undergoes changes throughout its shelf life in various types of containers is influenced by storage conditions, the brewing process, and the raw materials used in the style of beer.
The PLSR model was implemented to predict the beer shelf life. It showed a determination coefficient of R2 = 0.967 and could predict the ageing time of a beer with an error of around 0.4 months. This prediction error is much lower than the 1.1 months obtained in our previous study. The results of the PLSR model showed the potential application of the MS-data e-nose in assessing the freshness of a beer during its shelf life.

5. Conclusions

Conventional methods for the comprehensive characterisation and prediction of beer shelf life are both time-consuming and expensive, needing the expertise of experienced professionals. In this study, we introduce a swifter and more efficient method, using an MS-based e-nose and multivariate analysis, to classify beers according to packaging type or freshness and to forecast the beer’s shelf life by examining alterations in the volatile matrix of the samples. PLS-DA was used to classify the samples into fresh and aged with very good classification results, and PLSR was used to create a model to predict beer shelf life. The results showed that MS-based e-nose coupled with multivariate analysis seems to be a rapid, efficient, and effective tool for distinguishing between beer samples based on their storage duration and predicting the shelf life of samples.

Author Contributions

A.C.d.L.: Conceptualization, Investigation, Methodology, Writing—original draft, Writing—review & editing. L.A.: Conceptualization, Investigation, Methodology, Supervision, Visualization, Validation, Writing—original draft, Writing—review & editing. M.M.: Conceptualization, Investigation, Methodology, Supervision, Visualization, Validation, Writing—original draft, Writing—review & editing. R.B.: Conceptualization, Funding acquisition, Formal analysis, Software, Supervision, Validation, Writing–original draft, Writing—review & editing. All authors have read and agreed to the published version of the manuscript.

Funding

This research was funded by MCIN/AEI/10.13039/501100011033, grant number PID2019-104269RR-C33, and by the Secretaria d’Universitats i Recerca of the Departament d’Empresa i Coneixement de la Generalitat de Catalunya grant number 2021FI_B2 00851.

Data Availability Statement

The data presented in this study are available on request from the corresponding author.

Acknowledgments

The authors acknowledge the support given to this research by Antonio Fumanal Sopena.

Conflicts of Interest

The authors declare no conflict of interest.

References

  1. Milani, E.A.; Silva, F.V.M. Pasteurization of Beer by Non-Thermal Technologies. Front. Food Sci. Technol. 2022, 1, 798676. [Google Scholar] [CrossRef]
  2. Ghasemi-Varnamkhasti, M.; Mohtasebi, S.S.; Rodriguez-Mendez, M.L.; Lozano, J.; Razavi, S.H.; Ahmadi, H. Potential Application of Electronic Nose Technology in Brewery. Trends Food Sci. Technol. 2011, 22, 165–174. [Google Scholar] [CrossRef]
  3. De Lima, A.C.; Aceña, L.; Mestres, M.; Boqué, R. An Overview of the Application of Multivariate Analysis to the Evaluation of Beer Sensory Quality and Shelf-Life Stability. Foods 2022, 11, 2037. [Google Scholar] [CrossRef] [PubMed]
  4. Rodrigues, J.A.; Barros, A.S.; Carvalho, B.; Brandão, T.; Gil, A.M. Probing Beer Aging Chemistry by Nuclear Magnetic Resonance and Multivariate Analysis. Anal. Chim. Acta 2011, 702, 178–187. [Google Scholar] [CrossRef]
  5. da Costa, N.L.; da Costa, M.S.; Barbosa, R. A Review on the Application of Chemometrics and Machine Learning Algorithms to Evaluate Beer Authentication. Food Anal. Methods 2021, 14, 136–155. [Google Scholar] [CrossRef]
  6. Andrés-Iglesias, C.; Montero, O.; Sancho, D.; Blanco, C.A. New Trends in Beer Flavour Compound Analysis. J. Sci. Food Agric. 2015, 95, 1571–1576. [Google Scholar] [CrossRef] [PubMed]
  7. Gonzalez Viejo, C.; Fuentes, S.; Godbole, A.; Widdicombe, B.; Unnithan, R.R. Development of a Low-Cost e-Nose to Assess Aroma Profiles: An Artificial Intelligence Application to Assess Beer Quality. Sens. Actuators B Chem. 2020, 308, 127688. [Google Scholar] [CrossRef]
  8. Gonzalez Viejo, C.; Fuentes, S.; Torrico, D.D.; Godbole, A.; Dunshea, F.R. Chemical Characterization of Aromas in Beer and Their Effect on Consumers Liking. Food Chem. 2019, 293, 479–485. [Google Scholar] [CrossRef]
  9. Ncube, S.; Dube, S.; Nindi, M.M. Determination of Volatile Compounds during Deterioration of African Opaque Beer Using a Stir Bar Sorptive Extraction Technique and Gas Chromatography-High Resolution Mass Spectrometry. Curr. Res. Food Sci. 2020, 3, 256–267. [Google Scholar] [CrossRef]
  10. Ferreira, I.M.; Freitas, F.; Pinheiro, S.; Mourão, M.F.; Guido, L.F.; Gomes da Silva, M. Impact of Temperature during Beer Storage on Beer Chemical Profile. LWT 2022, 154, 112688. [Google Scholar] [CrossRef]
  11. Schubert, C.; Lafontaine, S.; Dennenlöhr, J.; Thörner, S.; Rettberg, N. The Influence of Storage Conditions on the Chemistry and Flavor of Hoppy Ales. Food Chem. 2022, 395, 133616. [Google Scholar] [CrossRef] [PubMed]
  12. Wauters, R.; Herrera-Malaver, B.; Schreurs, M.; Bircham, P.; Cautereels, C.; Cortebeeck, J.; Duffin, P.M.; Steensels, J.; Verstrepen, K.J. Novel Saccharomyces Cerevisiae Variants Slow down the Accumulation of Staling Aldehydes and Improve Beer Shelf-Life. Food Chem. 2022, 398, 133863. [Google Scholar] [CrossRef] [PubMed]
  13. Barnette, B.M.; Shellhammer, T.H. Evaluating the Impact of Dissolved Oxygen and Aging on Dry-Hopped Aroma Stability in Beer. J. Am. Soc. Brew. Chem. 2019, 77, 179–187. [Google Scholar] [CrossRef]
  14. Saison, D.; De Schutter, D.P.; Uyttenhove, B.; Delvaux, F.F.R.; Delvaux, F.F.R. Contribution of Staling Compounds to the Aged Flavour of Lager Beer by Studying Their Flavour Thresholds. Food Chem. 2009, 114, 1206–1215. [Google Scholar] [CrossRef]
  15. de Lima, A.C.; Aceña, L.; Mestres, M.; Boqué, R. Monitoring the Evolution of the Aroma Profile of Lager Beer in Aluminium Cans and Glass Bottles during the Natural Ageing Process by Means of HS-SPME/GC-MS and Multivariate Analysis. Molecules 2023, 28, 2807. [Google Scholar] [CrossRef]
  16. Siadat, M.; Losson, E.; Ghasemi-Varnamkhasti, M.; Mohtasebi, S.S. Application of Electronic Nose to Beer Recognition Using Supervised Artificial Neural Networks. In Proceedings of the 2014 International Conference on Control, Decision and Information Technologies (CoDIT), Metz, France, 3–5 November 2014; pp. 640–645. [Google Scholar] [CrossRef]
  17. Saevels, S.; Lammertyn, J.; Berna, A.Z.; Veraverbeke, E.A.; Di Natale, C.; Nicolaï, B.M. An Electronic Nose and a Mass Spectrometry-Based Electronic Nose for Assessing Apple Quality during Shelf Life. Postharvest Biol. Technol. 2004, 31, 9–19. [Google Scholar] [CrossRef]
  18. Grassi, S.; Benedetti, S.; Casiraghi, E.; Buratti, S. E-Sensing Systems for Shelf Life Evaluation: A Review on Applications to Fresh Food of Animal Origin. Food Packag. Shelf Life 2023, 40, 101221. [Google Scholar] [CrossRef]
  19. Song, S.Y.; Ahn, M.S.; Mekapogu, M.; Jung, J.A.; Song, H.Y.; Lim, S.H.; Jin, J.S.; Kwon, O.K. Analysis of Floral Scent and Volatile Profiles of Different Aster Species by E-Nose and HS-SPME-GC-MS. Metabolites 2023, 13, 503. [Google Scholar] [CrossRef]
  20. Yuan, N.; Chi, X.; Ye, Q.; Liu, H.; Zheng, N. Analysis of Volatile Organic Compounds in Milk during Heat Treatment Based on E-Nose, E-Tongue and HS-SPME-GC-MS. Foods 2023, 12, 1071. [Google Scholar] [CrossRef]
  21. Lee-Rangel, H.A.; Mendoza-Martinez, G.D.; Diaz de León-Martínez, L.; Relling, A.E.; Vazquez-Valladolid, A.; Palacios-Martínez, M.; Hernández-García, P.A.; Chay-Canul, A.J.; Flores-Ramirez, R.; Roque-Jiménez, J.A. Application of an Electronic Nose and HS-SPME/GC-MS to Determine Volatile Organic Compounds in Fresh Mexican Cheese. Foods 2022, 11, 1887. [Google Scholar] [CrossRef]
  22. Liberto, E.; Bressanello, D.; Strocchi, G.; Cordero, C.; Ruosi, M.R.; Pellegrino, G.; Bicchi, C.; Sgorbini, B. HS-SPME-MS-Enose Coupled with Chemometrics as an Analytical Decision Maker to Predict In-Cup Coffee Sensory Quality in Routine Controls: Possibilities and Limits. Molecules 2019, 24, 4515. [Google Scholar] [CrossRef] [PubMed]
  23. Nimsuk, N. Improvement of Accuracy in Beer Classification Using Transient Features for Electronic Nose Technology. J. Food Meas. Charact. 2019, 13, 656–662. [Google Scholar] [CrossRef]
  24. Vera, L.; Aceña, L.; Guasch, J.; Boqué, R.; Mestres, M.; Busto, O. Characterization and Classification of the Aroma of Beer Samples by Means of an MS E-Nose and Chemometric Tools. Anal. Bioanal. Chem. 2011, 399, 2073–2081. [Google Scholar] [CrossRef] [PubMed]
  25. Ghasemi-Varnamkhasti, M.; Mohtasebi, S.S.; Siadat, M.; Lozano, J.; Ahmadi, H.; Razavi, S.H.; Dicko, A. Aging Fingerprint Characterization of Beer Using Electronic Nose. Sens. Actuators B Chem. 2011, 159, 51–59. [Google Scholar] [CrossRef]
  26. Ghasemi-Varnamkhasti, M.; Mohtasebi, S.S.; Siadat, M.; Razavi, S.H.; Ahmadi, H.; Dicko, A. Discriminatory Power Assessment of the Sensor Array of an Electronic Nose System for the Detection of Non Alcoholic Beer Aging. Czech J. Food Sci. 2012, 30, 236–240. [Google Scholar] [CrossRef]
  27. Fromuth, K.; Chaparro, J.M.; Sedin, D.; Van Buiten, C.; Prenni, J.E. Characterizing the Impact of Package Type on Beer Stability. ACS Food Sci. Technol. 2023, 3, 616–625. [Google Scholar] [CrossRef]
  28. Aguiar, D.; Pereira, A.C.; Marques, J.C. The Influence of Transport and Storage Conditions on Beer Stability—A Systematic Review. Food Bioprocess Technol. 2022, 15, 1477–1494. [Google Scholar] [CrossRef]
  29. Olaniran, A.O.; Hiralal, L.; Mokoena, M.P.; Pillay, B. Flavour-Active Volatile Compounds in Beer: Production, Regulation and Control. J. Inst. Brew. 2017, 123, 13–23. [Google Scholar] [CrossRef]
  30. Jaskula-Goiris, B.; De Causmaecker, B.; De Rouck, G.; Aerts, G.; Paternoster, A.; Braet, J.; De Cooman, L. Influence of Transport and Storage Conditions on Beer Quality and Flavour Stability. J. Inst. Brew. 2019, 125, 60–68. [Google Scholar] [CrossRef]
  31. Paternoster, A.; Jaskula-Goiris, B.; Perkisas, T.; Springael, J.; De Rouck, G.; De Cooman, L.; Braet, J. A Model to Simulate the Overall Ageing Score Impact of Temperature and Time on the Sensorial Quality of Lager. J. Inst. Brew. 2019, 125, 364–373. [Google Scholar] [CrossRef]
  32. Lorencová, E.; Salek, R.N.; Černošková, I.; Buňka, F. Evaluation of Force-Carbonated Czech-Type Lager Beer Quality during Storage in Relation to the Applied Type of Packaging. Food Control 2019, 106, 106706. [Google Scholar] [CrossRef]
  33. Gagula, G.; Mastanjević, K.; Mastanjević, K.; Krstanović, V.; Horvat, D.; Magdić, D. The Influence of Packaging Material on Volatile Compounds of Pale Lager Beer. Food Packag. Shelf Life 2020, 24, 100496. [Google Scholar] [CrossRef]
Figure 1. Comparison of the mass spectra of a given sample at different ageing times.
Beverages 10 00011 g001
Figure 2. Score plot of the first two principal components in the PCA model (A): Aluminium can (Class 0) vs. glass bottle (Class 1). (B): Fresh samples (Class 0) vs. aged samples (Class 1). Green ellipse: fresh samples bought in a supermarket; red ellipse: fresh samples from a brewery; yellow ellipse: 6-month aged samples; blue ellipse: 11-month aged samples.
Beverages 10 00011 g002
Figure 3. Results of the PLS-DA models. (A) Aluminium can (grey) vs. glass bottle (red); (B) Fresh samples (from brewery and supermarket) (grey) vs. aged samples (6 and 11 months aged) (red).
Beverages 10 00011 g003
Figure 4. Plot of predicted vs. actual values for the validation set and some parameters of the PLSR model. Class 1: 0 months (fresh samples from a brewery); Class 2: 1 month (fresh samples from a supermarket); Class 3: 6- and 11 months-aged. Red line: regression line. Green line: target line.
Beverages 10 00011 g004
Disclaimer/Publisher’s Note: The statements, opinions and data contained in all publications are solely those of the individual author(s) and contributor(s) and not of MDPI and/or the editor(s). MDPI and/or the editor(s) disclaim responsibility for any injury to people or property resulting from any ideas, methods, instructions or products referred to in the content.

