
Investigating the Malting Suitability and Brewing Quality of Different Rice Cultivars

 , , , , , and
Abstract
:1. Introduction
2. Materials and Methods
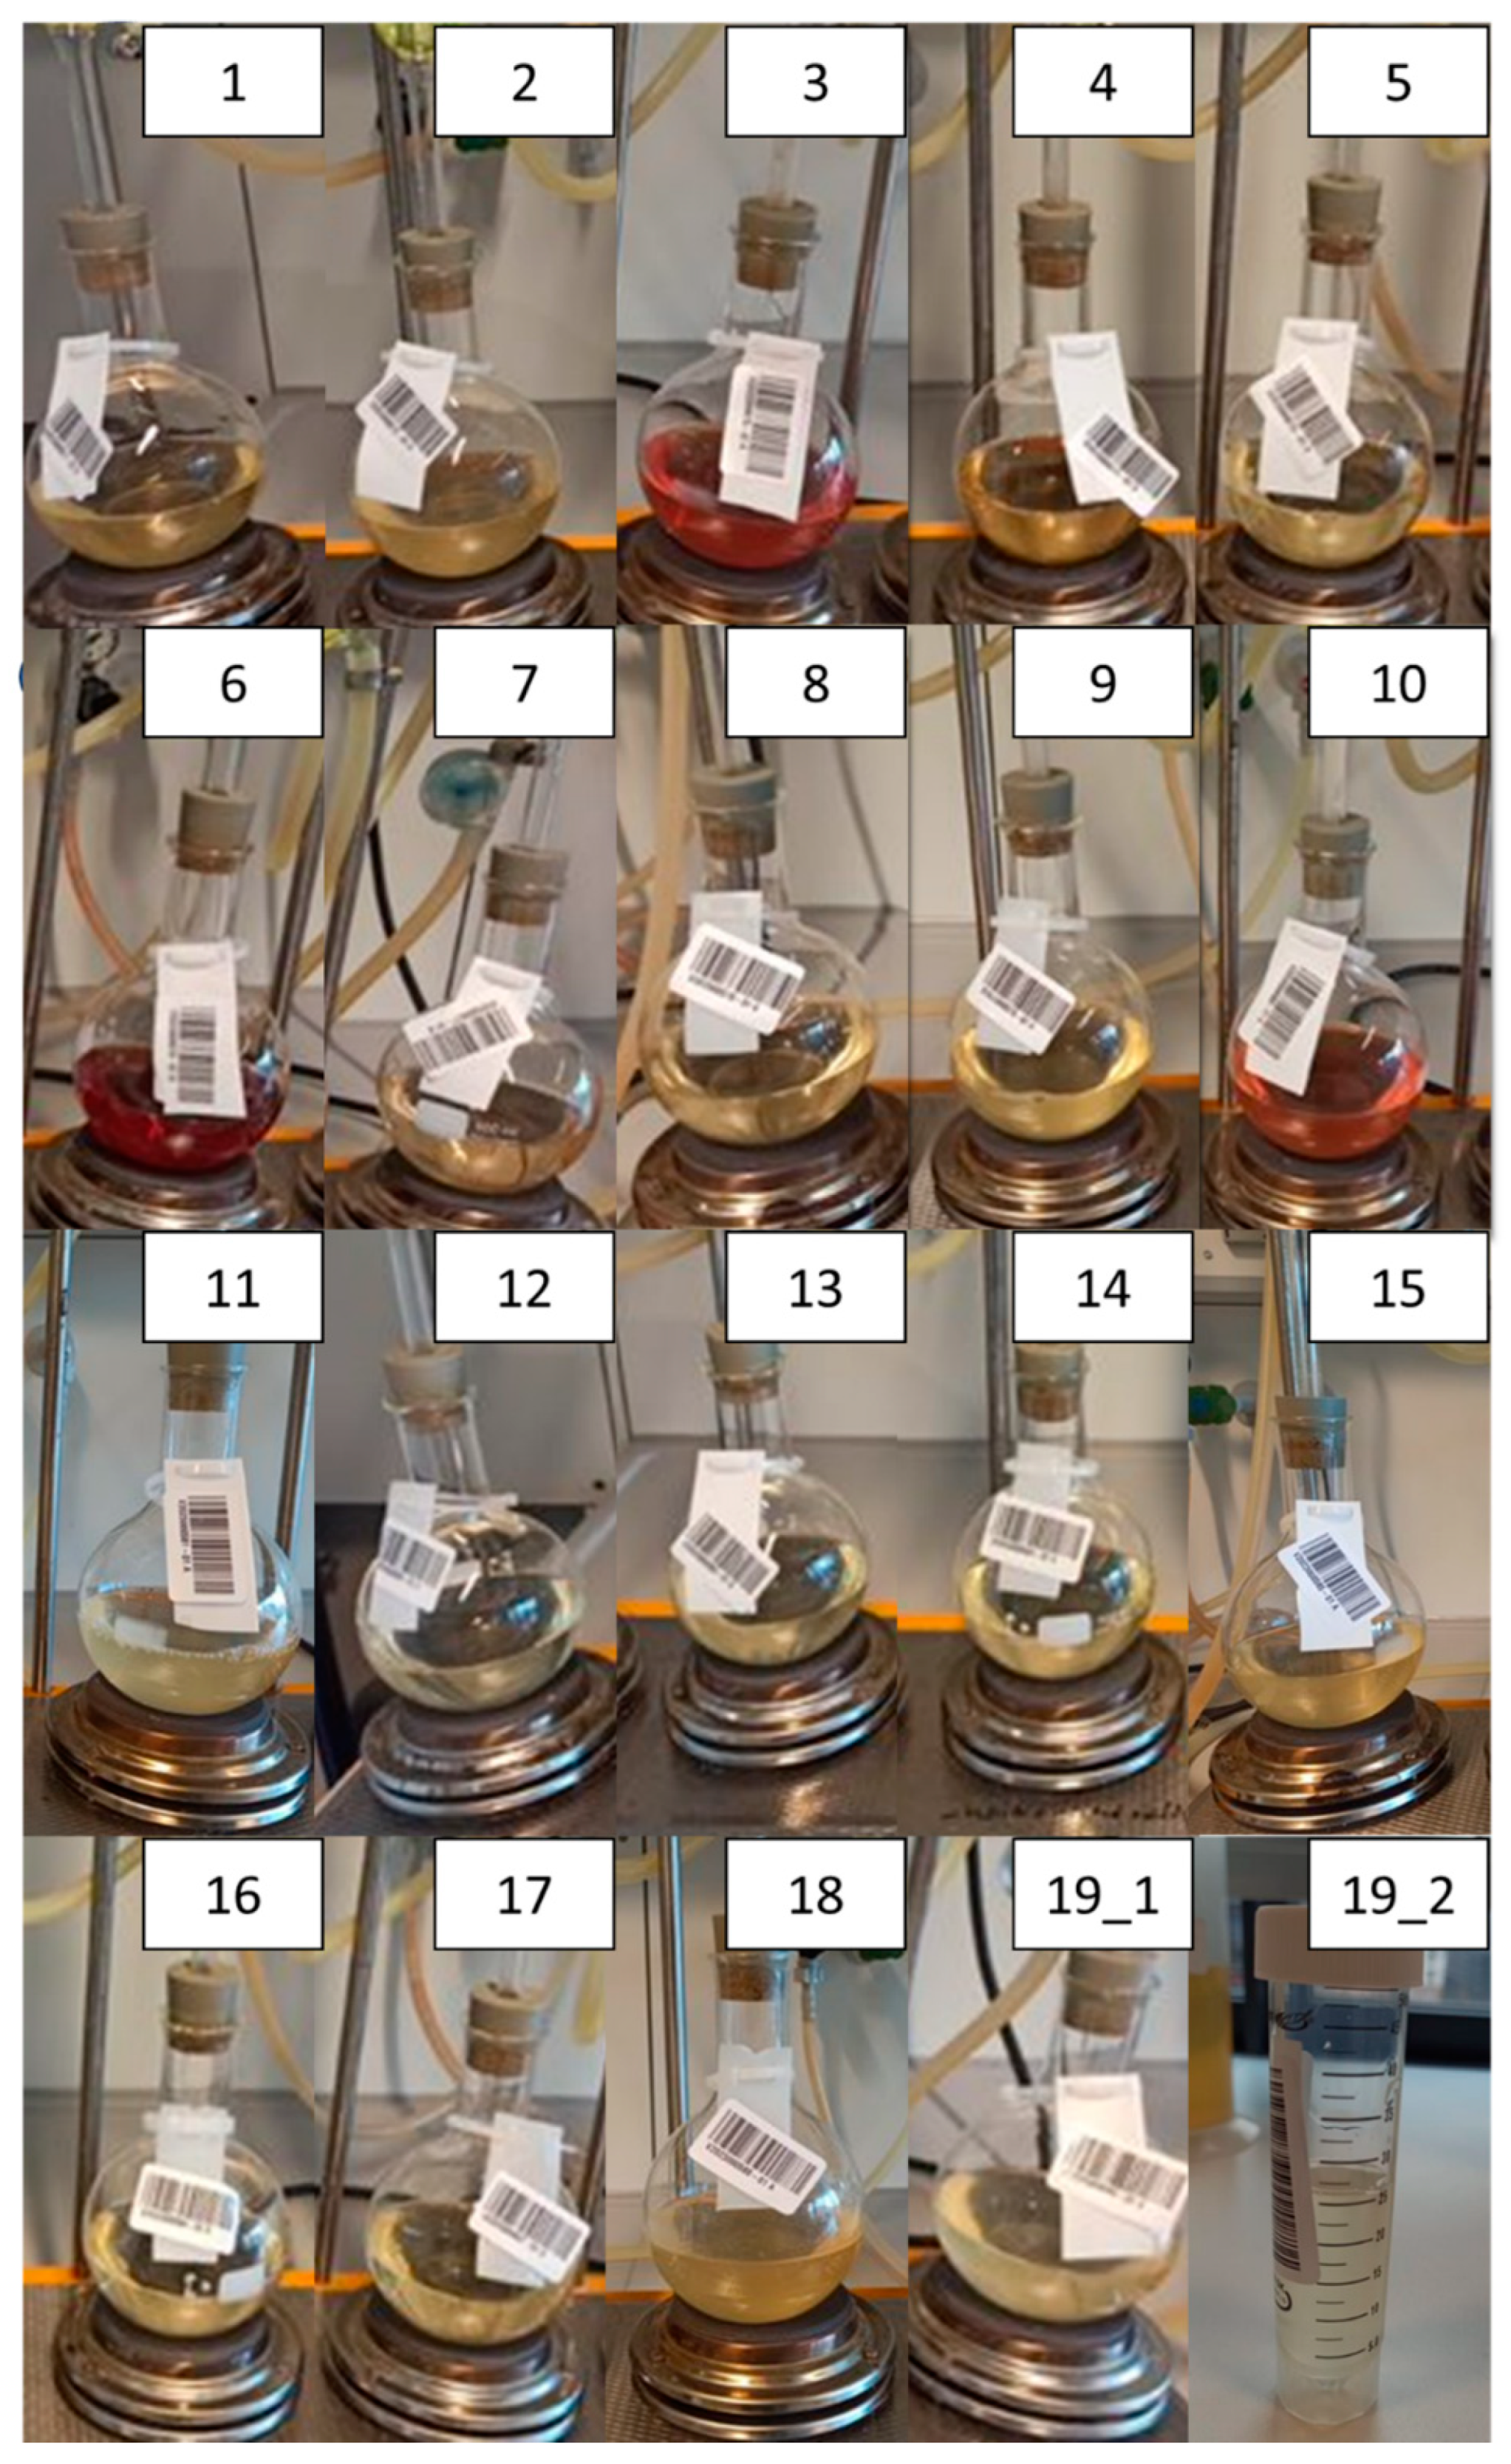
2.1. Rice Samples
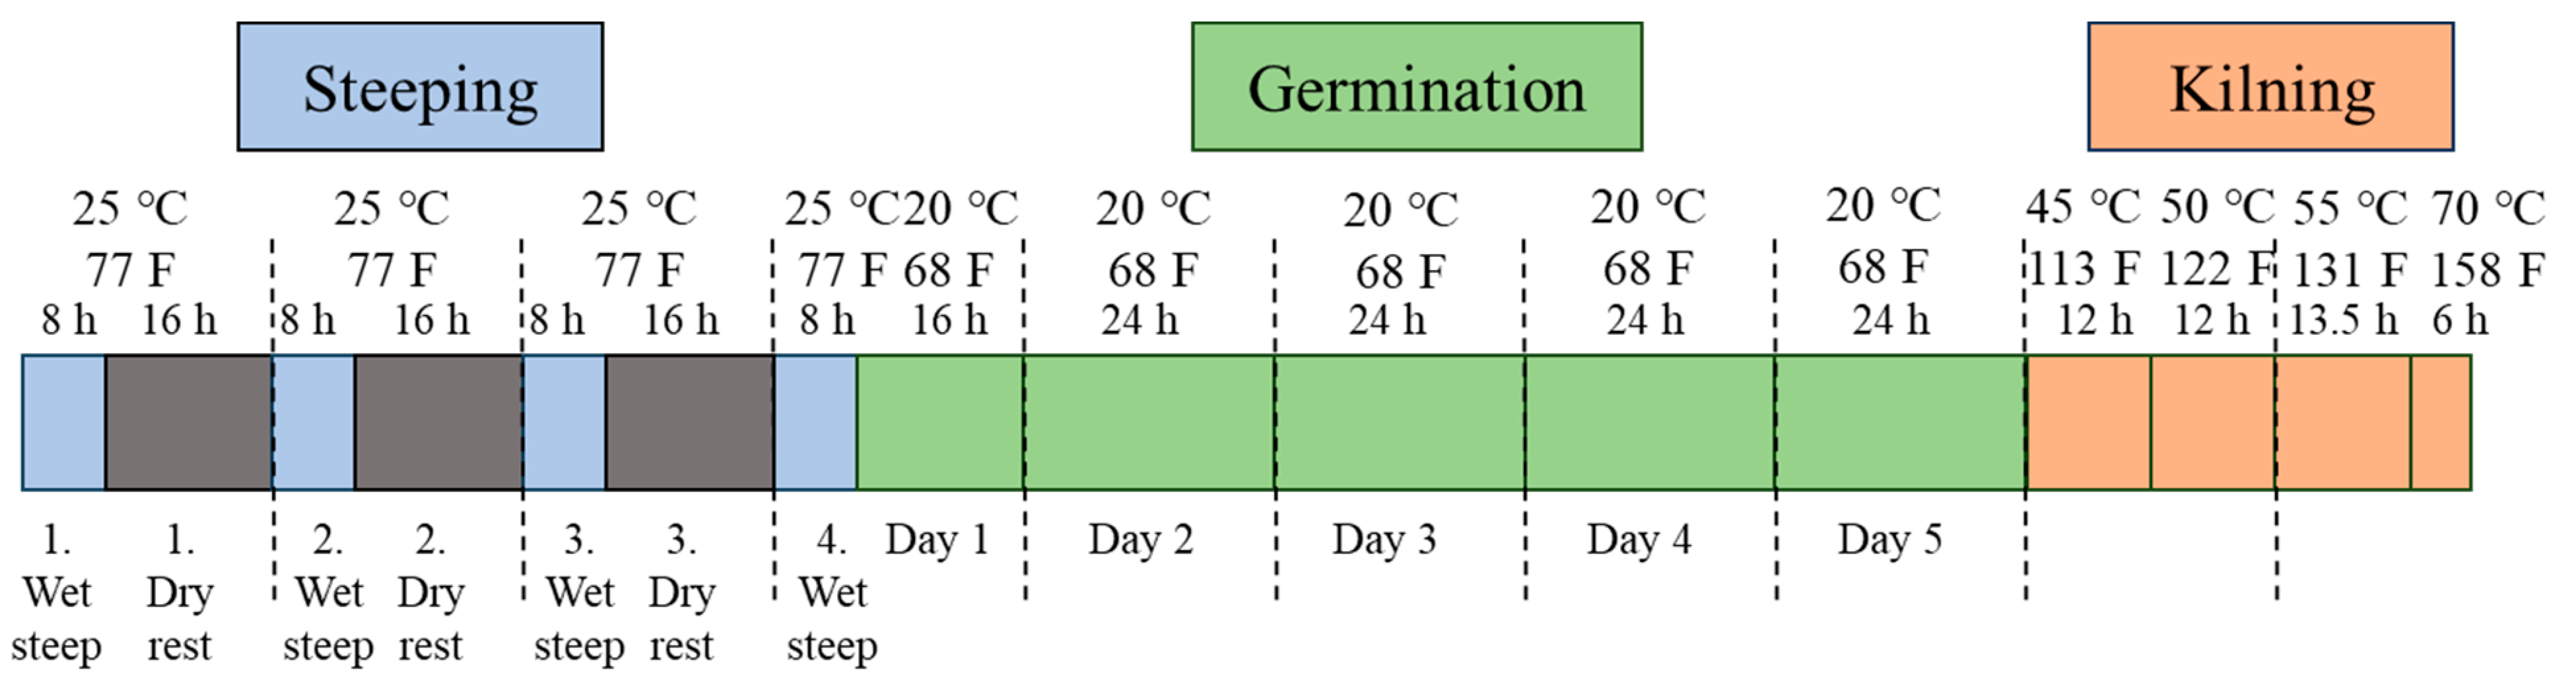
2.2. Micro Malting
2.3. Malted Rice Analyses
2.4. Statistical Analyses
3. Results and Discussion
3.1. Paddy Rice Quality Characteristics
3.1.1. General Seed and Malting Qualities
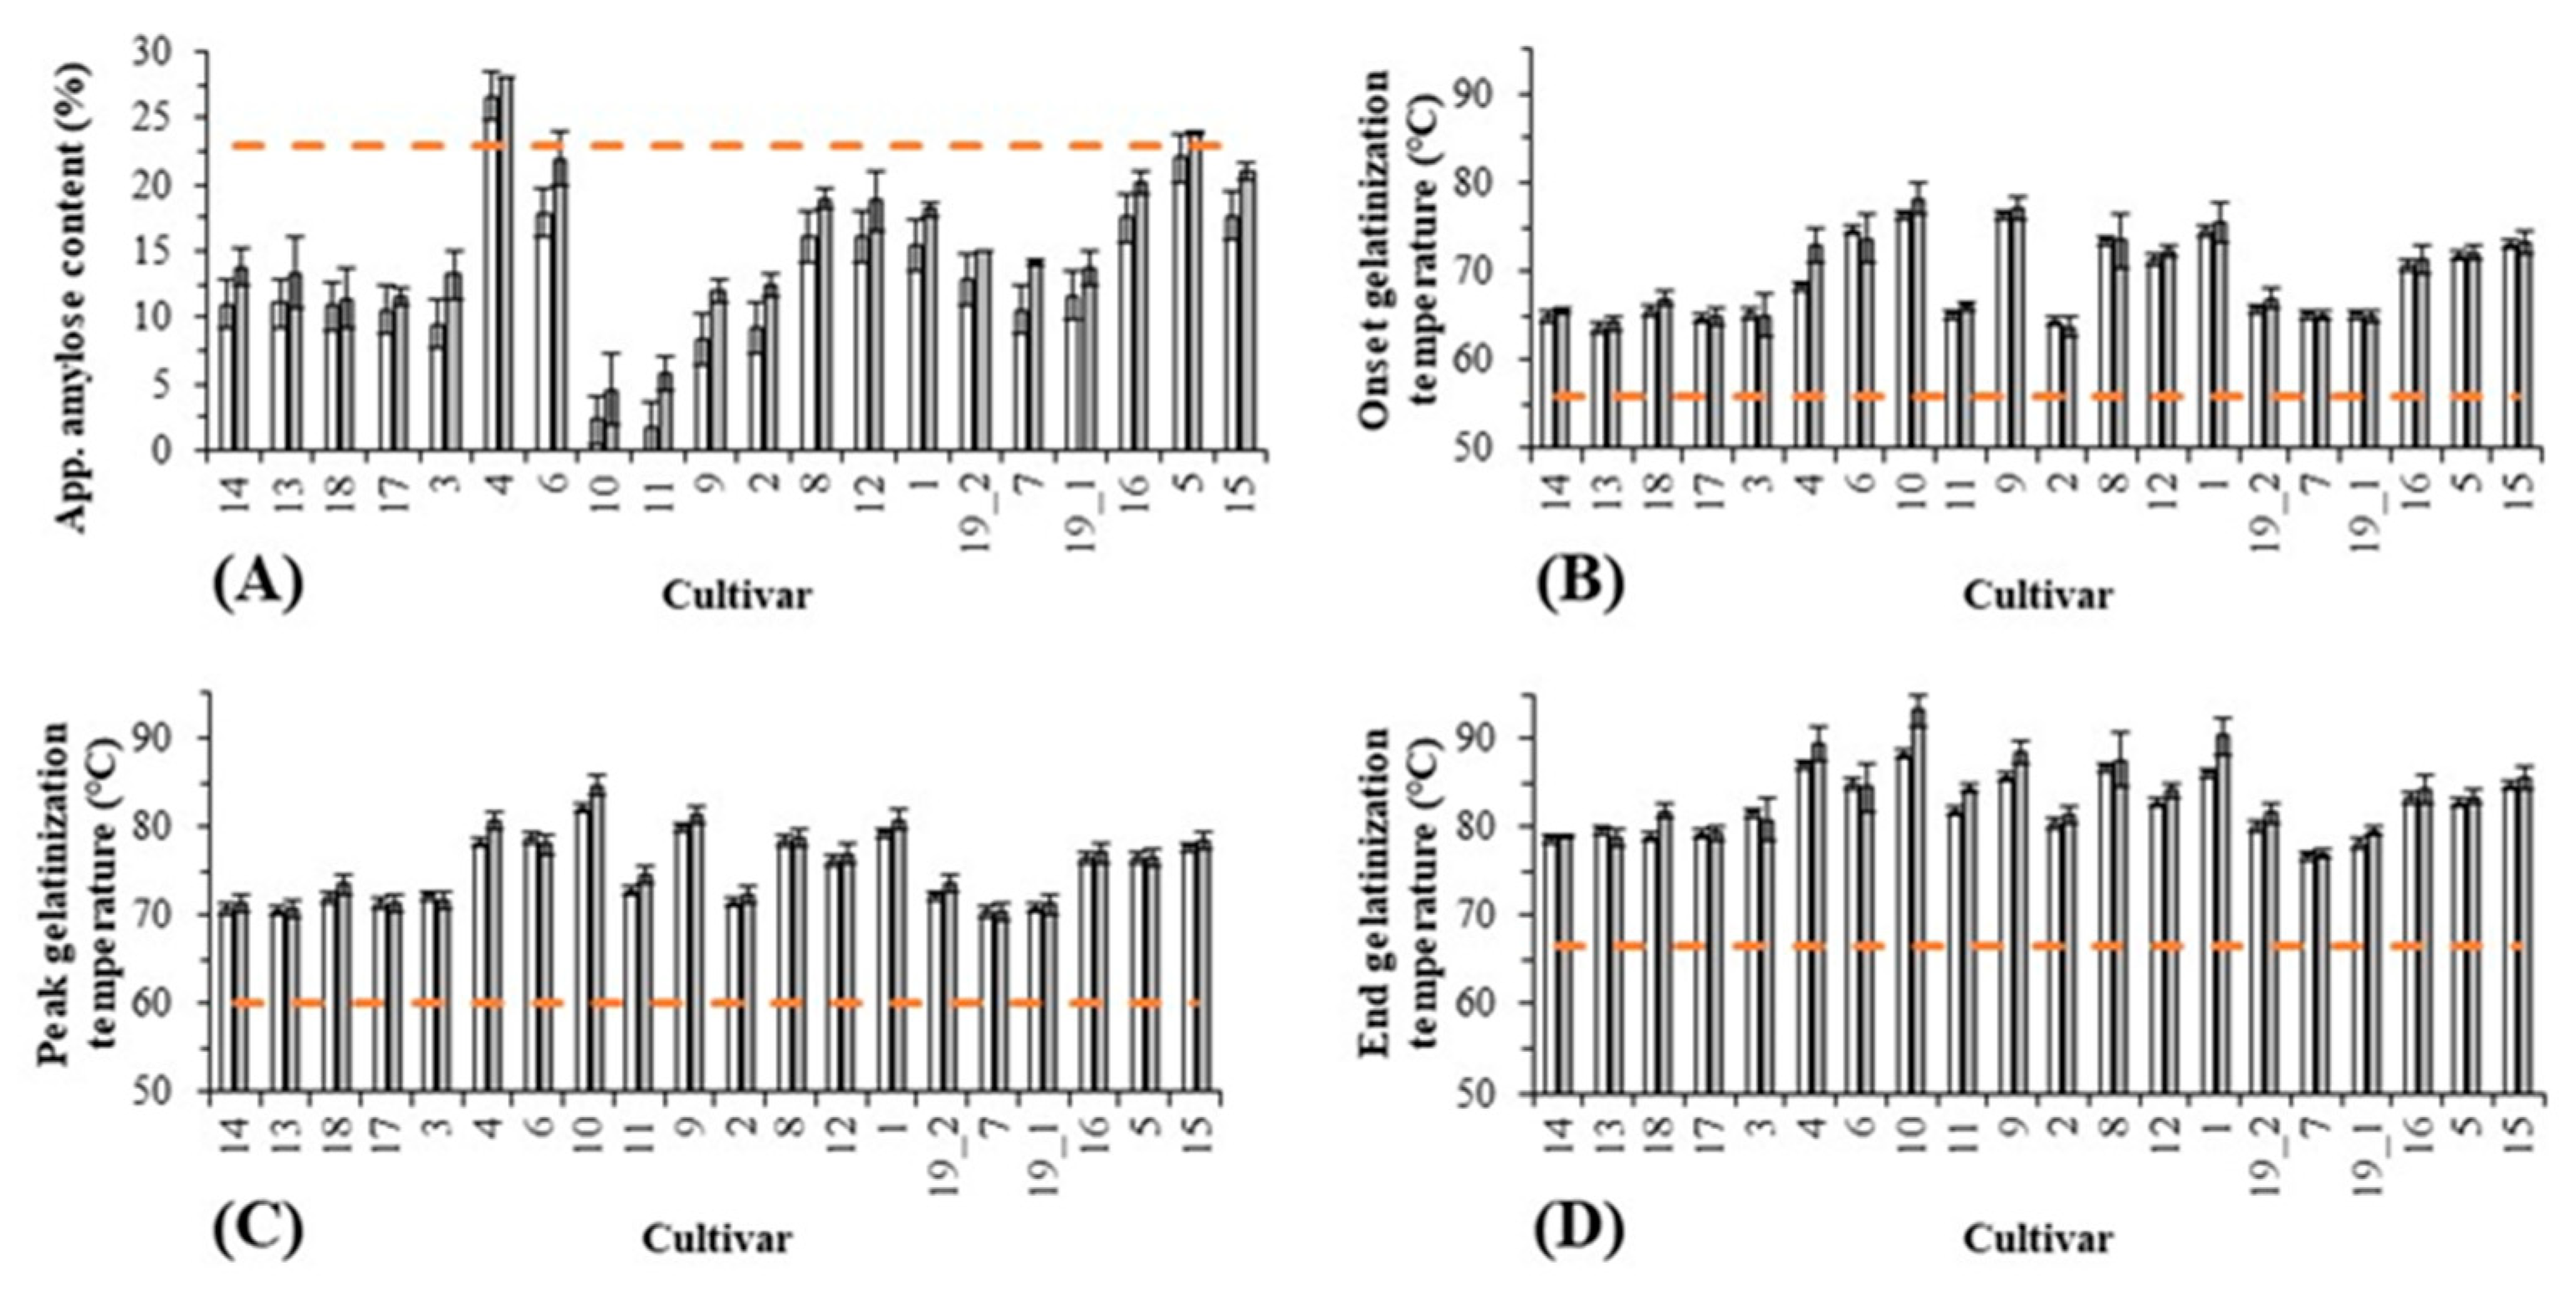
3.1.2. Starch Qualities
3.2. Malted Rice Quality Characteristics
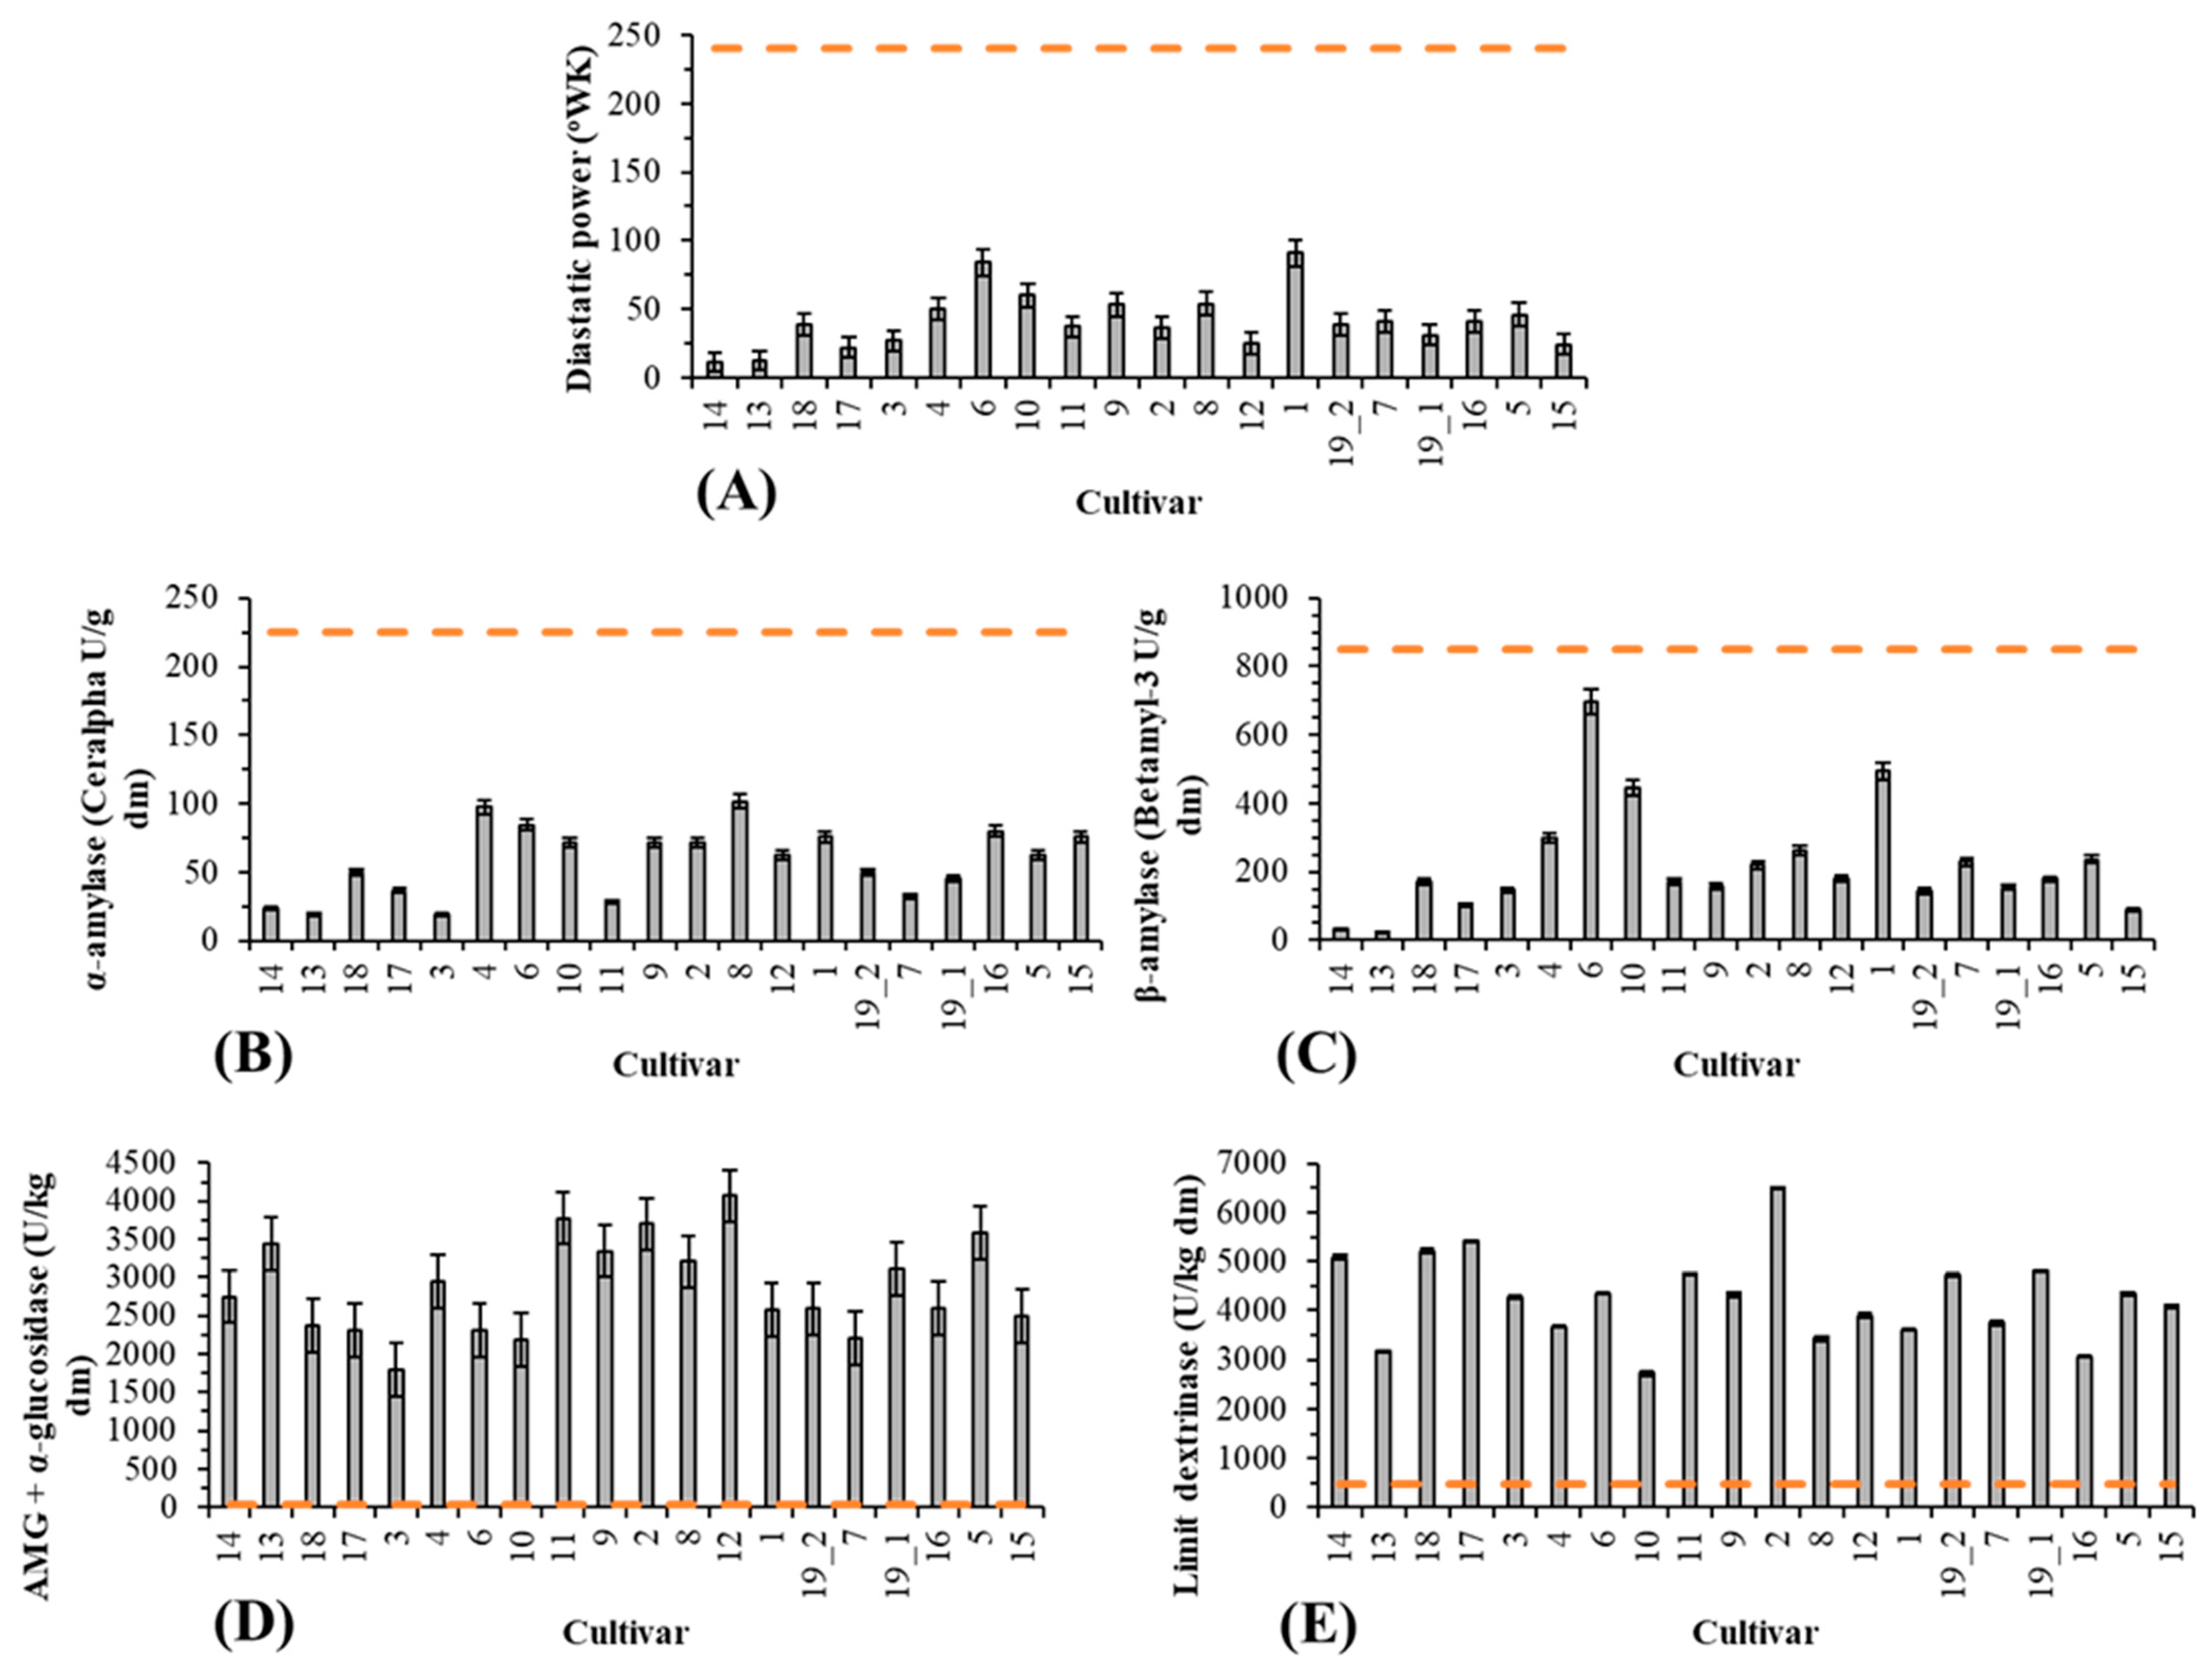
3.2.1. Enzymatic Activities
3.2.2. Starch Qualities

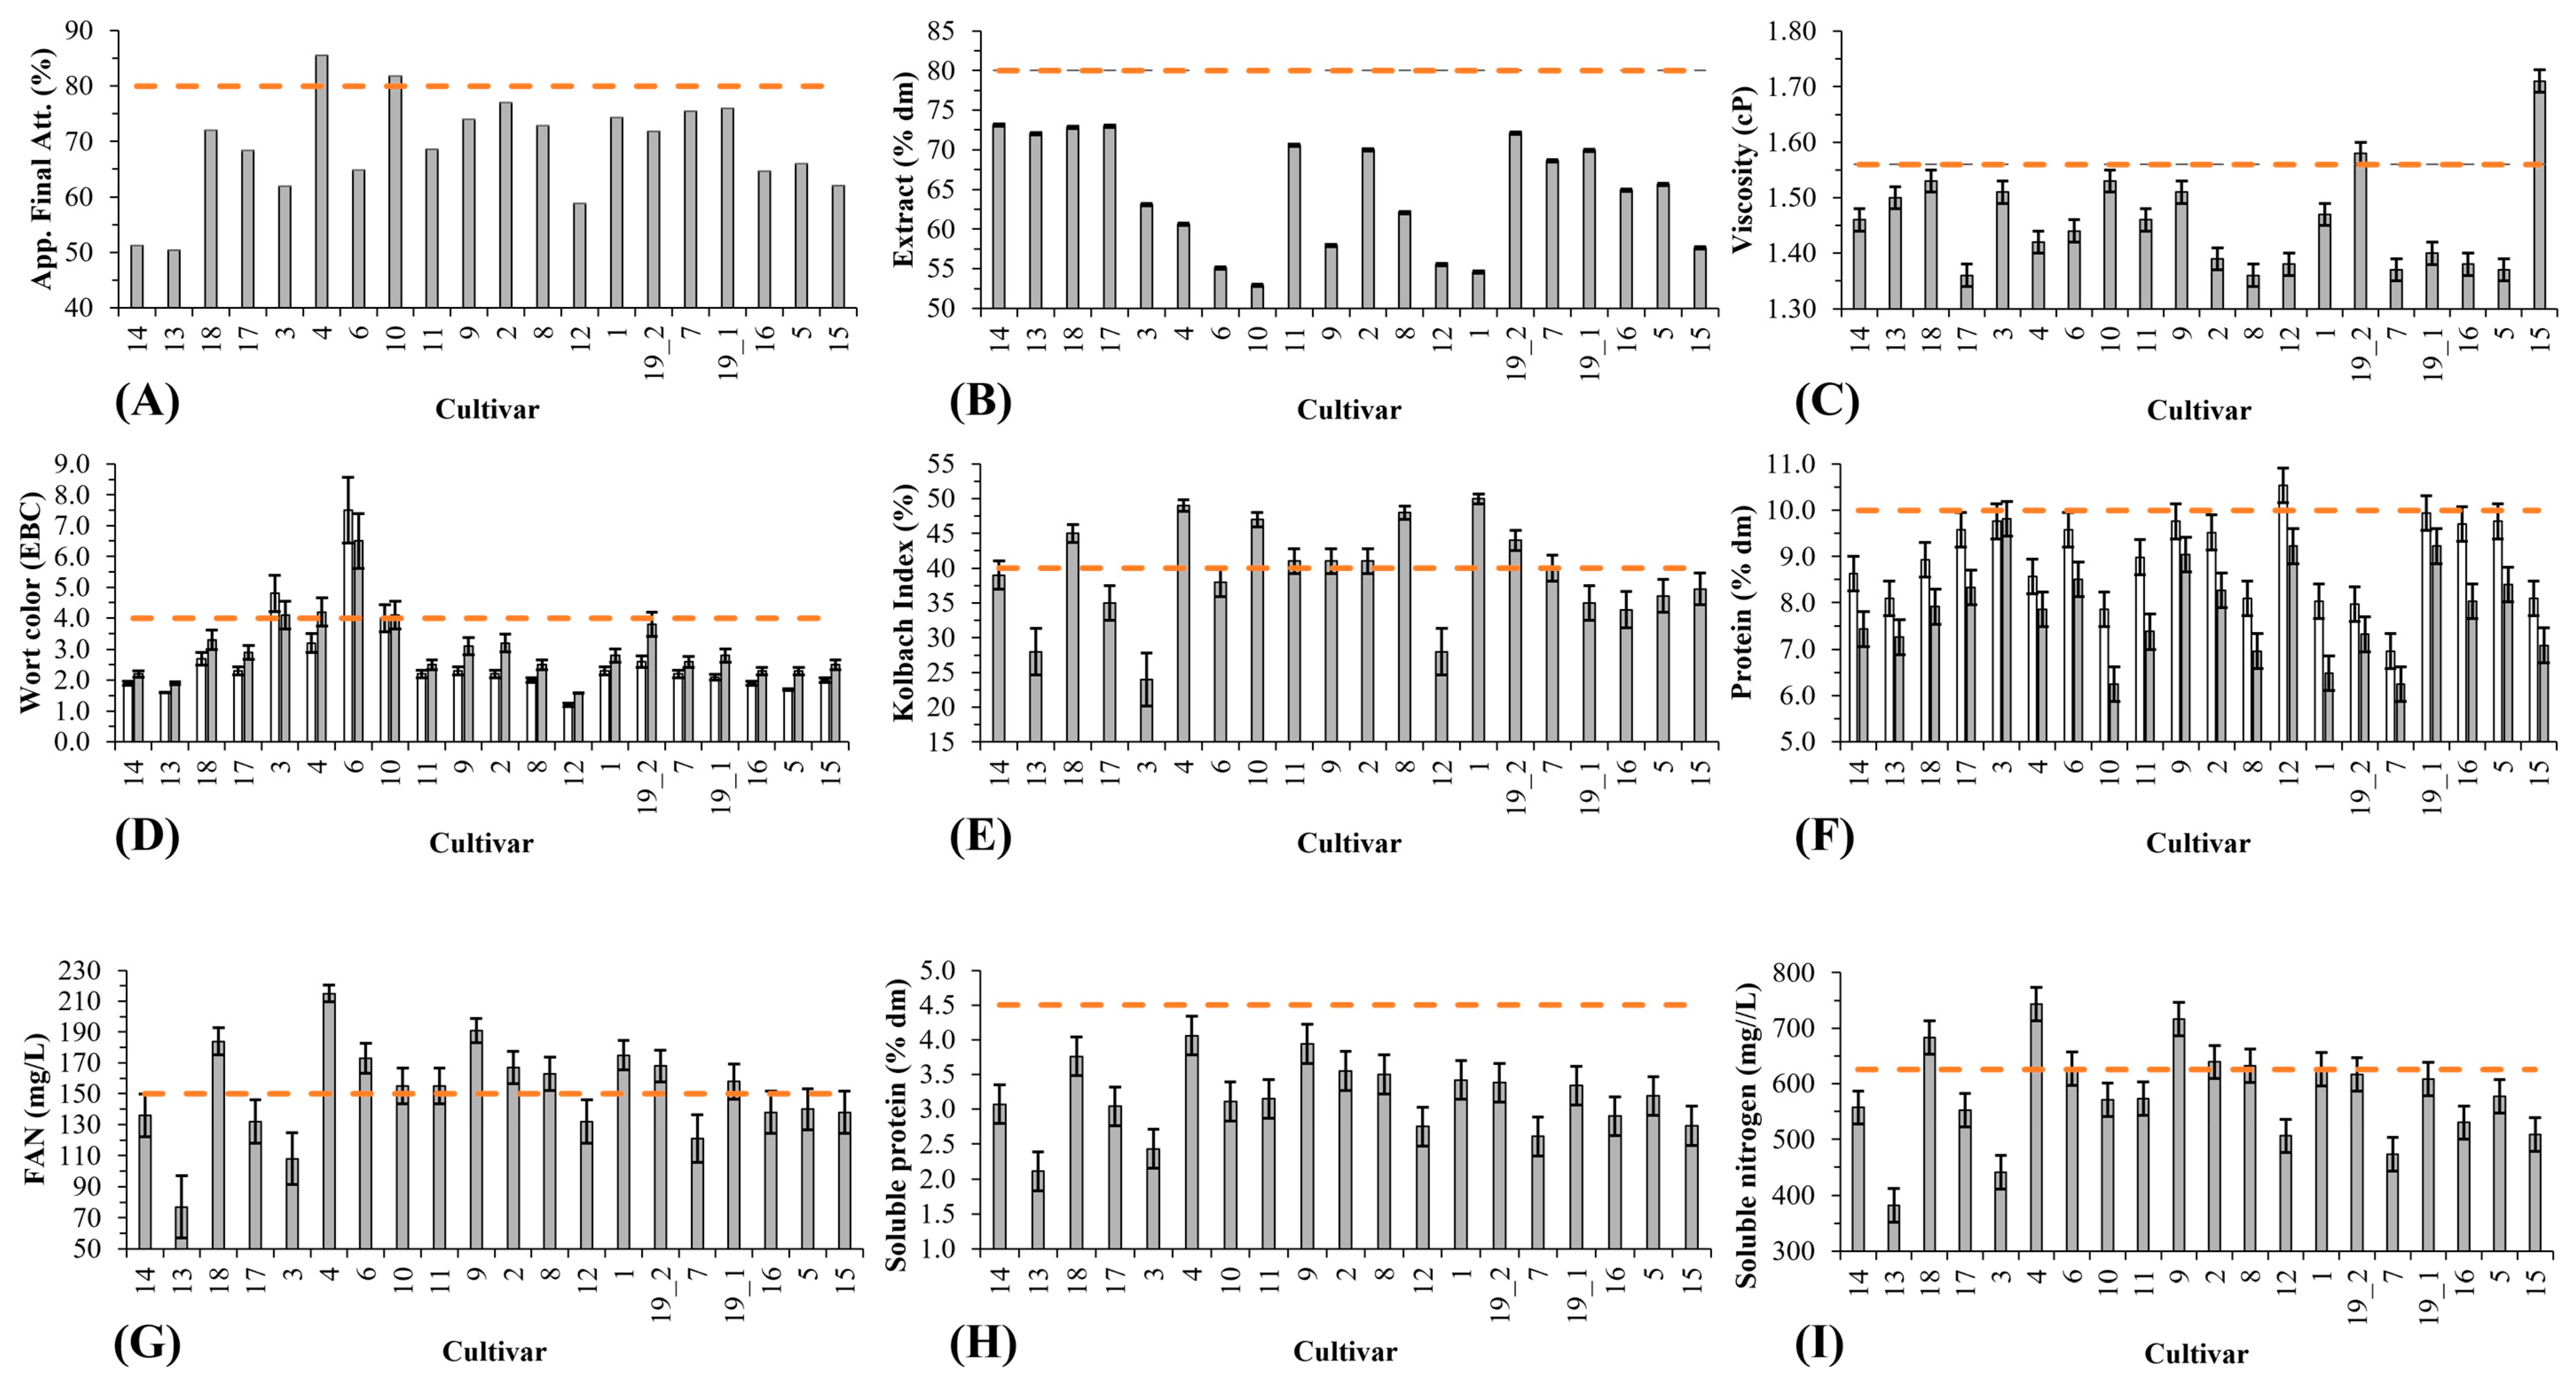
3.2.3. Congress Wort Viscosity
3.2.4. Congress Mash Saccharification
3.2.5. Protein
3.2.6. Wort Color
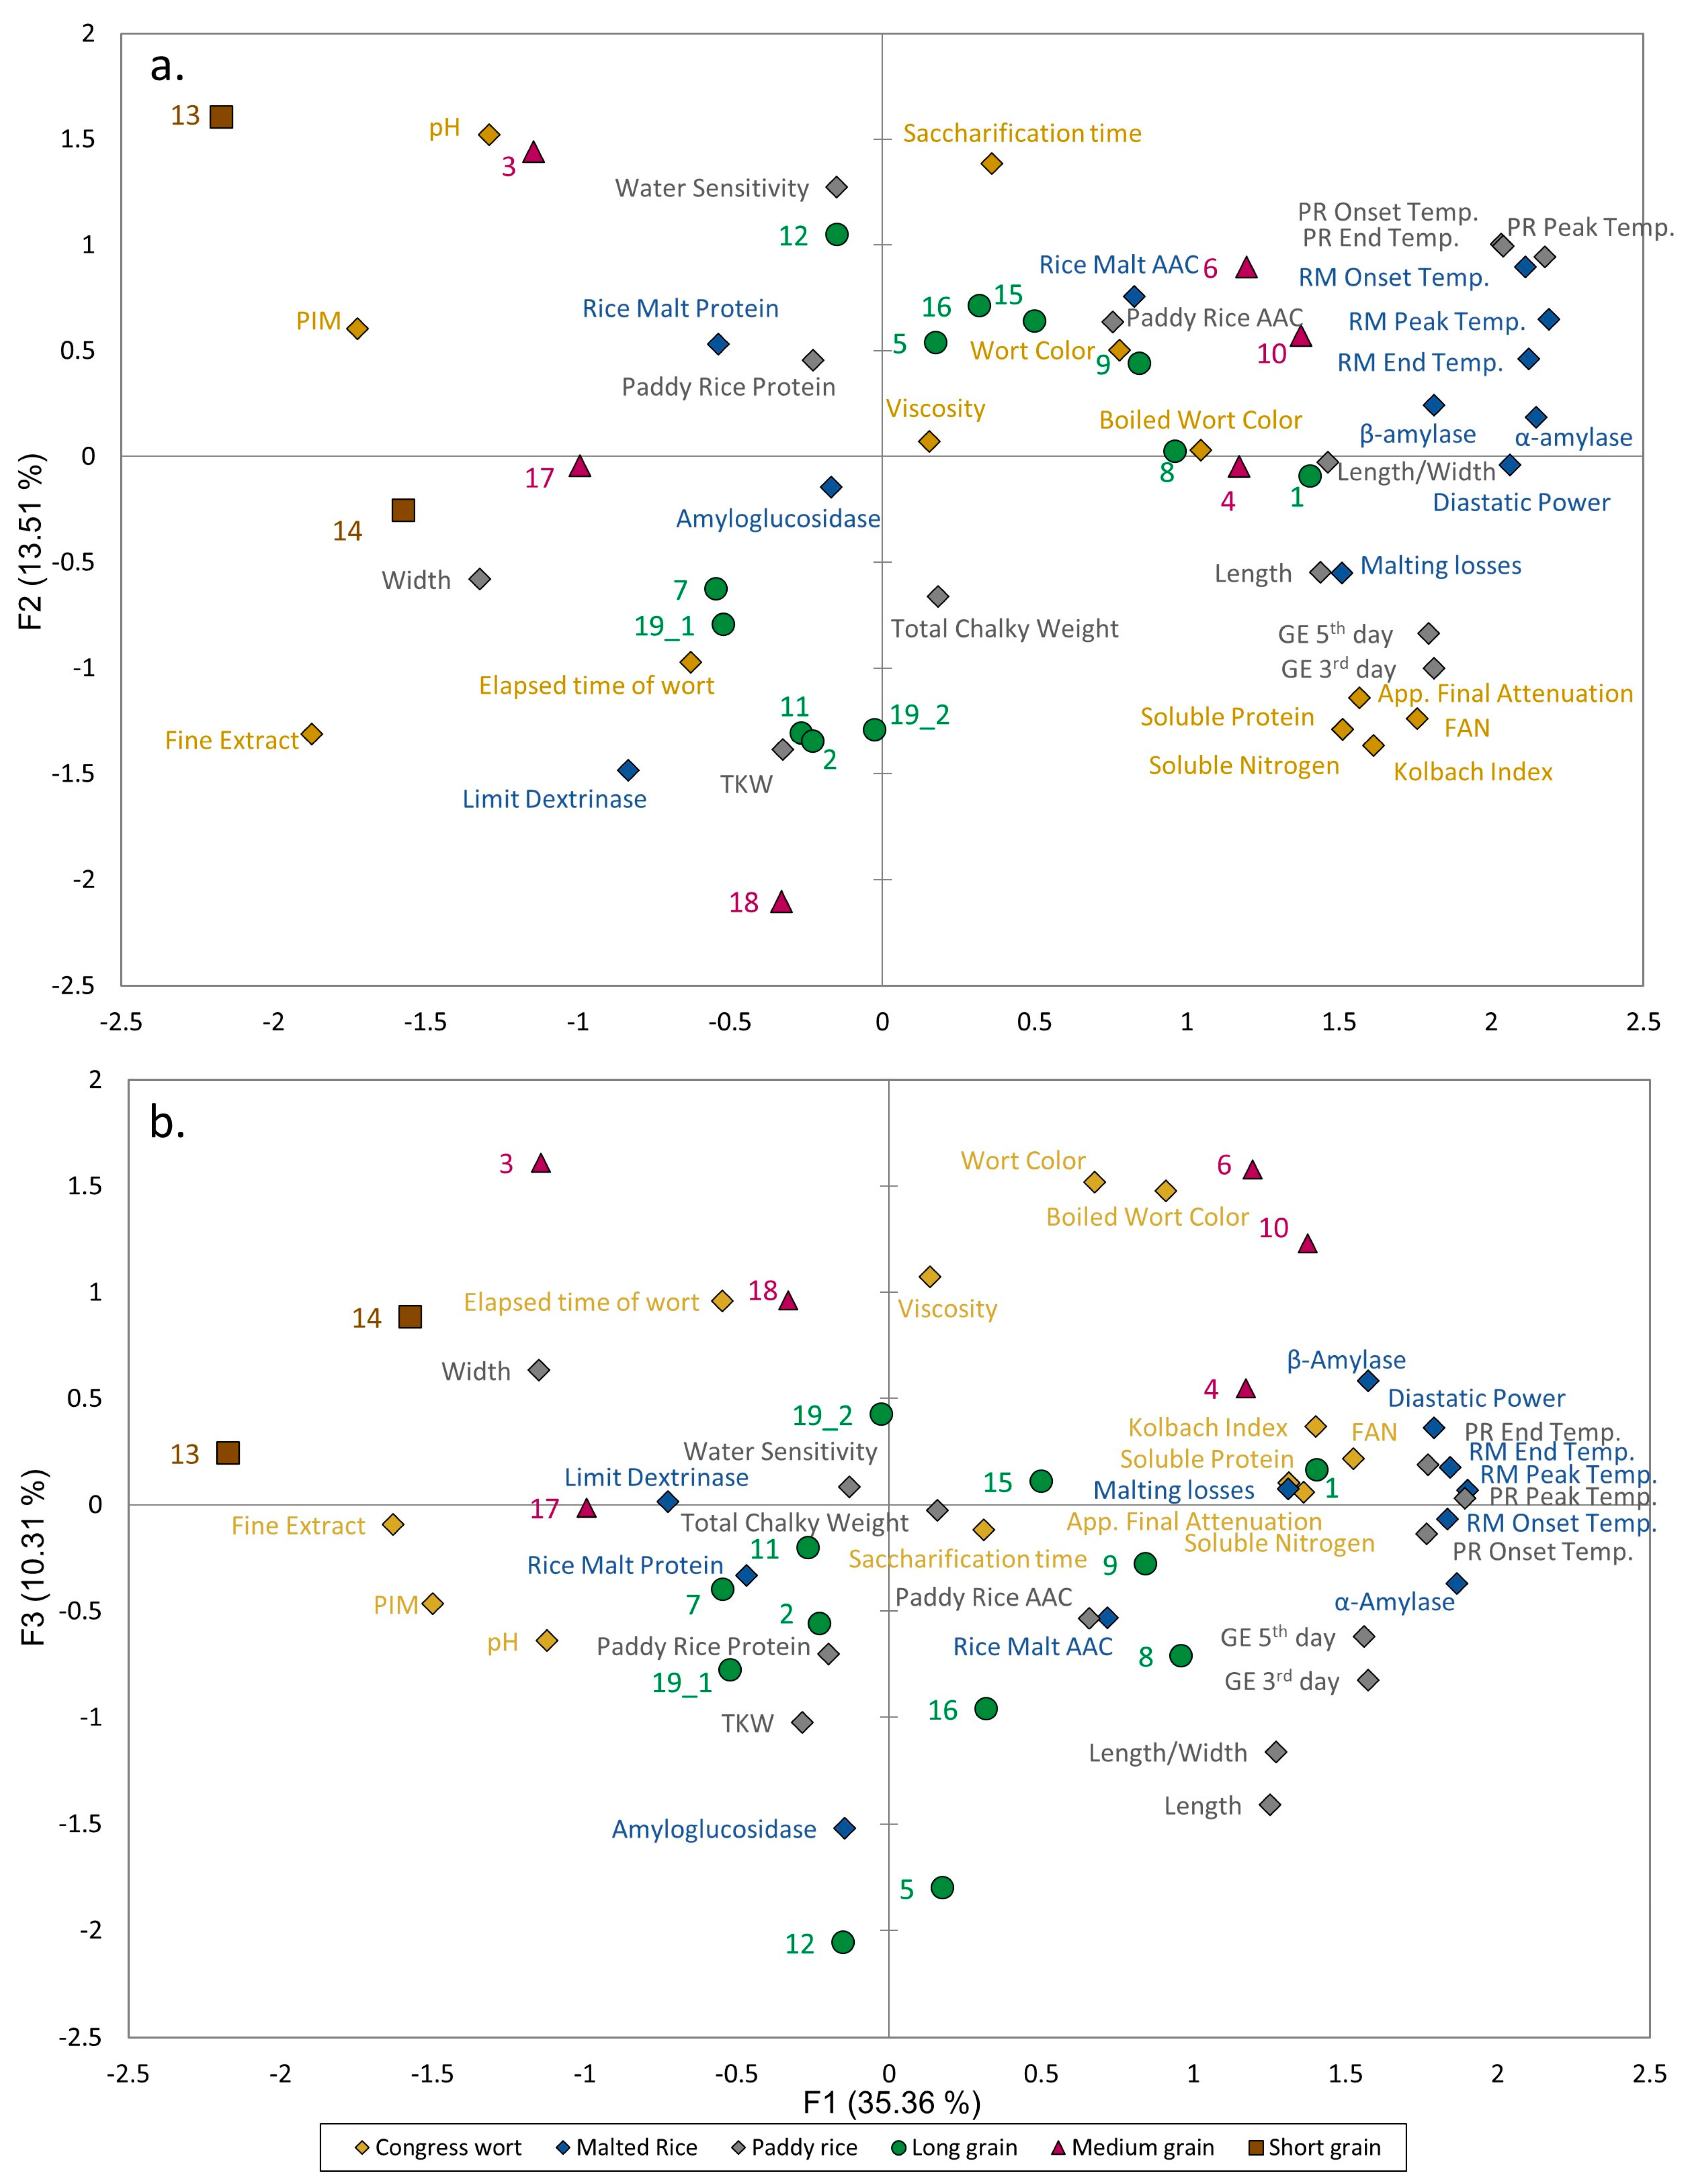
3.3. Principal Component Analysis of Paddy Rice, Malted Rice, and Congress Wort Attributes
4. Conclusions

Supplementary Materials
Author Contributions
Funding
Data Availability Statement
Acknowledgments
Conflicts of Interest
References
- Xie, W.; Xiong, W.; Pan, J.; Ali, T.; Cui, Q.; Guan, D.; Meng, J.; Mueller, N.D.; Lin, E.; Davis, S.J. Decreases in global beer supply due to extreme drought and heat. Nat. Plants 2018, 4, 964–973. [Google Scholar] [CrossRef]
- Afonso, M.; Taylor, S.; Sonneville, F. The War in Ukraine’s Impact on Malting Barley Availability: Maltsters Need to Be Prepared to Step Up. Rabobank. 2022. Available online: https://research.rabobank.com/far/en/sectors/grains-oilseeds/the-war-in-ukraine-impact-on-malting-barley-availability.html (accessed on 4 August 2023).
- Dawson, I.K.; Russell, J.; Powell, W.; Steffenson, B.; Thomas, W.T.B.; Waugh, R. Barley: A translational model for adaptation to climate change. New Phytol. 2015, 206, 913–931. [Google Scholar] [CrossRef]
- USDA National Agricultural Statistics Service. Quick Stats; 2023. Available online: https://quickstats.nass.usda.gov/ (accessed on 15 November 2023).
- Bento, V.A.; Ribeiro, A.F.S.; Russo, A.; Gouveia, C.M.; Cardoso, R.M.; Soares, P.M.M. The impact of climate change in wheat and barley yields in the Iberian Peninsula. Sci. Rep. 2021, 11, 15484. [Google Scholar] [CrossRef]
- Cammarano, D.; Ceccarelli, S.; Grando, S.; Romagosa, I.; Benbelkacem, A.; Akar, T.; Al-Yassin, A.; Pecchioni, N.; Francia, E.; Ronga, D. The impact of climate change on barley yield in the Mediterranean basin. Eur. J. Agron. 2019, 106, 1–11. [Google Scholar] [CrossRef]
- The Observatory of Economic Complexity. Rice. 2021. Available online: https://oec.world/en/profile/hs/rice?countryComparisonFlowSelector=Exports&countryComparisonGeoSelector=na&countryComparisonMeasureSelector=Trade%20Value&latestTrendsScaleSelector=Trade%20Value%20Growth (accessed on 10 February 2023).
- USDA Economic Research Service. Rice Sector at a Glance; 2022. Available online: https://www.ers.usda.gov/topics/crops/rice/rice-sector-at-a-glance/ (accessed on 29 January 2023).
- Zhao, C.; Liu, B.; Piao, S.; Wang, X.; Lobell, D.B.; Huang, Y.; Huang, M.; Yao, Y.; Bassu, S.; Ciais, P.; et al. Temperature increase reduces global yields of major crops in four independent estimates. Proc. Natl. Acad. Sci. USA 2017, 114, 9326–9331. [Google Scholar] [CrossRef]
- Nalley, L.L.; Massey, J.; Durand-Morat, A.; Shew, A.; Parajuli, R.; Tsiboe, F. Comparative economic and environmental assessments of furrow- and flood-irrigated rice production systems. Agric. Water Manag. 2022, 274, 107964. [Google Scholar] [CrossRef]
- Rajaniemi, M.; Mikkola, H.; Ahokas, J. Greenhouse gas emissions from oats, barley, wheat and rye production. Agron. Res. 2011, 9, 189–195. [Google Scholar]
- Oliveira, M.E.A.S.; Coimbra, P.P.S.; Galdeano, M.C.; Carvalho, C.W.P.; Takeiti, C.Y. How does germinated rice impact starch structure, products and nutrional evidences?—A review. Trends Food Sci. Technol. 2022, 122, 13–23. [Google Scholar] [CrossRef]
- Zhu, L.; Gu, M.; Meng, X.; Cheung, S.C.K.; Yu, H.; Huang, J.; Sun, Y.; Shi, Y.; Liu, Q. High-amylose rice improves indices of animal health in normal and diabetic rats. Plant Biotechnol. J. 2012, 10, 353–362. [Google Scholar] [CrossRef] [PubMed]
- Rittenauer, M.; Gladis, S.; Gastl, M.; Becker, T. Gelatinization or pasting? The impact of different temperature levels on the saccharification efficiency of barley malt starch. Foods 2021, 10, 1733. [Google Scholar] [CrossRef] [PubMed]
- Langenaeken, N.A.; De Schepper, C.F.; De Schutter, D.P.; Courtin, C.M. Different gelatinization characteristics of small and large barley starch granules impact their enzymatic hydrolysis and sugar production during mashing. Food Chem. 2019, 295, 138–146. [Google Scholar] [CrossRef]
- Fox, G.; Yu, W.; Nischwitz, R.; Harasymow, S. Variation in maltose in sweet wort from barley malt and rice adjuncts with differences in amylose structure. J. Inst. Brew. 2019, 125, 18–27. [Google Scholar] [CrossRef]
- Marconi, O.; Sileoni, V.; Ceccaroni, D.; Perretti, G. The Use of Rice in Brewing. In Advances in International Rice Research; Jinquan, L., Ed.; IntechOpen: London, UK, 2017; Chapter 4; pp. 49–66. [Google Scholar]
- Yang, D.; Gao, X. Progress of the use of alternatives to malt in the production of gluten-free beer. Crit. Rev. Food Sci. Nutr. 2022, 62, 2820–2835. [Google Scholar] [CrossRef]
- Usansa, U.; Burberg, F.; Geiger, E.; Back, W.; Wanapu, C.; Arendt, E.K.; Kreisz, S.; Boonkerd, N.; Teaumroong, N.; Zarnkow, M. Optimization of Malting Conditions for Two Black Rice Varieties, Black Non-Waxy Rice and Black Waxy Rice (Oryza sativa L. Indica). J. Inst. Brew. 2011, 117, 39–46. [Google Scholar] [CrossRef]
- Patindol, J.; Jinn, J.-R.; Wang, Y.-J.; Siebenmorgen, T. Kernel and Starch Properties of U.S. and Imported Medium- and Short-Grain Rice Cultivars. Cereal Chem. 2016, 93, 529–535. [Google Scholar] [CrossRef]
- Mayer, H.; Marconi, O.; Regnicoli, G.F.; Perretti, G.; Fantozzi, P. Production of a Saccharifying Rice Malt for Brewing Using Different Rice Varieties and Malting Parameters. J. Agric. Food Chem. 2014, 62, 5369–5377. [Google Scholar] [CrossRef] [PubMed]
- Ceccaroni, D.; Marconi, O.; Sileoni, V.; Wray, E.; Perretti, G. Rice malting optimization for the production of top-fermented gluten-free beer. J. Sci. Food Agric. 2019, 99, 2726–2734. [Google Scholar] [CrossRef]
- European Brewery Convention. Analytica—EBC methods 3.2—Moisture content of barley, 3.3.2—Total nitrogen of barley: Dumas Combustion Method, 3.4—Thousand corn Weight of Barley, 3.6.1—Germinative Energy of Barley: Aubry Method, 4.2—Moisture Content of Malt, 4.3.2—Total Nitrogen of Malt: Dumas Combustion Method, 4.5.1—Extract of Malt: Congress Mash, 4.7.1—Colour of Malt. Spectrophotometric Method (RM), 4.8—Viscosity of Laboratory Wort from Malt, 4.9.1—Soluble Nitrogen of Malt: Kjeldahl Method, 4.9.3—Soluble Nitrogen of Malt: Dumas Combustion Method, 4.10—Free Amino Nitrogen of Malt by Spectrophotometry, 4.12—Diastatic Power of Malt, 8.17—pH of Wort. In Analytica—EBC, 5th ed.; Fachverlag Hans Carl: Nuremberg, Germany, 2007. [Google Scholar]
- Methner, F.-J. RAW MATERIALS: Adjuncts, Barley, Malt, Hops and Hop Products; MEBAK, Fachverlag Hans Carl: Nuremberg, Germany, 2018. [Google Scholar]
- Juliano, B.O. A simplified assay for milled-rice amylose. Cereal Sci. Today 1971, 12, 334–360. [Google Scholar]
- Müller, C.; Kleinwaechter, M.; Selmar, D.; Methner, F.-J. The influence of the withering temperature on the resulting proteolytic and cytolytic modification of pale malt. BrewingScience 2014, 67, 88–95. [Google Scholar]
- Mitteleuropäische Brautechnische, A. Methods R-110.34.612 Water Sensitivity in Barley. Rev. 2016-03, R-200.22.111 β-Amylase Activity in Malt—Photometric Method. Rev. 2016-03, R-200.24.111 α-Amylase Activity in Malt—Photometric Method. Rev. 2016-03, and R-205.17.080 Limit of Attenuation in (Laboratory) Wort—Reference Method. Rev. 2016-03. In MEBAK; Fachverlag Hans Carl: Nuremberg, Germany, 2012. [Google Scholar]
- Megazyme. Amyloglucosidase Assay Reagent and Limit-Dextrinase Assay Kit (PullG6 Method). 2023. Available online: https://www.megazyme.com/shop-all-products/assay-kits (accessed on 15 March 2023).
- Ceppi, E.L.M.; Brenna, O.V. Experimental Studies to Obtain Rice Malt. J. Agric. Food Chem. 2010, 58, 7701–7707. [Google Scholar] [CrossRef]
- Rani, H.; Bhardwaj, R.D. Quality attributes for barley malt: “The backbone of beer”. J. Food Sci. 2021, 86, 3322–3340. [Google Scholar] [CrossRef]
- Zuo, Z.-W.; Zhang, Z.-H.; Huang, D.-R.; Fan, Y.-Y.; Yu, S.-B.; Zhuang, J.-Y.; Zhu, Y.-J. Control of Thousand-Grain Weight by OsMADS56 in Rice. Int. J. Mol. Sci. 2022, 23, 125. [Google Scholar] [CrossRef] [PubMed]
- USDA. Rice Inspection Handbook; 2020. Available online: https://www.ams.usda.gov/sites/default/files/media/RiceHB.pdf (accessed on 15 December 2023).
- Bayili, G.R.; Coulibaly-Diakité, M.; Tankoano, A.; Kere-Kando, C.; Kabore, T.J.; Konfe-Kanwe, M.E.M.P.; Rouamba, A.; Parkouda, C.; Sawadogo-Lingani, H. Physico-Chemical, Microbiological, and Sensorial Characteristics of Grains, Malt, Wort, and Beer from FKR 19 and FKR 62 N Rice Varieties Grown in Burkina Faso. J. Am. Soc. Brew. Chem. 2023, 81, 569–578. [Google Scholar] [CrossRef]
- Waggoner, A.T.; Scott Osborn, G.; Pinson, S.R. Using a Moisture Transport Model for Identifying the Genes Expressing Field Fissure Resistance in Rice Seed. In Proceedings of the 2003 ASAE Annual Meeting; American Society of Agricultural and Biological Engineers: St. Joseph, MI, USA, 2003. [Google Scholar]
- Yin, X.S. MALT: Practical Brewing Science; American Society of Brewing Chemists: St. Paul, MN, USA, 2021. [Google Scholar]
- Cooper, C.M.; Evans, D.E.; Yousif, A.; Metz, N.; Koutoulis, A. Comparison of the impact on the performance of small-scale mashing with different proportions of unmalted barley, Ondea Pro®, malt and rice. J. Inst. Brew. 2016, 122, 218–227. [Google Scholar] [CrossRef]
- Ceccaroni, D.; Sileoni, V.; Marconi, O.; De Francesco, G.; Lee, E.G.; Perretti, G. Specialty rice malt optimization and improvement of rice malt beer aspect and aroma. LWT 2019, 99, 299–305. [Google Scholar] [CrossRef]
- Rettberg, N. Berliner Programm—Von der Prüfung zur Verarbeitungsempfehlung. 2023. Available online: https://www.braugerstengemeinschaft.de/wp-content/uploads/2023/02/20230207_Sortengremium_Veroeffentluchung.pdf (accessed on 13 April 2023).
- Mohan, B.H.; Malleshi, N.G.; Koseki, T. Physico-chemical characteristics and non-starch polysaccharide contents of Indica and Japonica brown rice and their malts. LWT—Food Sci. Technol. 2010, 43, 784–791. [Google Scholar] [CrossRef]
- Du, J.; Dong, J.; Du, S.; Zhang, K.; Yu, J.; Hu, S.; Yin, H. Understanding Thermostability Factors of Barley Limit Dextrinase by Molecular Dynamics Simulations. Front. Mol. Biosci. 2020, 7, 51. [Google Scholar] [CrossRef]
- Gibson, T.S.; Solah, V.; Holmes, M.R.G.; Taylor, H.R. Diastatic Power in Malted Barley: Contributions of Malt Parameters to Its Development And The Potential Of Barley Grain Beta-Amylase To Predict Malt Diastatic Power. J. Inst. Brew. 1995, 101, 277–280. [Google Scholar] [CrossRef]
- Stewart, S.; Sanders, R.; Ivanova, N.; Wilkinson, K.L.; Stewart, D.C.; Dong, J.; Hu, S.; Evans, D.E.; Able, J.A. The Influence of Malt Variety and Origin on Wort Flavor. J. Am. Soc. Brew. Chem. 2023, 81, 282–298. [Google Scholar] [CrossRef]
- Del Pozo-Insfran, D.; Urias-Lugo, D.; Hernandez-Brenes, C.; Saldivar, S.O.S. Effect of Amyloglucosidase on Wort Composition and Fermentable Carbohydrate Depletion in Sorghum Lager Beers. J. Inst. Brew. 2004, 110, 124–132. [Google Scholar] [CrossRef]
- Espinosa-Ramírez, J.; Pérez-Carrillo, E.; Serna-Saldívar, S.O. Maltose and glucose utilization during fermentation of barley and sorghum lager beers as affected by β-amylase or amyloglucosidase addition. J. Cereal Sci. 2014, 60, 602–609. [Google Scholar] [CrossRef]
- Contreras-Jiménez, B.; Del Real, A.; Millan-Malo, B.M.; Gaytán-Martínez, M.; Morales-Sánchez, E.; Rodríguez-García, M.E. Physicochemical changes in barley starch during malting. J. Inst. Brew. 2019, 125, 10–17. [Google Scholar] [CrossRef]
- Izydorczyk, M.S.; MacGregor, A.W.; Billiaderis, C.G. Effects of Malting on Phase Transition Behaviour of Starch in Barley Cultivars with Varying Amylose Content. J. Inst. Brew. 2001, 107, 119–128. [Google Scholar] [CrossRef]
- Stenholm, K.; Home, S. A New Approach to Limit Dextrinase and its Role in Mashing. J. Inst. Brew. 1999, 105, 205–210. [Google Scholar] [CrossRef]
- Gomaa, A.M. Application of Enzymes in Brewing. Sci. Forecast. 2018, 1, 1–5. [Google Scholar] [CrossRef]
- Blšáková, L.; Gregor, T.; Mešťánek, M.; Hřivna, L.; Kumbár, V. The Use of Unconventional Malts in Beer Production and Their Effect on the Wort Viscosity. Foods 2022, 11, 31. [Google Scholar] [CrossRef]
- Jin, Y.-L.; Speers, R.A.; Paulson, A.T.; Stewart, R.J. Effect of β-Glucans and Process Conditions on the Membrane Filtration Performance of Beer. J. Am. Soc. Brew. Chem. 2004, 62, 117–124. [Google Scholar] [CrossRef]
- Habschied, K.; Lalić, A.; Krstanović, V.; Dvojković, K.; Abičić, I.; Šimić, G.; Mastanjević, K. Comprehensive Comparative Study of the Malting Qualities of Winter Hull-Less and Hulled Barley (2016–2019). Fermentation 2021, 7, 8. [Google Scholar] [CrossRef]
- Zeuschner, P.; Pahl, R. Iodine Values in Breweries. In Brauwelt International; Brauwelt International: Nuremberg, Germany, 2017; pp. 266–269. [Google Scholar]
- Kupetz, M.; Gastl, M.; Geissinger, C.; Becker, T. Analyses in modern quality assurance, Part 1: Amylolytic issues. In Brauwelt International; Brauwelt International: Nuremberg, Germany, 2020; Volume 1, pp. 134–138. [Google Scholar]
- Moirangthem, K.; Jenkins, D.; Ramakrishna, P.; Rajkumari, R.; Cook, D. Indian black rice: A brewing raw material with novel functionality. J. Inst. Brew. 2020, 126, 35–45. [Google Scholar] [CrossRef]
- Taylor, J.R.N.; Dlamini, B.C.; Kruger, J. 125th Anniversary Review: The science of the tropical cereals sorghum, maize and rice in relation to lager beer brewing. J. Inst. Brew. 2013, 119, 1–14. [Google Scholar] [CrossRef]
- Gibson, B.R.; Lawrence, S.J.; Leclaire, J.P.R.; Powell, C.D.; Smart, K.A. Yeast responses to stresses associated with industrial brewery handling. FEMS Microbiol. Rev. 2007, 31, 535–569. [Google Scholar] [CrossRef]
- Dwiningsih, Y.; Alkahtani, J. Phenotypic Variations, Environmental Effects and Genetic Basis Analysis of Grain Elemental Concentrations in Rice (Oryza sativa L.) for Improving Human Nutrition. Preprints 2022, 2022090263. [Google Scholar] [CrossRef]
- Turner, H.; Olivo, S.; Lutgen, G.; Sherman, J.; Justus, A.; Frame, A. Malt Mineral Profile. Available online: https://www.montana.edu/barleybreeding/learning-center/brewer-resources/ionic/malt-mineral.html (accessed on 31 August 2023).
- Ceppi, E.L.M.; Brenna, O.V. Brewing with Rice Malt—A Gluten-free Alternative. J. Inst. Brew. 2010, 116, 275–279. [Google Scholar] [CrossRef]
- Omari, I.O.; Charnock, H.M.; Fugina, A.L.; Thomson, E.L.; McIndoe, J.S. Magnesium-Accelerated Maillard Reactions Drive Differences in Adjunct and All-Malt Brewing. J. Am. Soc. Brew. Chem. 2021, 79, 145–155. [Google Scholar] [CrossRef]
- Filipowska, W.; Jaskula-Goiris, B.; Ditrych, M.; Bustillo Trueba, P.; De Rouck, G.; Aerts, G.; Powell, C.; Cook, D.; De Cooman, L. On the contribution of malt quality and the malting process to the formation of beer staling aldehydes: A review. J. Inst. Brew. 2021, 127, 107–126. [Google Scholar] [CrossRef]
- Yahya, H.; Linforth, R.S.T.; Cook, D.J. Flavour generation during commercial barley and malt roasting operations: A time course study. Food Chem. 2014, 145, 378–387. [Google Scholar] [CrossRef]
- Schubert, C.; Lafontaine, S.; Dennenlöhr, J.; Thörner, S.; Rettberg, N. The influence of storage conditions on the chemistry and flavor of hoppy ales. Food Chem. 2022, 395, 133616. [Google Scholar] [CrossRef]


| Cultivar | Characteristics and Country of Origin | Harvest Year | Whole Kernel Length/Width * (mm) | USDA Classification [23] | Chalkiness * (%) | TKW $ (g dm) | GE Aubry 3rd Day $ (%) | GE Aubry 5th Day $ (%) | Protein $ (Dumas, g/100 g d.m.) | Apparent Amylose Content @ (%) | To @ (°C) |
|---|---|---|---|---|---|---|---|---|---|---|---|
| 14 | Non-aromatic, Japan | 2022 | 1.74 | Short grain | 3.84 | 21.80 | 9.00 | 42.00 | 8.63 | 10.97 | 64.93 |
| 13 | Non-aromatic, USA | 2022 | 1.98 | Short grain | 20.62 | 19.80 | 5.00 | 35.00 | 8.09 | 11.06 | 63.59 |
| 18 | Non-aromatic, USA | 2022 | 2.15 | Medium grain | 4.46 | 24.40 | 90.00 | 92.00 | 8.93 | 10.86 | 65.58 |
| 17 | Non-aromatic, USA | 2022 | 2.51 | Medium grain | 5.02 | 19.30 | 65.00 | 79.00 | 9.58 | 10.55 | 64.71 |
| 3 | Purple bran, aromatic, Brazil | 2022 | 2.53 | Medium grain | 0.02 | 15.40 | 6.00 | 69.00 | 9.76 | 9.46 | 65.22 |
| 4 | Highly resistant starch, non-aromatic, the Philippines | 2022 | 2.72 | Medium grain | 21.49 | 16.20 | 81.00 | 85.00 | 8.57 | 26.63 | 68.28 |
| 6 | Purple bran, aromatic, USA | 2022 | 2.96 | Medium grain | 0.01 | 16.90 | 84.00 | 89.00 | 9.58 | 17.84 | 74.60 |
| 10 | Purple bran, non-aromatic, the Philippines | 2021 | 2.99 | Medium grain | 6.58 | 19.70 | 95.00 | 97.00 | 7.85 | 2.28 | 76.31 |
| 11 | Non-aromatic, USA | 2021 | 3.04 | Long grain | 87.17 | 21.60 | 95.00 | 97.00 | 8.98 | 1.72 | 65.10 |
| 9 | Non-aromatic, USA | 2022 | 3.13 | Long grain | 3.42 | 20.10 | 77.00 | 83.00 | 9.76 | 8.32 | 76.40 |
| 2 | Aromatic, USA | 2022 | 3.13 | Long grain | 3.18 | 21.70 | 84.00 | 92.00 | 9.52 | 9.22 | 64.39 |
| 8 | Hybrid, non-aromatic, USA | 2022 | 3.15 | Long grain | 16.3 | 21.30 | 96.00 | 97.00 | 8.09 | 16.02 | 73.48 |
| 12 | Red bran, non-aromatic, USA | 2022 | 3.16 | Long grain | 3.08 | 23.40 | 93.00 | 95.00 | 10.53 | 16.02 | 71.30 |
| 1 | Non-aromatic, USA | 2022 | 3.19 | Long grain | 20.1 | 21.60 | 93.00 | 95.00 | 8.03 | 15.39 | 74.57 |
| 19_2 | Aromatic, USA | 2021 | 3.22 | Long grain | 2.93 | 22.90 | 91.00 | 93.00 | 7.97 | 12.82 | 65.74 |
| 7 | Aromatic, the Philippines | 2020 | 3.25 | Long grain | 0.9 | 22.70 | 93.00 | 95.00 | 6.96 | 10.52 | 65.13 |
| 19_1 | Aromatic, USA | 2022 | 3.39 | Long grain | 1.39 | 20.10 | 74.00 | 78.00 | 9.94 | 11.58 | 65.07 |
| 16 | Non-aromatic, USA | 2022 | 3.41 | Long grain | 9.99 | 19.10 | 81.00 | 87.00 | 9.70 | 17.46 | 70.65 |
| 5 | Aromatic, USA | 2022 | 3.48 | Long grain | 1.97 | 22.60 | 92.00 | 95.00 | 9.76 | 21.99 | 71.80 |
| 15 | Non-aromatic, USA | 2022 | 3.52 | Long grain | 9.32 | 19.10 | 90.00 | 92.00 | 8.09 | 17.59 | 73.07 |
| ^r | 0.04 | 0.36 | 1.1 | 1.5 × (100-m)0.5 # | 1.4 × (100-m)0.5 # | 0.063 | 1.86 | 0.55 |
| Variables | Whole Kernel Length/Width | Whole Kernel Chalky Percentage | TKW (db) | Paddy Rice Protein | GE 3rd Day | GE 5th Day | Water Sensitivity | Paddy Rice Apparent Amylose Content | Rice Onset Gel. Temp. | Rice End Gel. Temp. | Malting Losses | Rice Malt Protein | Diastatic Power | Alpha-Amylase | Beta-Amylase | Amyloglucosidase | Limit Dextrinase | Rice Malt Apparent Amylose Content | Rice Malt Onset Gel. Temp. | Rice Malt End Gel. Temp. | Viscosity | Elapsed Time of Wort | Fine Extract | Saccharification time | Apparent Final Attenuation | Soluble Nitrogen (mg/L) | Soluble Protein (%) | FAN (mg/L) | Kolbach Index | Wort Color |
|---|---|---|---|---|---|---|---|---|---|---|---|---|---|---|---|---|---|---|---|---|---|---|---|---|---|---|---|---|---|---|
| Whole Kernel Length/Width | 1 | −0.005 | 0.073 | 0.083 | 0.735 | 0.754 | 0.127 | 0.218 | 0.471 | 0.328 | 0.456 | −0.011 | 0.401 | 0.518 | 0.293 | 0.179 | −0.170 | 0.274 | 0.410 | 0.331 | −0.076 | −0.254 | −0.424 | 0.076 | 0.427 | 0.159 | 0.153 | 0.236 | 0.142 | −0.089 |
| Whole Kernel Length | 0.938 | 0.063 | 0.348 | 0.050 | 0.858 | 0.821 | −0.064 | 0.195 | 0.414 | 0.252 | 0.371 | −0.088 | 0.398 | 0.516 | 0.268 | 0.350 | −0.085 | 0.228 | 0.379 | 0.314 | −0.194 | −0.272 | −0.312 | −0.021 | 0.492 | 0.296 | 0.294 | 0.347 | 0.295 | −0.232 |
| Whole Kernel Width | −0.903 | 0.047 | 0.299 | −0.125 | −0.503 | −0.610 | −0.364 | −0.173 | −0.454 | −0.398 | −0.406 | −0.112 | −0.390 | −0.442 | −0.332 | 0.049 | 0.243 | −0.243 | −0.381 | −0.334 | −0.019 | 0.201 | 0.512 | −0.201 | −0.367 | −0.003 | 0.005 | −0.100 | 0.042 | −0.152 |
| Whole Kernel Chalky Percentage | −0.005 | 1 | 0.040 | −0.135 | 0.133 | 0.101 | −0.160 | −0.291 | −0.136 | 0.123 | 0.123 | −0.270 | 0.019 | −0.133 | −0.051 | 0.368 | −0.068 | −0.261 | −0.068 | 0.191 | 0.025 | 0.291 | 0.123 | 0.168 | 0.024 | 0.015 | 0.013 | 0.063 | 0.192 | −0.161 |
| Total Chalky Weight % | 0.015 | 0.969 | −0.041 | −0.081 | 0.165 | 0.151 | −0.174 | −0.187 | −0.165 | 0.136 | 0.128 | −0.182 | 0.049 | −0.083 | −0.004 | 0.348 | −0.010 | −0.157 | −0.069 | 0.202 | −0.025 | 0.322 | 0.108 | 0.148 | 0.139 | 0.137 | 0.134 | 0.197 | 0.232 | −0.081 |
| TKW (db) | 0.073 | 0.040 | 1 | −0.154 | 0.373 | 0.247 | −0.463 | −0.209 | −0.129 | −0.384 | −0.128 | −0.296 | −0.110 | −0.150 | −0.230 | 0.394 | 0.247 | −0.253 | −0.147 | −0.204 | −0.103 | −0.010 | 0.336 | −0.306 | −0.032 | 0.069 | 0.079 | 0.014 | 0.236 | −0.600 |
| Paddy Rice Protein | 0.083 | −0.135 | −0.154 | 1 | −0.085 | −0.010 | 0.196 | 0.109 | 0.012 | −0.040 | 0.036 | 0.909 | −0.138 | 0.021 | −0.070 | 0.358 | 0.364 | 0.111 | −0.038 | −0.098 | −0.333 | −0.180 | −0.040 | −0.130 | −0.195 | 0.117 | 0.120 | 0.051 | −0.521 | 0.067 |
| Germination Energy 3rd day | 0.735 | 0.133 | 0.373 | −0.085 | 1 | 0.935 | −0.253 | 0.148 | 0.467 | 0.353 | 0.471 | −0.271 | 0.548 | 0.627 | 0.449 | 0.165 | −0.051 | 0.146 | 0.479 | 0.470 | −0.097 | −0.194 | −0.346 | −0.111 | 0.638 | 0.511 | 0.503 | 0.581 | 0.576 | −0.056 |
| Germination Energy 5th day | 0.754 | 0.101 | 0.247 | −0.010 | 0.935 | 1 | −0.206 | 0.093 | 0.453 | 0.380 | 0.429 | −0.144 | 0.562 | 0.570 | 0.478 | 0.026 | −0.023 | 0.107 | 0.447 | 0.470 | −0.078 | −0.090 | −0.407 | −0.041 | 0.648 | 0.434 | 0.427 | 0.523 | 0.470 | 0.082 |
| Water Sensitivity | 0.127 | −0.160 | −0.463 | 0.196 | −0.253 | −0.206 | 1 | 0.083 | 0.135 | 0.193 | −0.203 | 0.402 | −0.171 | −0.016 | −0.200 | 0.053 | −0.129 | 0.101 | 0.110 | 0.055 | 0.393 | 0.112 | −0.202 | 0.076 | −0.140 | −0.181 | −0.187 | −0.193 | −0.416 | 0.105 |
| Paddy Rice Apparent Amylose Content | 0.218 | −0.291 | −0.209 | 0.109 | 0.148 | 0.093 | 0.083 | 1 | 0.227 | 0.276 | 0.215 | 0.128 | 0.190 | 0.552 | 0.183 | 0.060 | −0.194 | 0.987 | 0.279 | 0.132 | −0.175 | −0.242 | −0.244 | 0.097 | −0.002 | 0.219 | 0.211 | 0.236 | 0.051 | 0.009 |
| Paddy Rice Onset Gel. Temp. | 0.471 | −0.136 | −0.129 | 0.012 | 0.467 | 0.453 | 0.135 | 0.227 | 1 | 0.849 | 0.415 | −0.129 | 0.679 | 0.723 | 0.596 | −0.024 | −0.515 | 0.271 | 0.971 | 0.817 | 0.150 | −0.446 | −0.882 | 0.314 | 0.215 | 0.313 | 0.296 | 0.366 | 0.328 | 0.240 |
| Paddy Rice Peak Gel. Temp. | 0.419 | −0.017 | −0.253 | −0.021 | 0.470 | 0.465 | 0.128 | 0.277 | 0.955 | 0.955 | 0.446 | −0.159 | 0.689 | 0.789 | 0.619 | −0.021 | −0.557 | 0.309 | 0.984 | 0.932 | 0.150 | −0.353 | −0.893 | 0.351 | 0.341 | 0.398 | 0.378 | 0.470 | 0.421 | 0.275 |
| Paddy Rice End Gel. Temp. | 0.328 | 0.123 | −0.384 | −0.040 | 0.353 | 0.380 | 0.193 | 0.276 | 0.849 | 1 | 0.420 | −0.150 | 0.624 | 0.772 | 0.562 | 0.021 | −0.543 | 0.311 | 0.901 | 0.951 | 0.163 | −0.217 | −0.843 | 0.426 | 0.331 | 0.376 | 0.359 | 0.451 | 0.412 | 0.285 |
| Variables | Whole Kernel Length/Width | Whole Kernel Chalky Percentage | TKW (db) | Paddy Rice Protein | GE 3rd Day | GE 5th Day | Water Sensitivity | Paddy Rice Apparent Amylose Content | Rice Onset Gel. Temp. | Rice End Gel. Temp. | Malting Losses | Rice Malt Protein | Diastatic Power | Alpha-Amylase | Beta-Amylase | Amyloglucosidase | Limit Dextrinase | Rice Malt Apparent Amylose Content | Rice Malt Onset Gel. Temp. | Rice Malt End Gel. Temp. | Viscosity | Elapsed Time of Wort | Fine Extract | Saccharification time | Apparent Final Attenuation | Soluble Nitrogen (mg/L) | Soluble Protein (%) | FAN (mg/L) | Kolbach Index | Wort Color |
|---|---|---|---|---|---|---|---|---|---|---|---|---|---|---|---|---|---|---|---|---|---|---|---|---|---|---|---|---|---|---|
| Malting Losses | 0.456 | 0.123 | −0.128 | 0.036 | 0.471 | 0.429 | −0.203 | 0.215 | 0.415 | 0.420 | 1 | −0.131 | 0.432 | 0.603 | 0.303 | −0.148 | −0.034 | 0.234 | 0.417 | 0.472 | 0.236 | 0.062 | −0.289 | −0.136 | 0.310 | 0.469 | 0.454 | 0.544 | 0.436 | 0.100 |
| Malted Rice Protein | −0.011 | −0.270 | −0.296 | 0.909 | −0.271 | −0.144 | 0.402 | 0.128 | −0.129 | −0.150 | −0.131 | 1 | −0.235 | −0.109 | −0.174 | 0.199 | 0.380 | 0.137 | −0.174 | −0.243 | −0.206 | −0.012 | 0.028 | −0.209 | −0.188 | 0.061 | 0.067 | 0.000 | −0.610 | 0.167 |
| Diastatic Power | 0.401 | 0.019 | −0.110 | −0.138 | 0.548 | 0.562 | −0.171 | 0.190 | 0.679 | 0.624 | 0.432 | −0.235 | 1 | 0.631 | 0.910 | −0.187 | −0.285 | 0.227 | 0.667 | 0.659 | −0.082 | −0.323 | −0.628 | 0.107 | 0.534 | 0.522 | 0.514 | 0.591 | 0.600 | 0.502 |
| Alpha Amylase | 0.518 | −0.133 | −0.150 | 0.021 | 0.627 | 0.570 | −0.016 | 0.552 | 0.723 | 0.772 | 0.603 | −0.109 | 0.631 | 1 | 0.558 | 0.103 | −0.274 | 0.566 | 0.750 | 0.729 | −0.084 | −0.334 | −0.640 | 0.156 | 0.495 | 0.608 | 0.597 | 0.652 | 0.538 | 0.155 |
| Beta Amylase | 0.293 | −0.051 | −0.230 | −0.070 | 0.449 | 0.478 | −0.200 | 0.183 | 0.596 | 0.562 | 0.303 | −0.174 | 0.910 | 0.558 | 1 | −0.234 | −0.255 | 0.224 | 0.570 | 0.553 | −0.138 | −0.338 | −0.649 | 0.152 | 0.419 | 0.363 | 0.353 | 0.449 | 0.430 | 0.697 |
| Amyloglucosidase | 0.179 | 0.368 | 0.394 | 0.358 | 0.165 | 0.026 | 0.053 | 0.060 | −0.024 | 0.021 | −0.148 | 0.199 | −0.187 | 0.103 | −0.234 | 1 | 0.155 | 0.075 | −0.012 | 0.035 | −0.316 | −0.114 | 0.079 | 0.090 | −0.115 | 0.116 | 0.126 | 0.048 | −0.081 | −0.541 |
| Limit dextrinase | −0.170 | −0.068 | 0.247 | 0.364 | −0.051 | −0.023 | −0.129 | −0.194 | −0.515 | −0.543 | −0.034 | 0.380 | −0.285 | −0.274 | −0.255 | 0.155 | 1 | −0.212 | −0.566 | −0.489 | −0.073 | 0.392 | 0.555 | −0.311 | 0.008 | 0.282 | 0.300 | 0.190 | −0.038 | −0.038 |
| Malted Rice Apparent Amylose Content | 0.274 | −0.261 | −0.253 | 0.111 | 0.146 | 0.107 | 0.101 | 0.987 | 0.271 | 0.311 | 0.234 | 0.137 | 0.227 | 0.566 | 0.224 | 0.075 | −0.212 | 1 | 0.305 | 0.145 | −0.164 | −0.241 | −0.306 | 0.181 | −0.030 | 0.189 | 0.182 | 0.219 | 0.023 | 0.057 |
| Rice Malt Onset Gel. Temp. | 0.410 | −0.068 | −0.147 | −0.038 | 0.479 | 0.447 | 0.110 | 0.279 | 0.971 | 0.901 | 0.417 | −0.174 | 0.667 | 0.750 | 0.570 | −0.012 | −0.566 | 0.305 | 1 | 0.897 | 0.173 | −0.389 | −0.878 | 0.296 | 0.300 | 0.396 | 0.376 | 0.461 | 0.421 | 0.199 |
| Rice Malt Peak Gel. Temp. | 0.382 | 0.066 | −0.188 | −0.082 | 0.505 | 0.481 | 0.071 | 0.216 | 0.902 | 0.947 | 0.465 | −0.229 | 0.666 | 0.771 | 0.573 | 0.011 | −0.535 | 0.234 | 0.967 | 0.973 | 0.193 | −0.268 | −0.843 | 0.296 | 0.427 | 0.469 | 0.449 | 0.547 | 0.523 | 0.202 |
| Rice Malt End Gel. Temp. | 0.331 | 0.191 | −0.204 | −0.098 | 0.470 | 0.470 | 0.055 | 0.132 | 0.817 | 0.951 | 0.472 | −0.243 | 0.659 | 0.729 | 0.553 | 0.035 | −0.489 | 0.145 | 0.897 | 1 | 0.198 | −0.162 | −0.790 | 0.268 | 0.477 | 0.489 | 0.470 | 0.569 | 0.569 | 0.187 |
| Cultivar | #10 | #19_2 | ||||
|---|---|---|---|---|---|---|
| Treatment | To (°C) | Tp (°C) | Te (°C) | To (°C) | Tp (°C) | Te (°C) |
| Rest at 40 °C for 30 min | 78.47 | 85.36 | 93.61 | 66.82 | 74.00 | 82.73 |
| Rest at 45 °C for 30 min | 78.40 | 85.53 | 94.24 | 67.00 | 74.33 | 82.91 |
| Rest at 50 °C for 30 min | 78.74 | 85.79 | 94.05 | 67.19 | 74.65 | 84.84 |
| Rest at 55 °C for 30 min | 78.79 | 85.79 | 93.20 | 67.25 | 74.73 | 84.60 |
| Rest at 60 °C for 30 min | 79.94 | 87.13 | 94.48 | 70.61 | 75.98 | 83.79 |
| Rest at 65 °C for 30 min | 80.82 | 86.81 | 93.30 | 75.95 | 79.07 | 83.38 |
| Rest at 55 °C for 30 min + 65 °C for 30 min | 80.61 | 86.46 | 93.79 | 75.42 | 78.86 | 84.46 |
| Variables | Whole Kernel Length/Width | Whole Kernel Chalky Percentage | TKW (db) | Paddy Rice Protein | GE 3rd Day | GE 5th Day | Water Sensitivity | Paddy Rice Apparent Amylose Content | Rice Onset Gel. Temp. | Rice End Gel. Temp. | Malting Losses | Rice Malt Protein | Diastatic Power | Alpha-Amylase | Beta-Amylase | Amyloglucosidase | Limit Dextrinase | Rice Malt Apparent Amylose Content | Rice Malt Onset Gel. Temp. | Rice Malt End Gel. Temp. | Viscosity | Elapsed Time of Wort | Fine Extract | Saccharification time | Apparent Final Attenuation | Soluble Nitrogen (mg/L) | Soluble Protein (%) | FAN (mg/L) | Kolbach Index | Wort Color |
|---|---|---|---|---|---|---|---|---|---|---|---|---|---|---|---|---|---|---|---|---|---|---|---|---|---|---|---|---|---|---|
| Viscosity | −0.076 | 0.025 | −0.103 | −0.333 | −0.097 | −0.078 | 0.393 | −0.175 | 0.150 | 0.163 | 0.236 | −0.206 | −0.082 | −0.084 | −0.138 | −0.316 | −0.073 | −0.164 | 0.173 | 0.198 | 1 | 0.664 | −0.164 | −0.110 | −0.137 | −0.068 | −0.086 | 0.018 | 0.064 | 0.134 |
| Elapsed Time of Wort | −0.254 | 0.291 | −0.010 | −0.180 | −0.194 | −0.090 | 0.112 | −0.242 | −0.446 | −0.217 | 0.062 | −0.012 | −0.323 | −0.334 | −0.338 | −0.114 | 0.392 | −0.241 | −0.389 | −0.162 | 0.664 | 1 | 0.341 | −0.240 | −0.048 | 0.008 | 0.008 | 0.060 | 0.026 | 0.065 |
| Fine Extract | −0.424 | 0.123 | 0.336 | −0.040 | −0.346 | −0.407 | −0.202 | −0.244 | −0.882 | −0.843 | −0.289 | 0.028 | −0.628 | −0.640 | −0.649 | 0.079 | 0.555 | −0.306 | −0.878 | −0.790 | −0.164 | 0.341 | 1 | −0.381 | −0.218 | −0.158 | −0.136 | −0.274 | −0.166 | −0.369 |
| Saccharification time | 0.076 | 0.168 | −0.306 | −0.130 | −0.111 | −0.041 | 0.076 | 0.097 | 0.314 | 0.426 | −0.136 | −0.209 | 0.107 | 0.156 | 0.152 | 0.090 | −0.311 | 0.181 | 0.296 | 0.268 | −0.110 | −0.240 | −0.381 | 1 | −0.208 | −0.279 | −0.281 | −0.245 | −0.086 | 0.058 |
| Photometric Iodine Method | −0.484 | 0.021 | 0.043 | 0.211 | −0.635 | −0.762 | 0.308 | −0.029 | −0.459 | −0.405 | −0.523 | 0.242 | −0.550 | −0.462 | −0.531 | 0.444 | 0.094 | −0.074 | −0.463 | −0.463 | −0.192 | −0.085 | 0.483 | −0.058 | −0.522 | −0.372 | −0.358 | −0.511 | −0.494 | −0.404 |
| Apparent Final Attenuation | 0.427 | 0.024 | −0.032 | −0.195 | 0.638 | 0.648 | −0.140 | −0.002 | 0.215 | 0.331 | 0.310 | −0.188 | 0.534 | 0.495 | 0.419 | −0.115 | 0.008 | −0.030 | 0.300 | 0.477 | −0.137 | −0.048 | −0.218 | −0.208 | 1 | 0.672 | 0.672 | 0.716 | 0.699 | 0.135 |
| Soluble Nitrogen (mg/L) | 0.159 | 0.015 | 0.069 | 0.117 | 0.511 | 0.434 | −0.181 | 0.219 | 0.313 | 0.376 | 0.469 | 0.061 | 0.522 | 0.608 | 0.363 | 0.116 | 0.282 | 0.189 | 0.396 | 0.489 | −0.068 | 0.008 | −0.158 | −0.279 | 0.672 | 1 | 0.999 | 0.975 | 0.739 | 0.146 |
| Soluble Nitrogen (mg/100 g dm) | 0.153 | 0.013 | 0.079 | 0.120 | 0.503 | 0.427 | −0.187 | 0.211 | 0.296 | 0.359 | 0.454 | 0.067 | 0.514 | 0.597 | 0.353 | 0.126 | 0.300 | 0.182 | 0.376 | 0.470 | −0.086 | 0.008 | −0.136 | −0.281 | 0.672 | 0.999 | 1.000 | 0.969 | 0.736 | 0.138 |
| Soluble Protein (% dm) | 0.153 | 0.013 | 0.079 | 0.120 | 0.503 | 0.427 | −0.187 | 0.211 | 0.296 | 0.359 | 0.454 | 0.067 | 0.514 | 0.597 | 0.353 | 0.126 | 0.300 | 0.182 | 0.376 | 0.470 | −0.086 | 0.008 | −0.136 | −0.281 | 0.672 | 0.999 | 1 | 0.969 | 0.736 | 0.138 |
| FAN (mg/L) | 0.236 | 0.063 | 0.014 | 0.051 | 0.581 | 0.523 | −0.193 | 0.236 | 0.366 | 0.451 | 0.544 | 0.000 | 0.591 | 0.652 | 0.449 | 0.048 | 0.190 | 0.219 | 0.461 | 0.569 | 0.018 | 0.060 | −0.274 | −0.245 | 0.716 | 0.975 | 0.969 | 1 | 0.766 | 0.215 |
| Kolbach Index | 0.142 | 0.192 | 0.236 | −0.521 | 0.576 | 0.470 | −0.416 | 0.051 | 0.328 | 0.412 | 0.436 | −0.610 | 0.600 | 0.538 | 0.430 | −0.081 | −0.038 | 0.023 | 0.421 | 0.569 | 0.064 | 0.026 | −0.166 | −0.086 | 0.699 | 0.739 | 0.736 | 0.766 | 1 | 0.029 |
| Wort color | −0.089 | −0.161 | −0.600 | 0.067 | −0.056 | 0.082 | 0.105 | 0.009 | 0.240 | 0.285 | 0.100 | 0.167 | 0.502 | 0.155 | 0.697 | −0.541 | −0.038 | 0.057 | 0.199 | 0.187 | 0.134 | 0.065 | −0.369 | 0.058 | 0.135 | 0.146 | 0.138 | 0.215 | 0.029 | 1 |
| Boiled Wort Color | −0.019 | −0.189 | −0.542 | 0.017 | 0.088 | 0.187 | 0.115 | 0.071 | 0.223 | 0.306 | 0.187 | 0.129 | 0.554 | 0.279 | 0.695 | −0.505 | 0.065 | 0.097 | 0.220 | 0.251 | 0.158 | 0.127 | −0.316 | −0.035 | 0.358 | 0.380 | 0.373 | 0.443 | 0.231 | 0.946 |
| pH | −0.306 | −0.173 | −0.185 | 0.384 | −0.567 | −0.560 | 0.247 | 0.077 | −0.174 | −0.191 | −0.639 | 0.408 | −0.472 | −0.352 | −0.361 | 0.280 | −0.158 | 0.071 | −0.190 | −0.330 | −0.409 | −0.380 | 0.120 | 0.314 | −0.487 | −0.501 | −0.491 | −0.603 | −0.694 | −0.199 |
Disclaimer/Publisher’s Note: The statements, opinions and data contained in all publications are solely those of the individual author(s) and contributor(s) and not of MDPI and/or the editor(s). MDPI and/or the editor(s) disclaim responsibility for any injury to people or property resulting from any ideas, methods, instructions or products referred to in the content. |
© 2024 by the authors. Licensee MDPI, Basel, Switzerland. This article is an open access article distributed under the terms and conditions of the Creative Commons Attribution (CC BY) license (https://creativecommons.org/licenses/by/4.0/).
Share and Cite
Guimaraes, B.P.; Schrickel, F.; Rettberg, N.; Pinson, S.R.M.; McClung, A.M.; Luthra, K.; Atungulu, G.G.; Sha, X.; de Guzman, C.; Lafontaine, S. Investigating the Malting Suitability and Brewing Quality of Different Rice Cultivars. Beverages 2024, 10, 16. https://doi.org/10.3390/beverages10010016
Guimaraes BP, Schrickel F, Rettberg N, Pinson SRM, McClung AM, Luthra K, Atungulu GG, Sha X, de Guzman C, Lafontaine S. Investigating the Malting Suitability and Brewing Quality of Different Rice Cultivars. Beverages. 2024; 10(1):16. https://doi.org/10.3390/beverages10010016
Chicago/Turabian StyleGuimaraes, Bernardo P., Florian Schrickel, Nils Rettberg, Shannon R. M. Pinson, Anna M. McClung, Kaushik Luthra, Griffiths G. Atungulu, Xueyan Sha, Christian de Guzman, and Scott Lafontaine. 2024. "Investigating the Malting Suitability and Brewing Quality of Different Rice Cultivars" Beverages 10, no. 1: 16. https://doi.org/10.3390/beverages10010016