
The Role of Medical Image Modalities and AI in the Early Detection, Diagnosis and Grading of Retinal Diseases: A Survey

 , ,
, ,  ,
,  , ,
, , 
Abstract
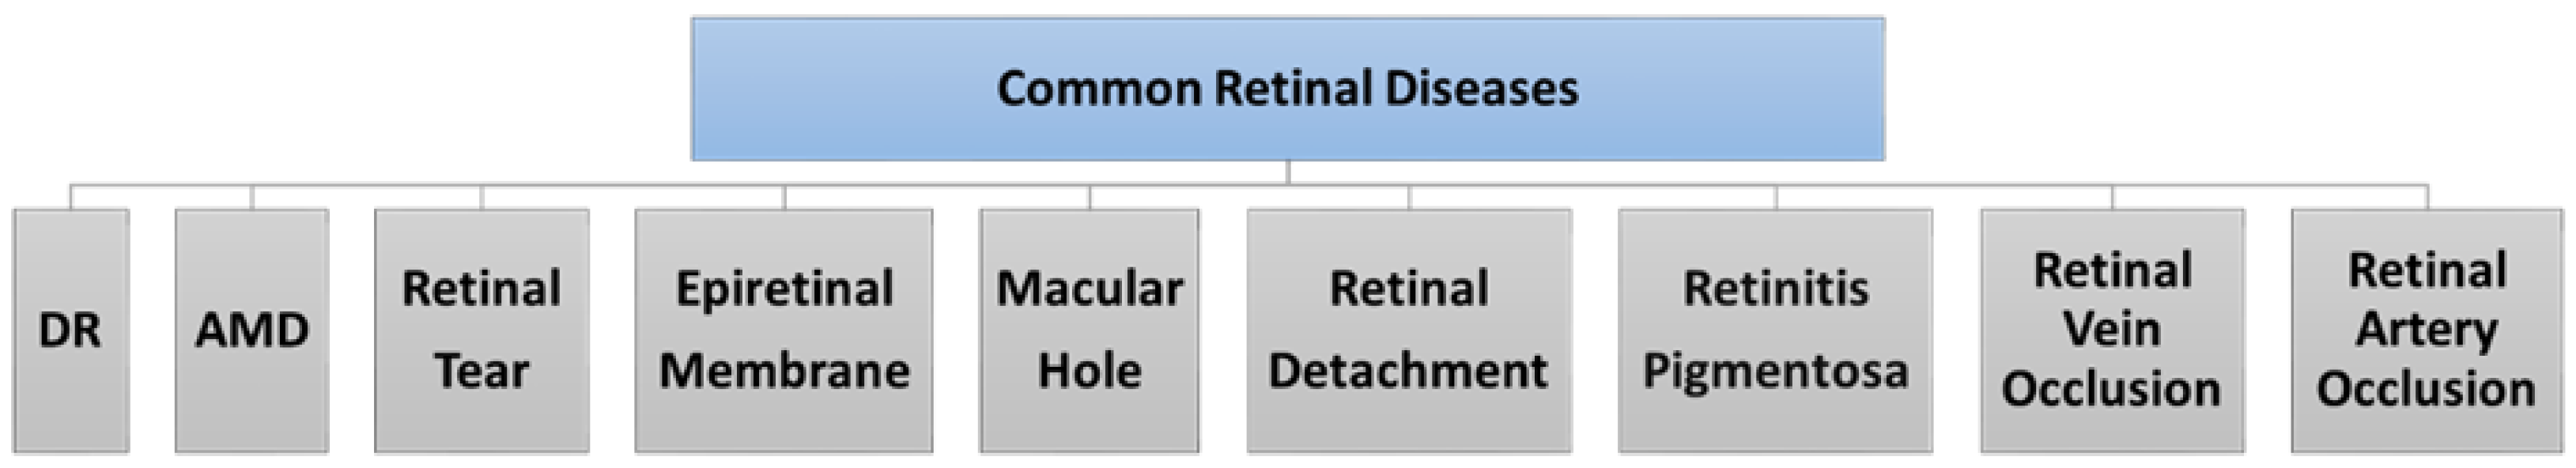
:1. Introduction to Retinal Diseases
1.1. Diabetic Retinopathy (DR)
1.2. Age-Related Macular Degeneration (AMD)
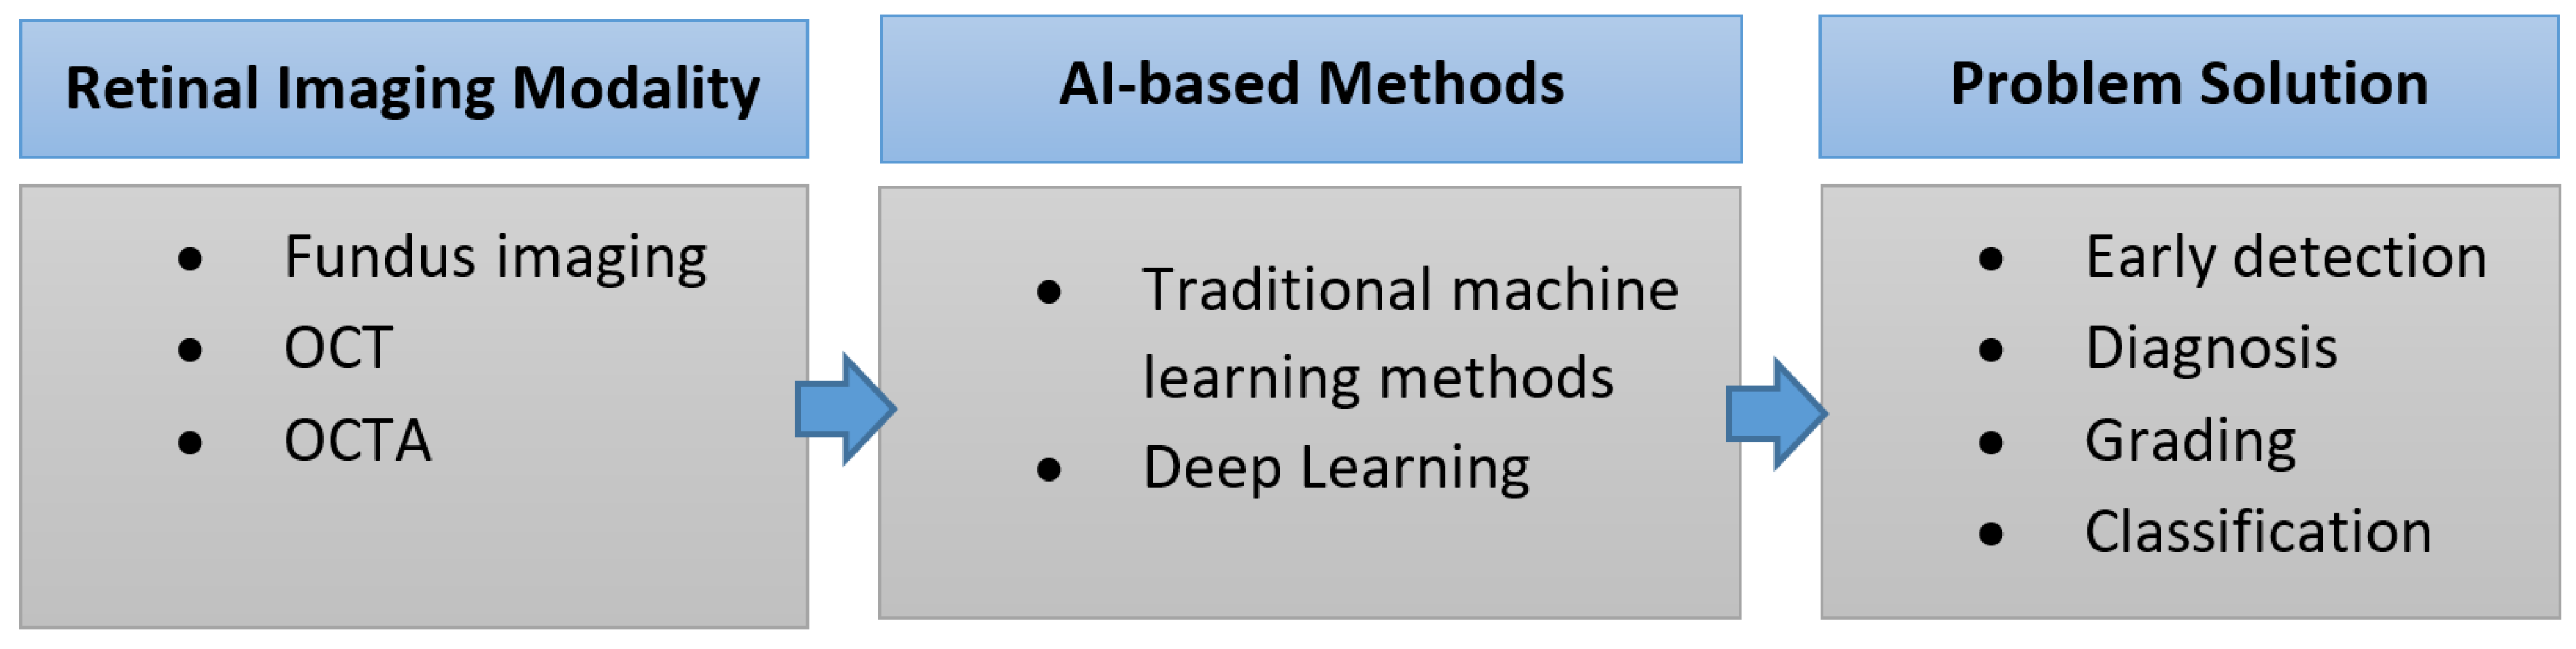
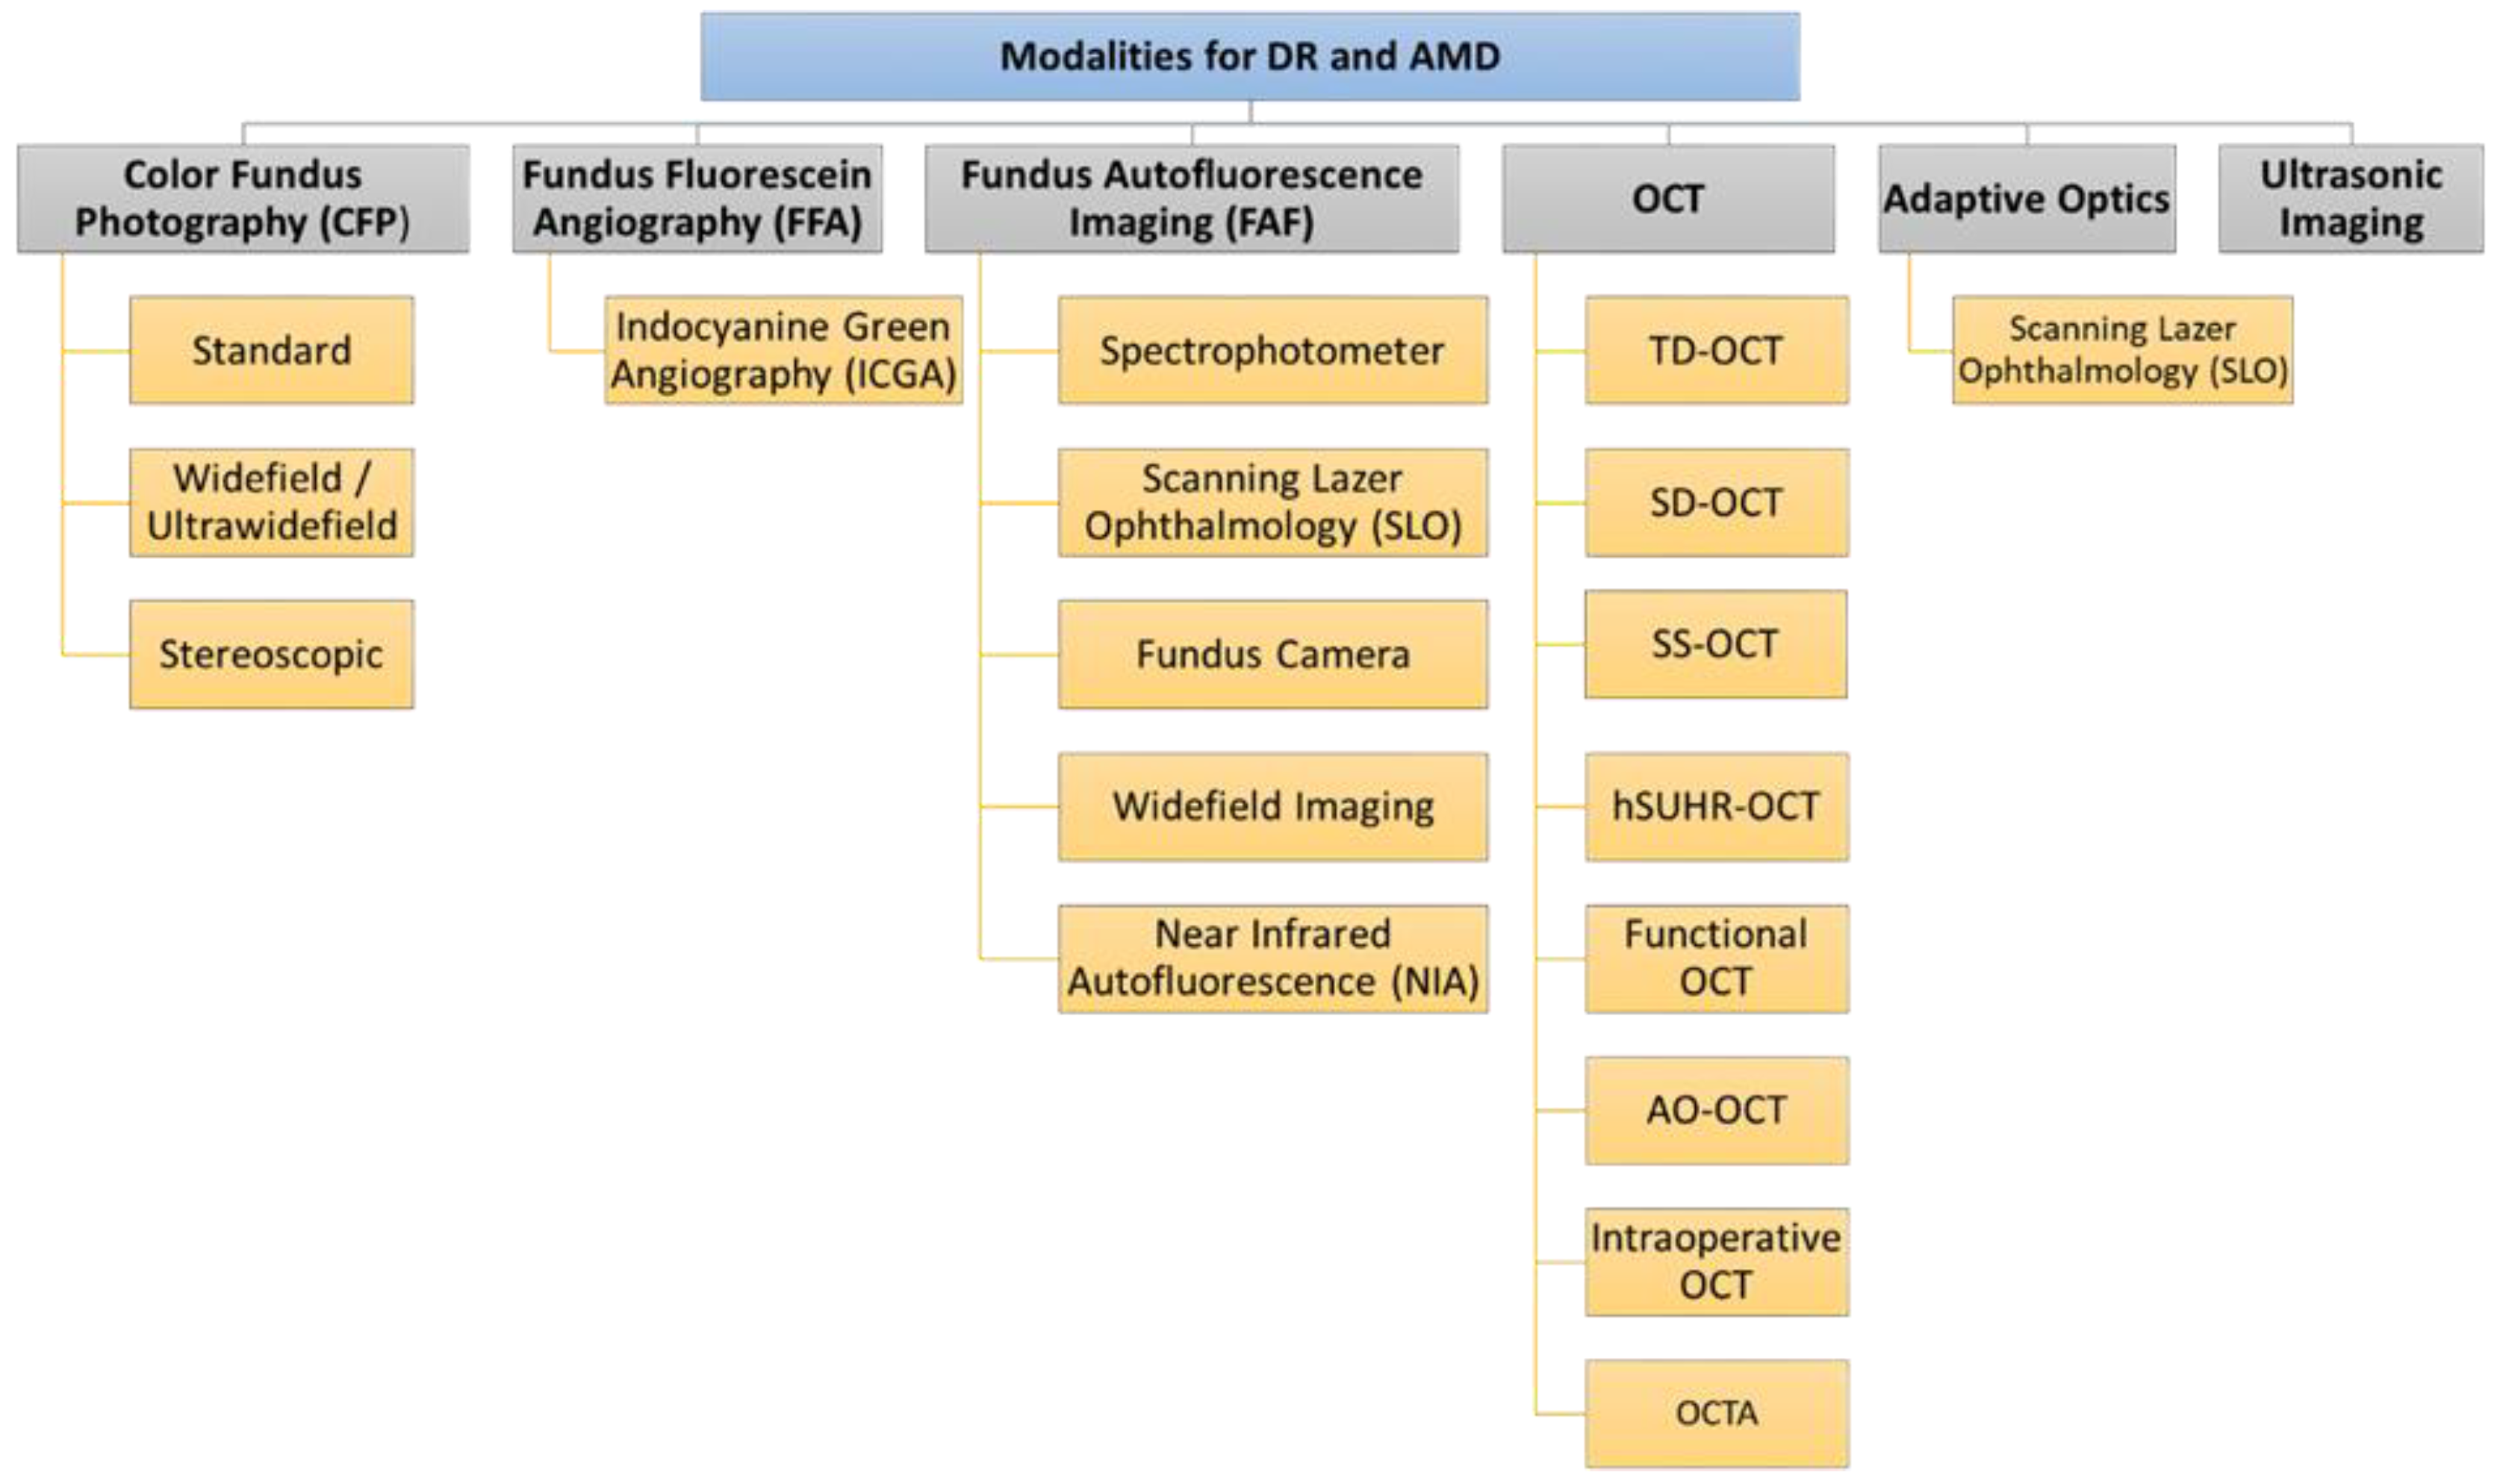
2. Retinal Imaging Modalities
2.1. Color Fundus Photography (CFP)
- Standard fundus photography is widely available and easy to use. It captures a 30° to 50° image of the posterior pole of the eye, including the macula and the optic nerve. Standard fundus photography cameras can collect multiple fundus field images. These images are then overlapped to create a montage image with a 75° field of view [10,13].
- Widefield/ultra-widefield fundus photography can image the peripheral retina. It can capture a 200° field of view even if the pupil is not dilated. This 200° field extends beyond the macula to cover 80% of the total surface of the retina. Theoretically, the large field of view permits better detection of peripheral retinal pathology. However, widefield fundus photography presents some limitations; the spherical shape of the globe causes image distortion, artifacts as a result of eyelashes, and false findings due to inadequate color representation, in addition to the expensive equipment. Consequently, standard 30° fundus photography remains the best choice for fundus imaging [10,13].
- Stereoscopic fundus photography can be used to obtain a stereo image created by merging photographs taken at two slightly different positions from both eyes to enable the perception of depth [11,13,25]. Despite the potential value of stereoscopic fundus photography, its clinical value is controversial due to several limitations. The acquisition of stereo images is time consuming, and patients must be exposed to double the number of light flashes [11]. The photographer’s experience has an impact on the technique, and the left and right images must be equally sharp and have the same illumination in each image in the pair [12,26]. Image interpretation is time consuming and requires special goggles or optical viewers to fuse the image stereoscopically and achieve depth [11,25].
2.1.1. Application of Color Fundus Photography (CFP) in DR
2.1.2. Application of Color Fundus Photography (CFP) in AMD
2.2. Fundus Fluorescein Angiography (FFA)
- Indocyanine green angiography (ICGA) is a type of FFA based on intravenously injected high-molecular-weight indocyanine green dye. It projects light with a longer wavelength (near infrared light (790 nm)), which allows deeper penetration of the retinal layers, resulting in better visualization of choroidal and retinal circulation [23,36]. Systemic side effects can similarly occur [36]. In ICGA, the dye combines with plasma proteins, leading to less dye leakage than in FFA [37].
2.2.1. Application of FFA in DR
- Microaneurysms: appear as punctate hyperfluorescent areas.
- Retinal hypoperfusion: nonperfused retinal capillaries, which can cause ischemia and appear as patches of hypofluorescent areas.
- Increased foveal avascular zone: results from macular ischemia and can explain the cause of loss of vision in some diabetic patients.
- Retinal neo-vascularization or intraretinal microvascular abnormalities.
2.2.2. Application of FFA in AMD
2.2.3. Application of Indocyanine Green Angiography (ICGA) in AMD
2.3. Fundus Autofluorescence Imaging (FAF)
- Near infrared autofluorescence (NIA) is another fundus imaging technique that uses the other fluorophore properties of the retina located in melanin. Melanin is present mainly in the retinal pigment epithelium, and to a lesser extent in the choroid in small amounts. NIA uses diode laser light with a longer wavelength of 787 nm for excitation, and then a specific wavelength above 800 nm is captured using a confocal scanning laser ophthalmoscope [50,51]. The captured image shows increased hyperautofluorescence in the center of the fovea due to the high melanin content of the retinal pigment epithelial cells [50]. Retromode imaging (RM) is an imaging modality using an infrared laser at 790 nm, generating a pseudo-3D appearance of the deeper retinal layer [52].
- Fundus spectrophotometry is able to process the excitation and emission spectra of autofluorescence signals originating from a small retinal area of the fundus (only 2° in diameter) [53]. It is composed of an image intensifier, diode array detector, and crystalline lens. The beam is separated in the pupil, and the detection is confocal to reduce the contribution of the crystalline lens in the autofluorescence. The complex instrumentation and the small examined area have led fundus spectrophotometry not to be the preferred technique in clinical practice for FAF [48,53].
- Scanning laser ophthalmoscopy can image larger areas of the retina by using a low-power laser beam that is projected onto the retina and distributed over the fundus [54]. Then, the reflected light intensities from each point after passing through a confocal pinhole are collected via a detector, and the image is produced [48]. A series of several images are recorded, then averaged to form the final image, reduce the background noise, and improve the image contrast [55].
- Fundus cameras have limitations with respect to FAF, such as weak signal, the crystalline lens absorptive effect, nonconfocal imaging, and light scattering [48]. A modified fundus camera was designed by adding an aperture to the illumination optics to decrease the effect of light scattering from the crystalline lens and reduce the loss of contrast [56]. This modified design is limited by the small field of view (only 13° in diameter) and complex instrumentation [48].
- Widefield imaging: confocal scanning laser ophthalmoscopy has a 30° × 30° retinal field. Therefore, imaging of larger retinal areas like a 55° field needs additional lenses. The fundus camera can be used to manually produce montage images using seven field panorama-based software packages [48].
- Widefield scanning laser ophthalmoscopy was developed to record peripheral autofluorescence images using green light excitation (532 nm) with an acquisition time of less than two seconds. The widefield extends beyond the vascular arcades and can be used to assess the peripheral involvement of retinal diseases [48]. Ultra-widefield scanning laser ophthalmoscopy was developed by combining confocal scanning laser ophthalmoscopy with a concave elliptical mirror. It can record a wider view of the retina of up to 200° in a single image with an acquisition time of less than one second, without the need for pupil dilatation [25,57]. The use of ultra-widefield scanning laser ophthalmoscopy is still limited due to its high cost [12].
2.3.1. Application of FAF in DR
2.3.2. Application of FAF in AMD
2.4. Optical Coherence Tomography (OCT)
- TD-OCT is the first commercially offered OCT device based on time-domain detection that shows rather low scan rates of 400 A-scans per second. The key imitations in the clinical use of TD-OCT are the limited resolution and slow acquisition [75]. However, it is commonly accepted for the evaluation of several retinal diseases, such as macular edema, AMD, and glaucoma [76].
- Spectral domain OCT (SD-OCT): Subsequently, spectral domain imaging technologies have significantly improved sampling speed and signal-to-noise ratio by using a high-speed spectrometer that measures the light interferences from all time delays simultaneously [77]. In commercially available SD-OCT devices, technical improvements have enabled scan rates of up to 250,000 Hz [78]. SD-OCT’s higher acquisition speeds allow for a shift from two-dimensional to three-dimensional images of ocular anatomy. In addition, SD-OCT is several orders of magnitude more sensitive than TD-OCT [75]. SD-OCT is used to diagnose DR and diabetic macular edema (DME).
- SS-OCT technology has also improved imaging accuracy by using a swept laser light source that successively emits various frequencies in time and photodetectors to measure the interference [79]. SS-OCT devices employ a longer wavelength (>1050 nm) laser light source and have scan rates as fast as 200,000 Hz. The longer wavelengths are thought to enhance visualization of subretinal tissue and choroidal structures [80,81]. SS-OCT has been used to visualize a thick posterior hyaloids among eyes with diabetes compared to normal controls [82]. SS OCT can be used to reveal adhesion between the retina and detached posterior hyaloid in eyes with DR and DME, while this was not detected in eyes without diabetic eye disease [2].
- High-speed ultra-high-resolution OCT (hsUHR-OCT) is another variation on SS-CT that provides a striking improvement in terms of cross-sectional image resolution and acquisition speed. The axial resolution of hsUHR-OCT is approximately 3.5 µm, compared with the 10 µm resolution in the standard OCT. This enables superior visualization of retinal morphology in retinal abnormalities. The imaging speed is approximately 75 times faster than that with standard SD-OCT. hsUHR-OCT improves visualization by obtaining high-transverse-pixel density and high-definition images [83,84].
- OCTA is a relatively new modality for visualizing flow in the retinal and choroidal vasculature. Rapid scanning by SD-OCT or SS-OCT devices allows analysis of variation of reflectivity from retinal blood vessels, permitting the creation of microvascular flow maps. This technology enables clinicians to visualize the microvasculature without the need for an intravenous injection of fluorescein [2]. OCTA signifies progression of OCT technology, as motion contrast is used to create high-resolution, volumetric, angiographic flow images in a few minutes [85]. Neovascularization at the optic disc is obviously visualized on OCTA, and microaneurysms exist as focally distended saccular or fusiform capillaries on OCTA [86].
- Intraoperative optical coherence tomography: Performing intraoperative OCT in the operating theater may offer supplementary data on retinal structures that were inaccessible preoperatively due to media opacity [2]. Prospective intraoperative and perioperative ophthalmic imaging with OCT study has been performed to assess the feasibility, utility, and safety of using intraoperative OCT through different vitreoretinal surgical procedures. The information achieved from intraoperative OCT permit surgeons to evaluate subtle details from a perspective distinctive from that of standard en face visualization, which can improve surgical decisions and patient outcome [87]. Intraoperative OCT revealed variable retinal abnormalities in patients who underwent pars plana vitrectomy for dense vitreous hemorrhage secondary to DR, including epiretinal membranes (60.9%), macular edema (60.9%) and retinal detachment (4.3%). The surgeons reported that intraoperative OCT impacts their surgical decision making, particularly when membrane peeling is accomplished [88].
- Functional OCT makes it possible to perform noninvasive physiological evaluation of retinal tissue, with respect to factors such as its metabolism [89,90]. A transient intrinsic optical signal (IOS) is noted in retinal photoreceptors implying a distinctive biomarker for ocular disease detection. By developing high spatiotemporal resolution, OCT and using an algorithm for IOS processing, transient IOS could be recorded [89]. IOS imaging is a promising alternative for the measurement of retinal physiological functions [91]. Functional OCT provides a noninvasive method for the early disease detection and improved treatment of retinal diseases that cuase changes to retinal function and photoreceptor damage, such as DR and AMD, which can be detected using functional OCT as differences in IOS [2,89].
2.4.1. Application of OCT in DR
2.4.2. Application of OCTA in DR
2.4.3. Application of OCT in AMD
2.4.4. Application of OCTA in AMD
2.5. Adaptive Optics (AO)
2.5.1. Application of AO in DR
2.5.2. Application of AO in AMD
2.6. Ultrasound Imaging
Application of Ultrasonic Imaging in DR
3. Denoising of Retinal Images
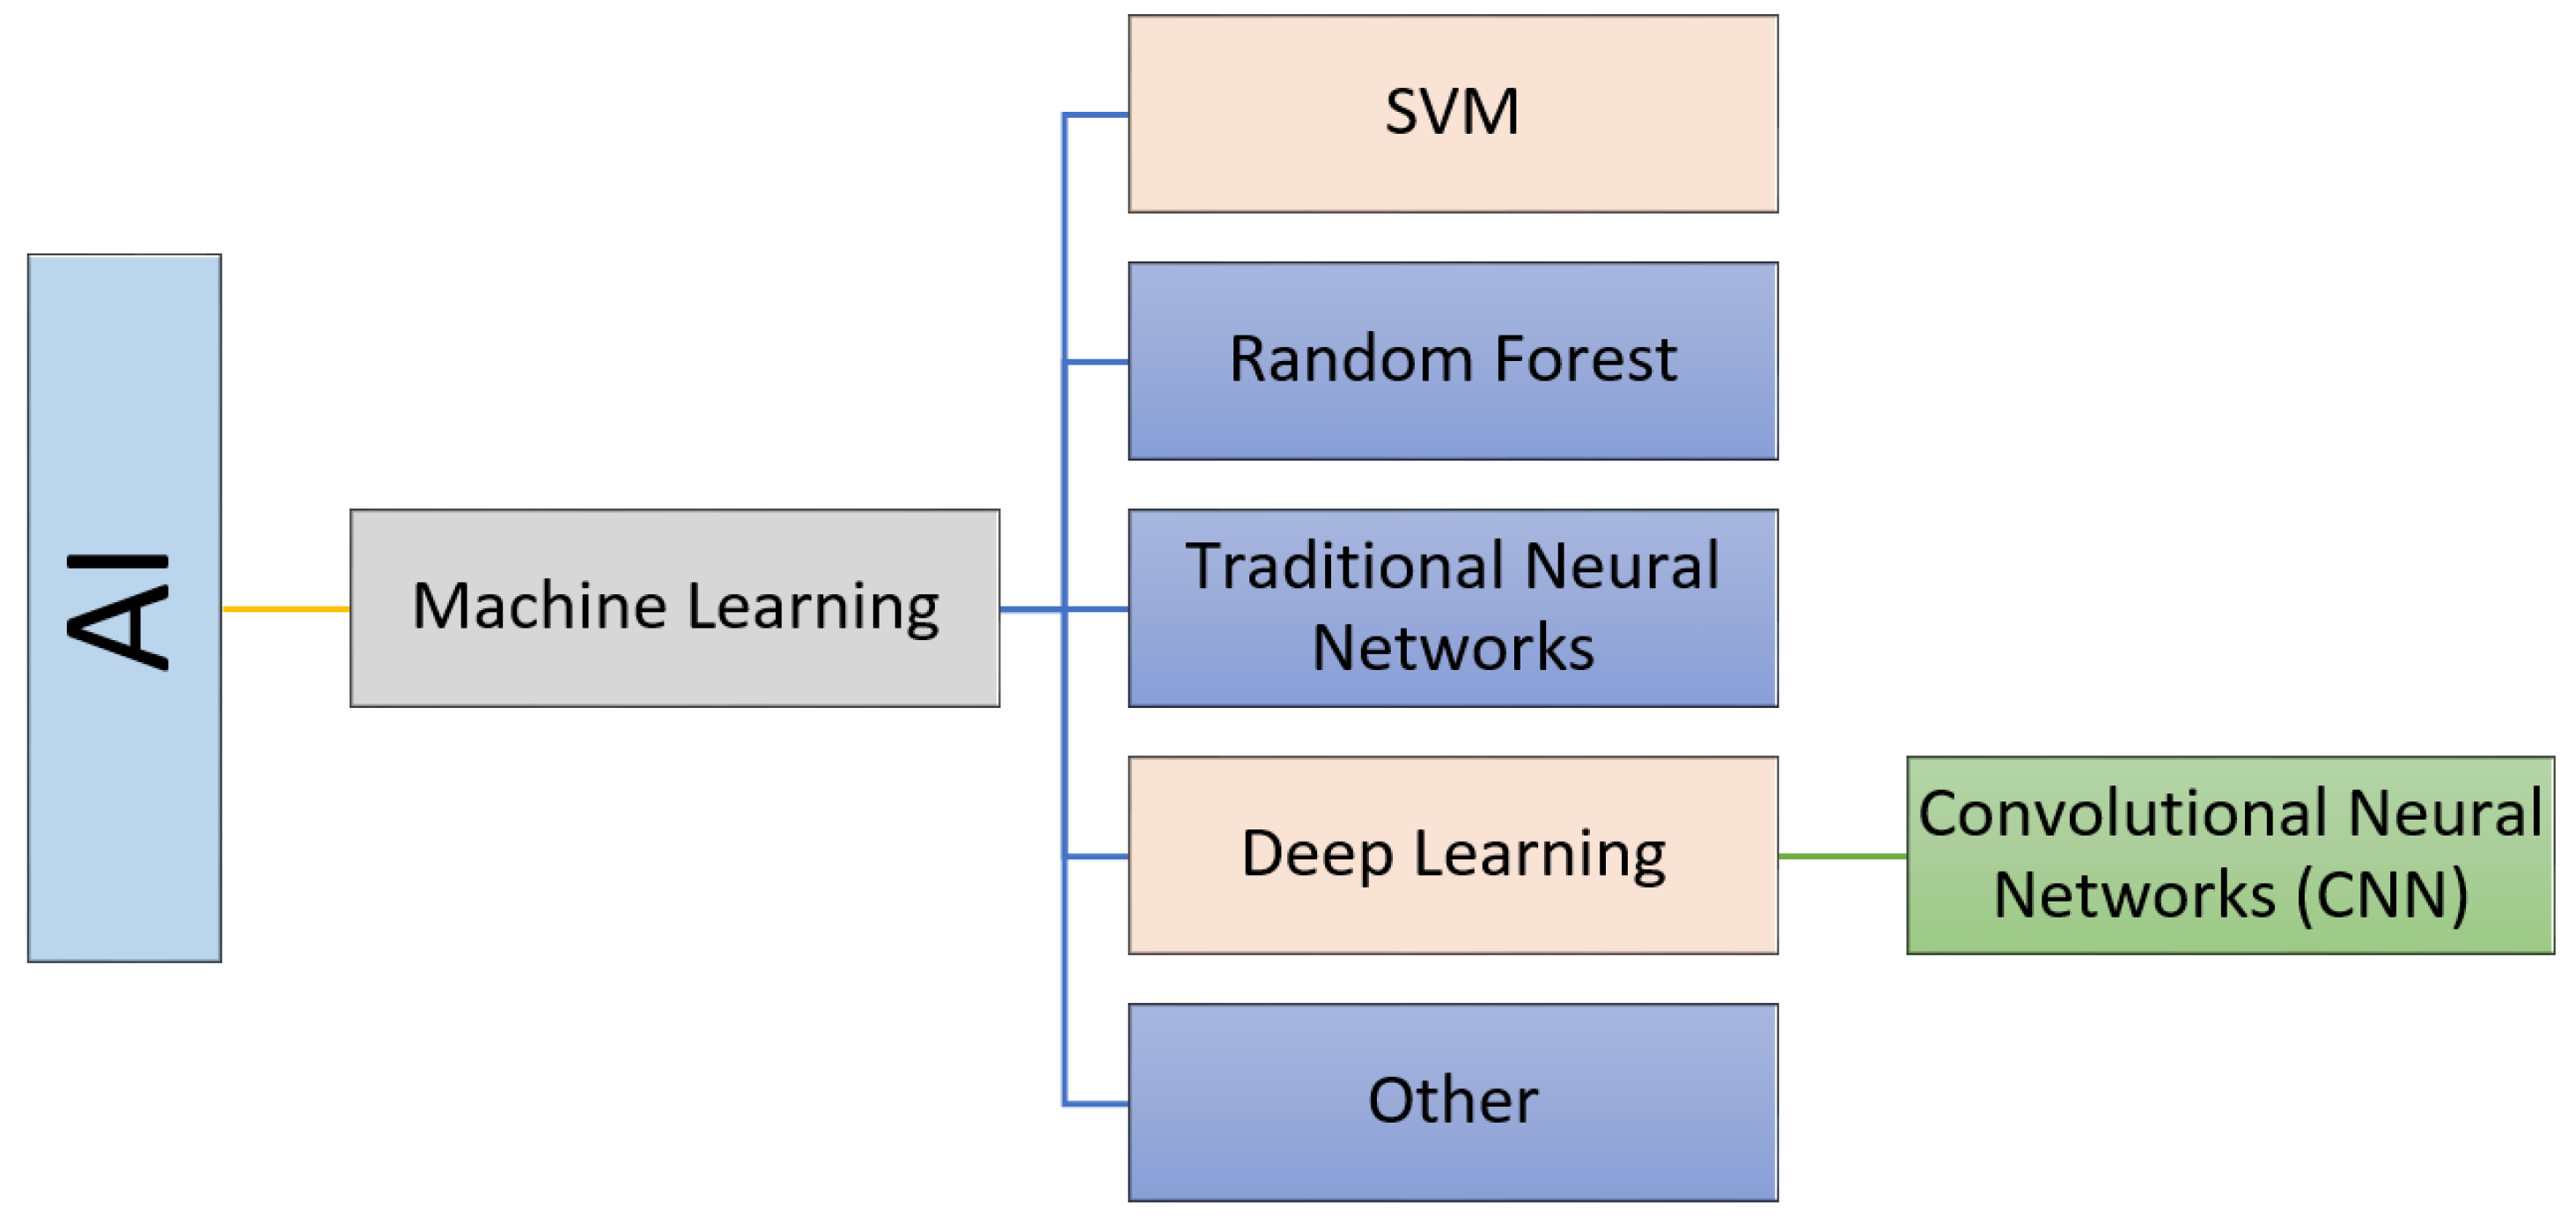
4. The Role of AI in the Diagnosis of Retinal Diseases
Performance Metrics
- Specificity:
- Sensitivity (recall):
- Accuracy:
- F1-score:
- Precision:
- Kappa:
- AUC is the area under the curve of the receiver operating characteristics (ROC), a curve that relates the false positive rate (specificity, on the x-axis) to the true positive rate (sensitivity, on the y-axis). AUC is between 0 and 1. The closer the AUC to 1, the better the performance.
- Confusion matrix, which is a summary of classification results based on highlighting the number of correct and incorrect predictions for each class.
5. The Role of AI in the Early Detection, Diagnosis, and Grading of DR
5.1. Traditional Machine Learning Methods

| Study | Goal | Features | Classifier | Database Size | Performance |
|---|---|---|---|---|---|
| Welikala et al. [135], 2015 | Detection of new vessels from fundus images as an indication of PDR | Local morphology features + genetic feature selection algorithm | SVM | 60 Images from MESSIDOR [153] and local Hospital | = 1000 = 0.975 per image |
| Prasad et al. [136], 2015 | Detection of DR (two classes: non DR vs. DR) using fundus images | 41-statistical and texture features+ Haar wavelet transform for feature selection + PCA for feature reduction | Back propagation neural network and one rule classifier | 89 images from DIARETDB1 [154] | = 93.8% for back propagation neural network and = 97.75% for one rule classifier |
| Mahendran et al. [137], 2015 | Classification of the data into normal vs. abnormal followed by classification of abnormal into moderate NPDR or severe NPDR using fundus images | Statistical and texture features using GLCM extracted from segmented images | SVM and neural network | 1200 images from MESSIDOR database | = 97.8% (SVM) and = 94.7%, (neural network) |
| Bhatkar et al. [138], 2015 | Detect DR using fundus images | Discrete Cosine transform and statistical features | Multi-layer perceptron neural network | 130 images from DIARETDB0 database | = 100% = 100% |
| Labhade et al. [139], 2016 | Classification of the data into four classes: normal, mild NPDR, severe NPDR, and PDR using fundus images | 40 statistical and GLCM texture features | SVM, random forests, gradient boost, AdaBoost, Gaussian naive Bayes | 1200 images from MESSIDOR database | Best = 88.71 using SVM |
| Rahim et al. [140], 2016 | Classification of the data into five classes: no DR, mild NPDR, moderate NPDR, severe NPDR, and PDR using fundus images | Three features (area, mean, and standard deviation) of two extracted regions using fuzzy techniques (retina and exudates) | SVM with RBF kernel | 600 images from 300 patients collected at the Hospital Melaka, Malaysia | ACC = 93%, Spef = 93.62%, and Sen = 92.45% |
| Islam et al. [141], 2017 | Discriminate between normal and DR using fundus images | Speeded up robust features | k-means, a bag of words approach, and SVM | 180 fundus images | ACC = 94.4%, Pre = 94%, F1 = 94% AUC = 95% |
| Carrera et al. [142], 2017 | Classifying nonproliferative DR into 4 grades using fundus images | Extract features from isolates blood vessels, microaneurysms, and hard exudates | SVM | 400 images | = 95% |
| Somasundaram and Alli [143], 2017 | Differentiate between NPDR and PDR | Extraction of the candidate objects (blood vessels, optic nerve, neural tissue, neuroretinal rim, optic disc size, thickness and variance) | Bagging ensemble classifier | 89 colors fundus images | = 49% for DR detection |
| Eladawi et al. [149] | Detecting early DR using OCTA | Density, appearance of the retinal blood vessels, and distance map of the foveal avascular zone | SVM | 105 subjects | = 97.3% |
| Costa et al. [144] | Grading DR using fundus images | Joint optimization of the instance encoding and the image classification stages | Weakly supervised multiple instance learning framework | 1200 (Messidor) 1077 (DR1) 5320 (DR2) images | = 90% (Messidor) = 93 % (DR1) = 96% (DR2) |
| Alam et al. [150] | Early detection of DR using OCTA images | Blood vessel tortuosity, blood vascular caliber, vessel perimeter index, blood vessel density, foveal avascular zone area, and foveal avascular zone contour irregularity | SVM | 120 images | = 94.41 % (control vs. disease) = 92.96% (control vs. mild) |
| Sandhu et al. [152], 2020 | Diagnosis of NPDR using OCT and OCTA | Curvature, reflectivity, and thickness of retinal layers (OCT), Area of foveal avascular zone, vascular caliber, vessel density, and number of bifurcation points (OCTA) | Random forest | 111 patients | = 96%, = 100%, = 94%, = 0.96 (OCT + OCTA) |
| Sharafeldeen et al. [145], 2021 | Detecting DR using OCT | Thickness, tortuosity, and reflectivity of 12 extracted retinal layers | Two-level neural networks | 260 images from 130 patients | = 96.15%, = 99.23% F1 = 97.66% = 97.69% |
| Liu et al. [151], 2021 | Detecting DR using OCTA | A discrete wavelet transform was applied to extract texture features from each image | Logistic regression, logistic regression regularized with the elastic net penalty, SVM, and the gradient boosting tree | 114 DR images + 132 control images | = 82% = 0.84 (logistic regression) |
| Wang et al. [146], 2021 | Grading DR using OCT images | Foveal avascular zone (FAZ) metrics, Vessel density, extrafoveal avascular area and vessel morphology metrics | Multivariate regression analysis was used to identify the most discriminative features | 105 eyes from 105 patients | = 83.72% = 78.38% |
| Abdelsalam et al. [147], 2021 | Diagnosis of early NPDR using OCTA | Multifractal geometry | SVM | 170 eye images | = 98.5%, = 100%, = 97.3% |
| Elsharkawy et al. [148], 2022 | Detection of DR using OCT | Gibbs energy extracted from 12 retinal layers | Majority voting using an ensemble of Neural networks | 188 3D-OCT subjects | = 90.56% (4-fold cross validation) |
5.2. Deep Learning Methods
6. The Role of AI in the Early Detection, Diagnosis, and Grading of AMD
6.1. Traditional ML Methods
6.2. Deep Learning Methods
7. Discussion and Future Trends
- Currently, FFA is the gold standard for assessing retinal vasculature, the most affected part of the retina in the diabetic eye. For early detection of DR, OCTA can detect changes in the retinal vasculature before developing DR clinical features.
- Currently, FAF and OCT are the basic methods for diagnosing and monitoring dry AMD. NIA, FFA and OCTA can provide complementary data [24].
- OCT is used to identify and monitor AMD and its abnormalities, such as drusen deposits, pseudodrusen, subretinal fluid, RPE detachment, and choroid NV [23].
- Using different medical image modalities, AI components have demonstrated outstanding capabilities to provide assisting automated early detection, diagnosis, and staging of DR and AMD diseases.
- Traditional ML methods are different with respect to the imaging modality used, the features extracted, and the classifiers used. For DR detection, diagnosis, and staging, fundus imaging, OCT, and OCTA have been used in the literature. For AMD detection, diagnosis, and staging, fundus imaging, FFA, OCT and OCTA have been used.
- Deep learning methods (mainly CNNs) have recently been introduced for the automated detection, diagnosis, and staging of DR and AMD diseases, achieving improved performance and representing the state of the art for the upcoming years. For DR detection, diagnosis, and staging, fundus imaging, OCT, and OCTA have been used. For AMD detection, diagnosis, and staging, fundus imaging and OCT have been used.
- Using mixed image modalities for the eye will provide more information about the pathology, diagnosis, and proper treatments.
- Automated image interpretation using AI will play a dominant role in the early detection, diagnosis, and staging of retinal diseases, especially DR and AMD.
- Mobile applications are emerging, and can provide a fast, mobile solution for the early detection and diagnosis of retinal diseases.
- Large data sets will be acquired and available online for users. Quantification of large datasets will help to find reliable solutions.
- Further investigation into the relationship between retinal function and structure are required.
8. Conclusions
Author Contributions
Funding
Institutional Review Board Statement
Informed Consent Statement
Data Availability Statement
Conflicts of Interest
References
- Schmidt-Erfurth, U.; Sadeghipour, A.; Gerendas, B.S.; Waldstein, S.M.; Bogunović, H. Artificial intelligence in retina. Prog. Retin. Eye Res. 2018, 67, 1–29. [Google Scholar] [CrossRef] [PubMed]
- Tan, C.S.H.; Chew, M.C.Y.; Lim, L.W.Y.; Sadda, S.R. Advances in retinal imaging for diabetic retinopathy and diabetic macular edema. Indian J. Ophthalmol. 2016, 64, 76. [Google Scholar] [PubMed]
- Bagetta, G.; Scuteri, D.; Vero, A.; Zito, M.; Naturale, M.D.; Nucci, C.; Tonin, P.; Corasaniti, M.T. Diabetic retinopathy and age-related macular degeneration: A survey of pharmacoutilization and cost in Calabria, Italy. Neural Regen. Res. 2019, 14, 1445. [Google Scholar] [CrossRef] [PubMed]
- Yau, J.W.; Rogers, S.L.; Kawasaki, R.; Lamoureux, E.L.; Kowalski, J.W.; Bek, T.; Chen, S.-J.; Dekker, J.M.; Fletcher, J.; Grauslund, J.; et al. Global prevalence and major risk factors of diabetic retinopathy. Diabetes Care 2012, 35, 556–564. [Google Scholar] [CrossRef] [Green Version]
- Harding, S. Neovascular age-related macular degeneration: Decision making and optimal management. Eye 2010, 24, 497–505. [Google Scholar] [CrossRef]
- Schwartz, R.; Loewenstein, A. Early detection of age related macular degeneration: Current status. Int. J. Retin. Vitr. 2015, 1, 1–8. [Google Scholar] [CrossRef] [Green Version]
- Cohen, S.Y.; Mrejen, S. Imaging of exudative age-related macular degeneration: Toward a shift in the diagnostic paradigm? Retina 2017, 37, 1625–1629. [Google Scholar] [CrossRef]
- Jung, J.J.; Chen, C.Y.; Mrejen, S.; Gallego-Pinazo, R.; Xu, L.; Marsiglia, M.; Boddu, S.; Freund, K.B. The incidence of neovascular subtypes in newly diagnosed neovascular age-related macular degeneration. Am. J. Ophthalmol. 2014, 158, 769.e2–779.e2. [Google Scholar] [CrossRef]
- Ryan, S.J.; Hinton, D.R.; Schachat, A.P. Retina; Elsevier Health Sciences: Amsterdam, The Netherlands, 2012. [Google Scholar]
- Baumal, C.R.; Duker, J.S. Current Management of Diabetic Retinopathy; Elsevier Health Sciences: Amsterdam, The Netherlands, 2017. [Google Scholar]
- Li, H.K.; Hubbard, L.D.; Danis, R.P.; Esquivel, A.; Florez-Arango, J.F.; Krupinski, E.A. Monoscopic versus stereoscopic retinal photography for grading diabetic retinopathy severity. Investig. Ophthalmol. Vis. Sci. 2010, 51, 3184–3192. [Google Scholar] [CrossRef] [Green Version]
- Kernt, M.; Hadi, I.; Pinter, F.; Seidensticker, F.; Hirneiss, C.; Haritoglou, C.; Kampik, A.; Ulbig, M.W.; Neubauer, A.S. Assessment of diabetic retinopathy using nonmydriatic ultra-widefield scanning laser ophthalmoscopy (Optomap) compared with ETDRS 7-field stereo photography. Diabetes Care 2012, 35, 2459–2463. [Google Scholar] [CrossRef] [Green Version]
- Salz, D.A.; Witkin, A.J. Imaging in diabetic retinopathy. Middle East Afr. J. Ophthalmol. 2015, 22, 145–150. [Google Scholar] [PubMed]
- Pascolini, D.; Mariotti, S.P. Global estimates of visual impairment: 2010. Br. J. Ophthalmol. 2012, 96, 614–618. [Google Scholar] [CrossRef] [PubMed] [Green Version]
- Colijn, J.M.; Buitendijk, G.H.; Prokofyeva, E.; Alves, D.; Cachulo, M.L.; Khawaja, A.P.; Cougnard-Gregoire, A.; Merle, B.M.; Korb, C.; Erke, M.G.; et al. Prevalence of age-related macular degeneration in Europe: The past and the future. Ophthalmology 2017, 124, 1753–1763. [Google Scholar] [CrossRef] [Green Version]
- Garrity, S.T.; Sarraf, D.; Freund, K.B.; Sadda, S.R. Multimodal imaging of nonneovascular age-related macular degeneration. Investig. Ophthalmol. Vis. Sci. 2018, 59, AMD48–AMD64. [Google Scholar] [CrossRef] [Green Version]
- Cunningham, J. Recognizing age-related macular degeneration in primary care. J. Am. Acad. PAs 2017, 30, 18–22. [Google Scholar] [CrossRef] [PubMed]
- Al-Zamil, W.M.; Yassin, S.A. Recent developments in age-related macular degeneration: A review. Clin. Interv. Aging 2017, 12, 1313. [Google Scholar] [CrossRef] [PubMed] [Green Version]
- Rickman, C.B.; Farsiu, S.; Toth, C.A.; Klingeborn, M. Dry age-related macular degeneration: Mechanisms, therapeutic targets, and imaging. Investig. Ophthalmol. Vis. Sci. 2013, 54, ORSF68–ORSF80. [Google Scholar] [CrossRef] [PubMed] [Green Version]
- Kaszubski, P.; Ami, T.B.; Saade, C.; Smith, R.T. Geographic atrophy and choroidal neovascularization in the same eye: A review. Ophthalmic Res. 2016, 55, 185–193. [Google Scholar] [CrossRef] [Green Version]
- Jonasson, F.; Fisher, D.E.; Eiriksdottir, G.; Sigurdsson, S.; Klein, R.; Launer, L.J.; Harris, T.; Gudnason, V.; Cotch, M.F. Five-year incidence, progression, and risk factors for age-related macular degeneration: The age, gene/environment susceptibility study. Ophthalmology 2014, 121, 1766–1772. [Google Scholar] [CrossRef] [Green Version]
- Chew, E.Y.; Clemons, T.E.; Agrón, E.; Sperduto, R.D.; Sangiovanni, J.P.; Kurinij, N.; Davis, M.D.; Age-Related Eye Disease Study Research Group. Long-term effects of vitamins C and E, β-carotene, and zinc on age-related macular degeneration: AREDS report no. 35. Ophthalmology 2013, 120, 1604.e4–1611.e4. [Google Scholar] [CrossRef] [Green Version]
- Talks, S.J.; Aftab, A.M.; Ashfaq, I.; Soomro, T. The role of new imaging methods in managing age-related macular degeneration. Asia-Pac. J. Ophthalmol. 2017, 6, 498–507. [Google Scholar]
- Yuzawa, M.; Mori, R.; Kawamura, A. The origins of polypoidal choroidal vasculopathy. Br. J. Ophthalmol. 2005, 89, 602–607. [Google Scholar] [CrossRef] [PubMed] [Green Version]
- Kanclerz, P.; Tuuminen, R.; Khoramnia, R. Imaging Modalities Employed in Diabetic Retinopathy Screening: A Review and Meta-Analysis. Diagnostics 2021, 11, 1802. [Google Scholar] [CrossRef]
- Rasmussen, M.L.; Broe, R.; Frydkjaer-Olsen, U.; Olsen, B.S.; Mortensen, H.B.; Peto, T.; Grauslund, J. Comparison between Early Treatment Diabetic Retinopathy Study 7-field retinal photos and non-mydriatic, mydriatic and mydriatic steered widefield scanning laser ophthalmoscopy for assessment of diabetic retinopathy. J. Diabetes Complicat. 2015, 29, 99–104. [Google Scholar] [CrossRef]
- Diabetic Retinopathy Study Research Group. Diabetic retinopathy study report number 6. Design, methods, and baseline results. Report number 7. A modification of the Airlie House classification of diabetic retinopathy. Prepared by the diabetic retinopathy. Investig. Ophthalmol. Vis. Sci. 1981, 21, 1–226. [Google Scholar]
- Diabetic Retinopathy Study Research Group. Fundus photographic risk factors for progression of diabetic retinopathy: ETDRS report number 12. Ophthalmology 1991, 98, 823–833. [Google Scholar] [CrossRef]
- Diabetic Retinopathy Study Research Group. Grading diabetic retinopathy from stereoscopic color fundus photographs—An extension of the modified Airlie House classification: ETDRS report number 10. Ophthalmology 1991, 98, 786–806. [Google Scholar] [CrossRef]
- Victor, A.A. The Role of Imaging in Age-Related Macular Degeneration. In Visual Impairment and Blindness-What We Know and What We Have to Know; IntechOpen: London, UK, 2019. [Google Scholar]
- Wong, C.W.; Yanagi, Y.; Lee, W.-K.; Ogura, Y.; Yeo, I.; Wong, T.Y.; Cheung, C.M.G. Age-related macular degeneration and polypoidal choroidal vasculopathy in Asians. Prog. Retin. Eye Res. 2016, 53, 107–139. [Google Scholar] [CrossRef]
- Seddon, J.M.; Sharma, S.; Adelman, R.A. Evaluation of the clinical age-related maculopathy staging system. Ophthalmology 2006, 113, 260–266. [Google Scholar] [CrossRef]
- Göbel, A.P.; Fleckenstein, M.; Schmitz-Valckenberg, S.; Brinkmann, C.K.; Holz, F.G. Imaging geographic atrophy in age-related macular degeneration. Ophthalmologica 2011, 226, 182–190. [Google Scholar] [CrossRef]
- Mokwa, N.F.; Ristau, T.; Keane, P.A.; Kirchhof, B.; Sadda, S.R.; Liakopoulos, S. Grading of age-related macular degeneration: Comparison between color fundus photography, fluorescein angiography, and spectral domain optical coherence tomography. J. Ophthalmol. 2013, 2013, 1–6. [Google Scholar] [CrossRef] [PubMed] [Green Version]
- Costanzo, E.; Miere, A.; Querques, G.; Capuano, V.; Jung, C.; Souied, E.H. Type 1 choroidal neovascularization lesion size: Indocyanine green angiography versus optical coherence tomography angiography. Investig. Ophthalmol. Vis. Sci. 2016, 57, OCT307–OCT313. [Google Scholar] [CrossRef] [PubMed]
- Gess, A.J.; Fung, A.E.; Rodriguez, J.G. Imaging in neovascular age-related macular degeneration. In Seminars in Ophthalmology; Taylor & Francis: Oxfordshire, UK, 2011; pp. 225–233. [Google Scholar]
- Keane, P.A.; Sim, D.A.; Sadda, S.R. Advances in imaging in age-related macular degeneration. Curr. Ophthalmol. Rep. 2013, 1, 1–11. [Google Scholar] [CrossRef] [Green Version]
- Wessel, M.M.; Nair, N.; Aaker, G.D.; Ehrlich, J.R.; D’Amico, D.J.; Kiss, S. Peripheral retinal ischaemia, as evaluated by ultra-widefield fluorescein angiography, is associated with diabetic macular oedema. Br. J. Ophthalmol. 2012, 96, 694–698. [Google Scholar] [CrossRef]
- Friberg, T.R.; Gupta, A.; Yu, J.; Huang, L.; Suner, I.; Puliafito, C.A.; Schwartz, S.D. Ultrawide angle fluorescein angiographic imaging: A comparison to conventional digital acquisition systems. Ophthalmic Surg. Lasers Imaging Retin. 2008, 39, 304–311. [Google Scholar] [CrossRef]
- Ohno-Matsui, K.; Ikuno, Y.; Lai, T.Y.; Cheung, C.M.G. Diagnosis and treatment guideline for myopic choroidal neovascularization due to pathologic myopia. Prog. Retin. Eye Res. 2018, 63, 92–106. [Google Scholar] [CrossRef]
- Moreno, J.M.R.; Barquet, L.A. Manual De Retina SERV; Elsevier Health Sciences: Amsterdam, The Netherlands, 2019. [Google Scholar]
- Karampelas, M.; Malamos, P.; Petrou, P.; Georgalas, I.; Papaconstantinou, D.; Brouzas, D. Retinal pigment epithelial detachment in age-related macular degeneration. Ophthalmol. Ther. 2020, 9, 739–756. [Google Scholar] [CrossRef]
- Donati, M.C.; Carifi, G.; Virgili, G.; Menchini, U. Retinal angiomatous proliferation: Association with clinical and angiographic features. Ophthalmologica 2006, 220, 31–36. [Google Scholar] [CrossRef]
- Pfau, M.; Goerdt, L.; Schmitz-Valckenberg, S.; Mauschitz, M.M.; Mishra, D.K.; Holz, F.G.; Lindner, M.; Fleckenstein, M. Green-light autofluorescence versus combined blue-light autofluorescence and near-infrared reflectance imaging in geographic atrophy secondary to age-related macular degeneration. Investig. Ophthalmol. Vis. Sci. 2017, 58, BIO121–BIO130. [Google Scholar] [CrossRef]
- Holz, F.G.; Sadda, S.R.; Staurenghi, G.; Lindner, M.; Bird, A.C.; Blodi, B.A.; Bottoni, F.; Chew, E.Y.; Chakravarthy, U.; Schmitz-Valckenberg, S. Imaging protocols in clinical studies in advanced age-related macular degeneration: Recommendations from classification of atrophy consensus meetings. Ophthalmology 2017, 124, 464–478. [Google Scholar] [CrossRef] [Green Version]
- Zarbin, M.A.; Casaroli-Marano, R.P.; Rosenfeld, P.J. Age-related macular degeneration: Clinical findings, histopathology and imaging techniques. Cell-Based Ther. Retin. Degener. Dis. 2014, 53, 1–32. [Google Scholar]
- Gross, N.E.; Aizman, A.; Brucker, A.; James, M. Klancnik, J.R.; Yannuzzi, L.A. Nature and risk of neovascularization in the fellow eye of patients with unilateral retinal angiomatous proliferation. Retina 2005, 25, 713–718. [Google Scholar] [CrossRef] [PubMed]
- Fleckenstein, M.; Schmitz-Valckenberg, S.; Holz, F.G. Autofluorescence imaging. In Retina; Elsevier: Amsterdam, The Netherlands, 2013; pp. 111–132. [Google Scholar]
- Ly, A.; Nivison-Smith, L.; Assaad, N.; Kalloniatis, M. Fundus autofluorescence in age-related macular degeneration. Optom. Vis. Sci. 2017, 94, 246–259. [Google Scholar] [CrossRef] [PubMed] [Green Version]
- Keilhauer, C.N.; Delori, F.C. Near-infrared autofluorescence imaging of the fundus: Visualization of ocular melanin. Investig. Ophthalmol. Vis. Sci. 2006, 47, 3556–3564. [Google Scholar] [CrossRef]
- Kellner, U.; Kellner, S.; Weinitz, S. Fundus autofluorescence (488 NM) and near-infrared autofluorescence (787 NM) visualize different retinal pigment epithelium alterations in patients with age-related macular degeneration. Retina 2010, 30, 6–15. [Google Scholar] [CrossRef]
- Acton, J.H.; Cubbidge, R.P.; King, H.; Galsworthy, P.; Gibson, J.M. Drusen detection in retro-mode imaging by a scanning laser ophthalmoscope. Acta Ophthalmol. 2011, 89, e404–e411. [Google Scholar] [CrossRef]
- Delori, F.C.; Dorey, C.K.; Staurenghi, G.; Arend, O.; Goger, D.G.; Weiter, J.J. In vivo fluorescence of the ocular fundus exhibits retinal pigment epithelium lipofuscin characteristics. Investig. Ophthalmol. Vis. Sci. 1995, 36, 718–729. [Google Scholar]
- Webb, R.H.; Hughes, G.W.; Delori, F.C. Confocal scanning laser ophthalmoscope. Appl. Opt. 1987, 26, 1492–1499. [Google Scholar] [CrossRef]
- Schmitz-Valckenberg, S.; Fleckenstein, M.; Scholl, H.P.; Holz, F.G. Fundus autofluorescence and progression of age-related macular degeneration. Surv. Ophthalmol. 2009, 54, 96–117. [Google Scholar] [CrossRef]
- Delori, F.C.; Fleckner, M.R.; Goger, D.G.; Weiter, J.J.; Dorey, C.K. Autofluorescence distribution associated with drusen in age-related macular degeneration. Investig. Ophthalmol. Vis. Sci. 2000, 41, 496–504. [Google Scholar]
- Friberg, T.R.; Pandya, A.; Eller, A.W. Non-Mydriatic Panoramic Fundus Imaging Using a Non-Contact Scanning Laser-Based System; Slack Incorporated: Thorofare, NJ, USA, 2003; Volume 34, pp. 488–497. [Google Scholar]
- Vujosevic, S.; Casciano, M.; Pilotto, E.; Boccassini, B.; Varano, M.; Midena, E. Diabetic macular edema: Fundus autofluorescence and functional correlations. Investig. Ophthalmol. Vis. Sci. 2011, 52, 442–448. [Google Scholar] [CrossRef] [PubMed] [Green Version]
- Chung, H.; Park, B.; Shin, H.J.; Kim, H.C. Correlation of fundus autofluorescence with spectral-domain optical coherence tomography and vision in diabetic macular edema. Ophthalmology 2012, 119, 1056–1065. [Google Scholar] [CrossRef] [PubMed]
- Pece, A.; Isola, V.; Holz, F.; Milani, P.; Brancato, R. Autofluorescence imaging of cystoid macular edema in diabetic retinopathy. Ophthalmologica 2010, 224, 230–235. [Google Scholar] [CrossRef] [PubMed]
- Bessho, K.; Gomi, F.; Harino, S.; Sawa, M.; Sayanagi, K.; Tsujikawa, M.; Tano, Y. Macular autofluorescence in eyes with cystoid macula edema, detected with 488 nm-excitation but not with 580 nm-excitation. Graefe’s Arch. Clin. Exp. Ophthalmol. 2009, 247, 729–734. [Google Scholar] [CrossRef]
- Sparrow, J.R.; Boulton, M. RPE lipofuscin and its role in retinal pathobiology. Exp. Eye Res. 2005, 80, 595–606. [Google Scholar] [CrossRef]
- Panorgias, A.; Zawadzki, R.J.; Capps, A.G.; Hunter, A.A.; Morse, L.S.; Werner, J.S. Multimodal assessment of microscopic morphology and retinal function in patients with geographic atrophy. Investig. Ophthalmol. Vis. Sci. 2013, 54, 4372–4384. [Google Scholar] [CrossRef] [Green Version]
- Batoglu, F.; Demirel, S.; Özmert, E.; Oguz, Y.G.; Özyol, P. Autofluorescence patterns as a predictive factor for neovascularization. Optom. Vis. Sci. 2014, 91, 950–955. [Google Scholar] [CrossRef]
- Cachulo, L.; Silva, R.; Fonseca, P.; Pires, I.; Carvajal-Gonzalez, S.; Bernardes, R.; Cunha-Vaz, J.G. Early markers of choroidal neovascularization in the fellow eye of patients with unilateral exudative age-related macular degeneration. Ophthalmologica 2011, 225, 144–149. [Google Scholar] [CrossRef]
- Yung, M.; Klufas, M.A.; Sarraf, D. Clinical applications of fundus autofluorescence in retinal disease. Int. J. Retin. Vitr. 2016, 2, 1–25. [Google Scholar] [CrossRef] [Green Version]
- Horani, M.; Mahmood, S.; Aslam, T.M. Macular atrophy of the retinal pigment epithelium in patients with neovascular age-related macular degeneration: What is the link? Part I: A review of disease characterization and morphological associations. Ophthalmol. Ther. 2019, 8, 235–249. [Google Scholar] [CrossRef] [Green Version]
- Pilotto, E.; Sportiello, P.; Alemany-Rubio, E.; Vujosevic, S.; Segalina, S.; Fregona, I.; Midena, E. Confocal scanning laser ophthalmoscope in the retromode imaging modality in exudative age-related macular degeneration. Graefe’s Arch. Clin. Exp. Ophthalmol. 2013, 251, 27–34. [Google Scholar] [CrossRef] [PubMed]
- Fujimoto, J.G.; Drexler, W.; Schuman, J.S.; Hitzenberger, C.K. Optical Coherence Tomography (OCT) in ophthalmology: Introduction. Opt. Express 2009, 17, 3978–3979. [Google Scholar] [CrossRef] [PubMed]
- Pennington, K.L.; DeAngelis, M.M. Epidemiology of age-related macular degeneration (AMD): Associations with cardiovascular disease phenotypes and lipid factors. Eye Vis. 2016, 3, 1–20. [Google Scholar] [CrossRef] [PubMed] [Green Version]
- Lalwani, G.A.; Rosenfeld, P.J.; Fung, A.E.; Dubovy, S.R.; Michels, S.; Feuer, W.; Feuer, W.; Davis, J.L.; Flynn, H.W., Jr.; Esquiabro, M. A variable-dosing regimen with intravitreal ranibizumab for neovascular age-related macular degeneration: Year 2 of the PrONTO Study. Am. J. Ophthalmol. 2009, 148, 43.e1–58.e1. [Google Scholar] [CrossRef]
- Virgili, G.; Menchini, F.; Casazza, G.; Hogg, R.; Das, R.R.; Wang, X.; Michelessi, M. Optical coherence tomography (OCT) for detection of macular oedema in patients with diabetic retinopathy. Cochrane Database Syst. Rev. 2015, 1, CD008081. [Google Scholar] [CrossRef] [Green Version]
- Costa, R.A.; Jorge, R.; Calucci, D.; Luiz, J.R.M.; Cardillo, J.A.; Scott, I.U. Intravitreal bevacizumab (avastin) for central and hemicentral retinal vein occlusions: IBeVO study. Retina 2007, 27, 141–149. [Google Scholar] [CrossRef]
- Prager, F.; Michels, S.; Kriechbaum, K.; Georgopoulos, M.; Funk, M.; Geitzenauer, W.; Polak, K.; Schmidt-Erfurth, U. Intravitreal bevacizumab (Avastin®) for macular oedema secondary to retinal vein occlusion: 12-month results of a prospective clinical trial. Br. J. Ophthalmol. 2009, 93, 452–456. [Google Scholar] [CrossRef] [Green Version]
- Kiernan, D.F.; Mieler, W.F.; Hariprasad, S.M. Spectral-domain optical coherence tomography: A comparison of modern high-resolution retinal imaging systems. Am. J. Ophthalmol. 2010, 149, 18.e2–31.e2. [Google Scholar] [CrossRef]
- Hee, M.R.; Izatt, J.A.; Swanson, E.A.; Huang, D.; Schuman, J.S.; Lin, C.P.; Puliafito, C.A.; Fujimoto, J.G. Optical coherence tomography of the human retina. Arch. Ophthalmol. 1995, 113, 325–332. [Google Scholar] [CrossRef]
- Müller, P.L.; Wolf, S.; Dolz-Marco, R.; Tafreshi, A.; Schmitz-Valckenberg, S.; Holz, F.G. Ophthalmic diagnostic imaging: Retina. In High Resolution Imaging in Microscopy and Ophthalmology; Springer: Cham, Switzerkand, 2019; pp. 87–106. [Google Scholar]
- Cereda, M.G.; Corvi, F.; Cozzi, M.; Pellegrini, M.; Staurenghi, G. Optical coherence tomography 2: Diagnostic tool to study peripheral vitreoretinal pathologies. Retina 2019, 39, 415–421. [Google Scholar] [CrossRef]
- Choma, M.A.; Sarunic, M.V.; Yang, C.; Izatt, J.A. Sensitivity advantage of swept source and Fourier domain optical coherence tomography. Opt. Express 2003, 11, 2183–2189. [Google Scholar] [CrossRef] [PubMed] [Green Version]
- Margolis, R.; Spaide, R.F. A pilot study of enhanced depth imaging optical coherence tomography of the choroid in normal eyes. Am. J. Ophthalmol. 2009, 147, 811–815. [Google Scholar] [CrossRef] [PubMed]
- An, L.; Li, P.; Lan, G.; Malchow, D.; Wang, R.K. High-resolution 1050 nm spectral domain retinal optical coherence tomography at 120 kHz A-scan rate with 6.1 mm imaging depth. Biomed. Opt. Express 2013, 4, 245–259. [Google Scholar] [CrossRef] [PubMed]
- Adhi, M.; Badaro, E.; Liu, J.J.; Kraus, M.F.; Baumal, C.R.; Witkin, A.J.; Hornegger, J.; Fujimoto, J.G.; Duker, J.S.; Waheed, N.K. Three-dimensional enhanced imaging of vitreoretinal interface in diabetic retinopathy using swept-source optical coherence tomography. Am. J. Ophthalmol. 2016, 162, 140.e1–149.e1. [Google Scholar] [CrossRef] [PubMed]
- Miller, D.; Kocaoglu, O.; Wang, Q.; Lee, S. Adaptive optics and the eye (super resolution OCT). Eye 2011, 25, 321–330. [Google Scholar] [CrossRef] [Green Version]
- Sakamoto, A.; Hangai, M.; Yoshimura, N. Spectral-domain optical coherence tomography with multiple B-scan averaging for enhanced imaging of retinal diseases. Ophthalmology 2008, 115, 1071.e7–1078.e7. [Google Scholar] [CrossRef] [Green Version]
- Talisa, E.; Chin, A.T.; Bonini Filho, M.A.; Adhi, M.; Branchini, L.; Salz, D.A.; Baumal, C.R.; Crawford, C.; Reichel, E.; Witkin, A.J.; et al. Detection of microvascular changes in eyes of patients with diabetes but not clinical diabetic retinopathy using optical coherence tomography angiography. Retina 2015, 35, 2364–2370. [Google Scholar]
- Ishibazawa, A.; Nagaoka, T.; Takahashi, A.; Omae, T.; Tani, T.; Sogawa, K.; Yokota, H.; Yoshida, A. Optical coherence tomography angiography in diabetic retinopathy: A prospective pilot study. Am. J. Ophthalmol. 2015, 160, 35.e1–44.e1. [Google Scholar] [CrossRef] [Green Version]
- Ehlers, J.P.; Goshe, J.; Dupps, W.J.; Kaiser, P.K.; Singh, R.P.; Gans, R.; Eisengart, J.; Srivastava, S.K. Determination of feasibility and utility of microscope-integrated optical coherence tomography during ophthalmic surgery: The DISCOVER Study RESCAN Results. JAMA Ophthalmol. 2015, 133, 1124–1132. [Google Scholar] [CrossRef]
- Ehlers, J.P.; Dupps, W.; Kaiser, P.; Goshe, J.; Singh, R.P.; Petkovsek, D.; Srivastava, S.K. The prospective intraoperative and perioperative ophthalmic imaging with optical coherence tomography (PIONEER) study: 2-year results. Am. J. Ophthalmol. 2014, 158, 999.e1–1007.e1. [Google Scholar] [CrossRef] [Green Version]
- Zhang, Q.; Lu, R.; Wang, B.; Messinger, J.D.; Curcio, C.A.; Yao, X. Functional optical coherence tomography enables in vivo physiological assessment of retinal rod and cone photoreceptors. Sci. Rep. 2015, 5, 1–10. [Google Scholar] [CrossRef] [PubMed]
- Drexler, W. Cellular and functional optical coherence tomography of the human retina the Cogan lecture. Investig. Ophthalmol. Vis. Sci. 2007, 48, 5340–5351. [Google Scholar] [CrossRef] [PubMed] [Green Version]
- Zhang, Q.-X.; Lu, R.-W.; Curcio, C.A.; Yao, X.-C. In vivo confocal intrinsic optical signal identification of localized retinal dysfunction. Investig. Ophthalmol. Vis. Sci. 2012, 53, 8139–8145. [Google Scholar] [CrossRef] [Green Version]
- Michels, S.; Pircher, M.; Geitzenauer, W.; Simader, C.; Gotzinger, E.; Findl, O.; Schmidt-Erfurth, U.; Hitzenberger, C. Value of polarisation-sensitive optical coherence tomography in diseases affecting the retinal pigment epithelium. Br. J. Ophthalmol. 2008, 92, 204–209. [Google Scholar] [CrossRef] [PubMed]
- Yazdanfar, S.; Rollins, A.M.; Izatt, J.A. Imaging and velocimetry of the human retinal circulation with color Doppler optical coherence tomography. Opt. Lett. 2000, 25, 1448–1450. [Google Scholar] [CrossRef] [PubMed]
- Kim, B.Y.; Smith, S.D.; Kaiser, P.K. Optical coherence tomographic patterns of diabetic macular edema. Am. J. Ophthalmol. 2006, 142, 405.e1–412.e1. [Google Scholar] [CrossRef] [PubMed]
- Kothari, A.R.; Raman, R.P.; Sharma, T.; Gupta, M.; Laxmi, G. Is there a correlation between structural alterations and retinal sensitivity in morphological patterns of diabetic macular edema? Indian J. Ophthalmol. 2013, 61, 230–232. [Google Scholar] [CrossRef] [PubMed]
- Kim, N.R.; Kim, Y.J.; Chin, H.S.; Moon, Y.S. Optical coherence tomographic patterns in diabetic macular oedema: Prediction of visual outcome after focal laser photocoagulation. Br. J. Ophthalmol. 2009, 93, 901–905. [Google Scholar] [CrossRef]
- Salz, D.A.; De Carlo, T.E.; Adhi, M.; Moult, E.M.; Choi, W.; Baumal, C.R.; Witkin, A.J.; Duker, J.S.; Fujimoto, J.G.; Waheed, N.K. Select features of diabetic retinopathy on swept-source optical coherence tomographic angiography compared with fluorescein angiography and normal eyes. JAMA Ophthalmol. 2016, 134, 644–650. [Google Scholar] [CrossRef]
- Dimitrova, G.; Chihara, E.; Takahashi, H.; Amano, H.; Okazaki, K. Quantitative retinal optical coherence tomography angiography in patients with diabetes without diabetic retinopathy. Investig. Ophthalmol. Vis. Sci. 2017, 58, 190–196. [Google Scholar] [CrossRef]
- Pircher, M.; Götzinger, E.; Findl, O.; Michels, S.; Geitzenauer, W.; Leydolt, C.; Schmidt-Erfurth, U.; Hitzenberger, C.K. Human macula investigated in vivo with polarization-sensitive optical coherence tomography. Investig. Ophthalmol. Vis. Sci. 2006, 47, 5487–5494. [Google Scholar] [CrossRef] [PubMed]
- Ueda-Arakawa, N.; Ooto, S.; Tsujikawa, A.; Yamashiro, K.; Oishi, A.; Yoshimura, N. Sensitivity and specificity of detecting reticular pseudodrusen in multimodal imaging in Japanese patients. Retina 2013, 33, 490–497. [Google Scholar] [CrossRef] [PubMed]
- Schmidt-Erfurth, U.; Klimscha, S.; Waldstein, S.; Bogunović, H. A view of the current and future role of optical coherence tomography in the management of age-related macular degeneration. Eye 2017, 31, 26–44. [Google Scholar] [CrossRef]
- Schmidt-Erfurth, U.; Kaiser, P.K.; Korobelnik, J.F.; Brown, D.M.; Chong, V.; Nguyen, Q.D.; Ho, A.C.; Ogura, Y.; Simader, Y.; Heier, J.S.; et al. Intravitreal aflibercept injection for neovascular age-related macular degeneration: Ninety-six–week results of the VIEW studies. Ophthalmology 2014, 121, 193–201. [Google Scholar] [CrossRef] [PubMed]
- Gualino, V.; Tadayoni, R.; Cohen, S.Y.; Erginay, A.; Fajnkuchen, F.; Haouchine, B.; Krivosic, V.; Quentel, G.; Vicaut, E.; Gaudric, A. Optical coherence tomography, fluorescein angiography, and diagnosis of choroidal neovascularization in age-related macular degeneration. Retina 2019, 39, 1664–1671. [Google Scholar] [CrossRef] [PubMed]
- Fleckenstein, M.; Schmitz-Valckenberg, S.; Adrion, C.; Krämer, I.; Eter, N.; Helb, H.M.; Brinkmann, C.K.; Issa, P.C.; Mansmann, U.; Holz, F.G. Tracking progression with spectral-domain optical coherence tomography in geographic atrophy caused by age-related macular degeneration. Investig. Ophthalmol. Vis. Sci. 2010, 51, 3846–3852. [Google Scholar] [CrossRef] [PubMed]
- Zweifel, S.A.; Engelbert, M.; Laud, K.; Margolis, R.; Spaide, R.F.; Freund, K.B. Outer retinal tubulation: A novel optical coherence tomography finding. Arch. Ophthalmol. 2009, 127, 1596–1602. [Google Scholar] [CrossRef]
- Chalam, K.; Sambhav, K. Optical coherence tomography angiography in retinal diseases. J. Ophthalmic Vis. Res. 2016, 11, 84–92. [Google Scholar] [CrossRef]
- Gong, J.; Yu, S.; Gong, Y.; Wang, F.; Sun, X. The diagnostic accuracy of optical coherence tomography angiography for neovascular age-related macular degeneration: A comparison with fundus fluorescein angiography. J. Ophthalmol. 2016, 2016, 1–8. [Google Scholar] [CrossRef] [Green Version]
- Perrott-Reynolds, R.; Cann, R.; Cronbach, N.; Neo, Y.N.; Ho, V.; McNally, O.; Madi, H.; Cochran, C.; Chakravarthy, U. The diagnostic accuracy of OCT angiography in naive and treated neovascular age-related macular degeneration: A review. Eye 2019, 33, 274–282. [Google Scholar] [CrossRef]
- Liang, M.C.; De Carlo, T.E.; Baumal, C.R.; Reichel, E.; Waheed, N.K.; Duker, J.S.; Witkin, A.J. Correlation of spectral domain optical coherence tomography angiography and clinical activity in neovascular age-related macular degeneration. Retina 2016, 36, 2265–2273. [Google Scholar] [CrossRef] [PubMed]
- Kvanta, A.; de Salles, M.C.; Amrén, U.; Bartuma, H. Optical coherence tomography angiography of the foveal microvasculature in geographic atrophy. Retina 2017, 37, 936–942. [Google Scholar] [CrossRef]
- Toto, L.; Borrelli, E.; di Antonio, L.; Carpineto, P.; Mastropasqua, R. Retinal Vascular Plexuses’changes in Dry Age-Related Macular Degeneration, Evaluated by Means of Optical Coherence Tomography Angiography. Retina 2016, 36, 1566–1572. [Google Scholar] [CrossRef]
- Cohen, S.Y.; Creuzot-Garcher, C.; Darmon, J.; Desmettre, T.; Korobelnik, J.F.; Levrat, F.; Quentel, G.; Palies, S.; Sanchez, A.; De Gendre, A.S.; et al. Types of choroidal neovascularisation in newly diagnosed exudative age-related macular degeneration. Br. J. Ophthalmol. 2007, 91, 1173–1176. [Google Scholar] [CrossRef]
- Farecki, M.-L.; Gutfleisch, M.; Faatz, H.; Rothaus, K.; Heimes, B.; Spital, G.; Lommatzsch, A.; Pauleikhoff, D. Characteristics of type 1 and 2 CNV in exudative AMD in OCT-Angiography. Graefe’s Arch. Clin. Exp. Ophthalmol. 2017, 255, 913–921. [Google Scholar] [CrossRef]
- Faridi, A.; Jia, Y.; Gao, S.S.; Huang, D.; Bhavsar, K.V.; Wilson, D.J.; Sill, A.; Flaxel, C.J.; Hwang, T.S.; Lauer, A.K.; et al. Sensitivity and specificity of OCT angiography to detect choroidal neovascularization. Ophthalmol. Retin. 2017, 1, 294–303. [Google Scholar] [CrossRef] [PubMed]
- Told, R.; Sacu, S.; Hecht, A.; Baratsits, M.; Eibenberger, K.; Kroh, M.E.; Rezar-Dreindl, S.; Schlanitz, F.G.; Weigert, G.; Pollreisz, A.; et al. Comparison of SD-optical coherence tomography angiography and indocyanine green angiography in type 1 and 2 neovascular age-related macular degeneration. Investig. Ophthalmol. Vis. Sci. 2018, 59, 2393–2400. [Google Scholar] [CrossRef] [PubMed] [Green Version]
- Schmoll, T.; Singh, A.S.G.; Blatter, C.; Schriefl, S.; Ahlers, C.; Schmidt-Erfurth, U.; Leitgeb, R.A. Imaging of the parafoveal capillary network and its integrity analysis using fractal dimension. Biomed. Opt. Express 2011, 2, 1159–1168. [Google Scholar] [CrossRef] [Green Version]
- Tam, J.; Dhamdhere, K.; Tiruveedhula, P.; Manzanera, S.; Barez, S.; Bearse, M.A.; Adams, A.J.; Roorda, A. Disruption of the retinal parafoveal capillary network in type 2 diabetes before the onset of diabetic retinopathy. Investig. Ophthalmol. Vis. Sci. 2011, 52, 9257–9266. [Google Scholar] [CrossRef]
- Burns, S.; Elsner, A.E.; Chui, T.Y.; VanNasdale, D.A.; Clark, C.A.; Gast, T.J.; Malinovsky, V.E.; Phan, A.-D.T. In vivo adaptive optics microvascular imaging in diabetic patients without clinically severe diabetic retinopathy. Biomed. Opt. Express 2014, 5, 961–974. [Google Scholar] [CrossRef] [Green Version]
- Lombardo, M.; Parravano, M.; Serrao, S.; Ducoli, P.; Stirpe, M.; Lombardo, G. Analysis of retinal capillaries in patients with type 1 diabetes and nonproliferative diabetic retinopathy using adaptive optics imaging. Retina 2013, 33, 1630–1639. [Google Scholar] [CrossRef] [PubMed] [Green Version]
- Lammer, J.; Prager, S.G.; Cheney, M.C.; Ahmed, A.; Radwan, S.H.; Burns, S.A.; Silva, P.S.; Sun, J.K. Cone photoreceptor irregularity on adaptive optics scanning laser ophthalmoscopy correlates with severity of diabetic retinopathy and macular edema. Investig. Ophthalmol. Vis. Sci. 2016, 57, 6624–6632. [Google Scholar] [CrossRef] [Green Version]
- Nesper, P.L.; Scarinci, F.; Fawzi, A.A. Adaptive optics reveals photoreceptor abnormalities in diabetic macular ischemia. PLoS ONE 2017, 12, e0169926. [Google Scholar] [CrossRef] [PubMed] [Green Version]
- Jonnal, R.S.; Kocaoglu, O.P.; Zawadzki, R.J.; Liu, Z.; Miller, D.T.; Werner, J.S. A review of adaptive optics optical coherence tomography: Technical advances, scientific applications, and the future. Investig. Ophthalmol. Vis. Sci. 2016, 57, OCT51–OCT68. [Google Scholar] [CrossRef]
- Sudo, K.; Cense, B. Adaptive optics-assisted optical coherence tomography for imaging of patients with age related macular degeneration. Ophthalmic Technol. XXIII 2013, 8567, 172–178. [Google Scholar] [CrossRef]
- ChaudhuRy, M.; PaRida, B.; Panigrahi, S.K. Diagnostic accuracy of B-scan ultrasonography for posterior segment eye disorders: A Cross-sectional Study. J. Clin. Diagn. Res. 2021, 15, TC07–TC012. [Google Scholar] [CrossRef]
- Mohamed, I.E.; Mohamed, M.A.; Yousef, M.; Mahmoud, M.Z.; Alonazi, B. Use of ophthalmic B-scan ultrasonography in determining the causes of low vision in patients with diabetic retinopathy. Eur. J. Radiol. Open 2018, 5, 79–86. [Google Scholar] [CrossRef] [Green Version]
- Shinar, Z.; Chan, L.; Orlinsky, M. Use of ocular ultrasound for the evaluation of retinal detachment. J. Emerg. Med. 2011, 40, 53–57. [Google Scholar] [CrossRef]
- Yuzurihara, D.; Iijima, H. Visual outcome in central retinal and branch retinal artery occlusion. Jpn. J. Ophthalmol. 2004, 48, 490–492. [Google Scholar] [CrossRef]
- Bhagat, N.; Grigorian, R.A.; Tutela, A.; Zarbin, M.A. Diabetic macular edema: Pathogenesis and treatment. Surv. Ophthalmol. 2009, 54, 1–32. [Google Scholar] [CrossRef]
- Palanisamy, G.; Shankar, N.B.; Ponnusamy, P.; Gopi, V.P. A hybrid feature preservation technique based on luminosity and edge based contrast enhancement in color fundus images. Biocybern. Biomed. Eng. 2020, 40, 752–763. [Google Scholar] [CrossRef]
- Chen, Q.; de Sisternes, L.; Leng, T.; Rubin, D.L. Application of improved homogeneity similarity-based denoising in optical coherence tomography retinal images. J. Digit. Imaging 2015, 28, 346–361. [Google Scholar] [CrossRef] [Green Version]
- Liu, H.; Lin, S.; Ye, C.; Yu, D.; Qin, J.; An, L. Using a dual-tree complex wavelet transform for denoising an optical coherence tomography angiography blood vessel image. OSA Contin. 2020, 3, 2630–2645. [Google Scholar] [CrossRef]
- Cui, D.; Liu, M.; Hu, L.; Liu, K.; Guo, Y.; Jiao, Q. The Application of Wavelet-Domain Hidden Markov Tree Model in Diabetic Retinal Image Denoising. Open Biomed. Eng. J. 2015, 9, 194. [Google Scholar] [CrossRef] [PubMed] [Green Version]
- Stitt, A.W.; Curtis, T.M.; Chen, M.; Medina, R.J.; McKay, G.J.; Jenkins, A.; Gardiner, T.A.; Lyons, T.J.; Hammes, H.-P.; Simó, R.; et al. The progress in understanding and treatment of diabetic retinopathy. Prog. Retin. Eye Res. 2016, 51, 156–186. [Google Scholar] [CrossRef]
- Ting, D.S.W.; Cheung, C.Y.-L.; Lim, G.; Tan, G.S.W.; Quang, N.D.; Gan, A.; Hamzah, H.; Garcia-Franco, R.; Yeo, I.Y.S.; Lee, S.Y.; et al. Development and validation of a deep learning system for diabetic retinopathy and related eye diseases using retinal images from multiethnic populations with diabetes. JAMA 2017, 318, 2211–2223. [Google Scholar] [CrossRef]
- Welikala, R.; Fraz, M.; Dehmeshki, J.; Hoppe, A.; Tah, V.; Mann, S.; Williamson, T.; Barman, S. Genetic algorithm based feature selection combined with dual classification for the automated detection of proliferative diabetic retinopathy. Comput. Med. Imaging Graph. 2015, 43, 64–77. [Google Scholar] [CrossRef] [Green Version]
- Prasad, D.K.; Vibha, L.; Venugopal, K. Early detection of diabetic retinopathy from digital retinal fundus images. In Proceedings of the 2015 IEEE Recent Advances in Intelligent Computational Systems, Trivandrum, Kerala, India, 10–12 December 2015; pp. 240–245. [Google Scholar]
- Mahendran, G.; Dhanasekaran, R. Investigation of the severity level of diabetic retinopathy using supervised classifier algorithms. Comput. Electr. Eng. 2015, 45, 312–323. [Google Scholar] [CrossRef]
- Bhatkar, A.P.; Kharat, G. Detection of diabetic retinopathy in retinal images using MLP classifier. In Proceedings of the 2015 IEEE International Symposium on Nanoelectronic and Information Systems, Bhopal, India, 21–23 December 2015; pp. 331–335. [Google Scholar]
- Labhade, J.D.; Chouthmol, L.; Deshmukh, S. Diabetic retinopathy detection using soft computing techniques. In Proceedings of the 2016 International Conference on Automatic Control and Dynamic Optimization Techniques (ICACDOT), Pune, India, 9–10 September 2016; pp. 175–178. [Google Scholar]
- Rahim, S.S.; Palade, V.; Shuttleworth, J.; Jayne, C. Automatic screening and classification of diabetic retinopathy and maculopathy using fuzzy image processing. Brain Inform. 2016, 3, 249–267. [Google Scholar] [CrossRef]
- Islam, M.; Dinh, A.V.; Wahid, K.A. Automated diabetic retinopathy detection using bag of words approach. J. Biomed. Sci. Eng. 2017, 10, 86–96. [Google Scholar] [CrossRef] [Green Version]
- Carrera, E.V.; González, A.; Carrera, R. Automated detection of diabetic retinopathy using SVM. In Proceedings of the 2017 IEEE XXIV International Conference on Electronics, Electrical Engineering and Computing (INTERCON), Cusco, Peru, 15–18 August 2017; pp. 1–4. [Google Scholar]
- Somasundaram, S.K.; Alli, P. A machine learning ensemble classifier for early prediction of diabetic retinopathy. J. Med. Syst. 2017, 41, 1–12. [Google Scholar]
- Costa, P.; Galdran, A.; Smailagic, A.; Campilho, A. A weakly-supervised framework for interpretable diabetic retinopathy detection on retinal images. IEEE Access 2018, 6, 18747–18758. [Google Scholar] [CrossRef]
- Sharafeldeen, A.; Elsharkawy, M.; Khalifa, F.; Soliman, A.; Ghazal, M.; AlHalabi, M.; Yaghi, M.; Alrahmawy, M.; Elmougy, S.; Sandhu, H.S.; et al. Precise higher-order reflectivity and morphology models for early diagnosis of diabetic retinopathy using OCT images. Sci. Rep. 2021, 11, 1–16. [Google Scholar] [CrossRef] [PubMed]
- Wang, X.; Han, Y.; Sun, G.; Yang, F.; Liu, W.; Luo, J.; Cao, X.; Yin, P.; Myers, F.L.; Zhou, L. Detection of the Microvascular Changes of Diabetic Retinopathy Progression Using Optical Coherence Tomography Angiography. Transl. Vis. Sci. Technol. 2021, 10, 31. [Google Scholar] [CrossRef] [PubMed]
- Abdelsalam, M.M.; Zahran, M. A novel approach of diabetic retinopathy early detection based on multifractal geometry analysis for OCTA macular images using support vector machine. IEEE Access 2021, 9, 22844–22858. [Google Scholar] [CrossRef]
- Elsharkawy, M.; Sharafeldeen, A.; Soliman, A.; Khalifa, F.; Ghazal, M.; El-Daydamony, E.; Atwan, A.; Sandhu, H.S.; El-Baz, A. A Novel Computer-Aided Diagnostic System for Early Detection of Diabetic Retinopathy Using 3D-OCT Higher-Order Spatial Appearance Model. Diagnostics 2022, 12, 461. [Google Scholar] [CrossRef]
- Eladawi, N.; Elmogy, M.; Fraiwan, L.; Pichi, F.; Ghazal, M.; Aboelfetouh, A.; Riad, A.; Keynton, R.; Schaal, S.; El-Baz, A. Early diagnosis of diabetic retinopathy in octa images based on local analysis of retinal blood vessels and foveal avascular zone. In Proceedings of the 2018 24th International Conference on Pattern Recognition (ICPR), Beijing, China, 20–24 August 2018; pp. 3886–3891. [Google Scholar]
- Alam, M.; Zhang, Y.; Lim, J.I.; Chan, R.V.; Yang, M.; Yao, X. Quantitative optical coherence tomography angiography features for objective classification and staging of diabetic retinopathy. Retina 2020, 40, 322–332. [Google Scholar] [CrossRef]
- Liu, Z.; Wang, C.; Cai, X.; Jiang, H.; Wang, J. Discrimination of Diabetic Retinopathy From Optical Coherence Tomography Angiography Images Using Machine Learning Methods. IEEE Access 2021, 9, 51689–51694. [Google Scholar] [CrossRef]
- Sandhu, H.S.; Elmogy, M.; Sharafeldeen, A.T.; Elsharkawy, M.; El-Adawy, N.; Eltanboly, A.; Shalaby, A.; Keynton, R.; El-Baz, A. Automated diagnosis of diabetic retinopathy using clinical biomarkers, optical coherence tomography, and optical coherence tomography angiography. Am. J. Ophthalmol. 2020, 216, 201–206. [Google Scholar] [CrossRef]
- Decencière, E.; Zhang, X.; Cazuguel, G.; Lay, B.; Cochener, B.; Trone, C.; Gain, P.; Ordóñez-Varela, J.-R.; Massin, P.; Erginay, A.; et al. Feedback on a publicly distributed image database: The Messidor database. Image Anal. Stereol. 2014, 33, 231–234. [Google Scholar] [CrossRef] [Green Version]
- Kauppi, T.; Kalesnykiene, V.; Kamarainen, J.-K.; Lensu, L.; Sorri, I.; Raninen, A.; Voutilainen, R.; Uusitalo, H.; Kalviainen, H.; Pietila, J. The diaretdb1 diabetic retinopathy database and evaluation protocol. In Proceedings of the BMVC, University of Warwick, Coventry, UK, 10–13 September 2007; Volume 1, pp. 1–10. [Google Scholar]
- Gulshan, V.; Peng, L.; Coram, M.; Stumpe, M.C.; Wu, D.; Narayanaswamy, A.; Venugopalan, S.; Widner, K.; Madams, T.; Cuadros, J.; et al. Development and validation of a deep learning algorithm for detection of diabetic retinopathy in retinal fundus photographs. JAMA 2016, 316, 2402–2410. [Google Scholar] [CrossRef] [PubMed]
- Colas, E.; Besse, A.; Orgogozo, A.; Schmauch, B.; Meric, N.; Besse, E. Deep learning approach for diabetic retinopathy screening. Acta Ophthalmol. 2016, 94, 1. [Google Scholar] [CrossRef]
- Takahashi, H.; Tampo, H.; Arai, Y.; Inoue, Y.; Kawashima, H. Applying artificial intelligence to disease staging: Deep learning for improved staging of diabetic retinopathy. PLoS ONE 2017, 12, e0179790. [Google Scholar] [CrossRef] [PubMed] [Green Version]
- Quellec, G.; Charrière, K.; Boudi, Y.; Cochener, B.; Lamard, M. Deep image mining for diabetic retinopathy screening. Med. Image Anal. 2017, 39, 178–193. [Google Scholar] [CrossRef] [Green Version]
- Wang, Z.; Yin, Y.; Shi, J.; Fang, W.; Li, H.; Wang, X. Zoom-in-net: Deep mining lesions for diabetic retinopathy detection. In Proceedings of the International Conference on Medical Image Computing and Computer-Assisted Intervention, Quebec, Canada, 10–14 September 2017; Springer: Berlin/Heidelberg, Germany, 2017; pp. 267–275. [Google Scholar]
- Dutta, S.; Manideep, B.; Basha, S.M.; Caytiles, R.D.; Iyengar, N. Classification of diabetic retinopathy images by using deep learning models. Int. J. Grid Distrib. Comput. 2018, 11, 89–106. [Google Scholar] [CrossRef]
- Zhang, X.; Zhang, W.; Fang, M.; Xue, J.; Wu, L. Automatic classification of diabetic retinopathy based on convolutional neural networks. In Proceedings of the 2018 International Conference on Image and Video Processing, and Artificial Intelligence, Shanghai, China, 15–17 August 2018; International Society for Optics and Photonics: Bellingham, DC, USA, 2018; Volume 10836, p. 1083608. [Google Scholar]
- Chakrabarty, N. A deep learning method for the detection of diabetic retinopathy. In Proceedings of the 2018 5th IEEE Uttar Pradesh Section International Conference on Electrical, Electronics and Computer Engineering (UPCON), Gorakhpur, India, 2–4 November 2018; pp. 1–5. [Google Scholar]
- Kwasigroch, A.; Jarzembinski, B.; Grochowski, M. Deep CNN based decision support system for detection and assessing the stage of diabetic retinopathy. In Proceedings of the 2018 International Interdisciplinary PhD Workshop (IIPhDW), Swinoujscie, Poland, 9–12 May 2018; pp. 111–116. [Google Scholar]
- Li, F.; Liu, Z.; Chen, H.; Jiang, M.; Zhang, X.; Wu, Z. Automatic detection of diabetic retinopathy in retinal fundus photographs based on deep learning algorithm. Transl. Vis. Sci. Technol. 2019, 8, 4. [Google Scholar] [CrossRef] [Green Version]
- Nagasawa, T.; Tabuchi, H.; Masumoto, H.; Enno, H.; Niki, M.; Ohara, Z.; Yoshizumi, Y.; Ohsugi, H.; Mitamura, Y. Accuracy of ultrawide-field fundus ophthalmoscopy-assisted deep learning for detecting treatment-naïve proliferative diabetic retinopathy. Int. Ophthalmol. 2019, 39, 2153–2159. [Google Scholar] [CrossRef] [Green Version]
- Metan, A.C.; Lambert, A.; Pickering, M. Small Scale Feature Propagation Using Deep Residual Learning for Diabetic Retinopathy Classification. In Proceedings of the 2019 IEEE 4th International Conference on Image, Vision and Computing (ICIVC), Xiamen, China, 5–7 July 2019; pp. 392–396. [Google Scholar]
- Qummar, S.; Khan, F.G.; Shah, S.; Khan, A.; Shamshirband, S.; Rehman, Z.U.; Khan, L.A.; Jadoon, W. A deep learning ensemble approach for diabetic retinopathy detection. IEEE Access 2019, 7, 150530–150539. [Google Scholar] [CrossRef]
- Sayres, R.; Taly, A.; Rahimy, E.; Blumer, K.; Coz, D.; Hammel, N.; Krause, J.; Narayanaswamy, A.; Rastegar, Z.; Wu, D.; et al. Using a deep learning algorithm and integrated gradients explanation to assist grading for diabetic retinopathy. Ophthalmology 2019, 126, 552–564. [Google Scholar] [CrossRef] [Green Version]
- Sengupta, S.; Singh, A.; Zelek, J.; Lakshminarayanan, V. Cross-domain diabetic retinopathy detection using deep learning. In Applications of Machine Learning; International Society for Optics and Photonics: Bellingham, DC, USA, 2019; Volume 11139, p. 111390V. [Google Scholar]
- Narayanan, B.N.; Hardie, R.C.; de Silva, M.S.; Kueterman, N.K. Hybrid machine learning architecture for automated detection and grading of retinal images for diabetic retinopathy. J. Med. Imaging 2020, 7, 034501. [Google Scholar] [CrossRef]
- Shankar, K.; Sait, A.R.W.; Gupta, D.; Lakshmanaprabu, S.; Khanna, A.; Pandey, H.M. Automated detection and classification of fundus diabetic retinopathy images using synergic deep learning model. Pattern Recognit. Lett. 2020, 133, 210–216. [Google Scholar] [CrossRef]
- He, A.; Li, T.; Li, N.; Wang, K.; Fu, H. CABNet: Category attention block for imbalanced diabetic retinopathy grading. IEEE Trans. Med. Imaging 2020, 40, 143–153. [Google Scholar] [CrossRef] [PubMed]
- Saeed, F.; Hussain, M.; Aboalsamh, H.A. Automatic diabetic retinopathy diagnosis using adaptive fine-tuned convolutional neural network. IEEE Access 2021, 9, 41344–41359. [Google Scholar] [CrossRef]
- Wang, Y.; Yu, M.; Hu, B.; Jin, X.; Li, Y.; Zhang, X.; Zhang, Y.; Gong, D.; Wu, C.; Zhang, B.; et al. Deep learning-based detection and stage grading for optimising diagnosis of diabetic retinopathy. Diabetes/Metab. Res. Rev. 2021, 37, e3445. [Google Scholar] [CrossRef] [PubMed]
- Hsieh, Y.-T.; Chuang, L.-M.; Jiang, Y.-D.; Chang, T.-J.; Yang, C.-M.; Yang, C.-H.; Chan, L.-W.; Kao, T.-Y.; Chen, T.-C.; Lin, H.-C.; et al. Application of deep learning image assessment software VeriSee™ for diabetic retinopathy screening. J. Formos. Med. Assoc. 2021, 120, 165–171. [Google Scholar] [CrossRef] [PubMed]
- Khan, Z.; Khan, F.G.; Khan, A.; Rehman, Z.U.; Shah, S.; Qummar, S.; Ali, S.; Pack, S. Diabetic Retinopathy Detection Using VGG-NIN a Deep Learning Architecture. IEEE Access 2022, 9, 61408–61416. [Google Scholar] [CrossRef]
- Zia, F.; Irum, I.; Qadri, N.N.; Nam, Y.; Khurshid, K.; Ali, M.; Ashraf, I.; Khan, M.A. A Multilevel Deep Feature Selection Framework for Diabetic Retinopathy Image Classification. Comput. Mater. Contin. 2022, 70, 2261–2276. [Google Scholar] [CrossRef]
- Das, S.; Saha, S.K. Diabetic retinopathy detection and classification using CNN tuned by genetic algorithm. Multimed. Tools Appl. 2022, 81, 8007–8020. [Google Scholar] [CrossRef]
- Tsai, C.-Y.; Chen, C.-T.; Chen, G.-A.; Yeh, C.-F.; Kuo, C.-T.; Hsiao, Y.-C.; Hu, H.-Y.; Tsai, I.-L.; Wang, C.-H.; Chen, J.-R.; et al. Necessity of Local Modification for Deep Learning Algorithms to Predict Diabetic Retinopathy. Int. J. Environ. Res. Public Health 2022, 19, 1204. [Google Scholar] [CrossRef]
- Gao, Z.; Jin, K.; Yan, Y.; Liu, X.; Shi, Y.; Ge, Y.; Pan, X.; Lu, Y.; Wu, J.; Wang, Y.; et al. End-to-end diabetic retinopathy grading based on fundus fluorescein angiography images using deep learning. Graefe’s Arch. Clin. Exp. Ophthalmol. 2022, 260, 1663–1673. [Google Scholar] [CrossRef]
- ElTanboly, A.; Ismail, M.; Shalaby, A.; Switala, A.; El-Baz, A.; Schaal, S.; Gimel’Farb, G.; El-Azab, M.; Switala, A.; El-Bazy, A. A computer-aided diagnostic system for detecting diabetic retinopathy in optical coherence tomography images. Med. Phys. 2017, 44, 914–923. [Google Scholar] [CrossRef] [PubMed]
- ElTanboly, A.; Ghazal, M.; Khalil, A.; Shalaby, A.; Mahmoud, A.; Switala, A.; El-Azab, M.; Schaal, S.; El-Baz, A. An integrated framework for automatic clinical assessment of diabetic retinopathy grade using spectral domain OCT images. In Proceedings of the 2018 IEEE 15th International Symposium on Biomedical Imaging (ISBI 2018), Washington, DC, USA, 4–7 April 2018; pp. 1431–1435. [Google Scholar]
- Li, X.; Shen, L.; Shen, M.; Tan, F.; Qiu, C.S. Deep learning based early stage diabetic retinopathy detection using optical coherence tomography. Neurocomputing 2019, 369, 134–144. [Google Scholar] [CrossRef]
- Ghazal, M.; Ali, S.S.; Mahmoud, A.H.; Shalaby, A.M.; El-Baz, A. Accurate detection of non-proliferative diabetic retinopathy in optical coherence tomography images using convolutional neural networks. IEEE Access 2020, 8, 34387–34397. [Google Scholar] [CrossRef]
- Heisler, M.; Karst, S.; Lo, J.; Mammo, Z.; Yu, T.; Warner, S.; Maberley, D.; Beg, M.F.; Navajas, E.V.; Sarunic, M.V. Ensemble deep learning for diabetic retinopathy detection using optical coherence tomography angiography. Transl. Vis. Sci. Technol. 2020, 9, 20. [Google Scholar] [CrossRef] [Green Version]
- Ryu, G.; Lee, K.; Park, D.; Park, S.H.; Sagong, M. A deep learning model for identifying diabetic retinopathy using optical coherence tomography angiography. Sci. Rep. 2021, 11, 1–9. [Google Scholar] [CrossRef]
- Zang, P.; Gao, L.; Hormel, T.T.; Wang, J.; You, Q.; Hwang, T.S.; Jia, Y. DcardNet: Diabetic retinopathy classification at multiple levels based on structural and angiographic optical coherence tomography. IEEE Trans. Biomed. Eng. 2020, 68, 1859–1870. [Google Scholar] [CrossRef]
- Ghosh, R.; Ghosh, K.; Maitra, S. Automatic detection and classification of diabetic retinopathy stages using CNN. In Proceedings of the 2017 4th International Conference on Signal Processing and Integrated Networks (SPIN), Noida, Delhi-NCR, India, 2–3 February 2017; pp. 550–554. [Google Scholar]
- Hathwar, S.B.; Srinivasa, G. Automated grading of diabetic retinopathy in retinal fundus images using deep learning. In Proceedings of the 2019 IEEE International Conference on Signal and Image Processing Applications (ICSIPA), Kuala Lumpur, Malaysia, 17–19 September 2019; pp. 73–77. [Google Scholar]
- García-Floriano, A.; Ferreira-Santiago, Á.; Camacho-Nieto, O.; Yáñez-Márquez, C. A machine learning approach to medical image classification: Detecting age-related macular degeneration in fundus images. Comput. Electr. Eng. 2019, 75, 218–229. [Google Scholar] [CrossRef]
- Liu, Y.-Y.; Ishikawa, H.; Chen, M.; Wollstein, G.; Duker, J.S.; Fujimoto, J.G.; Schuman, J.S.; Rehg, J. Computerized macular pathology diagnosis in spectral domain optical coherence tomography scans based on multiscale texture and shape features. Investig. Ophthalmol. Vis. Sci. 2011, 52, 8316–8322. [Google Scholar] [CrossRef] [Green Version]
- Srinivasan, P.P.; Kim, L.; Mettu, P.S.; Cousins, S.W.; Comer, G.M.; Izatt, J.A.; Farsiu, S. Fully automated detection of diabetic macular edema and dry age-related macular degeneration from optical coherence tomography images. Biomed. Opt. Express 2014, 5, 3568–3577. [Google Scholar] [CrossRef] [Green Version]
- Fraccaro, P.; Nicolo, M.; Bonetto, M.; Giacomini, M.; Weller, P.; Traverso, C.E.; Prosperi, M.; Osullivan, D. Combining macula clinical signs and patient characteristics for age-related macular degeneration diagnosis: A machine learning approach. BMC Ophthalmol. 2015, 15, 10. [Google Scholar] [CrossRef] [Green Version]
- Lee, C.S.; Baughman, D.M.; Lee, A.Y. Deep learning is effective for classifying normal versus age-related macular degeneration OCT images. Ophthalmol. Retin. 2017, 1, 322–327. [Google Scholar] [CrossRef]
- Burlina, P.M.; Joshi, N.; Pekala, M.; Pacheco, K.D.; Freund, D.E.; Bressler, N.M. Automated grading of age-related macular degeneration from color fundus images using deep convolutional neural networks. JAMA Ophthalmol. 2017, 135, 1170–1176. [Google Scholar] [CrossRef] [PubMed]
- Hassan, T.; Akram, M.U.; Akhtar, M.; Khan, S.A.; Yasin, U. Multilayered deep structure tensor delaunay triangulation and morphing based automated diagnosis and 3D presentation of human macula. J. Med. Syst. 2018, 42, 1–17. [Google Scholar] [CrossRef] [PubMed]
- Motozawa, N.; An, G.; Takagi, S.; Kitahata, S.; Mandai, M.; Hirami, Y.; Yokota, H.; Akiba, M.; Tsujikawa, A.; Takahashi, M.; et al. Optical coherence tomography-based deep-learning models for classifying normal and age-related macular degeneration and exudative and non-exudative age-related macular degeneration changes. Ophthalmol. Ther. 2019, 8, 527–539. [Google Scholar] [CrossRef] [PubMed] [Green Version]
- Li, F.; Chen, H.; Liu, Z.; Zhang, X.; Wu, Z. Fully automated detection of retinal disorders by image-based deep learning. Graefe’s Arch. Clin. Exp. Ophthalmol. 2019, 257, 495–505. [Google Scholar] [CrossRef] [PubMed]
- Tan, J.H.; Bhandary, S.V.; Sivaprasad, S.; Hagiwara, Y.; Bagchi, A.; Raghavendra, U.; Rao, A.K.; Raju, B.; Shetty, N.S.; Gertych, A.; et al. Age-related macular degeneration detection using deep convolutional neural network. Future Gener. Comput. Syst. 2018, 87, 127–135. [Google Scholar] [CrossRef]
- Hwang, D.-K.; Hsu, C.-C.; Chang, K.-J.; Chao, D.; Sun, C.-H.; Jheng, Y.-C.; Yarmishyn, A.A.; Wu, J.-C.; Tsai, C.-Y.; Wang, M.-L.; et al. Artificial intelligence-based decision-making for age-related macular degeneration. Theranostics 2019, 9, 232–245. [Google Scholar] [CrossRef] [PubMed]
- Treder, M.; Lauermann, J.L.; Eter, N. Automated detection of exudative age-related macular degeneration in spectral domain optical coherence tomography using deep learning. Graefe’s Arch. Clin. Exp. Ophthalmol. 2018, 256, 259–265. [Google Scholar] [CrossRef]
- An, G.; Yokota, H.; Motozawa, N.; Takagi, S.; Mandai, M.; Kitahata, S.; Hirami, Y.; Takahashi, M.; Kurimoto, Y.; Akiba, M. Deep learning classification models built with two-step transfer learning for age related macular degeneration diagnosis. In Proceedings of the 2019 41st Annual International Conference of the IEEE Engineering in Medicine and Biology Society (EMBC), Berlin, Germany, 23–27 July 2019; pp. 2049–2052. [Google Scholar]
- Jiang, F.; Jiang, Y.; Zhi, H.; Dong, Y.; Li, H.; Ma, S.; Wang, Y.; Dong, Q.; Shen, H.; Wang, Y. Artificial intelligence in healthcare: Past, present and future. Stroke Vasc. Neurol. 2017, 2, 230–243. [Google Scholar] [CrossRef]
- Tekkeşin, A. A rtificial intelligence in healthcare: Past, present and future. Anatol. J. Cardiol. 2019, 22, 8–9. [Google Scholar]
- Alksas, A.; Shehata, M.; Saleh, G.A.; Shaffie, A.; Soliman, A.; Ghazal, M.; Khelifi, A.; Abu Khalifeh, H.; Razek, A.A.; Giridharan, G.A.; et al. A novel computer-aided diagnostic system for accurate detection and grading of liver tumors. Sci. Rep. 2021, 11, 1–18. [Google Scholar] [CrossRef] [PubMed]
- Yanagihara, R.T.; Lee, C.S.; Ting, D.S.W.; Lee, A.Y. Methodological challenges of deep learning in optical coherence tomography for retinal diseases: A review. Transl. Vis. Sci. Technol. 2020, 9, 11. [Google Scholar] [CrossRef] [PubMed] [Green Version]
- Schlegl, T.; Waldstein, S.M.; Bogunovic, H.; Endstraßer, F.; Sadeghipour, A.; Philip, A.-M.; Podkowinski, D.; Gerendas, B.S.; Langs, G.; Schmidt-Erfurth, U. Fully automated detection and quantification of macular fluid in OCT using deep learning. Ophthalmology 2018, 125, 549–558. [Google Scholar] [CrossRef] [Green Version]
- Abràmoff, M.D.; Lavin, P.T.; Birch, M.; Shah, N.; Folk, J.C. Pivotal trial of an autonomous AI-based diagnostic system for detection of diabetic retinopathy in primary care offices. NPJ Digit. Med. 2018, 1, 1–8. [Google Scholar] [CrossRef]
- De Fauw, J.; Ledsam, J.R.; Romera-Paredes, B.; Nikolov, S.; Tomasev, N.; Blackwell, S.; Askham, H.; Glorot, X.; O’Donoghue, B.; Visentin, D.; et al. Clinically applicable deep learning for diagnosis and referral in retinal disease. Nat. Med. 2018, 24, 1342–1350. [Google Scholar] [CrossRef] [PubMed]
- Michl, M.; Fabianska, M.; Seeböck, P.; Sadeghipour, A.; Najeeb, B.H.; Bogunovic, H.; Schmidt-Erfurth, U.M.; Gerendas, B.S. Automated quantification of macular fluid in retinal diseases and their response to anti-VEGF therapy. Br. J. Ophthalmol. 2022, 106, 113–120. [Google Scholar] [CrossRef] [PubMed]


| Study | Goal | Deep Network | Other Features | Database Size | Performance |
|---|---|---|---|---|---|
| Gulshan et al. [155], 2016 | Grading of DR and DME using fundus images | Ensemble of 10 CNN networks | Final decision was computed as the linear average of the predictions of the ensemble | 128,175 + 9963 from EyePACS-1 +1748 from MESSIDOR-2 | = 99.1% (EyePACS-1) = 99% (Messidor-2) |
| Colas et al. [156], 2016 | Grading of DR using fundus images | Deep CNN network | Their technique provides the location of the detected anomalies | 70,000 image (training) +10,000 (test) | AUC = 94.6%, Sen = 96.2%, Spef = 66.6% |
| Ghosh et al. [188], 2017 | Grading of DR using fundus images | 28-layer CNN | Data augmentation, normalization denoising were applied before the CNN | 30,000 Kaggle images | ACC = 95% (two-class) ACC = 85% (five-class) |
| Eltanboly et al. [181], 2017 | DR detection using OCT images | Deep fusion classifier using auto-encoders | Features are: reflectivity, curvature, and thickness of twelve segmented retinal layers | 52 scans | ACC = 92% Sen = 83%, and Spef = 100% |
| Takahashi et al. [157], 2017 | Differentiate between NPDR, Severe NPDR, and PDR using fundus images | Modified GoogleNet | Fundus scans are the inputs to the Modified GoogleNet | 9939 scans from 2740 patients | = 81% |
| Quellec et al. [158], 2017 | Grading DR using fundus images | 26-layer ConvNets | An ensemble of ConvNet was used | 88,702 scans (Kaggle) +107,799 images (e-optha) | AUC = 0.954 (Kaggle) AUC = 0.949 (e-optha) |
| Ting et al. [134], 2017 | Identifying DR and related eye diseases using fundus images | Adapted VGGNet architecture | An ensemble of two networks for detecting referable DR | 494,661 images | Sen = 90.5% Spef = 91.6% for detecting referable DR |
| Wang et al. [159] | Diagnosing DR and identifying suspicious regions using fundus images | Zoom-in-Net | Inception-Resnet for the backbone network | 35k/11k/43k for train/val/test (EyePACS) and 1.2k (Messidor) | AUC = 0.95 (Messidor) AUC = 0.92 (EyePACS) |
| Dutta et al. [160], 2018 | Differentiate between mild NPDR, moderate NPDR, severe NPDR, and PDR | Back propagation NN, Deep NN, and CNN | CNN used VGG16 model | 35,000 training and 15,000 test images (Kaggle) | ACC = 86.3% (DNN) ACC = 78.3% (VGGNet) ACC = 42% (back propagation NN) |
| Eltanboly et al. [182], 2018 | Grading of nonproliferative DR using OCT images | Two-stage deep fusion classifier using autoencoder | Features are: reflectivity, curvature, and thickness of twelve segmented retinal layers | 74 OCT images | ACC = 93% Sen = 91%, Spef = 97% (for detecting DR) ACC = 98% (for detecting early stage from mild/moderate DR) |
| Zhang et al. [161], 2018 | Diagnose the severity of diabetic retinopathy (DR) | DR-Net with an adaptive cross-entropy loss | Data augmentation is applied | 88,702 images from EyePACS dataset | = 82.1% |
| Chakrabarty et al. [162], 2018 | DR detection using fundus images | 9-layer CNN | Resized grey-level Fundus scans are the inputs to the CNN | 300 images | = 100% = 100% |
| Kwasigroch et al. [163], 2018 | DR detection and staging using fundus images | VGGNet | Fundus scans are the inputs to the CNN | 88,000 images | ACC = 82% (DR detection) ACC = 51% (DR staging) |
| Li et al. [164], 2019 | Detection of referral DR using fundus images | Inception-v3 | Enhanced contrast scans are the inputs to the CNN, Transfer learning is applied | 19,233 images from 5278 patients | ACC = 93.49% Sen = 96.93% Spef = 93.45% AUC = 0.9905 |
| Nagasawa et al. [165], 2019 | Differentiate between nonPDR and PDR using ultrawide-field fundus images | Inception-v3 | Transfer learning is applied | 378 scans | Sen = 94.7% Spec = 97.2% AUC = 0.969 |
| Metan et al. [166], 2019 | DR staging using fundus images | ResNet | Color fundus images are the inputs to the CNN | 88,702 (EyePacks) | = 91% |
| Qummar et al. [167], 2019 | DR staging using fundus images | Five CNNs: ResNet50, Inception-v3, Xception, Dense121, and Dense 169 | Ensemble of five CNN | 88,702 (EyePacks) | ACC = 80.80%, Recall = 51.50%, Spef = 86.72%, F1 = 53.74% |
| Sayres et al. [168], 2019 | DR staging using fundus images | Inception-v4 | Fundus images are the inputs to the CNN | 1769 images from 1612 patients | = 88.4% |
| Sengupta et al. [169], 2019 | DR staging using fundus images | Inception-v3 | Data preprocessing is applied | Kaggle EYEPACS and Messidor datasets | Sen = 90% Spef = 91.94% ACC = 90.4 |
| Hathwar et al. [189], 2019 | DR detection and staging using fundus images | Xception | Transfer learning is applied | 35,124 images (EyePACS) 413 images (IDRiD) | = 94.3% (DR detection) |
| Li et al. [183], 2019 | Early detection of DR using OCT images | OCTD_Net | Data augmentation is applied | 4168 OCT images | ACC = 92% Spef = 95% Sen = 92% |
| Heisler et al. [185], 2020 | Classifying DR Using OCTA images | Four fine-tuned VGG19 | Ensemble training is applied based on majority voting or stacking | 463 volumes from 360 eyes | = 92% (majority voting) = 90% (stacking) |
| Zang et al. [187], 2020 | Classifying DR Using OCT and OCTA images | DcardNet | Data augmentation is applied | 303 eyes from 250 participants | = 95.7% (detecting referable DR) |
| Ghazal et al. [184], 2020 | Early detection of NPDR using OCT images | AlexNet | SVM was used for classification | 52 subjects | = 94% |
| Narayanan et al. [170], 2020 | detect and grade the fundus images | AlexNet, VGG16, ResNet, Inception-v3, NASNet, DenseNet, GoogleNet | Transfer Learning is applied for each network | 3661 images | = 98.4% (detection) = 96.3% (grading) |
| Shankar et al. [171], 2020 | DR grading using fundus images | Synergic deep learning | Histogram-based segmentation was applied to extract the details of the fundus image | 1200 images (MESSIDOR dataset) | ACC = 99.28%, Sen = 98%, Spef = 99% |
| Ryu et al. [186], 2021 | Early detection of DR using OCTA | ResNet101 | OCTA images are the inputs to the CNN | 496 eyes | ACC = 91–98% Sen = 86–97%, Spef = 94–99%, AUC = 0.919–0.976. |
| He et al. [172], 2021 | Grading DR using fundus images | CABNet with DenseNet-121 as a backbone network | CABNet is an attention module with global attention block | 1200 images (MESSIDOR), 88,702 (EyePACS) | = 93.1% = 0.969 = 92.9% |
| Saeed et al. [173], 2021 | Grading DR using fundus images | Two pretrained CNNs | Transfer Learning is applied | 1200 images (MESSIDOR), 88,702 (EyePACS) | = 99.73% = 89% (EyePACS) |
| Wang et al. [174], 2021 | Grading DR using fundus images | Inception-v3 + lesionNet | Transfer Learning is applied | 12,252 images + 565 (external test set) | = 94.3% = 90.6% = 80.7% |
| Hsieh et al. [175] | Grading DR using fundus images | VeriSee™ software | Modified Inception-v4 model as backbone network | 7524 images | = 92.2% = 89.5% = 0.955 (detecting DR) |
| Khan et al. [176] | Grading DR using fundus images | VGG-NiN model | VGG16, spatial pyramid pooling layer and network-in-network are stacked to form VGG-NiN model | 25,810 images | = 0.838 |
| Gao et al. [180], 2022 | Grading DR using fundus fluorescein angiography images | VGG16, ResNet50, DenseNet | Images are the inputs to the CNNs | 11,214 images from 705 patients | = 94.17% (VGG16) |
| Zia et al. [177], 2022 | Grading DR using fundus images | VGGNet and Inception-v3 | Applied a feature fusion and selection steps | 35,126 Kaggle dataset | = 96.4% |
| Das et al. [178], 2022 | Detecting and classifying DR using fundus images | A CNN is used with several layers that is optimized using a genetic algorithm | SVM was used for classification | 1200 images (Messidor dataset) | = 98.67% = 0.9933 |
| Tsai et al. [179], 2022 | Grading DR using fundus images | Inception-v3, ResNet101, and DenseNet121 | Transfer Learning is applied | 88,702 images (EyePACS) 4038 images | = 84.64% (Kaggle) = 83.80 (Taiwanese dataset) |
| Study | Goal | Features | Classifier | Database Size | Performance |
|---|---|---|---|---|---|
| Liu et al. [191], 2011 | Identify normal and three retinal diseases using OCT images: AMD, macular hole, and macular edema | Spatial and shape features | SVM | Train: 326 scans from 136 subject (193 eyes) Test:131 scans from 37 subjects (58 eyes) | = 0.975; to identify AMD from normal subjects |
| Srinivasan et al. [192], 2014 | Identify normal and two retinal diseases using SD-OCT: dry AMD and diabetic macular edema (DME) | Multiscale histograms of oriented gradient descriptors | SVM | 45 subjects: 15 normal, 15 with dry AMD, and 15 with DME | = 100% for identifying cases with AMD |
| Fraccaro et al. [193], 2015 | To diagnose AMD using OCT images | Patient age, gender, and clinical binary attributes | White boxes (e.g., logistic regression & decision tree) and black boxes (e.g., SVM & random forest) | 487 patients (912 eyes): 50 bootstrap test | = 0.92 |
| García-Floriano et al. [190], 2019 | To differentiate normal from AMD with drusen using color fundus images | Invariant momentums extracted from contrast enhanced, morphological processed images | SVM | 70 images: 37 healthy and 33 AMD with drusen | = 92% |
| Study | Goal | CNN | Other Features | Database Size | Performance |
|---|---|---|---|---|---|
| Lee et al. [194], 2017 | To differentiate between normal and AMD cases using OCT | Modified VGG19 | A modified VGG19 DCNN with changing the last fully connected layer with a two-nodes layer | 80,839 images for training and 20,163 images for test | AUC = 92.77%, ACC = 87.6%, Sen = 84.6% Spef = 91.5% |
| Ting et al. [134], 2017 | Identify three retinal diseases: DR, glaucoma, AMD using color fundus images | Adapted VGGNet model | An ensemble of two networks is used for the classification of each eye disease | Validation dataset of 71,896 images; from 14,880 patients | = 93.2% = 88.7 |
| Burlina et al. [195], 2017 | Identify no or early AMD from intermediate or advanced AMD using fundus images | AlexNet | Solving two-class problem | 130,000 images from 4613 patients | = 88.4% to 91.6% = 0.94 to 0.96 |
| Treder et al. [201], 2018 | Detect exudative AMD from normal subjects using SD-OCT | Inception-v3 | Transfer learning | 1012 SD-OCT scans | = 96% = 100% = 92% |
| Tan et al. [199], 2018 | Early detect AMD using fundus images | 14-layer CNN model | Data augmentation | 402 normal, 583 early, intermediate AMD, or GA, and 125 wet AMD eyes | = 95% = 96% = 94% 10-fold cross-validation |
| Hassan et al. [196], 2018 | Diagnosis of three retinal diseases (i.e., macular edema, central serous choriorentopathy, and AMD) using OCT | SegNet followed by an AlexNet | Segmenting nine retinal layers | 41,921 retinal OCT scans for testing and 4992 for training | = 96% |
| An et al. [202], 2019 | Two classifiers: AMD vs. normal and AMD with fluid vs. AMD without fluid | Two VGG16 models | A model to distinguish AMD from normal followed by a model to distinguish AMD with from AMD without fluid | 1234 training data and 391 test data | = 99.2% = 0.999 to identify AMD from normal. = 95.1% = 0.992 to distinguish AMD with from AMD without fluid |
| Motozawa et al. [197], 2019 | Two classifiers: AMD vs. normal and AMD with exudative changes vs. AMD without exudative changes using SD-OCT images | Two 18-layer CNN | A model to distinguish AMD from normal followed by a model to distinguish AMD with from AMD without exudative changes | 1621 images | = 99% = 100% = 91.8% to identify AMD from normal. = 93.9% = 98.4% = 88.3% to identify AMD with from AMD without exudative changes |
| Hwang et al. [200], 2019 | Distinguish between normal, Dry (drusen), active wet, and inactive wet AMD | ResNet50, Inception-v3, and VGG16 | A cloud computing website [196] wasss developed based on their algorithm | 35,900 images | = 91.40% (VGG16), 92.67% (Inception-v3), and 90.73% (ResNet50) |
| Li et al. [198], 2019 | Distinguish between normal, AMD, and diabetic macular edema using OCT images | VGG-16 | Transfer learning | 207,130 images | ACC = 98.6%, Sen = 97.8%, Spef = 99.4% AUC = 100% |
Publisher’s Note: MDPI stays neutral with regard to jurisdictional claims in published maps and institutional affiliations. |
© 2022 by the authors. Licensee MDPI, Basel, Switzerland. This article is an open access article distributed under the terms and conditions of the Creative Commons Attribution (CC BY) license (https://creativecommons.org/licenses/by/4.0/).
Share and Cite
Saleh, G.A.; Batouty, N.M.; Haggag, S.; Elnakib, A.; Khalifa, F.; Taher, F.; Mohamed, M.A.; Farag, R.; Sandhu, H.; Sewelam, A.; et al. The Role of Medical Image Modalities and AI in the Early Detection, Diagnosis and Grading of Retinal Diseases: A Survey. Bioengineering 2022, 9, 366. https://doi.org/10.3390/bioengineering9080366
Saleh GA, Batouty NM, Haggag S, Elnakib A, Khalifa F, Taher F, Mohamed MA, Farag R, Sandhu H, Sewelam A, et al. The Role of Medical Image Modalities and AI in the Early Detection, Diagnosis and Grading of Retinal Diseases: A Survey. Bioengineering. 2022; 9(8):366. https://doi.org/10.3390/bioengineering9080366
Chicago/Turabian StyleSaleh, Gehad A., Nihal M. Batouty, Sayed Haggag, Ahmed Elnakib, Fahmi Khalifa, Fatma Taher, Mohamed Abdelazim Mohamed, Rania Farag, Harpal Sandhu, Ashraf Sewelam, and et al. 2022. "The Role of Medical Image Modalities and AI in the Early Detection, Diagnosis and Grading of Retinal Diseases: A Survey" Bioengineering 9, no. 8: 366. https://doi.org/10.3390/bioengineering9080366