Article

Response Surface Optimization of Biophotocatalytic Degradation of Industrial Wastewater for Bioenergy Recovery

by
Emmanuel Kweinor Tetteh
* and
Sudesh Rathilal
Green Engineering and Sustainability Research Group, Department of Chemical Engineering, Faculty of Engineering and The Built Environment, Durban University of Technology, Durban 4001, South Africa
*
Author to whom correspondence should be addressed.
Bioengineering 2022, 9(3), 95; https://doi.org/10.3390/bioengineering9030095
Submission received: 5 January 2022 / Revised: 23 January 2022 / Accepted: 24 January 2022 / Published: 26 February 2022
(This article belongs to the Special Issue Bioengineering in Remediation of Polluted Environments)

Abstract

:
The continuous combustion of fossil fuels and industrial wastewater pollution undermines global environmental and socio-economic sustainability. Addressing this necessitates a techno-scientific revolution to recover the renewable energy potential of wastewater towards a circular economy. Herein, a developed biophotocatalytic (BP) system was examined with an engineered Fe-TiO2 to ascertain its degradability efficiency and biogas production from industrial wastewater. The response surface methodology (RSM) based on a modified Box-Behnken designed experiment was used to optimize and maximize the BP system’s desirability. The parameters investigated included catalyst dosage of 2–6 g and hydraulic retention time (HRT) of 1–31 d at a constant temperature of 37.5 °C and organic loading rate of 2.38 kgCOD/Ld. The modified RSM-BBD predicted 100% desirability at an optimal catalyst load of 4 g and HRT of 21 d. This represented 267 mL/d of biogas and >98% COD, color, and turbidity removal. The experimental validity was in good agreement with the model predicted results at a high regression (R2 > 0.98) and 95% confidence level. This finding provides an insight into RSM modeling and optimization with the potential of integrating the BP system into wastewater settings for the treatment of industrial wastewater and biogas production.

1. Introduction

Wastewater treatment concurrently with biogas production via the anaerobic digestion (AD) process has been a universally adaptable technology [1]. However, environmental pollution, water scarcity, food, and energy insecurity have become pressing matters for sustainable development in the twenty-first century [2,3]. Also, greenhouse gas emissions (especially CO2) being associated with global warming, and fossil fuel combustion, undermine a sustainable environment [4]. Herein, wastewater treatment is envisioned as a renewable energy source that can be used for biogas production as alternative sources of energy [3,5]. Thus, reclaiming wastewater for reuse and biogas production (biogas can be purified and used as an automotive fuel) can ease poor country’s standard of living as far as water and energy are concerned [2].
Notwithstanding, treating industrial effluent has become extremely relevant as emerging contaminants (pharmaceuticals, pesticides, nanomaterials, etc.) and toxic chemicals originating from households and industries are posing great threats to human health and the ecosystem when discharged into the environment without proper treatment [6,7]. So, mitigating environmental pollution and its consequences warrant degradation of the high organic constituents of industrial effluents.
Conventionally, treatment of water and wastewater involves the use of physical, chemical, and biological methods [7,8]. The biological treatment involves bacterial and fungal biosorption, anoxic and anaerobic/aerobic processes [2,7]. Membrane filtration, coagulation-flocculation, flotation, precipitation, ion exchange, adsorption, ultrasonic mineralization, ion-pair extraction, and electrolysis [6,9,10] are some of the physico-chemical treatments. Moreover, these technologies generate by-products during treatment that come with additional treatment costs [9,10]. Thus, it becomes very critical to design and select cost-effective technologies as an option in the water and wastewater treatment settings.
Currently, advanced oxidation processes (AOPs) are being developed to degrade nonbiodegradable contaminants [11]. Heterogeneous photocatalysis is a unique AOP that uses photocatalysts like TiO2 and UV light to break down pollutants into inoffensive end products like CO2, H2, and mineral acids [11,12]. The availability, low cost, and photochemical stability of TiO2 makes it a preferred photocatalytic degradation catalyst for organic contaminants [12]. To stimulate oxidation-reduction potential, photocatalytic reactions use photons with energy larger than the bandgap of a semiconductor, usually TiO2 [13]. Several researchers have investigated the photocatalytic treatment of hazardous substances in untreated wastewater [7,14,15,16]. Baseline pollutant concentration, photocatalyst concentration, and pH are among the key parameters that can influence photocatalytic activity [13]. Other parameters including irradiation time, light intensity, light wavelength, catalyst type and temperature can also affect the degradation routes [17]. Similarly, AD processes are influenced by several factors which includes carbon/nitrogen (C/N) ratio, temperature (mesophilic and thermophilic), organic loading rate (OLR), hydraulic retention time (HRT), and pH [1]. This makes it difficult to assess the relative importance of more than a few influencing variables, especially when they have a multifunctional effect on the outputs.
To assess the influence of operating parameters on photocatalytic process efficiency, current research has relied on a conventional one-factor-at-time (OFAT) experimental technique [18,19]. While OFAT techniques are labor-intensive, they do not depict multiple variable interaction effects. Conversely, fewer runs are needed when using response surface methodology (RSM) [20]. Box Behnken (BB), Central Composite Design (CCD), Central Composite Face centered (CCF), and full factorial are some of the most frequent design matrices used in the RSM technique. [18,19]. Environmental remediation studies have shown the great potential of using BBD and CCF for experimental design and optimization [17,18,19,20]. This is due to their ability to obtain more information from just a few numbers of their experimental matrix. Generally, using RSM in process optimization involves the following steps: (a) identification of response/s; (b) screening of multivariates according to the design of experiment; (c) building of an empirical response surface model; (d) and the application of various response optimizations through mathematical modeling [17,20].
In essence, AD (kinetically slow) and AOP (energy-intensive) processes are very complex, with limited knowledge of their integrated system (AD-AOP) [21]. Therefore, developing the biophotocatalytic (BP) system as an alternative technology to the AD process comes in handy. Herein, the CO2 methanation mechanism was carried out by incorporating Fe-TiO2 into the BP system and was optimized via RSM to maximize its efficacy. 
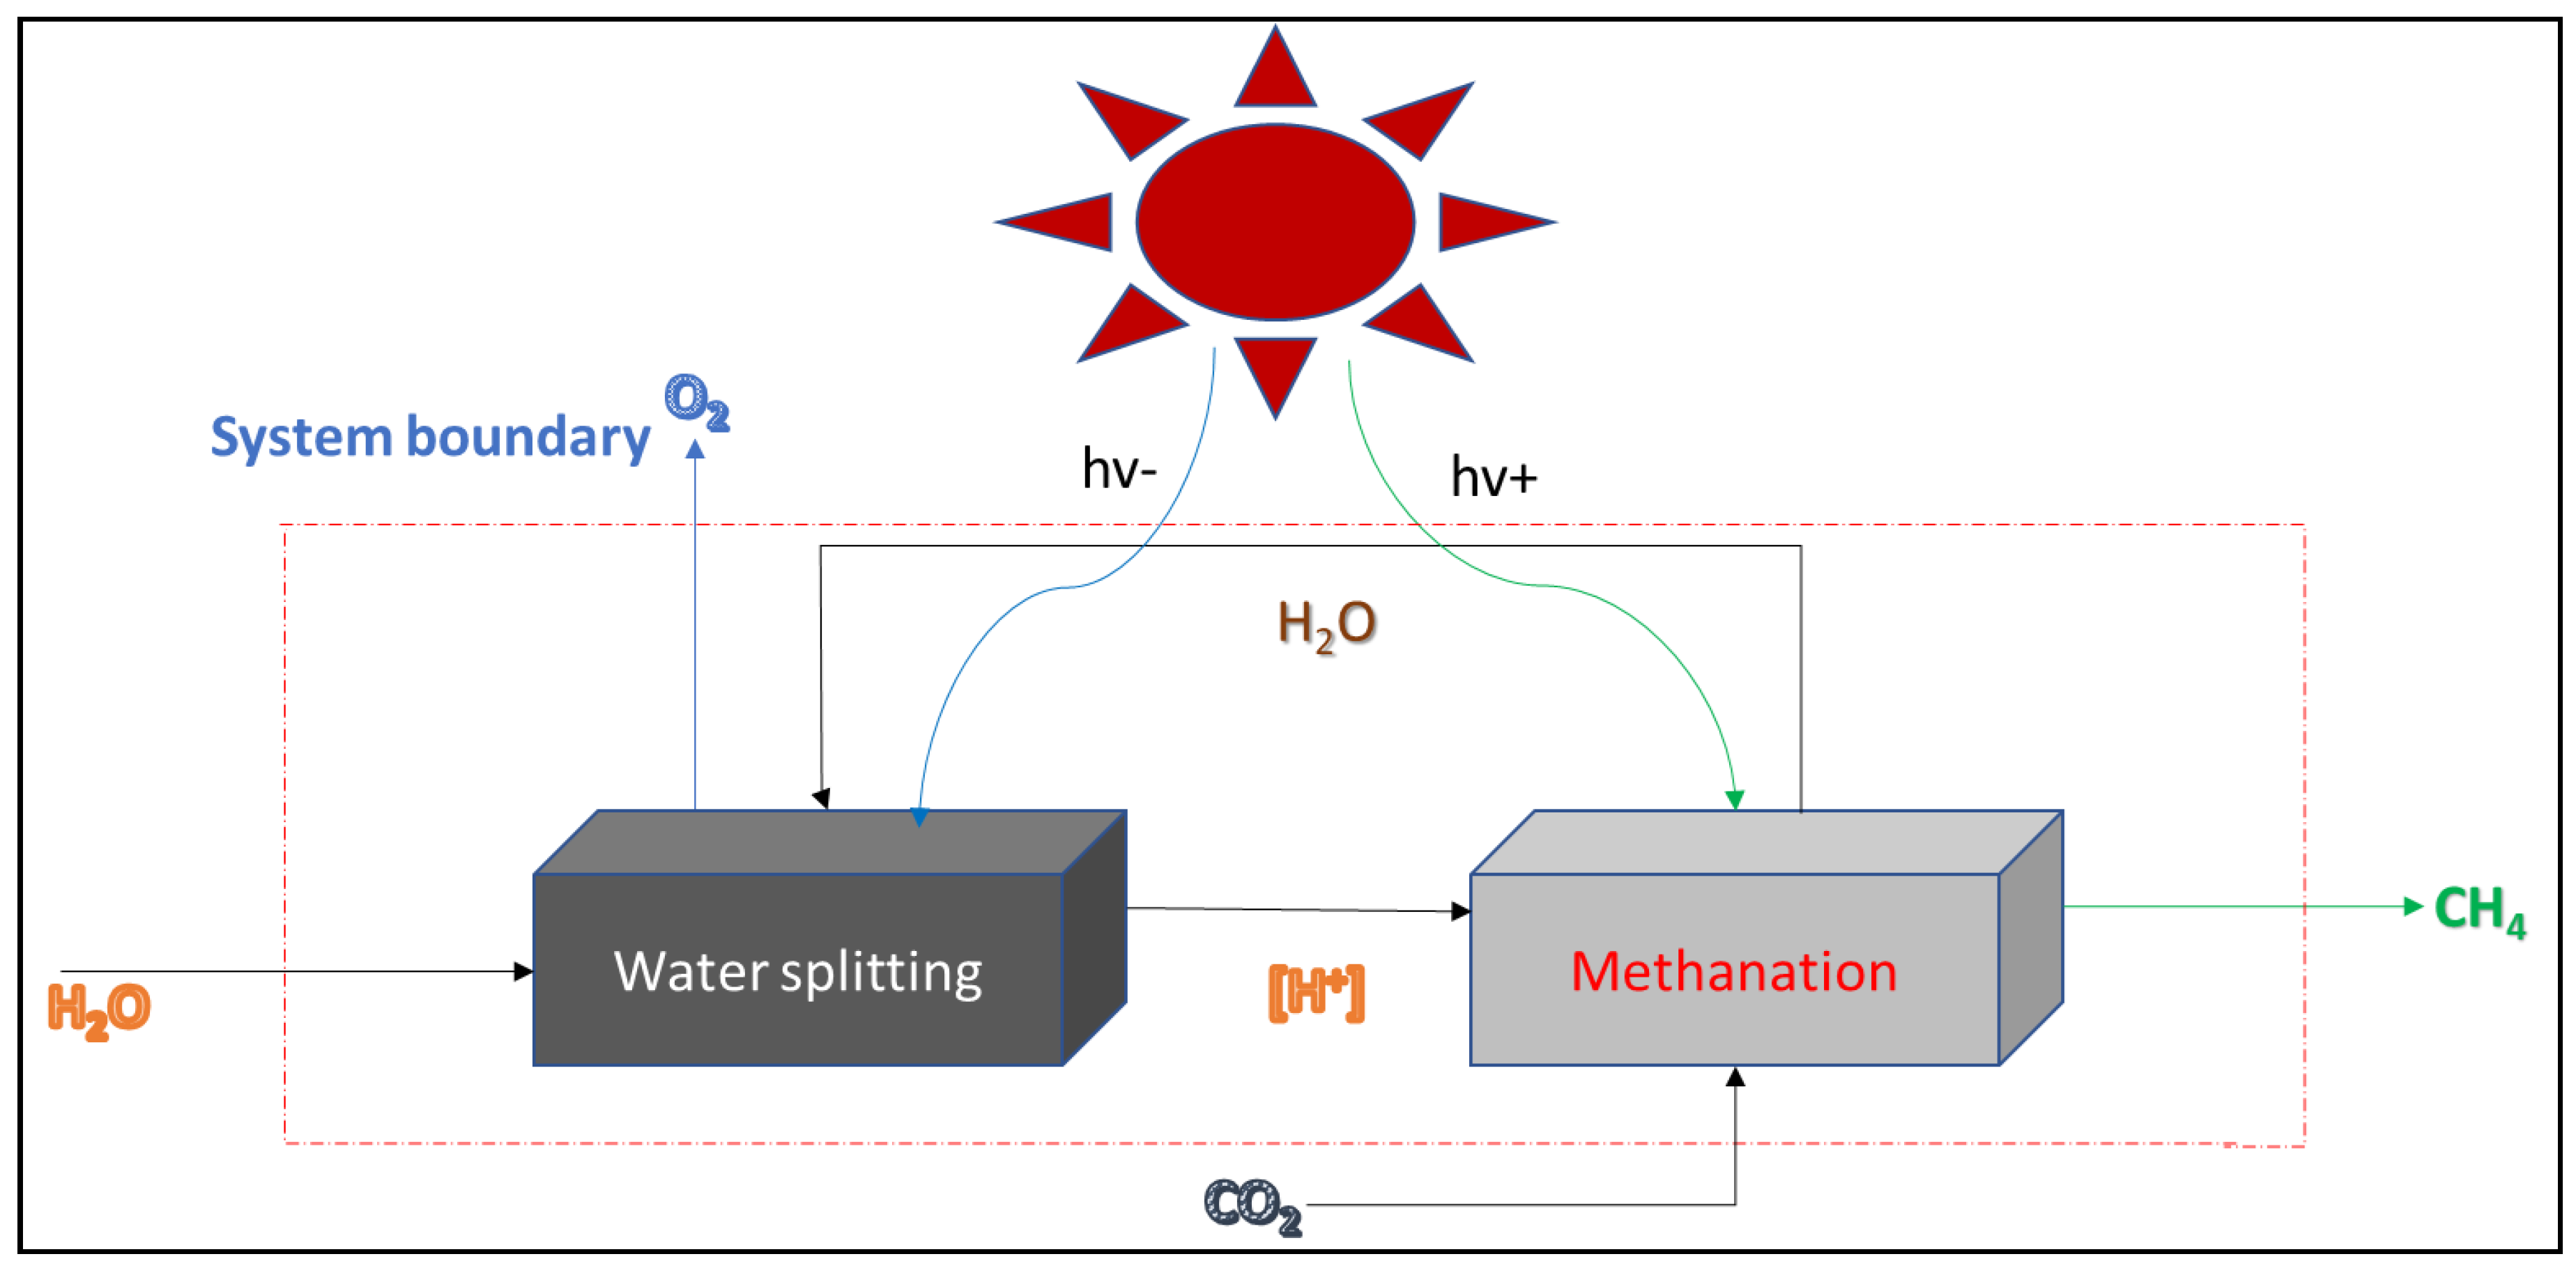
Figure 1 presents the light-driven methanation reaction scheme with the dynamic state of water-splitting and CO2 reduction steps. Ideally, the reactant and its intermediate products emulate natural photosynthesis [22]. Similarly, the presence of the photocatalysts being energy-driven for the initial excitation of its electrons via light absorption also promotes hydro generation potential [21]. However, improper catalyst loading and operating conditions can limit microbial activity and biogas production, yielding poor methane quality. Furthermore, the development of the BP system is still underway, which warrants process modeling, optimization, and control to maximize the process efficiency, as well as support the lab-scale design of a pilot plant. Herein, this study employed experimental data obtained from a modified RSM- BBD matrix with input factors at three levels (−1, 0, +1) with two center points at a constant temperature of 37.5 °C and an organic loading rate of 2.38 kgCOD/Ld. This was aimed at investigating the relationship between the input variable (catalyst dosage and HRT) and the design outputs (biogas, COD, color, and turbidity) via the modified RSM-BBD. Additionally, the analysis of variance (ANOVA) was employed statistically to ascertain the significance of the response models, whereas numerical optimization was used to optimize and maximize the system desirability for degradation of the organics (COD) for the biogas production.

2. Materials and Methods

2.1. Wastewater and Activated Sludge

The raw wastewater and sludge (anaerobic digested) were obtained from the eThekwini municipal wastewater treatment plant in the KwaZulu-Natal province, South Africa by observing the standard protocols for wastewater sample collection and characterization [23]. Table 1 presents the wastewater characteristics distribution from the biofiltration stream of the wastewater treatment plant.

2.2. Magnetised Photocatalyst (Fe-TiO2)

A laboratory-based magnetite-titania photocatalyst (Fe-TiO2) synthesized via the co-precipitation technique was employed [24], which had a specified BET surface area of 62.73 m2/g, pore volume of 0.017 cm3/g, and 1.337 nm particle size. This was analyzed with Brunauer–Emmett–Teller theory technique equipment (Micromeritics, TriStar II Plus, Norcross, GA, USA).

2.3. Experimental Procedure

The BP system constituted an upflow anaerobic sludge blanket (UASB) reactor coupled with UV-light bulbs (T8 blacklight—blue tube, 365 nm, 18 W, Philips, The Netherlands) as depicted in Figure 2. The BP was operated in batch mode at a working volume of 8 L with a headspace of 2 L at a temperature of 37.5 °C. The effects of catalyst load and hydraulic retention time (HRT) on bio-photodegradation of the wastewater with response biogas production and water quality (COD, color, and turbidity) improvement were studied. The daily monitoring of the biogas produced was obtained via the downward displacement technique as shown in Figure 2, by reading the level of the water displaced by the measuring cylinder. The removal percentage (%R) was evaluated using Equation (1).
R e a c t o r   e f f i c i e n c y   ( % R ) = ( C i C f C i ) × 100
where, C i = Substrate influent and C f = Substrate effluent.

2.4. Experimental Design and Modelling

The Design Expert software (version13.0.7) was employed for experimental design, analysis of variance (ANOVA), regression analysis (R2), and optimization of the process variables of the BP system. The response surface interaction between the catalyst dosage and HRT was investigated using a modified RSM-BBD method. Table 2 depicts the input variable levels considered based on the result of our previous work and other reported literature [17,18,19]. To avoid systematic mistakes, the experiment was carried out randomly with three levels, four duplicates, and one center point [25]. The response data (biogas, COD, color, and turbidity) obtained were used to develop a mathematical model that best correlates the input variables in the form of a quadratic equation (2). The model’s acceptance was also determined by the regression coefficient (R2) and ANOVA p-value.
Y = β 0 + i = 1 n β i X i + i = 1 n β i i X i i 2 + i < j n β i j   X i X j + ε
where the linear parameters Y, β 0 , β i , X i and ε represents the response, constant term, coefficient, factor, and the residual from the treatment, respectively. In addition, the quadratic terms X i and X j represents the factors, β i i and β i j represents the coefficients of the quadratic and the interaction parameters, respectively.

3. Results and Discussion

In principle, photoexcited catalysts can reduce CO2 to CH4 or split water molecules (H+; O2−) via light-induced redox reactions [22,26]. As a result (Figure 1), the H2 produced during the exergonic metabolism is subsequently utilized by the methanogens to enhance the CO2 reduction reaction into methane [1,5,27,28]. Results of the characterized municipality wastewater showed a high organic load (2380 ± 14 mgCOD/L) with a VS/TS ratio of 0.75 (Table 1). The VS/TS ratio > 0.5 proves the wastewater used was biodegradable [11,22]. 
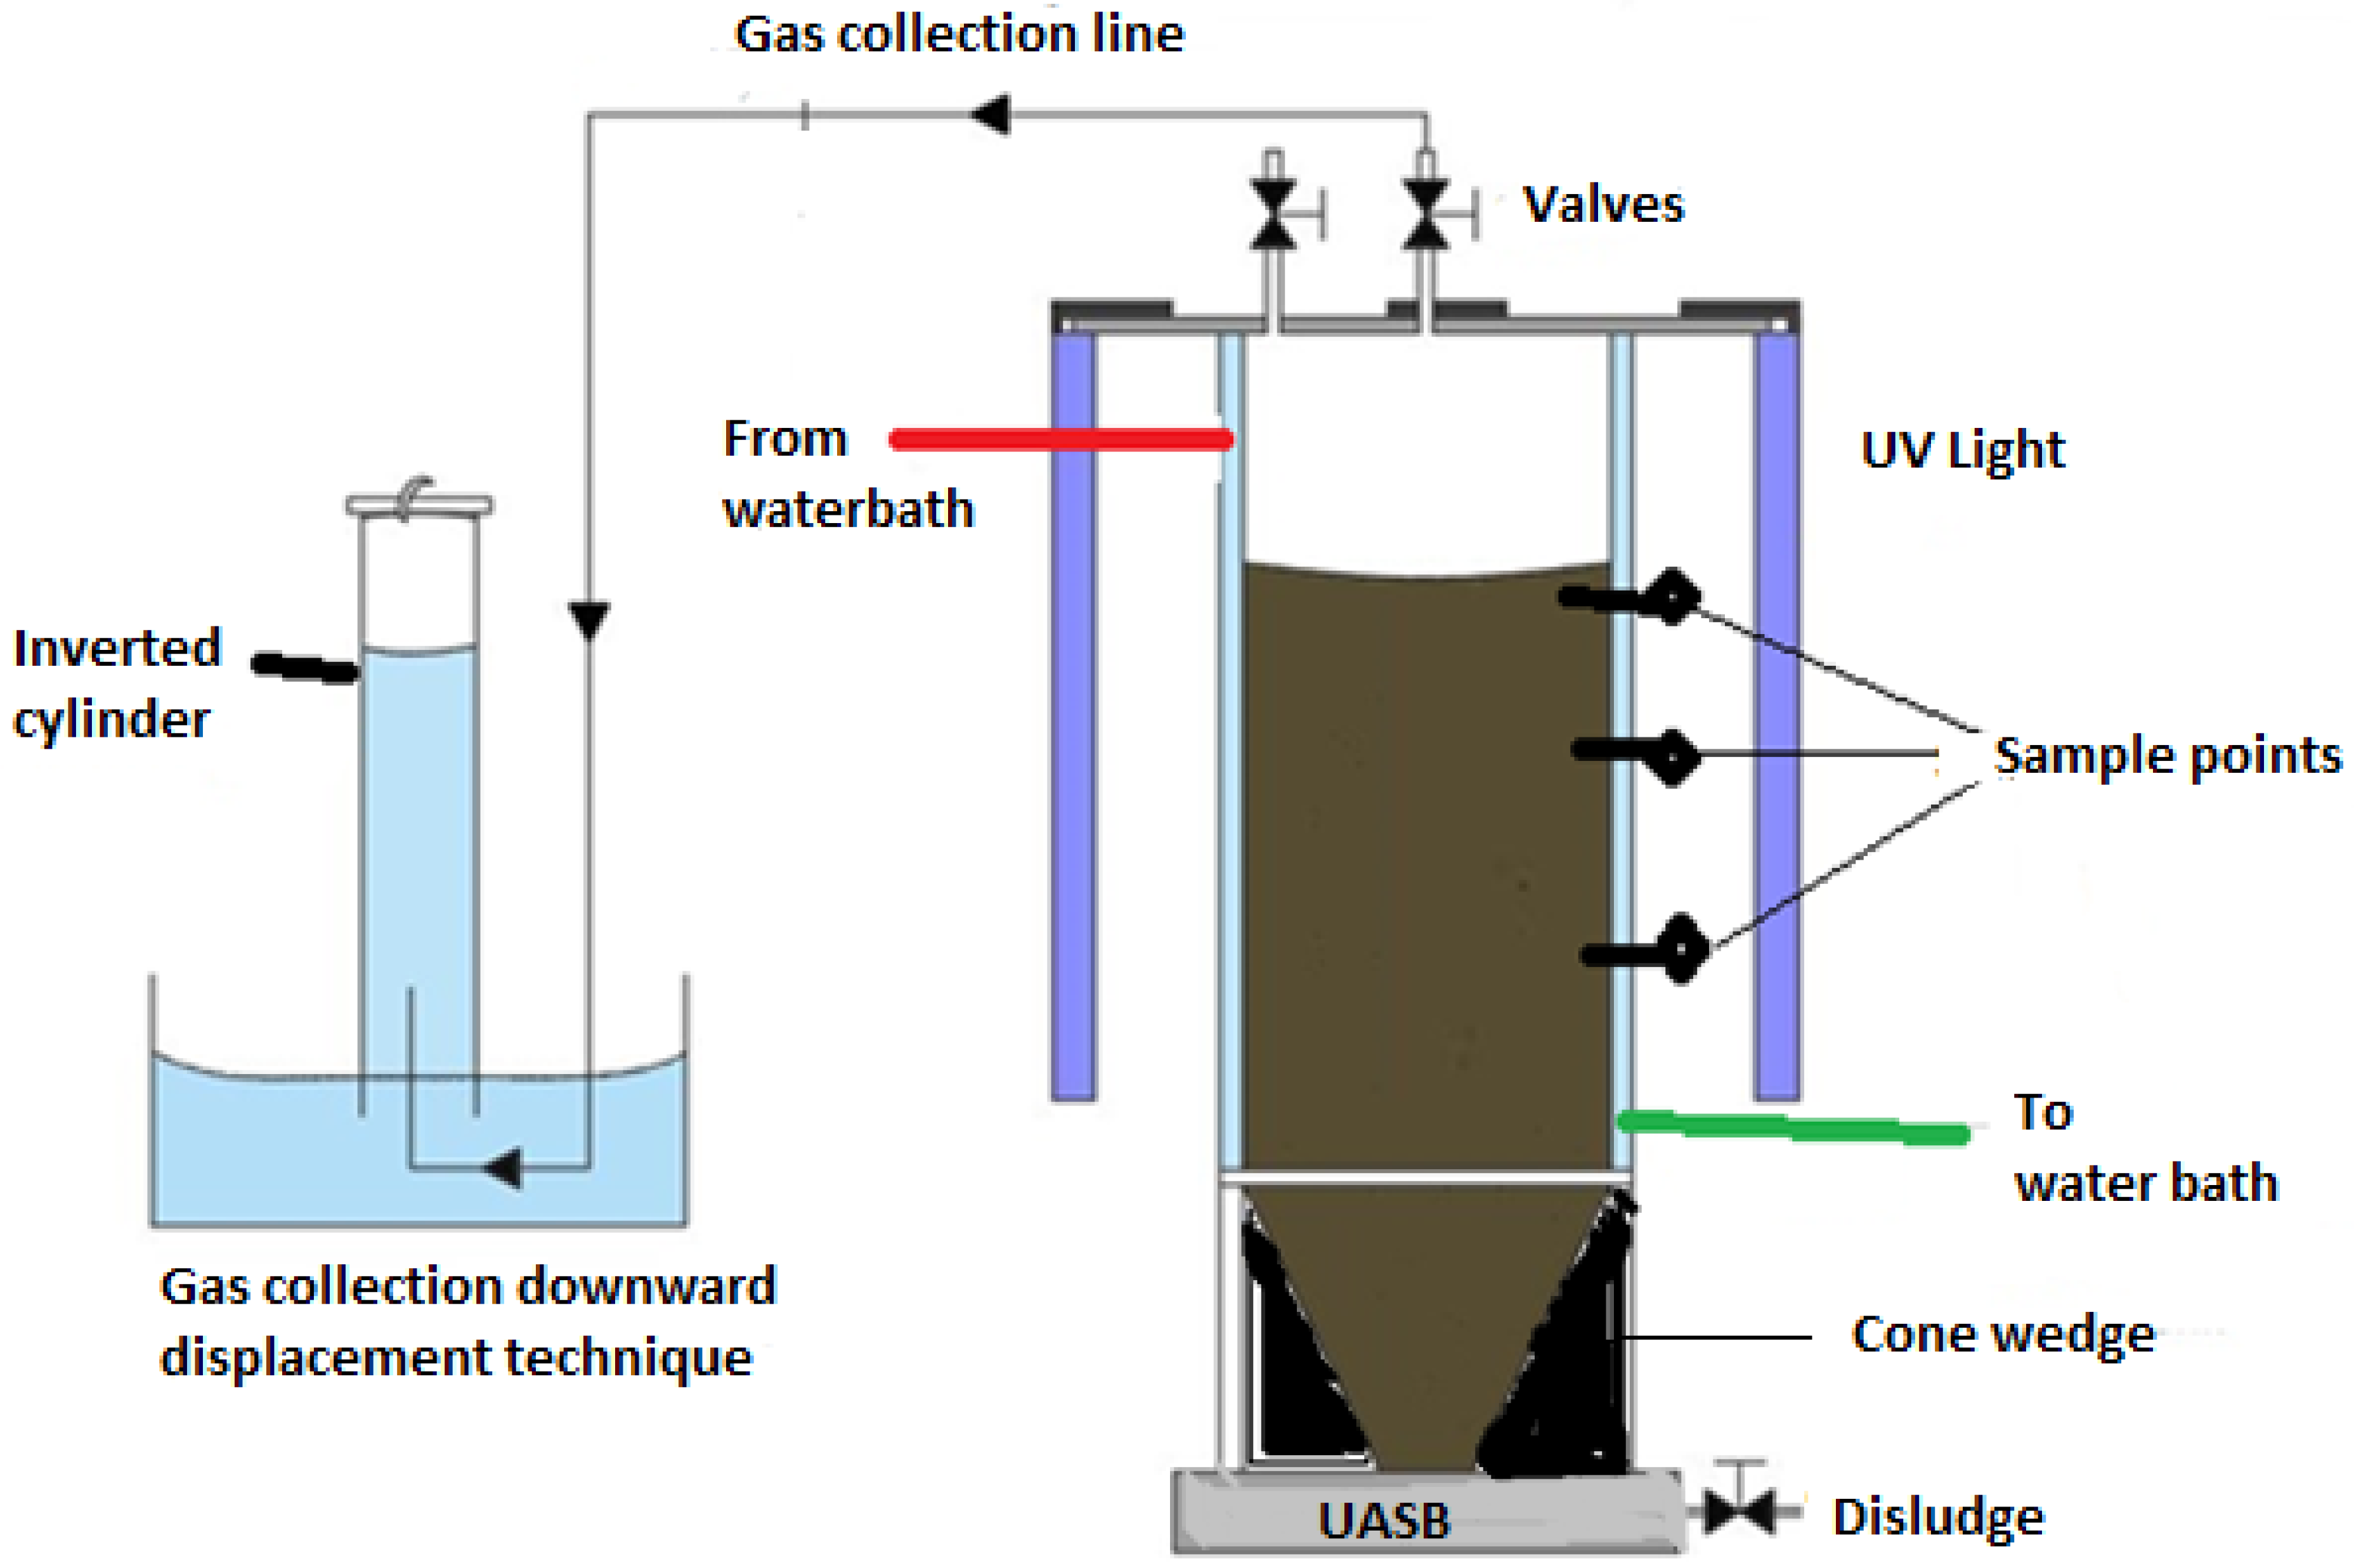
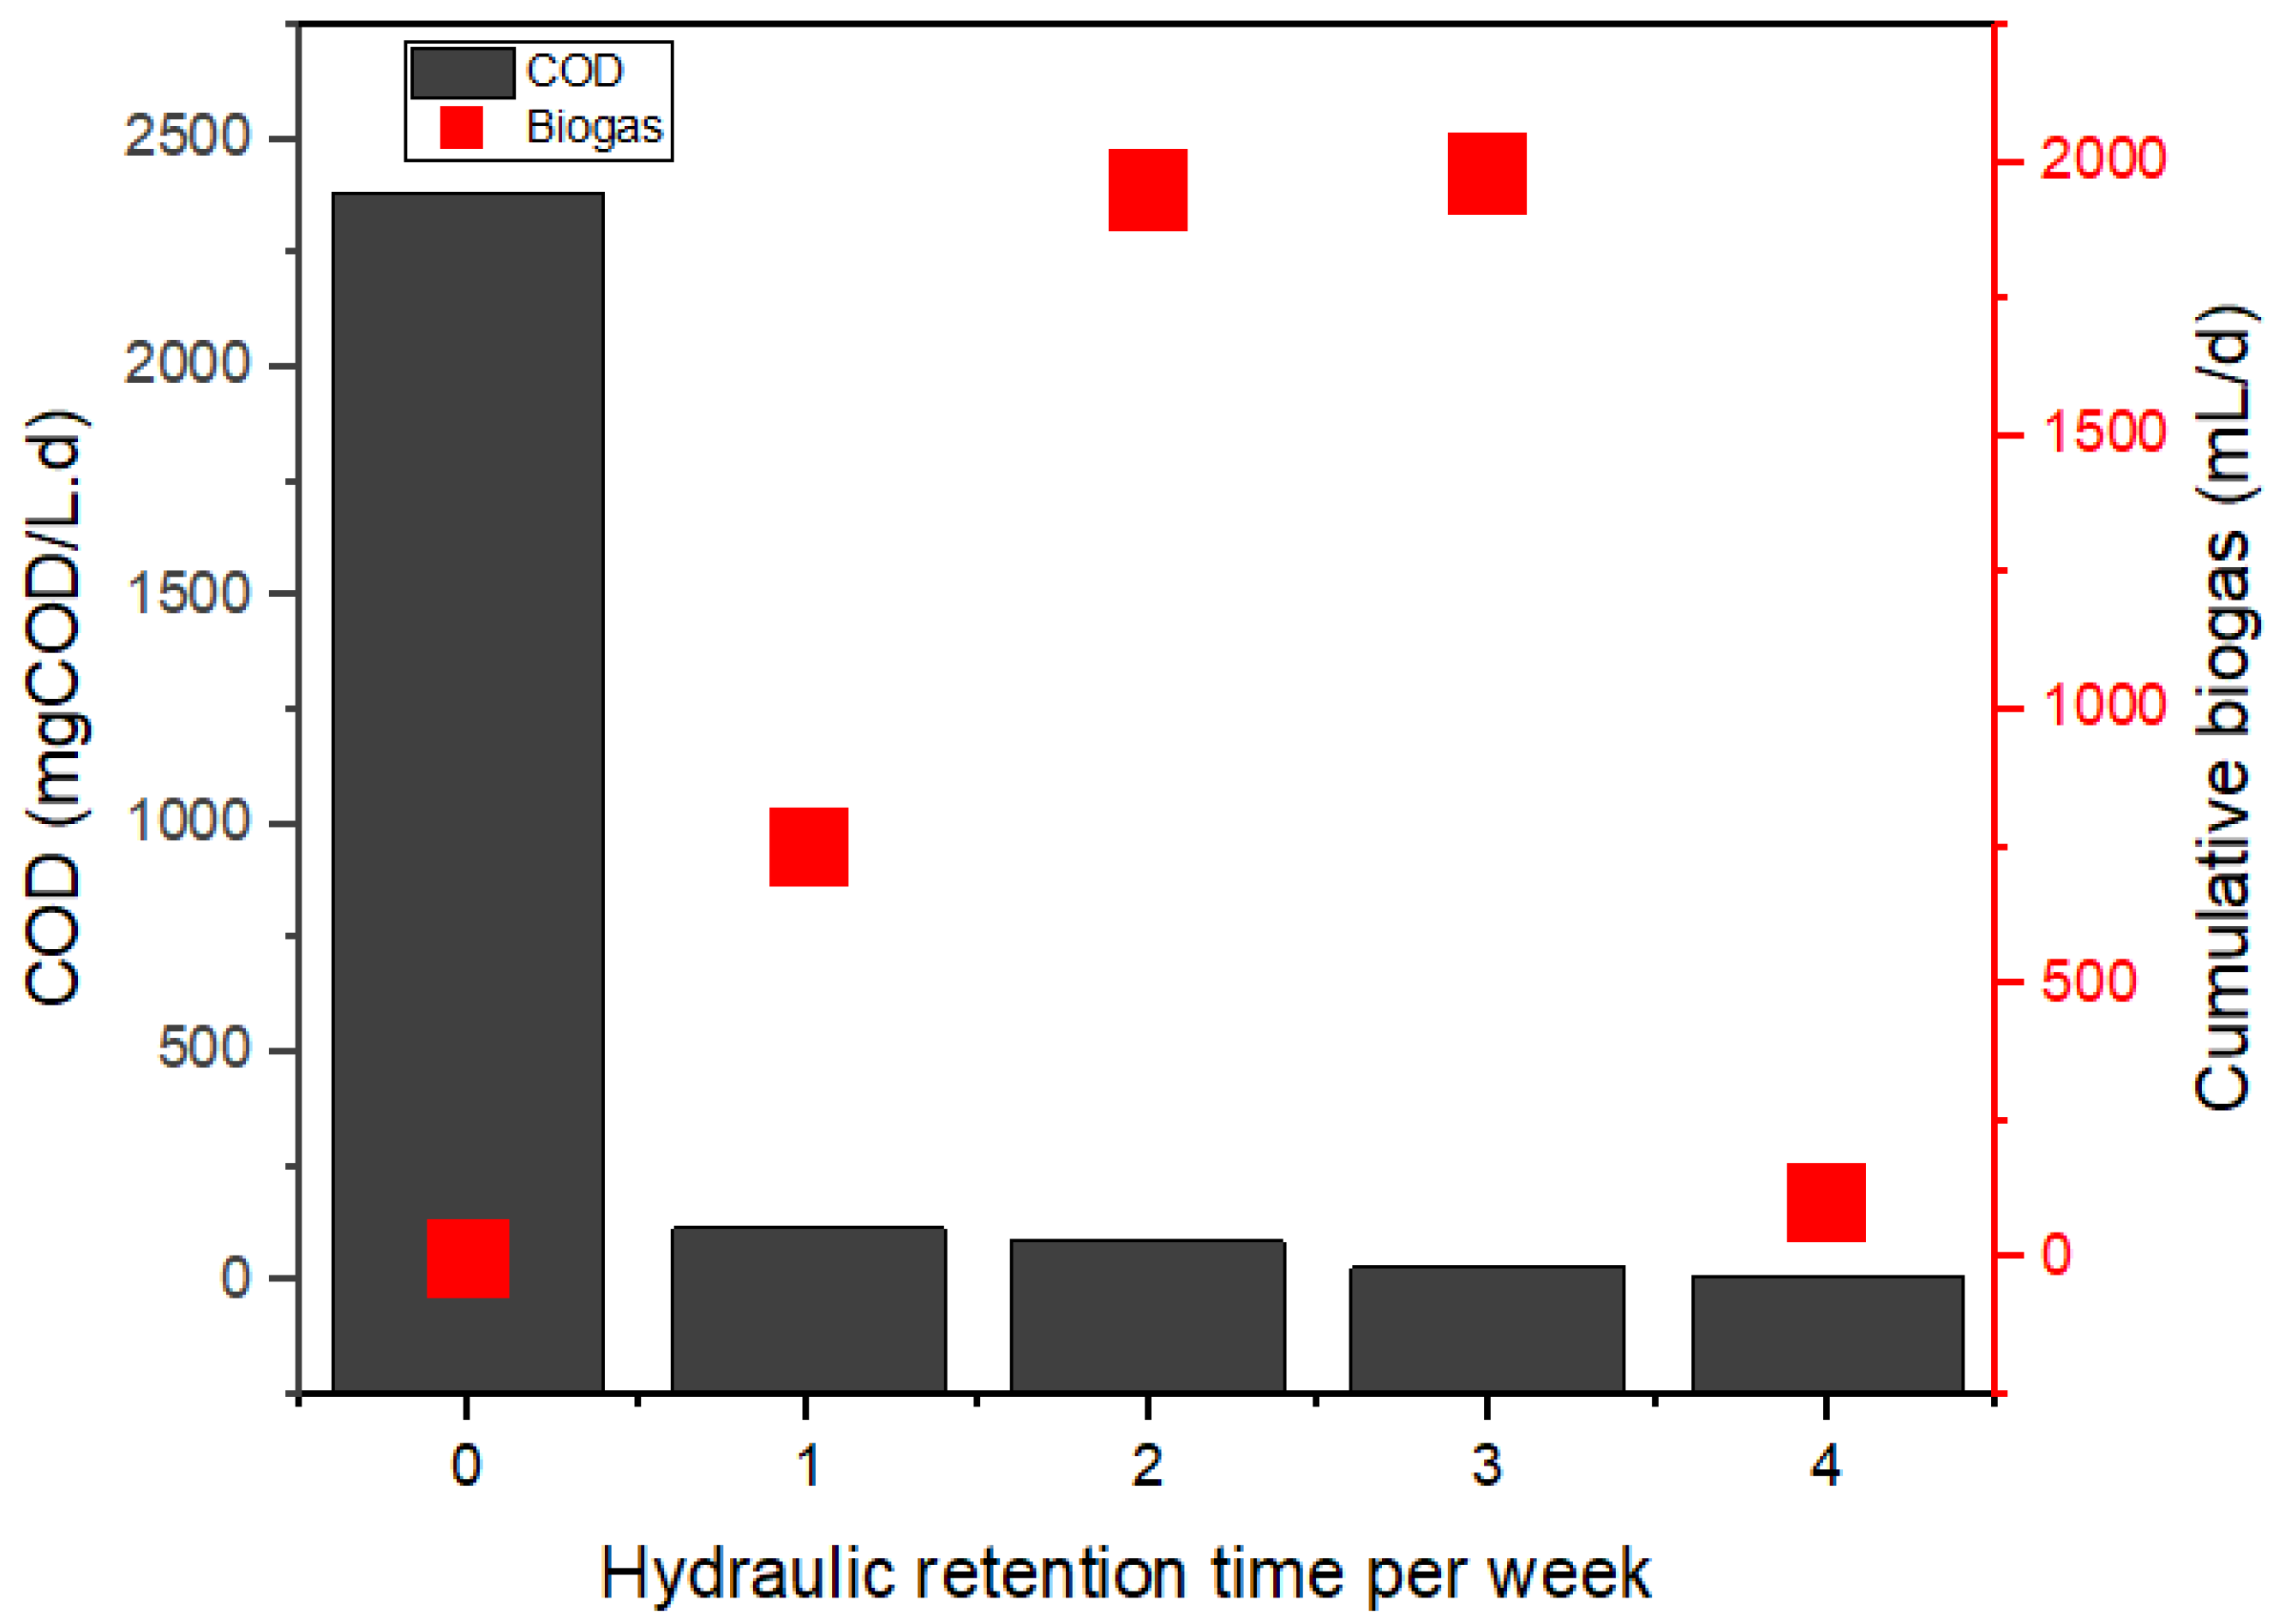
Figure 3 shows the weekly monitoring of the BP system operated under anaerobic conditions, whereby the degraded organic content (2380 > 115 > 87 > 30 > 12 mgCOD/L) increased biogas production. The cumulative biogas recorded for week 1 to week 4, were 750, 1950, 1980, and 100 mL/d, respectively as depicted in Figure 3. Also, the activated photons of the Fe-TiO2 catalyzed the microbes to enhance the degradability of the wastewater organic content. 
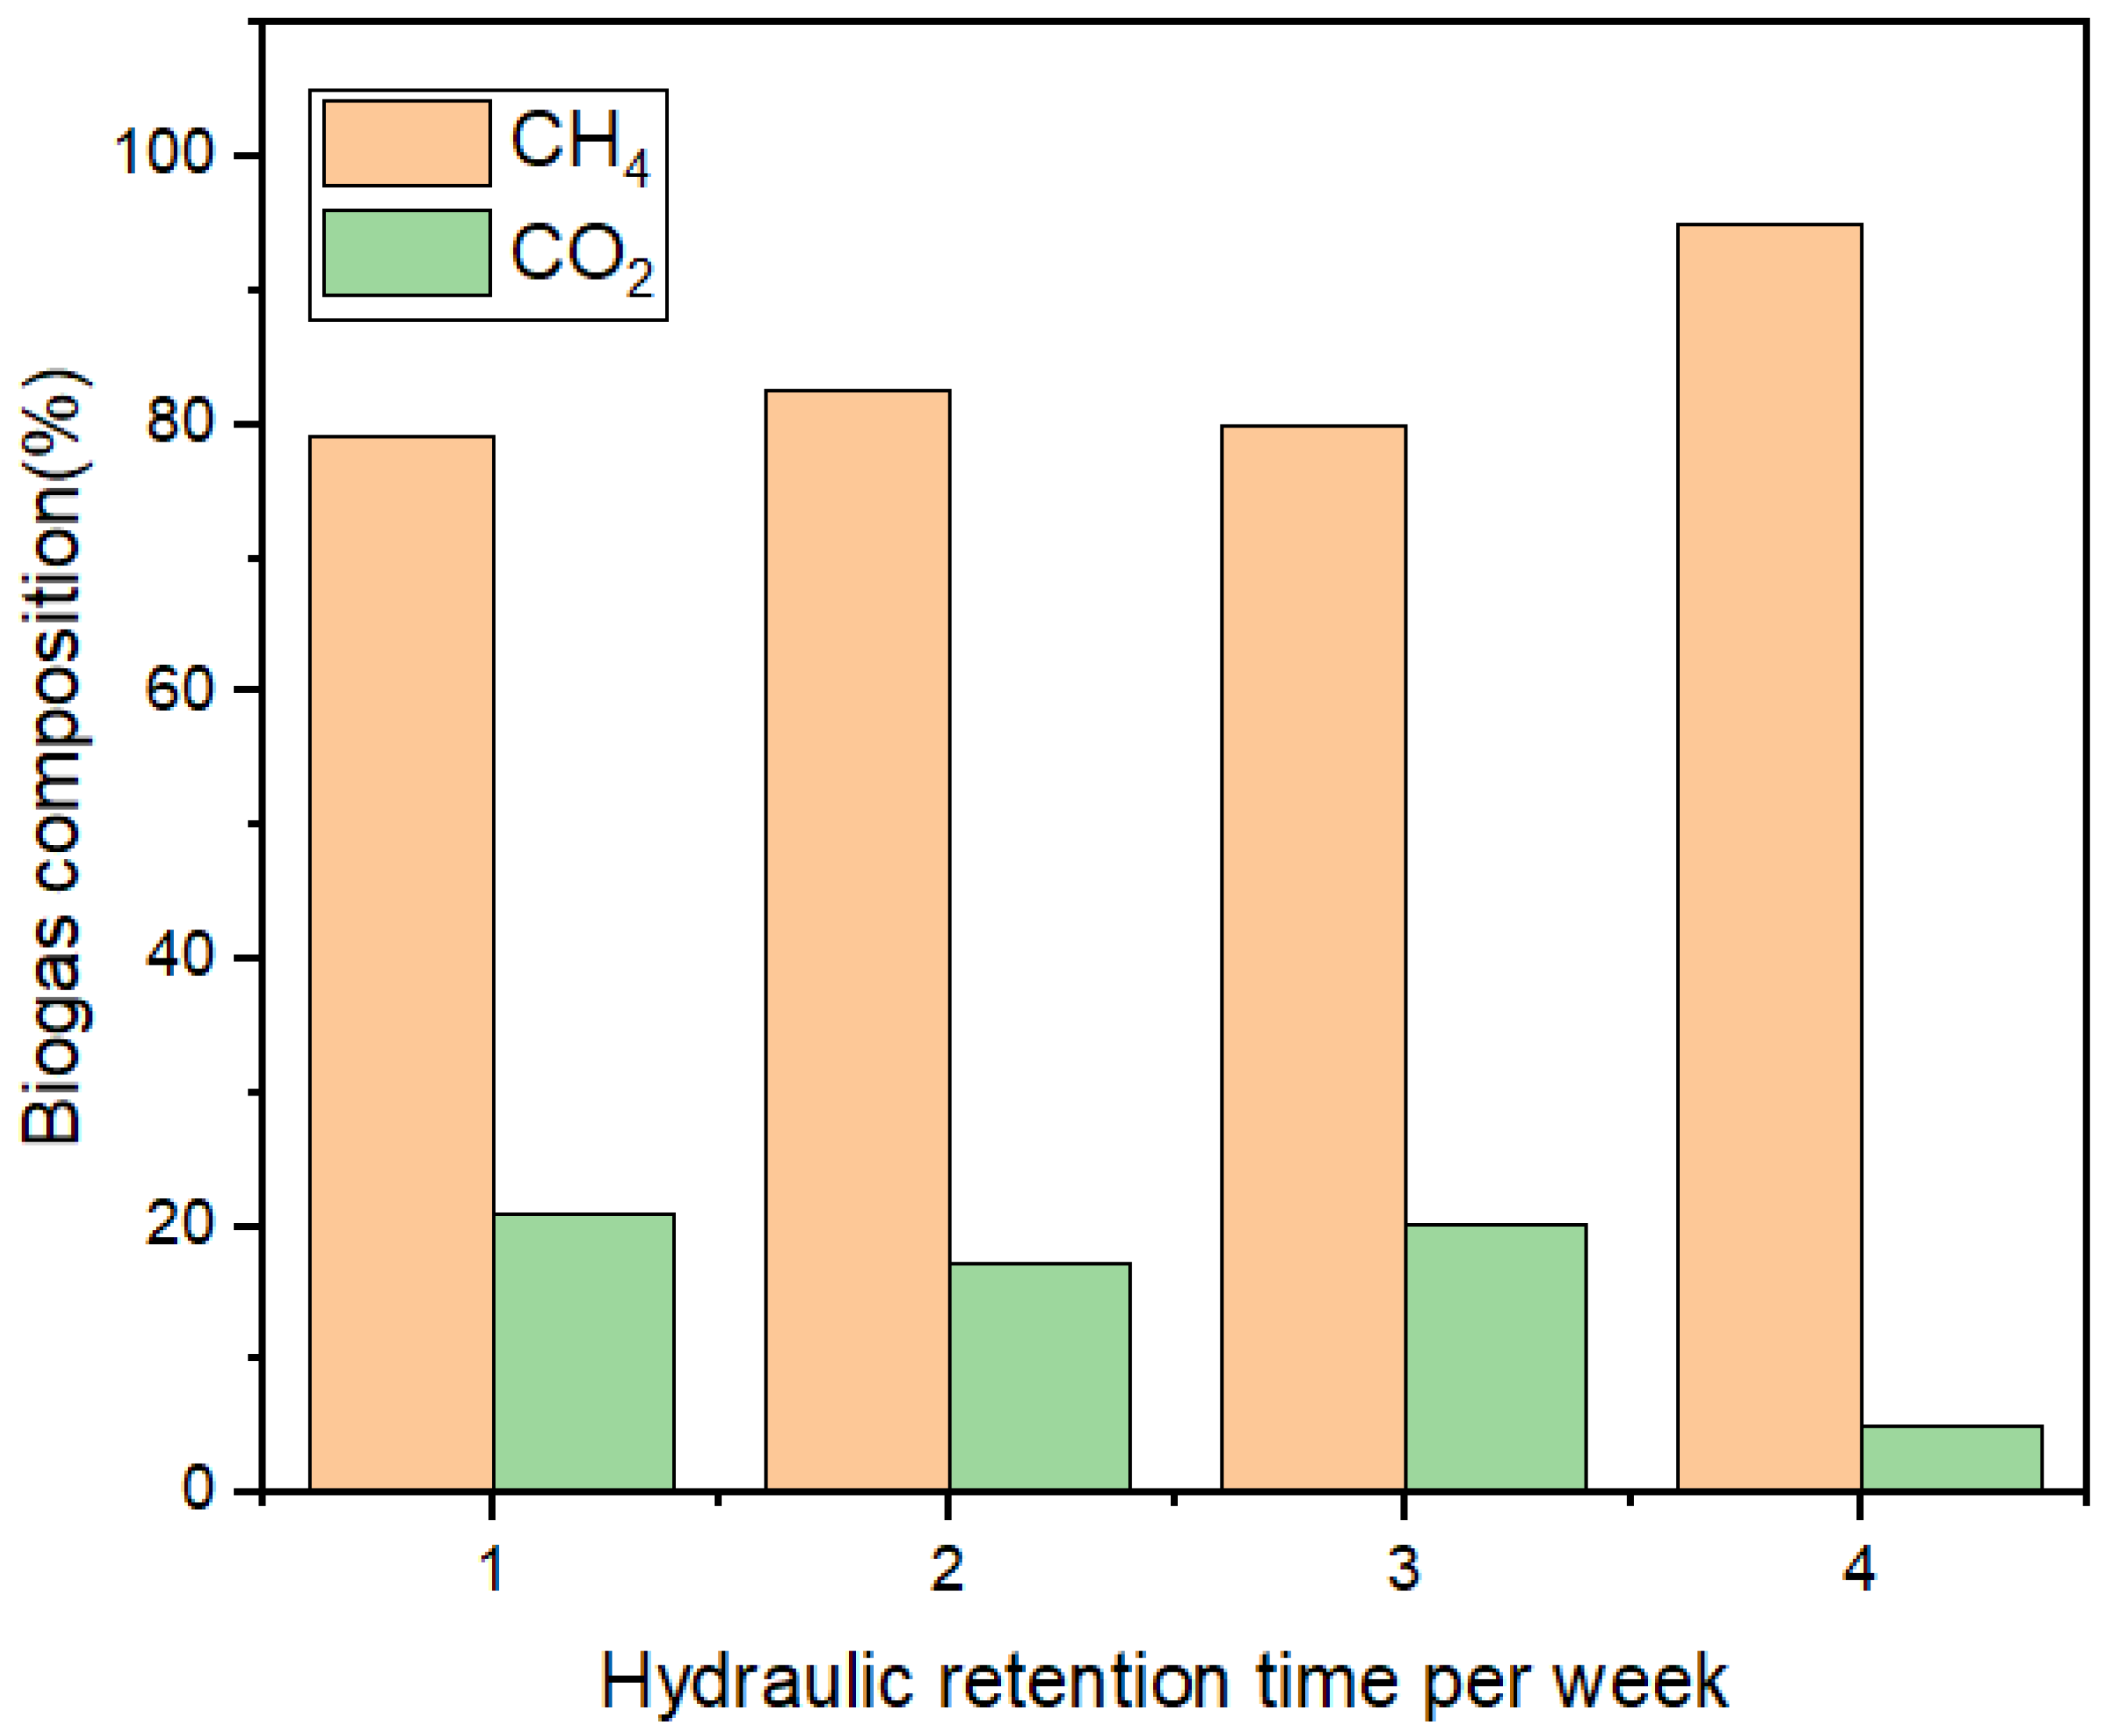
Figure 4 shows the increased methane level of the biogas produced recorded for week 1 to week 4, respectively, like 79%, 83%, 80%, and 95%, with the rest as CO2 composition. From our preliminary studies, there was the need to investigate the effect of the HRT and catalyst load on the BP system efficiency. Therefore, understanding their individual or interaction effects on the BP system led to the RSM studies at a constant temperature of 37.5 °C, and an organic loading rate of 2.38 kgCOD/Ld.

3.1. RSM Modelling and Statistical Analysis

According to the modified RSM-BBD matrix (Table 2), 13 randomized runs were carried out, including one center point (run 10) and four duplicates (runs 1:3; 2:9; 5:8; and 7:12) as depicted in Table 3 with additional information in Table S1. All the responses of the center point (run 10) showed little variation, indicating the consistency of the experimental runs. In all the experimental conditions, the removal efficiency of COD, color, and turbidity was observed to range from 90–98%. This degradation efficacy corresponded to biogas production of 125–335 mL/d. However, the biogas experimental results (125–335 mL/d) were estimated to deviate by 5% to that of the modified RSM-BBD model predicted results (130–327 mL/d). Subsequently, the significance of the factors was determined by modeling the experimental data as a function of the individual response (Table 3). This resulted in a reduced quadratic model with the Design Expert software that provided equations (3–10) in their coded and actual factors for the distinctive responses. The linear (A, B), interaction (AB), and quadratic (A2, B2) terms represent the hierarchal form of the model, which combined the forward and backward regression option [29]. This regression option augments and eliminates the insignificant variables that do not meet or fall short of the model levels required (p < 0.05) [19,29]. The positive and negative coefficients in the predicted models (3–10) denote energetic and antagonistic effects of the process variables, respectively. In essence, the positive coefficient suggests that the response will be favored by an increase in such variable interaction. Conversely, the negative signs implies the response efficiency will decrease with an increase in those variables [29].
Biogas coded ( Y 1 ) = 267 + 86.37 A 3 B 12.25 AB 50 A 2 + 8.75 B 2
Biogas actual   ( Y 1 ) = 118.73 + 149.72 Catalyst + 0.189 HRT 0.41 Catalyst HRT 12.5 Catalyst 2 0.03 HRT 2
COD coded ( Y 2 ) = 97.57 + 0.75 A + 1.13 B 0.24 AB 1.96 A 2 1.71 B 2
COD actual   ( Y 2 ) = 84.53 + 4.44 Catalyst + 0.35 HRT 0.0083 Catalyst HRT 0.49 Catalyst 2 0.03 HRT 2
Color   coded ( Y 3 ) = 97.86 + 1.5 A + 0.99 B 0.75 AB 2.07 A 2 1.57 B 2
Color actual   ( Y 3 ) = 82.12 + 5.29 Catalyst 0.39 HRT 0.0249 Catalyst HRT 0.518 Catalyst 2 0.00698 HRT 2
Turbidity coded ( Y 4 ) = 98.57 + 0.8 A + 0.49 B 0.37 AB 1.03 A 2 0.79 B 2
Turbidity actual   ( Y 4 ) = 90.61 + 2.67 Catalyst + 0.195 HRT 0.0125 Catalyst HRT 0.258 Catalyst 2 0.034 HRT 2

3.2. Analysis of Variance (ANOVA)

The response data was analyzed with the Design expert software, and the derived models were then fitted using the ANOVA (Table 4). The ANOVA shows how well the quadratic models fit the experimental values, parameters including F-value, probability >F, and adequate precision, which is a measure of error, or the signal-to-noise ratio were used [19,29]. The summary of the ANOVA for the various quadratic models is depicted in Table 4. The models’ variables depict the two-factor interactions between the catalyst load (A) and the HRT (B) for the biogas (Y1), COD (Y2), Color (Y3), and Turbidity (Y4) efficiency. All the variables and their interactions were significant in the proposed models except the interaction of AB of the COD (Y2) quadratic model (5–6) as indicated by a probability value being more than 0.05 (Table 4). A significant interaction between AB means that the effect of each variable depends on the value of the other variable [20]. Thus, increasing the catalyst load (AD) will require a longer period to reduce its potency. Adequate precision for all the models was greater than 4, suggesting a high signal/noise ratio; hence, the models can be used to navigate the design space [29].
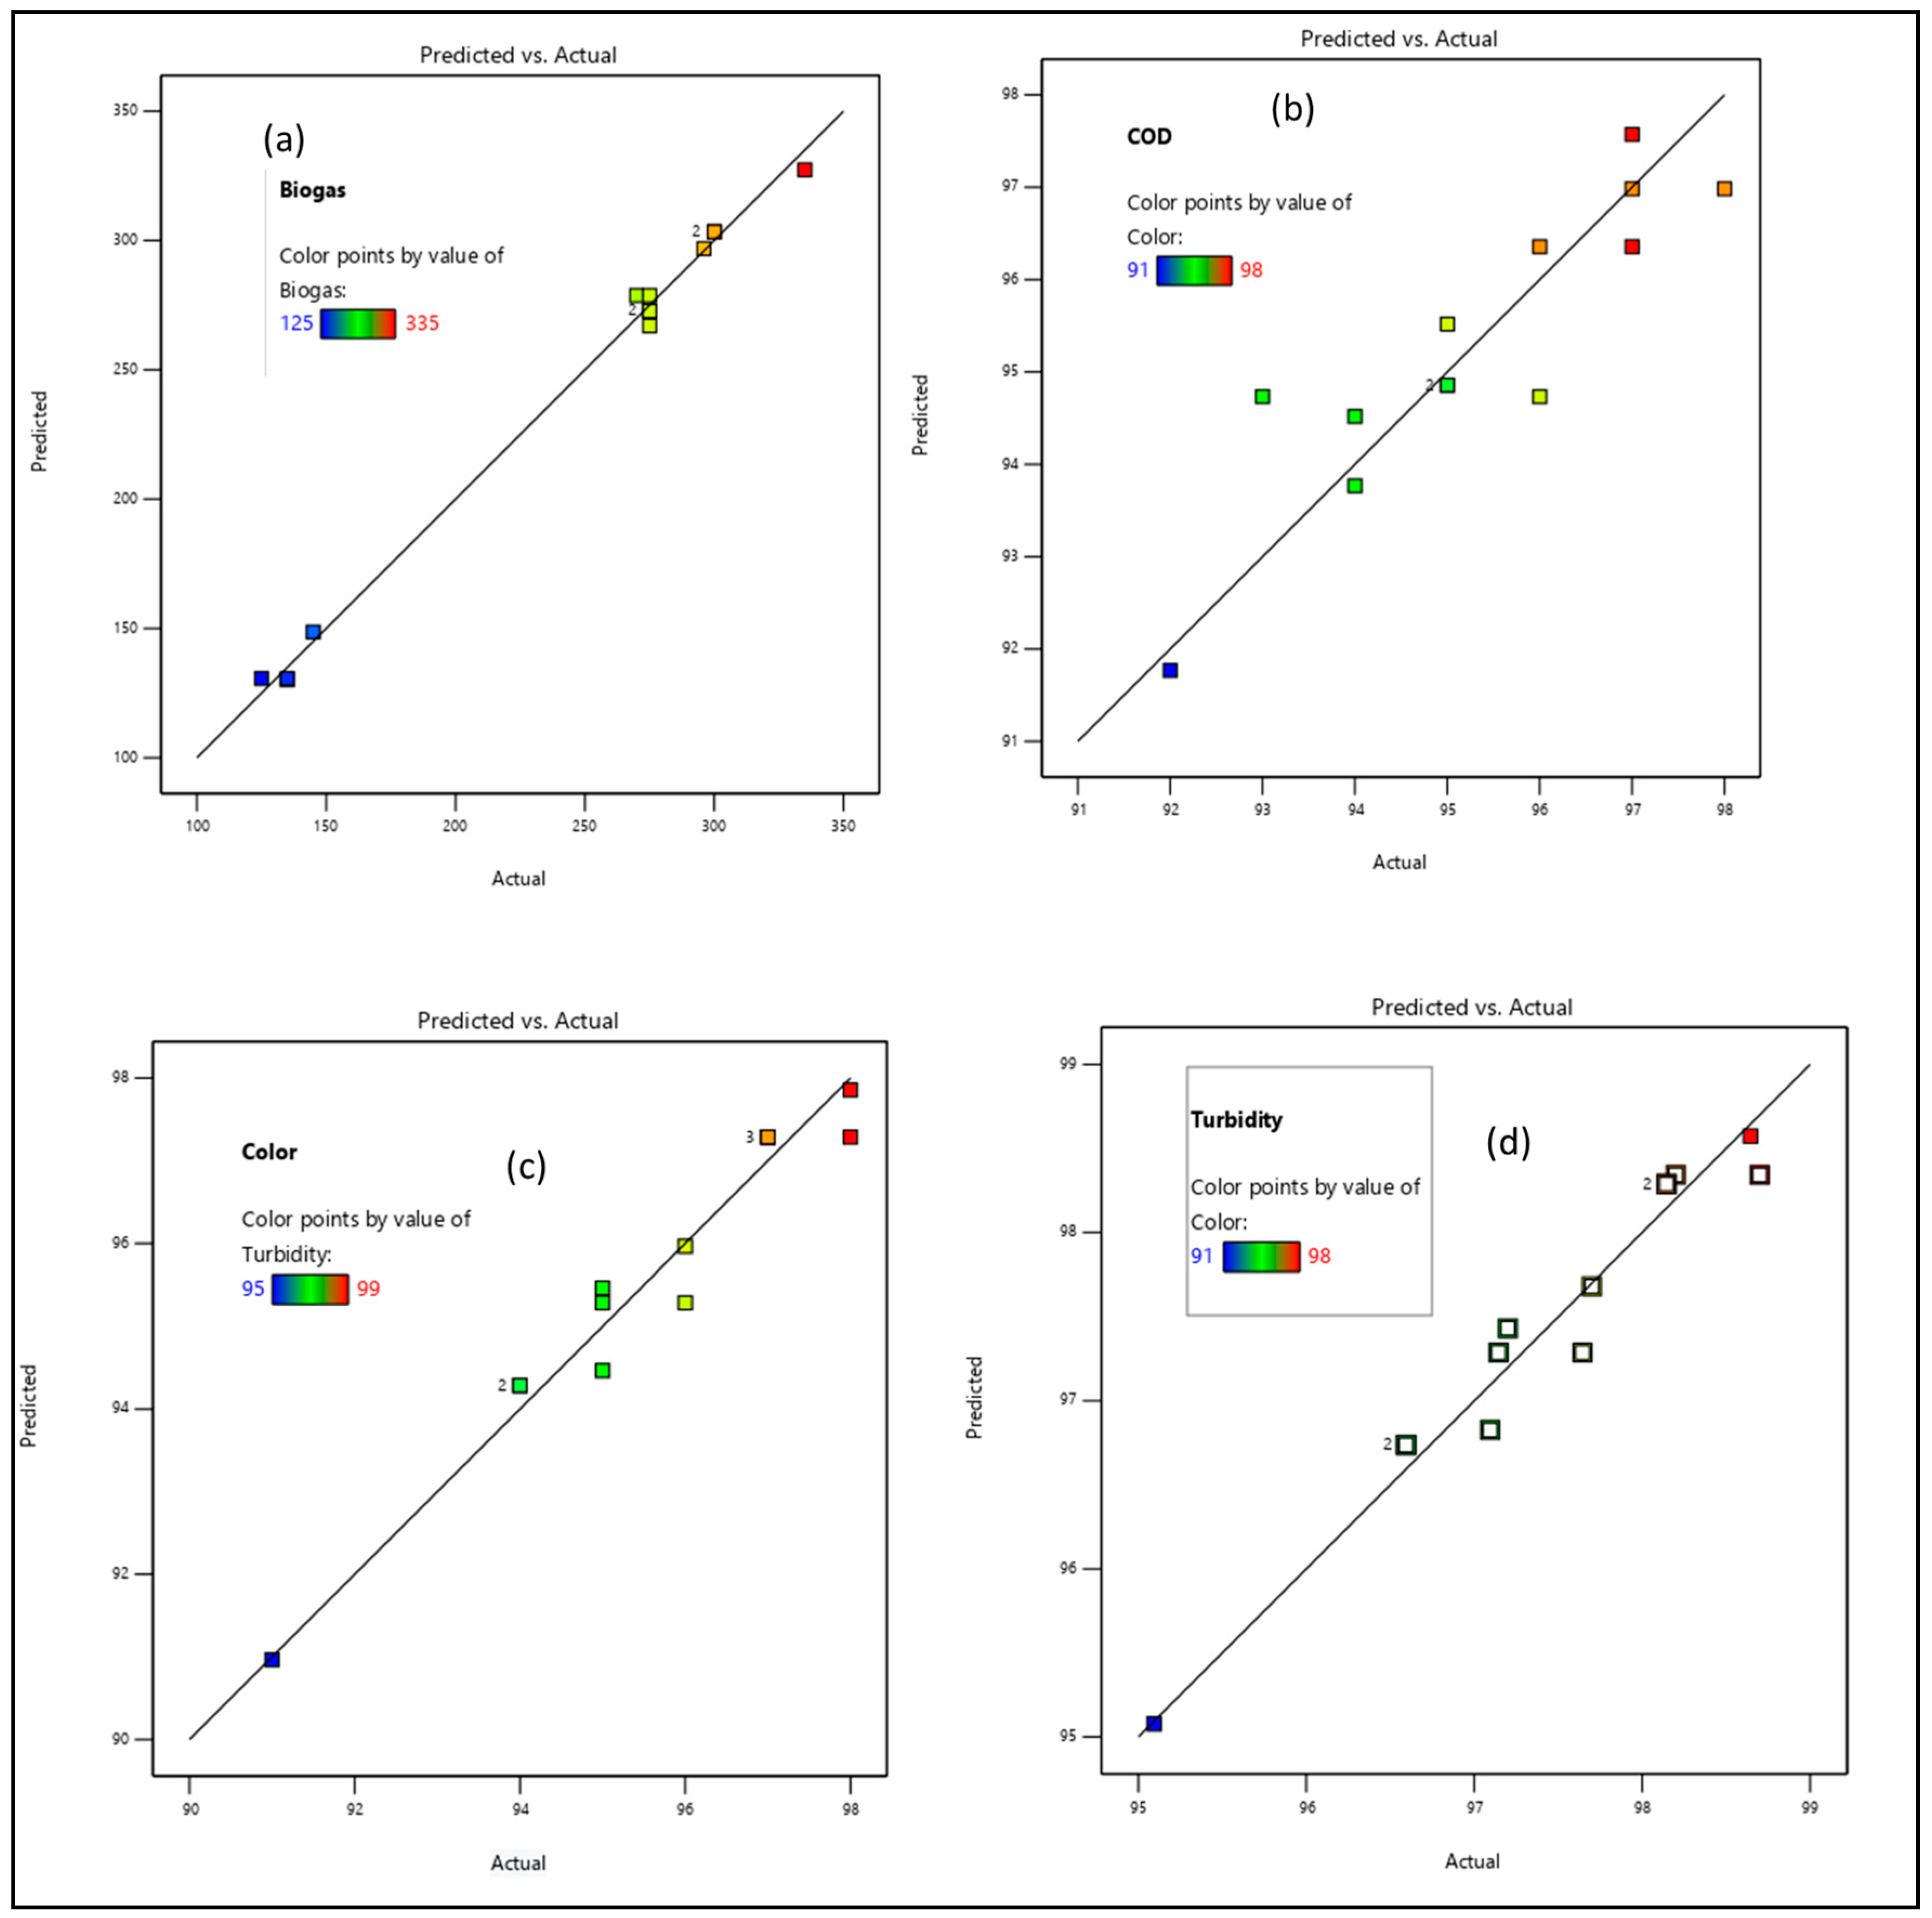
Subsequently, the extent of correlation was estimated using experimental-predicted data interactive plots that is represented by plotting the predicted values against the experimental ones (Figure 5). Figure 5a,c,d shows a strong linear correlation between the experimental and the model predicted data with their high regression coefficients (R2) as depicted in Table 4. However, in Figure 5b, only a few data points were frequently scattered around the diagonal line, which could account for the on-and-off degradation of the organics (%COD removal) based on the subjected experimental conditions. The standard error (SE) for the straight line of best fit had insignificant deviation (p < 0.05) at a 95% confidence level. As can be inferred in Table 4, the COD (Y2) model regression is very low, even though all the model’s Adjusted R2 and Predicted R2 values are in reasonable agreement with a difference of less than 0.2. The standard error (SE) for the straight line of best fit shows insignificant deviation (<0.05) at 95% confidence levels.

3.3. One-Factor-At-Time Technique

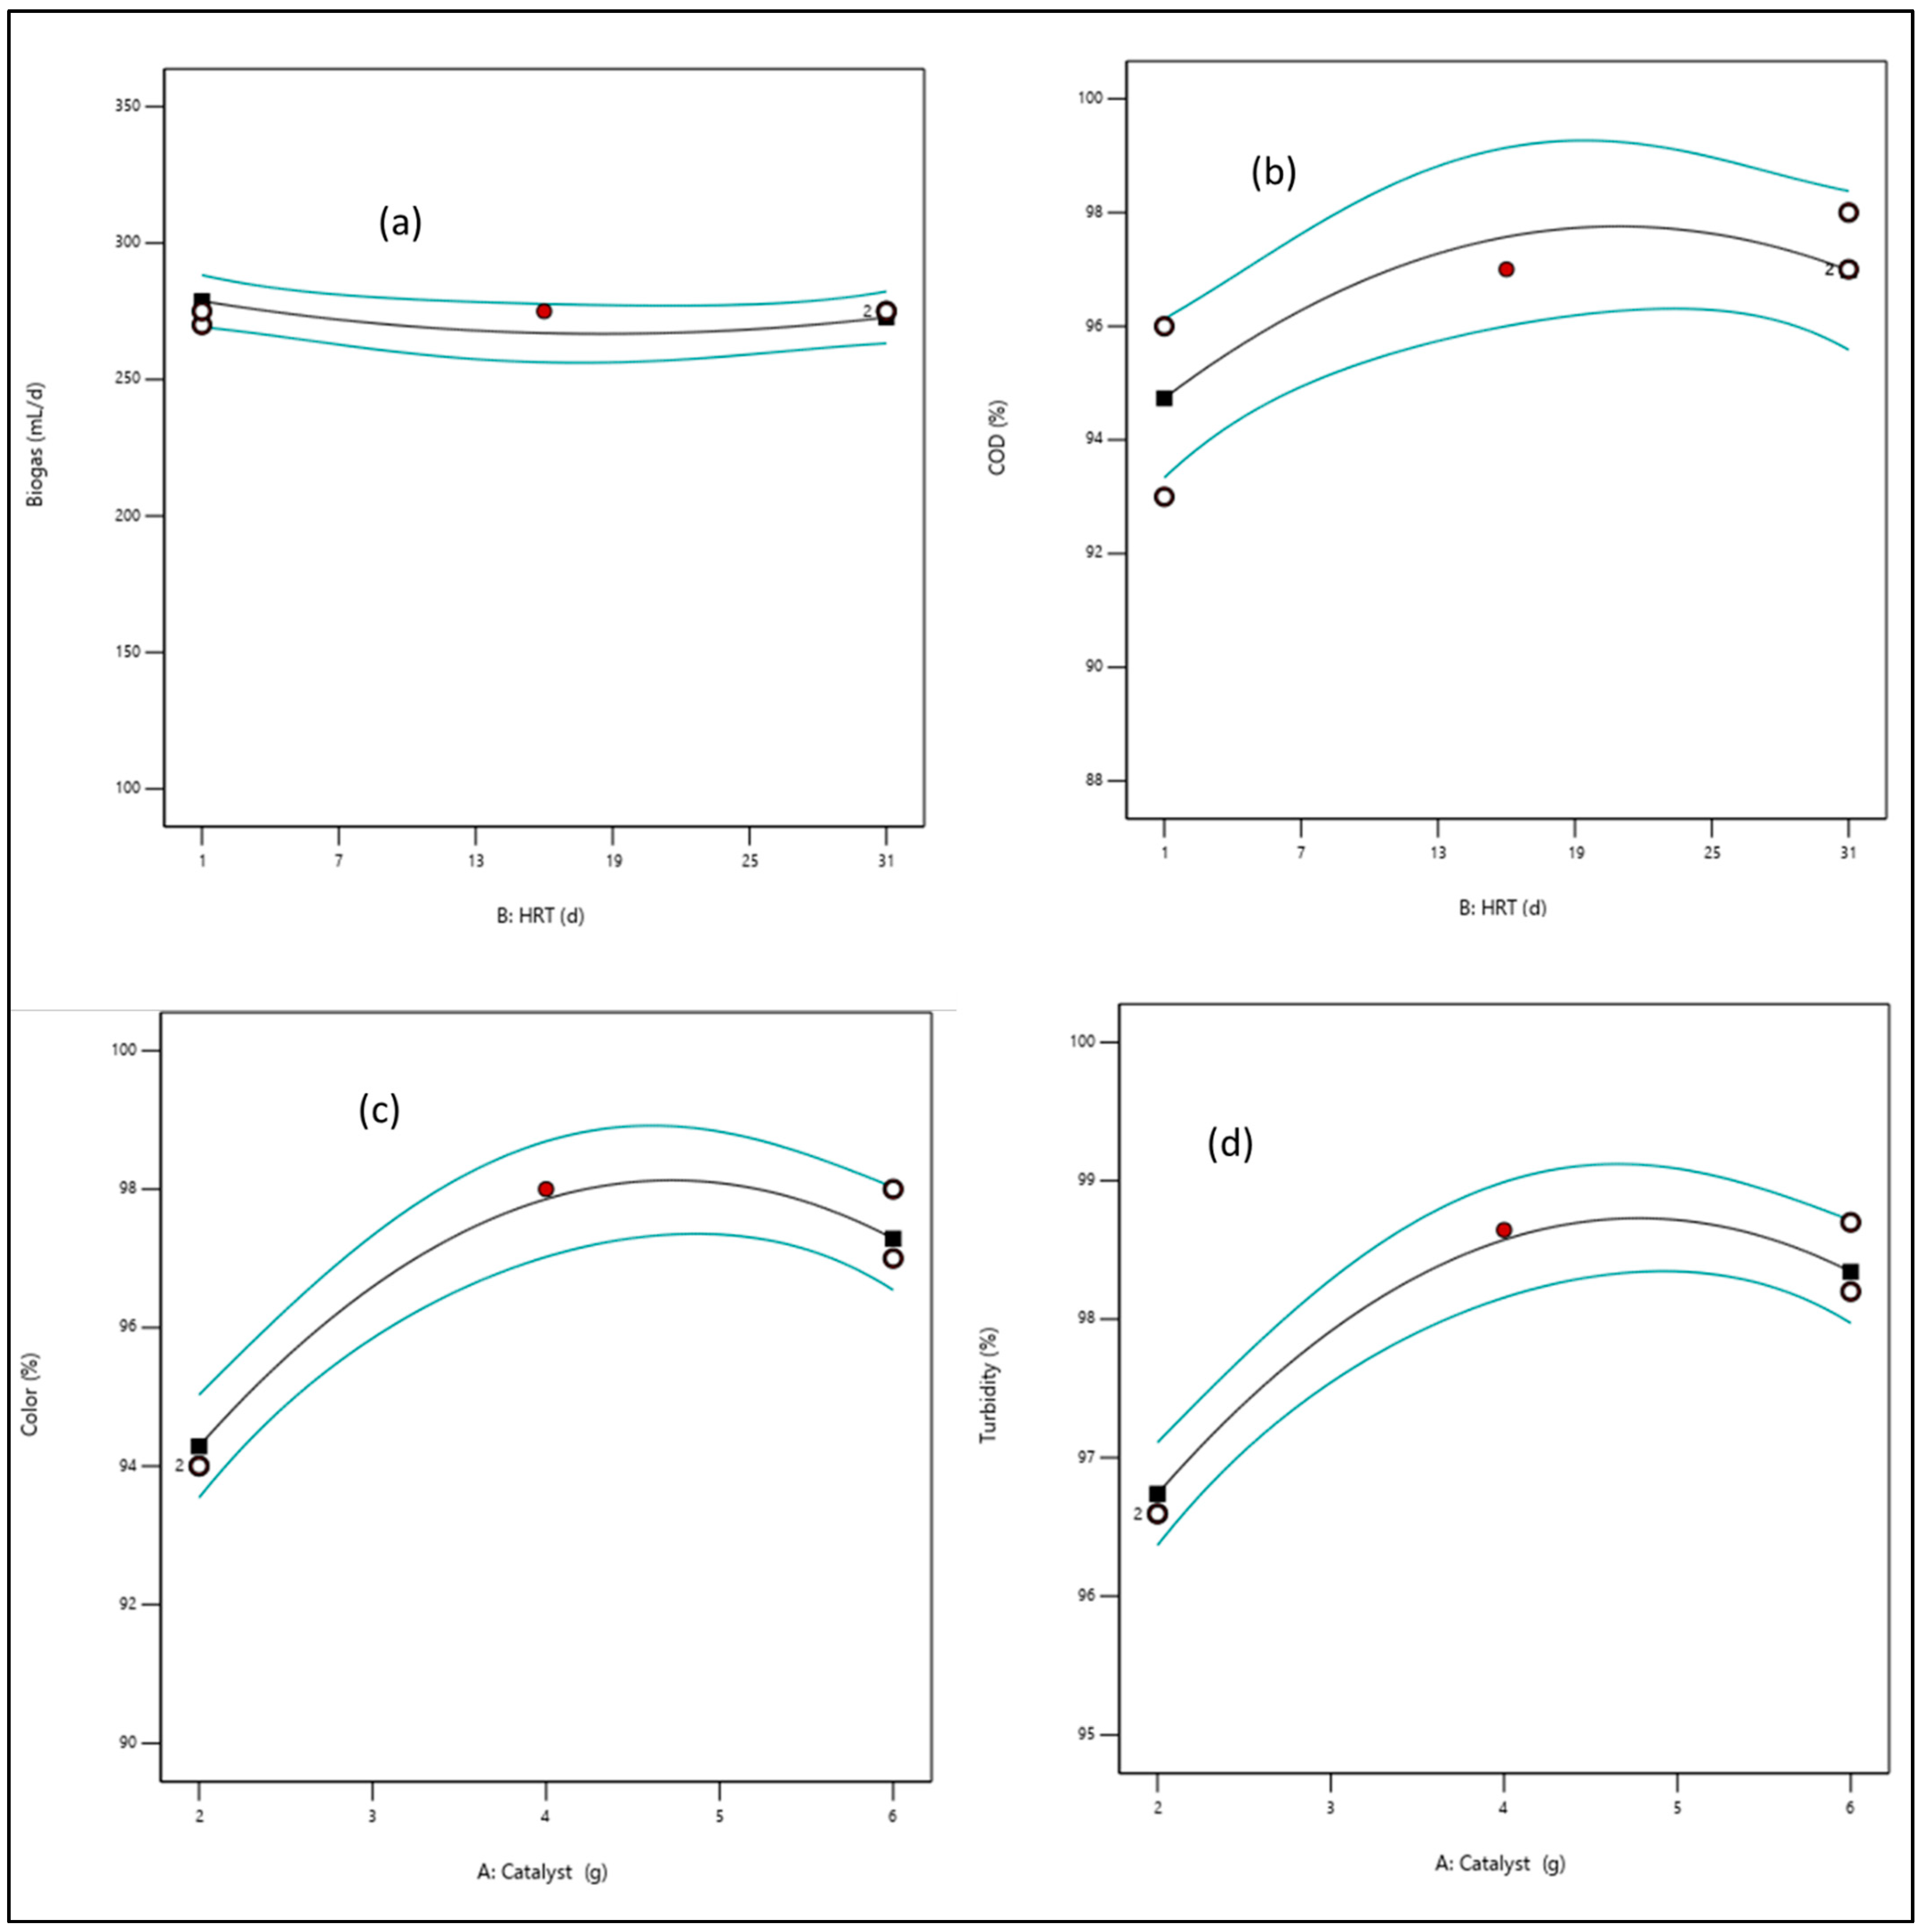
3.3.1. Effect of Catalyst Load

The impact of the Fe-TiO2 load over the range of 2–6 g was used to study the degradability of the organic content of the wastewater into biogas. In Figure 6, it is observed that the degradation efficiency as a function of (a) biogas, (b) COD, (c) color, and (d) turbidity increased with an increase in the catalyst load. However, after the optimum regime (>4.5 g) there was a drop in the degradation efficiency. The decrease in efficiency might be due to excess hydroxyl radicals generated which agglomerated and reduced the active surface area [30]. In essence, increasing the catalyst load increased the collision frequency between the hydroxyl radicals and the organic content interspecies, which diminished the photoactivity of the system [27,30]. Also, the exponential growth of the microbial organism and their degradability activity increased biogas production [27]. This suggests that the induction of the catalyst facilitated the conductive electron interspecies transfers, which increased the microbial activity and the methanogenic activity [13,30,31].

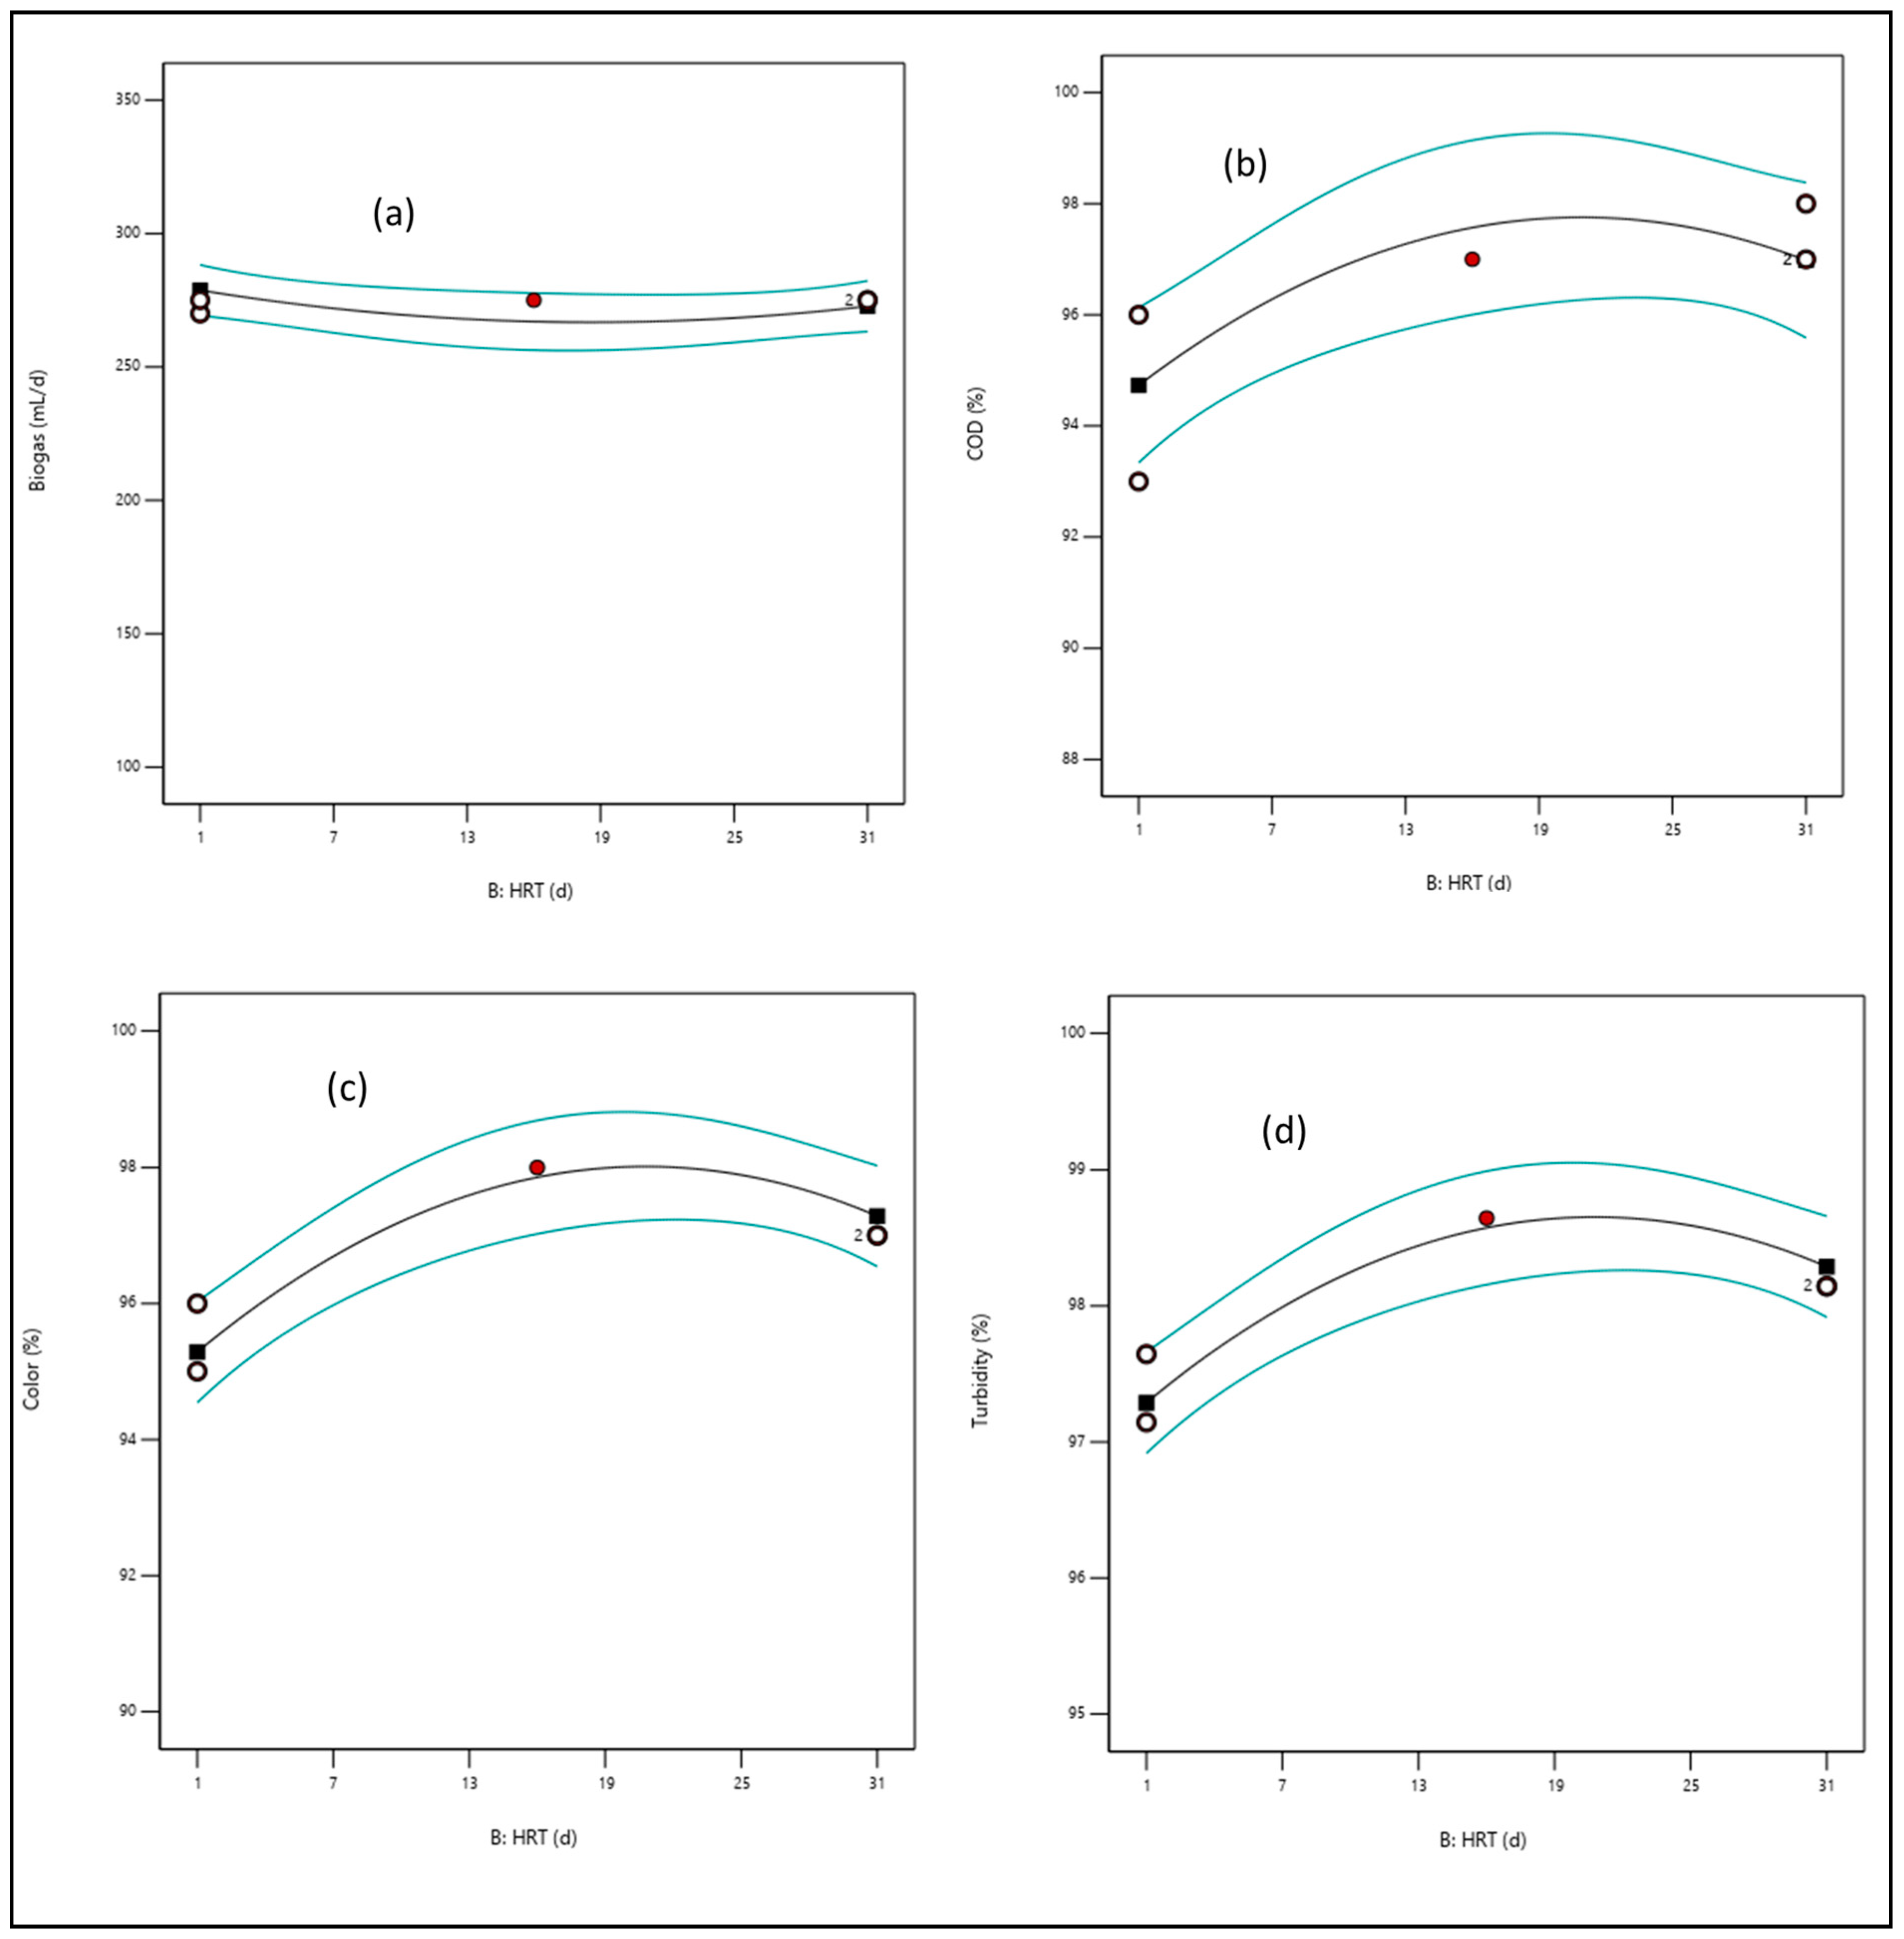
3.3.2. Effect of Hydraulic Retention Time (HRT)

The HRT investigated from 1–31 days had a significant effect on the digester performance as it facilitated microbial activity to the organic interspecies contact time, which increased its digestibility. Figure 7 shows an initial increase in degradation (COD, color, and turbidity) during the first 5 to 15 days followed by a decline (15–31 days), whereas a fairly constant rate for biogas production (Figure 7a) was observed. This indicates that a longer HRT is required for the methanogens to digest the organic component and convert it to biogas [32]. In addition, the digestion process will slow down if volatile fatty acids accumulate due to acidic bacteria being dominant with less organic content [26,30,33].

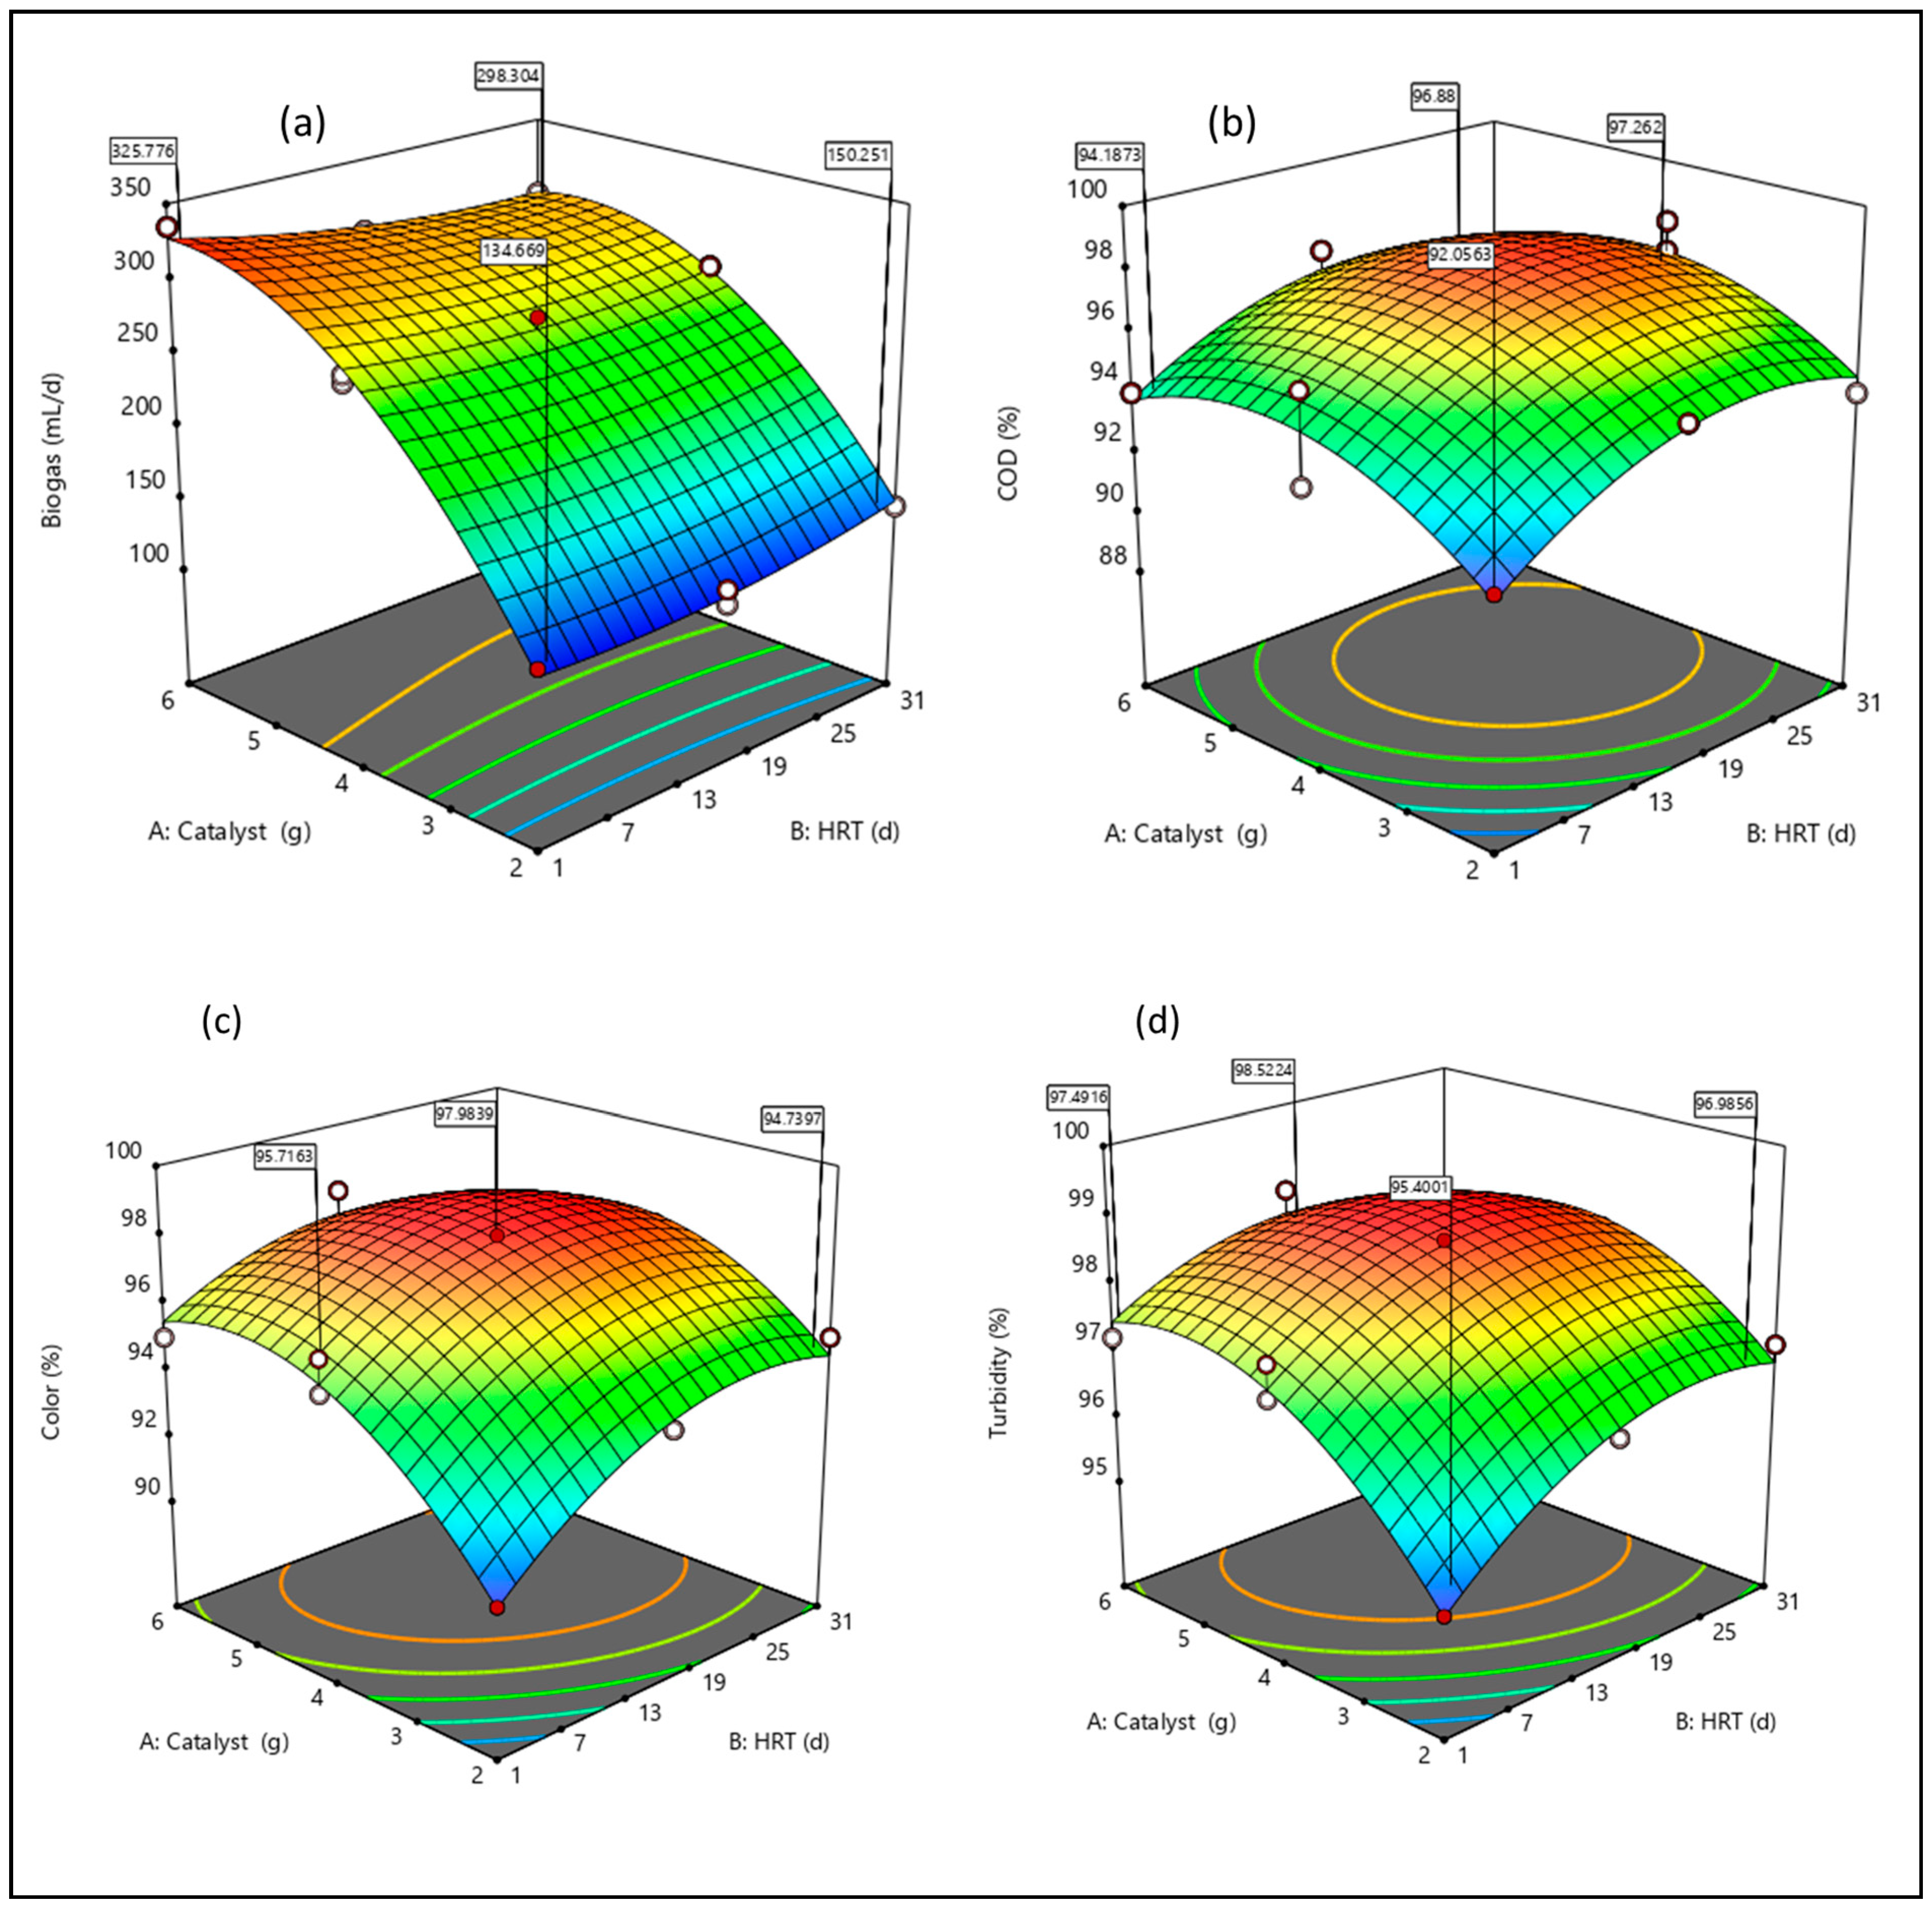
3.4. Response Surface Interaction Plots

The modified RSM-BBD was used to illustrate the interactive impact of the factors on the response. Figure 8 shows the presence of interactions between the factors, catalyst load, and HRT (AB) on (a) biogas (b) COD, (c) color, and (d) turbidity. The graphical representation of the three-dimensional (3D) surface plots of the response models was selected based on the influential factors and their interaction that can be utilized to maximize the system desirability. Curvatures of a significant magnitude can be seen in the graphs (Figure 8). These curves indicate that the correlation between the factors (AB) and the response (biogas, COD, color, and turbidity) was well fitted on a quadratic function (3–10). This elucidates Figure 8 as the degradation efficiency increased to the maximum with an increase in HRT; likewise, with the catalyst load (Figure 6). However, the curvature (Figure 8) highlights an increase in catalyst with dosage from 2 to 4 g and thereafter decreased with a further increase in catalyst load (5–6 g). The trend (Figure 8), observed at higher dosages of the catalyst, can be attributed to particle re-stabilization [30,33]. In addition, an overdose and excess of hydroxyl radicals can also aggregate to decrease the active surface area [30]. In essence, at the stage of re-stabilization, there is a charge reverse between the interspecies [26,30,33]. As illustrated (Figure 8) with an arc-line, the optimum regime can be observed within the HRT of 15–25 days. This validates the positive sign of the response quadratic models (3–10) as reported earlier, which had significant impact on the system predictability (Figure 5).

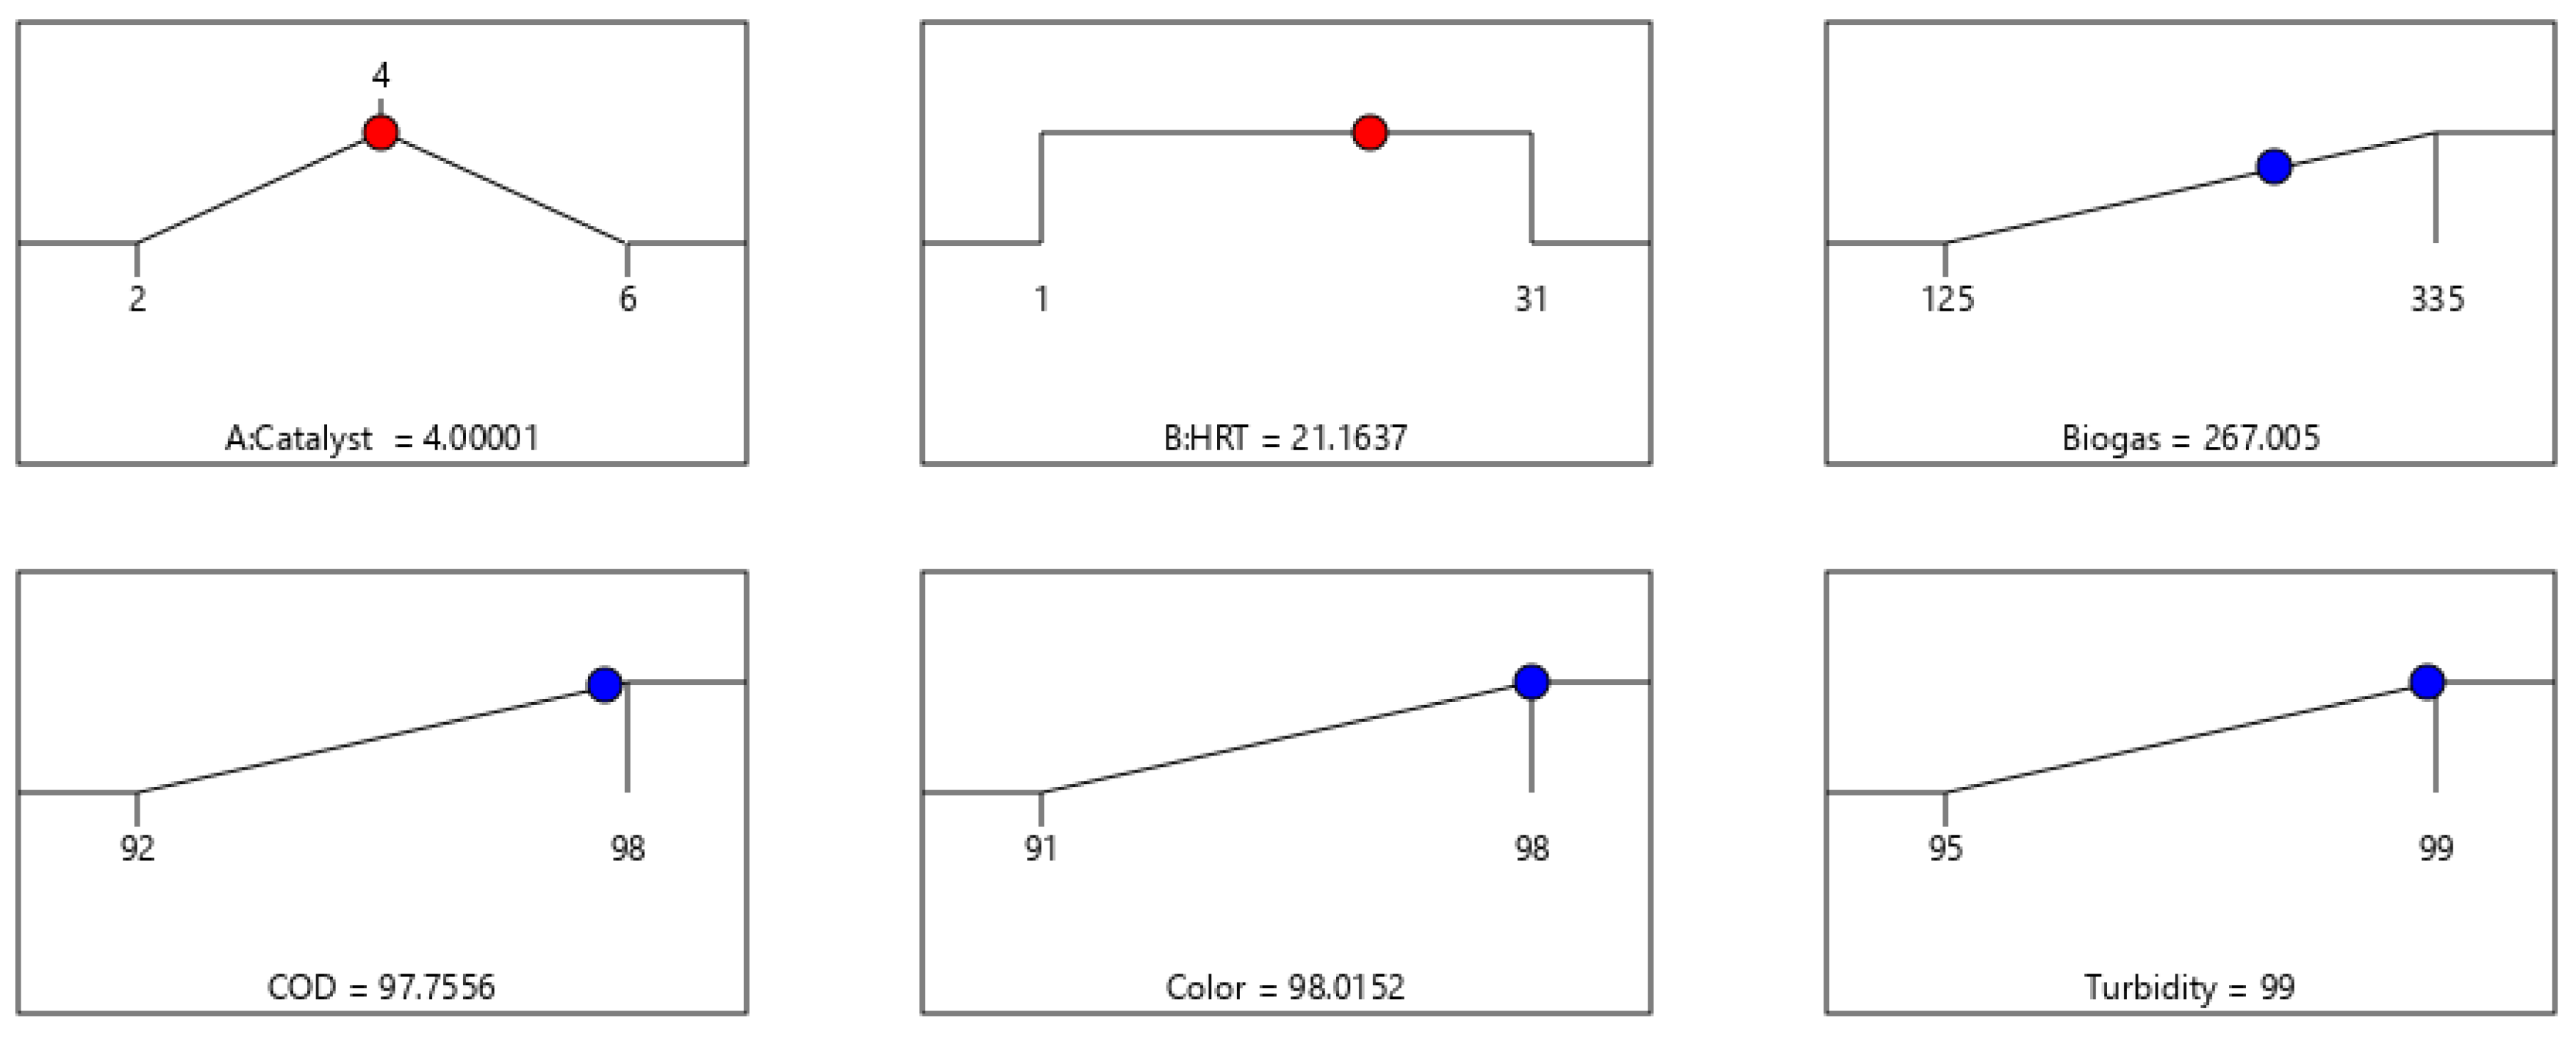
3.5. Response Optimization and Confirmation Test

The numerical optimization technique was employed to maximize the responses (biogas, COD, color, and turbidity) and determine the optimal conditions (with respect to the experimental runs) using their respective quadratic equations (3–10). Also, the comparative evaluation of the experimental and model predicted responses at each level of the experimental conditions (Table 3) showed considerable correlation with the two input variables (A and B) as a constraint. The goal for the optimization was defined as a function of the input variables set within the range of their levels such as low (−1) and high (+1) to maximize the desirability of the responses. The optimal solution selected out of 78 solutions (Table S1) to maximize the responses is presented in Figure 9 with 100% desirability. As it can be inferred from the ramp plot (Figure 9), 267 mL/d of biogas, 97.75% COD, 98% color, and 99% turbidity removal were attained at 4 g catalyst load and HRT of 21 d. The selected optimal conditions validated and confirmed experimentally as presented in Table 5 were in good agreement with the predicted values. This suggests the model’s predictability was consistent (p < 0.05) at 95% confidence levels with a small standard error (SE) and standard deviation (STD) (Table 5). Also, the results obtained were compared with other studies (Table 6), which showed the appreciable efficacy of the BP system for wastewater treatment and biogas production.

4. Conclusions

In this study, biogas, and decontamination (COD, color, and turbidity removal) efficiency of biophotocatalytic degradation of municipality wastewater was studied. The lab-scale biophotocatalytic (BP) system operated in batch mode was augmented with Fe-TiO2 and optimized to treat the wastewater. The results demonstrated both the HRT and catalyst load had positive effects on the BP system efficacy. At an optimal catalyst load of 4 g and HRT of 21 d, the modified RSM-BBD model predicted results were validated experimentally, and 267 mL/d of biogas and >98% COD, color and turbidity removal efficiency were attained. This infers 100% desirability with a high coefficient of regression of >0.98 at 95% confidence. The analysis of variance (ANOVA) suggested the modified RSM-BBD response models developed were significant with high precision, as the predicted results and the experimental results were in good agreement. This study demonstrates the modified RSM-BBD’s usefulness and reliability in modeling, optimizing, and monitoring the effectiveness of the BP systems for wastewater treatment and biogas production.

Supplementary Materials

The following supporting information can be downloaded at: https://www.mdpi.com/article/10.3390/bioengineering9030095/s1, Table S1: Modified RSM-BBD optimized conditions of the BP system.

Author Contributions

Conceptualization; methodology; investigation; writing of the original draft preparation was carried out by E.K.T. Writing review and editing, project administration, funding acquisition, and supervision by S.R. All authors have read and agreed to the published version of the manuscript.

Funding

This research was funded by the Water Research Commission of South Africa under project identification WRC Project: C2019/2020-00212.

Institutional Review Board Statement

Not applicable.

Informed Consent Statement

Not applicable.

Data Availability Statement

No new data were created or analyzed in this study. Data sharing is not applicable to this article.

Acknowledgments

The authors wish to thank the Durban University of Technology, Green Engineering and Sustainability Research Group, and the Water Research Commission of South Africa for their support on the project identification WRC Project: C2019/2020-00212. The corresponding author also wishes to thank the National Research Foundation for the scholarship grant number 138046.

Conflicts of Interest

The authors declare no conflict of interest and the funders had no role in the design of the study; in the collection, analyses, or interpretation of data; in the writing of the manuscript, or in the decision to publish the results.

References

  1. Bella, K.; Rao, P.V. Anaerobic digestion of dairy wastewater: Effect of different parameters and co-digestion options—A review. Biomass Convers. Biorefin. 2021, 1–26. [Google Scholar] [CrossRef]
  2. Guerra, J.B.S.O.d.; Berchin, I.I.; Garcia, J.; Neiva, S.D.S.; Jonck, A.V.; Faraco, R.A.; De Amorim, W.S.; Ribeiro, J.M.P. A literature-based study on the water-energy–food nexus for sustainable development. Stoch. Environ. Res. Risk Assess. 2021, 35, 95–116. [Google Scholar] [CrossRef]
  3. Wang, X.-C.; Jiang, P.; Yang, L.; Fan, Y.V.; Klemeš, J.J.; Wang, Y. Extended water-energy nexus contribution to environmentally-related sustainable development goals. Renew. Sustain. Energy Rev. 2021, 150, 111485. [Google Scholar] [CrossRef]
  4. Nguyen, T.K.L.; Ngo, H.H.; Guo, W.; Nguyen, T.L.H.; Chang, S.W.; Nguyen, D.D.; Varjani, S.; Lei, Z.; Deng, L. Environmental impacts and greenhouse gas emissions assessment for energy recovery and material recycle of the wastewater treatment plant. Sci. Total Environ. 2021, 784, 147135. [Google Scholar] [CrossRef] [PubMed]
  5. Mostafaeipour, A.; Bidokhti, A.; Fakhrzad, M.-B.; Sadegheih, A.; Mehrjerdi, Y.Z. A new model for the use of renewable electricity to reduce carbon dioxide emissions. Energy 2022, 238, 121602. [Google Scholar] [CrossRef]
  6. Tetteh, E.K.; Amankwa, M.O.; Armah, E.K.; Rathilal, S. Fate of COVID-19 Occurrences in Wastewater Systems: Emerging Detection and Treatment Technologies—A Review. Water 2020, 12, 2680. Available online: https://www.mdpi.com/2073-4441/12/10/2680 (accessed on 25 November 2020). [CrossRef]
  7. Rout, P.R.; Zhang, T.C.; Bhunia, P.; Surampalli, R.Y. Treatment technologies for emerging contaminants in wastewater treatment plants: A review. Sci. Total Environ. 2021, 753, 141990. [Google Scholar] [CrossRef]
  8. Chai, W.S.; Cheun, J.Y.; Kumar, P.S.; Mubashir, M.; Majeed, Z.; Banat, F.; Ho, S.-H.; Show, P.L. A review on conventional and novel materials towards heavy metal adsorption in wastewater treatment application. J. Clean. Prod. 2021, 296, 126589. [Google Scholar] [CrossRef]
  9. Tetteh, E.K.; Rathilal, S. Application of Organic Coagulants in Water and Wastewater Treatment. Available online: https://www.intechopen.com/chapters/65706 (accessed on 25 November 2020).
  10. Zhao, C.; Zhou, J.; Yan, Y.; Yang, L.; Xing, G.; Li, H.; Wu, P.; Wang, M.; Zheng, H. Application of coagulation/flocculation in oily wastewater treatment: A review. Sci. Total Environ. 2021, 765, 142795. [Google Scholar] [CrossRef]
  11. Mahtab, M.S.; Farooqi, I.H.; Khursheed, A. Zero Fenton sludge discharge: A review on reuse approach during wastewater treatment by the advanced oxidation process. Int. J. Environ. Sci. Technol. 2021, 1–14. [Google Scholar] [CrossRef]
  12. Babaei, A.A.; Golshan, M.; Kakavandi, B. A heterogeneous photocatalytic sulfate radical-based oxidation process for efficient degradation of 4-chlorophenol using TiO2 anchored on Fe oxides@carbon. Process Saf. Environ. Prot. 2021, 149, 35–47. [Google Scholar] [CrossRef]
  13. Ge, M.; Hu, Z.; Wei, J.; He, Q.; He, Z. Recent advances in persulfate-assisted TiO2-based photocatalysis for wastewater treatment: Performances, mechanism and perspectives. J. Alloy. Compd. 2021, 888, 161625. [Google Scholar] [CrossRef]
  14. Chong, M.N.; Jin, B.; Chow, C.W.; Saint, C. Recent developments in photocatalytic water treatment technology: A review. Water Res. 2010, 44, 2997–3027. [Google Scholar] [CrossRef]
  15. Qu, X.; Alvarez, P.J.; Li, Q. Applications of nanotechnology in water and wastewater treatment. Water Res. 2013, 47, 3931–3946. [Google Scholar] [CrossRef] [PubMed]
  16. Zhao, T.; Qian, R.; Zhou, G.; Wang, Y.; Lee, W.I.; Pan, J.H. Mesoporous WO3/TiO2 spheres with tailored surface properties for concurrent solar photocatalysis and membrane filtration. Chemosphere 2021, 263, 128344. [Google Scholar] [CrossRef] [PubMed]
  17. Kaur, M.; Noonia, A.; Dogra, A.; Thind, P.S. Optimising the parameters affecting degradation of Cypermethrin in an aqueous solution using TiO2/H2O2 mediated UV photocatalysis: RSM-BBD, kinetics, isotherms and reusability. Int. J. Environ. Anal. Chem. 2021, 1–15. [Google Scholar] [CrossRef]
  18. Deriase, S.F.; El-Salamony, R.A.; Amdeha, E.; Al-Sabagh, A.M. Statistical optimization of photocatalytic degradation process of methylene blue dye by SnO–TiO2–AC composite using response surface methodology. Environ. Prog. Sustain. Energy 2021, 40, e13639. [Google Scholar] [CrossRef]
  19. Tetteh, E.K.; Ezugbe, E.O.; Asante-Sackey, D.; Armah, E.K.; Rathilal, S. Response Surface Methodology: Photocatalytic Degradation Kinetics of Basic Blue 41 Dye Using Activated Carbon with TiO2. Molecules 2021, 26, 1068. [Google Scholar] [CrossRef] [PubMed]
  20. Joy, V.M.; Feroz, S.; Dutta, S. Solar nanophotocatalytic pretreatment of seawater: Process optimization and performance evaluation using response surface methodology and genetic algorithm. Appl. Water Sci. 2021, 11, 1–15. [Google Scholar] [CrossRef]
  21. Zhao, J.; Li, Y.; Dong, R. Recent progress towards in-situ biogas upgrading technologies. Sci. Total Environ. 2021, 800, 149667. [Google Scholar] [CrossRef]
  22. Fuentes, I.; Bernales, N.; Ulloa, C.; García, X. Kinetics of CO2 methanation using a Fe-bearing blast furnace sludge as catalytic precursor. Catal. Today 2021. [Google Scholar] [CrossRef]
  23. Carranzo, I.V. Standard Methods for examination of water and wastewater. In Anales De Hidrología Médic; Universidad Complutense de Madrid: Madrid, Spain, 2012; Volume 5, p. 185. [Google Scholar]
  24. Tetteh, E.K.; Amo-Duodu, G.; Rathilal, S. Synergistic Effects of Magnetic Nanomaterials on Post-Digestate for Biogas Production. Molecules 2021, 26, 6434. Available online: https://www.mdpi.com/1420-3049/26/21/6434 (accessed on 20 November 2021). [CrossRef] [PubMed]
  25. Apollo, S.; Onyango, M.S.; Ochieng, A. Modelling energy efficiency of an integrated anaerobic digestion and photodegradation of distillery effluent using response surface methodology. Environ. Technol. 2016, 37, 2435–2446. [Google Scholar] [CrossRef] [PubMed]
  26. Hwang, J.Y.; Moon, G.-H.; Kim, B.; Tachikawa, T.; Majima, T.; Hong, S.; Cho, K.; Kim, W.; Choi, W. Crystal phase-dependent generation of mobile OH radicals on TiO2: Revisiting the photocatalytic oxidation mechanism of anatase and rutile. Appl. Catal. B Environ. 2021, 286, 119905. [Google Scholar] [CrossRef]
  27. Kobwittaya, K.; Sirivithayapakorn, S. Photocatalytic reduction of nitrate over Fe-modified TiO2. APCBEE Procedia 2014, 10, 321–325. [Google Scholar] [CrossRef] [Green Version]
  28. Vargas, X.; Marin, J.; Restrepo, G. Evaluation of a coupled system using a nanomaterial Fe-doped TiO2 and a sequential batch reactor (SBR) to degrade azo dyes. Lat. Am. Appl. Res. 2016, 46, 81–86. [Google Scholar] [CrossRef]
  29. Manojkumar, N.; Muthukumaran, C.; Sharmila, G. A comprehensive review on the application of response surface methodology for optimization of biodiesel production using different oil sources. J. King Saud Univ.-Eng. Sci. 2020, in press. [Google Scholar] [CrossRef]
  30. Guo, Q.; Zhou, C.; Ma, Z.; Yang, X. Fundamentals of TiO2 photocatalysis: Concepts, mechanisms, and challenges. Adv. Mater. 2019, 31, 1901997. [Google Scholar] [CrossRef]
  31. Azadi, F.; Karimi-Jashni, A.; Zerafat, M.M.; Saadat, S. Fabrication, optimization, and performance of a novel double-skinned Al2O3. TiO2 ceramic nanocomposite membrane for forward osmosis application. Environ. Technol. Innov. 2021, 22, 101423. [Google Scholar] [CrossRef]
  32. Ajay, C.; Mohan, S.; Dinesha, P.; Rosen, M.A. Review of impact of nanoparticle additives on anaerobic digestion and methane generation. Fuel 2020, 277, 118234. [Google Scholar] [CrossRef]
  33. Ghofrani-Isfahani, H.; Baniamerian Tsapekos, P.; Alvarado-Morales, M.; Kasama, T.; Shahrokhi, M.; Vossoughi, M.; Angelidaki, I. Effect of metal oxide based TiO2 nanoparticles on anaerobic digestion process of lignocellulosic substrate. Energy 2020, 191, 116580. [Google Scholar] [CrossRef]
Figure 1. Schematic diagram of light-driven water-splitting with methanation CO2 reduction.
Bioengineering 09 00095 g001
Figure 2. Schematic presentation of the biophotocatalytic system.
Bioengineering 09 00095 g002
Figure 3. Weekly reduction of the COD and biogas produced by the BP system.
Bioengineering 09 00095 g003
Figure 4. Weekly biogas composition of the BP system.
Bioengineering 09 00095 g004
Figure 5. Diagnostic experimental plots against the modified RSM-BBD predicted results; (a) biogas, (b) COD, (c) color, and (d) turbidity. (The numbers on the diagonal line are the data points attained at a specific conditions of the experimental runs as inferred in Table 3).
Bioengineering 09 00095 g005
Figure 6. A diagnostic plot of the effect of catalyst load (2–4 g) on (a) biogas, (b) COD, (c) color, and (d) turbidity. The blue lines are the threshold or region of the response. The black is the trend line of the response. The whites and black circles are the level points of the response, whereas the red shows the high levels point.
Bioengineering 09 00095 g006
Figure 7. A diagnostic plot of the effect of HRT (1–31 d) on (a) biogas, (b) COD, (c) color, and (d) turbidity. The blue lines are the threshold or region of the response. The black is the trend line of the response. The whites and black circles are the level points of the response, whereas the red shows the high levels point.
Bioengineering 09 00095 g007
Figure 8. Three-dimensional (3D) plots of (a) biogas, (b) COD, (c) color and (d) turbidity.
Bioengineering 09 00095 g008
Figure 9. Selected numerical optimized condition ramp plots.
Bioengineering 09 00095 g009
Table 1. Wastewater characteristics and analytical technique.
Water Quality Value Analytical Units
pH7.42 ± 2.3Hanna pH/EC/TDS Tester (H198130)
Temperature (°C)26.42 ± 3.6Hanna pH/EC/TDS Tester (H198130)
Color (abs 465 nm, Pt. Co)570.23 ± 12HACH Spectrophotometer (DR3900)
Turbidity (NTU)732.32 ± 14Turbidity meter (HACH 2100N)
Chemical oxygen demand (mg COD/L) 2380.32 ± 14HACH Spectrophotometer (DR3900)
Ammonia (mg NH3/L)0.74 ± 0.4HACH Spectrophotometer (DR3900)
Total Kjeldahl nitrogen (mg TKN/L)30.52 ± 1.4HACH Spectrophotometer (DR3900)
Nitrate (mg NO3/L)0.64 ± 0.5HACH Spectrophotometer (DR3900)
Total nitrogen (mg TN/L)31.88 ± 7.8HACH Spectrophotometer (DR3900)
Total suspended solids (mgTS/L)304.53 ± 15.6Analytical balance (HCB602H 22 ADAM)
Volatile solids (mg VS/L)229.52 ± 25Analytical balance (HCB602H 22 ADAM)
Ratio (%VS/TS)75.37
Table 2. Box- Benhken design matrix.
Symbol Factor Name Unit TypeLow MiddleHigh
Coded level −101
ACatalyst loadgFactor246
BHRT dFactor11631
Table 3. Results of a modified RSM-BBD experiment and model predictions.
Factor 1Factor 2Experimental ResultsRSM-BBD Model Predicted Results
RunA:Catalyst Load (g)B:HRT (d)Biogas (mL/d)COD (%)Color (%)Turbidity (%)Biogas (mL/d)COD (%)Color (%)Turbidity (%)
1216135959496.6130.694.994.396.7
2616300969798.2303.496.497.398.3
3216125959496.6130.694.994.396.7
461335949597.2327.493.895.597.4
5431275979798.1272.897.097.398.3
6231145949597.1148.694.594.596.8
741275969697.6278.894.795.397.3
8431275989798.1272.897.097.398.3
9616300979898.7303.496.497.398.3
10416275979898.6267.096.696.997.6
11631296959697.7296.995.596.097.7
1241270939597.1278.894.795.397.3
1321135929195.1130.191.891.095.1
Table 4. A modified RSM-BBD. model analysis of variance (ANOVA).
Response Source Sum of SquaresdfF-Valuep-ValueR2Adeq Precision
Biogas (Y1)Model69,092.955289.5<0.00010.995242.025
A-Catalyst59,685.1211250.42<0.0001
B-HRT7211.510.2591
AB600.25112.580.0094
A270001146.65<0.0001
B2214.3814.490.0718
Residual334.137
COD(Y2)Model29.57520.480.00050.936016.0298
A-Catalyst4.5117.650.0040
B-HRT10.12125.000.0016
AB0.2510.64490.4483
A210.8149.410.0002
B28.23125.780.0014
Residual7.27
Color (Y3)Model43.04529.60.00010.954818.8142
A-Catalyst18161.890.0001
B-HRT8127.510.0012
AB2.2517.740.0272
A212.01141.310.0004
B26.91123.780.0018
Residual2.047
Turbidity (Y4)Model11.4531.360.00010.957319.0872
A-Catalyst5.15170.86<0.0001
B-HRT2127.510.0012
AB0.562517.740.0272
A22.99141.110.0004
B21.73123.780.0018
Residual0.50897
Table 5. Modified RSM-BBD optimum conditions experimental validation.
ResponsePredicted Observed* Std Dev* SE Mean
Biogas (mL/d)2672506.954.53
COD (%)98951.010.67
Color (%)98960.530.38
Turbidity (%)99971.871.67
* Std Dev—Standard deviation, SE—standard error.
Table 6. Comparing previous and current studies.
Waste TypeProcess Operating Condition Efficiency Reference
Blast furnace sludge (BFS) with a Fe-rich residue, as a catalystA Laboratory scale differential reactorTemperature of 300–350 °C, 1 atm, and variable partial pressures of H2 (10–50 kPa) and CO (0.25–3.0 kPa)The methane production and selectivity achieved were 2.63 μmolCH4/gcat/min and 49.5% [22]
Municipality wastewater seeded with 2 g of Fe2O4-TiO2 MNPsBiochemical Methane Potential (BMP) TestTemperature 40 °C for 30 daysbiogas production (400 mL/day) and methane yield (100% CH4) [24]
Municipality wastewater Biochemical Methane Potential (BMP) TestTemperature 40 °C for 30 daysBiogas production (350 mL/day) and methane yield (65% CH4).[24]
Distillery wastewater Integrated anaerobic -photocatalysis Organic load rate (OLR) of 3 kg COD/m3.d) and hydraulic retention time (HRT) of 20 days 98% COD, 50% color, bioenergy of 180.5 kWh/m3[25]
Lignocellulosic materialsAnaerobic digestion 0.252 mg of NiO–TiO2/g total solids (TS) and HRT of 4 daysSoluble chemical oxygen demand (COD) and 67% increase in volatile fatty acids (VFAs)[33]
Municipality wastewater seeded with Fe-TiO2 Biophotocatalytic system 4 g catalyst load and HRT of 21 d267 mL/d of biogas, 97.75% COD, 98% color and 99% turbidityThis study
Publisher’s Note: MDPI stays neutral with regard to jurisdictional claims in published maps and institutional affiliations.

