Biomechanical Behavior of a Variable Angle Locked Tibiotalocalcaneal Construct


Abstract
:1. Introduction
2. Materials and Methods
2.1. Material Conformity
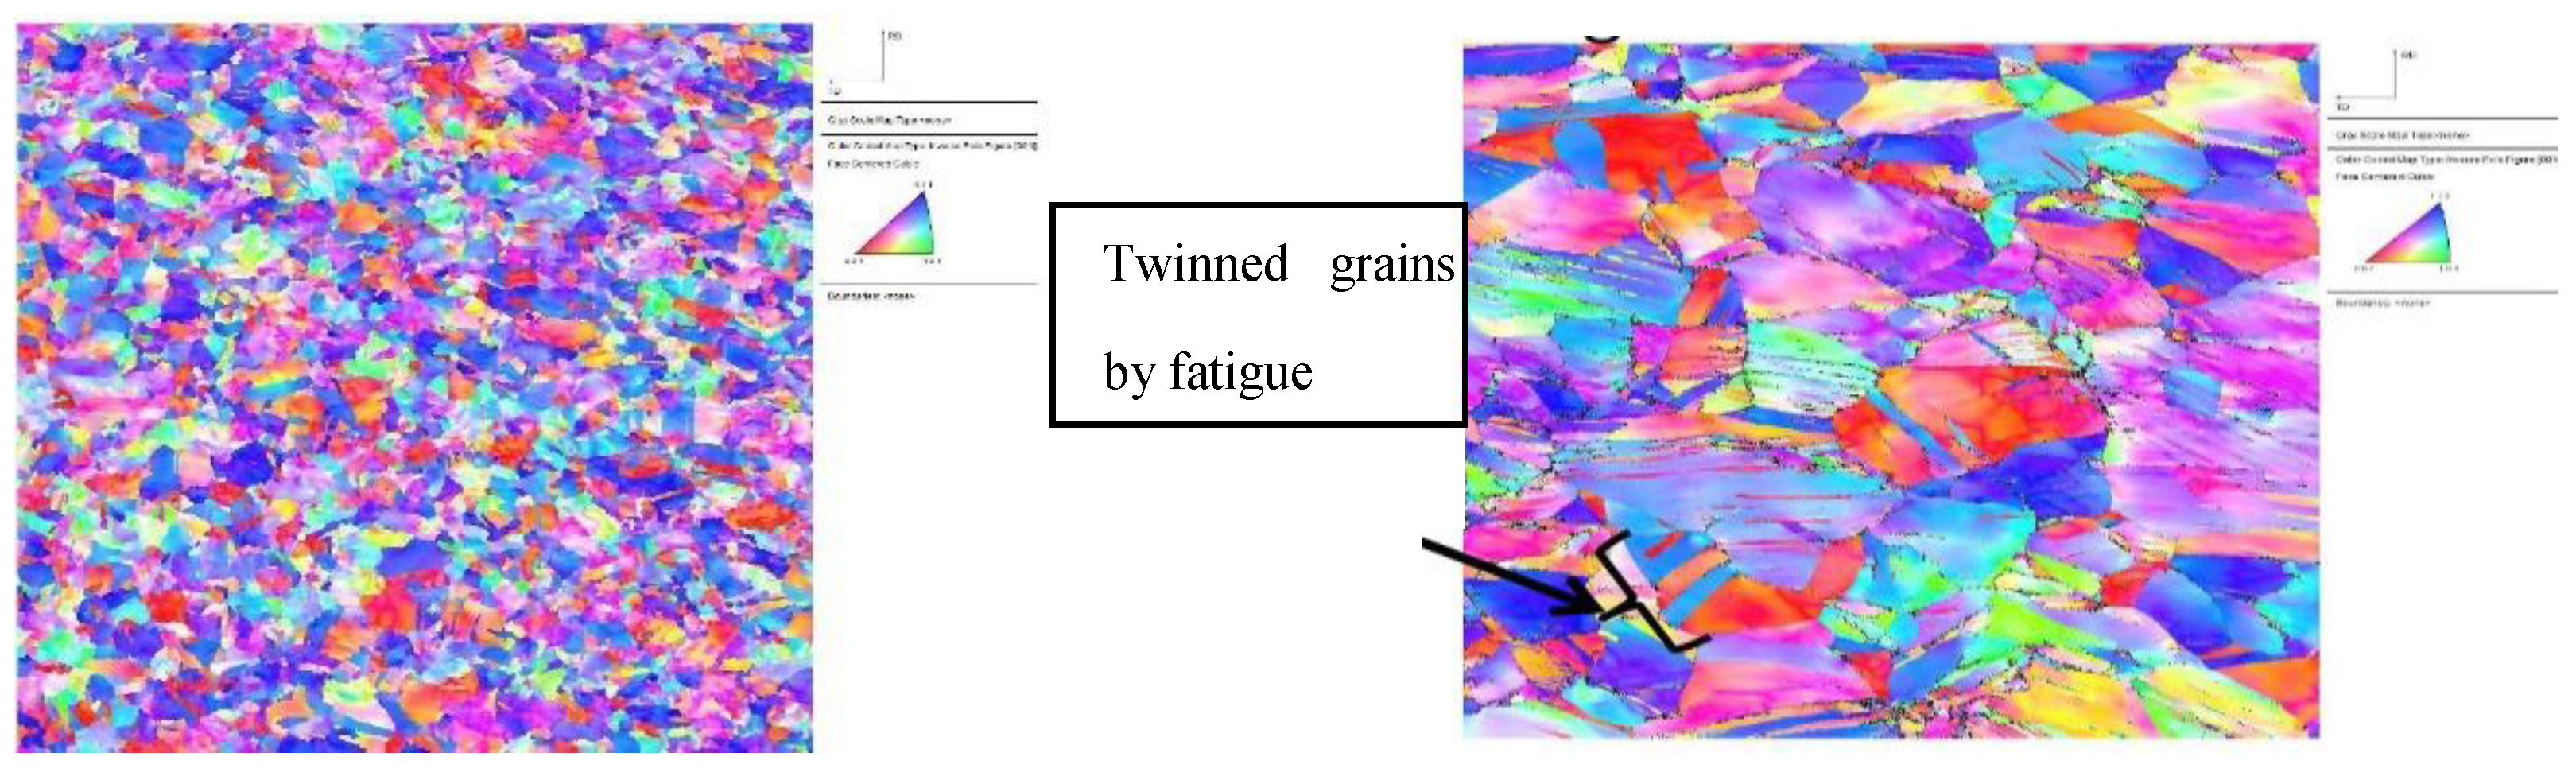
2.2. Microstructure Characterization
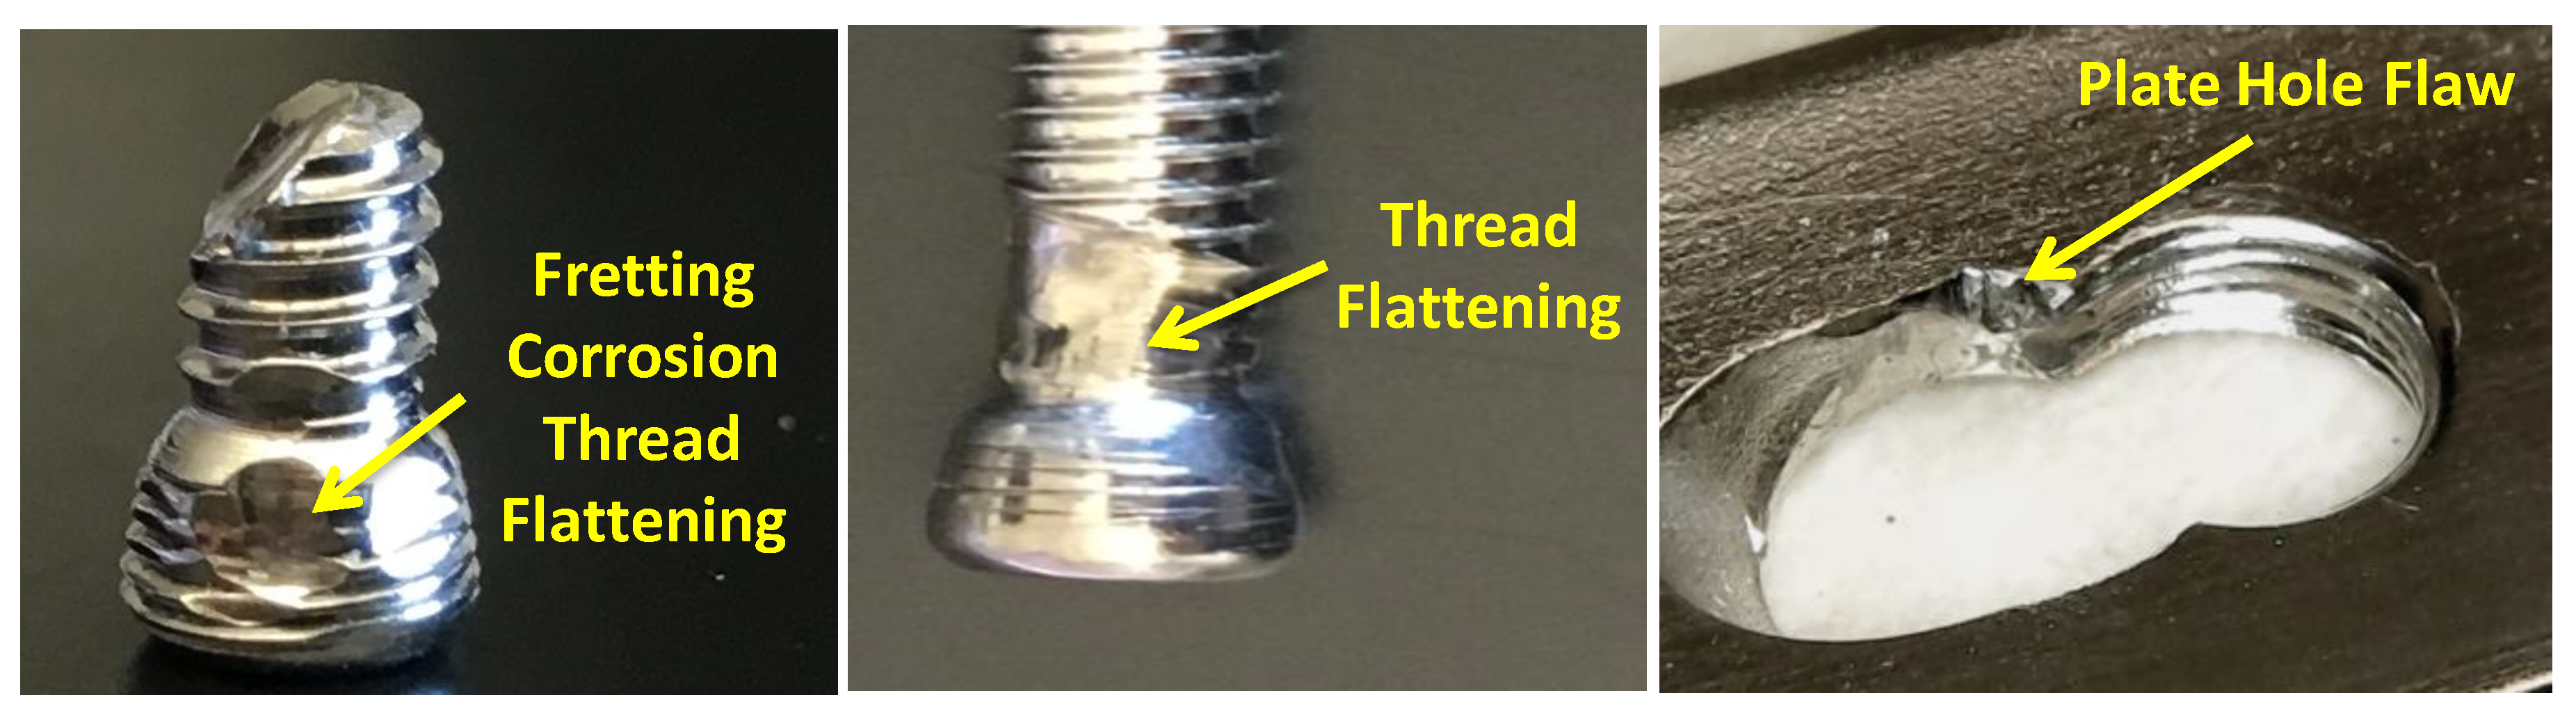
2.3. Device Failure Analysis Strategy
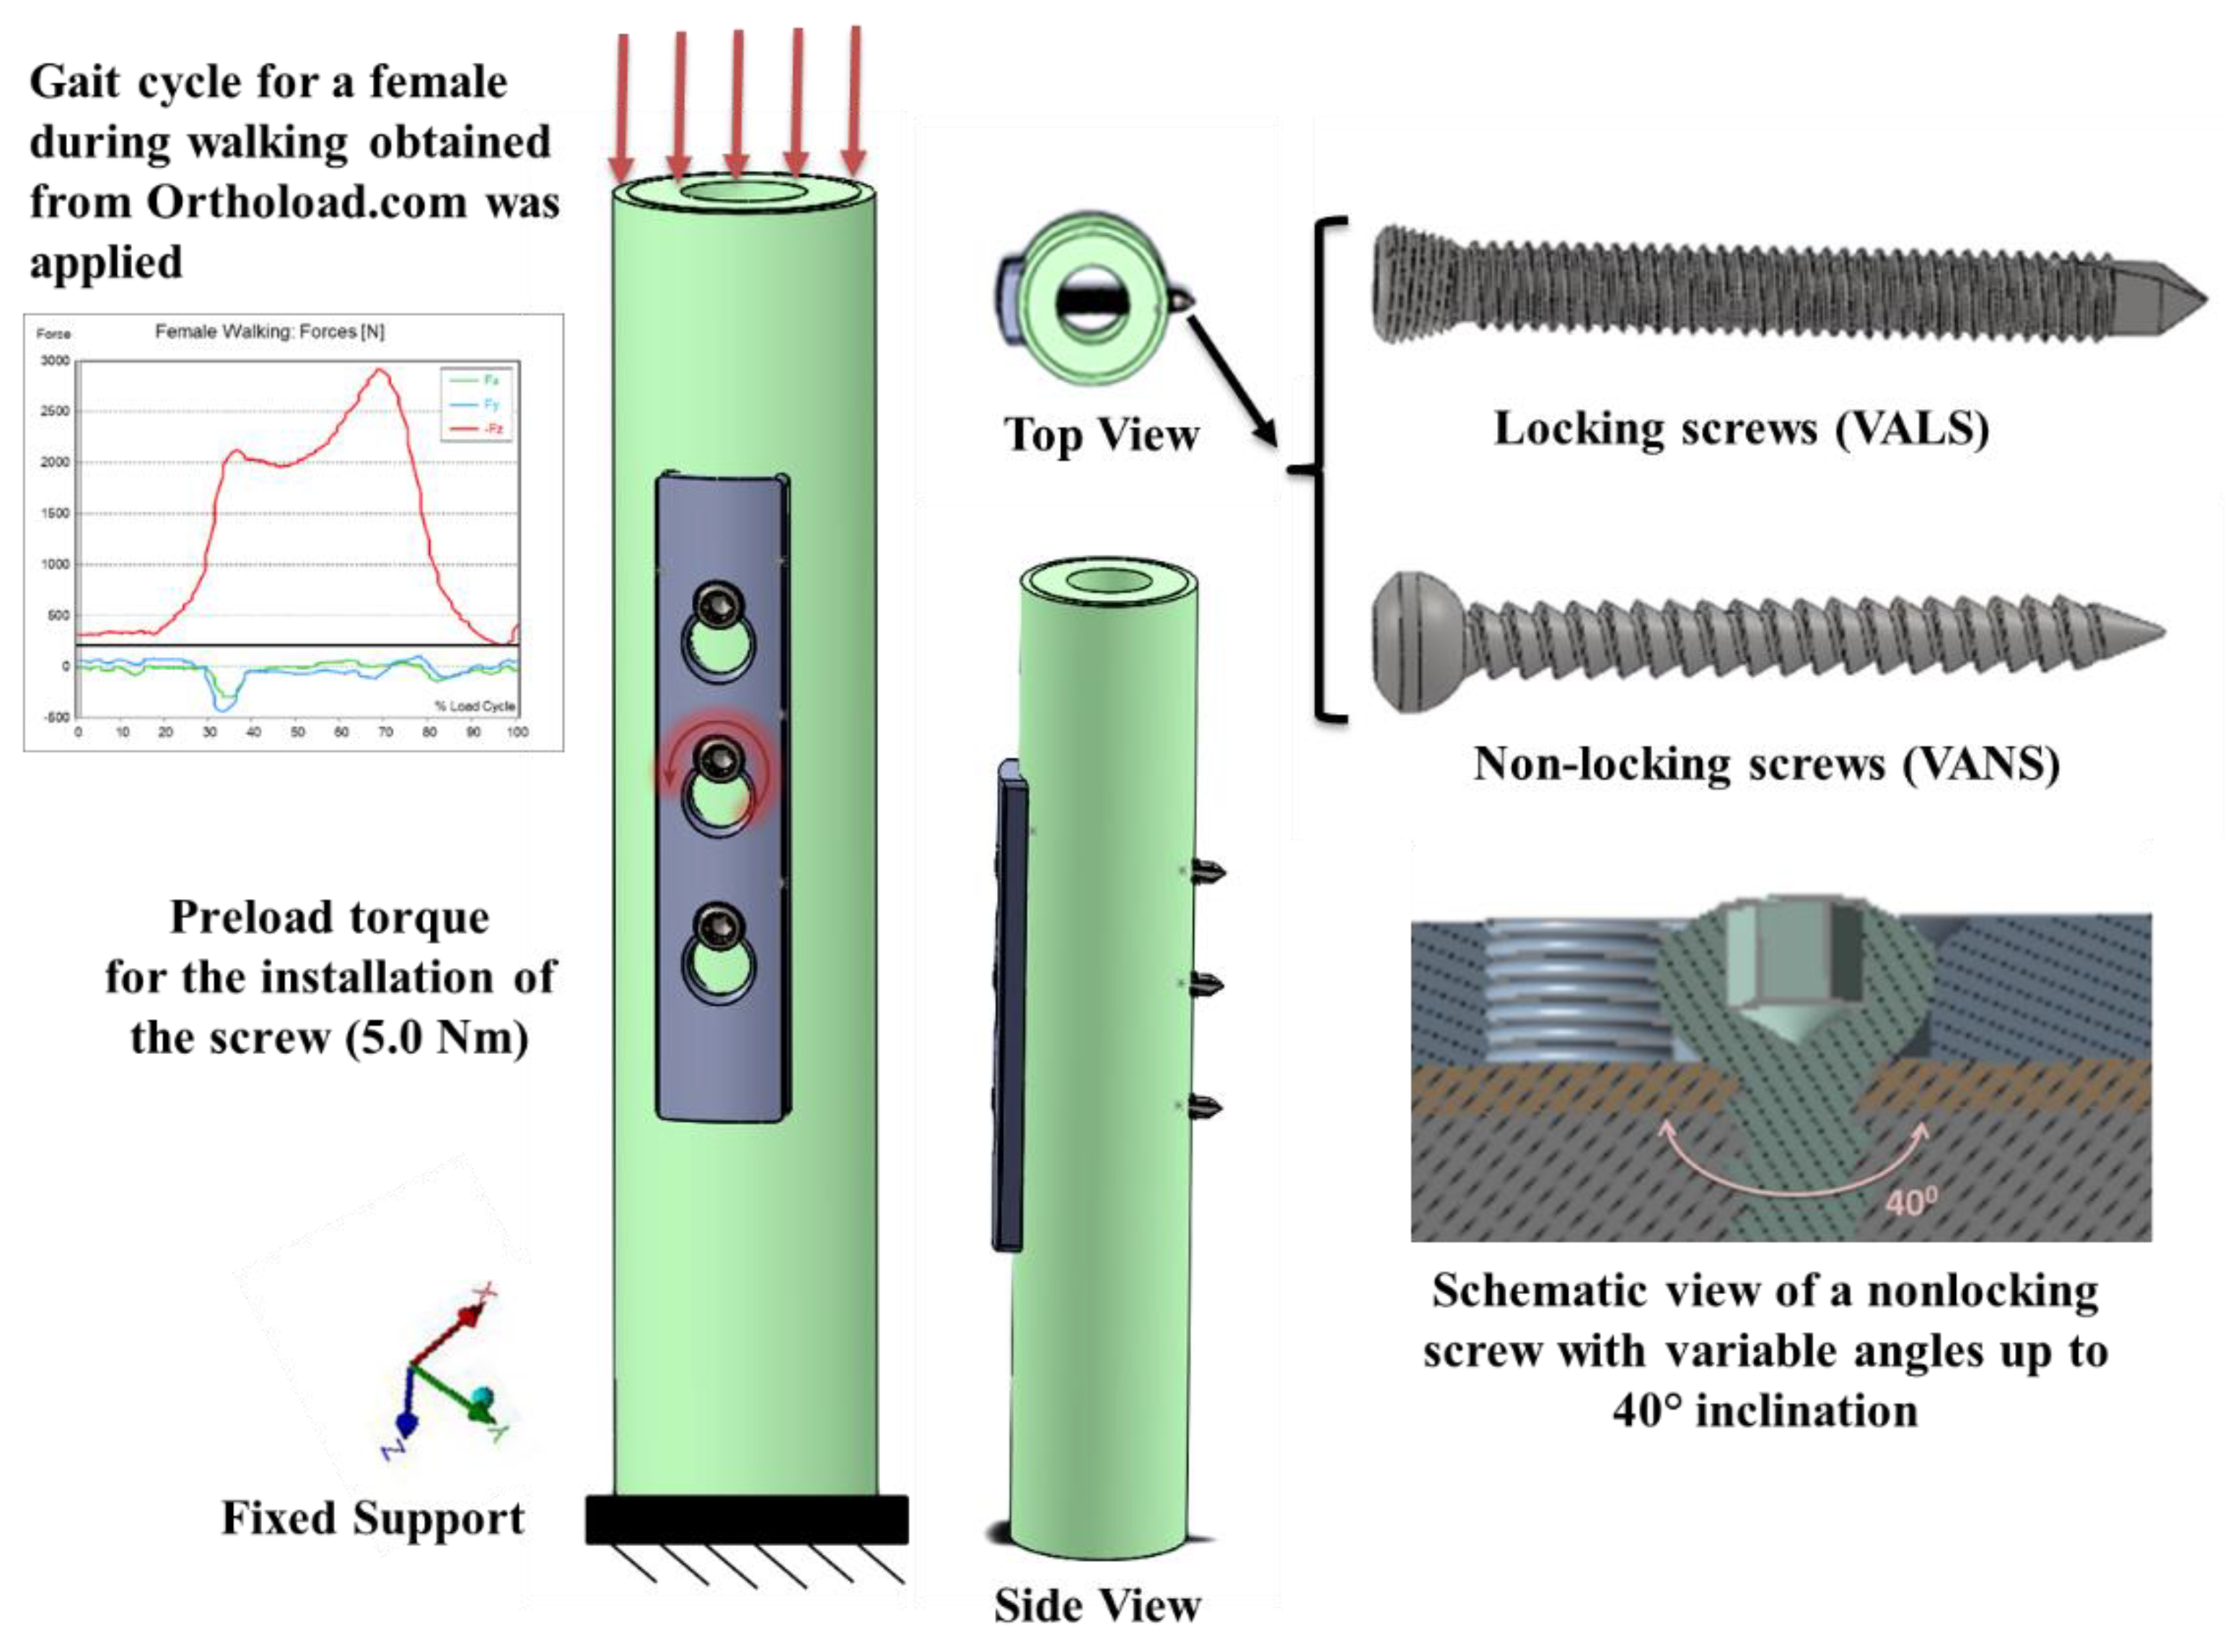
2.4. Computational Modeling of Failure Mechanisms
2.4.1. Simulation of Fatigue Failure
2.4.2. Modeling of Variable Angle Screws
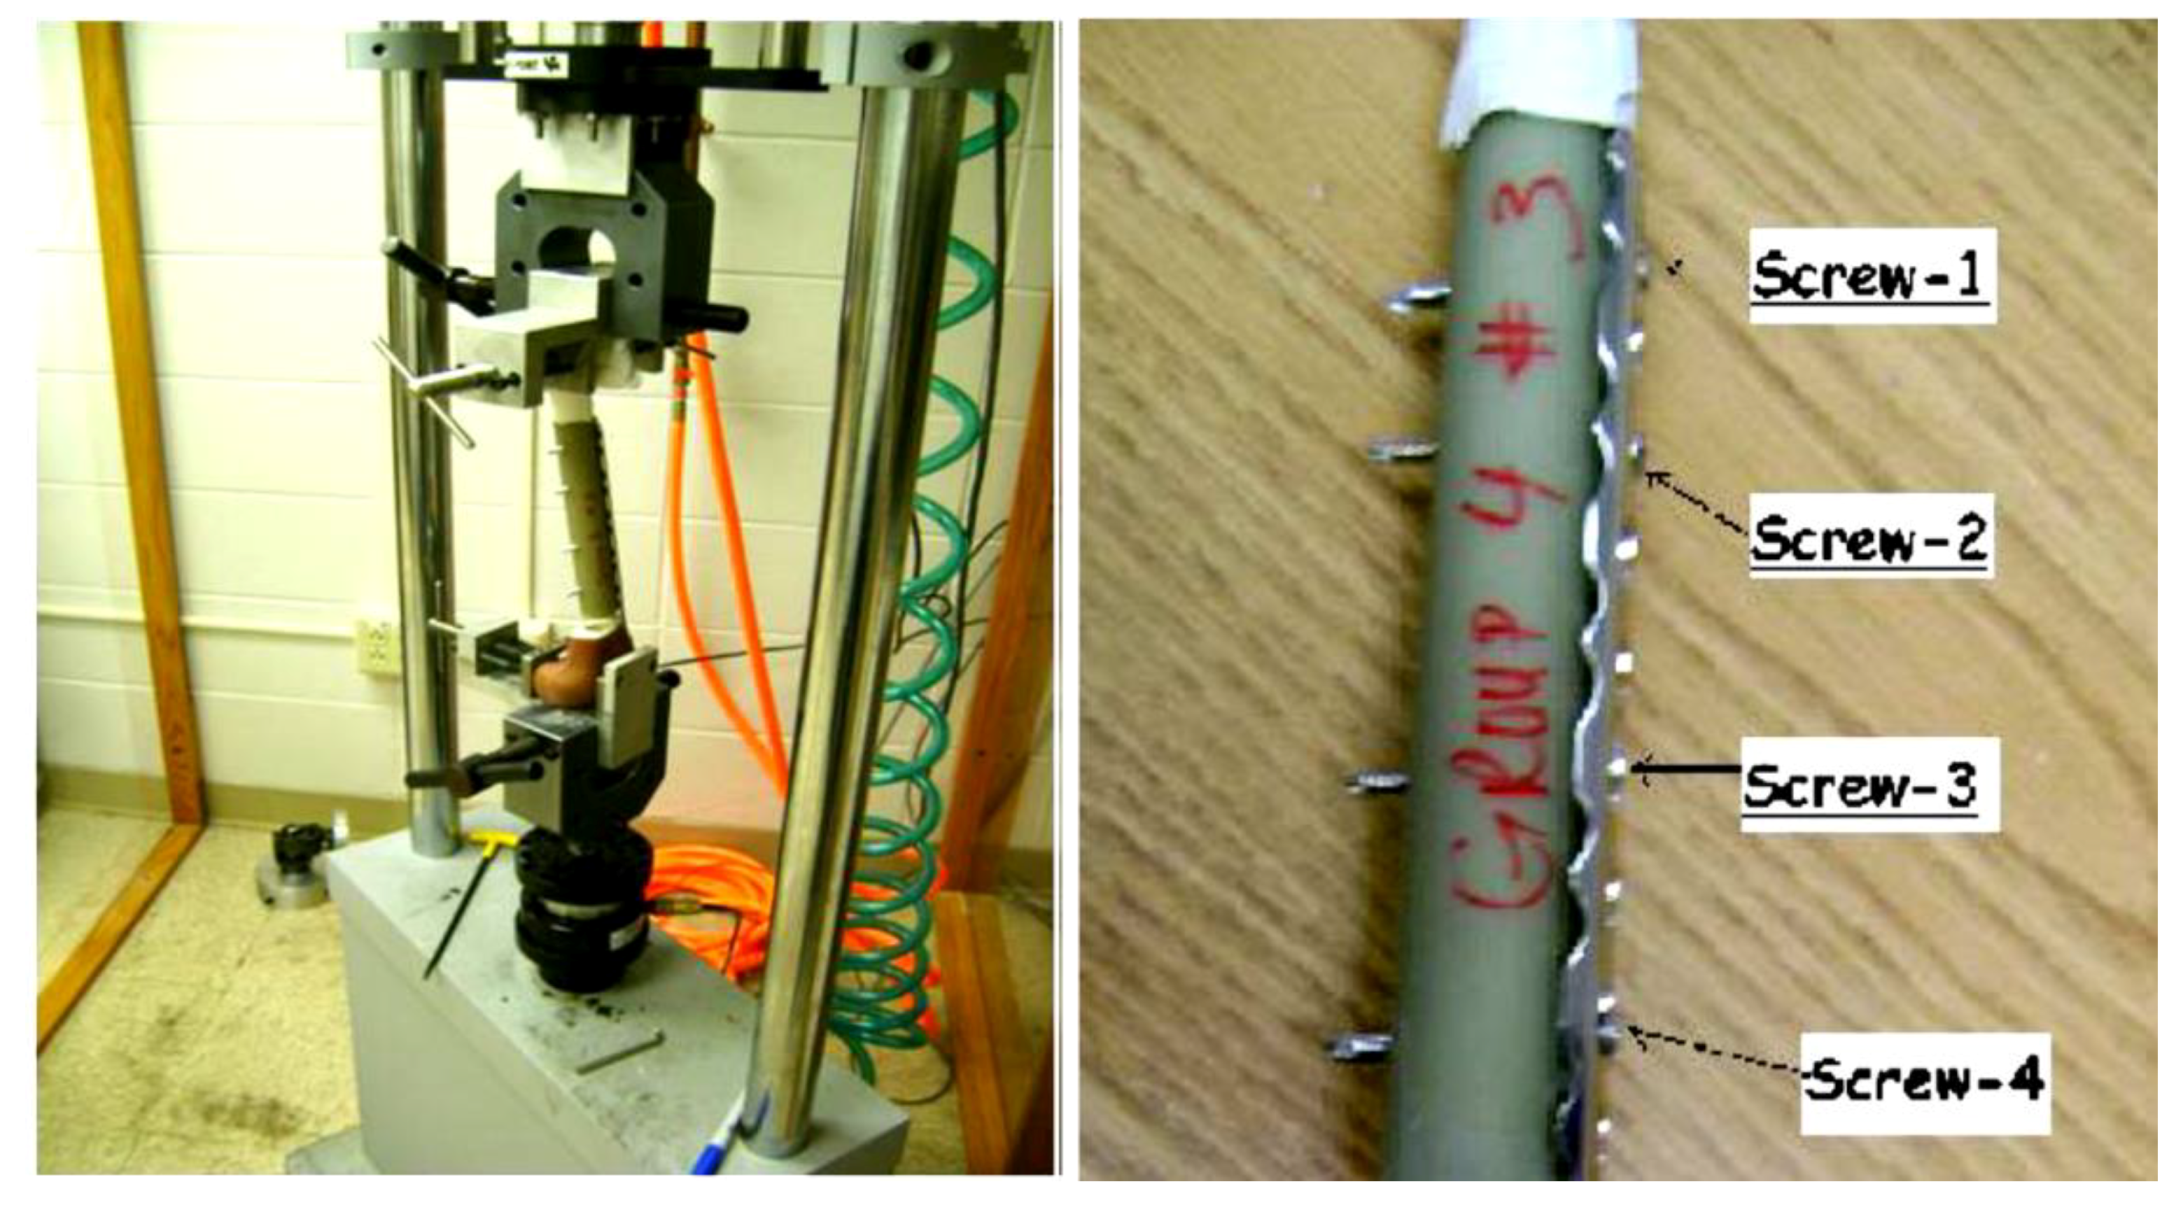
2.4.3. Comparison with Experimental Work.
3. Results
3.1. Material Conformity
3.2. Microstructure Characterization
3.3. Device Failure Analysis Strategy
3.4. Computational Modeling of Failure Mechanisms
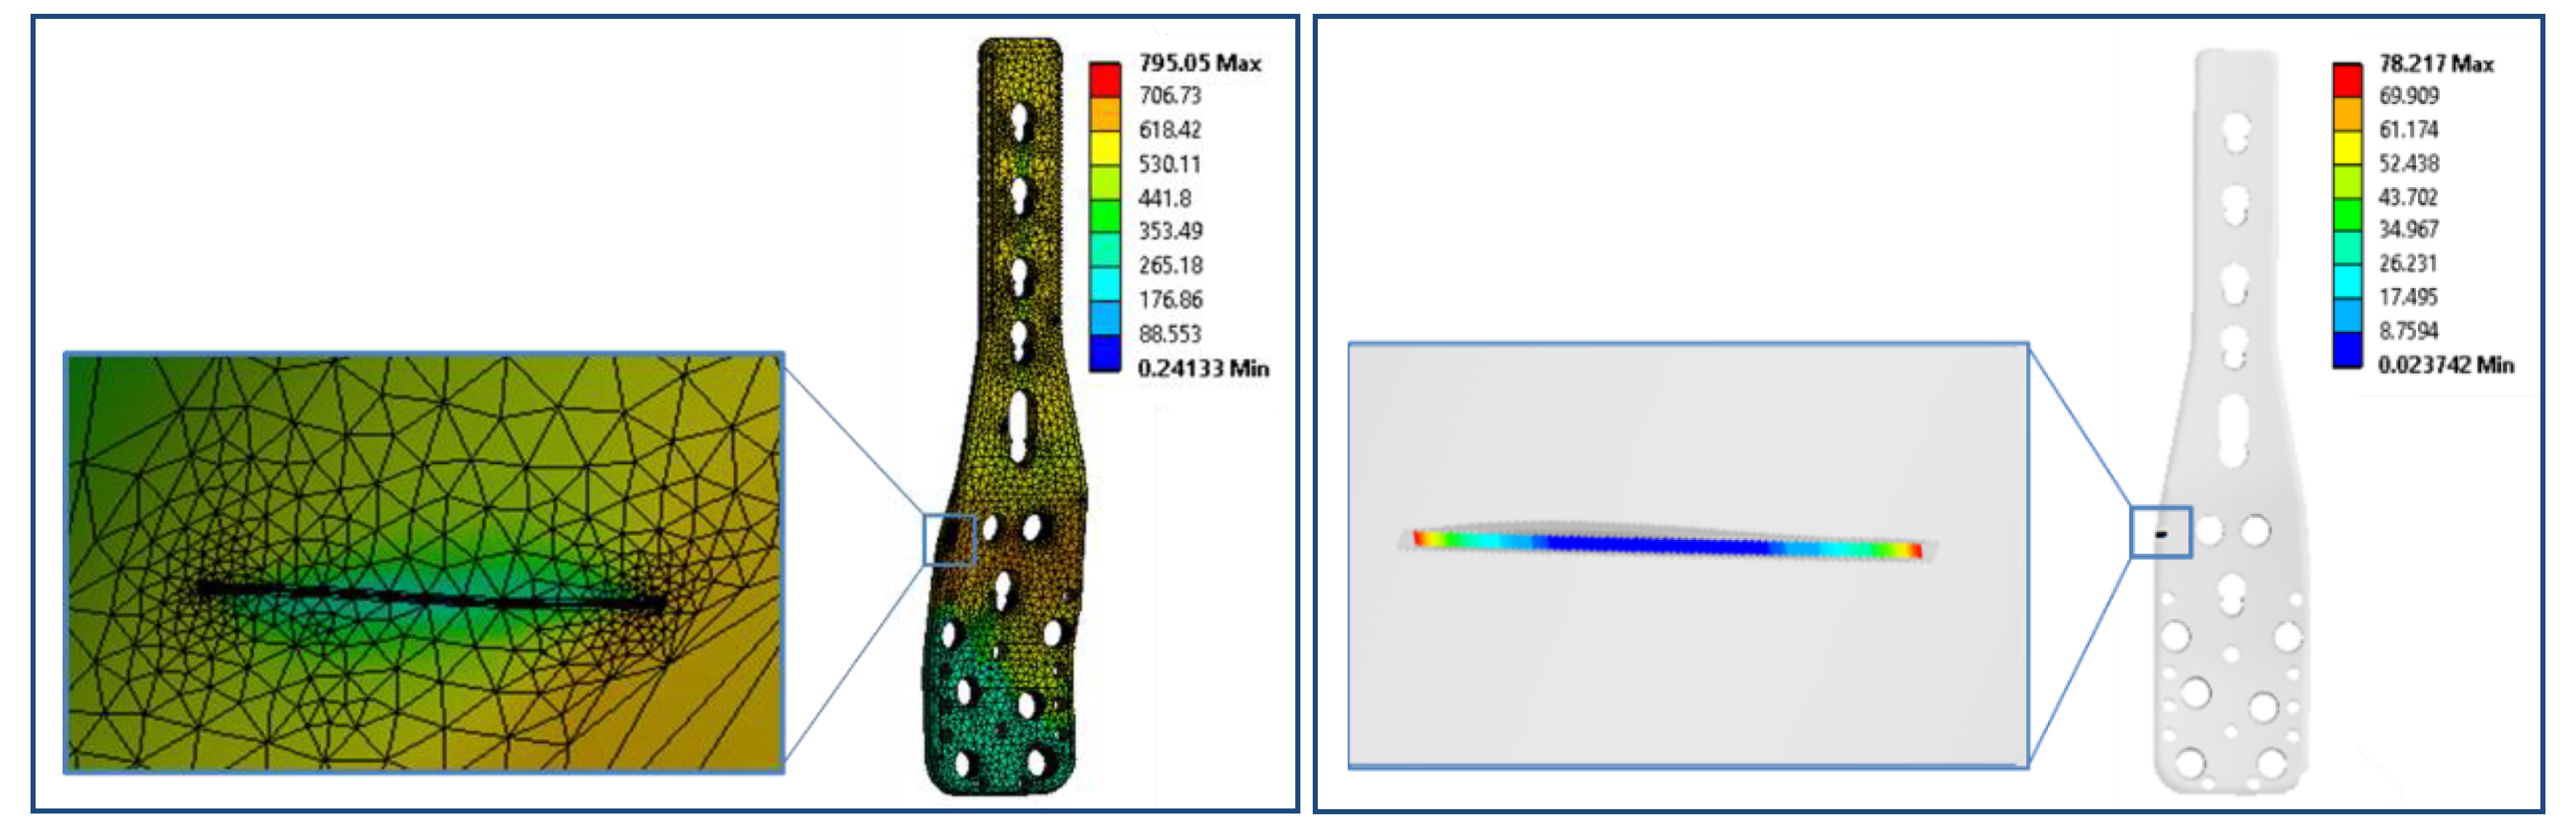
3.4.1. Simulation of Fatigue Failure
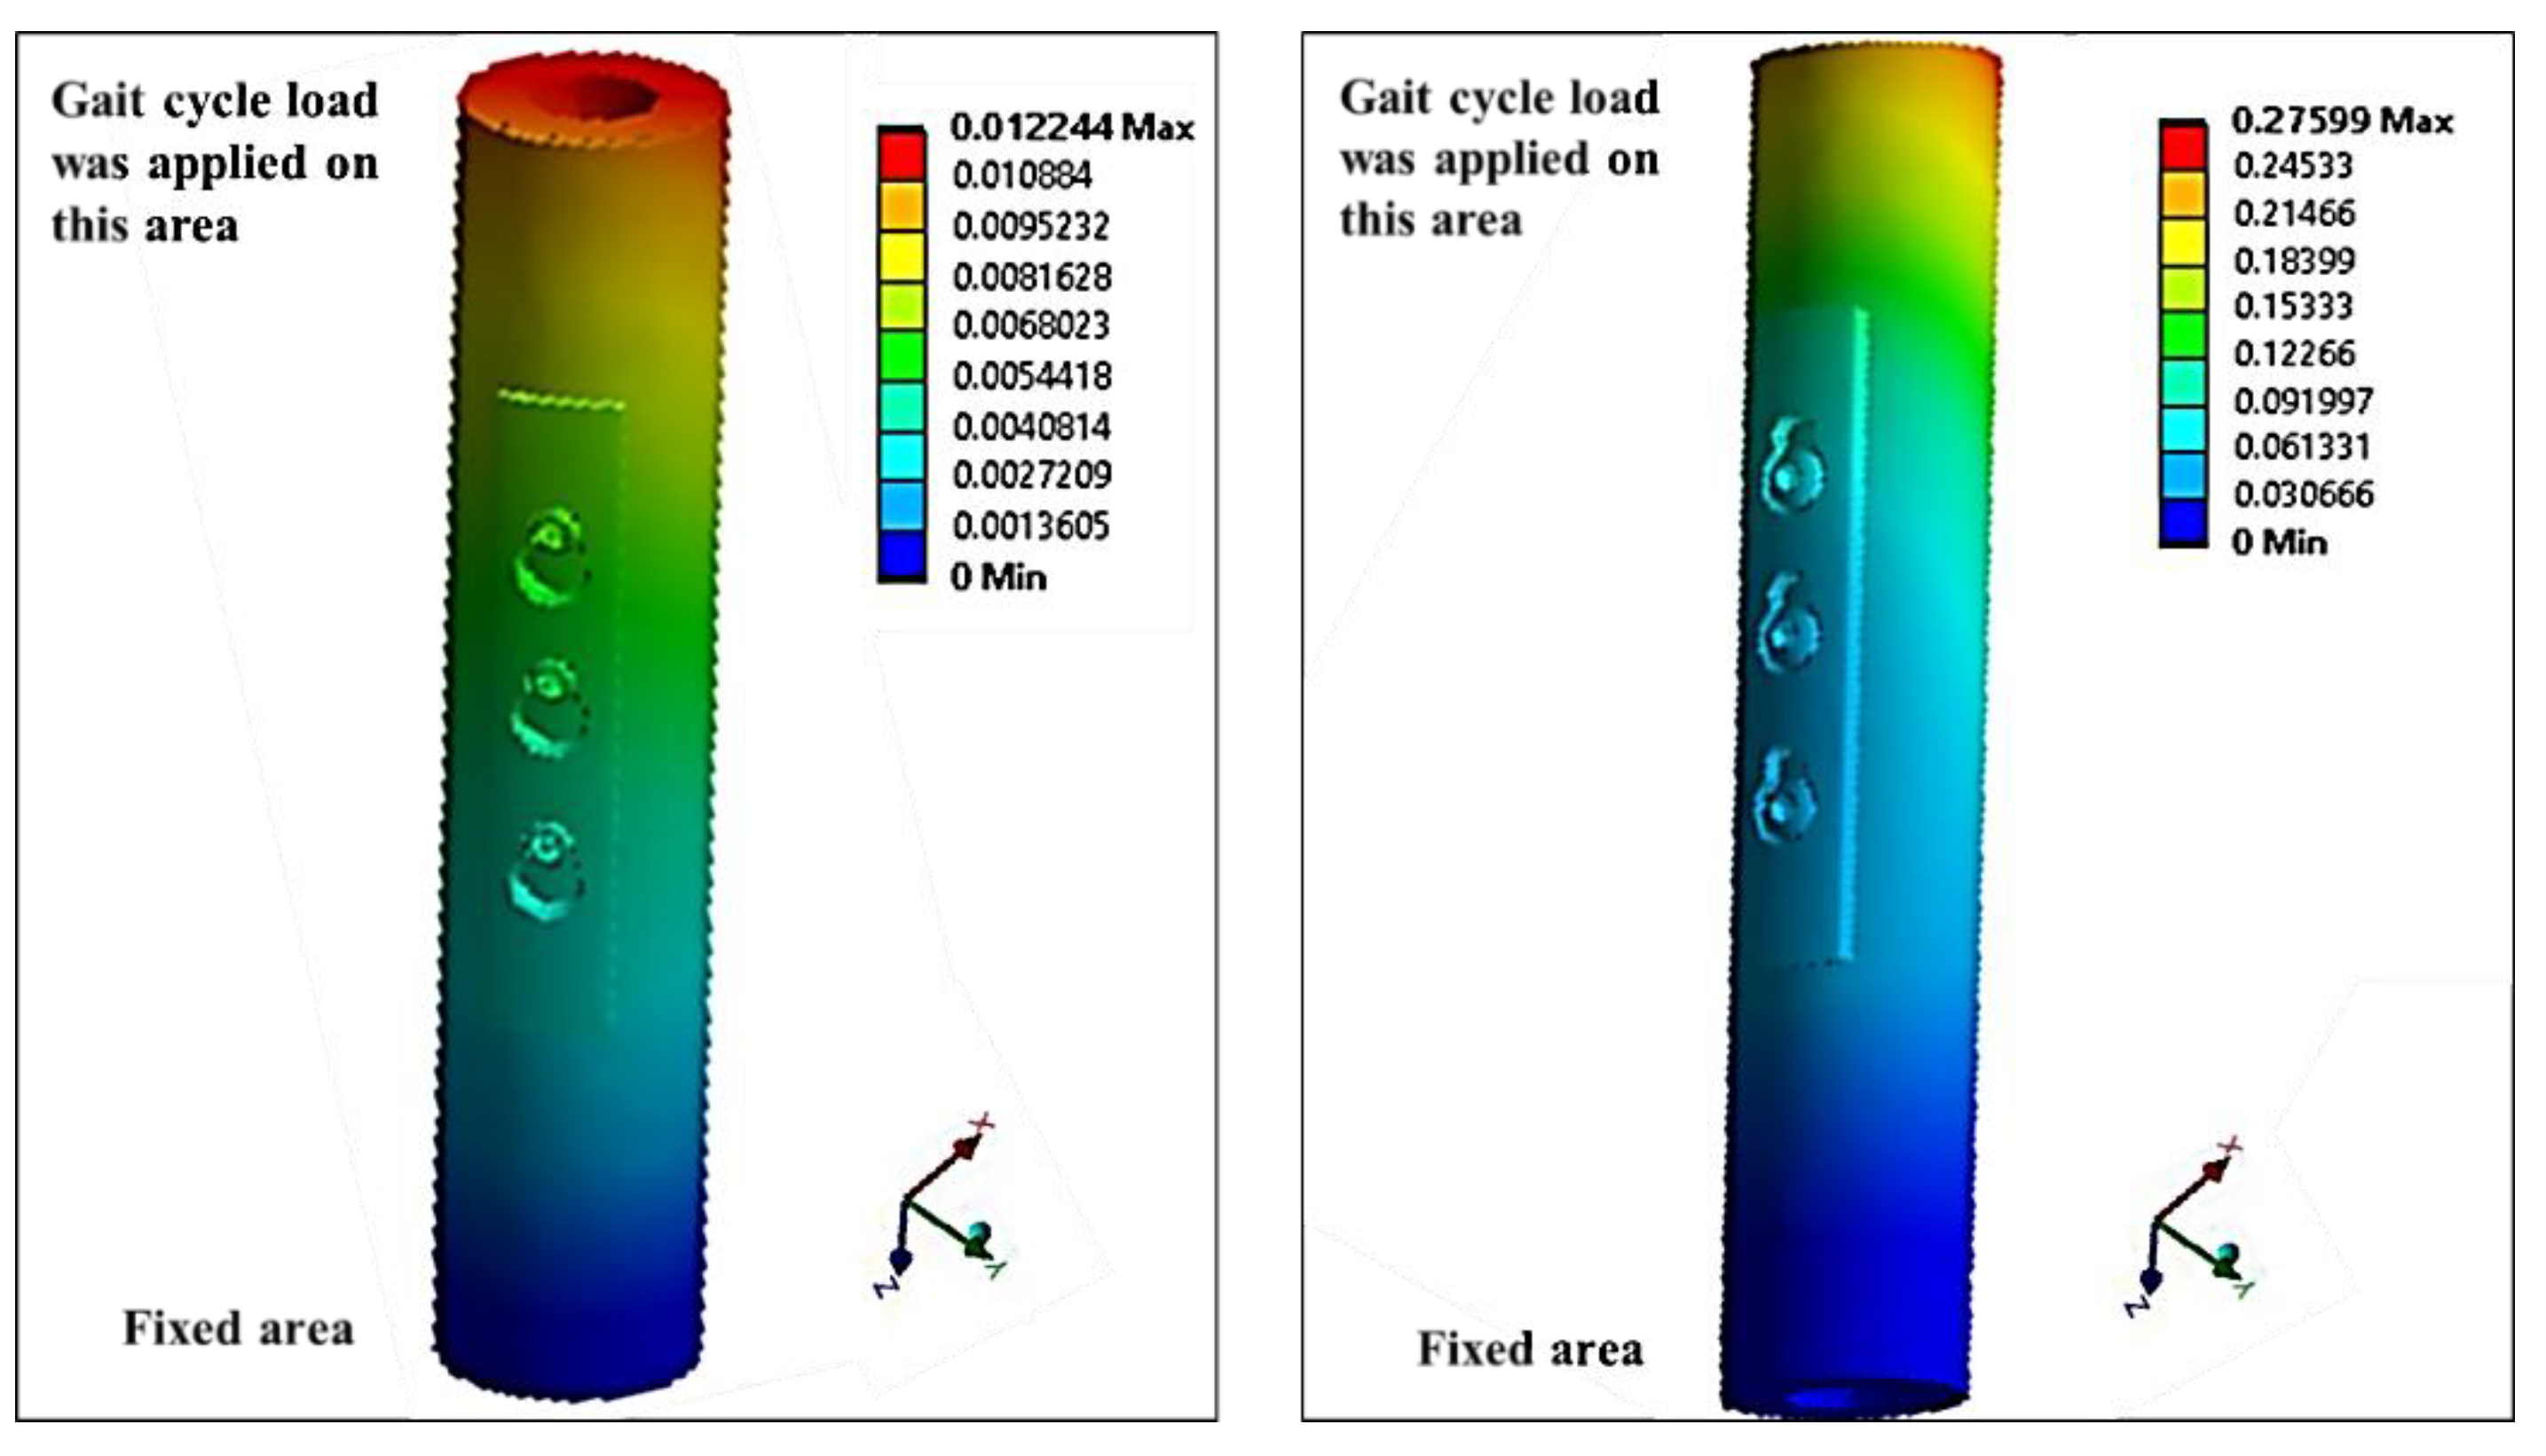
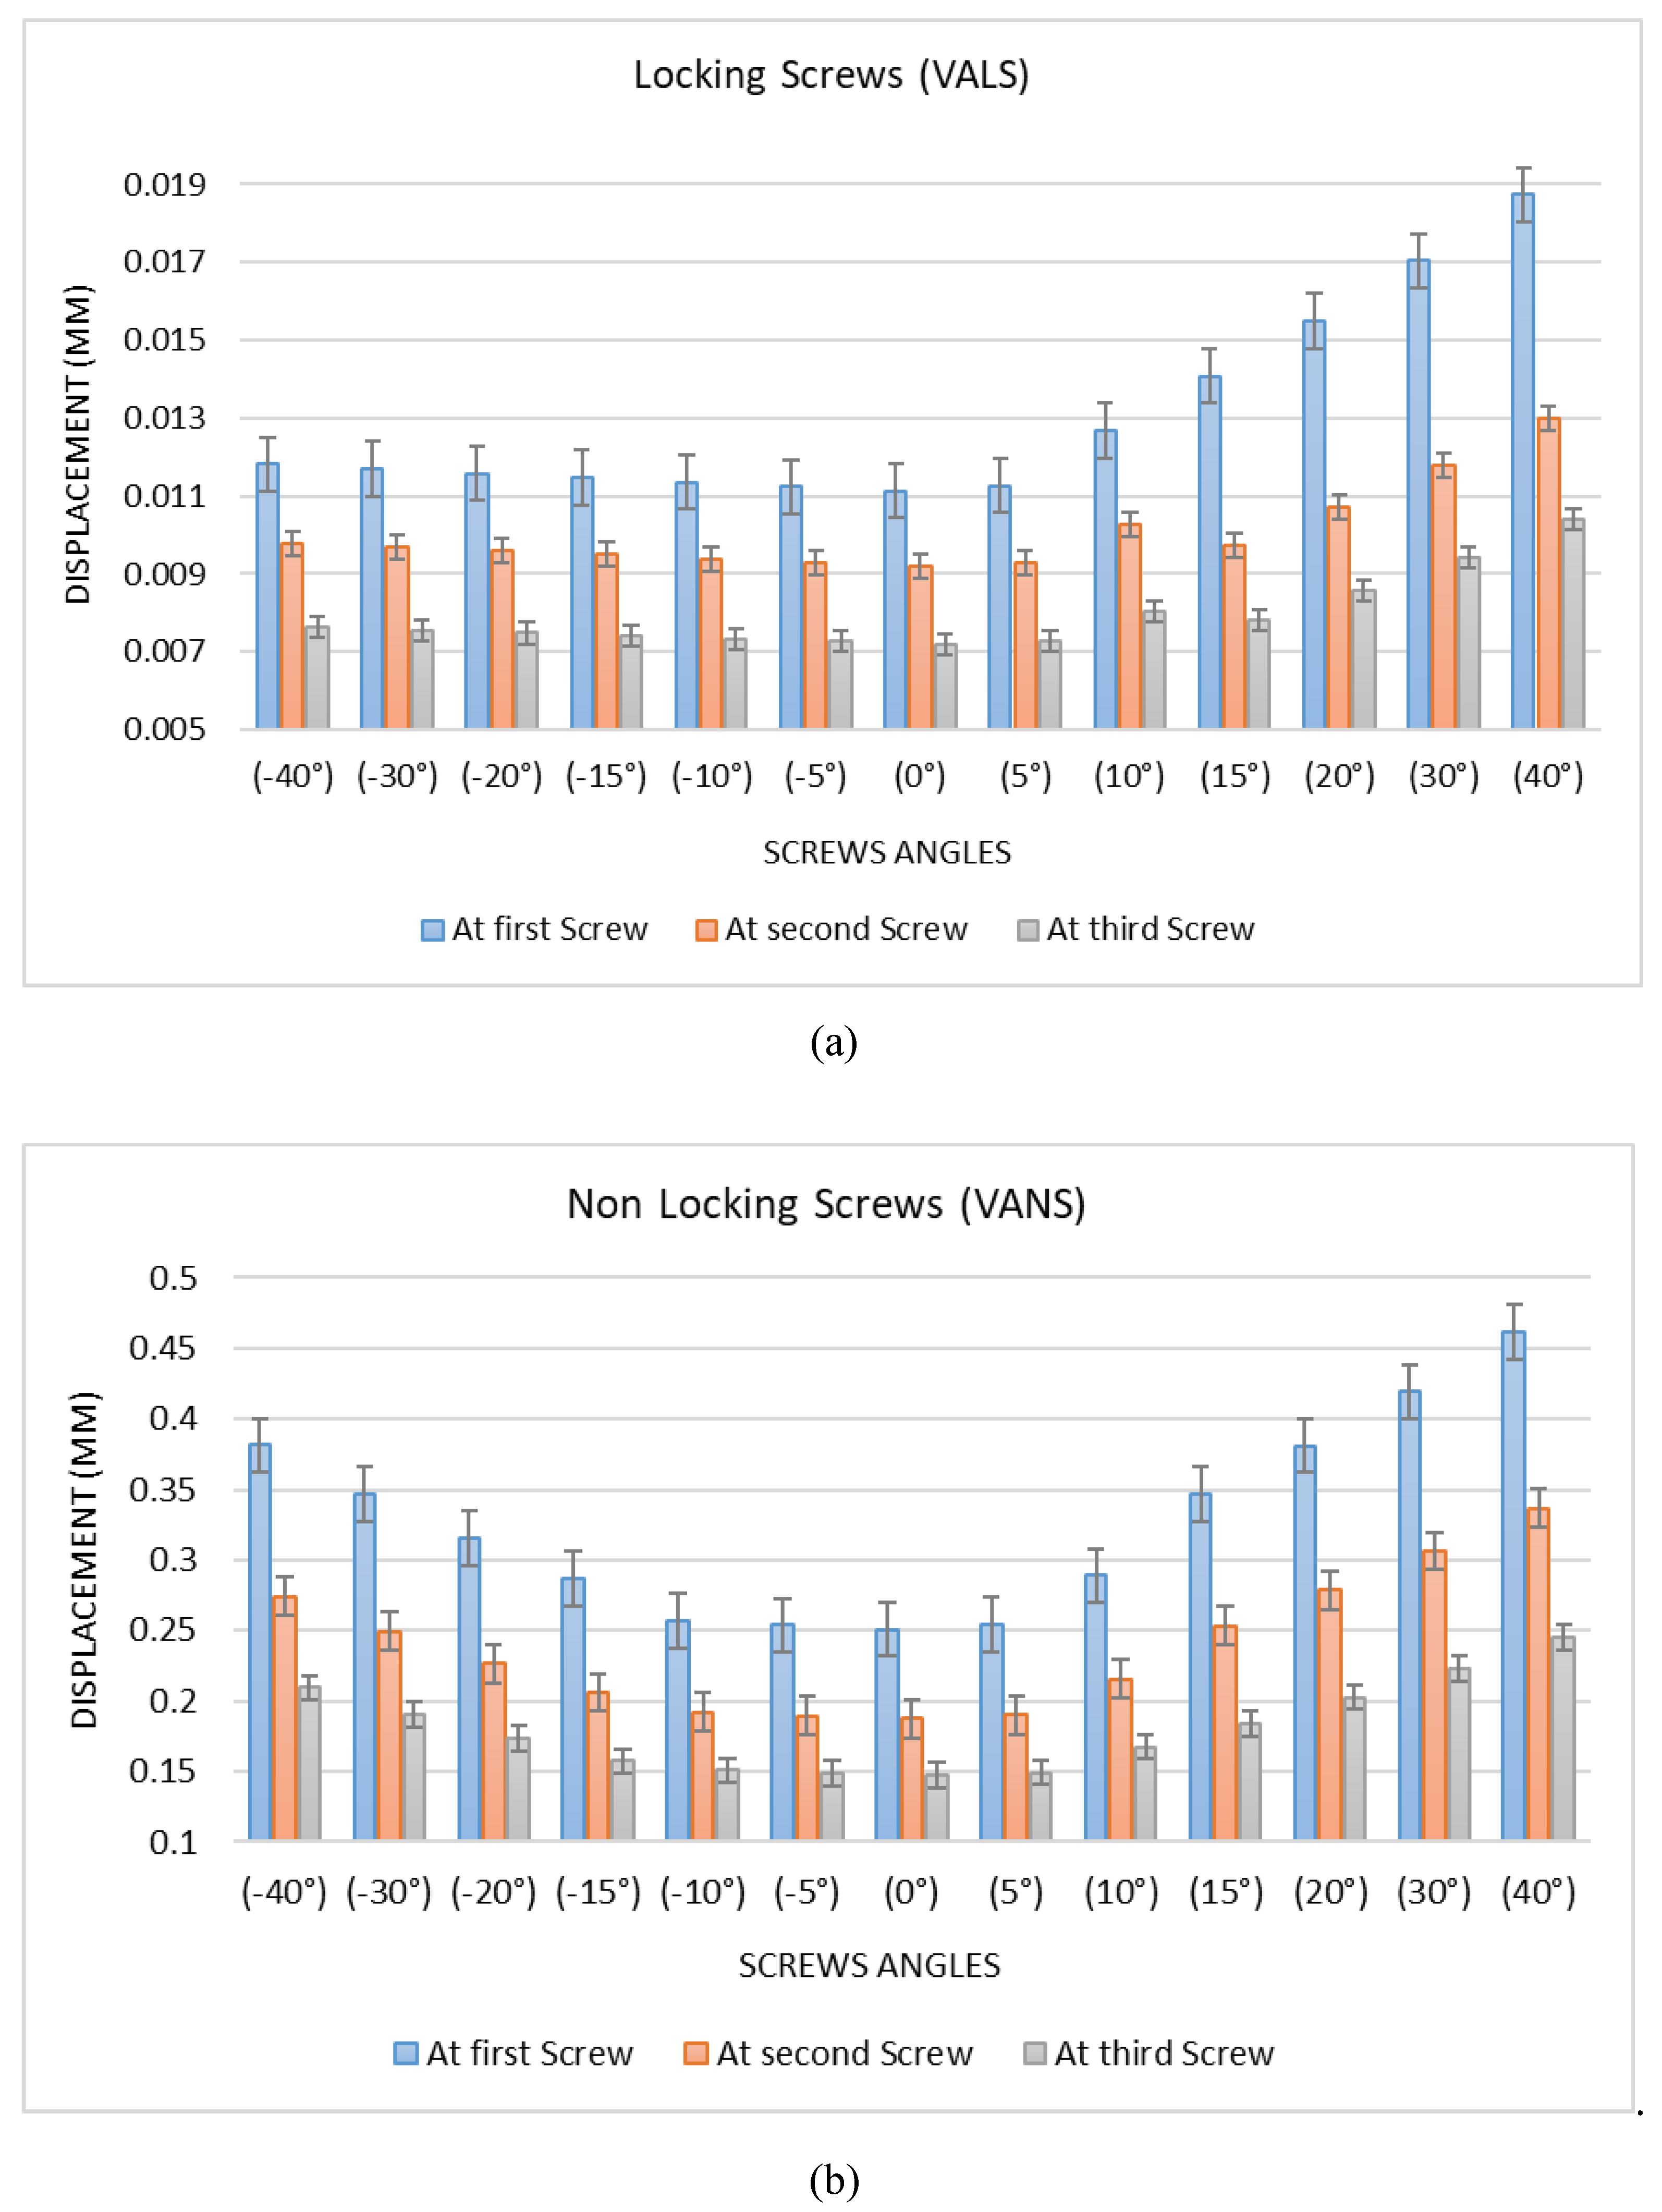
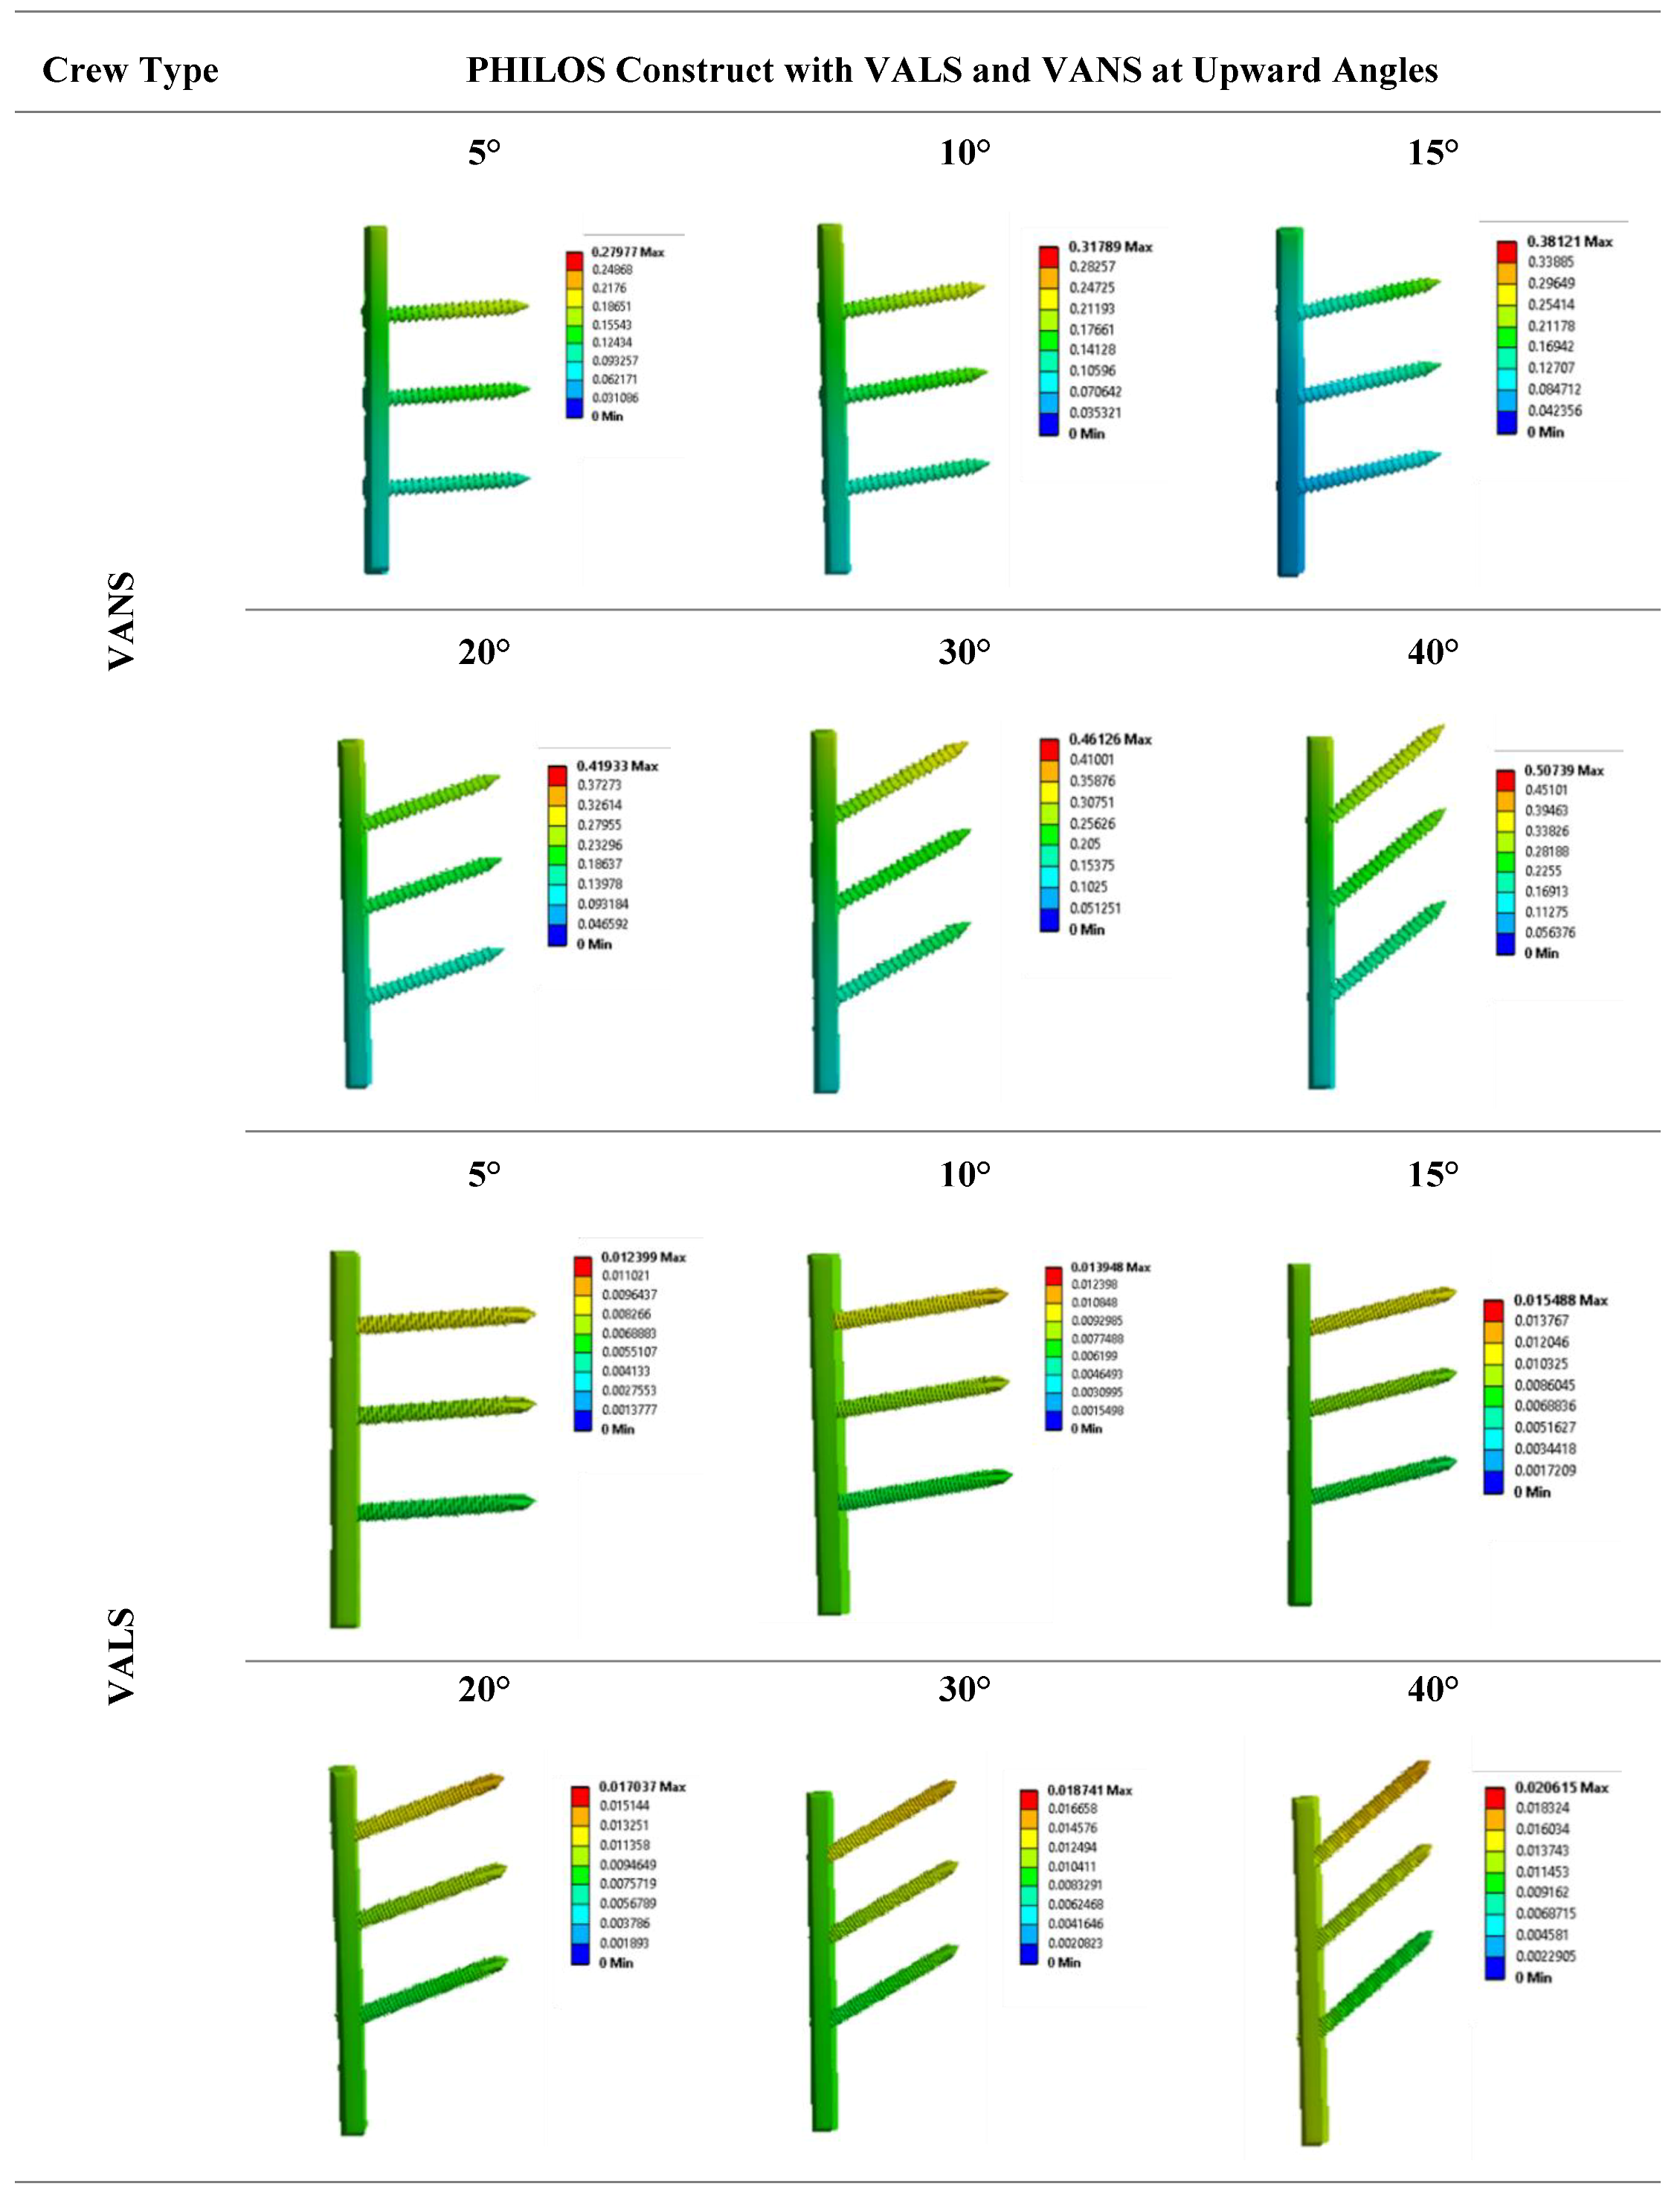
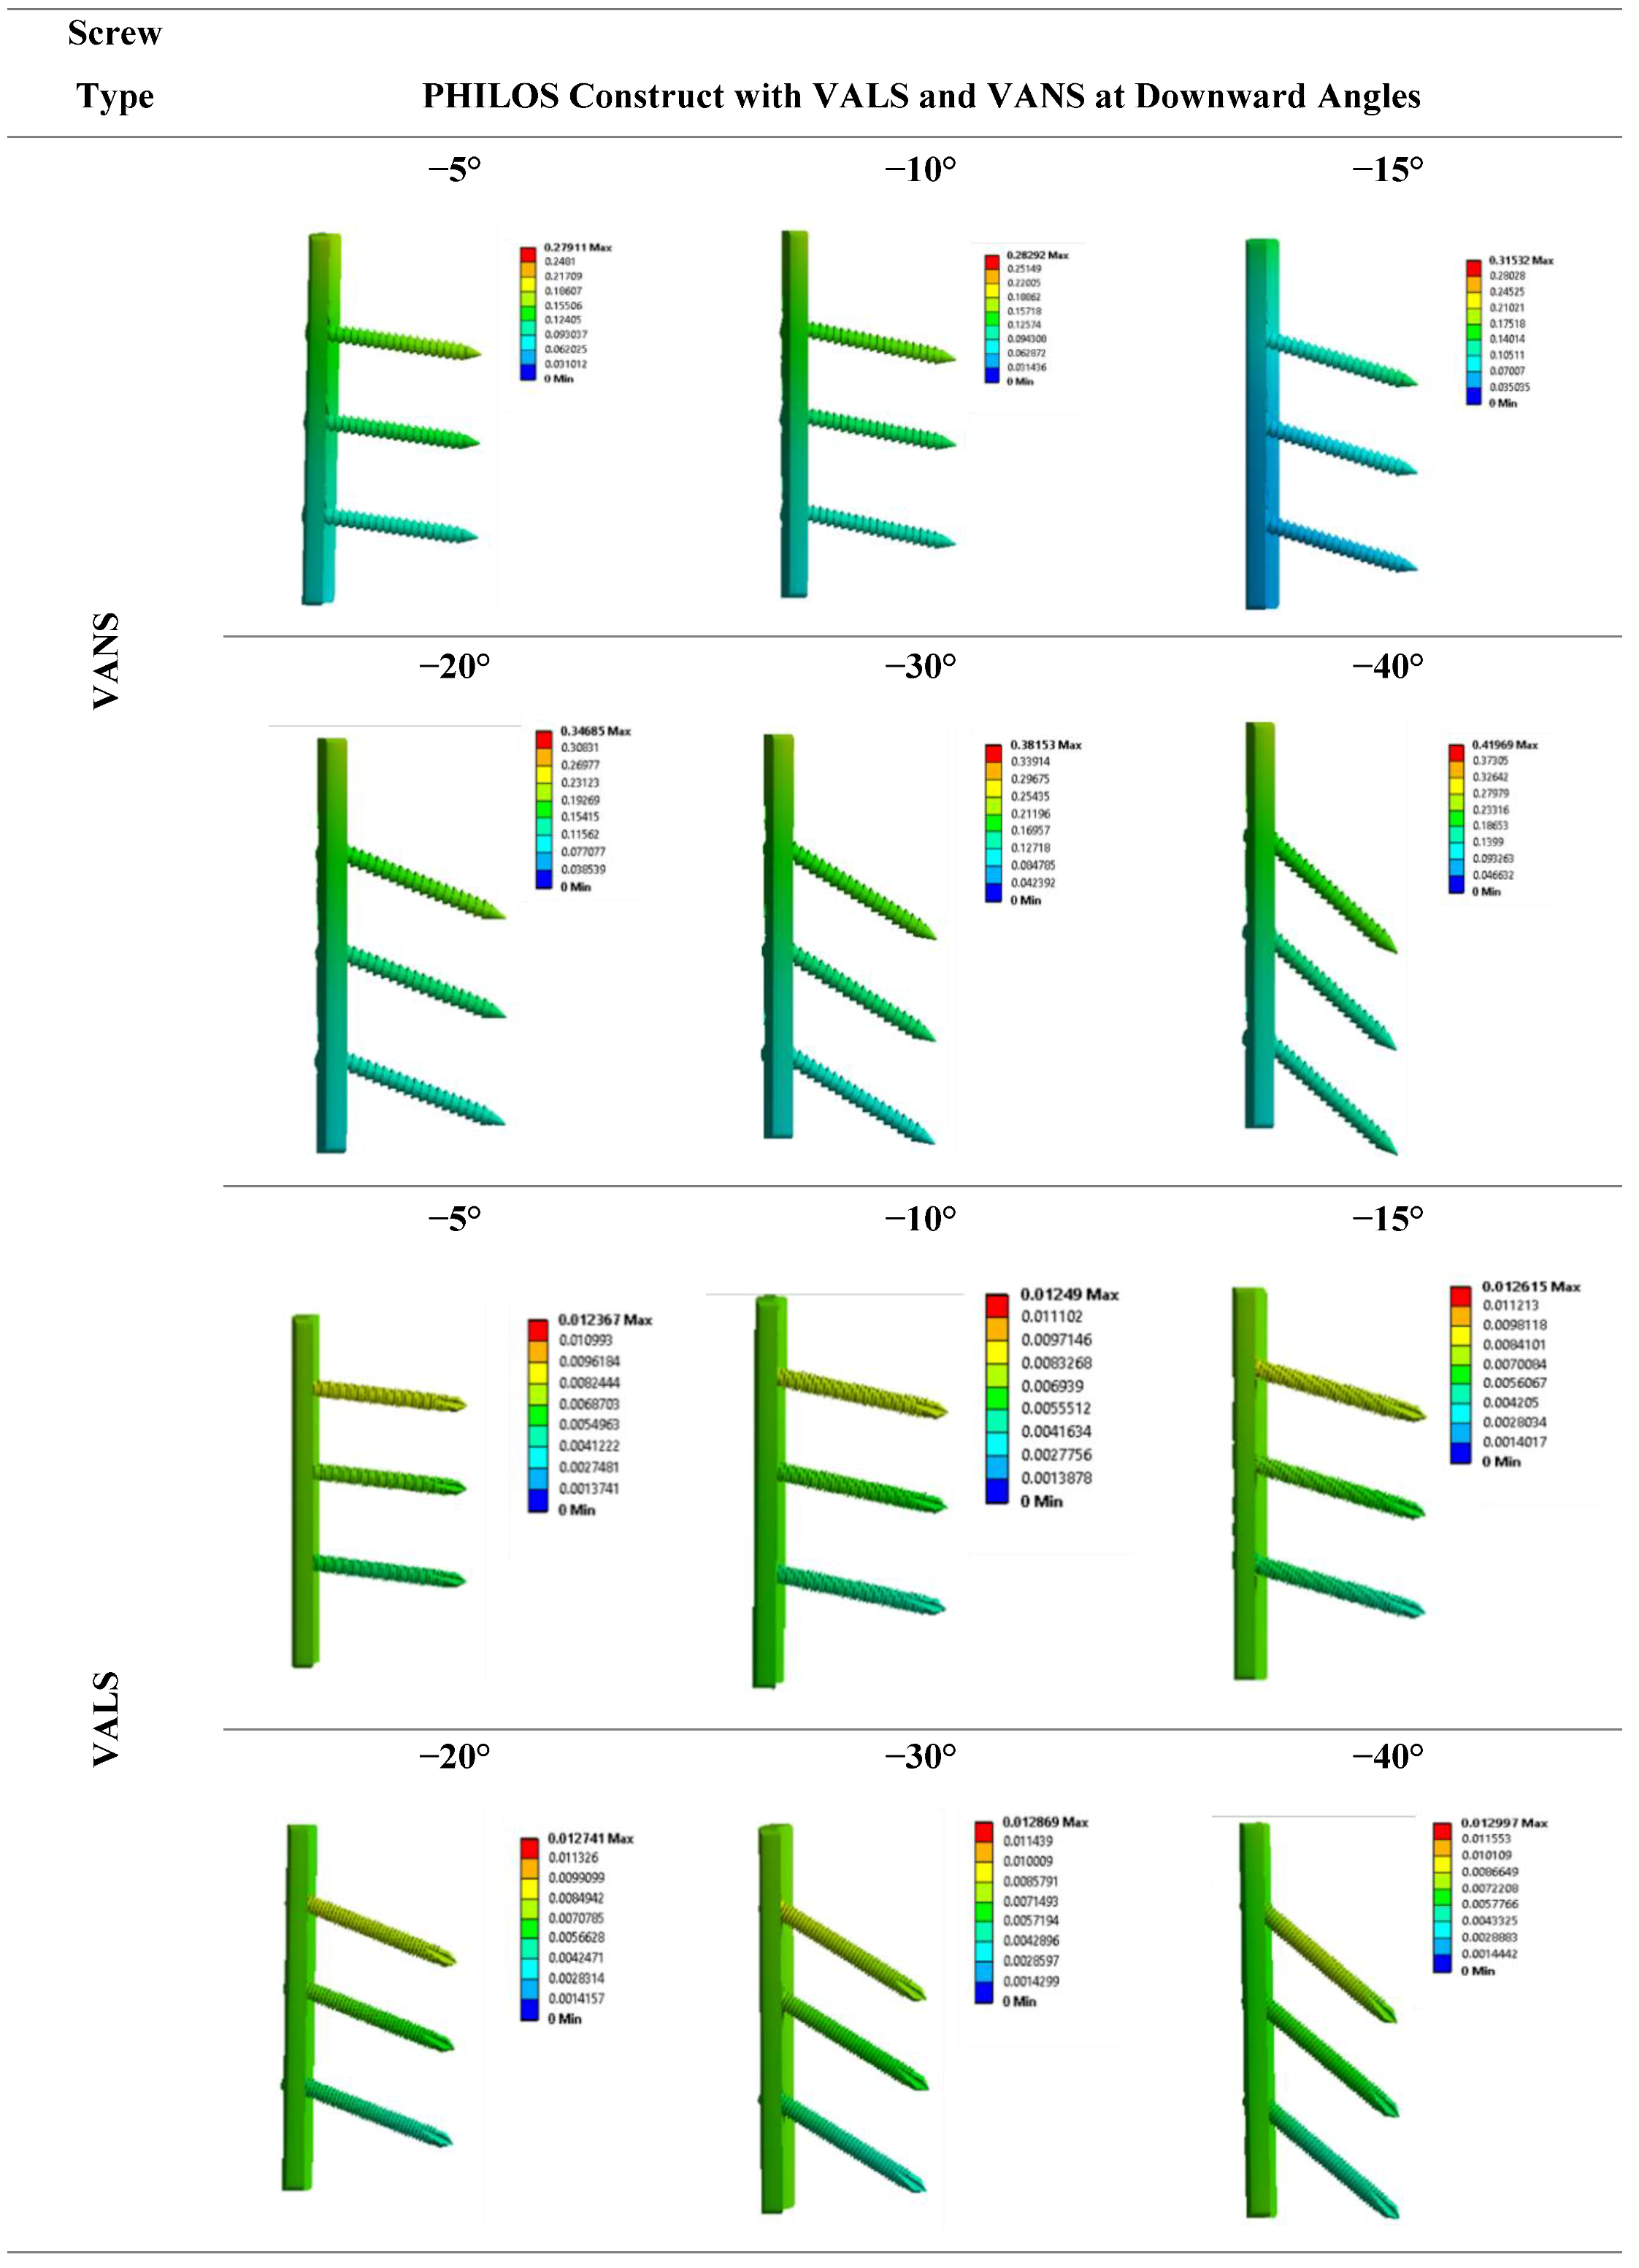
3.4.2. Modeling of Variable Angle Screws
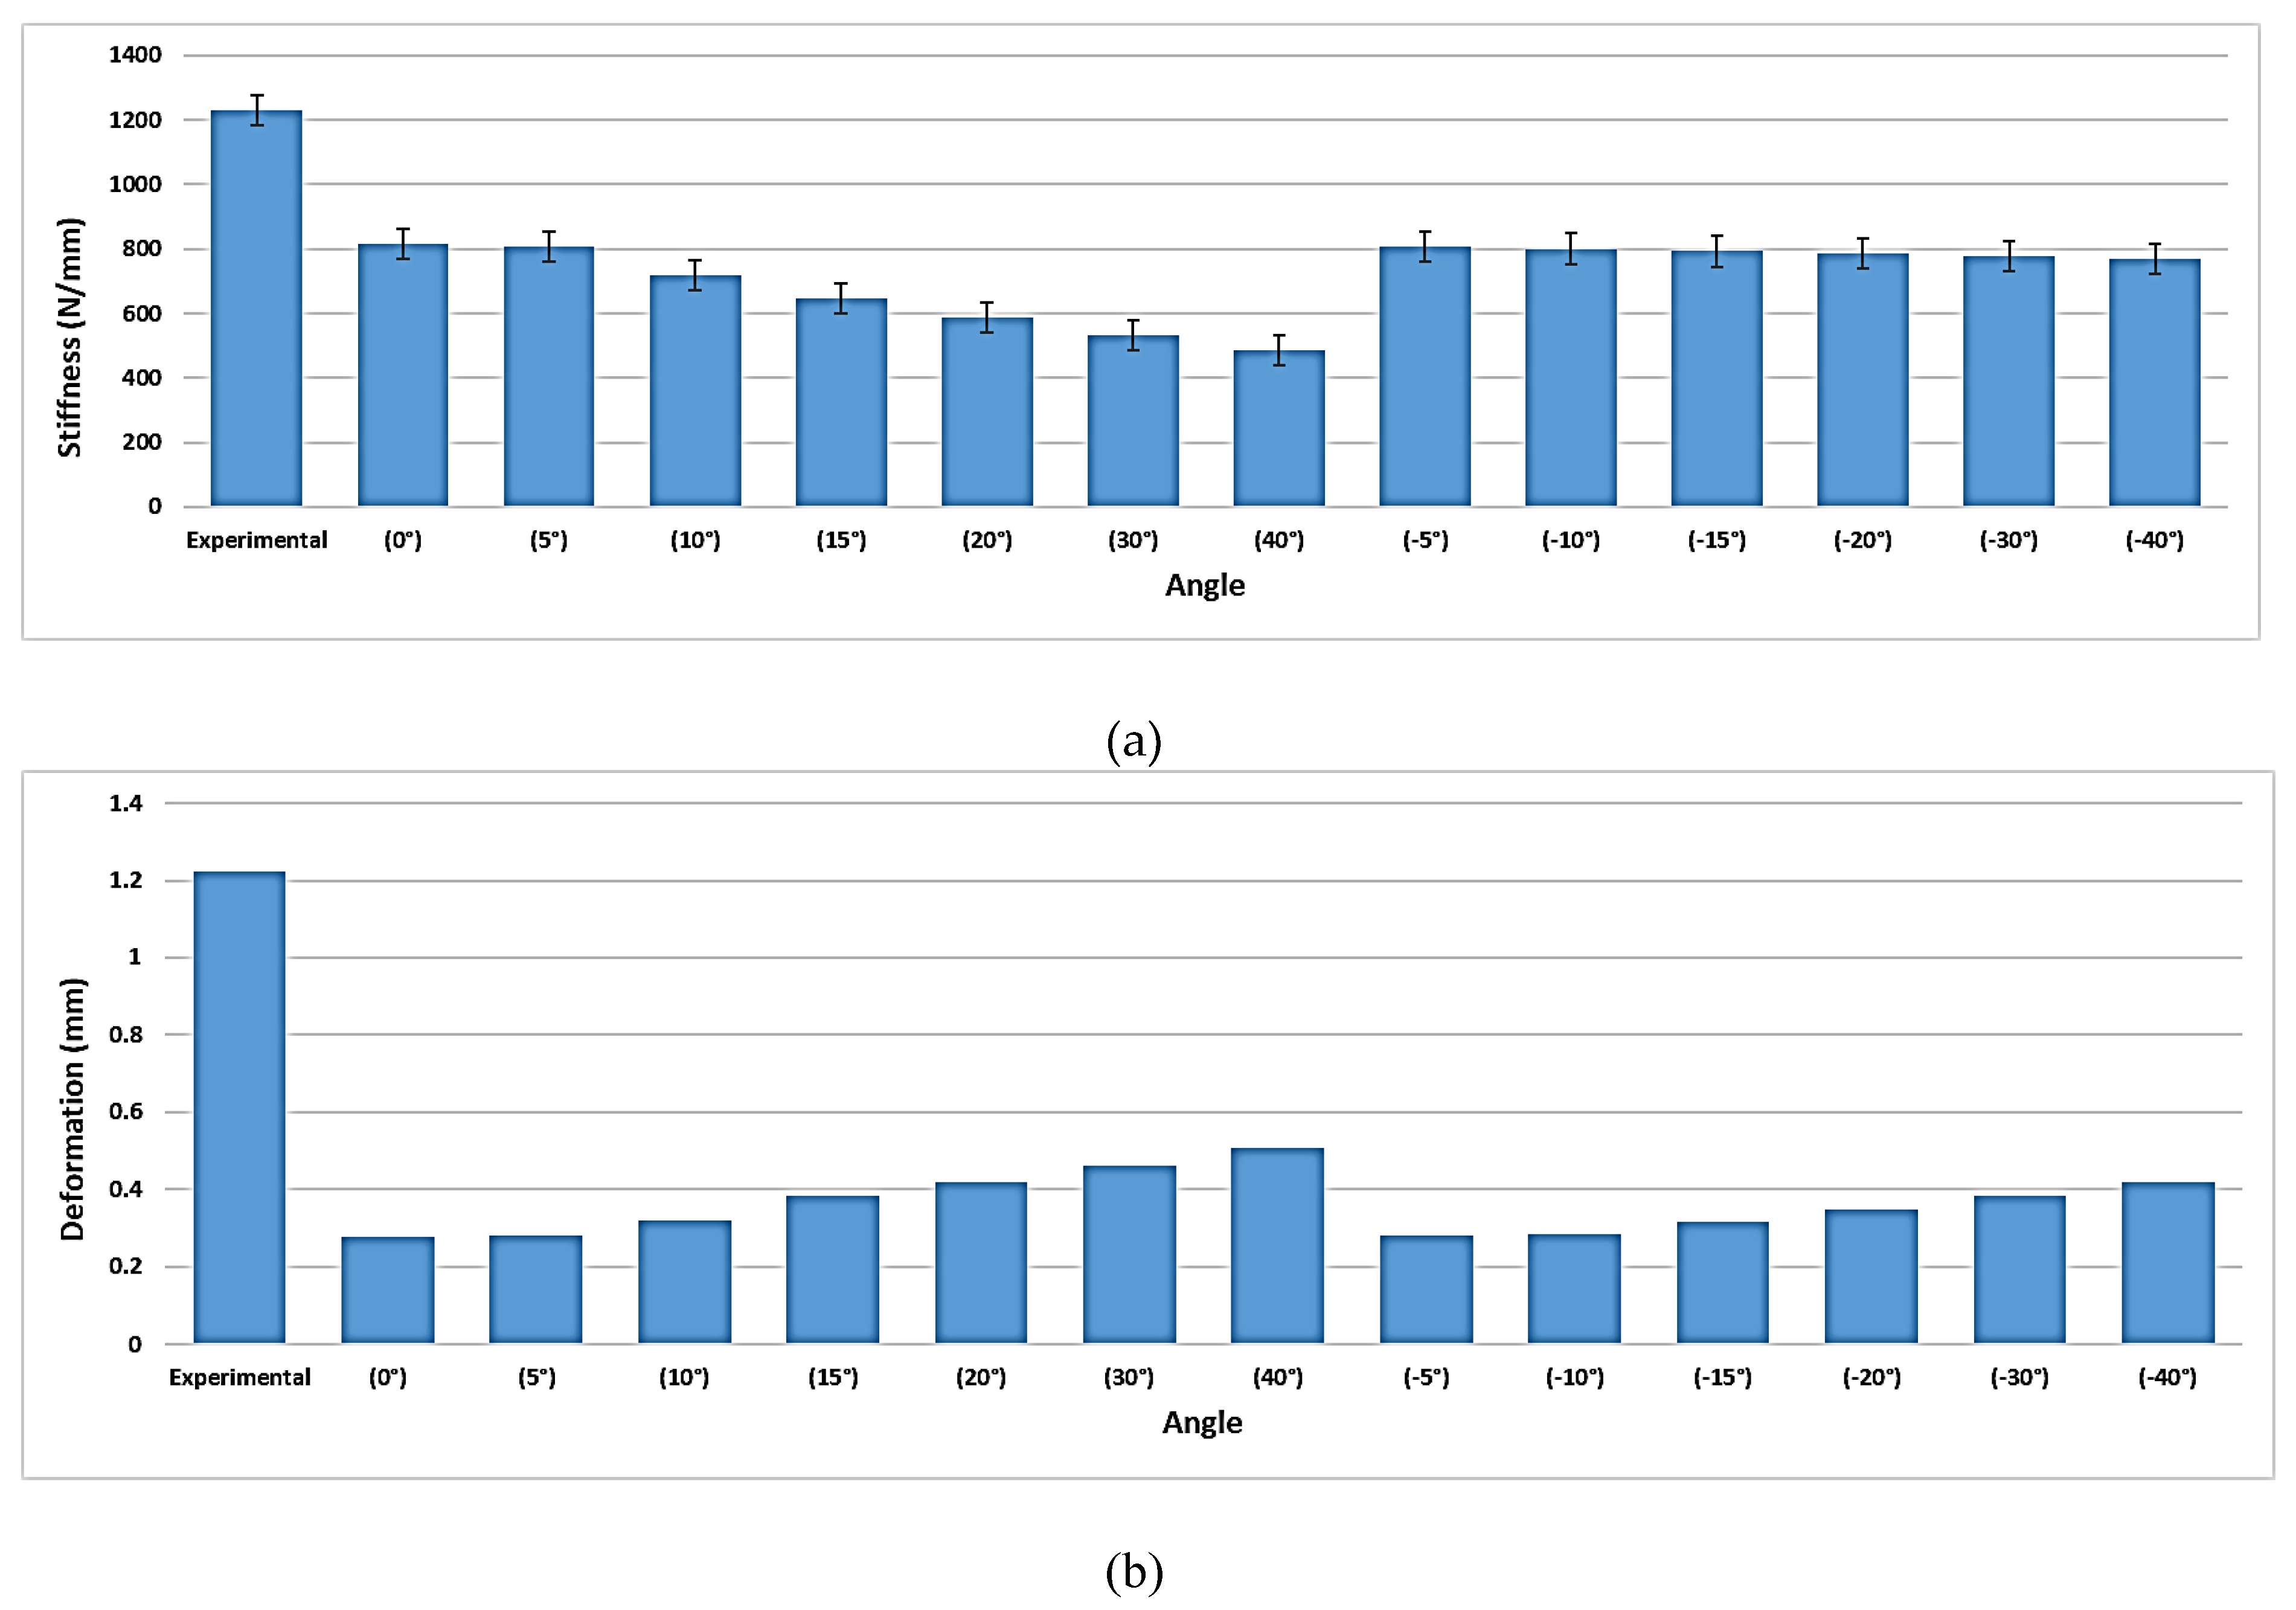
3.4.3. Comparison with Experimental Work
3.4.4. Fatigue Analysis of PHILOS Construct
4. Discussion
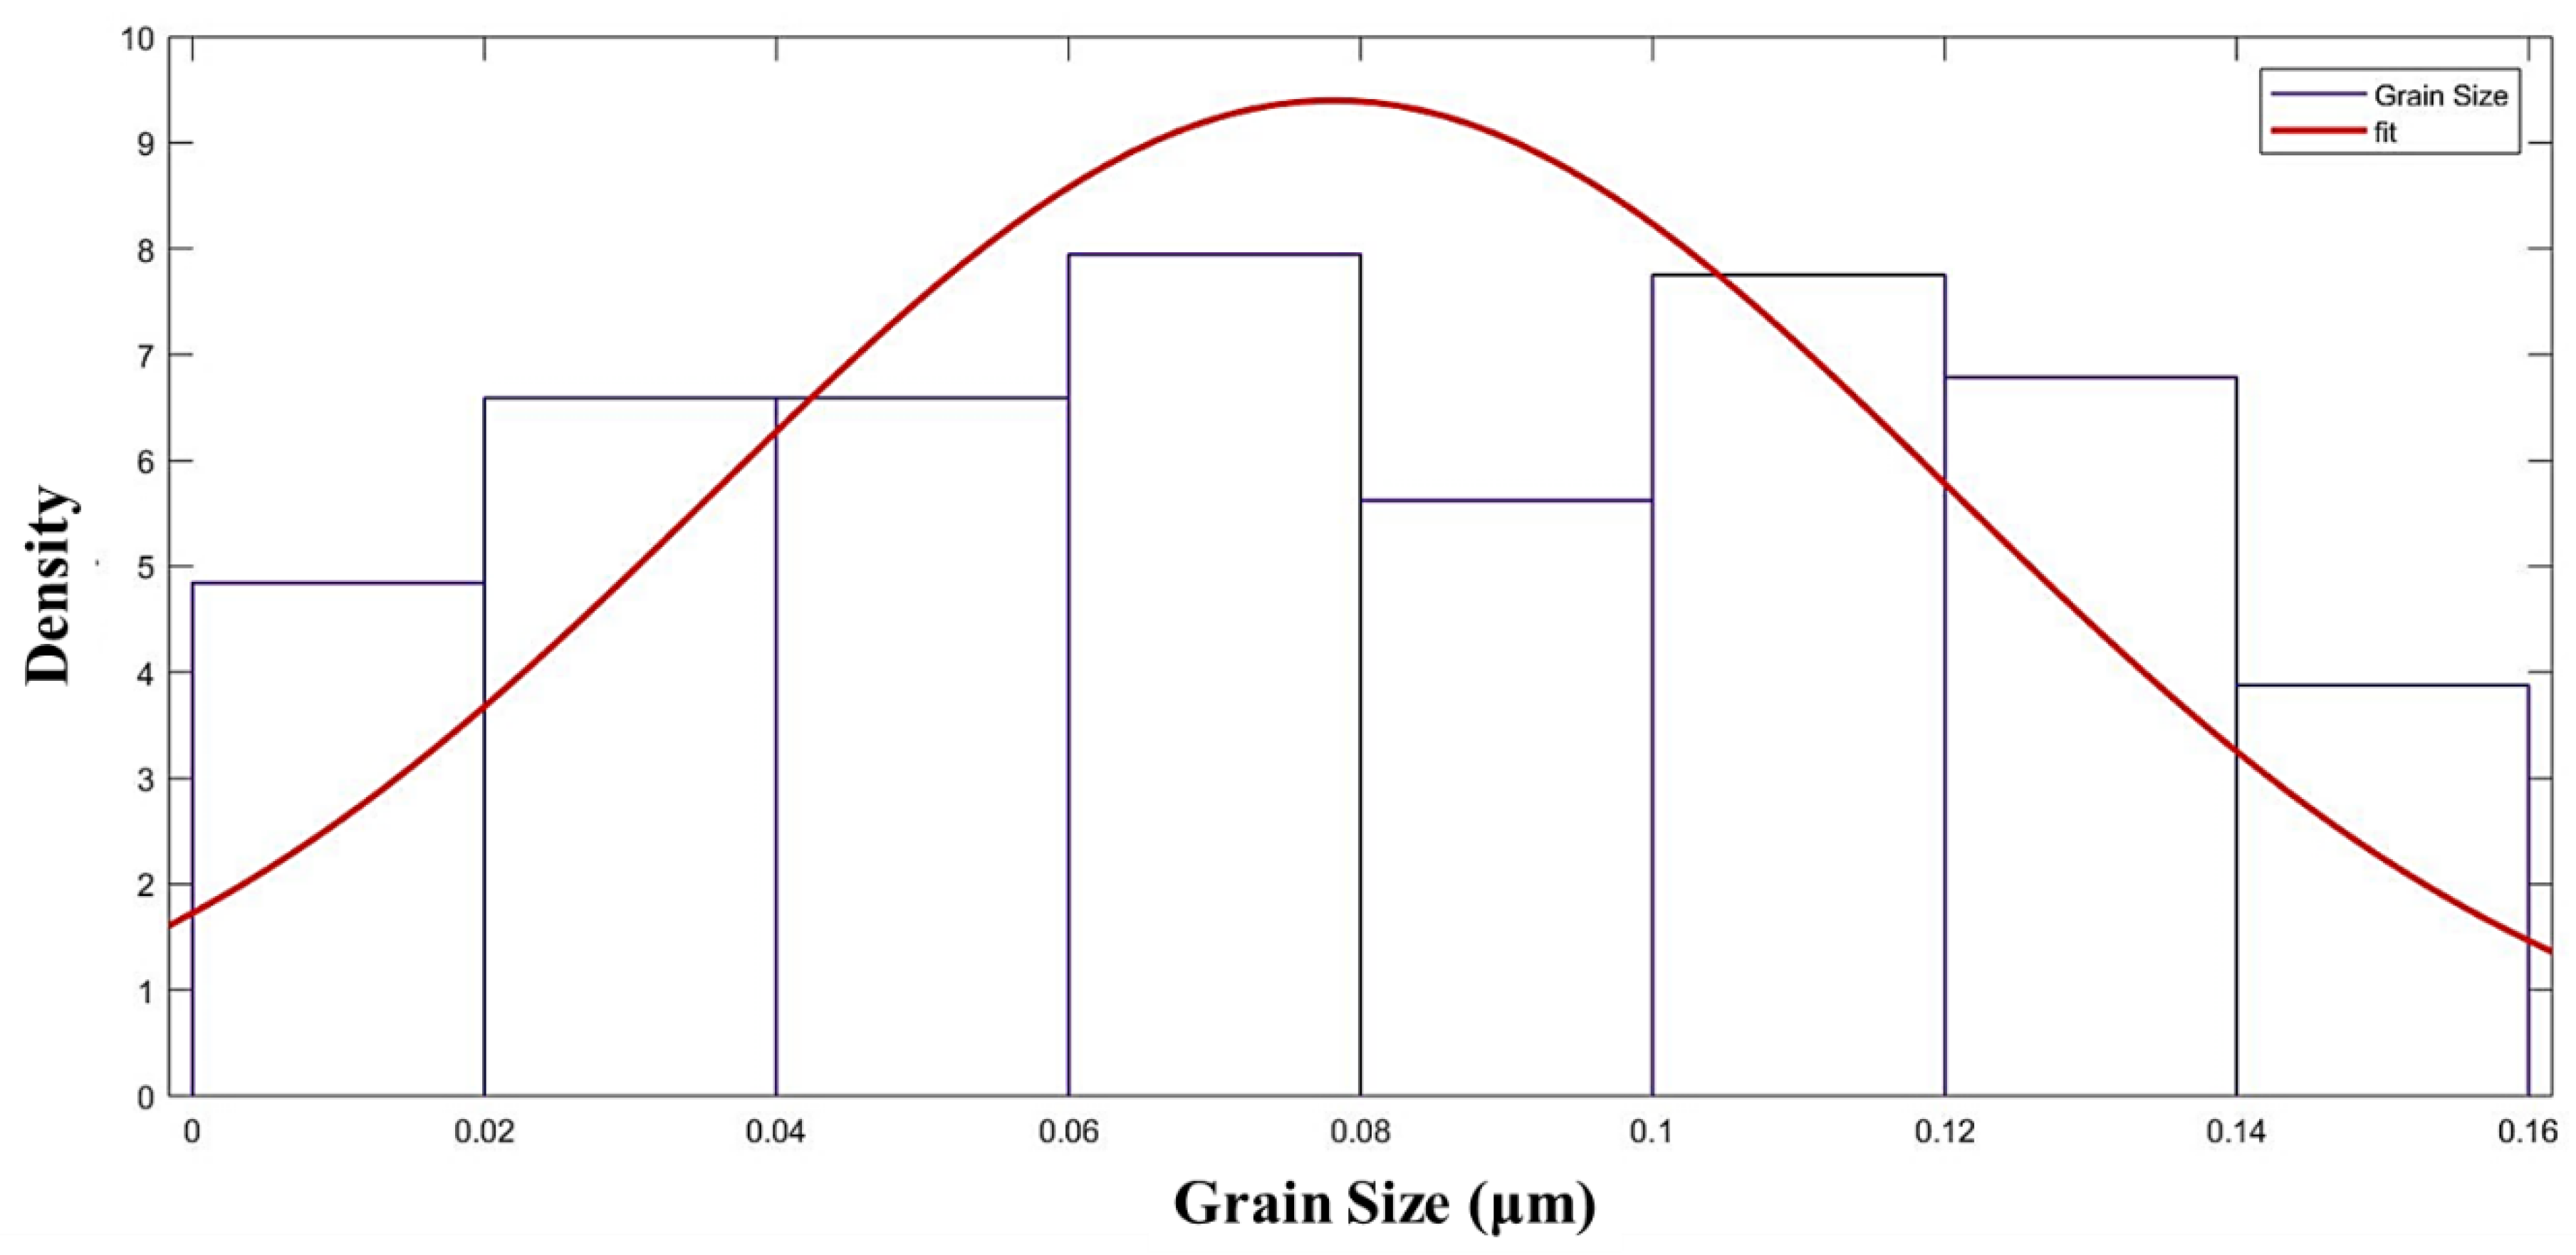
4.1. Microstructure Characterization
4.2. Computational Simulation
4.3. Comparison with Experimental Work
5. Conclusions
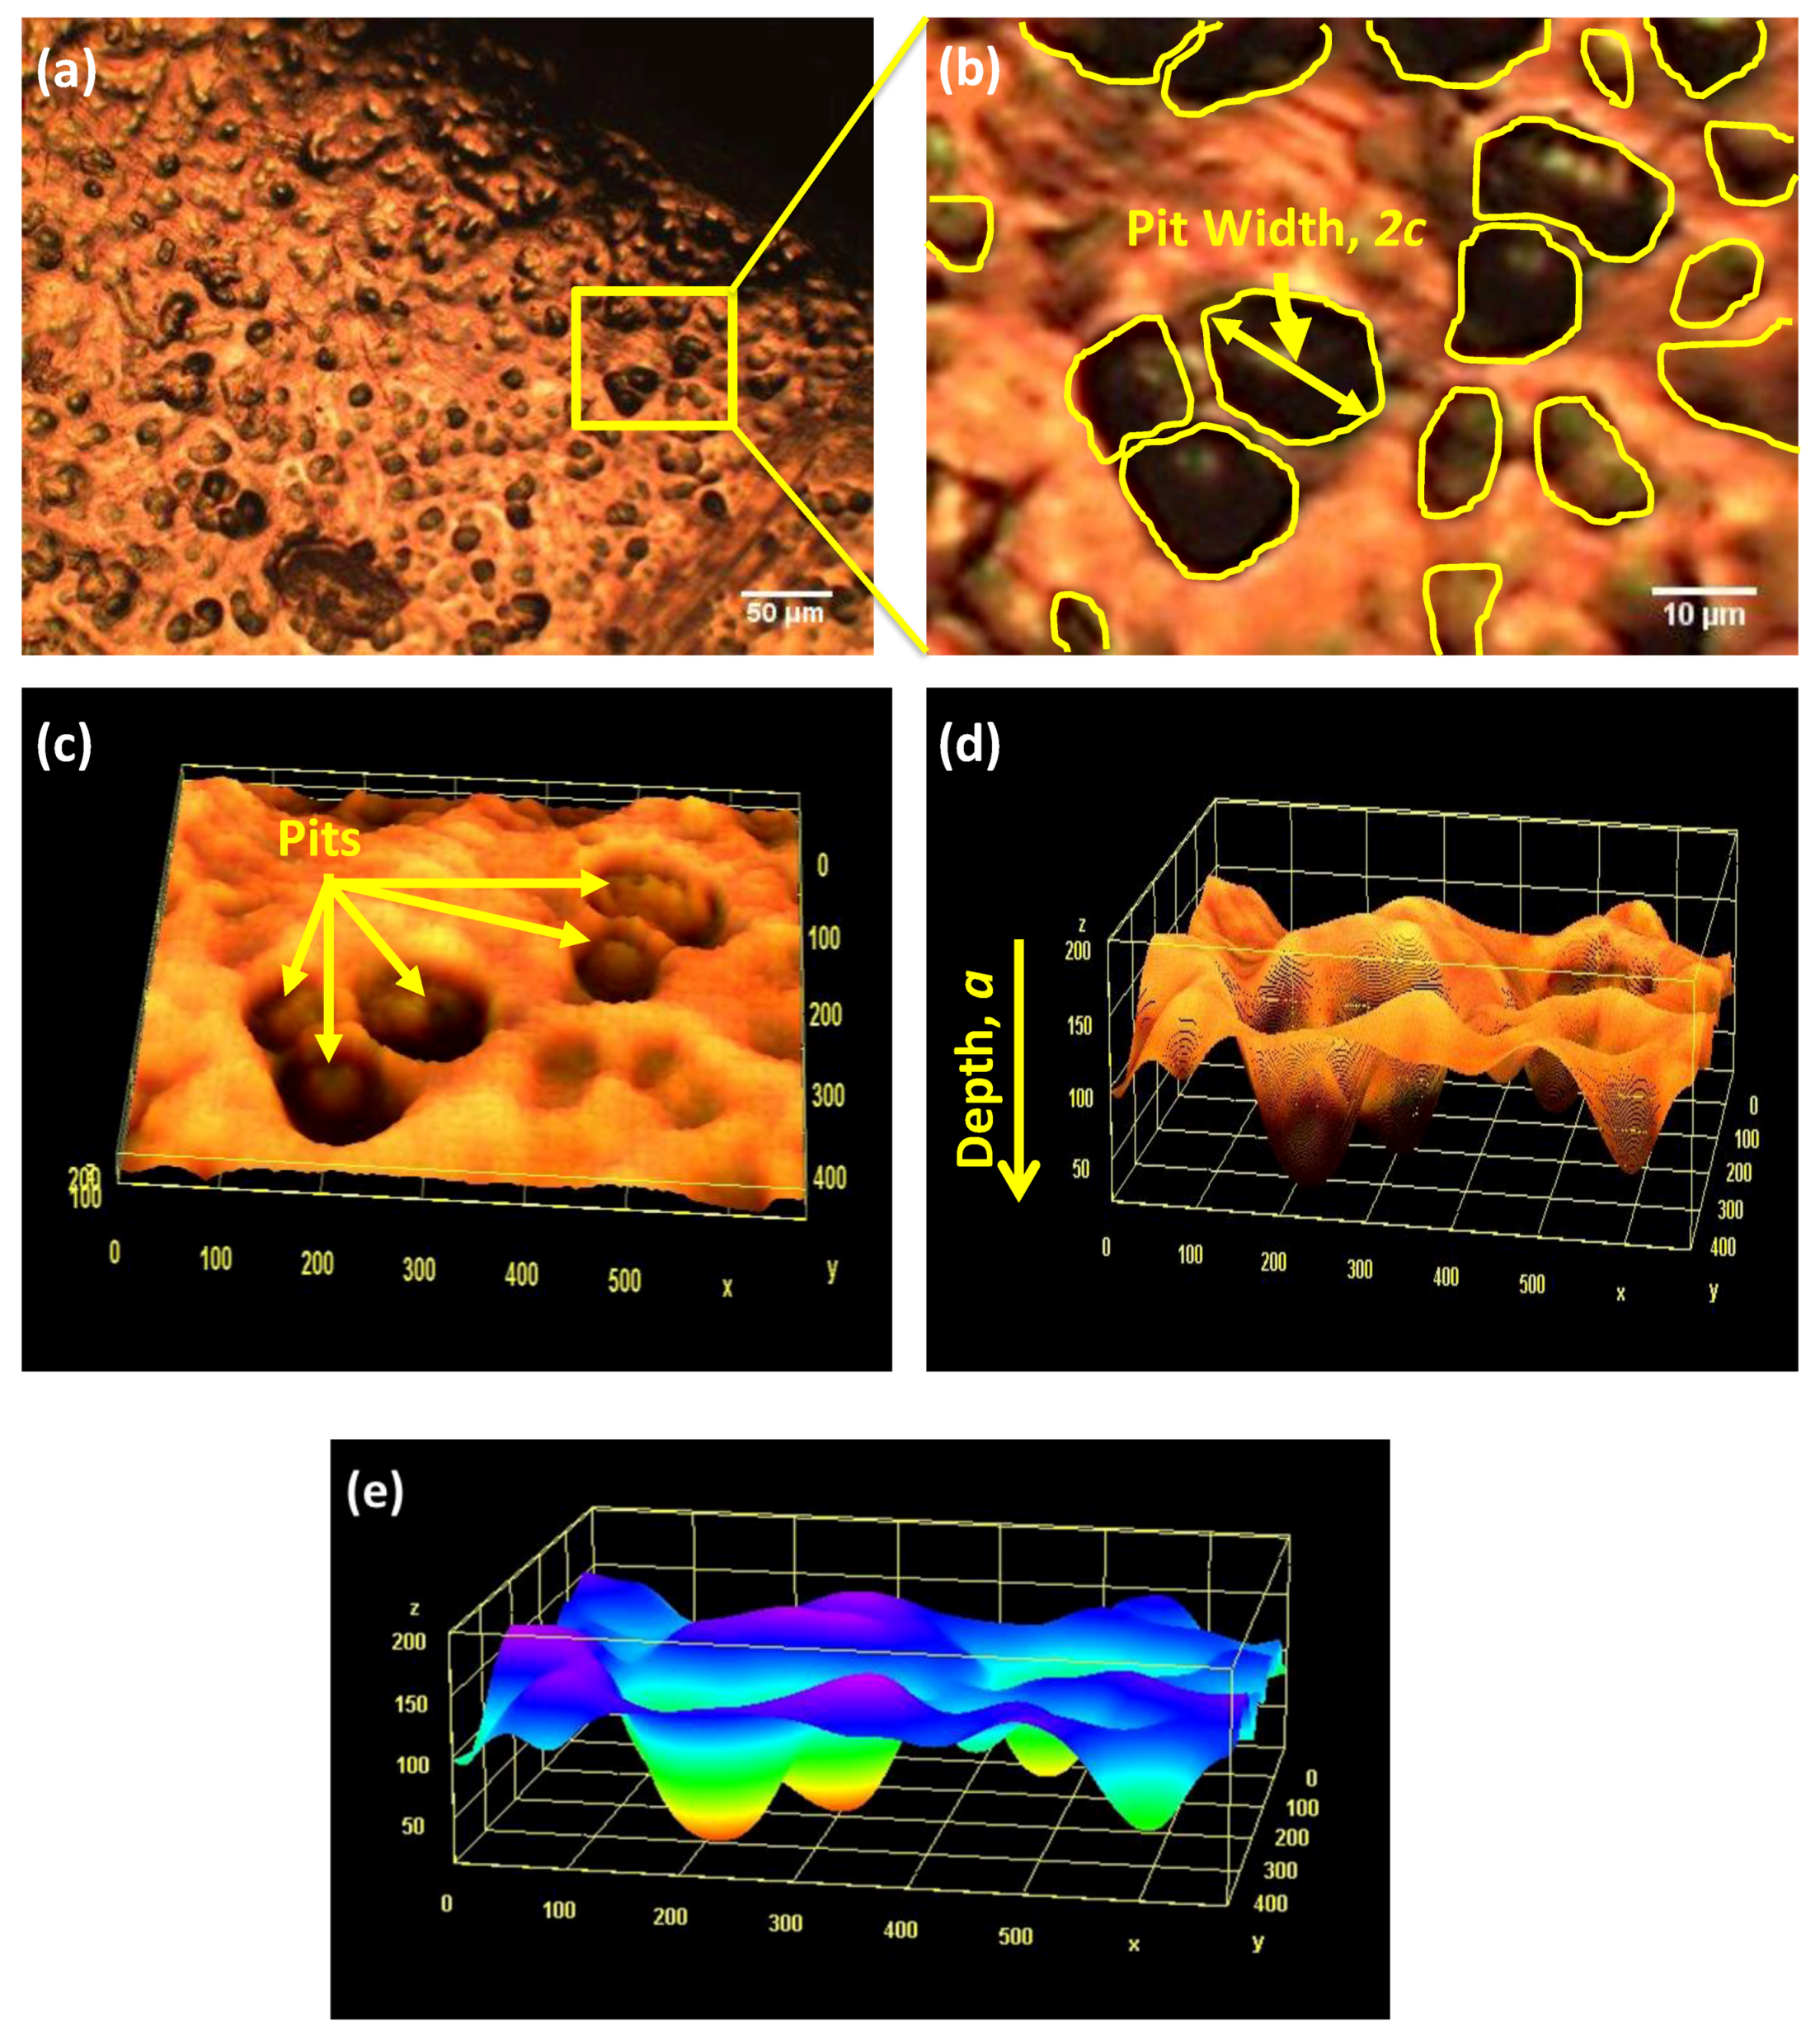
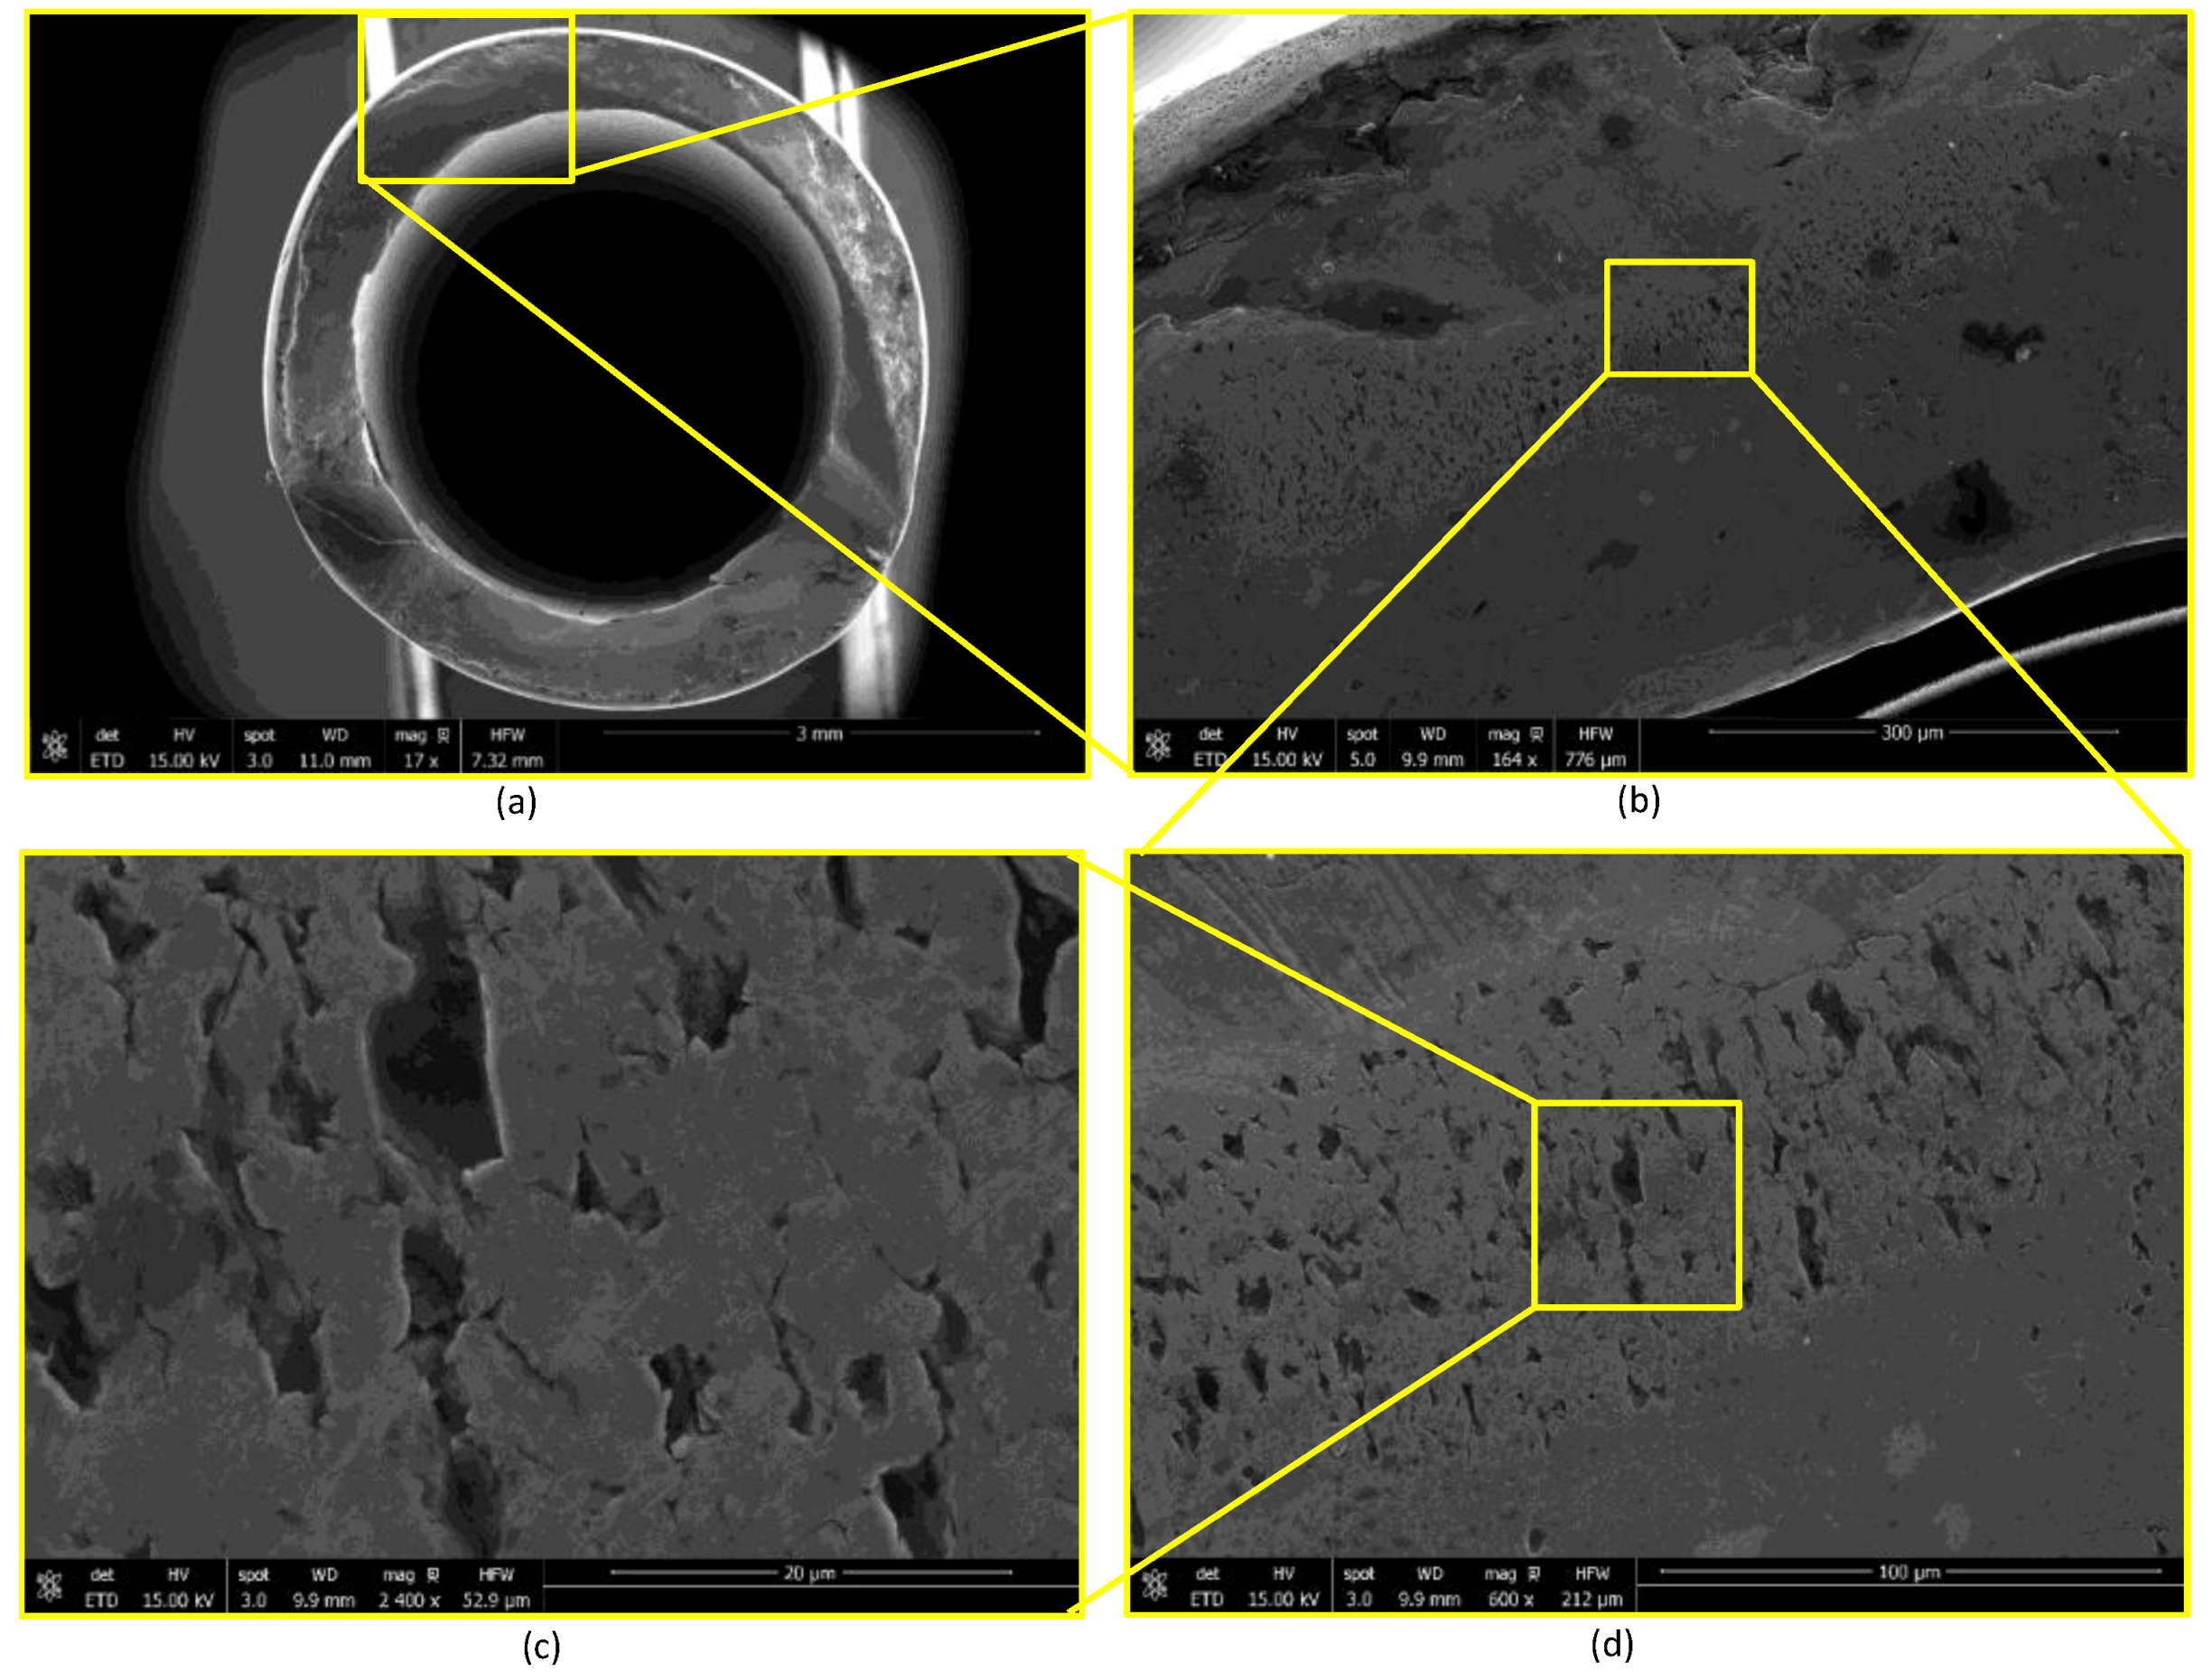
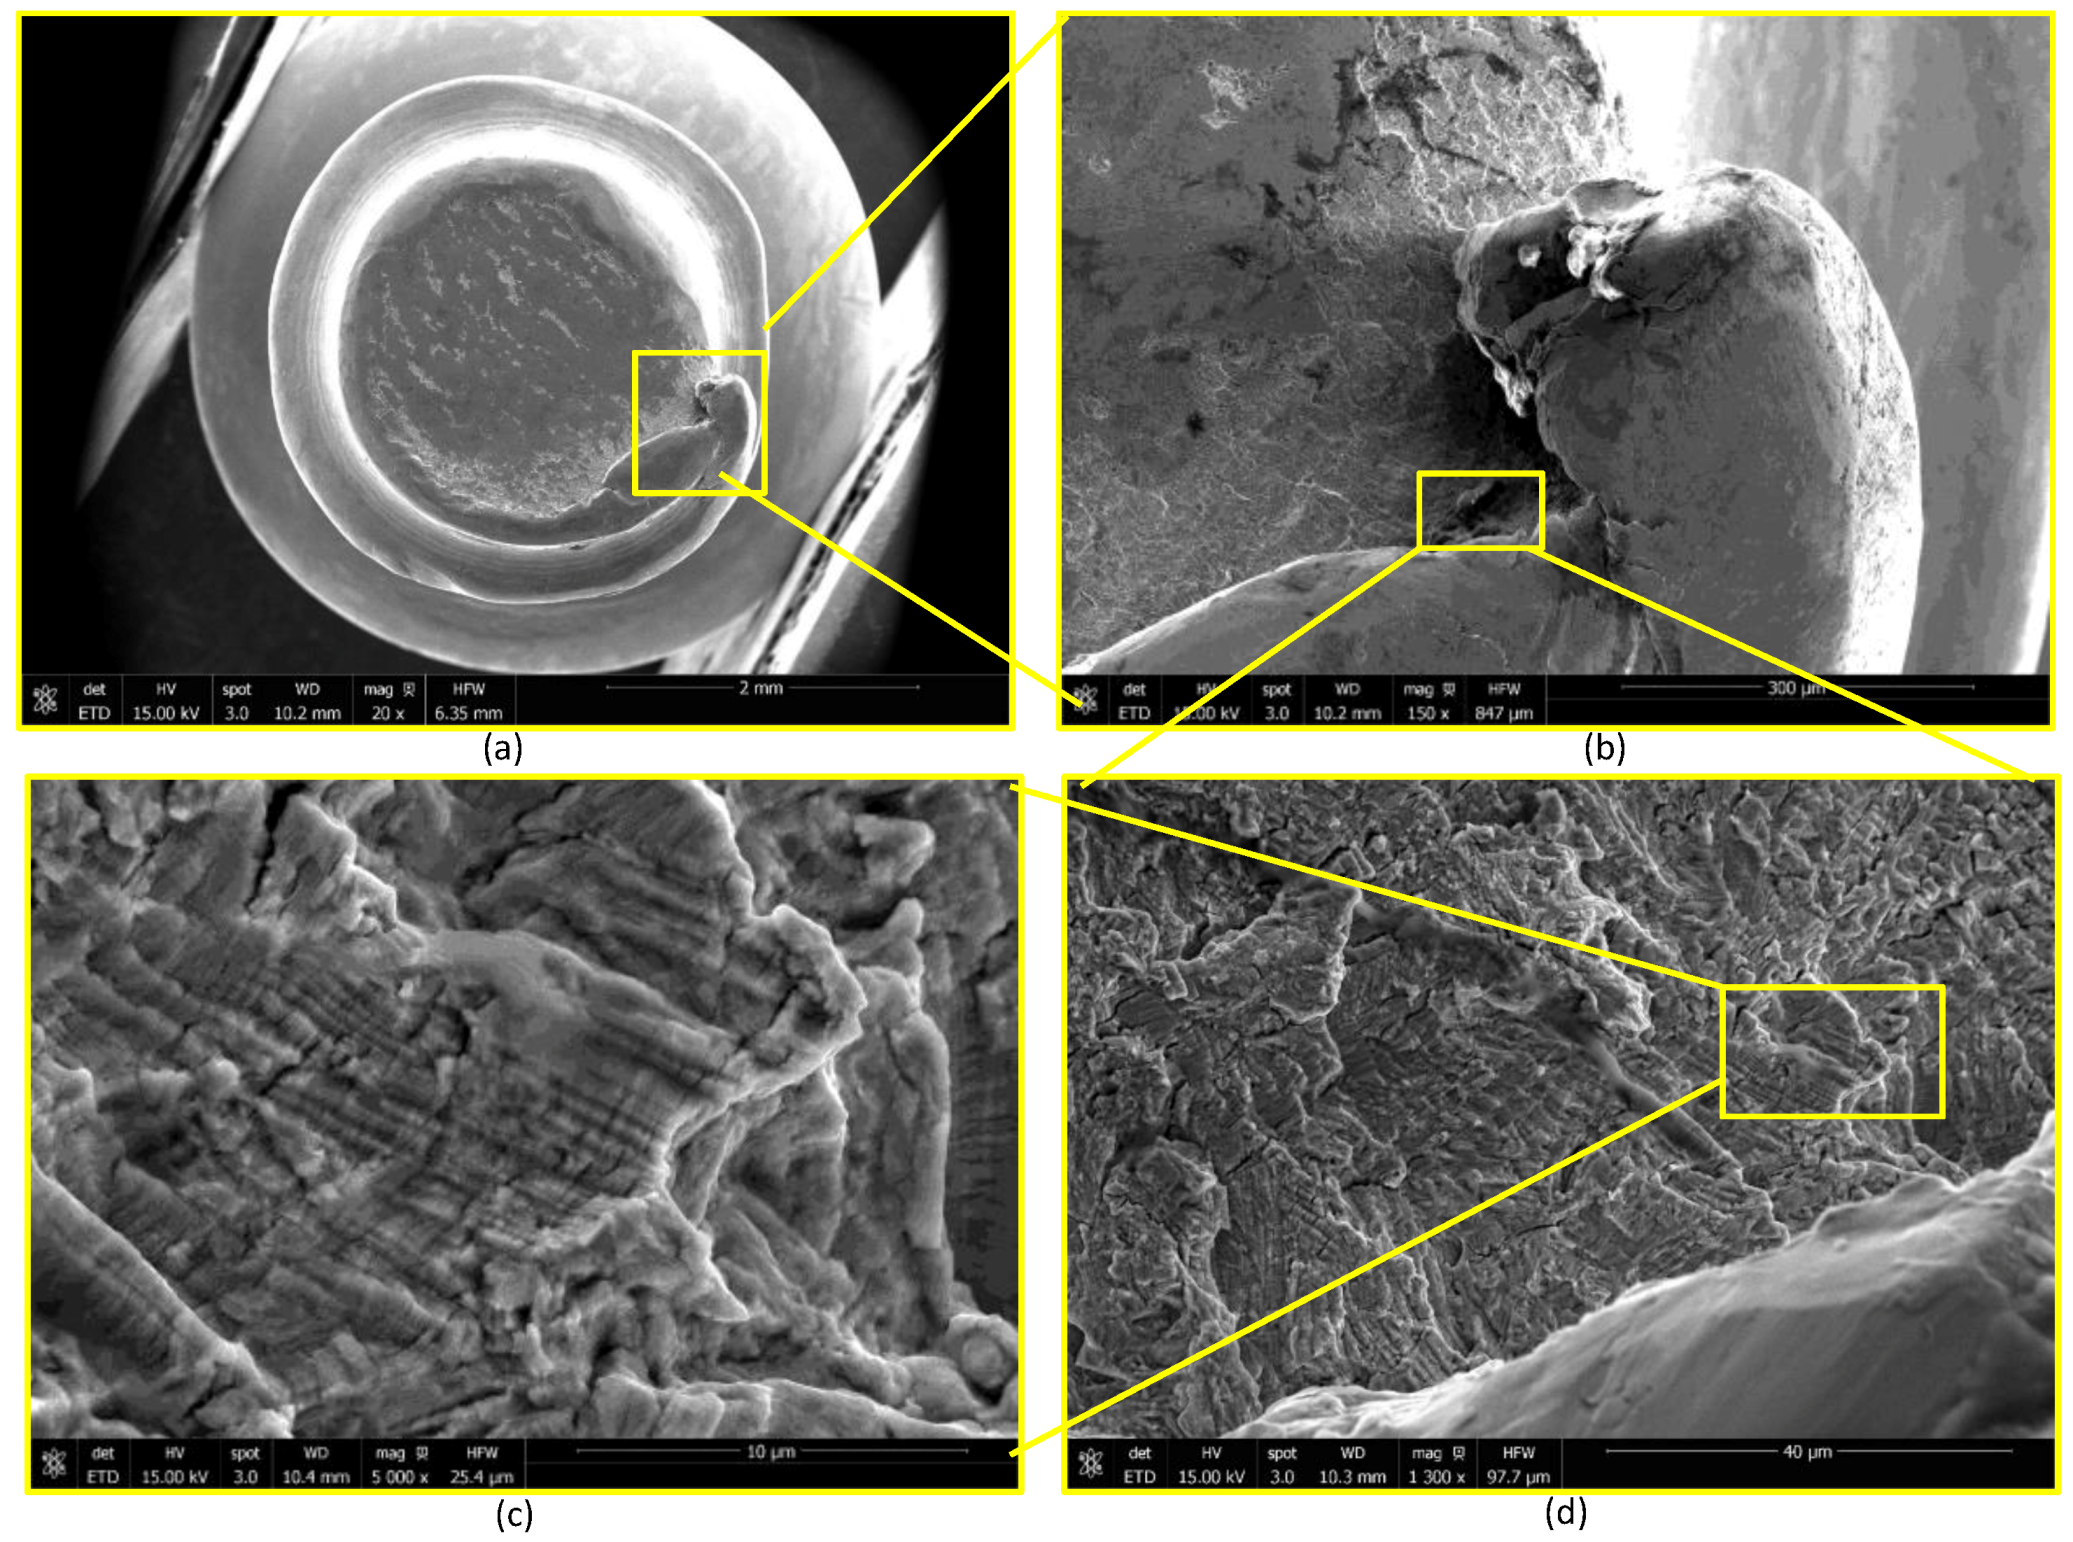
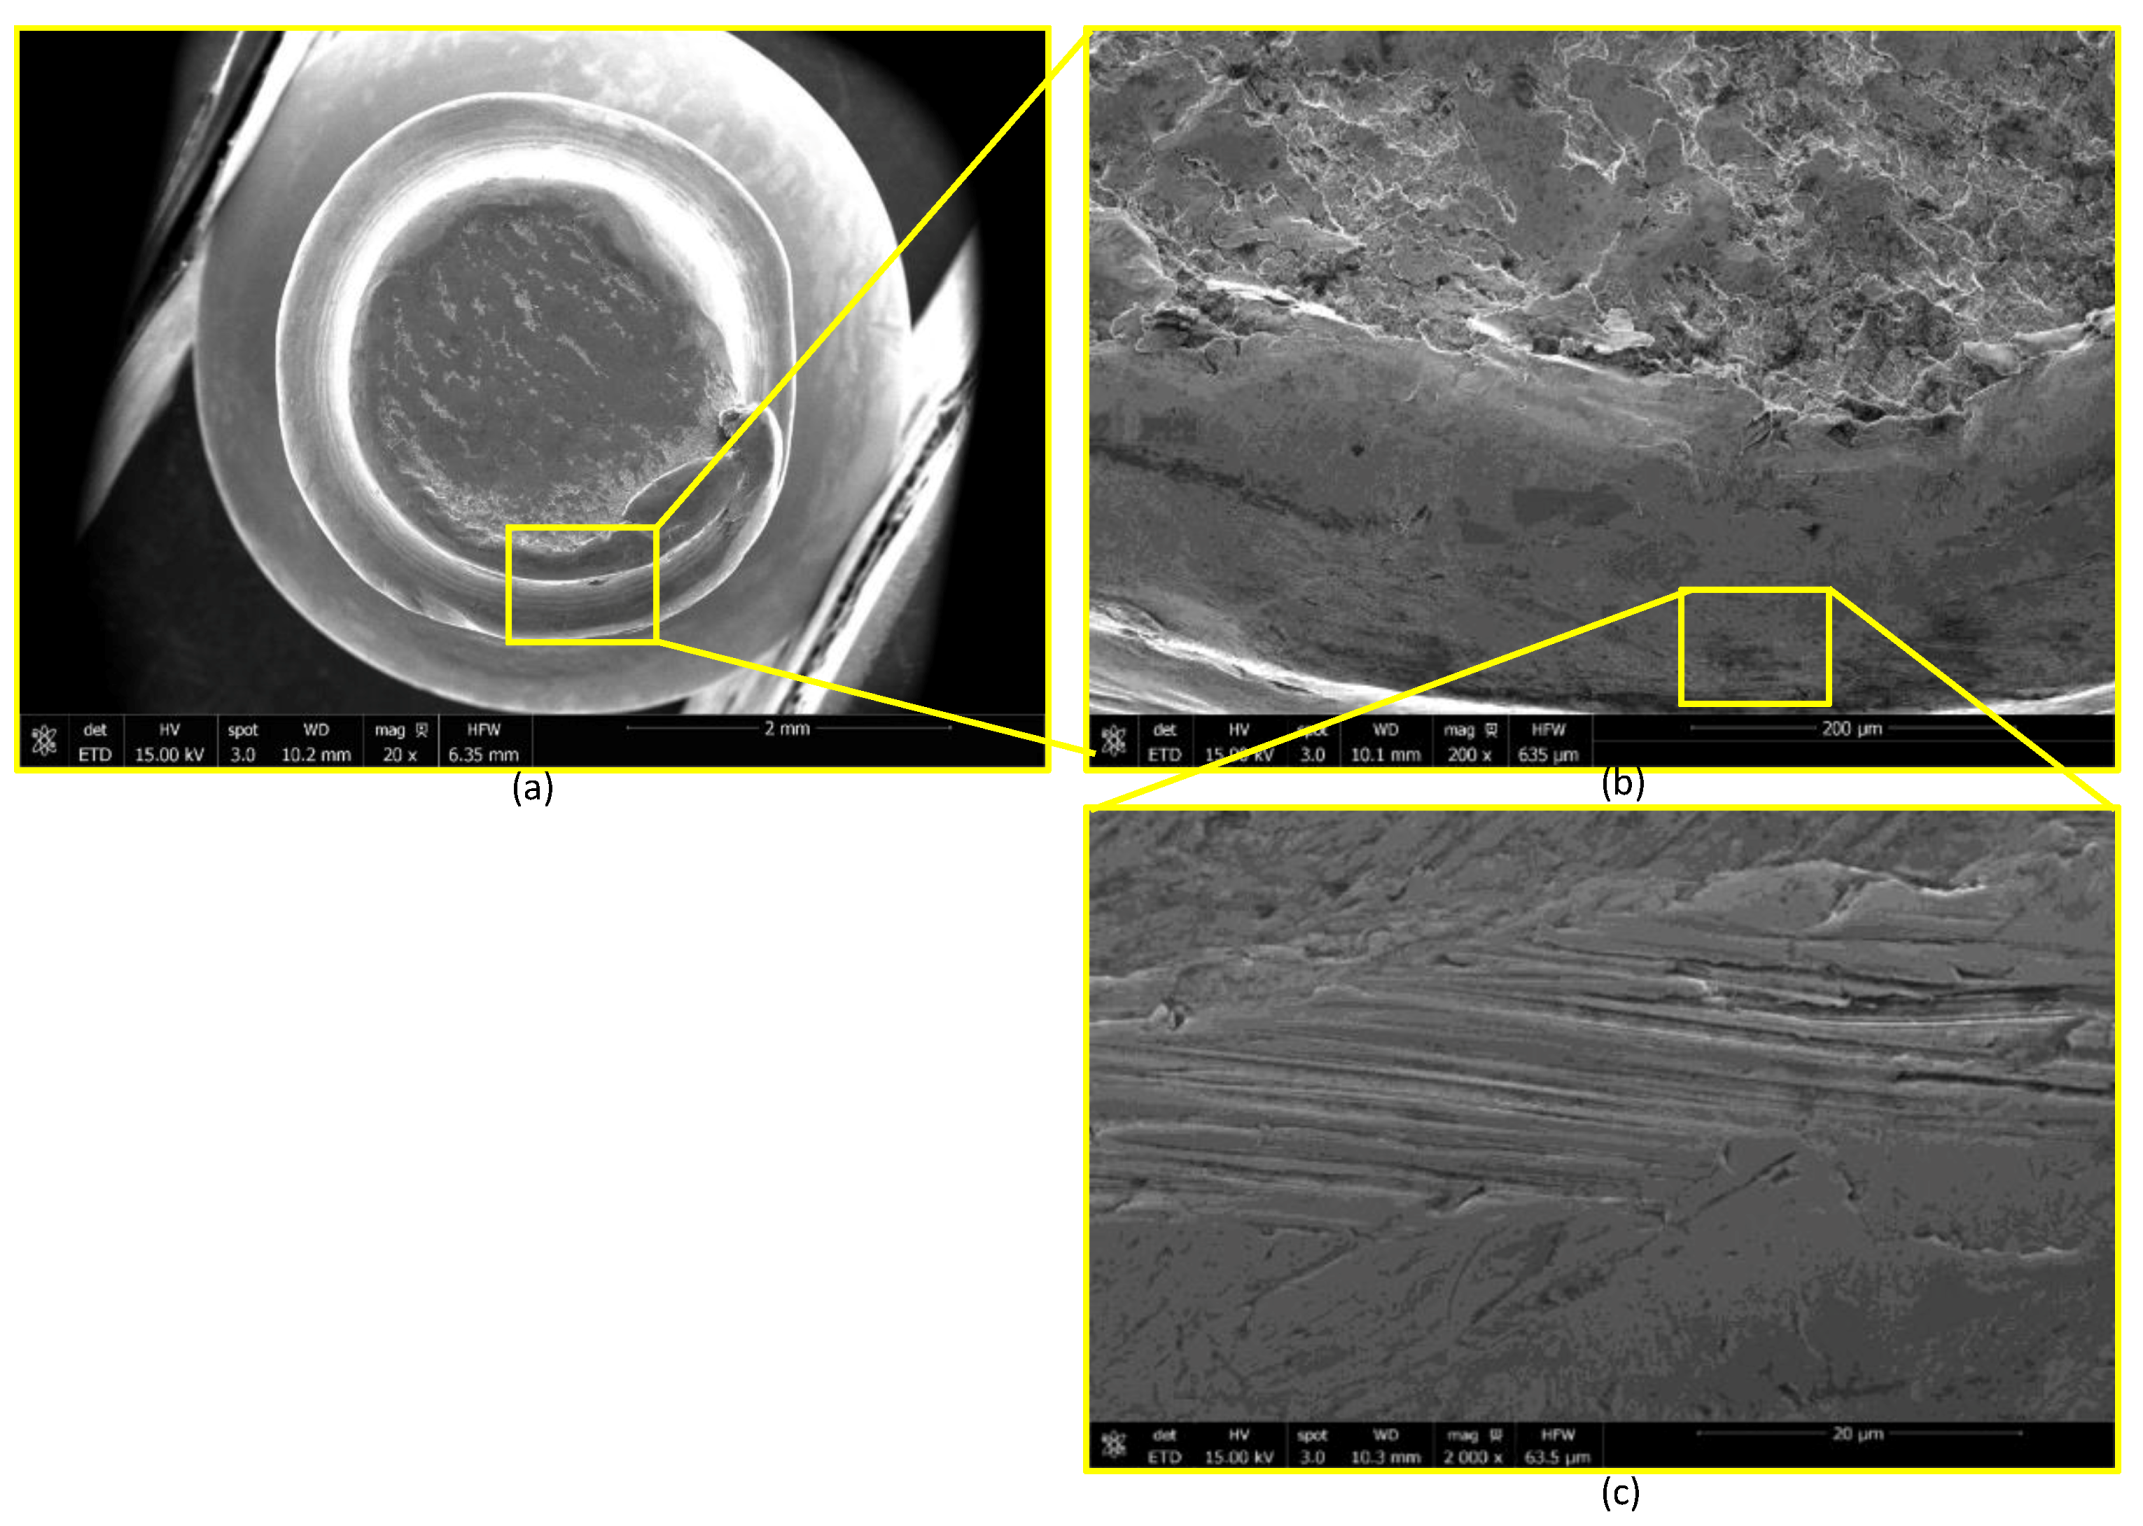
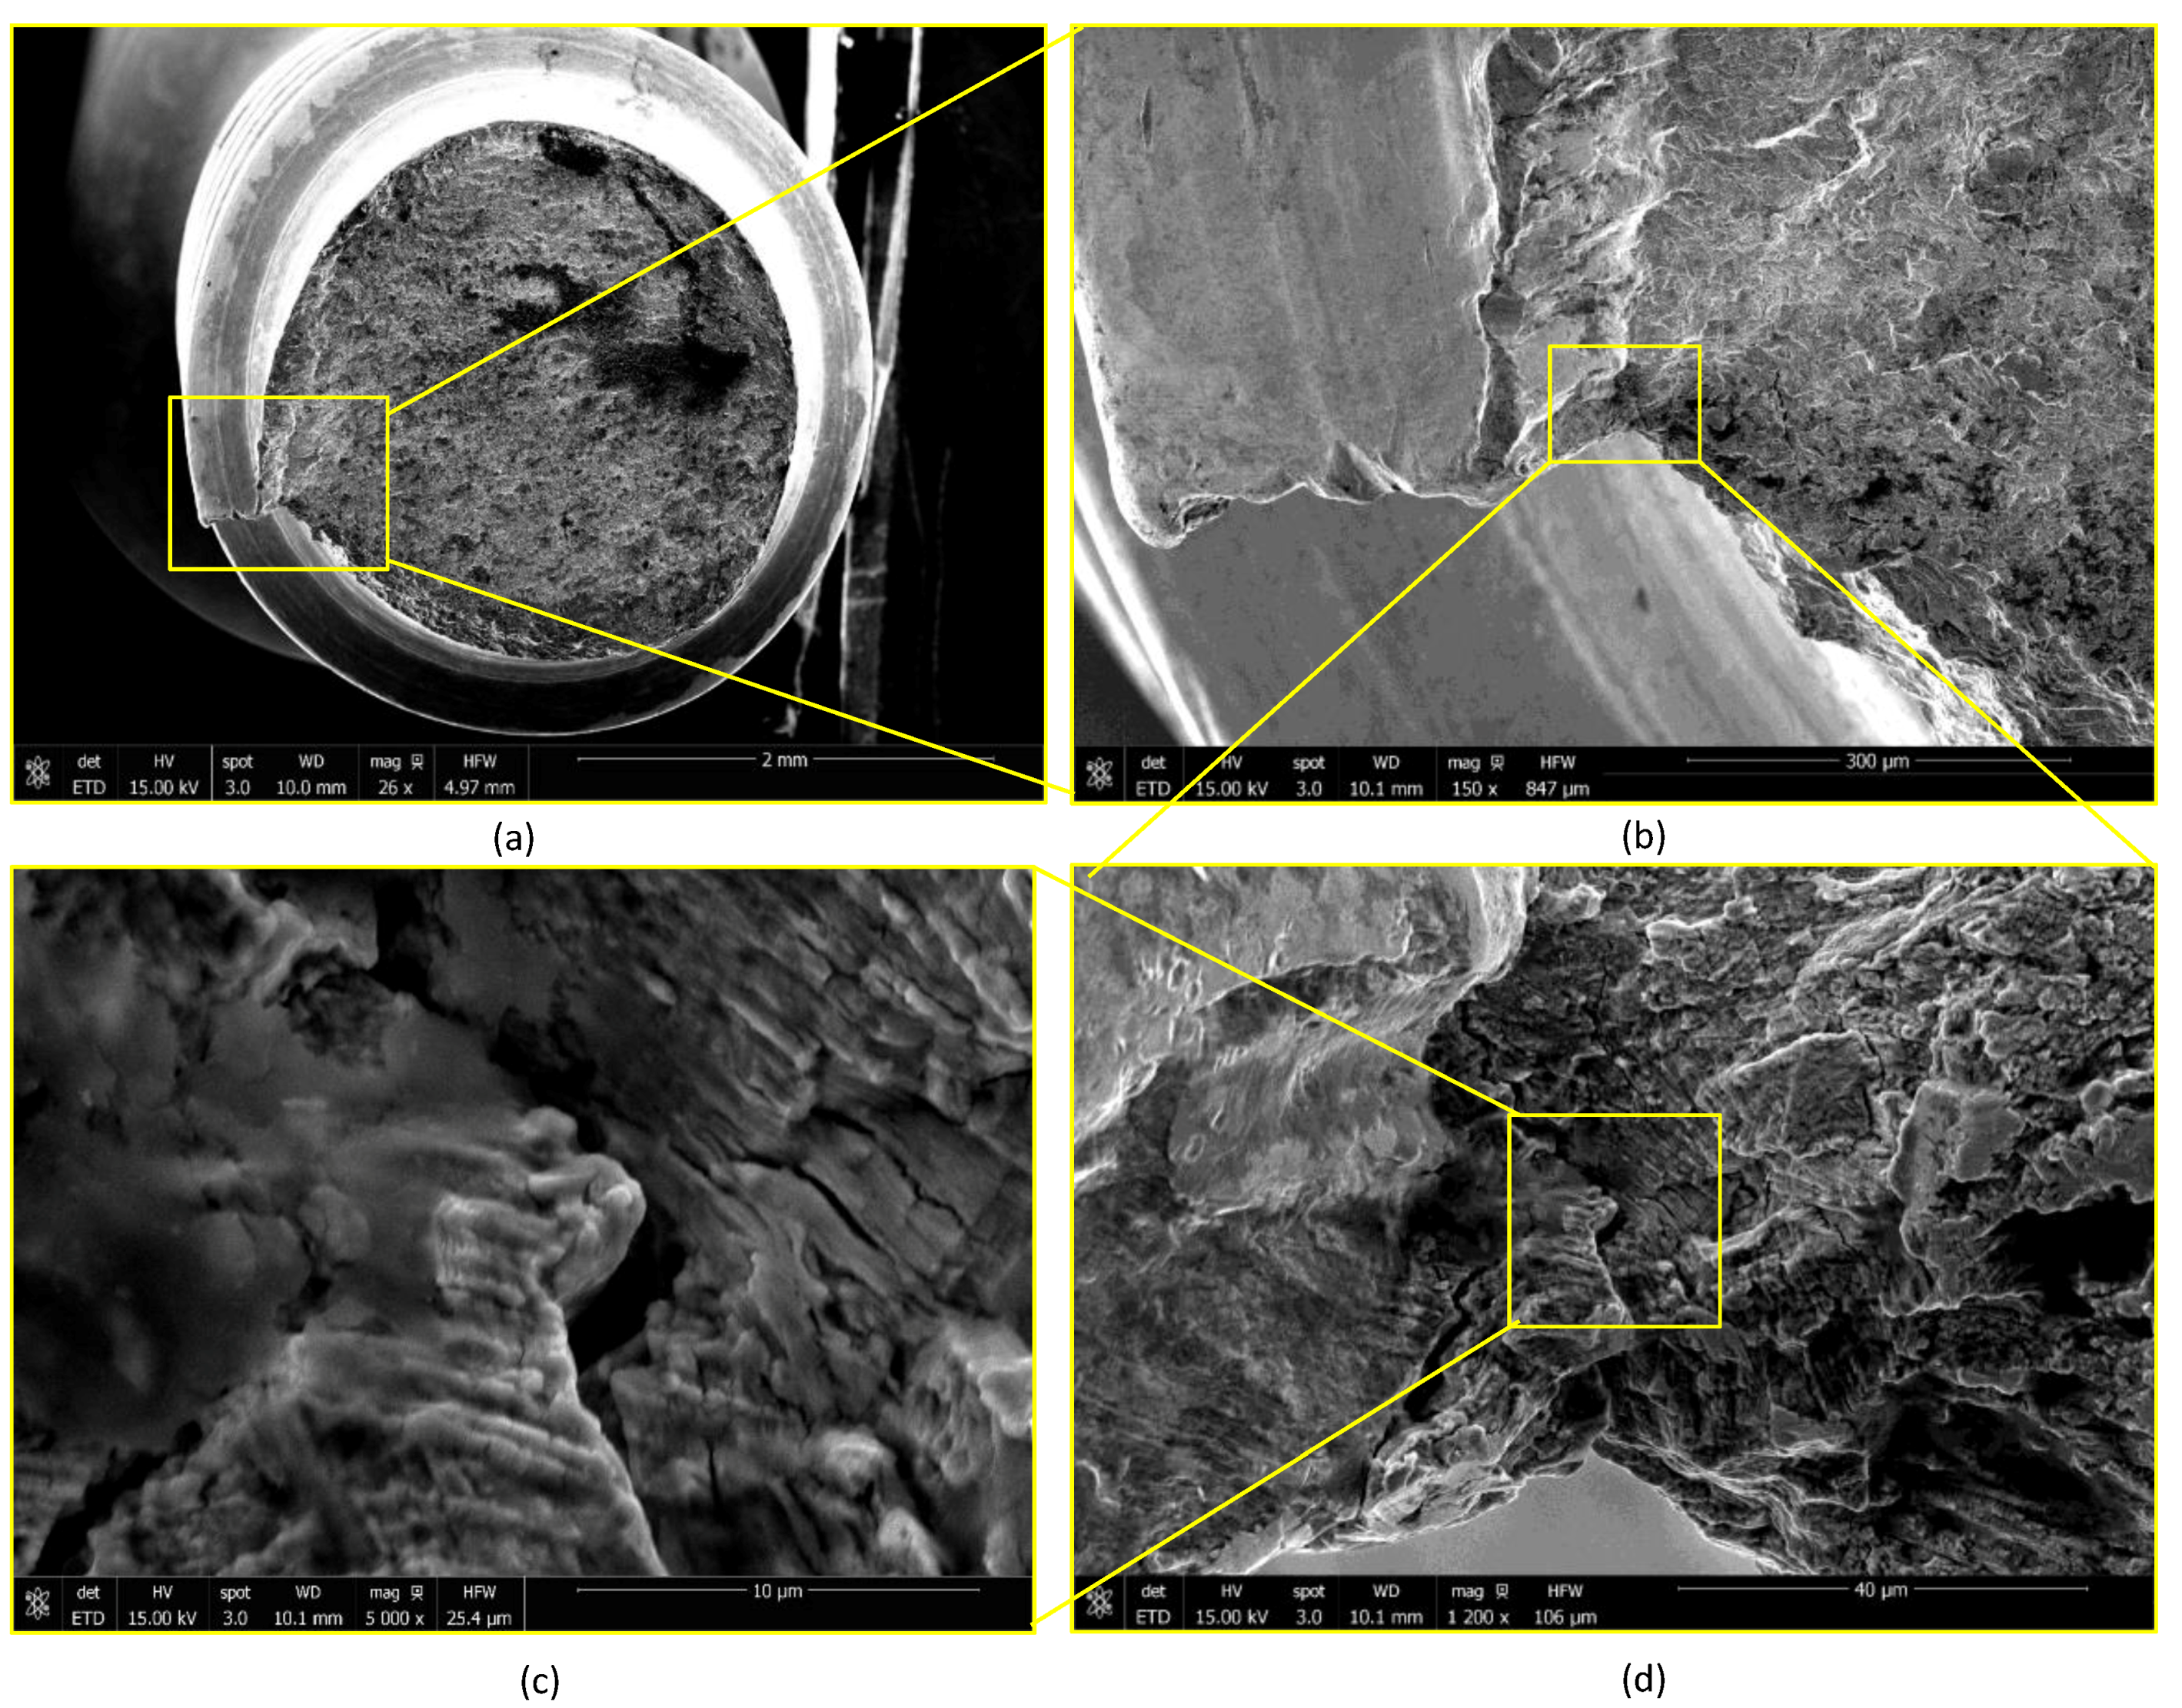
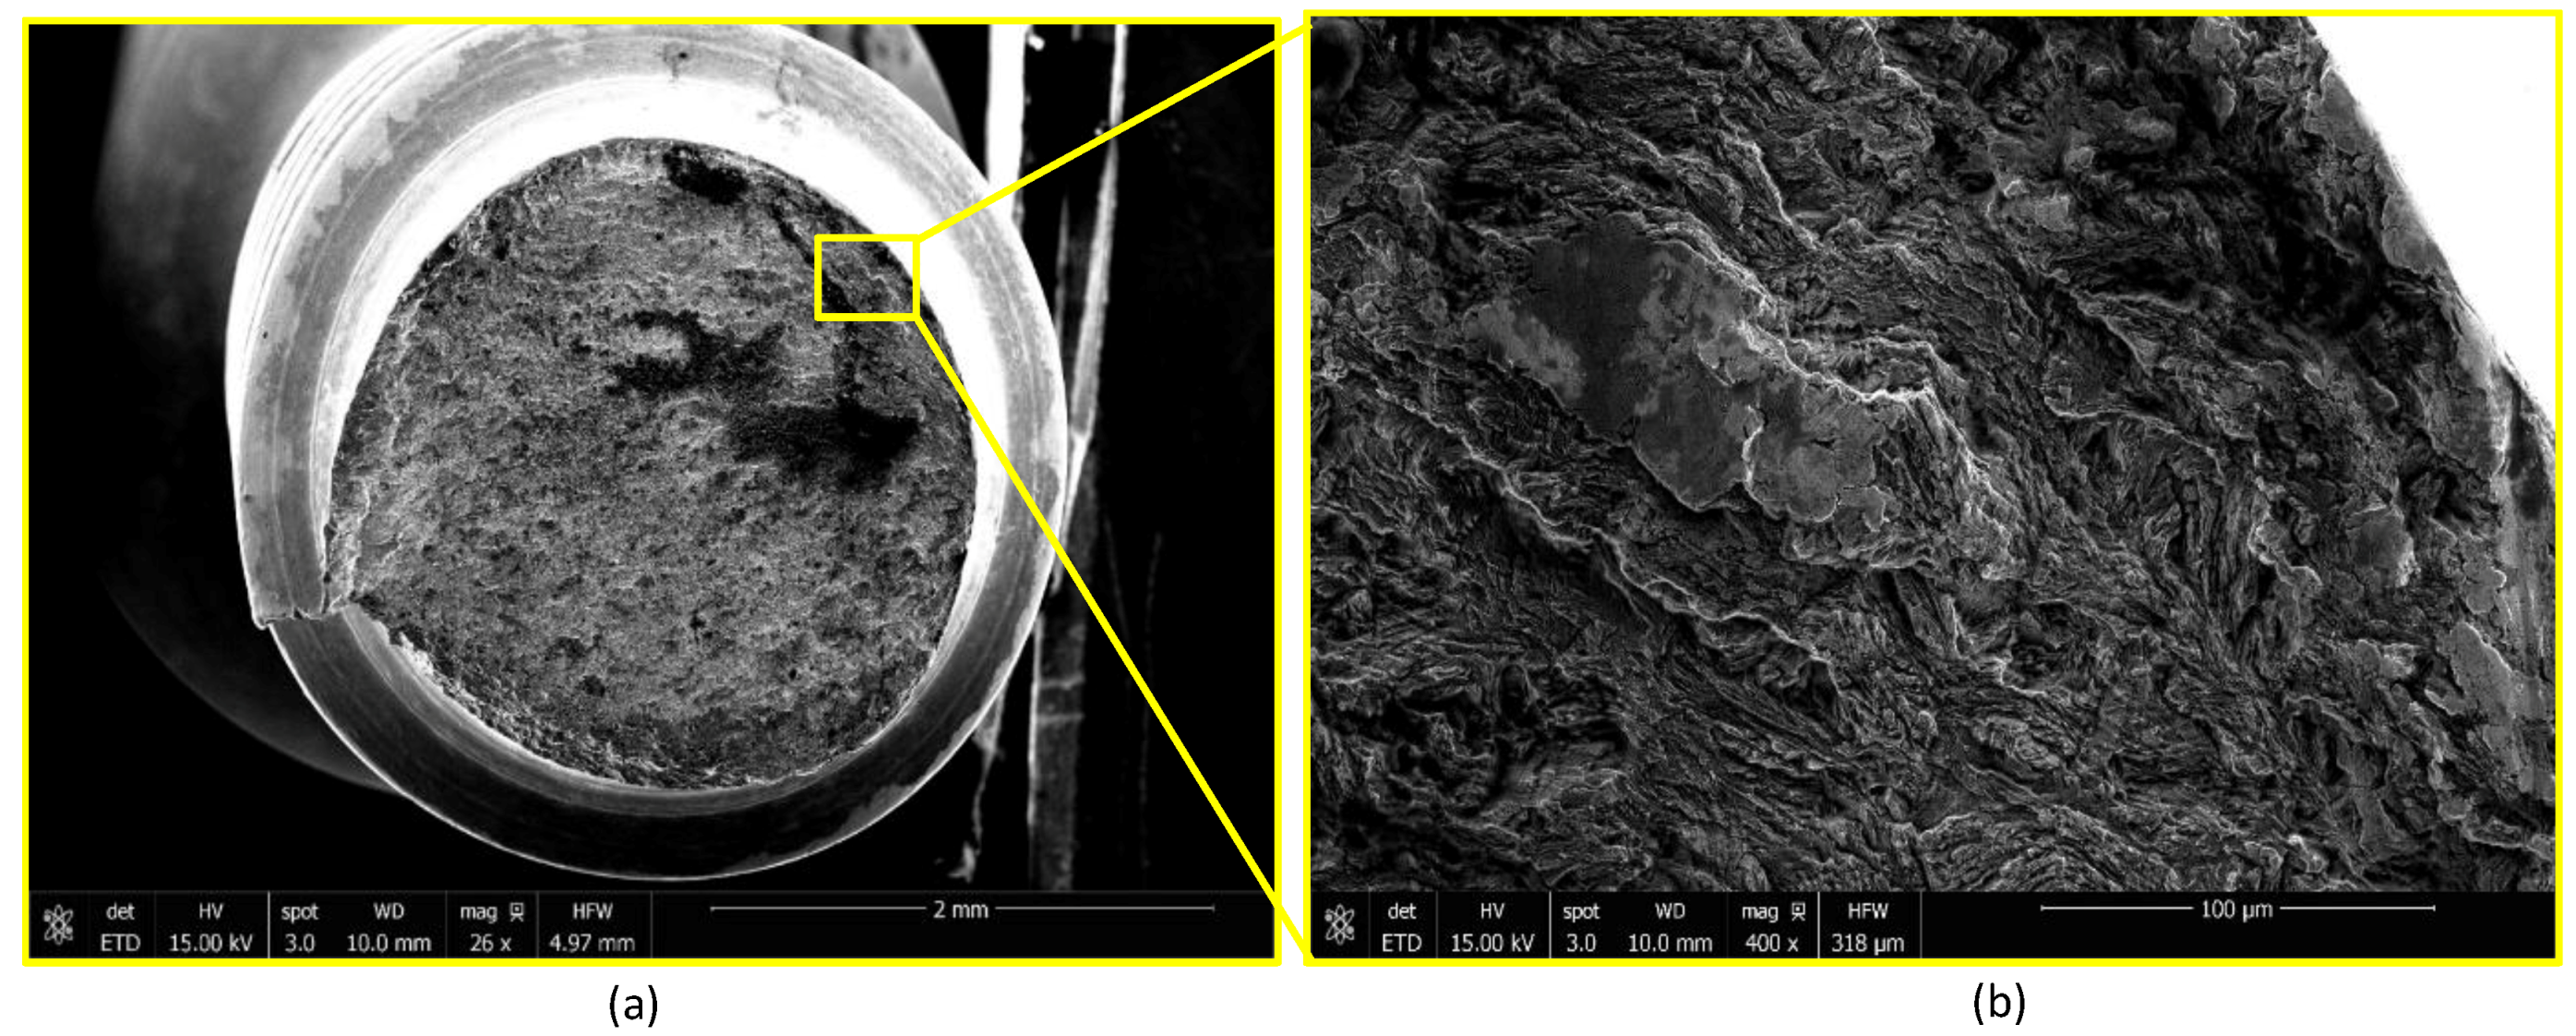
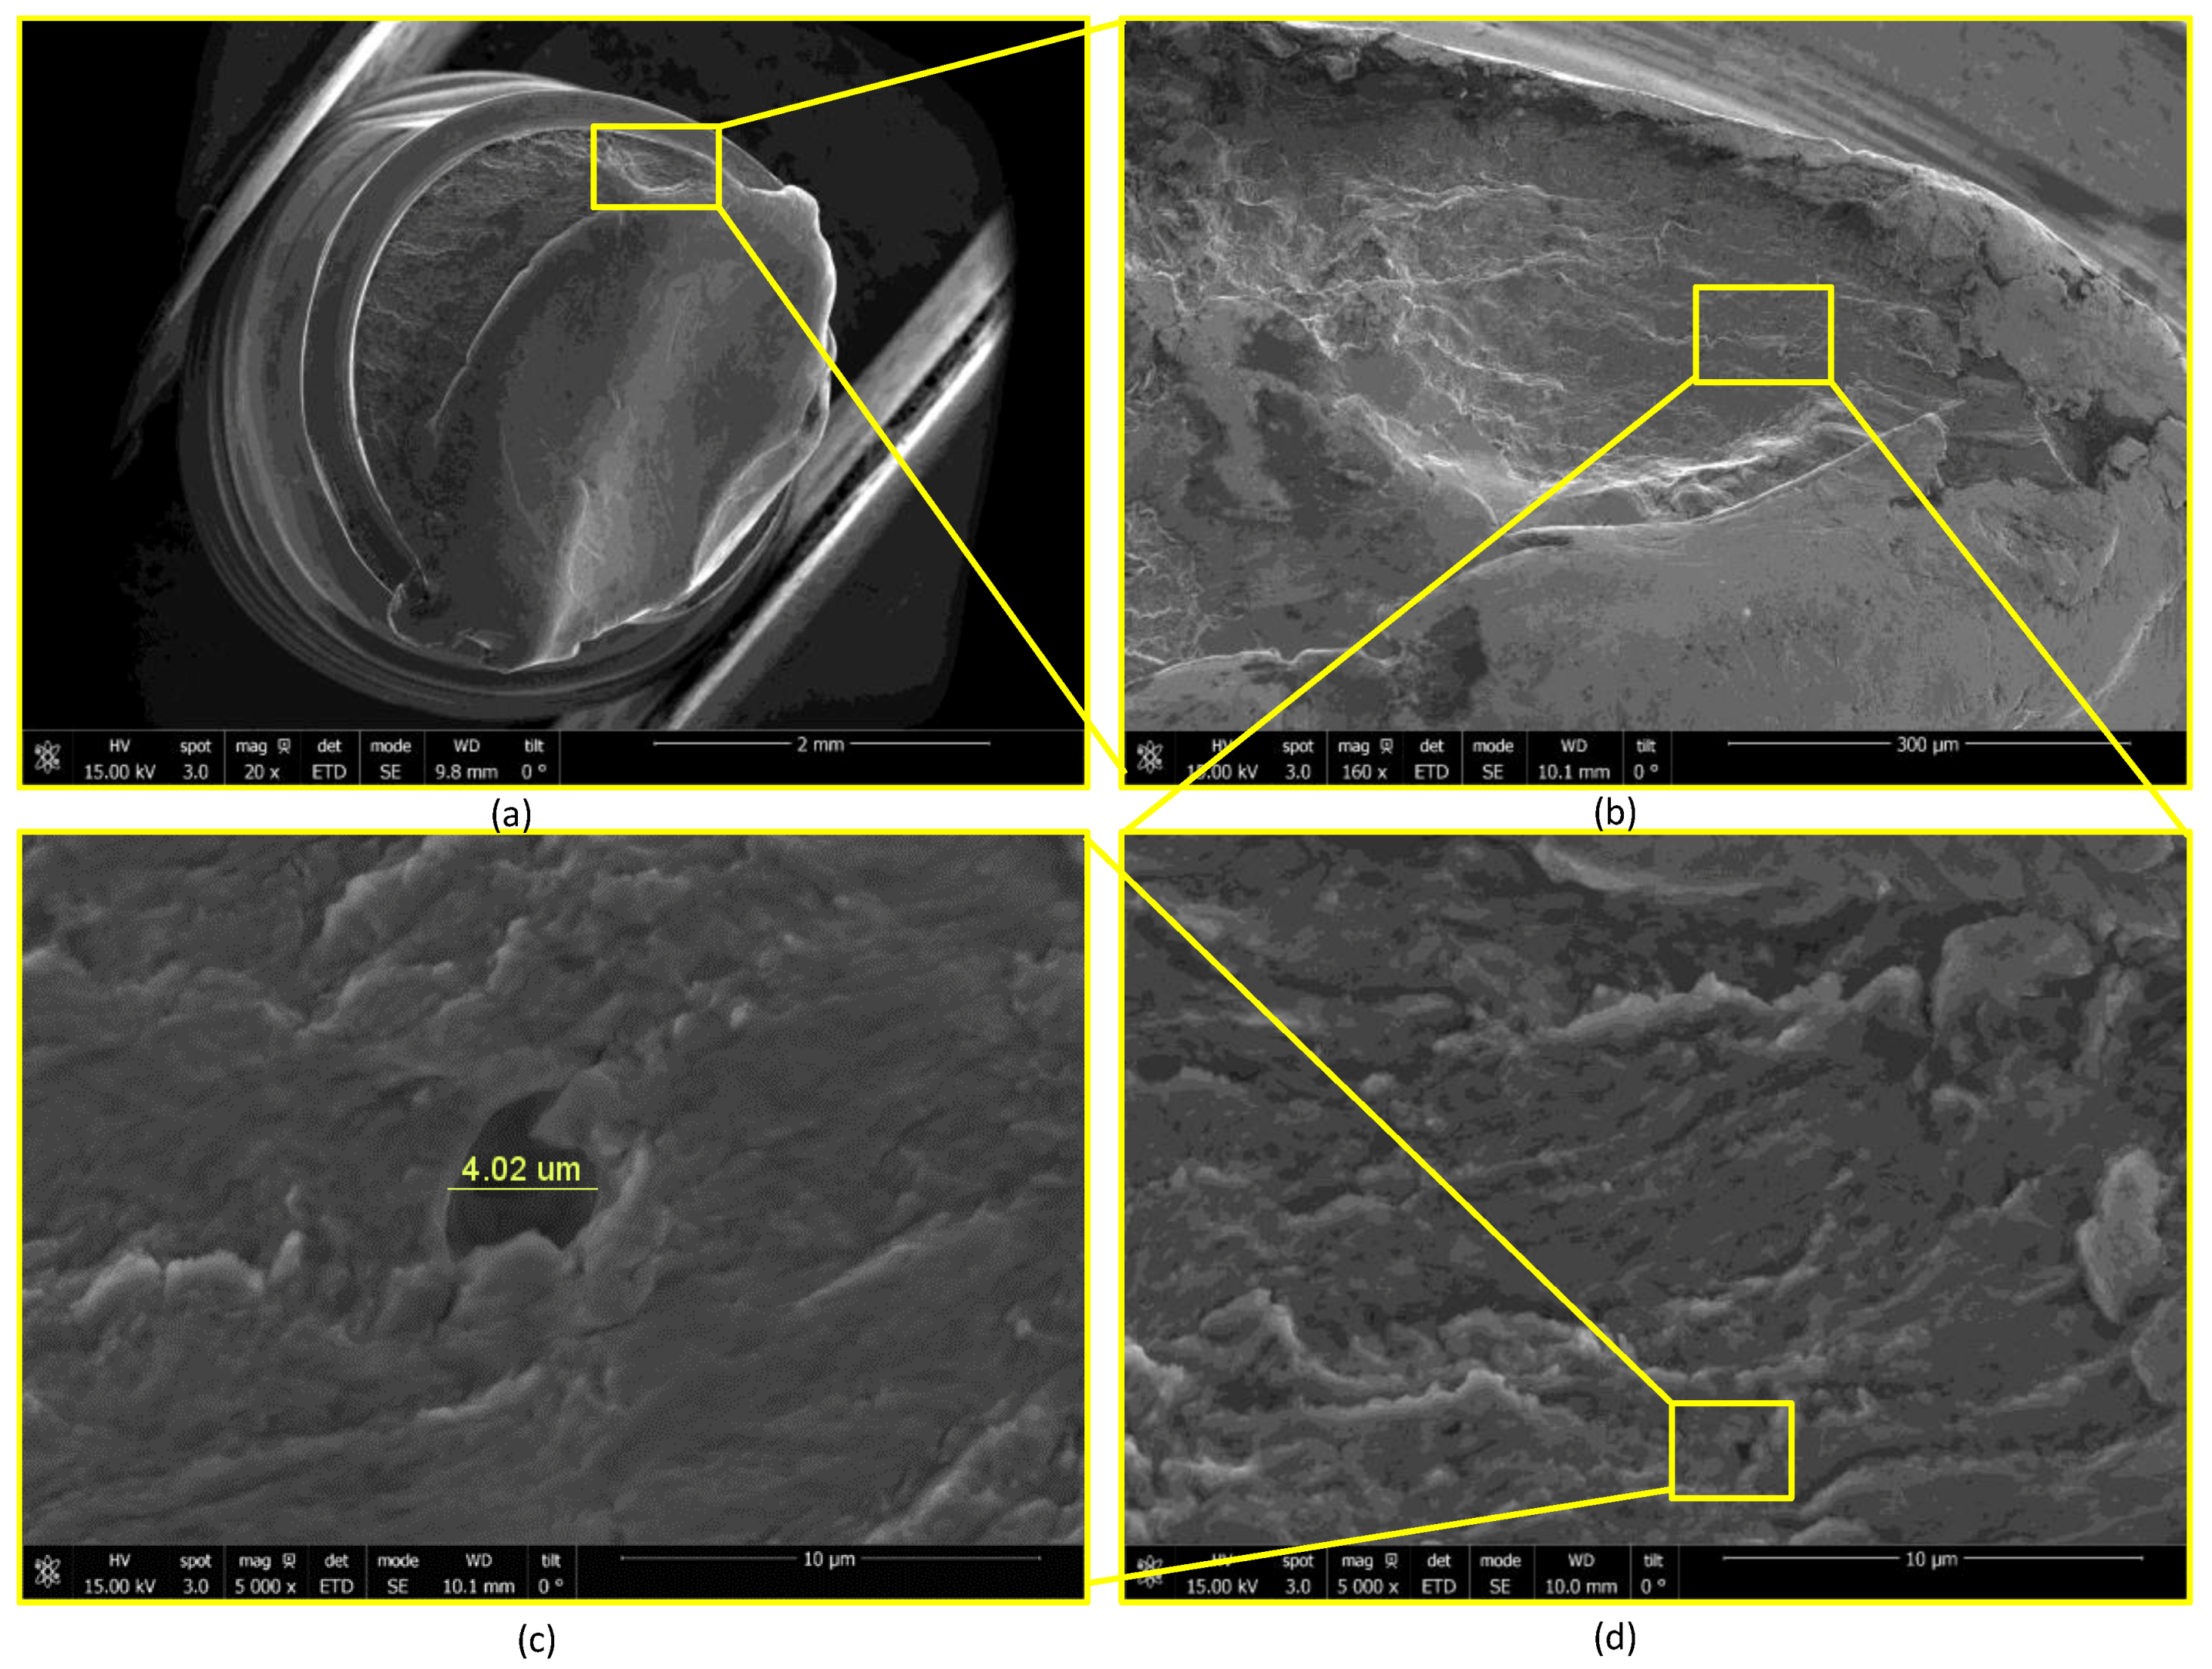
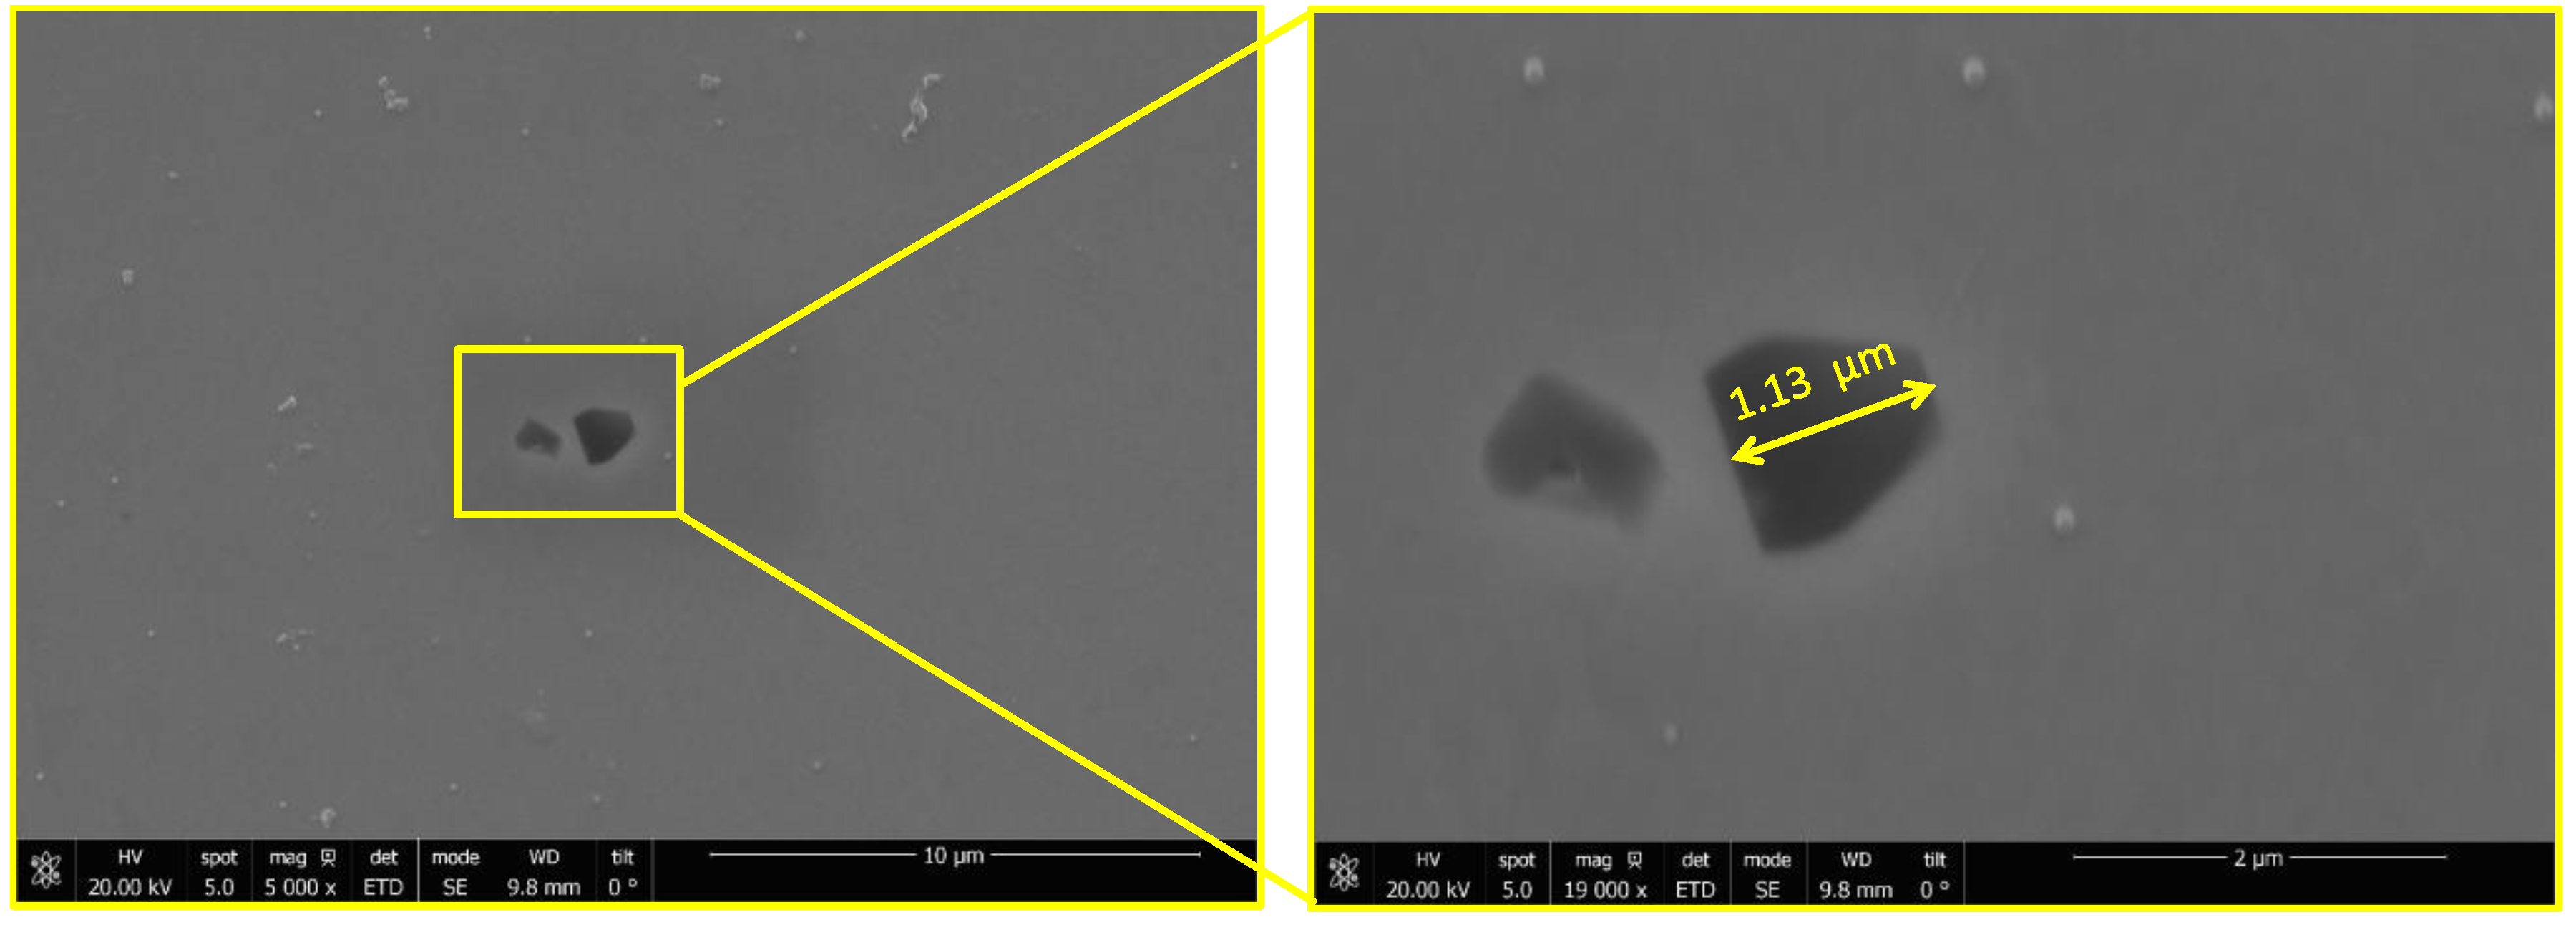
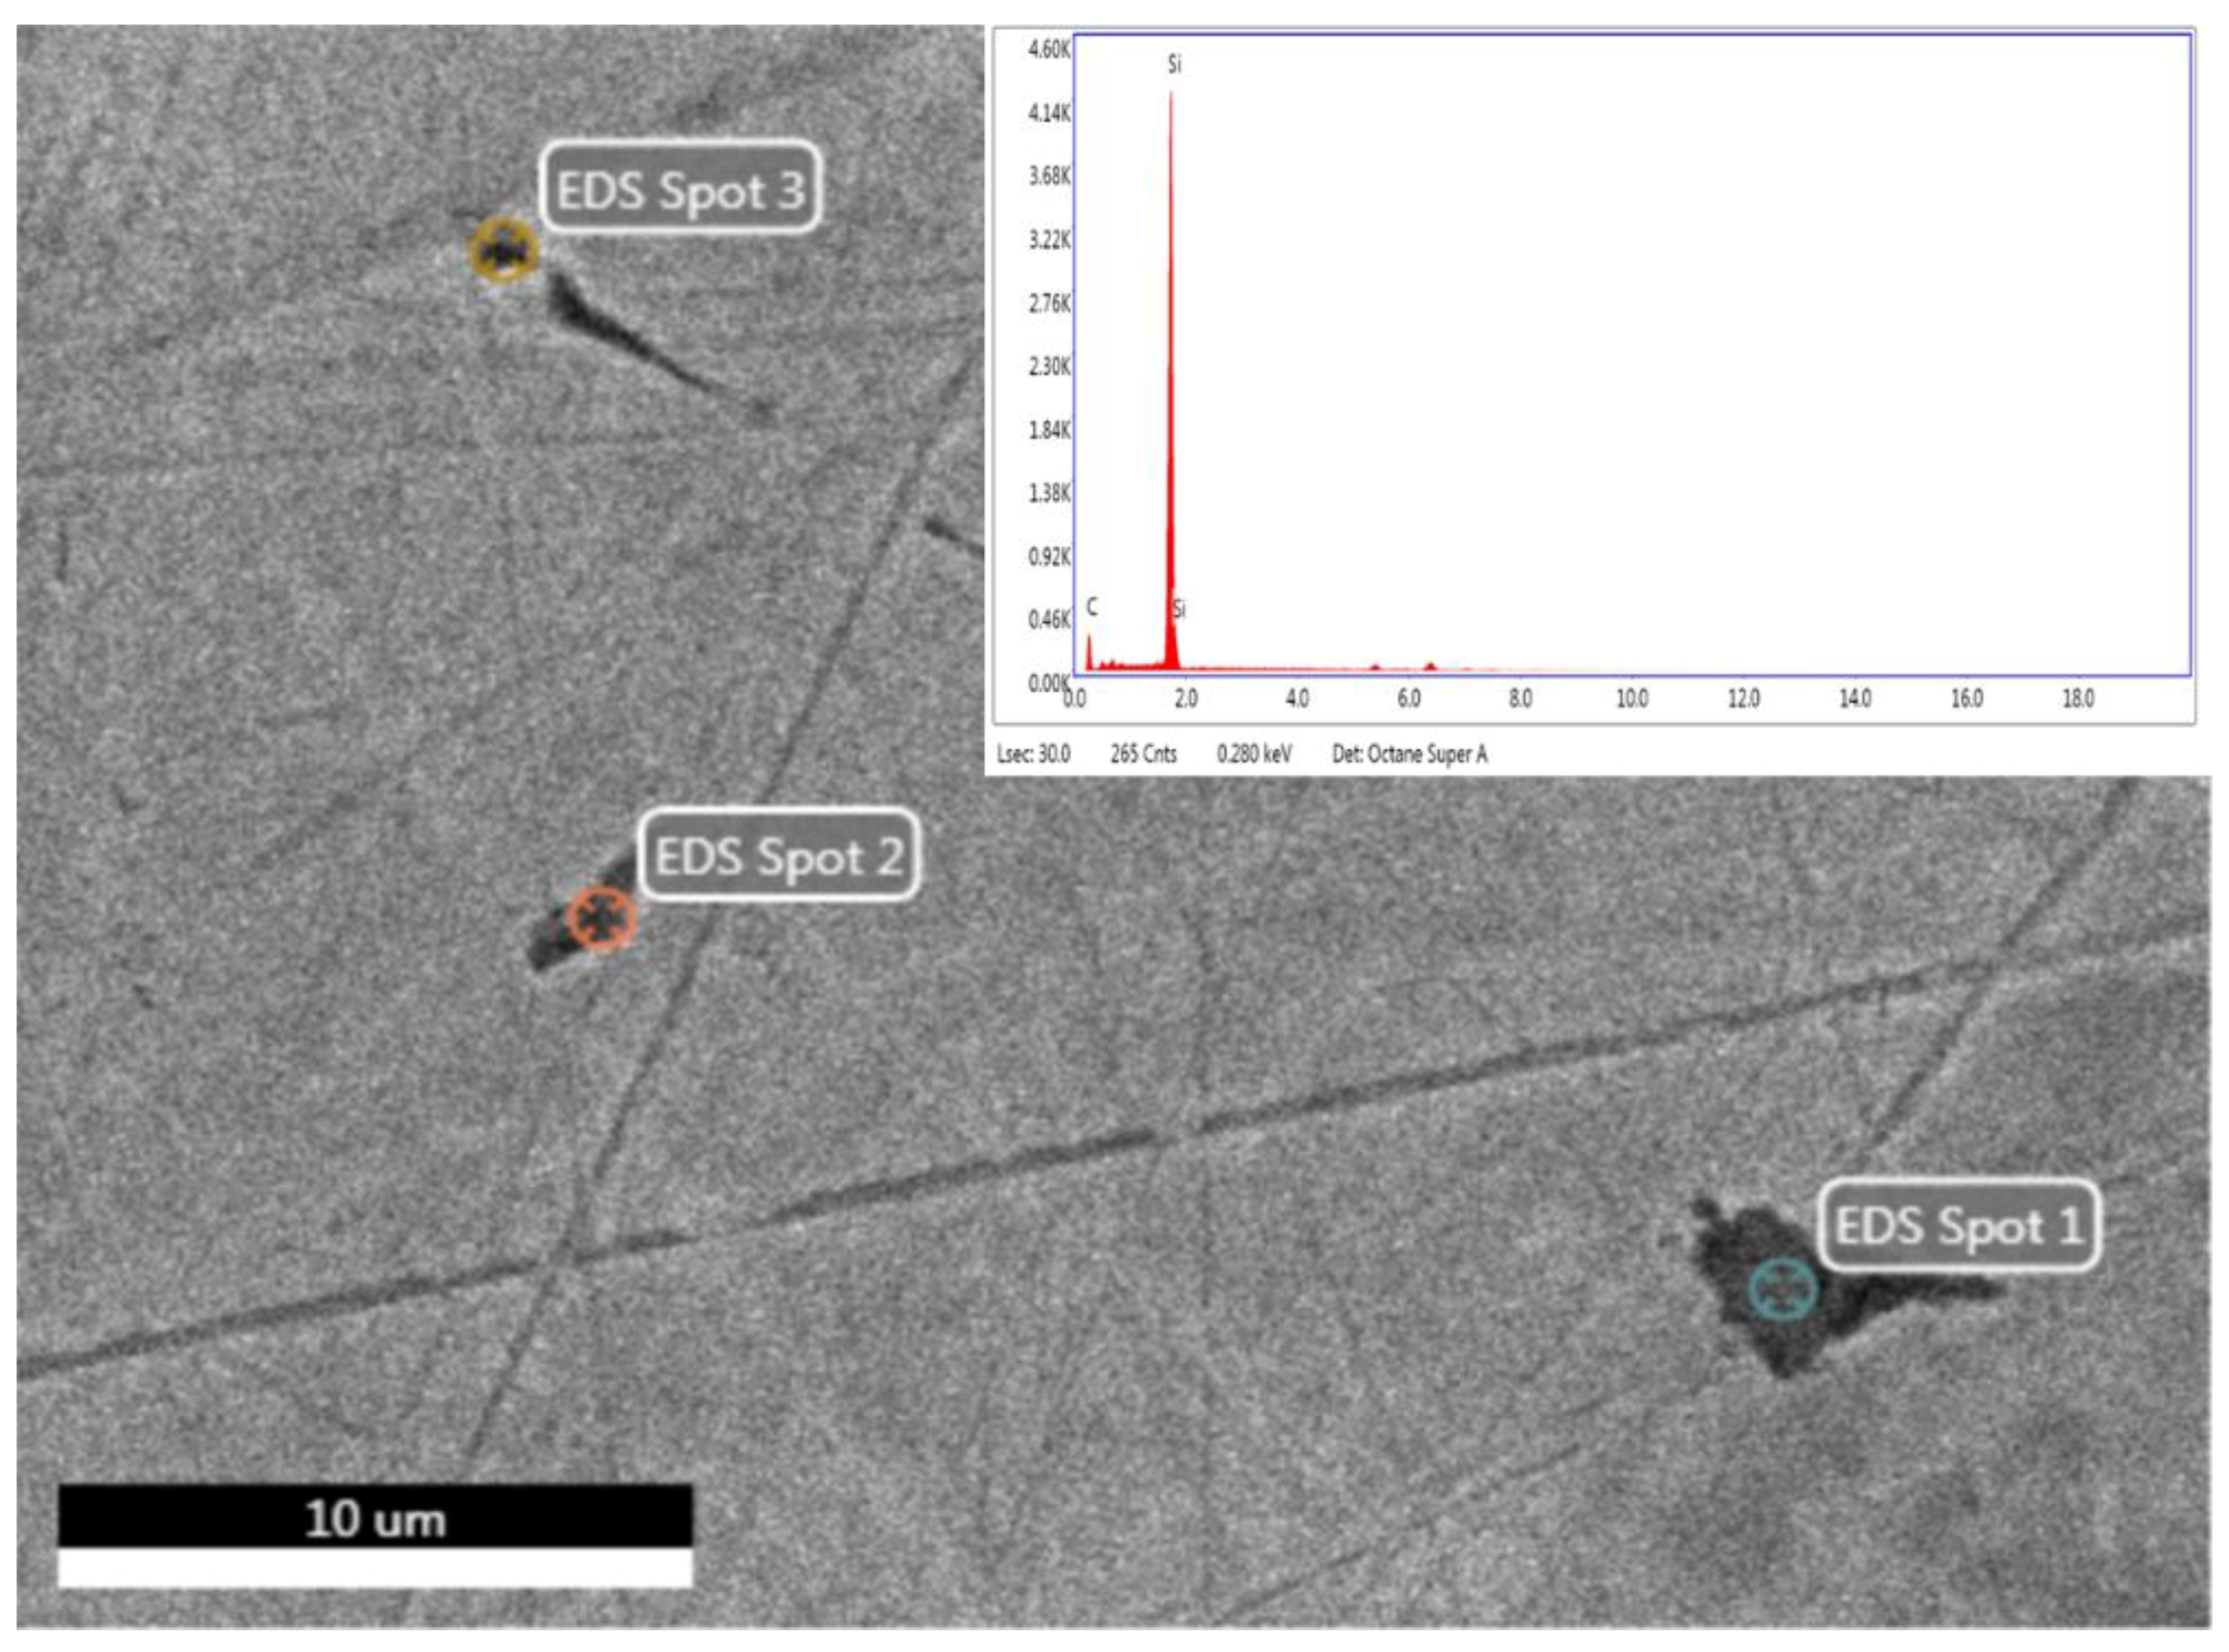
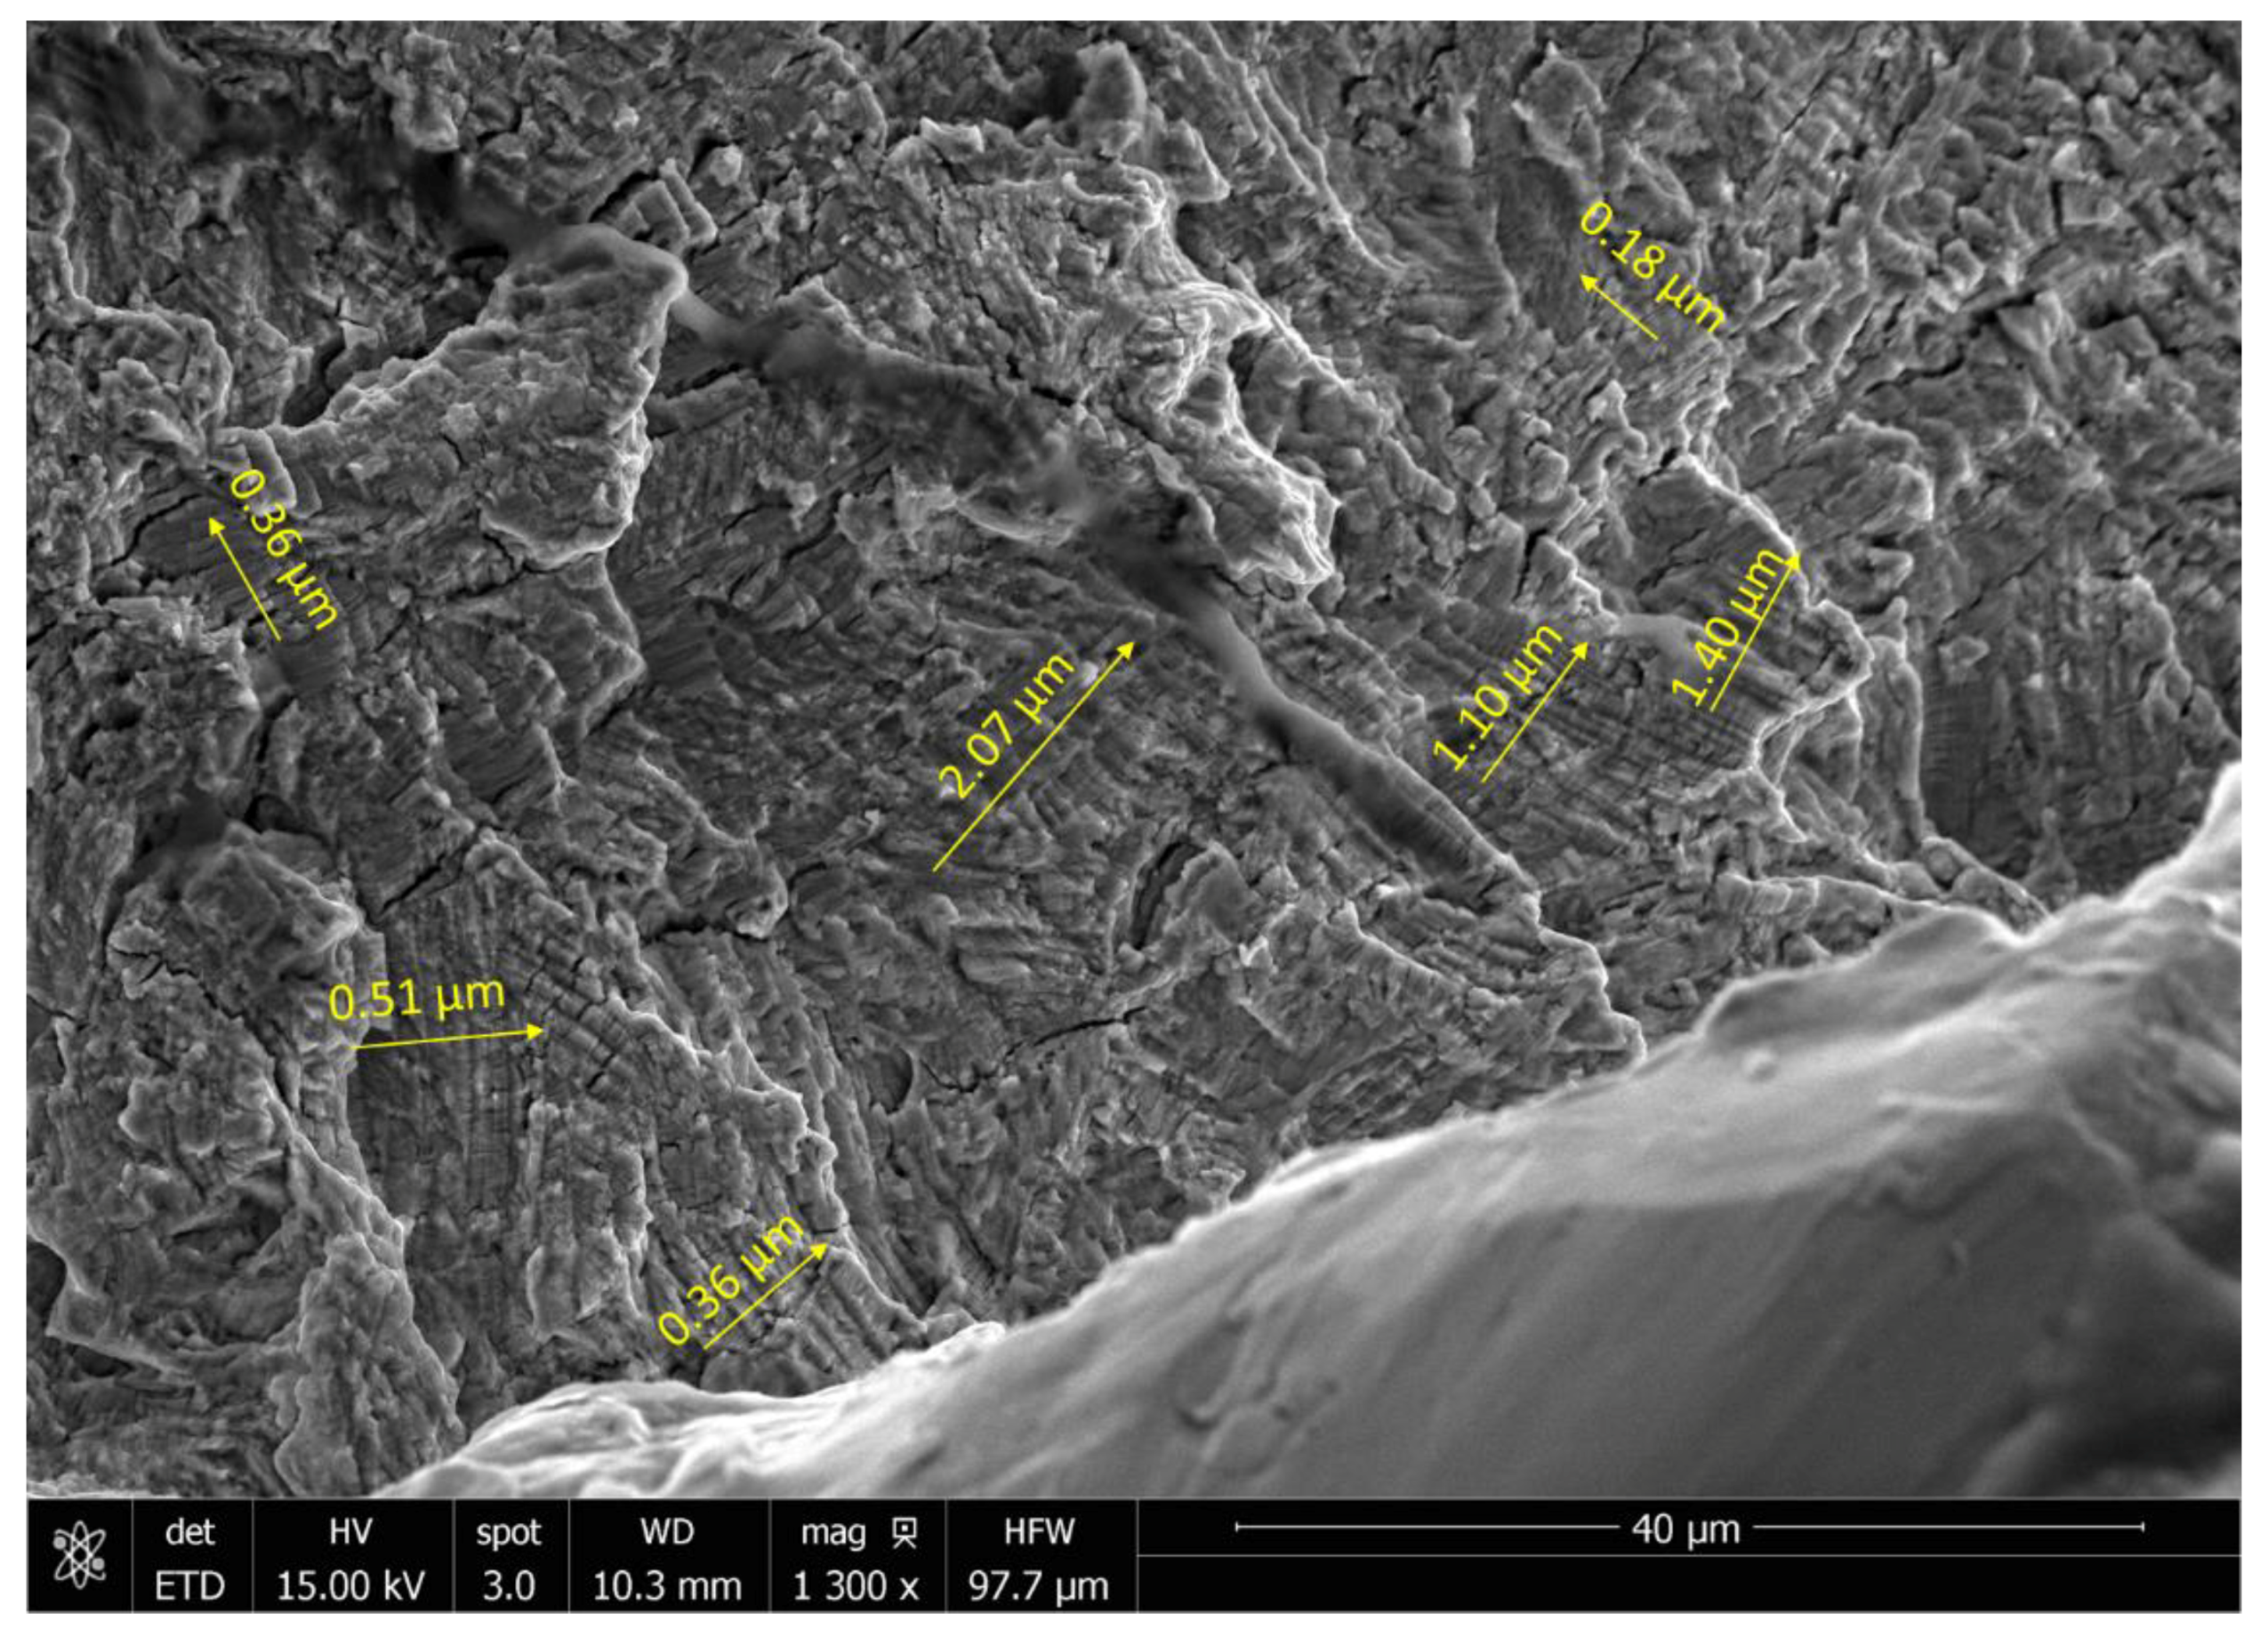
- The presence of surface scratching, inclusions, discoloration, corrosion pits, and beach marks, and cleavage and striations on the fracture surface.
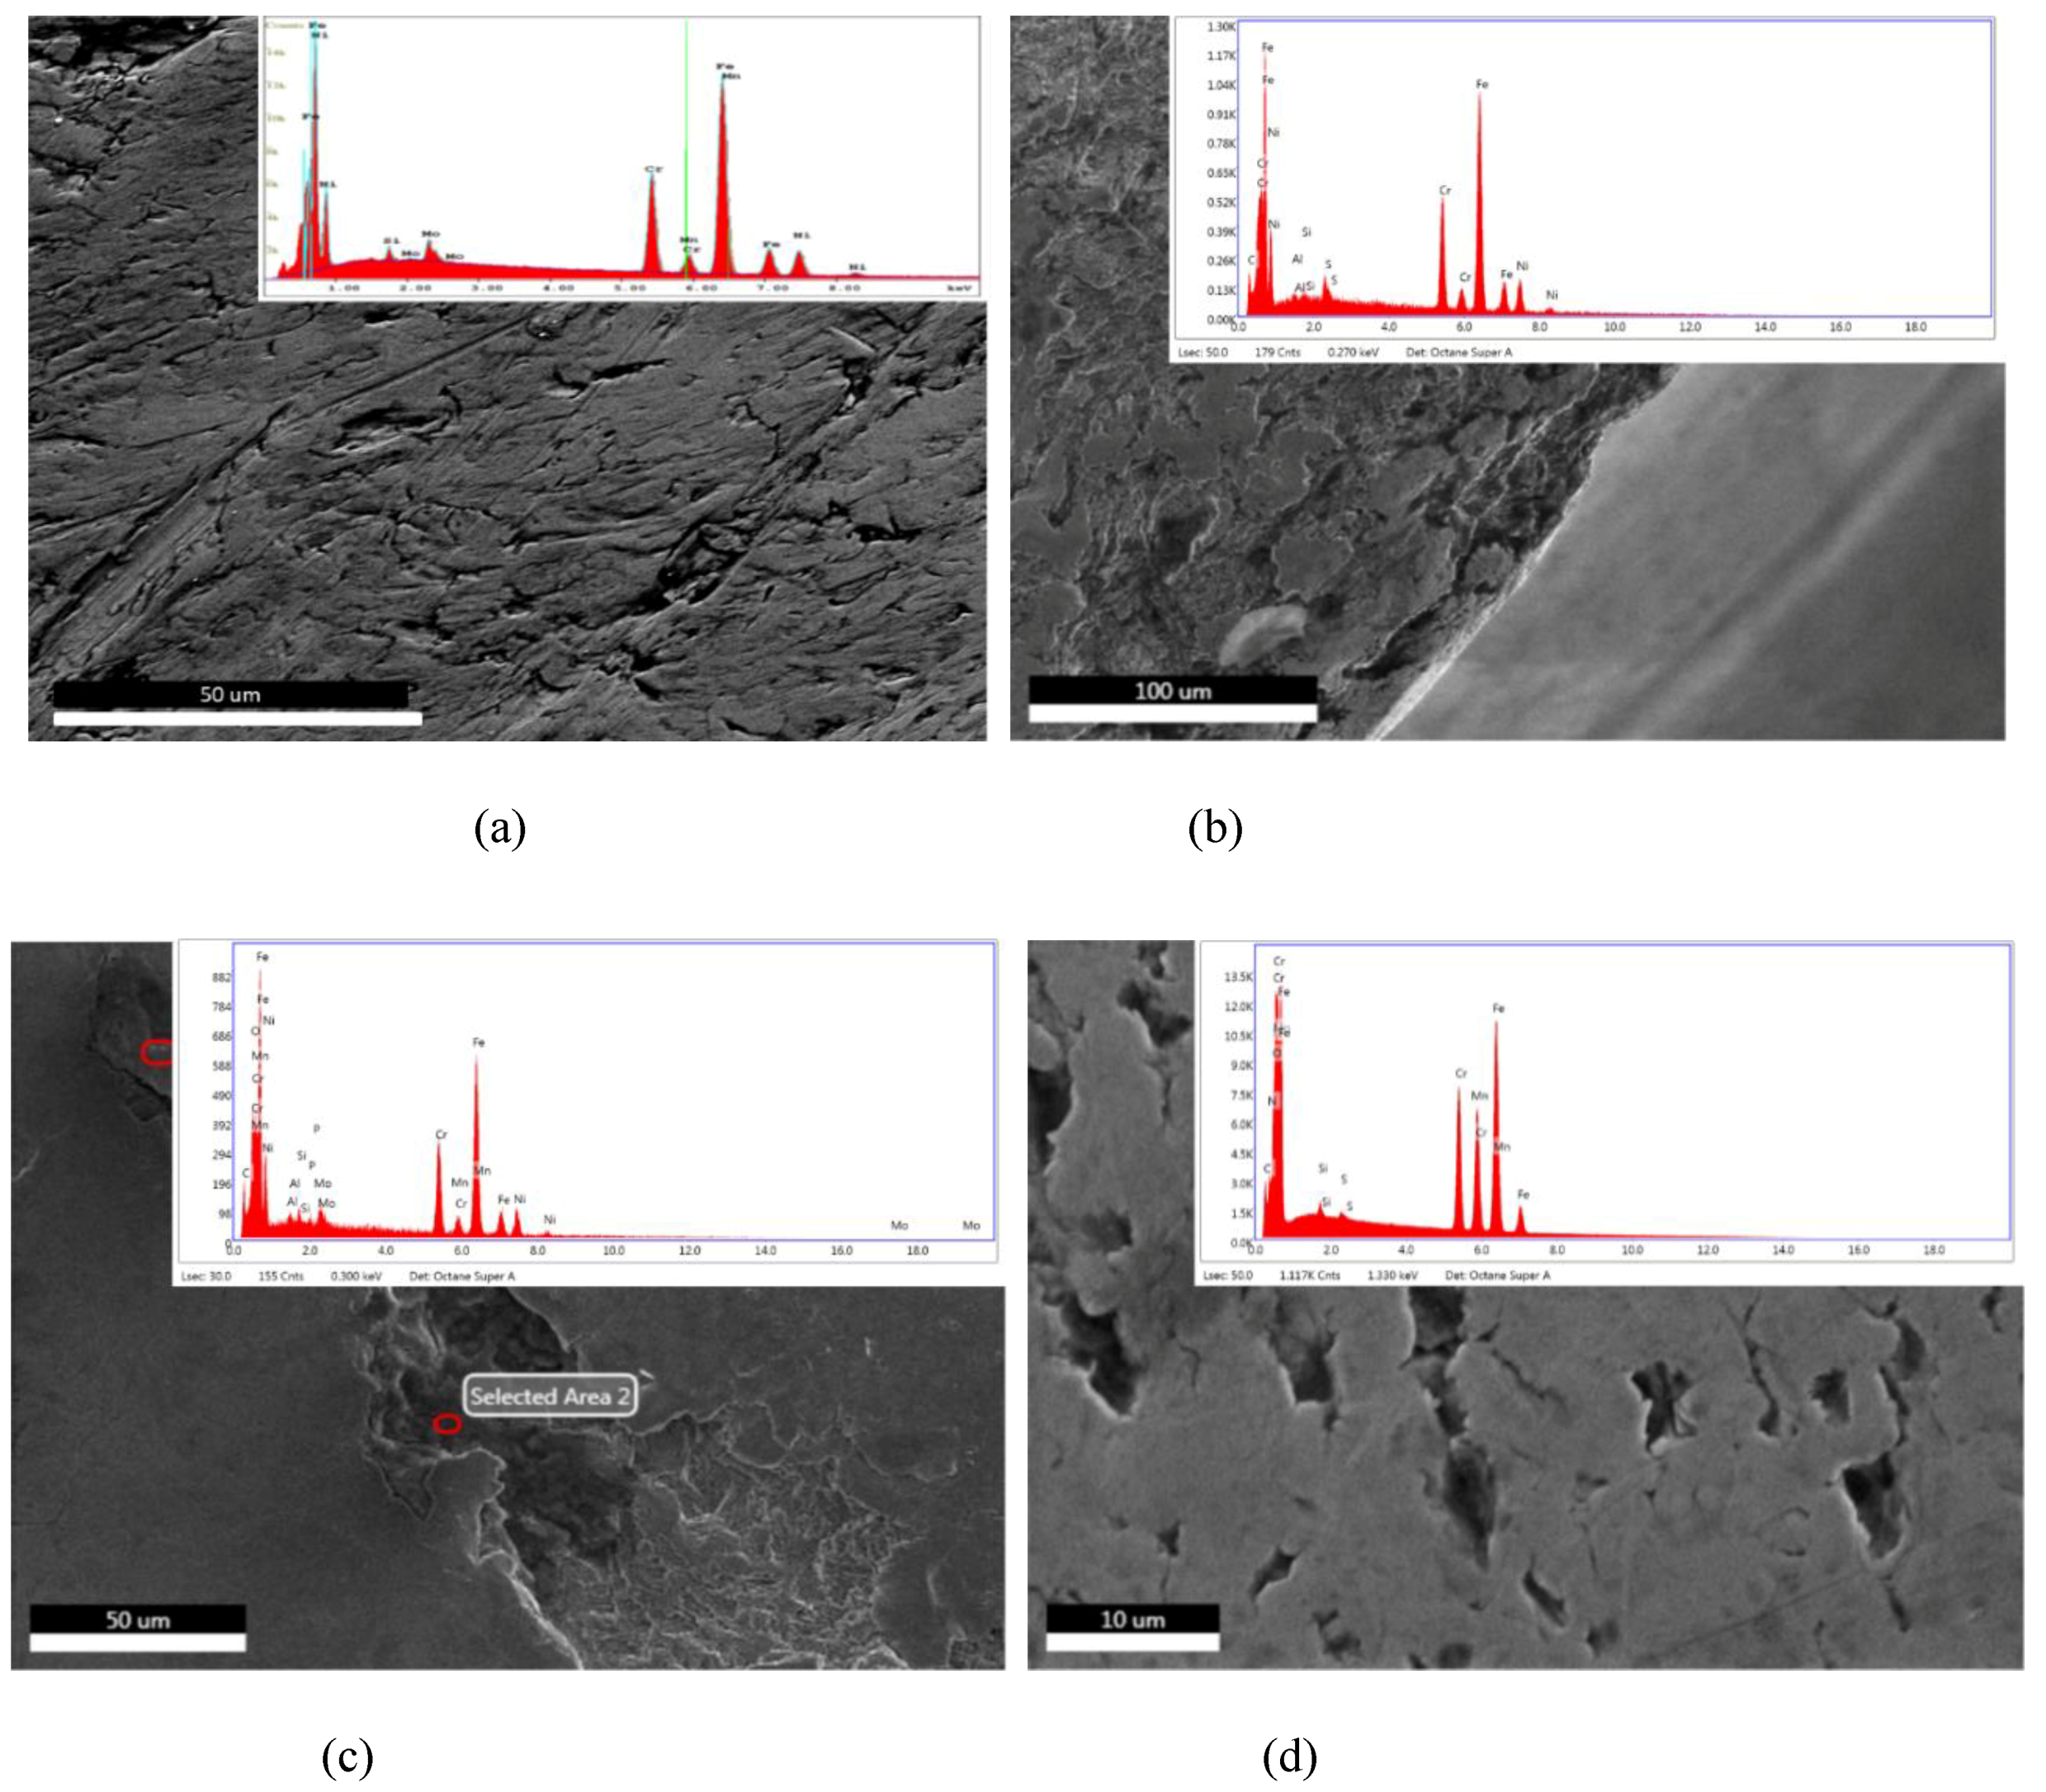
- The material of construction of the device was governed by ASTM F138-8 or its ISO equivalent 5832 and exhibited inconsistencies in chemistry and hardness requirements.
- An interaction of S, Ni, and Mo-based inclusions may have raised pitting susceptibility of the PHILOS construct. These features suggest that the device underwent damage by pitting the corrosion-fatigue mechanism and overloading towards the end to fail the plate and screws in two or more components.
- Upon linking with the screw-holes, a crack, perpendicular to the loading direction also propagated resulting in multiple fractures. The screws failed via the conjoint bending and torsion fatigue mechanisms.
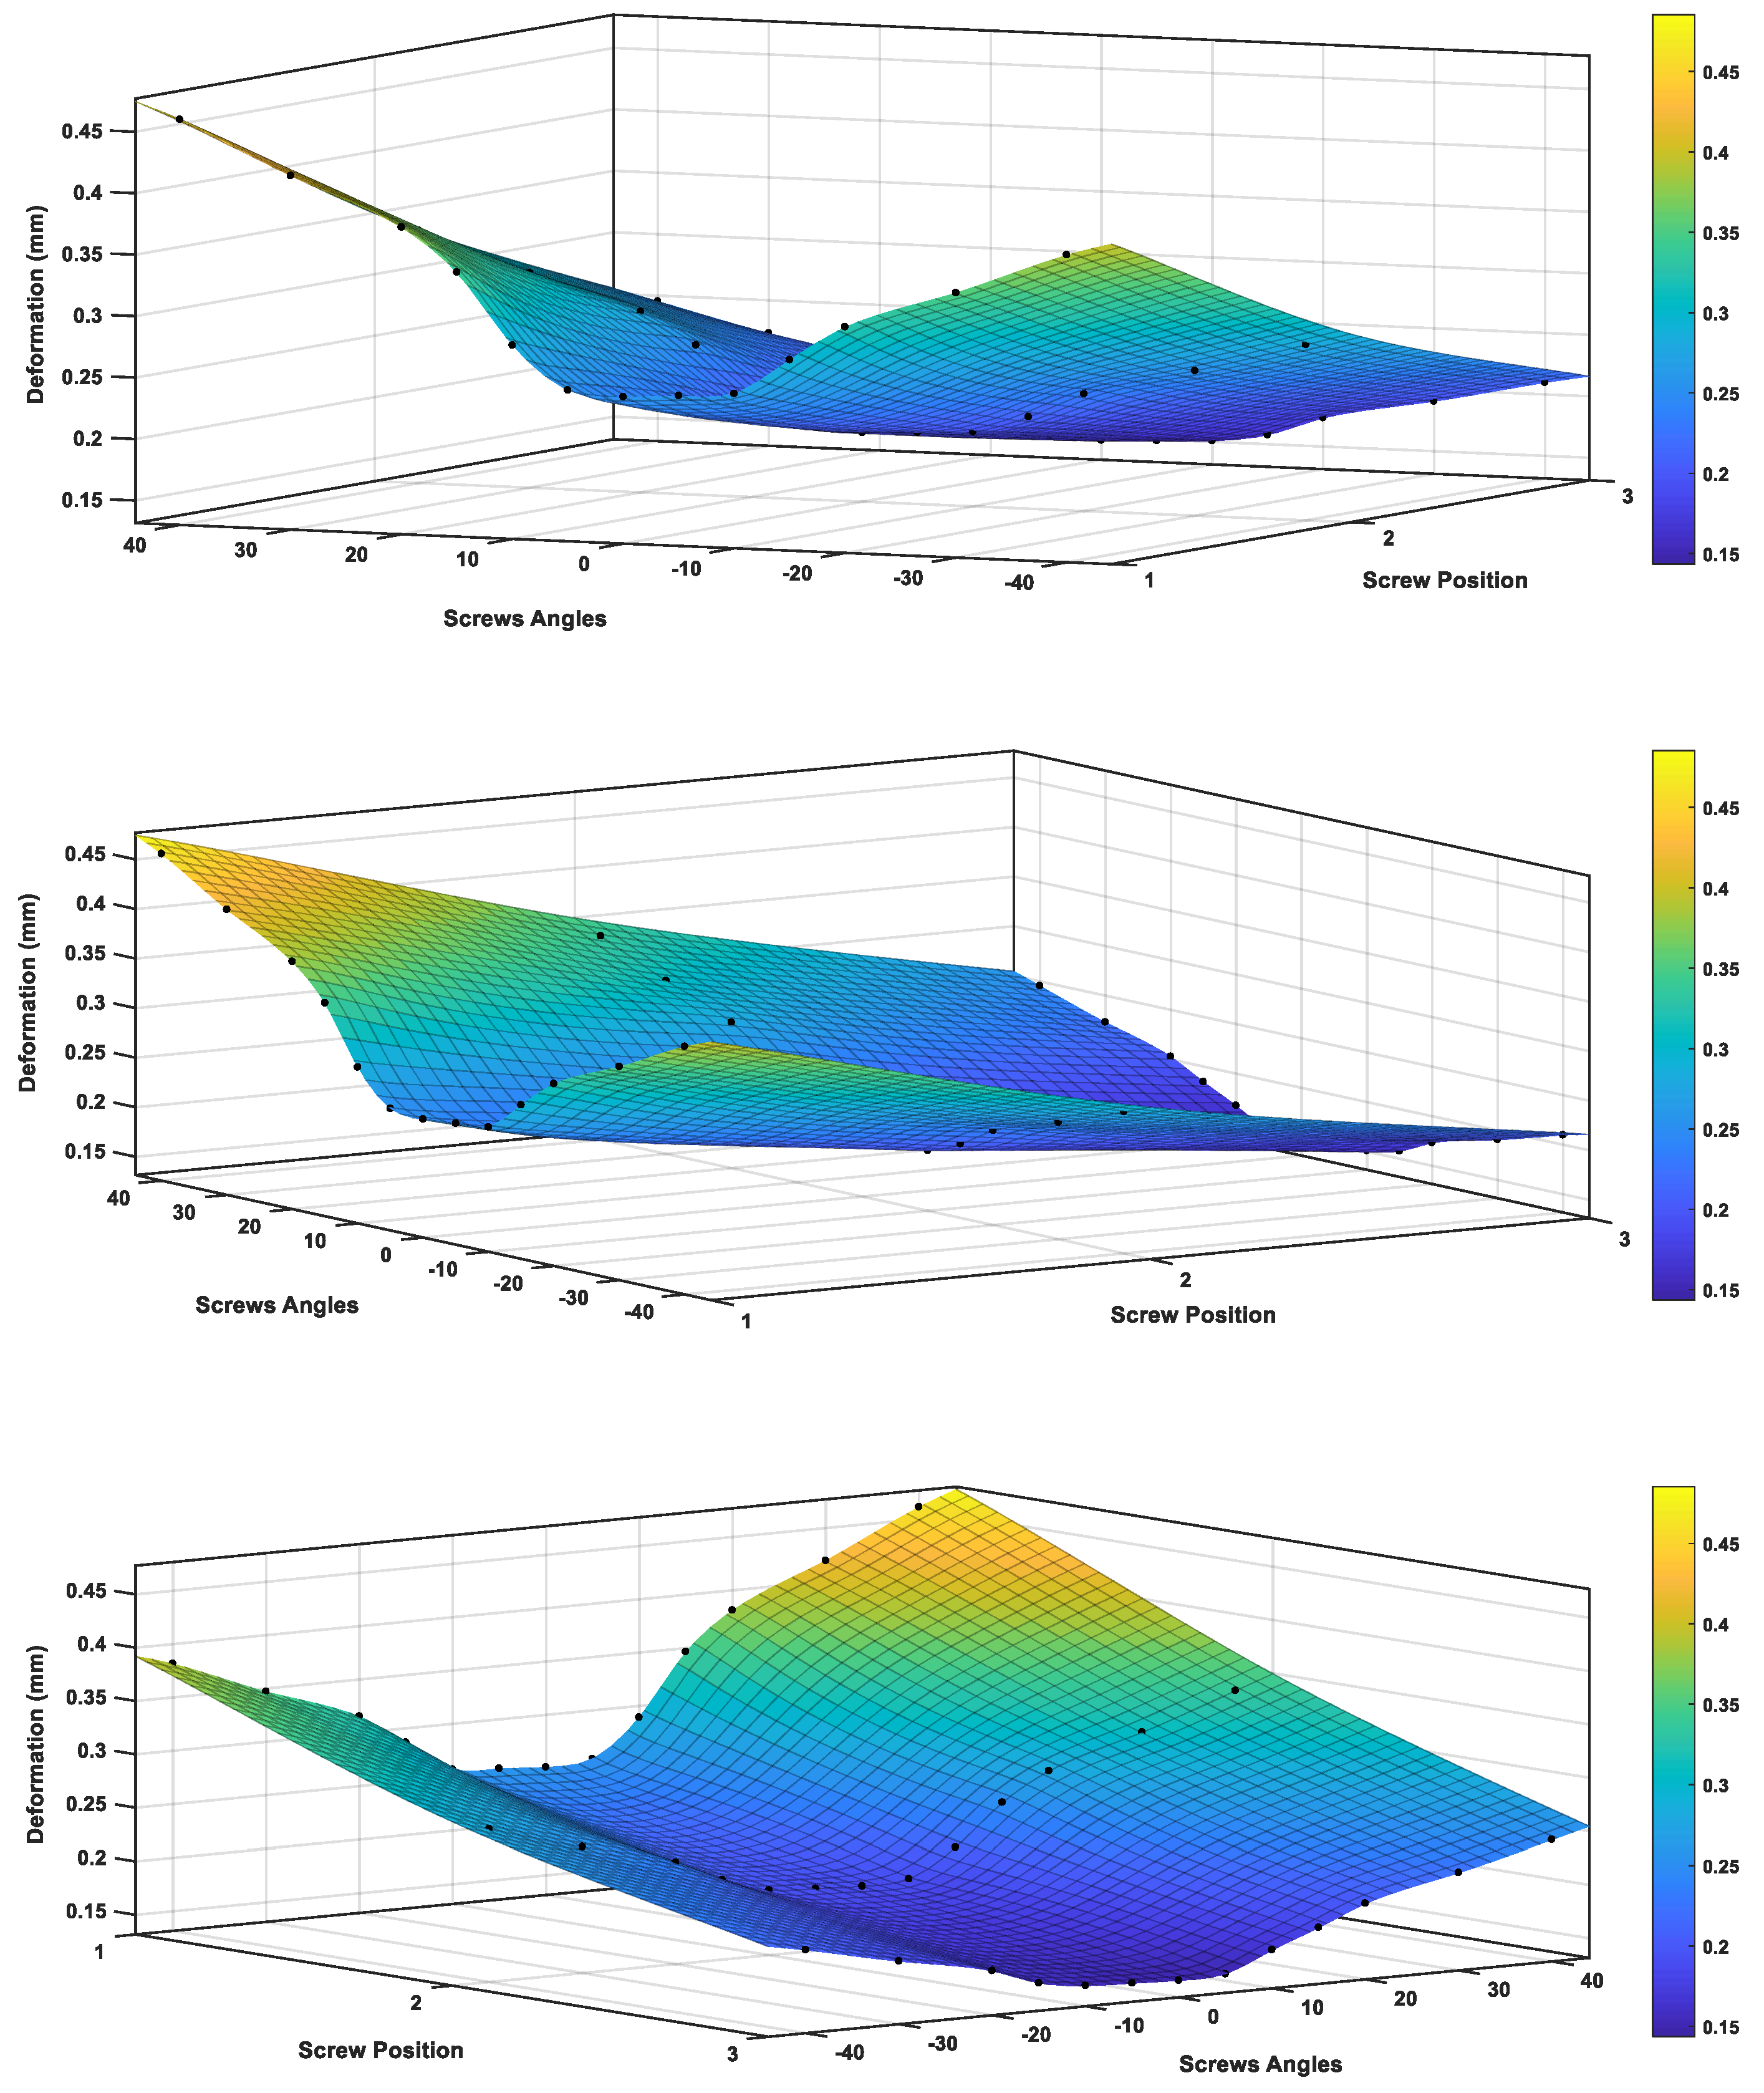
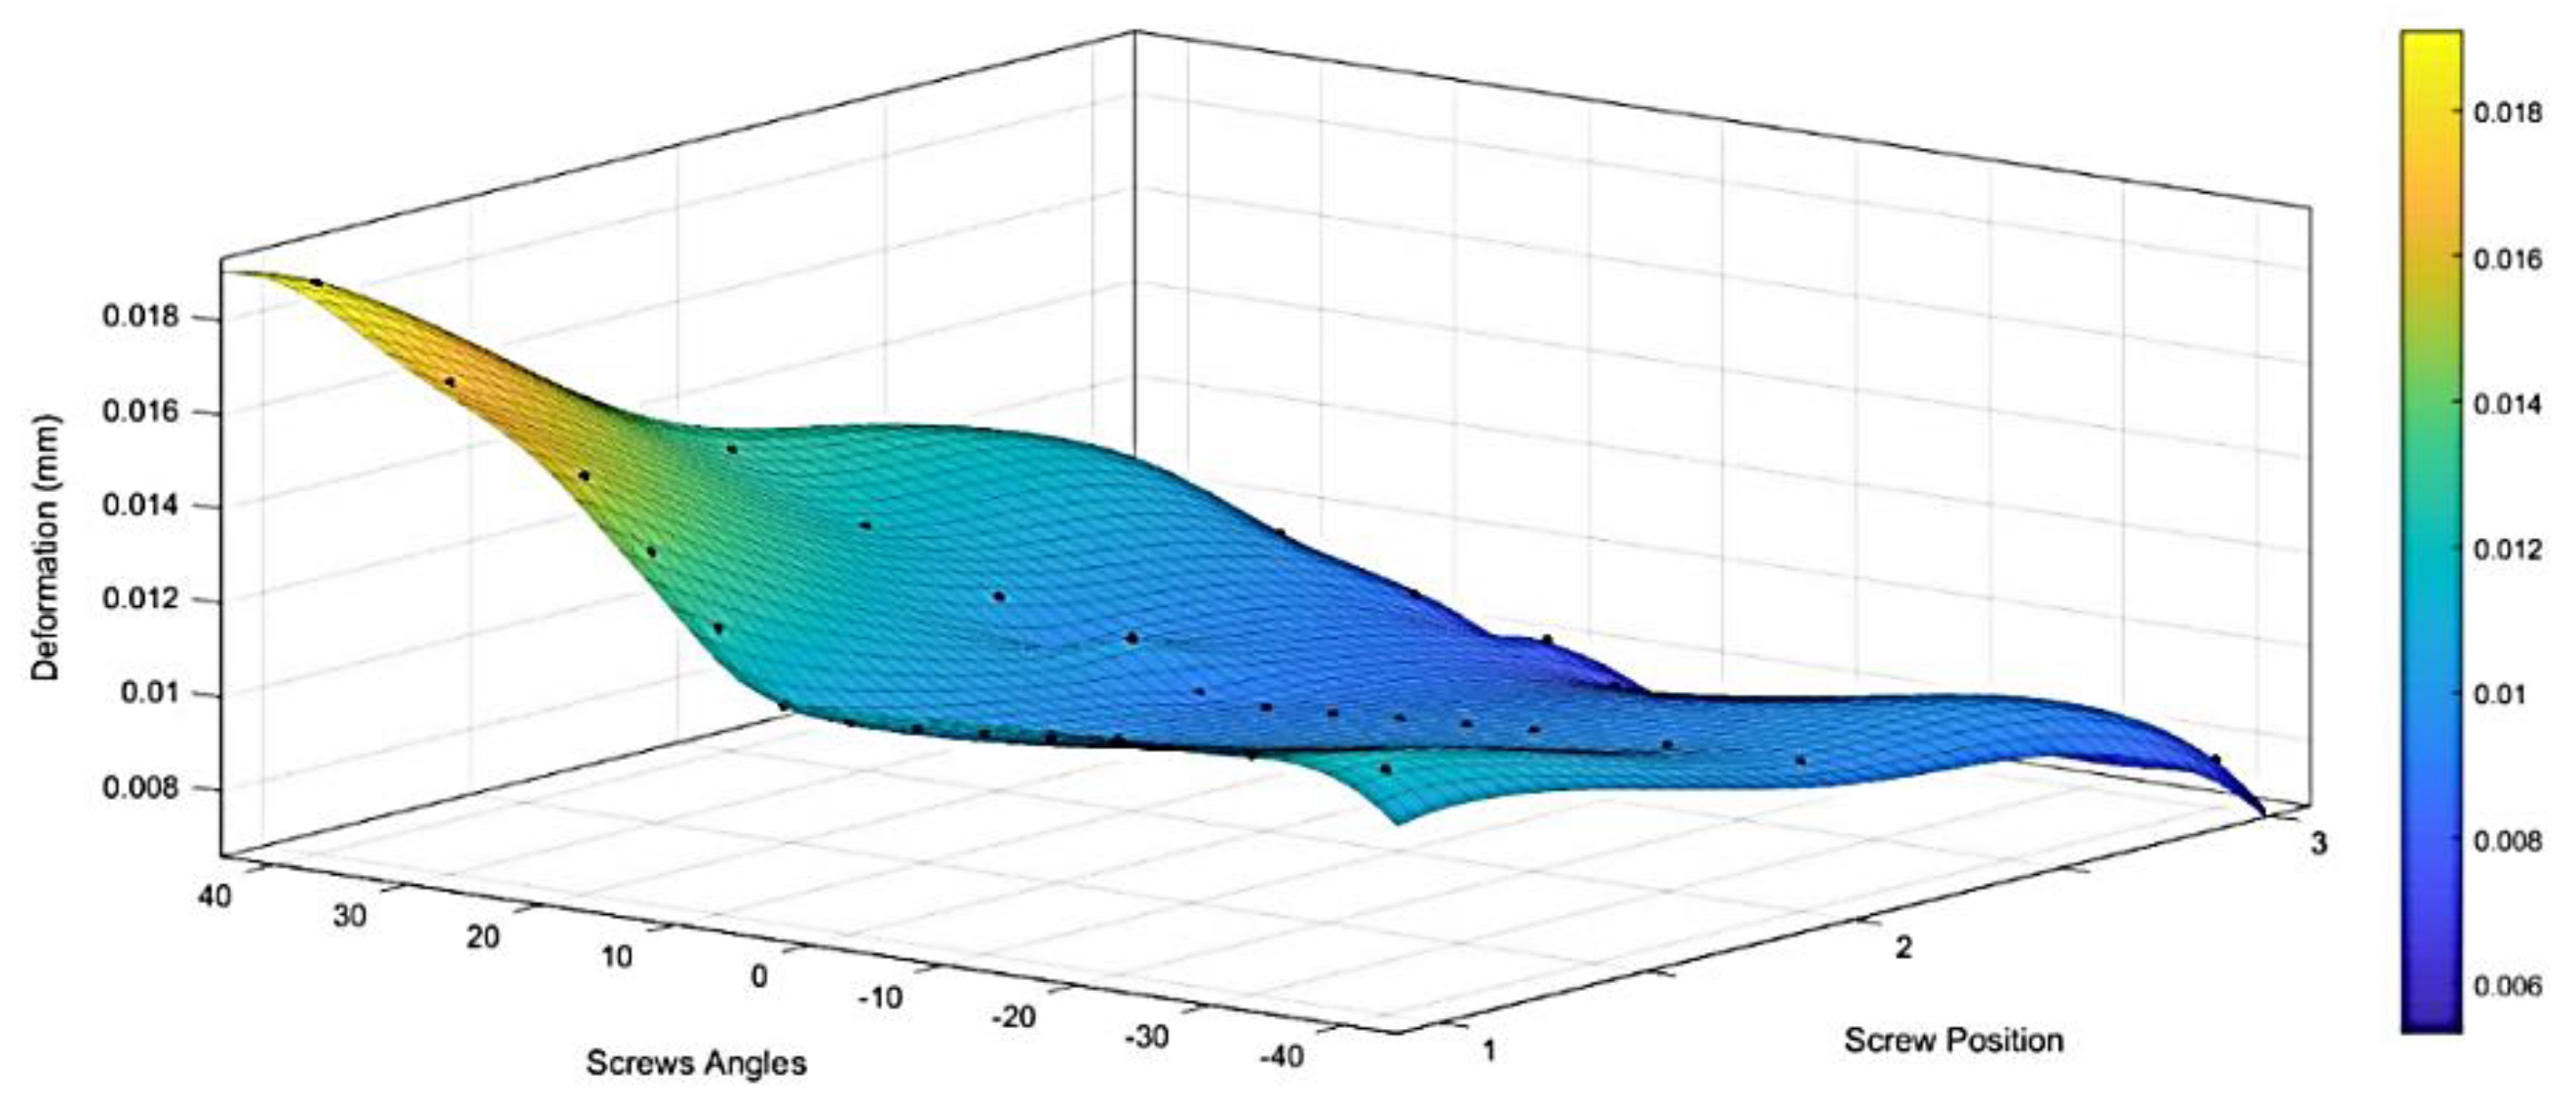
- VALS and VANS computational simulation illustrated that the stress vs. displacement behavior found to be dependent on where the screws mounted on the plate and having the VANS in downward angles showed a significant increase in maximum stress when compared with the screws in perpendicular angles to the plate, while there was no significant change in the VALS.
- Both the experimental work and finite element analysis support the assumption that fixing the screws in plates within the angles (<15°) is preferred.
Author Contributions
Funding
Conflicts of Interest
Appendix A


| With Locking Screws | With Nonlocking Screws | |||||
|---|---|---|---|---|---|---|
| von Mises Stress (MPa) | Displacement (mm) | Stiffness (N/mm) | von Mises stress (MPa) | Displacement (mm) | Stiffness (N/mm) | |
| Experimental Study [22] | ||||||
| Group 1 (no locking screws) | - | - | - | - | 0.58 | 1121.32 |
| Group 2 (one locking screw) | - | 0.7552 | 745.3 | - | 0.7552 | 745.3 |
| Group 3 (one locking screw) | - | 0.7746 | 620.03 | - | 0.7746 | 620.03 |
| Group 4 (two locking screws) | - | 1.2238 | 1231.23 | - | 1.2238 | 1231.23 |
| Computational Simulation | ||||||
| Perpendicular to the plate (0°) | 37.6020 | 0.0122 | 816.7199 | 93.0720 | 0.2759 | 362.3753 |
| Upward (5°) angle | 38.2771 | 0.0124 | 806.5180 | 94.6232 | 0.2798 | 357.4377 |
| Upward (10°) angle | 45.0284 | 0.0139 | 716.9600 | 110.1352 | 0.3179 | 314.5747 |
| Upward (15°) angle | 48.8468 | 0.0155 | 645.6612 | 155.1200 | 0.3812 | 262.3260 |
| Upward (20°) angle | 53.1884 | 0.0170 | 586.9647 | 164.4272 | 0.4190 | 238.4782 |
| Upward (30°) angle | 59.0027 | 0.0187 | 533.6043 | 173.8895 | 0.4613 | 216.7984 |
| Upward (40°) angle | 67.5130 | 0.0206 | 485.0948 | 184.9030 | 0.5074 | 197.0894 |
| Downward (5°) angle | 38.1834 | 0.0124 | 808.6336 | 94.4109 | 0.2790 | 358.2815 |
| Downward (10°) angle | 43.4163 | 0.0125 | 800.6273 | 95.9621 | 0.2829 | 353.4541 |
| Downward (15°) angle | 44.0914 | 0.0126 | 792.7003 | 133.8900 | 0.3153 | 317.1432 |
| Downward (20°) angle | 50.8427 | 0.0127 | 784.8518 | 143.1972 | 0.3468 | 288.3120 |
| Downward (30°) angle | 54.6611 | 0.0129 | 777.0810 | 152.6595 | 0.3815 | 262.1018 |
| Downward (40°) angle | 58.1430 | 0.0130 | 769.3871 | 163.6730 | 0.4197 | 238.2744 |
References
- Pe Pesce, V.; Speciale, D.; Sammarco, G.; Patella, S.; Spinarelli, A.; Patella, V. Surgical approach to bone healing in osteoporosis. Clin. Cases Miner. Bone Metab. 2009, 6, 131–135. [Google Scholar]
- McGowen, J.; Raisz, L.; Noonan, A. Bone health and osteoporosis: A report of the surgeon general. US Dep. Health Hum. Serv. 2004, 69–87. [Google Scholar]
- Nassiri, M.; Macdonald, B.; O’Byrne, J. Computational modelling of long bone fractures fixed with locking plates – How can the risk of implant failure be reduced? J. Orthop. 2013, 10, 29–37. [Google Scholar] [CrossRef] [PubMed] [Green Version]
- Fitzpatrick, D.C.; Doornink, J.; Madey, S.M.; Bottlang, M.; Fitzpatrick, D.C. Relative stability of conventional and locked plating fixation in a model of the osteoporotic femoral diaphysis. Clin. Biomech. 2009, 24, 203–209. [Google Scholar] [CrossRef] [PubMed] [Green Version]
- Latifi, M.H.; Ganthel, K.; Rukmanikanthan, S. Prospects of implant with locking plate in fixation of subtrochanteric fracture: Experimental demonstration of its potential benefits on synthetic femur model with supportive hierarchical nonlinear hyperelastic finite element analysis. Biomed. Eng. 2012, 11, 23. [Google Scholar]
- Huang, X.; Zhi, Z.; Yu, B.; Chen, F. Stress and stability of plate-screw fixation and screw fixation in the treatment of Schatzker type IV medial tibial plateau fracture: A comparative finite element study. J. Orthop. Surg. Res. 2015, 10, 182. [Google Scholar] [CrossRef] [Green Version]
- Kumar, A.; Gupta, H.; Yadav, C.-S.; Alam Khan, S.; Rastogi, S. Role of locking plates in treatment of difficult ununited fractures: A clinical study. Chin. J. Traumatol. 2013, 16, 22–26. [Google Scholar]
- Mavčič, B.; Antolič, V. Optimal mechanical environment of the healing bone fracture/osteotomy. Int. Orthop. 2012, 36, 689–695. [Google Scholar] [CrossRef] [Green Version]
- Wagner, M. General principles for the clinical use of the LCP. Injury 2003, 34, 31–42. [Google Scholar] [CrossRef]
- Miller, D.L.; Goswami, T. A review of locking compression plate biomechanics and their advantages as internal fixators in fracture healing. Clin. Biomech. 2007, 22, 1049–1062. [Google Scholar] [CrossRef]
- Hak, D.J.; Toker, S.; Yi, C.; Toreson, J. The influence of fracture fixation biomechanics on fracture healing. Orthopedics 2010, 33, 10. [Google Scholar] [CrossRef] [PubMed] [Green Version]
- Perren, S.M. Evolution of the internal fixation of long bone fractures. The scientific basis of biological internal fixation: Choosing a new balance between stability and biology. J. Bone Jt. Surgery. Br. Vol. 2002, 84, 1093–1110. [Google Scholar] [CrossRef]
- Texhammar, R.; Colton, C. AO/ASIF instruments and implants: A technical manual. Springer Science & Business Media: Berlin, Germany, 2013. [Google Scholar]
- Shahryari, A.; Omanovic, S. Improvement of pitting corrosion resistance of a biomedical grade 316LVM stainless steel by electrochemical modification of the passive film semiconducting properties. Electrochem. Commun. 2007, 9, 76–82. [Google Scholar] [CrossRef]
- Kocijan, A.; Milošev, I.; Pihlar, B. The influence of complexing agent and proteins on the corrosion of stainless steels and their metal components. J. Mater. Sci. Mater. Electron. 2003, 14, 69–77. [Google Scholar] [CrossRef]
- Goswami, T.; Hoeppner, D.W. Transition Criteria - From a Pit to a Crack. J. Mech. Behav. Mater. 1999, 10, 261–278. [Google Scholar] [CrossRef]
- Ina, J.; Vallentyne, M.; Hamandi, F.; Shugart, K.; Boin, M.; Laughlin, R.T.; Goswami, T. Failure Analysis of PHILOS Plate Construct Used for Pantalar Arthrodesis Paper I—Analysis of the Plate. Metals 2018, 8, 180. [Google Scholar] [CrossRef] [Green Version]
- Hamandi, F.; Laughlin, R.; Goswami, T. Failure Analysis of PHILOS Plate Construct Used for Pantalar Arthrodesis Paper II—Screws and FEM Simulations. Metals 2018, 8, 279. [Google Scholar] [CrossRef] [Green Version]
- Standard, A.S.T.M. Annual book of ASTM standards. In American Society for Testing and Materials Annual, Philadelphia, PA, USA; ASTM bulletin: West Conshohocken, PA, USA, 2004. [Google Scholar]
- "OrthoLoad." Standard Loads Knee Joint, OrthoLoad. Orthoload, 2018. 02 May. 2018. Available online: http://orthoload.com/test-loads/standard-loads-knee-joint/ (accessed on 10 March 2020).
- Hamandi, F.; Goswami, T. Macrodamage Accumulation Model for a Human Femur. Appl. Bionics Biomech. 2017, 2017, 1–19. [Google Scholar] [CrossRef] [Green Version]
- Goswami, T.; Patel, V.; Dalstrom, D.J.; Prayson, M.J. Mechanical evaluation of fourth-generation composite femur hybrid locking plate constructs. J. Mater. Sci. Mater. Electron. 2011, 22, 2139–2146. [Google Scholar] [CrossRef]
- Shahryari, A.; Szpunar, J.A.; Omanovic, S. The influence of crystallographic orientation distribution on 316LVM stainless steel pitting behavior. Corros. Sci. 2009, 51, 677–682. [Google Scholar] [CrossRef]
- Park, S.Y.; Kim, J.H.; Lee, M.H.; Jeong, Y.H. Effects of the microstructure and alloying elements on the iodine-induced stress-corrosion cracking behavior of nuclear fuel claddings. J. Nucl. Mater. 2008, 376, 98–107. [Google Scholar] [CrossRef]
- Narayan, R.J.; Roeder, R.K. The development of novel materials for medical devices. JOM 2009, 61, 13. [Google Scholar] [CrossRef] [Green Version]
- Tudor-Locke, C.; Craig, C.L.; Aoyagi, Y.; Bell, R.C.; Croteau, K.; De Bourdeaudhuij, I.; Ewald, B.; Gardner, A.W.; Hatano, Y.; Lutes, L.D.; et al. How many steps/day are enough? For older adults and special populations. Int. J. Behav. Nutr. Phys. Act. 2011, 8, 80. [Google Scholar] [CrossRef] [PubMed] [Green Version]
- Toribio, J.; Matos, J.-C.; González, B. Corrosion-Fatigue Crack Growth in Plates: A Model Based on the Paris Law. Materials 2017, 10, 439. [Google Scholar] [CrossRef] [PubMed] [Green Version]
- Newman, J.C., Jr.; Raju, I.S. Stress-intensity factor equations for cracks in three-dimensional finite bodies subjected to tension and bending loads. Comput. methods Mech. Fract. 1984, 2, 311–334. [Google Scholar]
- Lenz, M.; Wahl, D.; Gueorguiev, B.; Perren, S.M.; Jupiter, J.B. Concept of variable angle locking-evolution and mechanical evaluation of a recent technology. J. Orthop. Res. 2015, 33, 988–992. [Google Scholar] [CrossRef]
- Tidwell, J.E.; Roush, E.P.; Ondeck, C.L.; Kunselman, A.R.; Reid, J.; Lewis, G.S. The biomechanical cost of variable angle locking screws. Injury 2016, 47, 1624–1630. [Google Scholar] [CrossRef]


| Elastic Constants | Eradial (GPa) | Ecircumferential (GPa) | Elongitudinal (GPa) | vradial | v.circumferential | v.longitudinal | G.radial | G.circumferential | G.longitudinal |
|---|---|---|---|---|---|---|---|---|---|
| Cortical | 1.151 | 1.151 | 1.894 | 0.400 | 0.250 | 0.250 | 0.053 | 0.066 | 0.061 |
| Trabecular | 13.064 | 13.064 | 21.294 | 0.400 | 0.250 | 0.250 | 5.710 | 7.110 | 6.580 |
| Elasticity Tensor Components | C11 | C22 | C33 | C12 | C13 | C23 | C44 | C55 | C66 |
| Cortical | 1.423 | 1.483 | 2.187 | 0.534 | 0.297 | 0.237 | 0.066 | 0.061 | 0.053 |
| Trabecular | 16.162 | 16.835 | 24.587 | 6.061 | 3.367 | 2.694 | 7.110 | 6.580 | 5.710 |
| Log-likelihood: 185.16 | ||
| Domain: 0 < y < Inf | ||
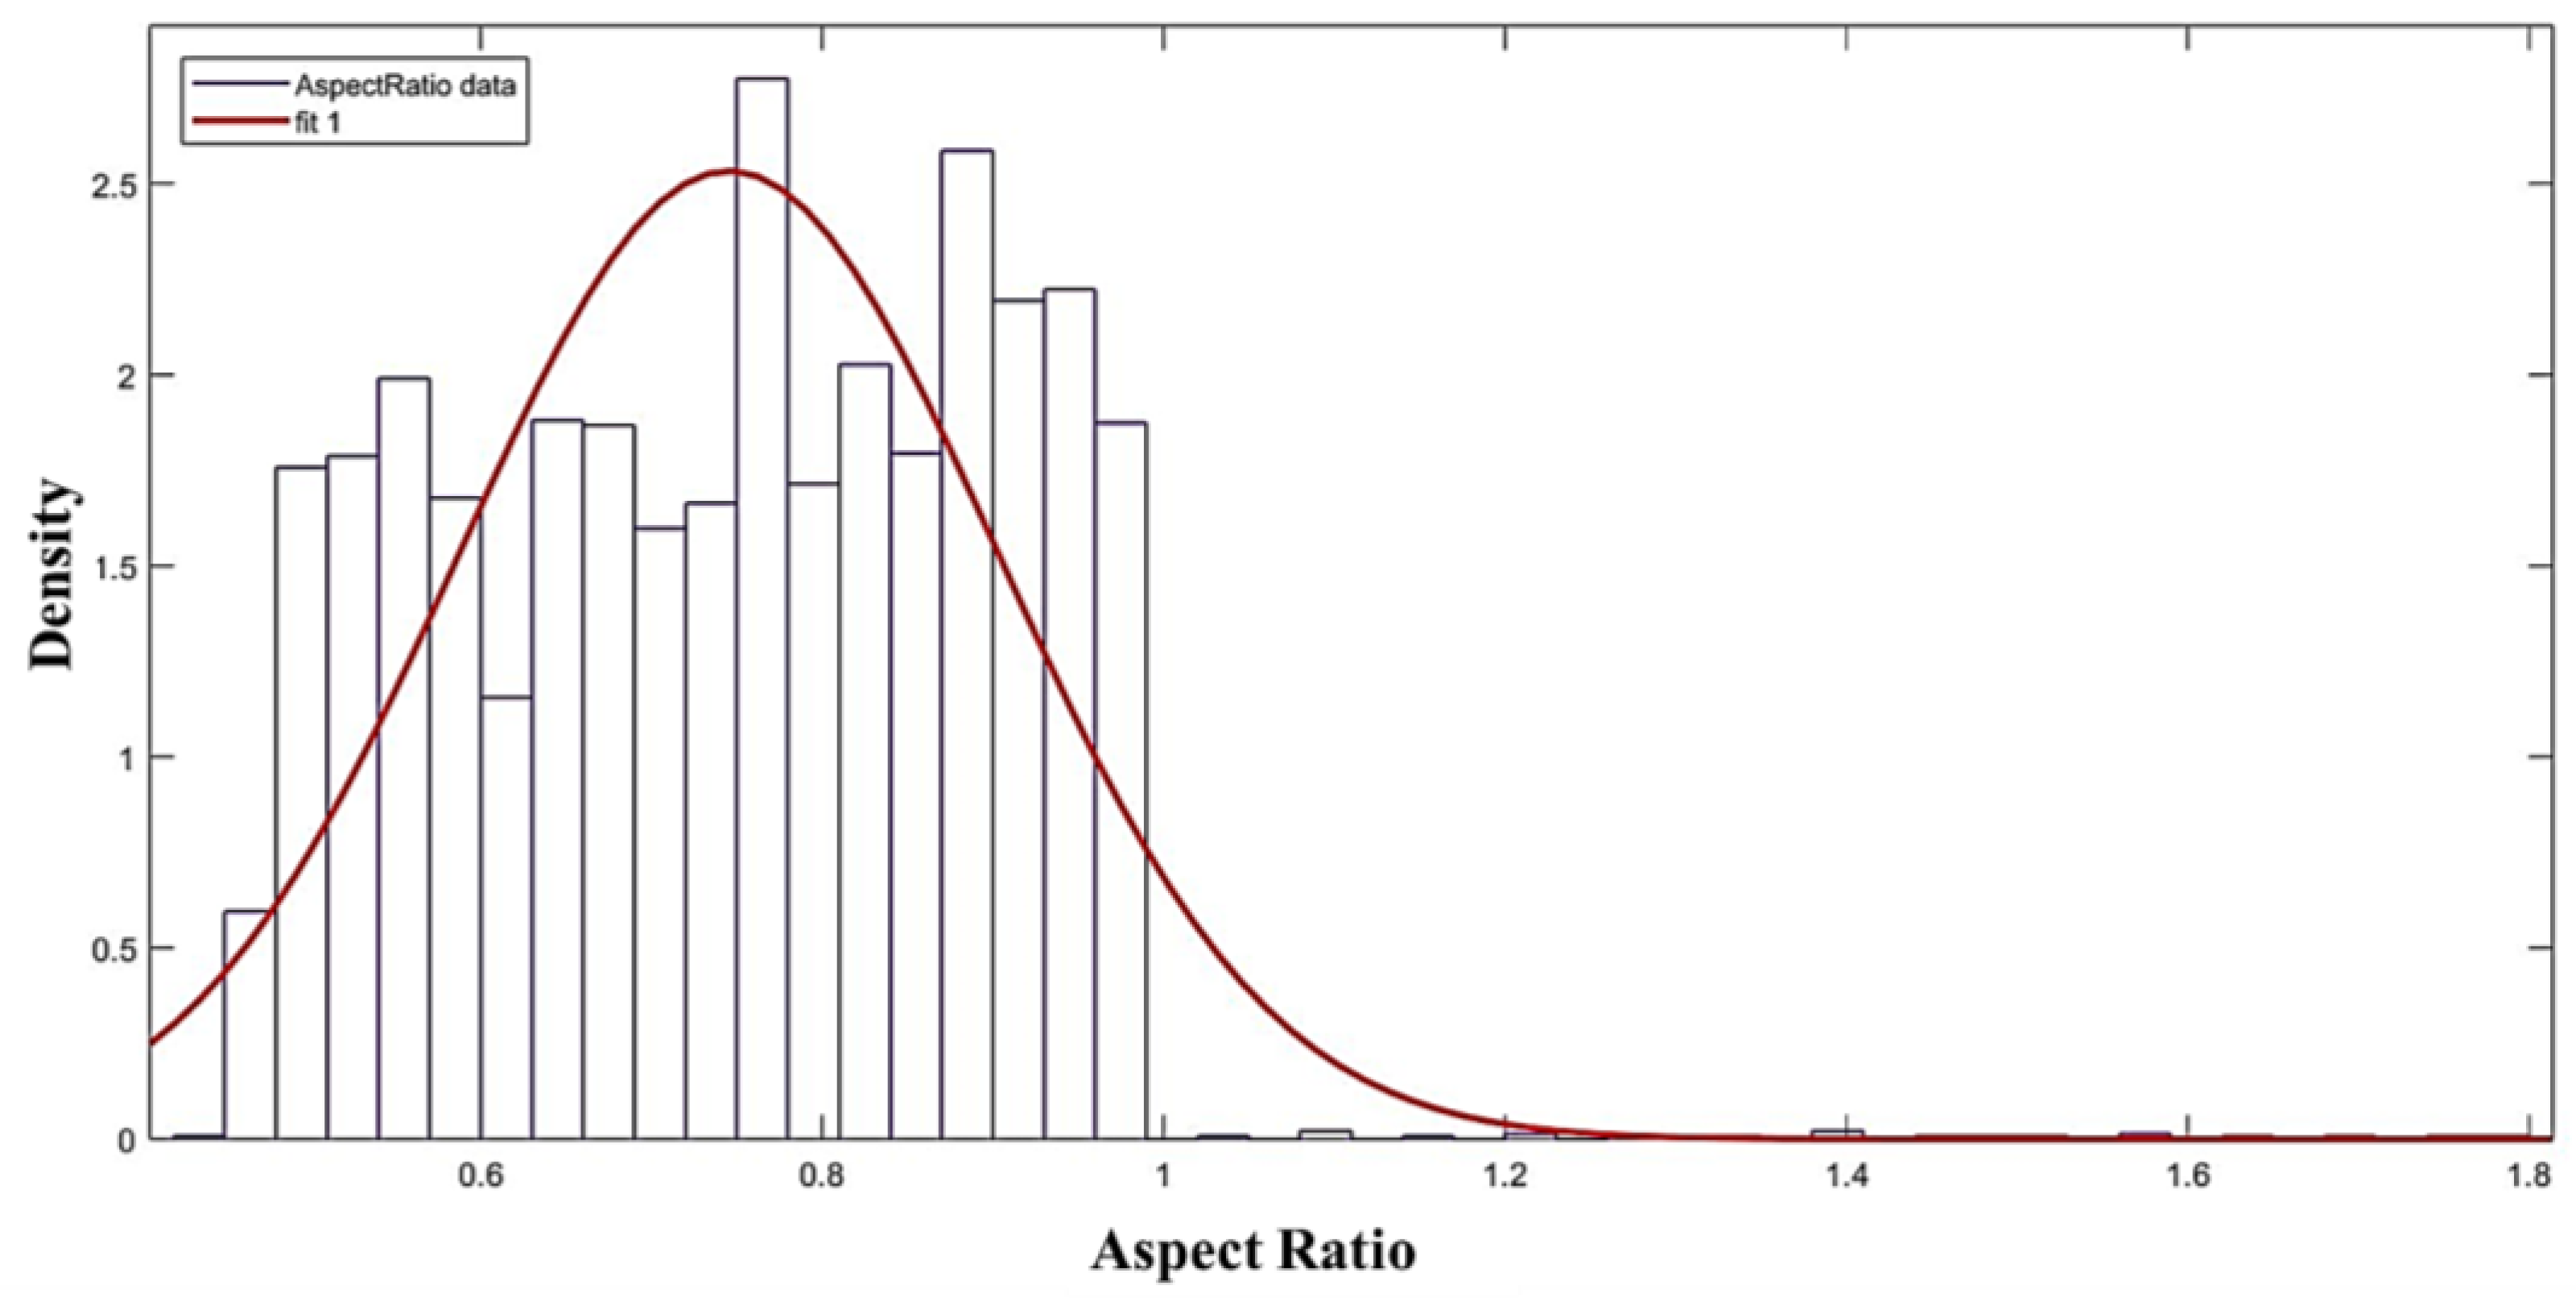
| Mean: 0.74913 | ||
| Variance: 0.0453871 | ||
| Parameter | Estimate | Std. Err. |
| A | 0.827193 | 0.0075486 |
| B | 3.94028 | 0.0884813 |
| Estimated covariance of parameter estimates: | ||
| A | B | |
| A | 5.69813 × 10⁻⁵ | 0.000222511 |
| B | 0.000222511 | 0.00782895 |
| a/2c | (avg ± SD) | (avg ± SD) | (avg ± SD) | Maximum von Mises Stress (MPa) | 316l SS Fracture Toughness (K1c) [19] |
|---|---|---|---|---|---|
| 0.4 | 8.12 ± 6.95 | 72.37 ± 3.21 | 40.25 ± 5.08 | 779.93 | 112 |
| 0.6 | 8.44 ± 7.41 | 76.04 ± 2.18 | 43.33 ± 4.79 | 786.31 | 112 |
| 0.8 | 9.37 ± 8.24 | 86.91 ± 2.41 | 48.14 ± 5.325 | 792.47 | 112 |
| 1 | 10.41 ± 9.15 | 96.52 ± 2.67 | 53.465 ± 5.91 | 795.05 | 112 |
© 2020 by the authors. Licensee MDPI, Basel, Switzerland. This article is an open access article distributed under the terms and conditions of the Creative Commons Attribution (CC BY) license (http://creativecommons.org/licenses/by/4.0/).
Share and Cite
Hamandi, F.; Simon, G.; Laughlin, R.; Goswami, T. Biomechanical Behavior of a Variable Angle Locked Tibiotalocalcaneal Construct. Bioengineering 2020, 7, 27. https://doi.org/10.3390/bioengineering7010027
Hamandi F, Simon G, Laughlin R, Goswami T. Biomechanical Behavior of a Variable Angle Locked Tibiotalocalcaneal Construct. Bioengineering. 2020; 7(1):27. https://doi.org/10.3390/bioengineering7010027
Chicago/Turabian StyleHamandi, Farah, Gerard Simon, Richard Laughlin, and Tarun Goswami. 2020. "Biomechanical Behavior of a Variable Angle Locked Tibiotalocalcaneal Construct" Bioengineering 7, no. 1: 27. https://doi.org/10.3390/bioengineering7010027