
GAN-Based Approach for Diabetic Retinopathy Retinal Vasculature Segmentation

Abstract
:1. Introduction
2. Related Works
Diabetic Retinopathy Retinal Vasculature Segmentation
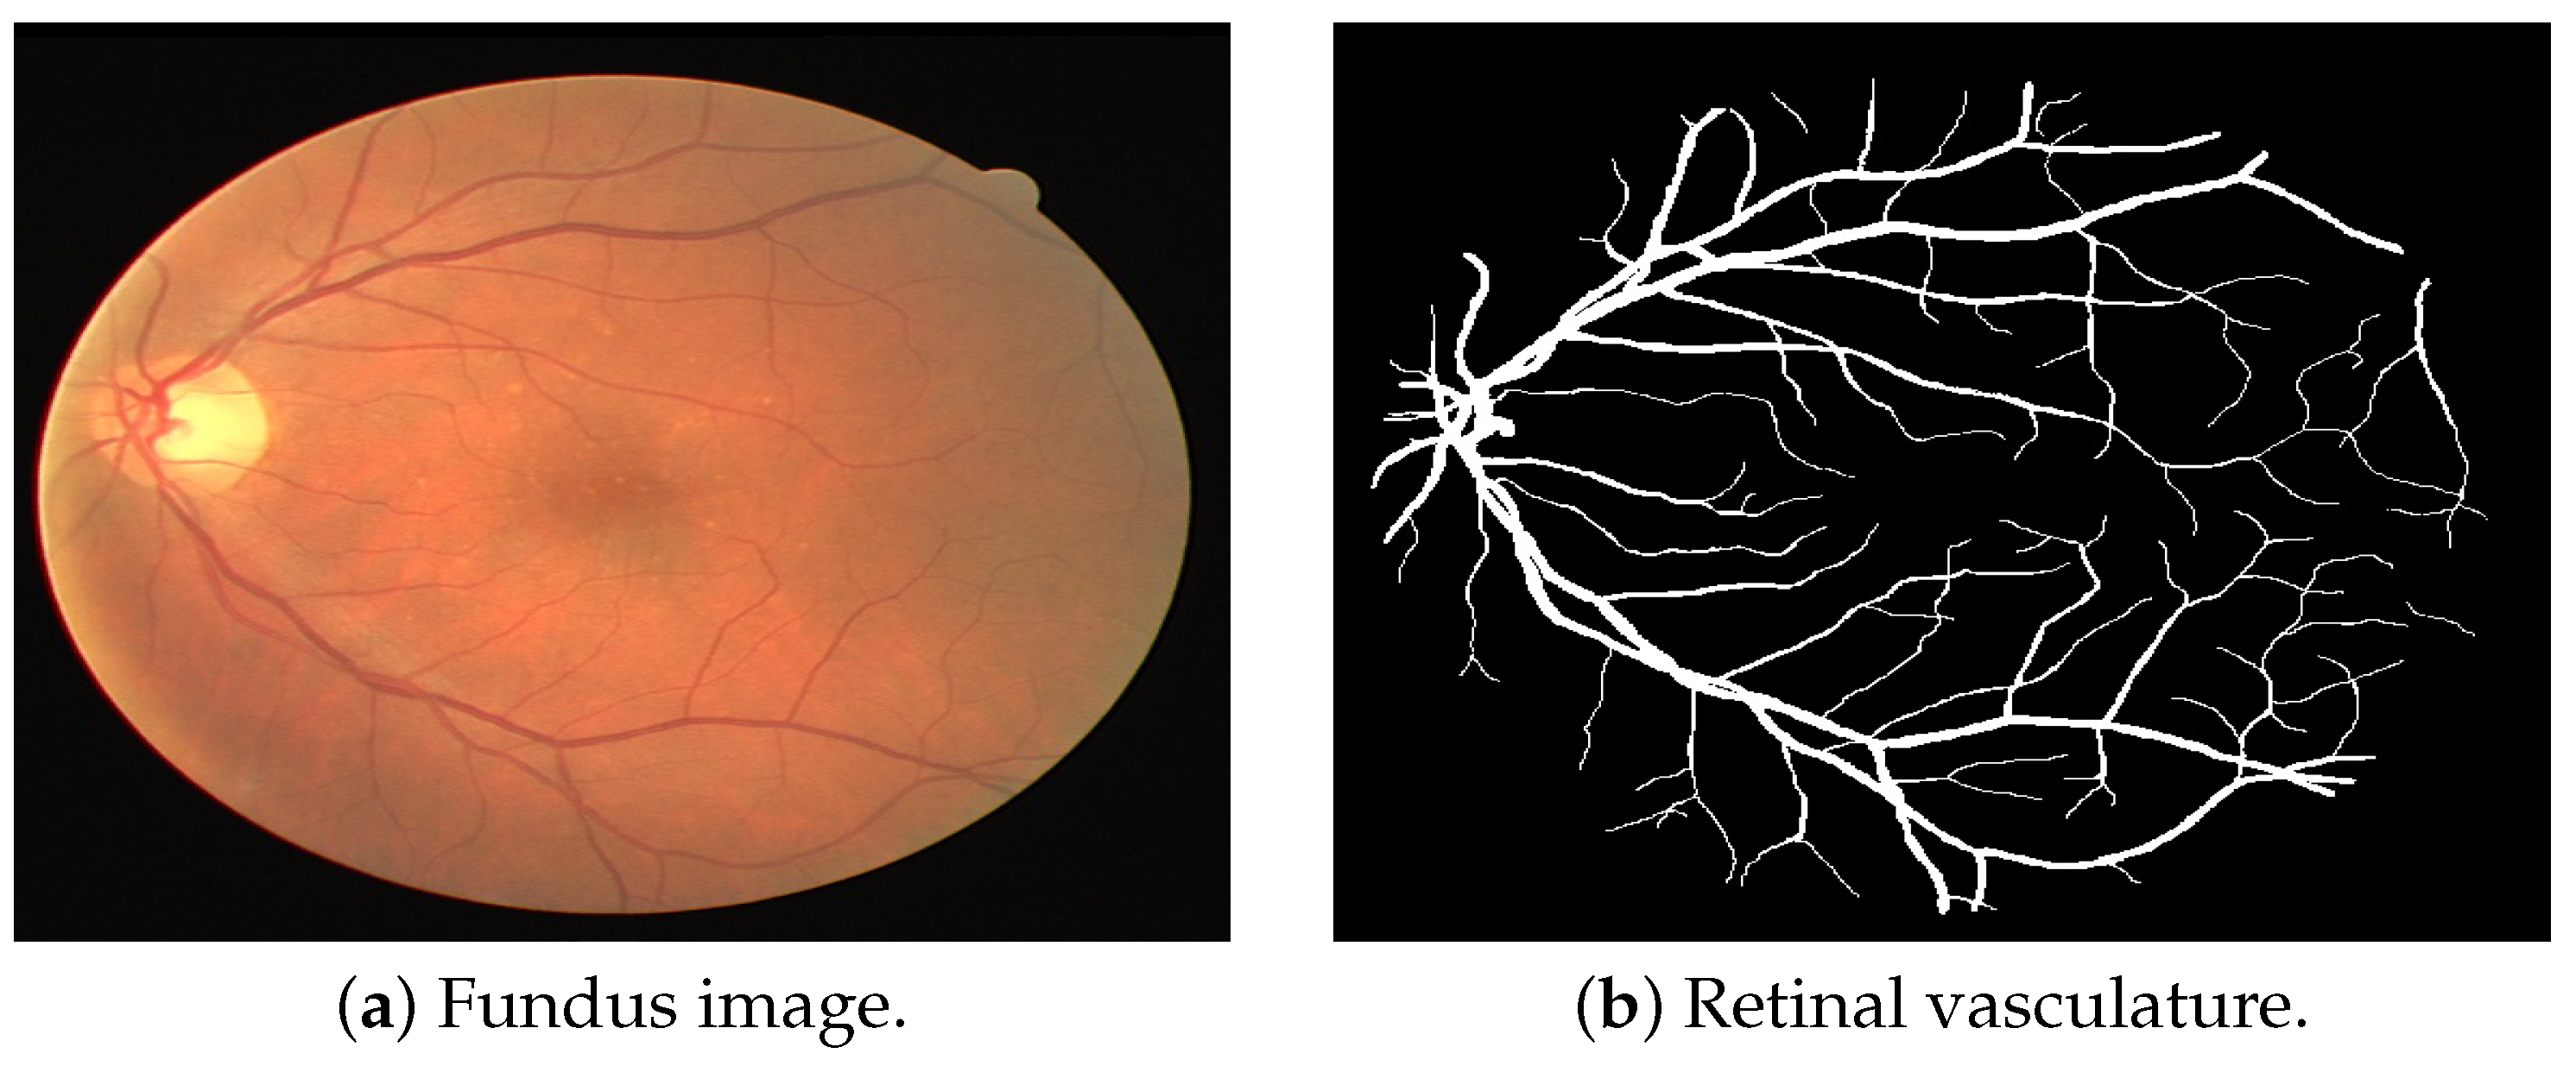
3. Proposed Method
3.1. Data Augmentation
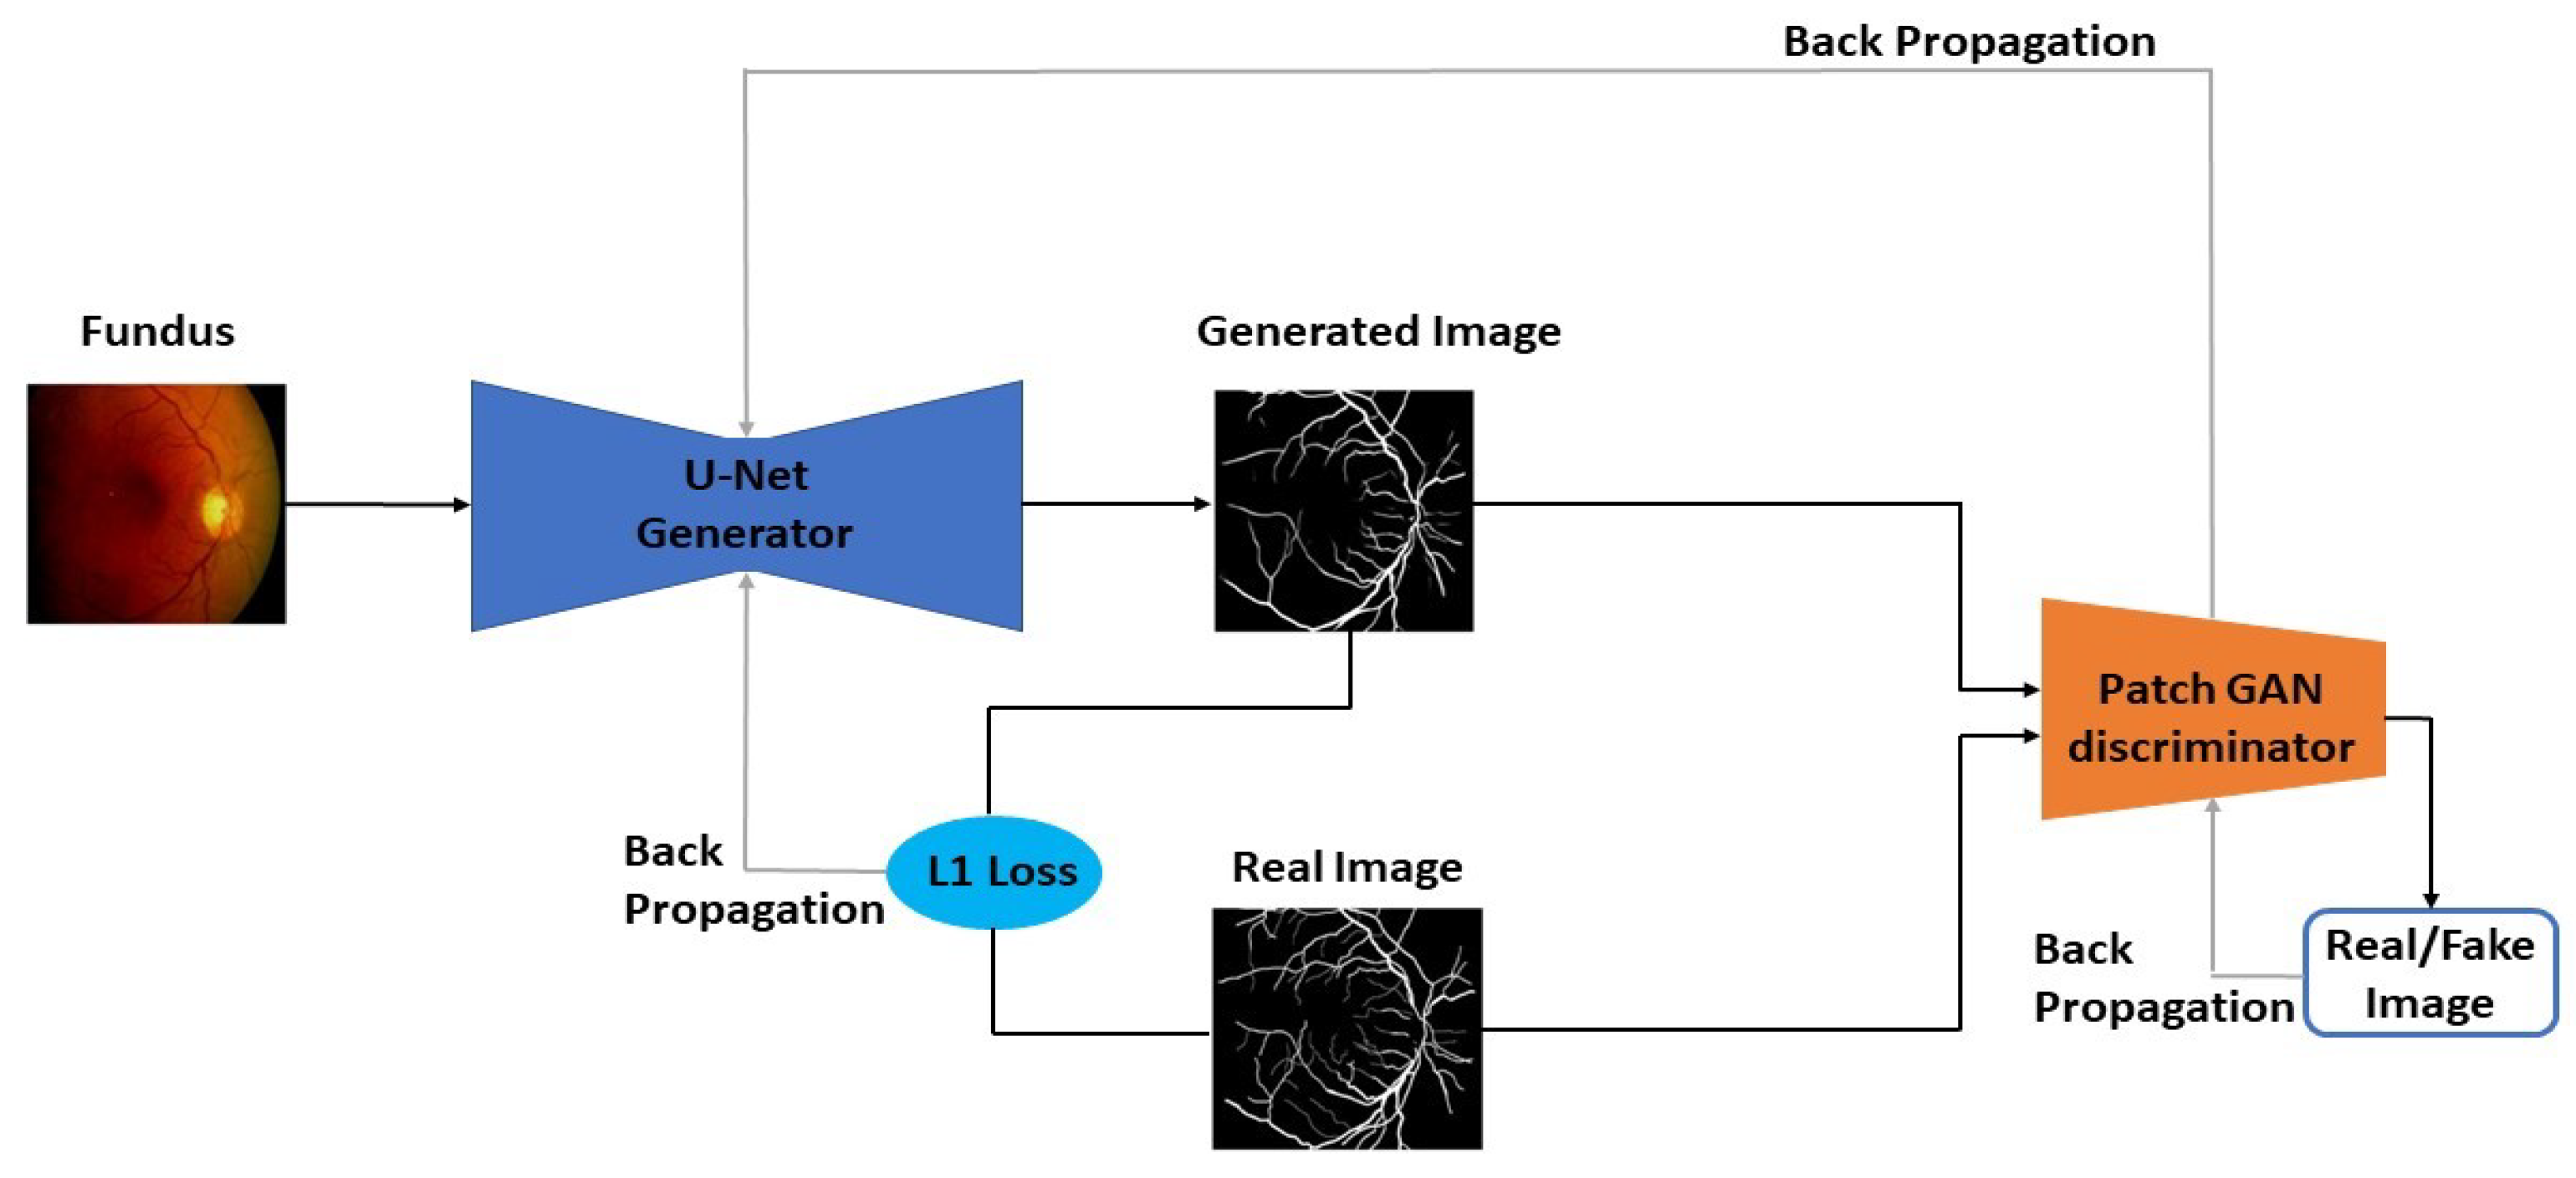
3.2. GAN-Based Retinal Vasculature Segmentation
4. Experimental Results
4.1. Datasets
4.2. Evaluation Metrics
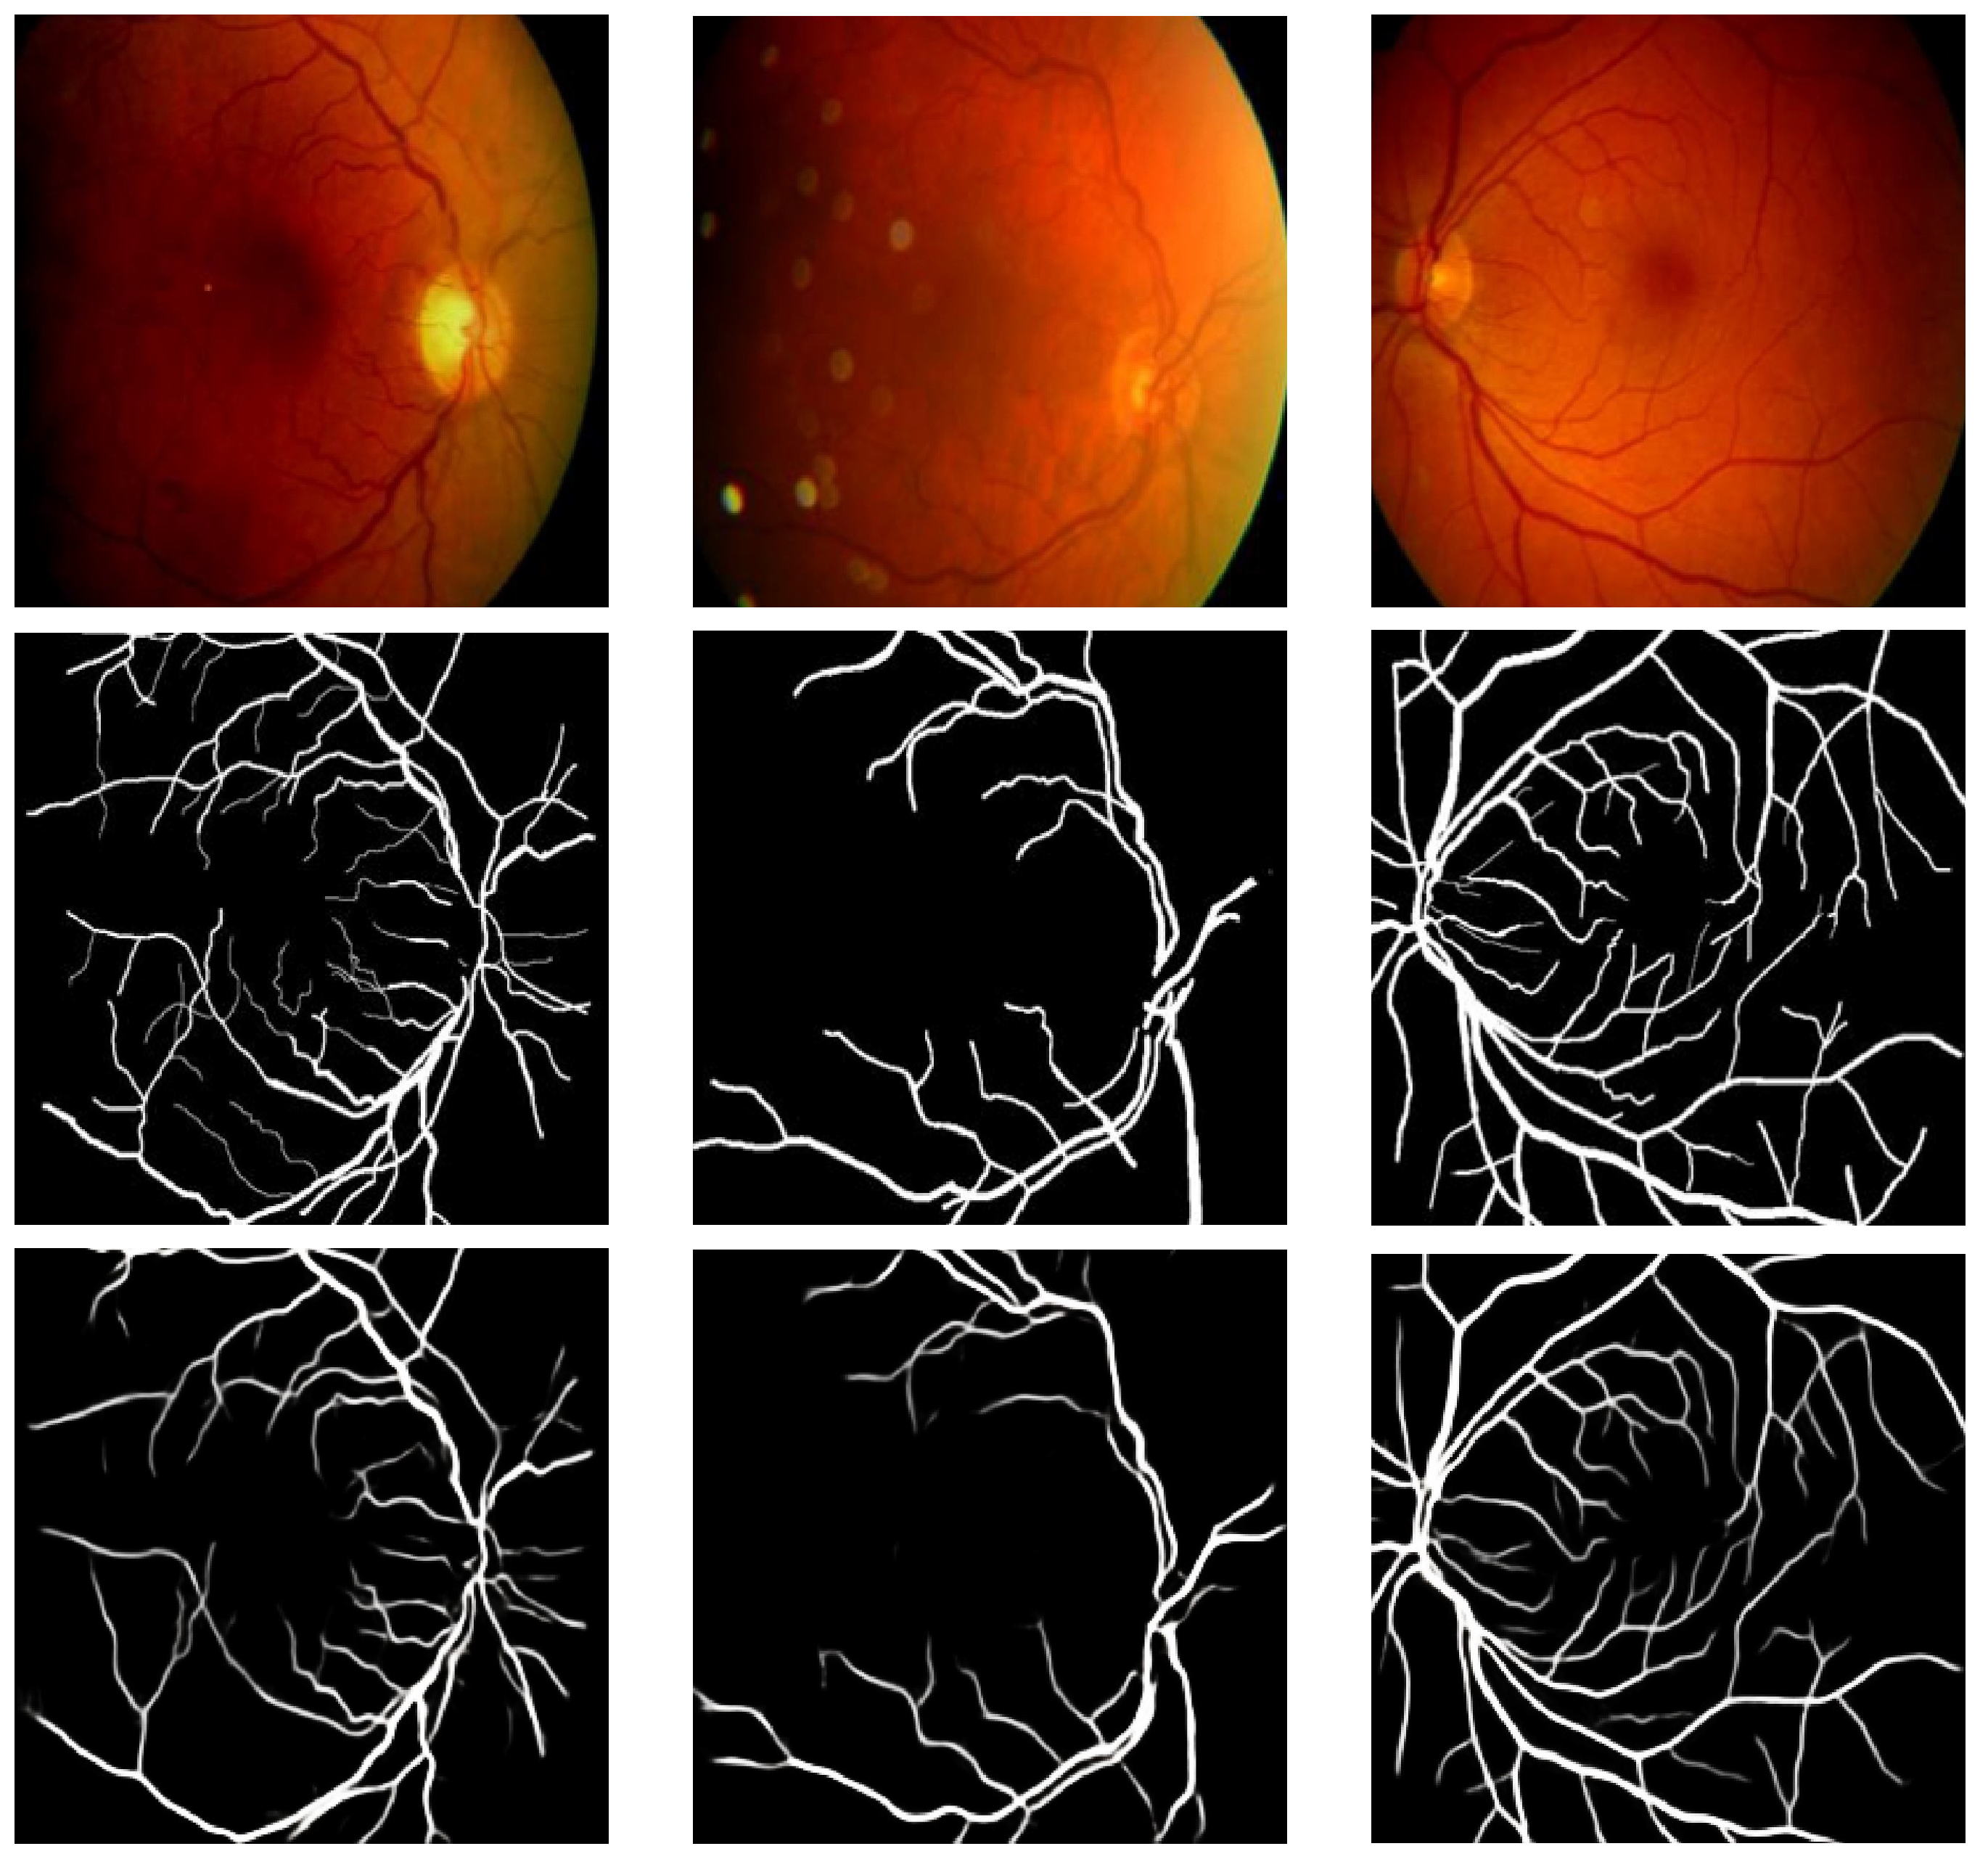
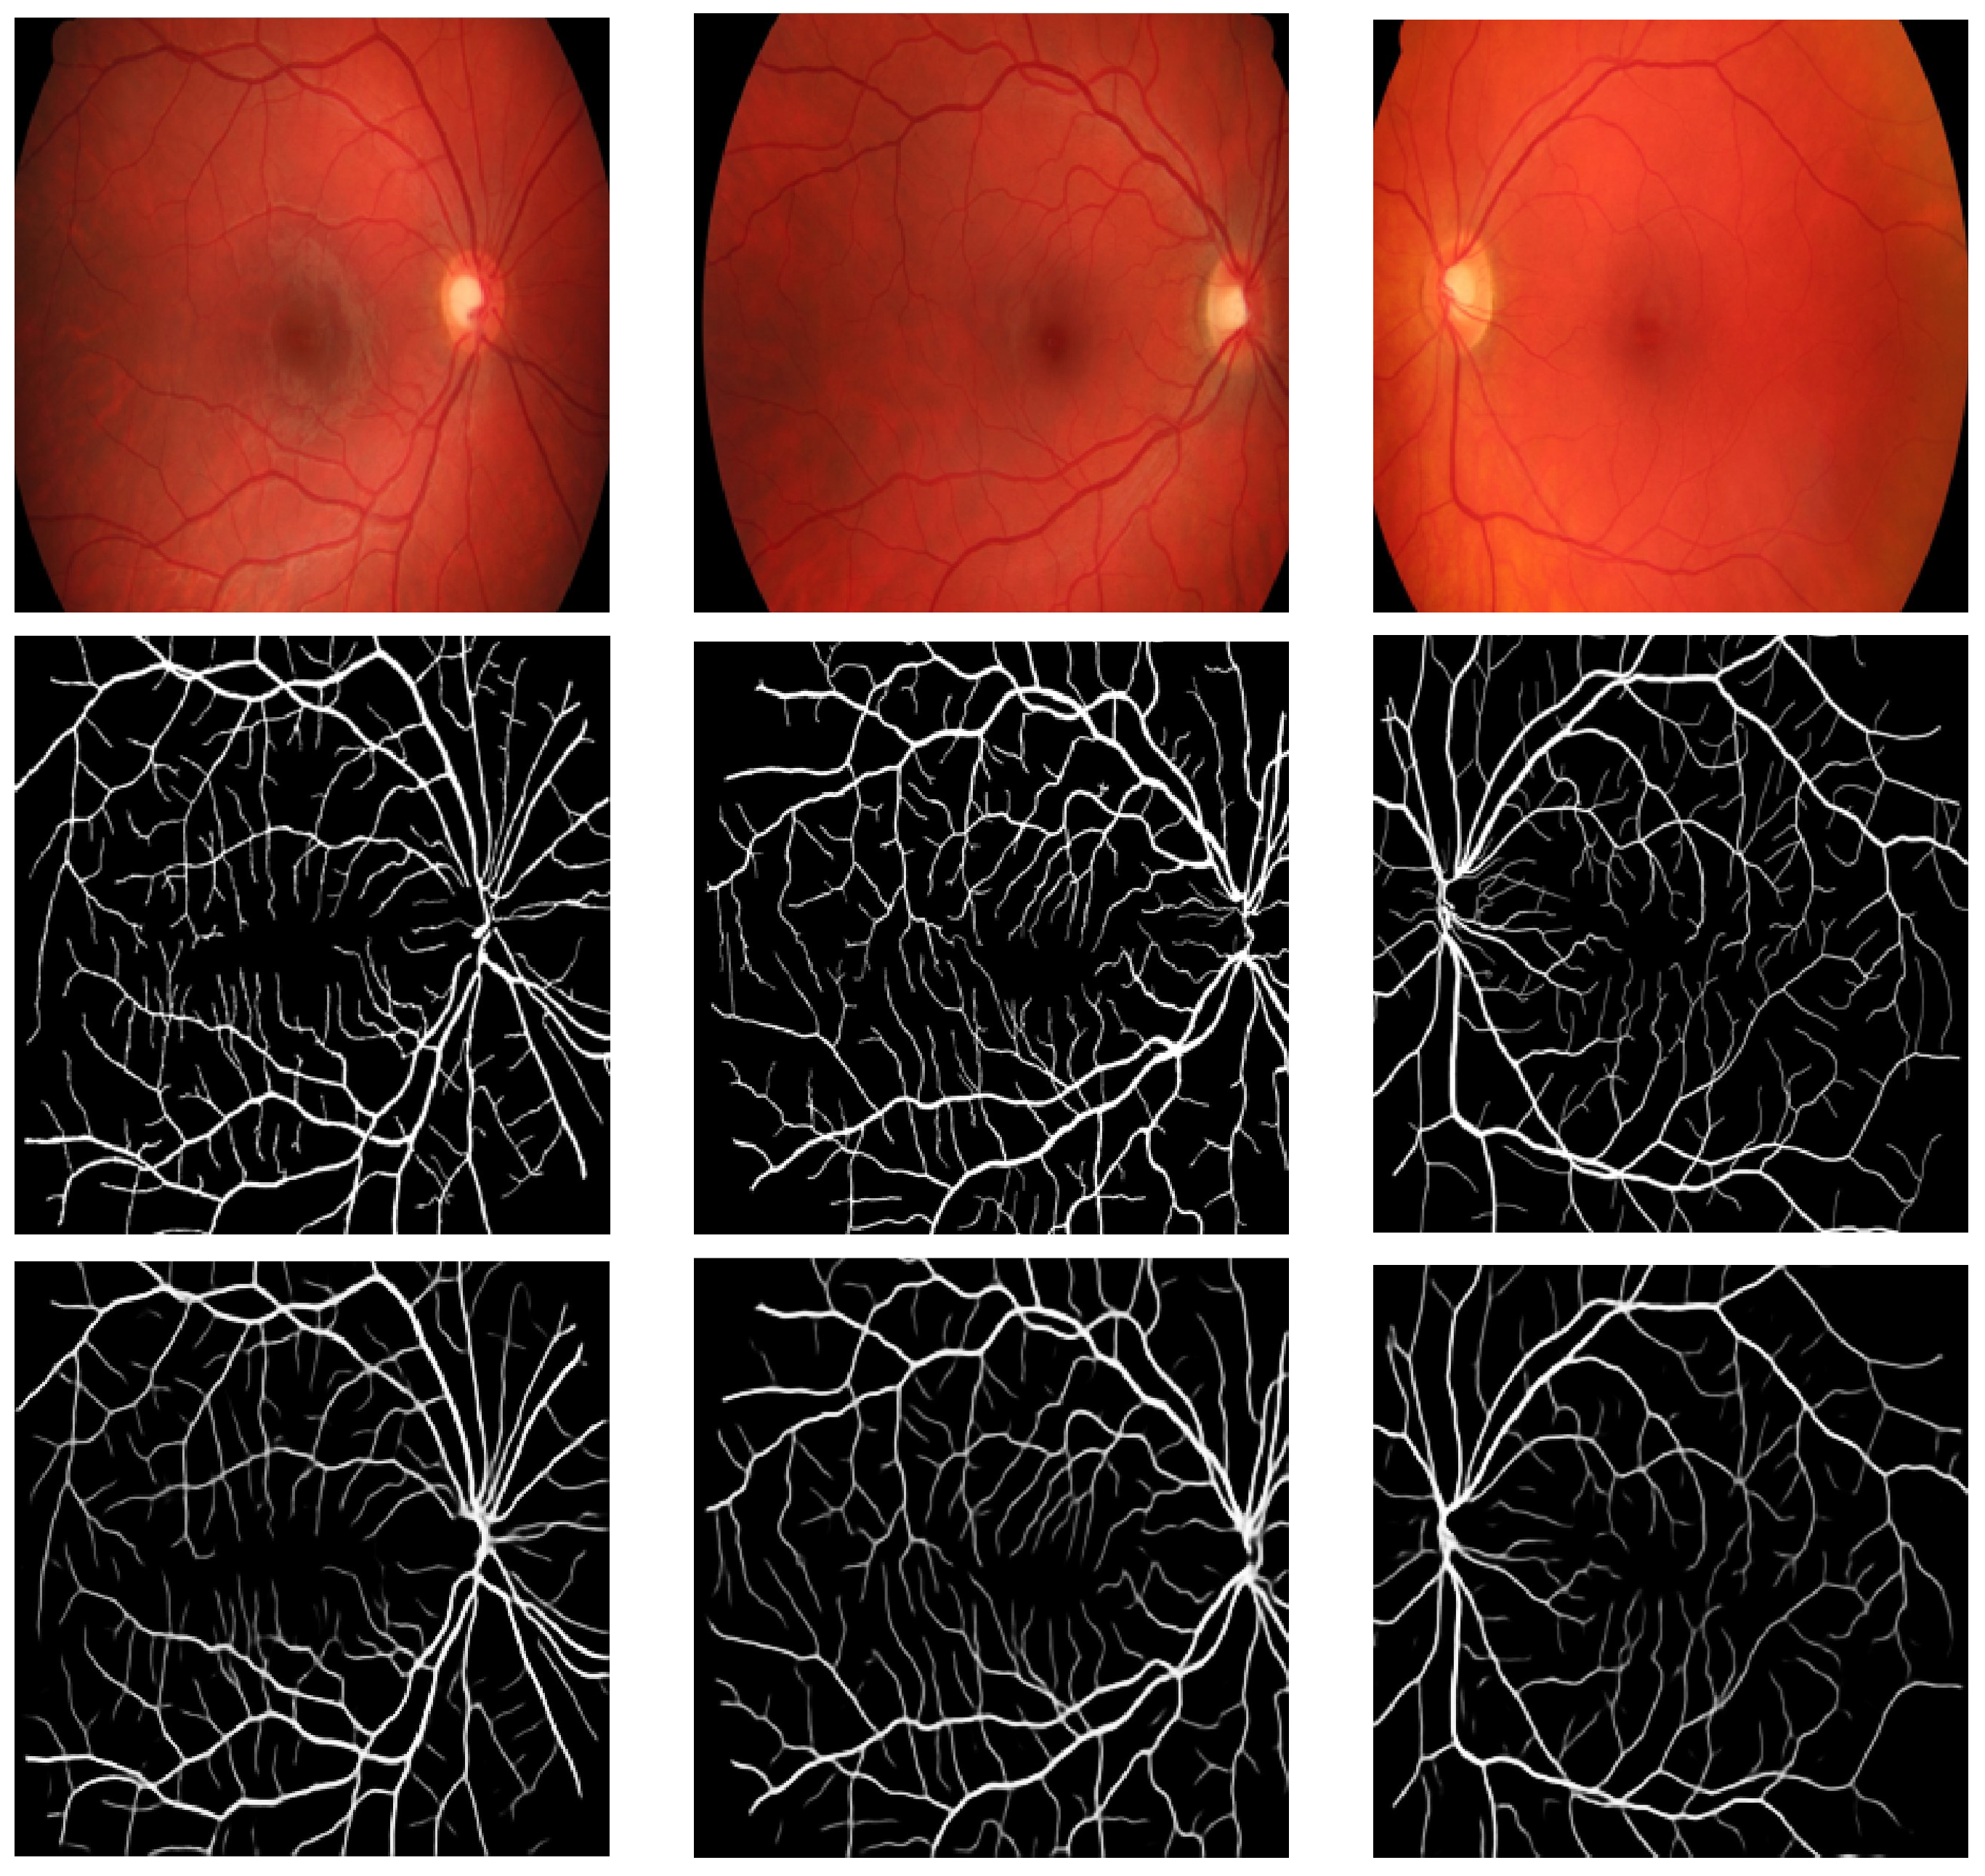
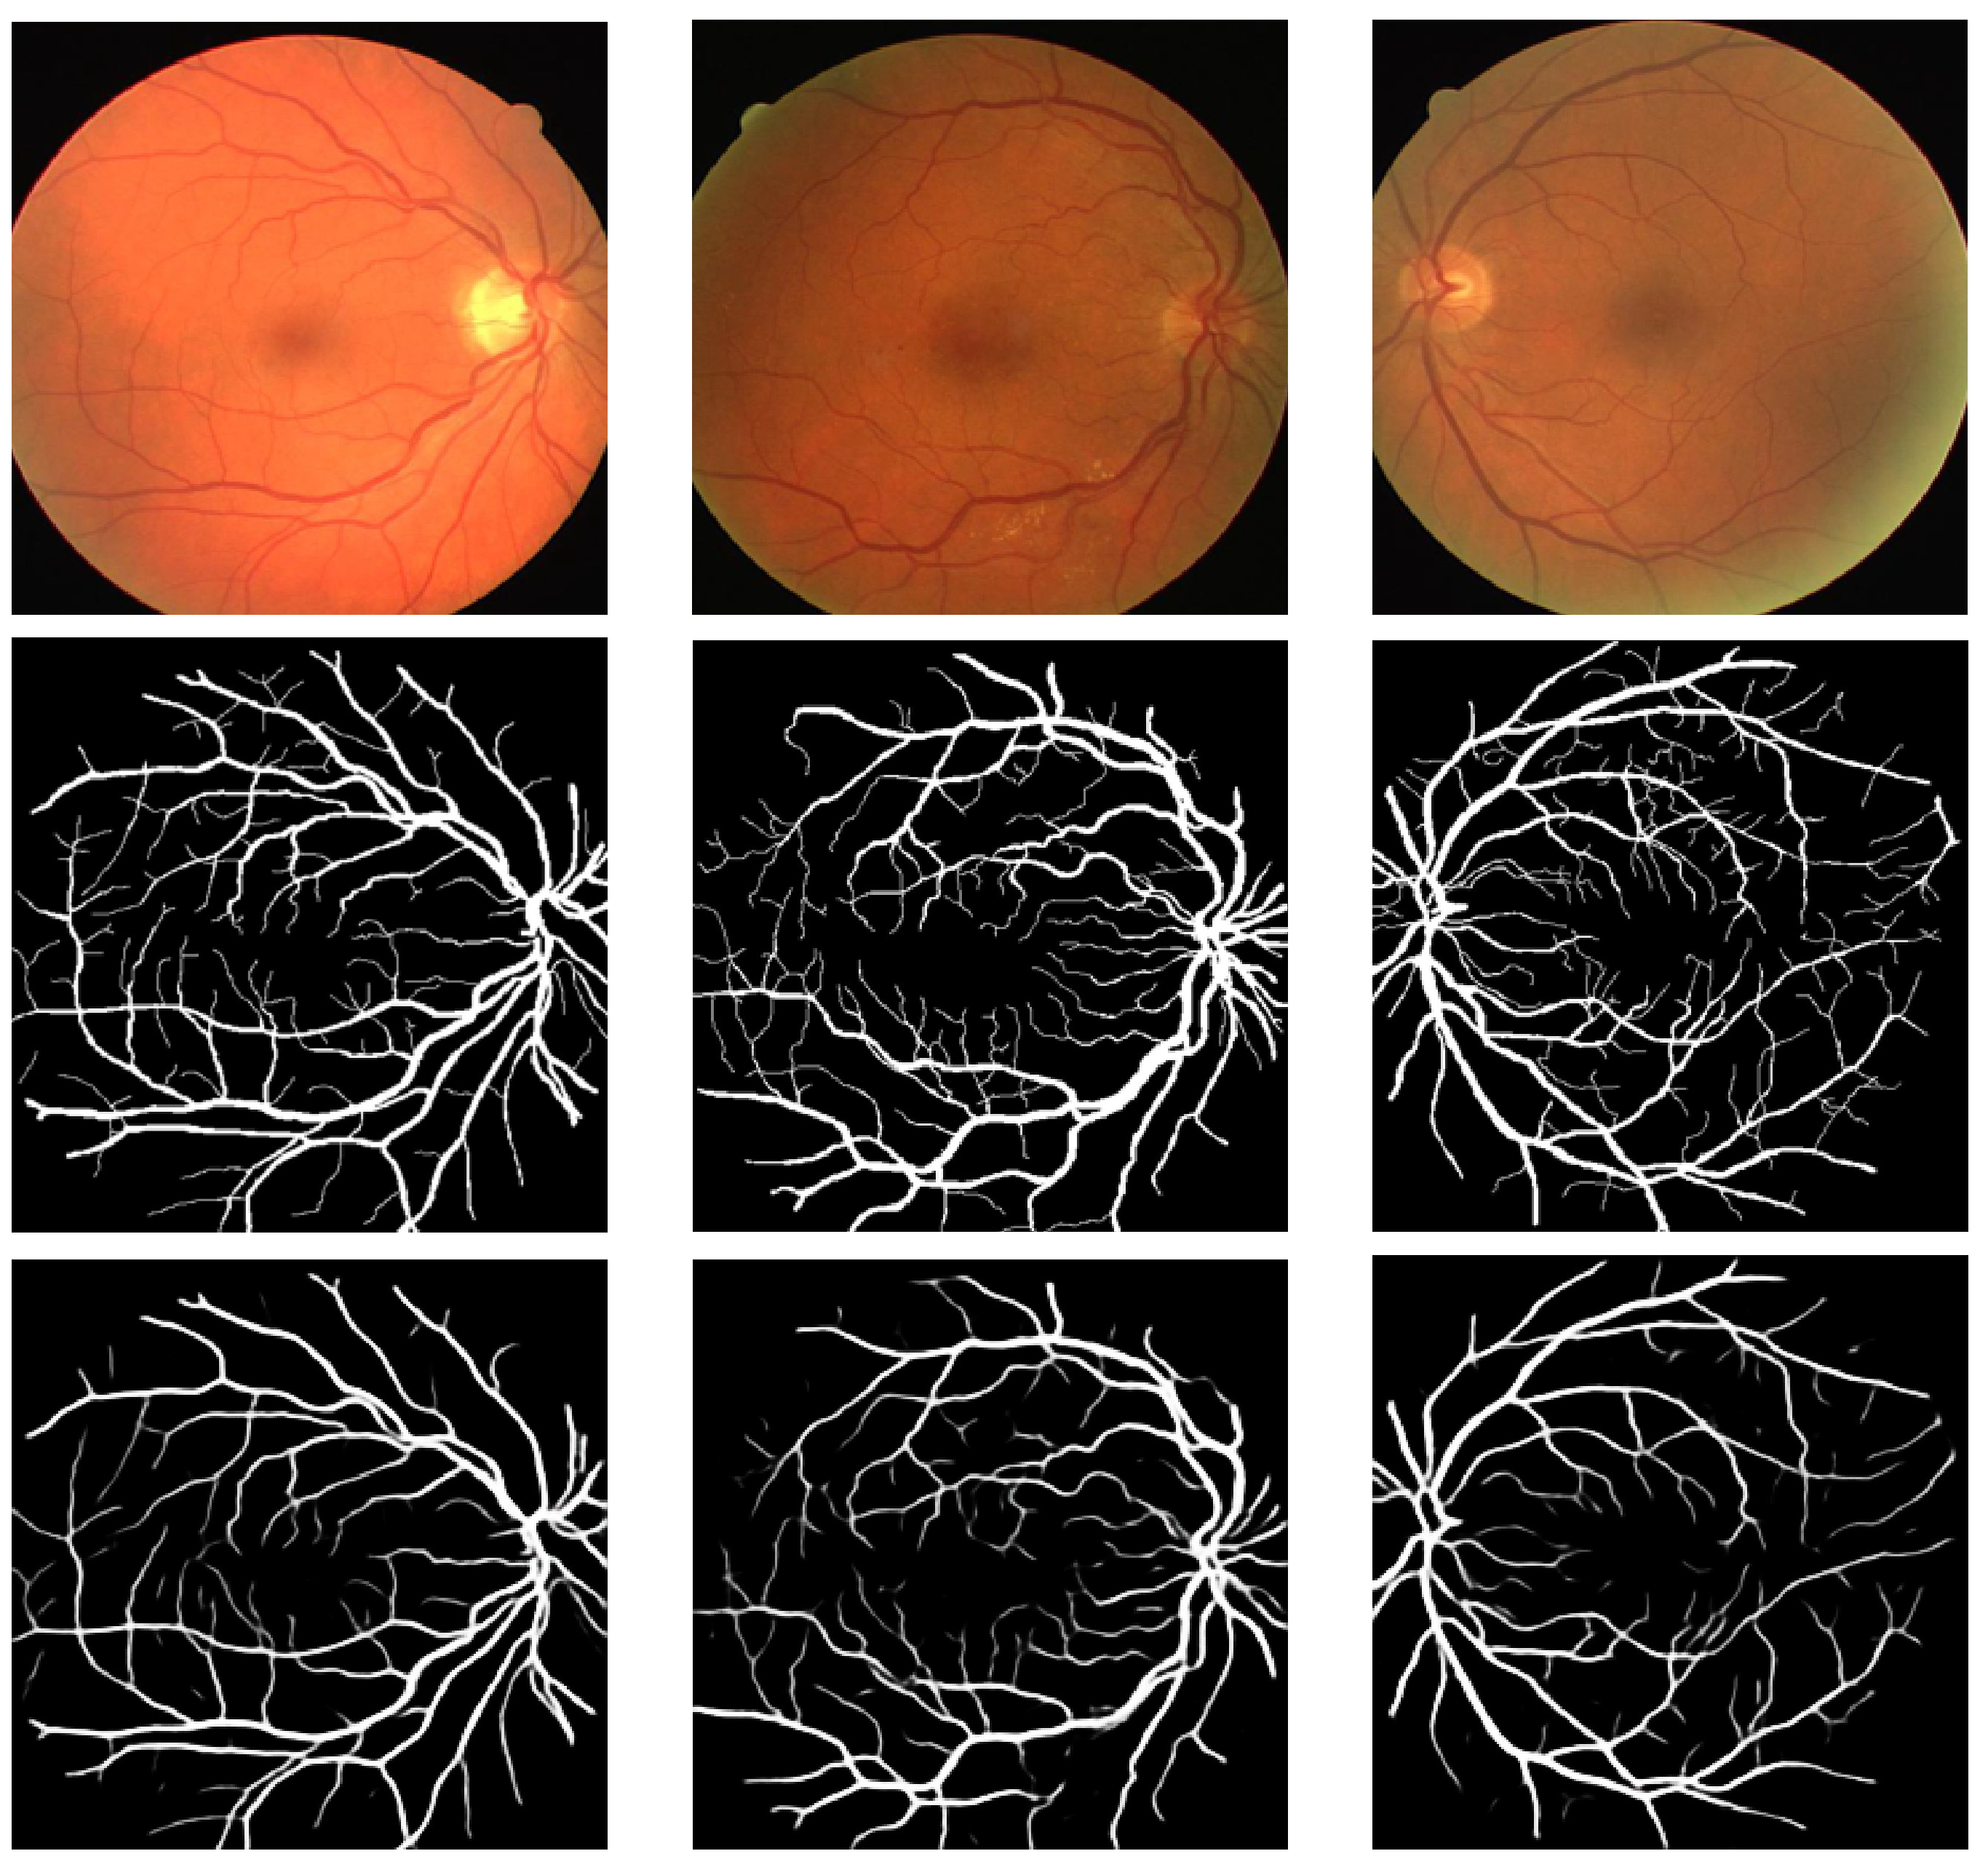
4.3. Evaluation and Discussion
5. Conclusions and Future Work
Author Contributions
Funding
Institutional Review Board Statement
Informed Consent Statement
Data Availability Statement
Conflicts of Interest
References
- Luo, X.; Pu, Z.; Xu, Y.; Wong, W.K.; Su, J.; Dou, X.; Ye, B.; Hu, J.; Mou, L. MVDRNet: Multi-view diabetic retinopathy detection by combining DCNNs and attention mechanisms. Pattern Recognit. 2021, 120, 108104. [Google Scholar] [CrossRef]
- Sebastian, A.; Elharrouss, O.; Al-Maadeed, S.; Almaadeed, N. A Survey on Deep-Learning-Based Diabetic Retinopathy Classification. Diagnostics 2023, 13, 345. [Google Scholar] [CrossRef] [PubMed]
- Thangaraj, S.; Periyasamy, V.; Balaji, R. Retinal vessel segmentation using neural network. IET Image Process. 2018, 12, 669–678. [Google Scholar] [CrossRef]
- Sebastian, A.; Elharrouss, O.; Al-Maadeed, S.; Almaadeed, N. A Survey on Diabetic Retinopathy Lesion Detection and Segmentation. Appl. Sci. 2023, 13, 5111. [Google Scholar] [CrossRef]
- Drive Dataset. Available online: https://drive.grand-challenge.org/ (accessed on 30 March 2023).
- Al-Mohannadi, A.; Al-Maadeed, S.; Elharrouss, O.; Sadasivuni, K.K. Encoder-decoder architecture for ultrasound IMC segmentation and cIMT measurement. Sensors 2021, 21, 6839. [Google Scholar] [CrossRef] [PubMed]
- Riahi, A.; Elharrouss, O.; Al-Maadeed, S. BEMD-3DCNN-based method for COVID-19 detection. Comput. Biol. Med. 2022, 142, 105188. [Google Scholar] [CrossRef] [PubMed]
- Elasri, M.; Elharrouss, O.; Al-Maadeed, S.; Tairi, H. Image generation: A review. Neural Process. Lett. 2022, 54, 4609–4646. [Google Scholar] [CrossRef]
- Memari, N.; Ramli, A.R.; Saripan, M.I.B.; Mashohor, S.; Moghbel, M. Retinal blood vessel segmentation by using matched filtering and fuzzy c-means clustering with integrated level set method for diabetic retinopathy assessment. J. Med. Biol. Eng. 2019, 39, 713–731. [Google Scholar] [CrossRef]
- Fan, Z.; Lu, J.; Wei, C.; Huang, H.; Cai, X.; Chen, X. A hierarchical image matting model for blood vessel segmentation in fundus images. IEEE Trans. Image Process. 2018, 28, 2367–2377. [Google Scholar] [CrossRef]
- Roychowdhury, S.; Koozekanani, D.D.; Parhi, K.K. Blood vessel segmentation of fundus images by major vessel extraction and subimage classification. IEEE J. Biomed. Health Inform. 2014, 19, 1118–1128. [Google Scholar]
- Hossain, N.I.; Reza, S. Blood vessel detection from fundus image using Markov random field based image segmentation. In Proceedings of the 2017 4th International Conference on Advances in Electrical Engineering (ICAEE), Dhaka, Bangladesh, 28–30 September 2017; pp. 123–127. [Google Scholar]
- Fu, H.; Xu, Y.; Wong, D.W.K.; Liu, J. Retinal vessel segmentation via deep learning network and fully-connected conditional random fields. In Proceedings of the 2016 IEEE 13th International Symposium on Biomedical Imaging (ISBI), Prague, Czech Republic, 13–16 April 2016; pp. 698–701. [Google Scholar]
- Soomro, T.A.; Afifi, A.J.; Gao, J.; Hellwich, O.; Khan, M.A.; Paul, M.; Zheng, L. Boosting sensitivity of a retinal vessel segmentation algorithm with convolutional neural network. In Proceedings of the 2017 International Conference on Digital Image Computing: Techniques and Applications (DICTA), Sydney, Australia, 29 November–1 December 2017; pp. 1–8. [Google Scholar]
- Chudzik, P.; Al-Diri, B.; Caliva, F.; Hunter, A. DISCERN: Generative framework for vessel segmentation using convolutional neural network and visual codebook. In Proceedings of the 2018 40th Annual International Conference of the IEEE Engineering in Medicine and Biology Society (EMBC), Honolulu, HI, USA, 18–21 July 2018; pp. 5934–5937. [Google Scholar]
- Atli, I.; Gedik, O.S. Sine-Net: A fully convolutional deep learning architecture for retinal blood vessel segmentation. Eng. Sci. Technol. Int. J. 2021, 24, 271–283. [Google Scholar] [CrossRef]
- Gargari, M.S.; Seyedi, M.H.; Alilou, M. Segmentation of Retinal Blood Vessels Using U-Net++ Architecture and Disease Prediction. Electronics 2022, 11, 3516. [Google Scholar] [CrossRef]
- Sathananthavathi, V.; Indumathi, G. Encoder enhanced atrous (EEA) unet architecture for retinal blood vessel segmentation. Cogn. Syst. Res. 2021, 67, 84–95. [Google Scholar]
- Li, Q.; Fan, S.; Chen, C. An intelligent segmentation and diagnosis method for diabetic retinopathy based on improved U-NET network. J. Med. Syst. 2019, 43, 1–9. [Google Scholar] [CrossRef] [PubMed]
- Elaouaber, Z.; Feroui, A.; Lazouni, M.; Messadi, M. Blood vessel segmentation using deep learning architectures for aid diagnosis of diabetic retinopathy. In Computer Methods in Biomechanics and Biomedical Engineering: Imaging & Visualization; Taylor & Francis: Abingdon, UK, 2022; pp. 1–15. [Google Scholar]
- Jin, Q.; Meng, Z.; Pham, T.D.; Chen, Q.; Wei, L.; Su, R. DUNet: A deformable network for retinal vessel segmentation. Knowl.-Based Syst. 2019, 178, 149–162. [Google Scholar] [CrossRef]
- Zhang, Y.; He, M.; Chen, Z.; Hu, K.; Li, X.; Gao, X. Bridge-Net: Context-involved U-net with patch-based loss weight mapping for retinal blood vessel segmentation. Expert Syst. Appl. 2022, 195, 116526. [Google Scholar] [CrossRef]
- Aujih, A.; Izhar, L.; Mériaudeau, F.; Shapiai, M.I. Analysis of retinal vessel segmentation with deep learning and its effect on diabetic retinopathy classification. In Proceedings of the 2018 International Conference on Intelligent and Advanced System (ICIAS), Kuala Lumpur, Malaysia, 13–14 August 2018; pp. 1–6. [Google Scholar]
- Burewar, S.; Gonde, A.B.; Vipparthi, S.K. Diabetic retinopathy detection by retinal segmentation with region merging using CNN. In Proceedings of the 2018 IEEE 13th International Conference on Industrial and Information Systems (ICIIS), Rupnagar, India, 1–2 December 2018; pp. 136–142. [Google Scholar]
- Liu, Z. Construction and verification of color fundus image retinal vessels segmentation algorithm under BP neural network. J. Supercomput. 2021, 77, 7171–7183. [Google Scholar] [CrossRef]
- Deng, X.; Ye, J. A retinal blood vessel segmentation based on improved D-MNet and pulse-coupled neural network. Biomed. Signal Process. Control 2022, 73, 103467. [Google Scholar] [CrossRef]
- Chala, M.; Nsiri, B.; El yousfi Alaoui, M.H.; Soulaymani, A.; Mokhtari, A.; Benaji, B. An automatic retinal vessel segmentation approach based on Convolutional Neural Networks. Expert Syst. Appl. 2021, 184, 115459. [Google Scholar] [CrossRef]
- Yadav, N. A deep data-driven approach for enhanced segmentation of blood vessel for diabetic retinopathy. Int. J. Imaging Syst. Technol. 2022, 32, 1696–1708. [Google Scholar] [CrossRef]
- Samuel, P.M.; Veeramalai, T. Multilevel and multiscale deep neural network for retinal blood vessel segmentation. Symmetry 2019, 11, 946. [Google Scholar] [CrossRef]
- Wu, Y.; Xia, Y.; Song, Y.; Zhang, Y.; Cai, W. NFN+: A novel network followed network for retinal vessel segmentation. Neural Netw. 2020, 126, 153–162. [Google Scholar] [CrossRef] [PubMed]
- Yan, Z.; Yang, X.; Cheng, K.T. A three-stage deep learning model for accurate retinal vessel segmentation. IEEE J. Biomed. Health Inform. 2018, 23, 1427–1436. [Google Scholar] [CrossRef] [PubMed]
- Fu, Q.; Li, S.; Wang, X. MSCNN-AM: A multi-scale convolutional neural network with attention mechanisms for retinal vessel segmentation. IEEE Access 2020, 8, 163926–163936. [Google Scholar] [CrossRef]
- Popescu, D.; Deaconu, M.; Ichim, L.; Stamatescu, G. Retinal blood vessel segmentation using pix2pix gan. In Proceedings of the 2021 29th Mediterranean Conference on Control and Automation (MED), Puglia, Italy, 22–25 June 2021; pp. 1173–1178. [Google Scholar]
- Yue, C.; Ye, M.; Wang, P.; Huang, D.; Lu, X. SRV-GAN: A generative adversarial network for segmenting retinal vessels. Math. Biosci. Eng. 2022, 19, 9948–9965. [Google Scholar] [CrossRef]
- Park, K.B.; Choi, S.H.; Lee, J.Y. M-GAN: Retinal blood vessel segmentation by balancing losses through stacked deep fully convolutional networks. IEEE Access 2020, 8, 146308–146322. [Google Scholar] [CrossRef]
- Aggarwal, A.; Mittal, M.; Battineni, G. Generative adversarial network: An overview of theory and applications. Int. J. Inf. Manag. Data Insights 2021, 1, 100004. [Google Scholar] [CrossRef]
- Isola, P.; Zhu, J.Y.; Zhou, T.; Efros, A.A. Image-to-image translation with conditional adversarial networks. In Proceedings of the IEEE Conference on Computer Vision and Pattern Recognition, Honolulu, HI, USA, 21–26 July 2017; pp. 1125–1134. [Google Scholar]
- Farnell, D.J.; Hatfield, F.N.; Knox, P.; Reakes, M.; Spencer, S.; Parry, D.; Harding, S.P. Enhancement of blood vessels in digital fundus photographs via the application of multiscale line operators. J. Frankl. Inst. 2008, 345, 748–765. [Google Scholar] [CrossRef]
- Staal, J.; Abràmoff, M.D.; Niemeijer, M.; Viergever, M.A.; Van Ginneken, B. Ridge-based vessel segmentation in color images of the retina. IEEE Trans. Med. Imaging 2004, 23, 501–509. [Google Scholar] [CrossRef]
- Budai, A.; Bock, R.; Maier, A.; Hornegger, J.; Michelson, G. Robust vessel segmentation in fundus images. Int. J. Biomed. Imaging 2013, 2013, 154860. [Google Scholar] [CrossRef]
- Kar, M.K.; Neog, D.R.; Nath, M.K. Retinal vessel segmentation using multi-scale residual convolutional neural network (MSR-Net) combined with generative adversarial networks. Circuits, Syst. Signal Process. 2023, 42, 1206–1235. [Google Scholar] [CrossRef]
- Vostatek, P.; Claridge, E.; Uusitalo, H.; Hauta-Kasari, M.; Fält, P.; Lensu, L. Performance comparison of publicly available retinal blood vessel segmentation methods. Comput. Med. Imaging Graph. 2017, 55, 2–12. [Google Scholar] [CrossRef] [PubMed]
- Prajna, Y.; Nath, M.K. Efficient blood vessel segmentation from color fundus image using deep neural network. J. Intell. Fuzzy Syst. 2022, 42, 1–13. [Google Scholar] [CrossRef]
- Azzopardi, G.; Strisciuglio, N.; Vento, M.; Petkov, N. Trainable COSFIRE filters for vessel delineation with application to retinal images. Med. Image Anal. 2015, 19, 46–57. [Google Scholar] [CrossRef]


| Study | Method | Dataset(s) | Year |
|---|---|---|---|
| Gargari et al. [17] | U-Net++ | DRIVE, MESSIDOR | 2022 |
| Roychowdhury et al. [11] | Gaussian mixture model classifier | DRIVE, CHASEDB1, STARE | 2014 |
| Fan et al. [10] | Image matting | DRIVE, CHASEDB1, STARE | 2018 |
| Memari et al. [9] | Fuzzy c means clustering | DRIVE, CHASEDB1, STARE | 2019 |
| Zhang et al. [22] | U-Net | DRIVE, CHASE-DB1, STARE, HRF | 2022 |
| Atli and Gedik [16] | Sine-Net | DRIVE, CHASEDB1, STARE | 2021 |
| Sathananthavathi et al. [18] | U-Net | CHASE DB1, DRIVE, STARE, HRF | 2021 |
| Deng and Ye [26] | D-MNet | CHASE DB1, DRIVE, STARE, HRF | 2022 |
| Elaouaber et al. [20] | Multiple DL models | DRIVE, CHASE-DB1, HRF | 2022 |
| Dataset | Method | Accuracy | Sensitivity | Specificity | Dice | Jaccard | MCC | Precision |
|---|---|---|---|---|---|---|---|---|
| DRIVE | Kar et al. [41] | 0.974 | 0.894 | 0.988 | - | - | - | 0.875 |
| Elaouaber et al. [20] | 0.977 | 0.967 | 0.996 | 0.957 | - | - | - | |
| Zhang et al. [22] | 0.957 | 0.785 | 0.982 | 0.82 | - | 0.798 | 0.864 | |
| Popescu et al. [33] | 0.921 | 0.834 | 0.960 | - | - | - | 0.948 | |
| Yue et al. [34] | 0.970 | 0.833 | 0.985 | - | - | - | - | |
| Park et al. [35] | 0.970 | 0.834 | 0.983 | - | - | 0.826 | 0.834 | |
| Proposed | 0.978 | 0.975 | 0.981 | 0.978 | 0.956 | 0.956 | 0.98 | |
| HRF | Kar et al. [41] | 0.977 | 0.889 | 0.985 | - | - | - | 0.8 |
| Elaouaber et al. [20] | 0.98 | 0.98 | 0.995 | 0.969 | - | - | - | |
| Zhang et al. [22] | 0.96 | 0.85 | 0.971 | 0.82 | - | - | - | |
| Park et al. [35] | 0.967 | - | - | - | - | 0.784 | - | |
| Proposed | 0.983 | 0.973 | 0.992 | 0.982 | 0.965 | 0.966 | 0.992 | |
| ARIA | Kar et al. [41] | 0.963 | 0.718 | 0.984 | - | - | - | 0.795 |
| Vostatek et al. [42] | 0.94 | - | - | - | - | - | - | |
| Prajna and Nath [43] | 0.925 | 0.566 | 0.961 | 0.649 | 0.48 | - | - | |
| Proposed | 0.971 | 0.974 | 0.969 | 0.97 | 0.942 | 0.943 | 0.966 |
Disclaimer/Publisher’s Note: The statements, opinions and data contained in all publications are solely those of the individual author(s) and contributor(s) and not of MDPI and/or the editor(s). MDPI and/or the editor(s) disclaim responsibility for any injury to people or property resulting from any ideas, methods, instructions or products referred to in the content. |
© 2023 by the authors. Licensee MDPI, Basel, Switzerland. This article is an open access article distributed under the terms and conditions of the Creative Commons Attribution (CC BY) license (https://creativecommons.org/licenses/by/4.0/).
Share and Cite
Sebastian, A.; Elharrouss, O.; Al-Maadeed, S.; Almaadeed, N. GAN-Based Approach for Diabetic Retinopathy Retinal Vasculature Segmentation. Bioengineering 2024, 11, 4. https://doi.org/10.3390/bioengineering11010004
Sebastian A, Elharrouss O, Al-Maadeed S, Almaadeed N. GAN-Based Approach for Diabetic Retinopathy Retinal Vasculature Segmentation. Bioengineering. 2024; 11(1):4. https://doi.org/10.3390/bioengineering11010004
Chicago/Turabian StyleSebastian, Anila, Omar Elharrouss, Somaya Al-Maadeed, and Noor Almaadeed. 2024. "GAN-Based Approach for Diabetic Retinopathy Retinal Vasculature Segmentation" Bioengineering 11, no. 1: 4. https://doi.org/10.3390/bioengineering11010004