

A Comparison of the Impact of Pharmacological Treatments on Cardioversion, Rate Control, and Mortality in Data-Driven Atrial Fibrillation Phenotypes in Critical Care


Abstract
:1. Introduction
2. Materials and Methods
2.1. Data
2.2. Cohort Definition
2.3. Variables
2.4. Outcomes
2.5. Treatment Groups
2.6. Multiple Imputation
2.7. Inverse Probability of Treatment Weighting
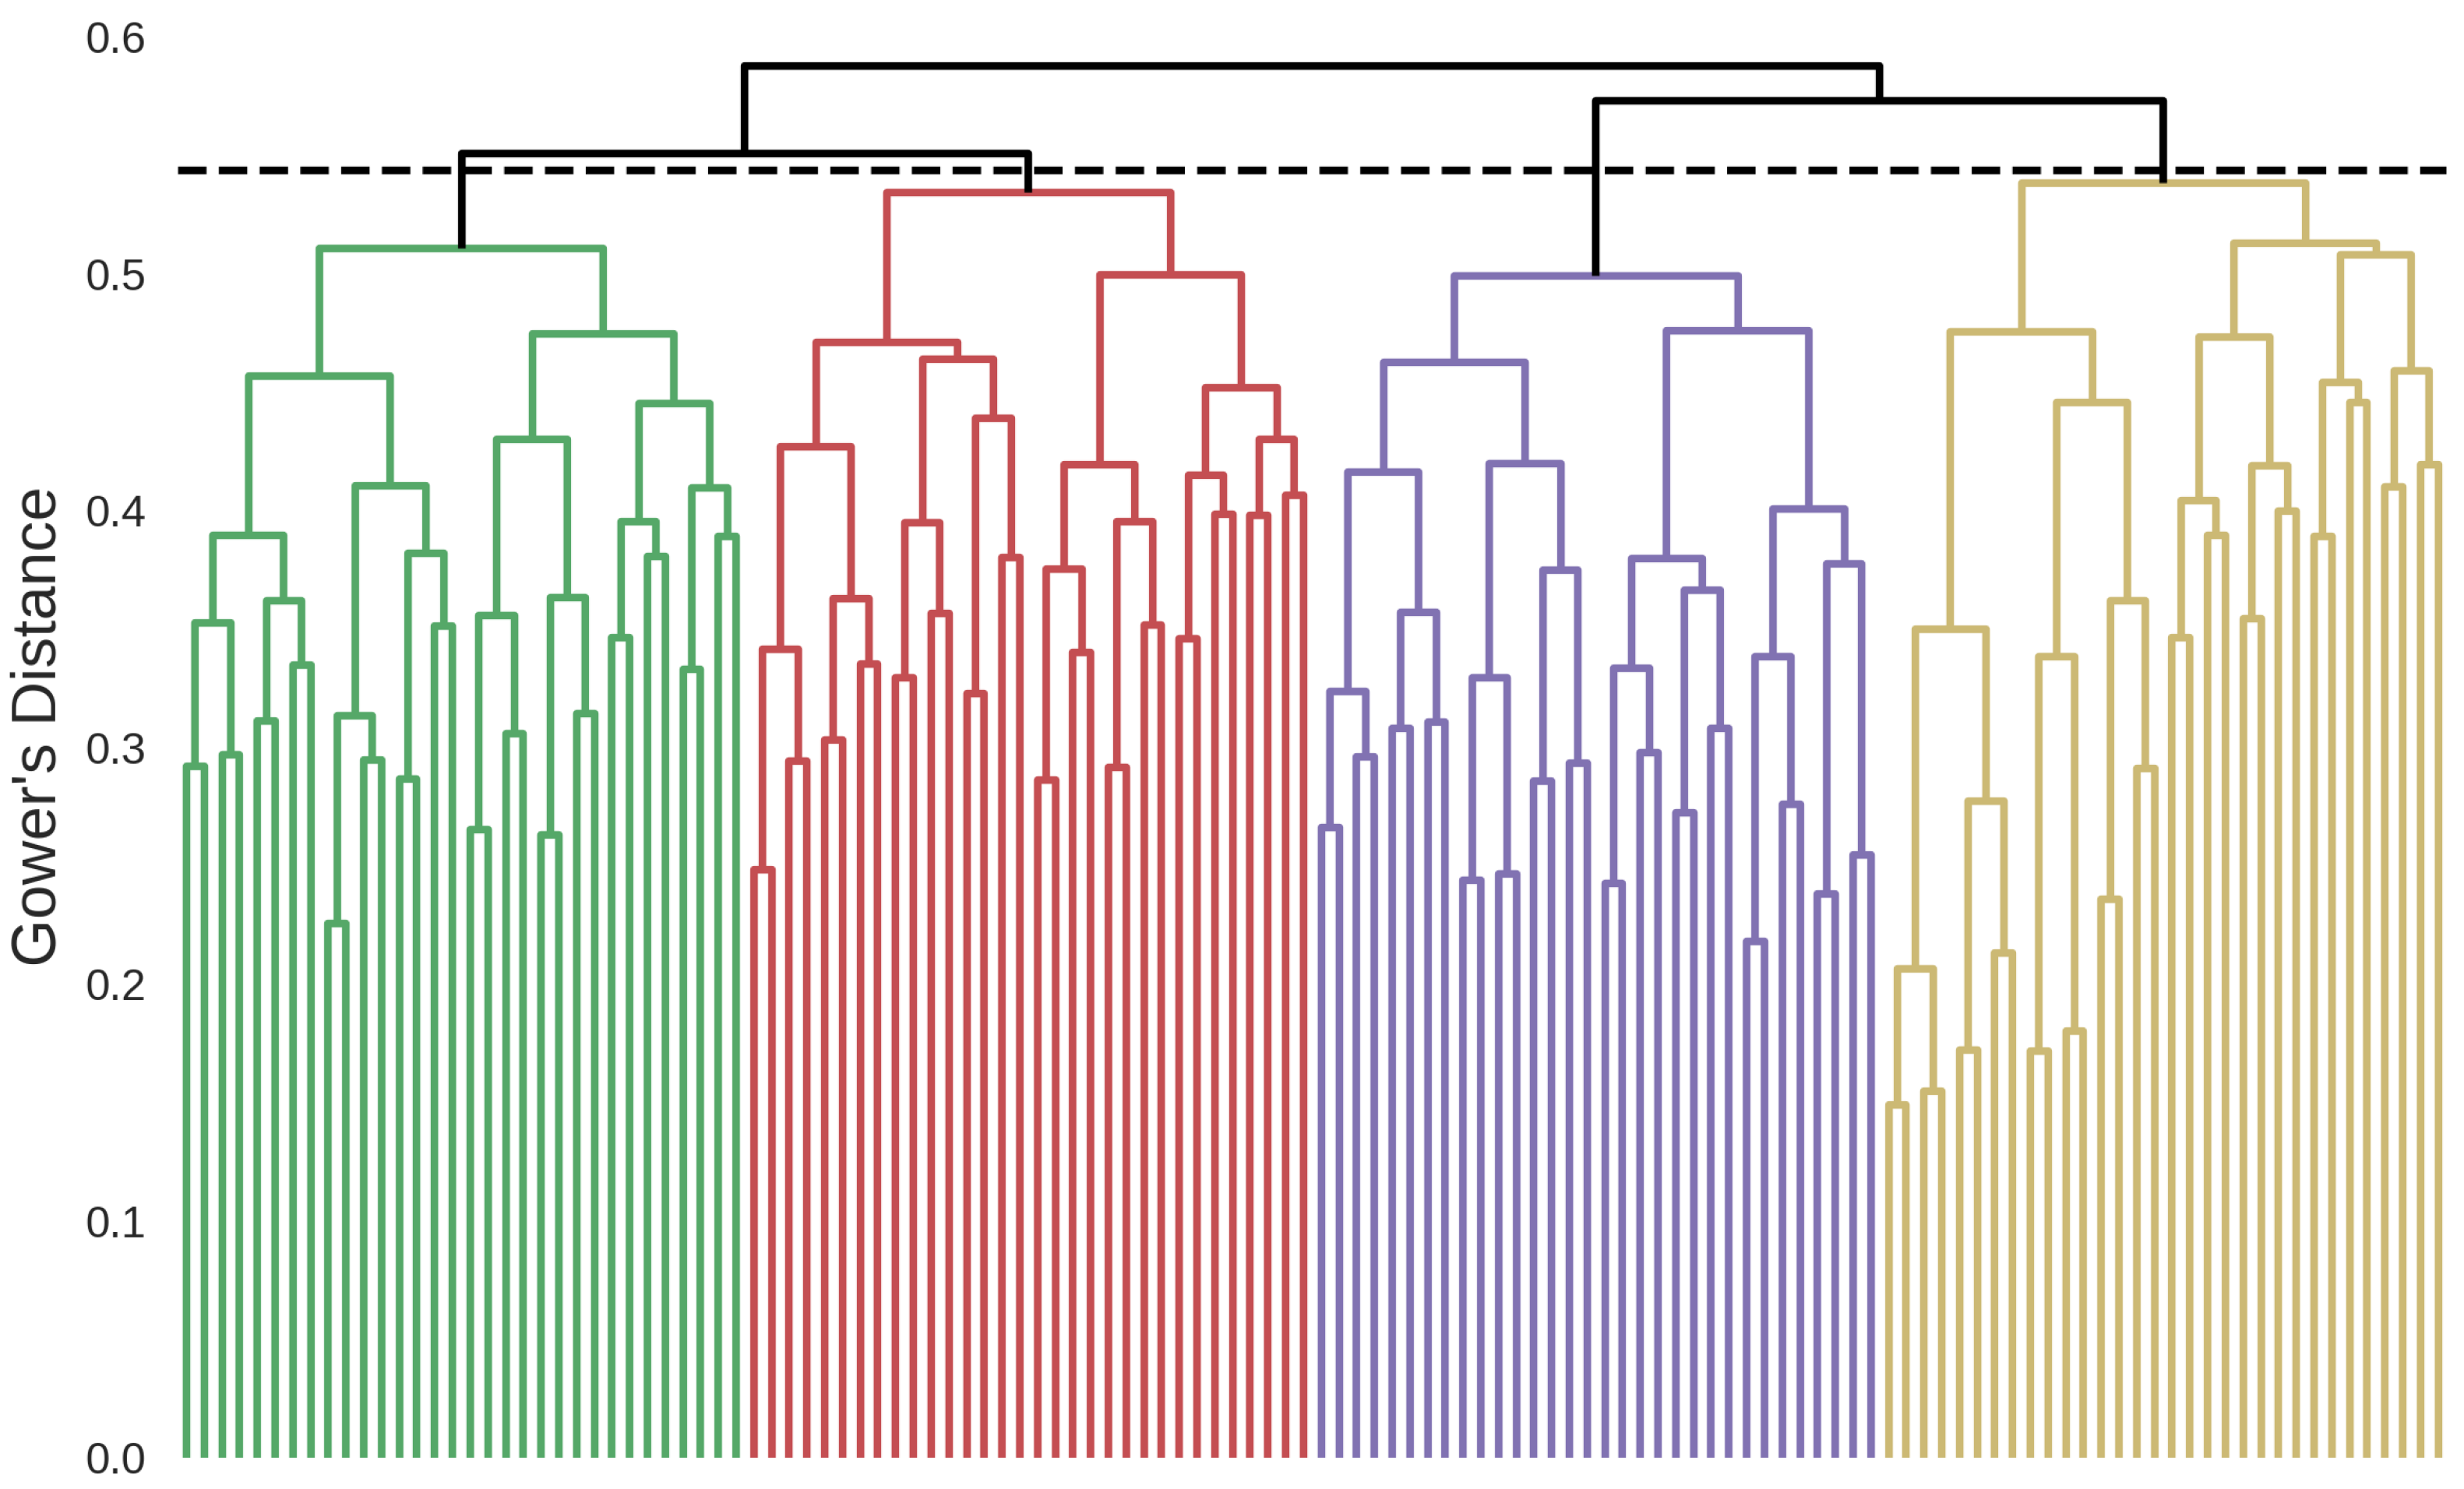
2.8. Cluster Analysis
2.9. Statistical Analysis
- All statistical analyses were performed using Python 3.7 and R Core v4.1.2. A secondary analysis using the KMeans algorithm can be found in Section S1 of the Supplementary Material.
3. Results
3.1. Patient Clusters
- Cluster 1: Postoperative Hypertensive (n = 2963)Patients in this cluster have the highest rate of postoperative conditions (74.2%) and hypertension (64.3%). This cluster has the highest share of male patients (72.1%), and the highest rate of coronary artery atherosclerosis (65.5%). Notably, patients in this cluster are the youngest (median age, 73.3; IQR, 65.1–80.5), have the lowest heart rates (median, 83.5; IQR, 75.0–90.1), and the lowest rate of arrhythmia history (12.8%).
- Cluster 2: Non-Cardiovascular Multimorbid (n = 3546)This cluster is characterized by the highest rate of chronic obstructive pulmonary disease (COPD) (16.6%) and diabetes (25.8%), while also having a high rate of renal insufficiency (43.9%). Patients in this cluster have the lowest rate of left and right atrial dilation (17.9%, 6.49%), coronary artery atherosclerosis (18.3%), and valvulopathies (12.6%) while having the highest rate of arrhythmia history (26.3%).
- Cluster 3: Cardiovascular Multimorbid (n = 557)Patients in this cluster are the oldest (median age, 78.1; IQR, 69.2–85.4) and have the highest rate of heart failure (85.5%). They have the highest rate of left and right atrial dilation (94.3%, 78.8%), thyroid disorders (16.0%), myocardial infarction (19.0%), renal insufficiency (54.6%), respiratory failure (40.2%), sepsis (30.9%), and obstructive sleep apnea (7.36%). Even though patients in this cluster have a high rate of comorbidities, they have the lowest rate of hypertension (27.1%).
- Cluster 4: Valvulopathy Atrial Dilation (n = 2335)This cluster is characterized by the highest rate of valvulopathies (45.2%) and a high rate of left and right atrial dilation (91.0%, 76.0%). Patients in this cluster further have the highest rates of cor pulmonale (14.3%) and a high rate of COPD (16.0%).
3.2. Treatment Effects
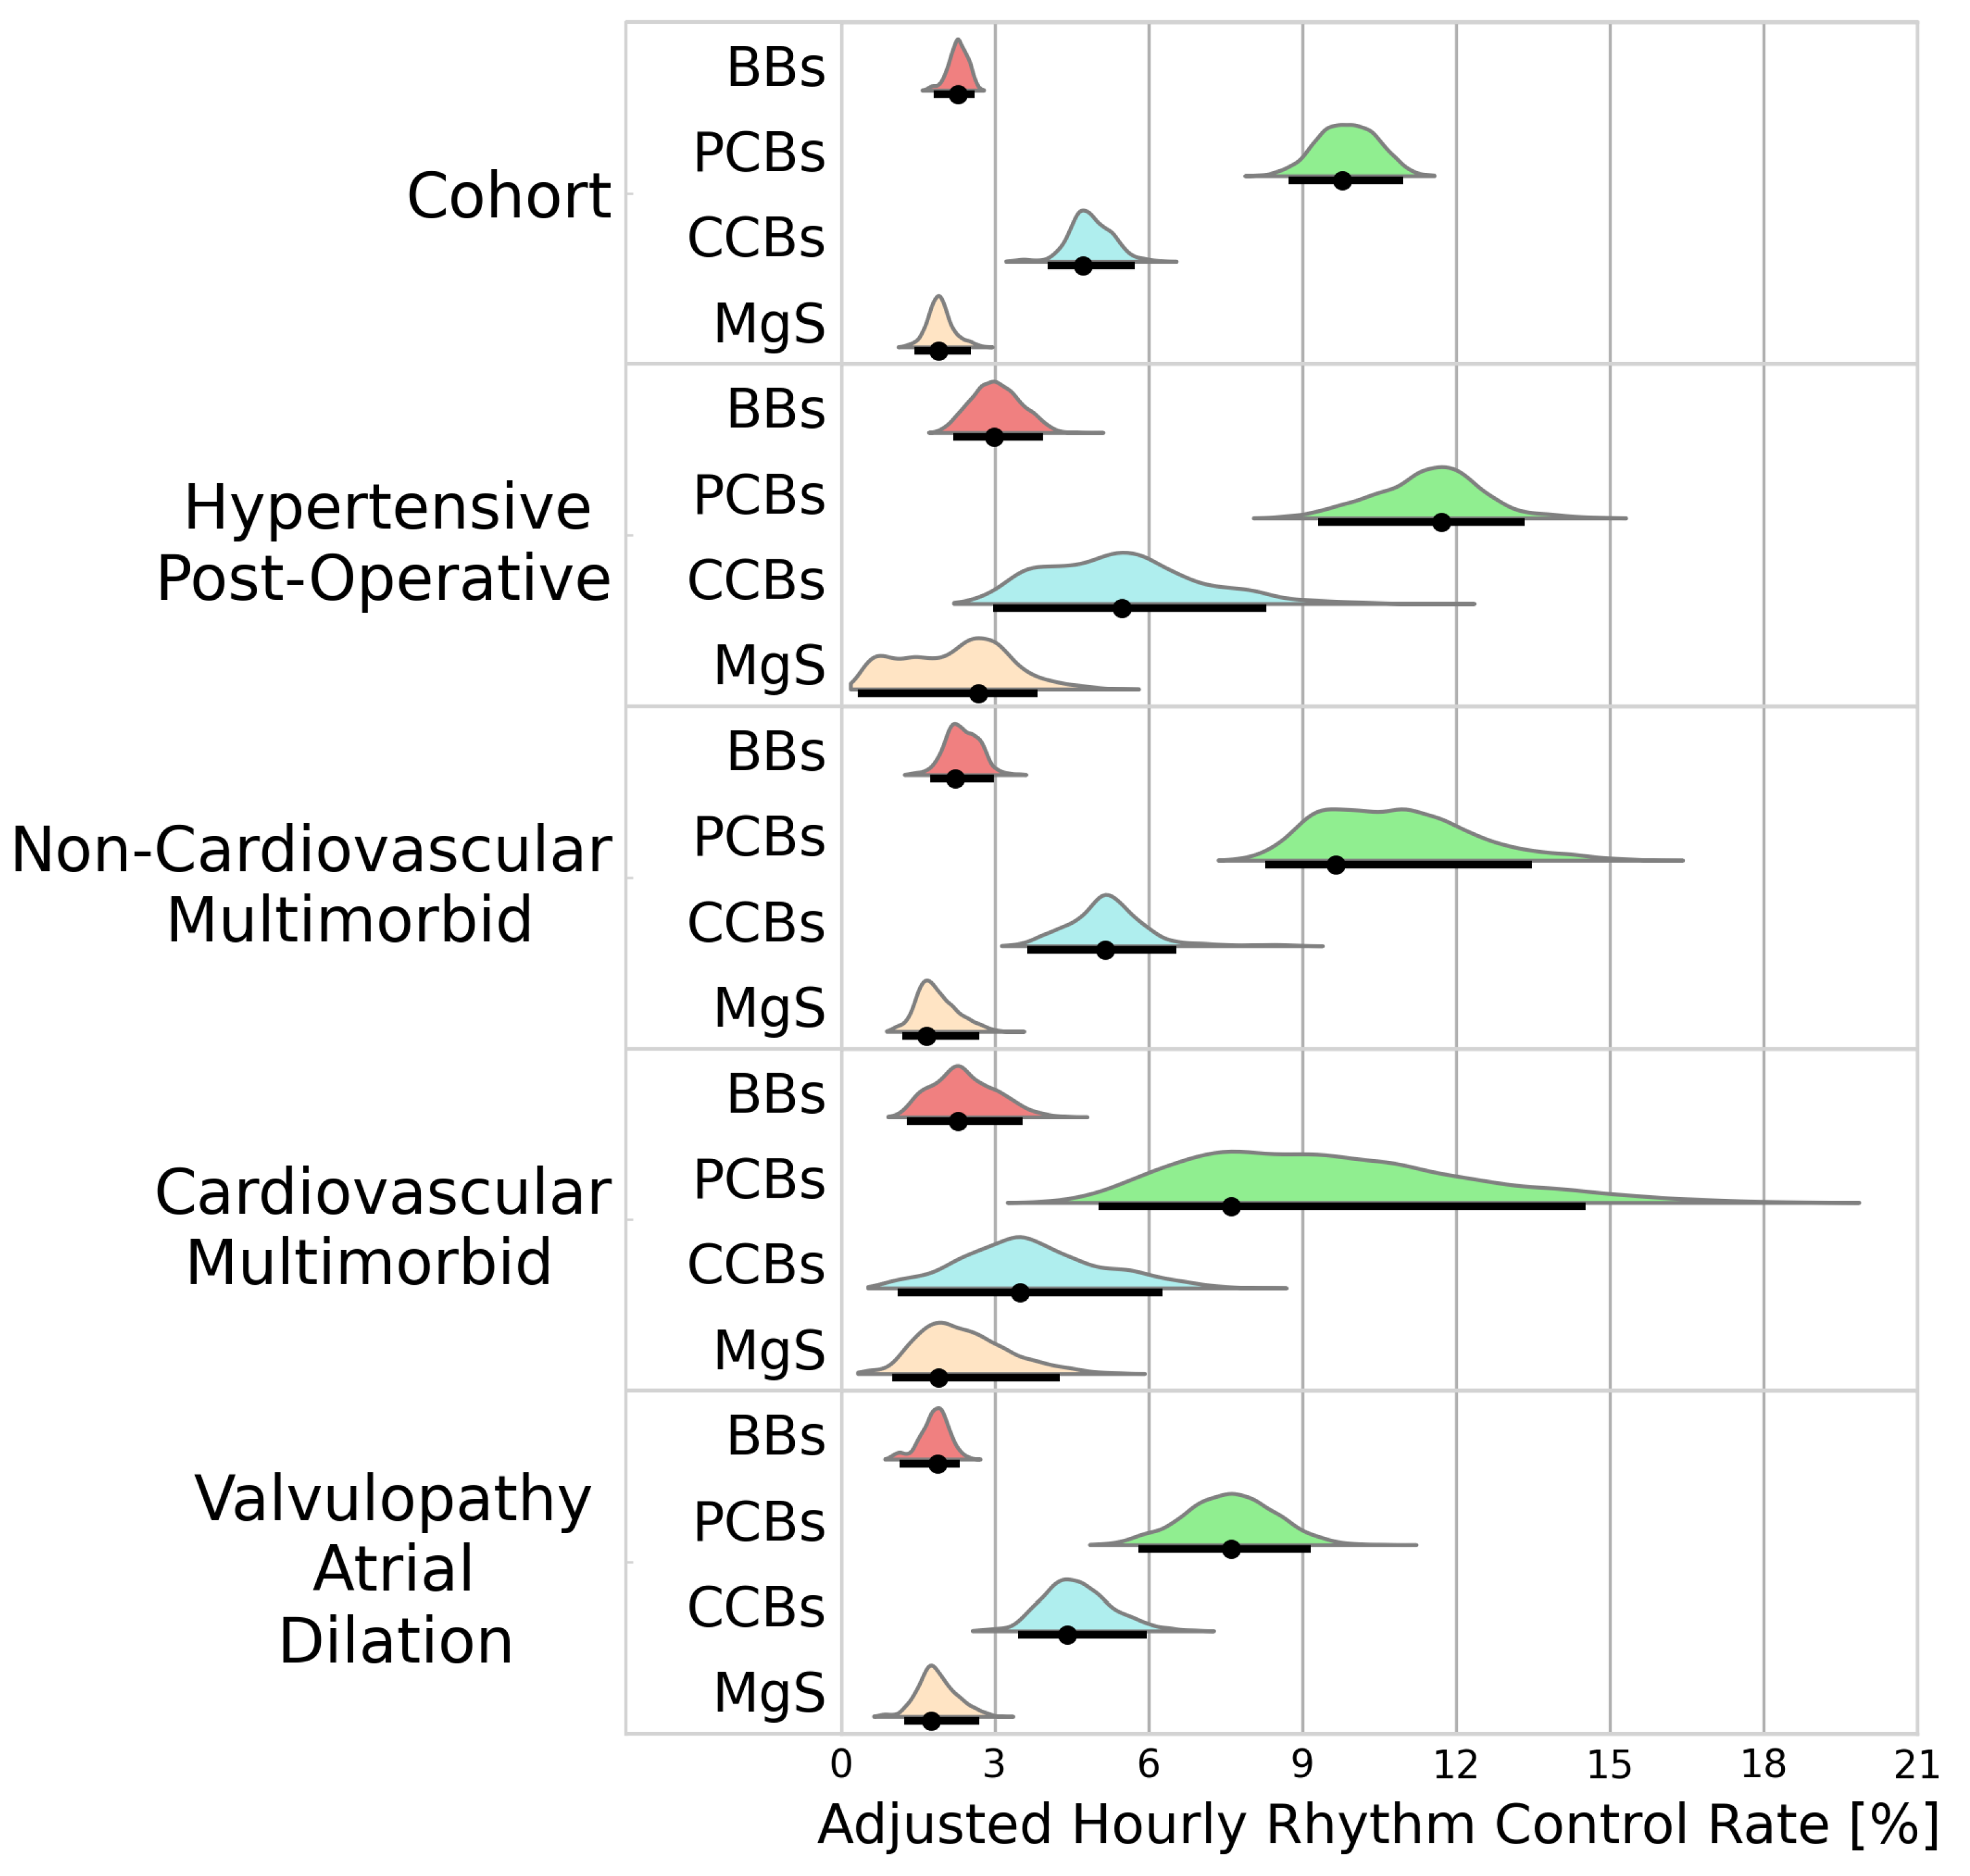
3.2.1. Rhythm Control
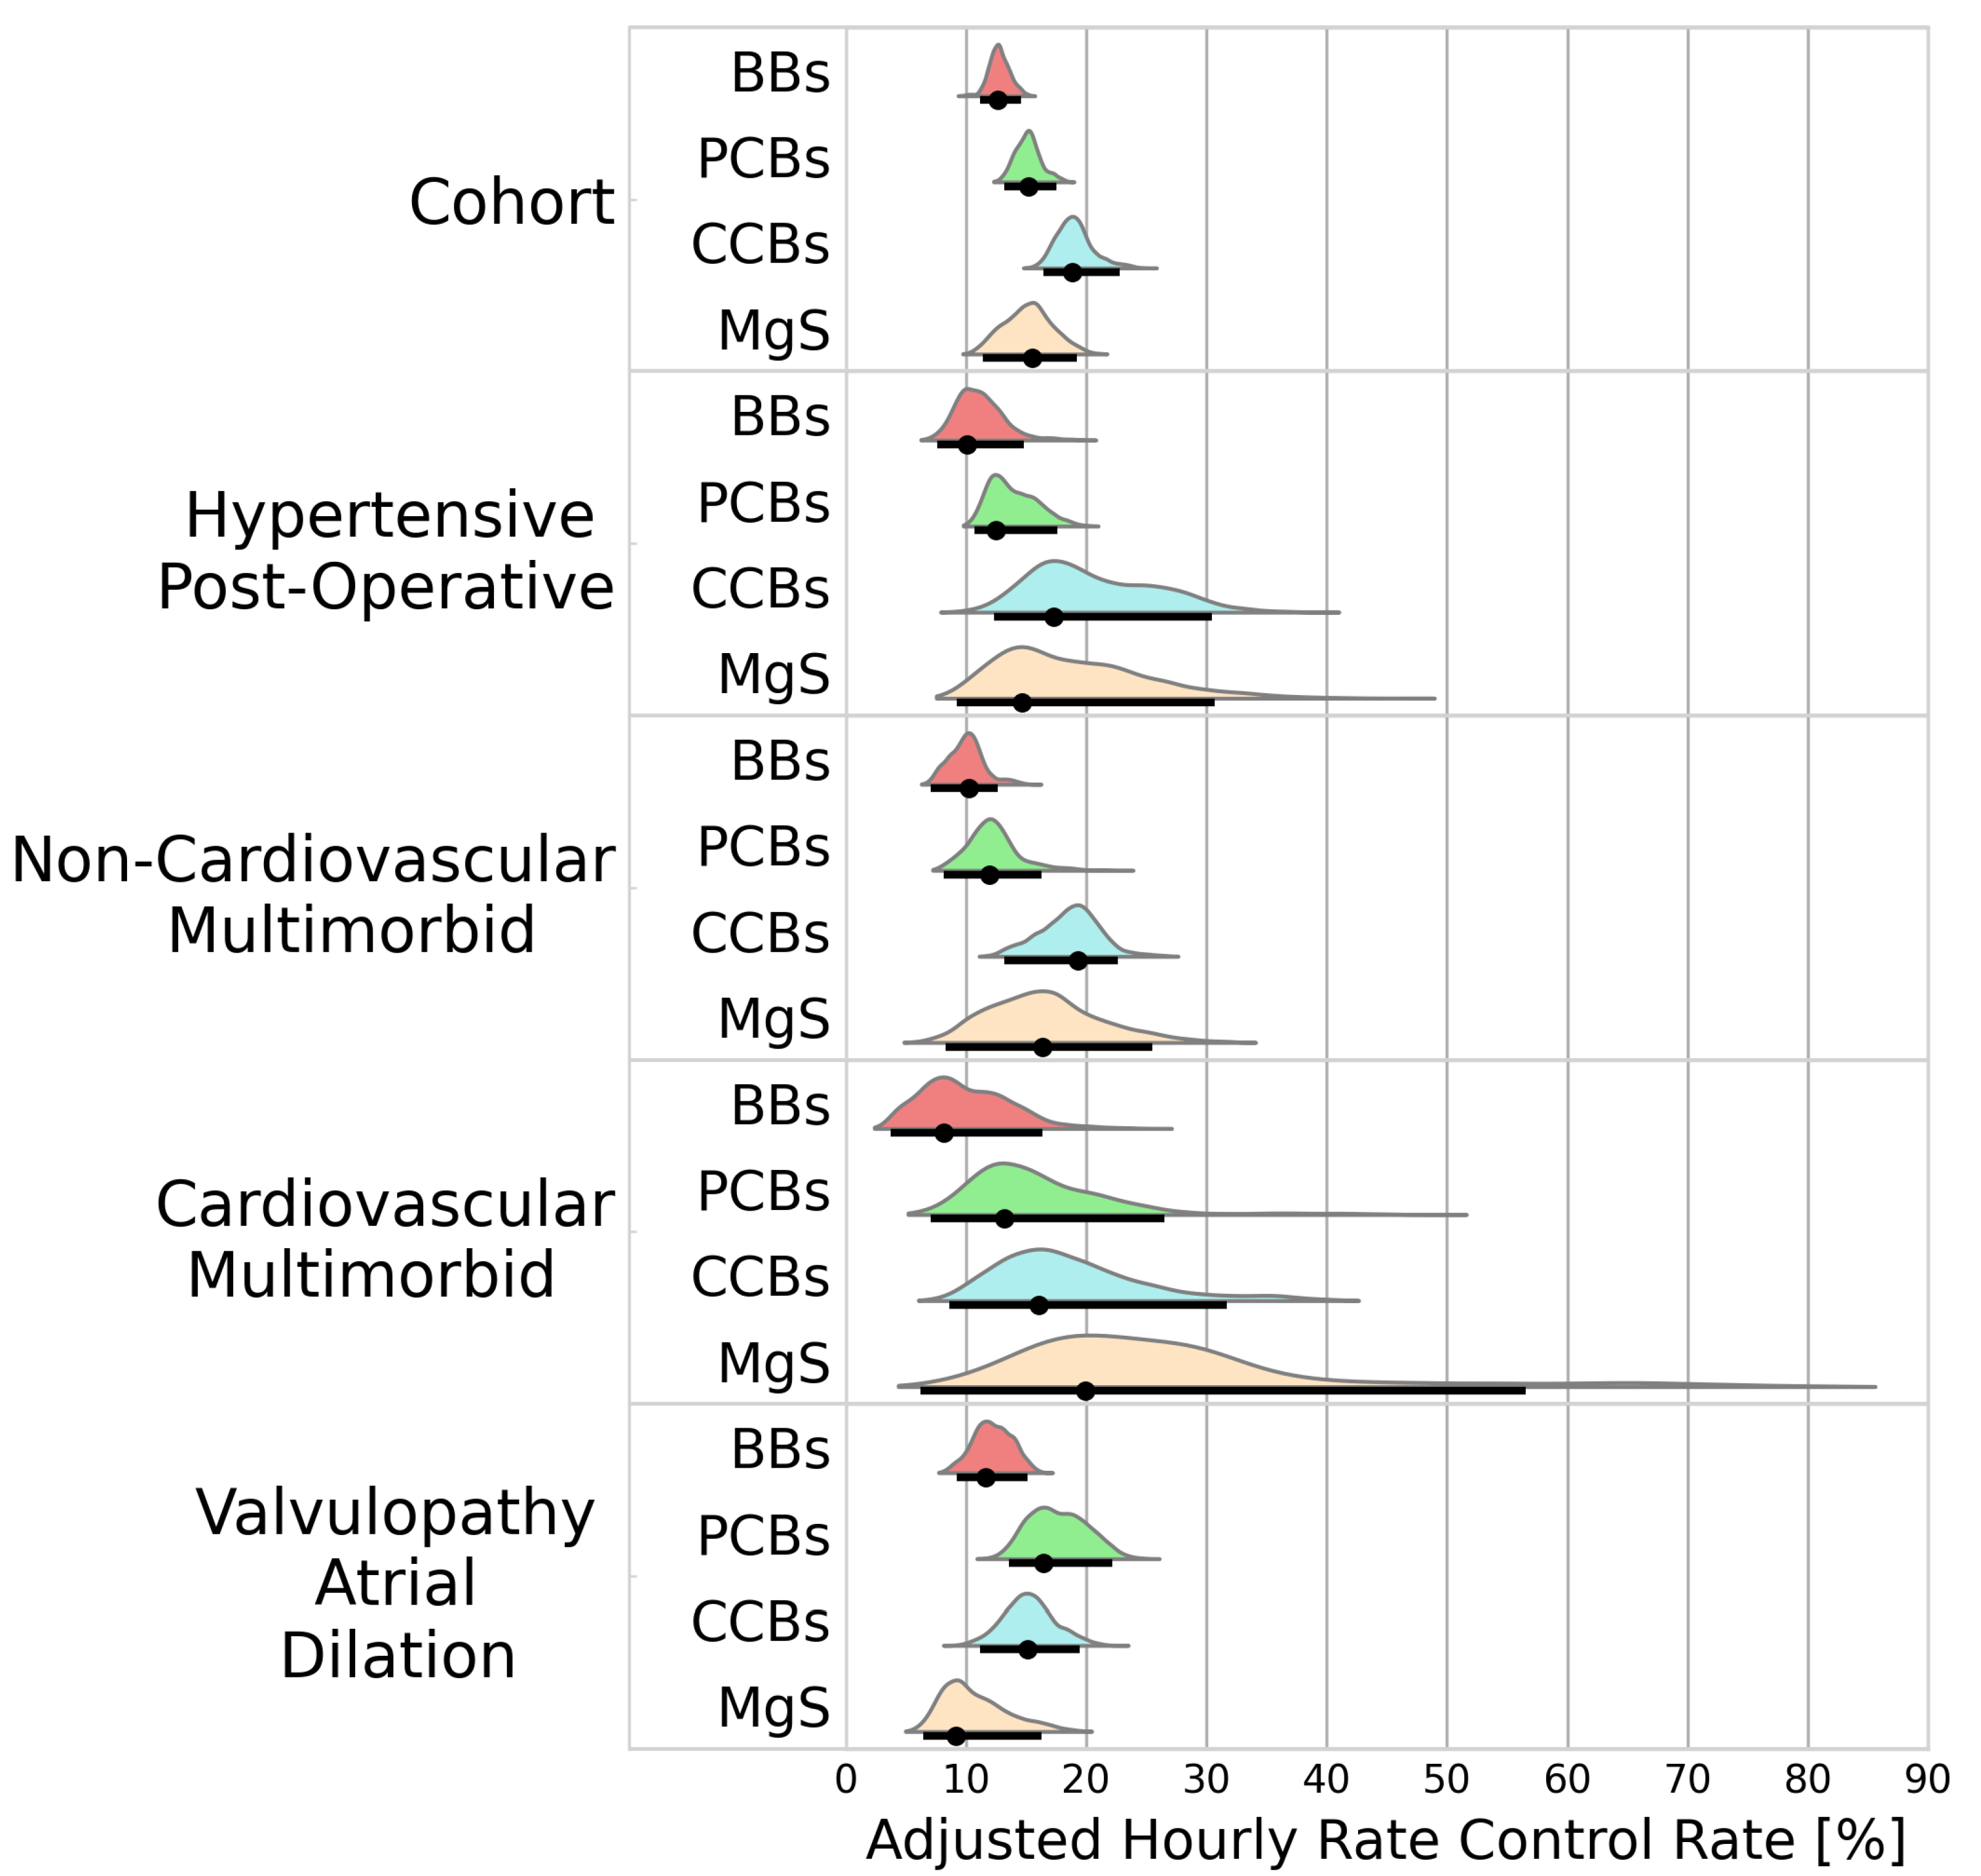
3.2.2. Rate Control
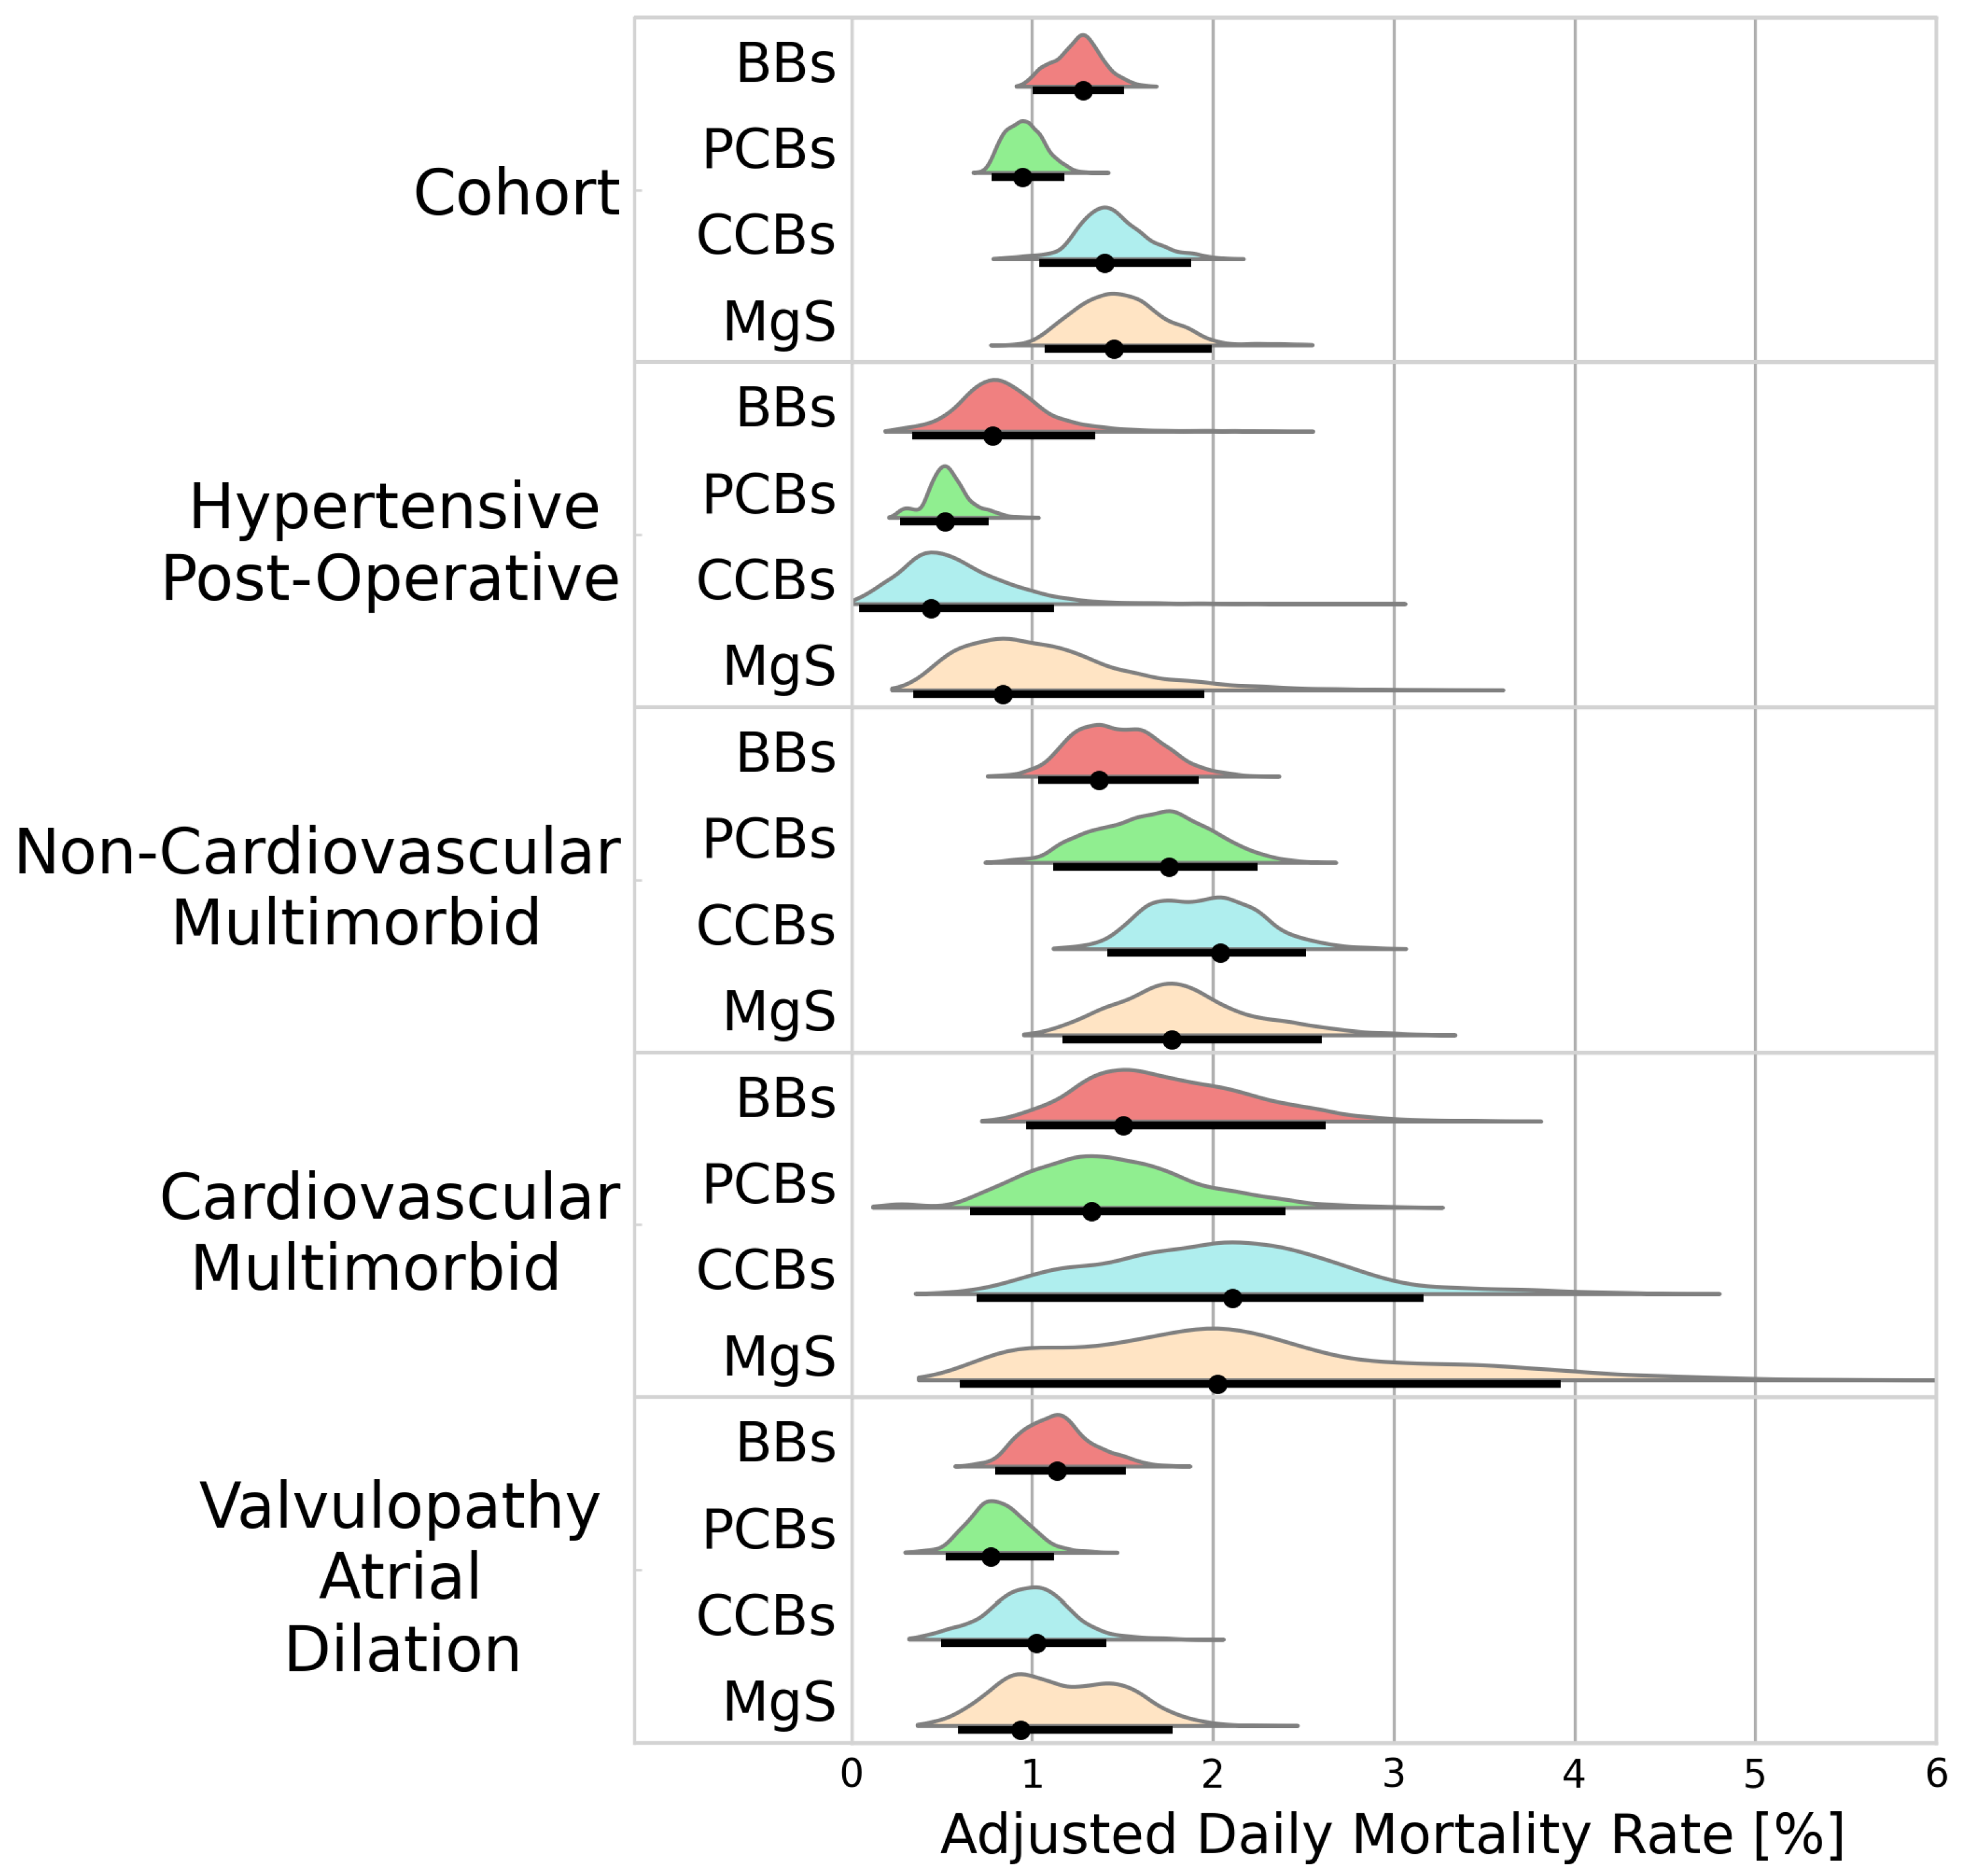
3.2.3. Mortality
4. Discussion
Limitations
5. Conclusions
Supplementary Materials
Author Contributions
Funding
Institutional Review Board Statement
Informed Consent Statement
Data Availability Statement
Conflicts of Interest
Abbreviations
| AF | Atrial fibrillation |
| ATE | Average treatment effect |
| BB | Beta blocker |
| BF | Bayes factor |
| CCB | Calcium channel blocker |
| COPD | Chronic obstructive pulmonary disease |
| HDI | Highest density interval |
| ICU | Intensive care unit |
| IQR | Interquartile range |
| MgS | Magnesium sulphate |
| NOAF | New onset atrial fibrillation |
| OSA | Obstructive sleep apnoe |
| PCB | Potassium channel blocker |
Appendix A

| Category | Characteristic | Missing (%) | Standard Name | Source Code |
|---|---|---|---|---|
| Medical History | Anemia | 0.00 | Anemia | 271737000 |
| Arrhythmia history | 0.00 | Arrhythmia history | MIMIC ITEMID: 225811 | |
| Collagen disease | 0.00 | Systemic lupus erythematosus | 55464009 | |
| Polymyalgia rheumatica | 65323003 | |||
| Sjögren’s syndrome | 83901003 | |||
| 81573002 | 81573002 | |||
| COPD | 0.00 | Chronic obstructive lung disease | 13645005 | |
| Cor pulmonale | 0.00 | Acute cor pulmonale | 49584005 | |
| Chronic pulmonary heart disease | 87837008 | |||
| Pulmonary arterial hypertension | 11399002 | |||
| Coronary artery atherosclerosis | 0.00 | Coronary arteriosclerosis | 53741008 | |
| Diabetes | 0.00 | Type 1 diabetes mellitus | 46635009 | |
| Type 2 diabetes mellitus | 44054006 | |||
| Diabetes insipidus | 15771004 | |||
| Diabetes mellitus | 73211009 | |||
| Type 2 diabetes mellitus without complication | 313436004 | |||
| Nephrogenic diabetes insipidus | 111395007 | |||
| Diabetic ketoacidosis | 420422005 | |||
| Medical History | Heart failure | 0.00 | Congestive rheumatic heart failure | 82523003 |
| Acute systolic heart failure | 443254009 | |||
| Diastolic heart failure | 418304008 | |||
| Congestive heart failure | 42343007 | |||
| Chronic diastolic heart failure | 441530006 | |||
| Acute diastolic heart failure | 443343001 | |||
| Heart failure | 84114007 | |||
| Systolic heart failure | 417996009 | |||
| Acute on chronic systolic heart failure | 443253003 | |||
| Acute on chronic diastolic heart failure | 443344007 | |||
| Chronic systolic heart failure | 441481004 | |||
| Acute combined systolic and diastolic heart failure | 153931000119109 | |||
| Acute on chronic combined systolic and diastolic heart failure | 153951000119103 | |||
| Chronic combined systolic and diastolic heart failure | 153941000119100 | |||
| Hypertension | 0.00 | 59621000 | ||
| Myocardial infarction | 0.00 | Acute subendocardial infarction | 70422006 | |
| Myocardial infarction | 22298006 | |||
| OSA | 0.00 | Obstructive sleep apnea syndrome | 78275009 | |
| Post-operative condition | 0.00 | Percutaneous transluminal coronary angioplasty [PTCA] | OMOP:2000064 | |
| Insertion of non-drug-eluting coronary artery stent(s) | OMOP:2001505 | |||
| Angioplasty of other non-coronary vessel(s) | OMOP:2002222 | |||
| Multiple vessel percutaneous transluminal coronary angioplasty [PTCA] or coronary atherectomy performed during the same operation, with or without mention of thrombolytic agent | OMOP:2001504 | |||
| Open and other replacement of aortic valve | OMOP:2001450 | |||
| (Aorto)coronary bypass of four or more coronary arteries | OMOP:2001513 | |||
| Open heart valvuloplasty of mitral valve without replacement | OMOP:2001444 | |||
| (Aorto)coronary bypass of two coronary arteries | OMOP:2001511 | |||
| Open and other replacement of mitral valve with tissue graft | OMOP:2001451 | |||
| Open and other replacement of mitral valve | OMOP:2001452 | |||
| Insertion of drug-eluting coronary artery stent(s) | OMOP:2001506 | |||
| Extracorporeal circulation auxiliary to open heart surgery | OMOP:2002243 | |||
| Open and other replacement of aortic valve with tissue graft | OMOP:2001449 | |||
| Pericardiotomy | OMOP:2001533 | |||
| (Aorto)coronary bypass of three coronary arteries | OMOP:2001512 | |||
| (Aorto)coronary bypass of one coronary artery | OMOP:2001510 | |||
| Medical History | Renal insufficiency | 0.00 | Renal failure syndrome | 42399005 |
| Chronic kidney disease | 709044004 | |||
| Acute renal failure syndrome | 14669001 | |||
| Chronic kidney disease stage 1 | 431855005 | |||
| Chronic kidney disease stage 2 | 431856006 | |||
| Chronic kidney disease stage 3 | 433144002 | |||
| Chronic kidney disease stage 4 | 431857002 | |||
| Chronic kidney disease stage 5 | 433146000 | |||
| Benign hypertensive renal disease with renal failure | 698591006 | |||
| End-stage renal disease | 46177005 | |||
| Chronic kidney disease stage 5 due to hypertension | 129161000119100 | |||
| Respiratory failure | 0.0 0 | Acute respiratory failure | 65710008 | |
| Rheumatism | 0.00 | Rheumatic aortic stenosis | 72011007 | |
| Rheumatic mitral regurgitation | 31085000 | |||
| Rheumatic aortic stenosis with insufficiency | 17759006 | |||
| Congestive rheumatic heart failure | 82523003 | |||
| Rheumatic disease of aortic valve | 12023003 | |||
| Rheumatoid arthritis | 69896004 | |||
| Rheumatic heart disease | 23685000 | |||
| Rheumatic disease of pulmonary valve | 18687009 | |||
| Rheumatic aortic regurgitation | 78031003 | |||
| Sepsis | 0.00 | Sepsis | 91302008 | |
| Septic shock | 76571007 | |||
| Severe sepsis | 1036671000000106 | |||
| Thyroid disorder | 0.00 | Primary malignant neoplasm of thyroid gland | 94098005 | |
| Congenital hypothyroidism | 190268003 | |||
| Thyrotoxic crisis | 29028009 | |||
| Benign neoplasm of thyroid gland | 92439006 | |||
| Acquired hypothyroidism | 111566002 | |||
| Disorder of thyroid gland | 14304000 | |||
| Medical History | Valvulopathy | 0.00 | Mitral valve regurgitation | 48724000 |
| Mitral and aortic incompetence | 194736003 | |||
| Ebstein’s anomaly | 204357006 | |||
| Subaortic stenosis | 204368006 | |||
| Mitral valve stenosis | 79619009 | |||
| Trauma and postoperative pulmonary insufficiency | 266370006 | |||
| Rheumatic aortic stenosis | 72011007 | |||
| Mitral stenosis and aortic insufficiency | 194734000 | |||
| Mitral and aortic stenosis | 194733006 | |||
| Rheumatic mitral regurgitation | 31085000 | |||
| Rheumatic aortic stenosis with regurgitation | 17759006 | |||
| Aortic valve disorder | 8722008 | |||
| Aortic valve regurgitation | 60234000 | |||
| Tricuspid valve disorder | 20721001 | |||
| Mitral insufficiency and aortic stenosis | 194735004 | |||
| Mitral valve disorder | 11851006 | |||
| Aortic valve stenosis | 60573004 | |||
| Rheumatic disease of aortic valve | 12023003 | |||
| Rheumatic aortic regurgitation | 78031003 | |||
| Mitral stenosis with insufficiency | 194726006 | |||
| Laboratory Measurement | Erythrocyte count [#/µm] | 0.97 | Erythrocytes [#/volume] in Blood by Automated count | LOINC:789-8 |
| Erythrocyte distribution width [ratio] | 0.98 | Erythrocyte distribution width [Ratio] by Automated count | LOINC:788-0 | |
| Hemoglobin [g/dL] | 0.88 | Hemoglobin [Mass/volume] in Blood | LOINC:718-7 | |
| Leukocyte count | 0.96 | Leukocytes [#/volume] in Blood by Manual count | LOINC:804-5 | |
| Platelet count | 0.93 | Platelets [#/volume] in Blood by Manual count | LOINC:778-1 | |
| Platelets [#/volume] in Blood by Automated count | LOINC:777-3 | |||
| Prothrombin time | 1.80 | Prothrombin time (PT) | LOINC:5902-2 | |
| Serum calcium [mg/dL] | 5.07 | Calcium [Mass/volume] in Serum or Plasma | LOINC:17861-6 | |
| Serum creatinine [mg/dL] | 0.87 | Creatinine [Mass/volume] in Serum or Plasma | LOINC:2160-0 | |
| Serum magnesium [mg/dL] | 1.40 | Magnesium [Moles/volume] in Serum or Plasma | LOINC:2601-3 | |
| Serum potassium [mmol/L] | 1.03 | Potassium [Moles/volume] in Serum or Plasma | LOINC:2823-3 | |
| Serum sodium [mmol/L] | 1.04 | Sodium [Moles/volume] in Serum or Plasma | LOINC:2951-2 | |
| Observation | Heart Rate [BPM] | 2.34 | Heart rate | LOINC:8867-4 |
| Left Atrial Dilation | 0.00 | - | String matching from clinical notes | |
| Right Atrial Dilation | 0.00 | - | String matching from clinical notes | |
| Demographic | Age | 0.00 | - | - |
| Male sex | 0.00 | “MALE”/”FEMALE” | OMOP:8507 OMOP:8532 |
| Category | Variable | Entire Cohort (n = 9401) | Cluster 1 (n = 2963) | Cluster 2 (n = 3546) | Cluster 3 (n = 557) | Cluster 4 (n = 2335) | p-Value (among Clusters) |
|---|---|---|---|---|---|---|---|
| Medical History | Anemia | 1127 (11.99) | 390 (13.16) | 369 (10.41) | 70 (12.57) | 298 (12.76) | <0.001 |
| Arrhythmia History | 1959 (20.8) | 380 (12.8) | 932 (26.3) | 113 (20.3) | 534 (22.9) | <0.001 | |
| Collagen disease | 115 (1.22) | 24 (0.81) | 58 (1.64) | 11 (1.97) | 22 (0.94) | <0.001 | |
| COPD | 1256 (13.4) | 226 (7.63) | 588 (16.6) | 68 (12.2) | 374 (16.0) | <0.001 | |
| Cor pulmonale | 754 (8.02) | 179 (6.04) | 164 (4.62) | 77 (13.8) | 334 (14.3) | <0.001 | |
| Coronary artery atherosclerosis | 3461 (36.8) | 1941 (65.5) | 650 (18.3) | 223 (40.0) | 647 (27.7) | <0.001 | |
| Diabetes | 2147 (22.8) | 677 (22.9) | 915 (25.8) | 101 (18.1) | 454 (19.4) | <0.001 | |
| Heart failure | 4128 (43.9) | 851 (28.7) | 1441 (40.6) | 476 (85.5) | 1360 (58.2) | <0.001 | |
| Hypertension | 4562 (48.5) | 1924 (64.9) | 1401 (39.5) | 151 (27.1) | 1085 (46.5) | <0.001 | |
| Myocardial infarction | 933 (9.92) | 403 (13.6) | 167 (4.71) | 106 (19.0) | 257 (11.0) | <0.001 | |
| OSA | 403 (4.29) | 130 (4.39) | 126 (3.55) | 41 (7.36) | 106 (4.54) | <0.001 | |
| Post-operative condition | 3250 (34.6) | 2198 (74.2) | 215 (6.06) | 92 (16.5) | 745 (31.9) | <0.001 | |
| Renal insufficiency | 3261 (34.7) | 519 (17.5) | 1555 (43.9) | 304 (54.6) | 883 (37.8) | <0.001 | |
| Respiratory failure | 1450 (15.4) | 118 (3.98) | 819 (23.1) | 224 (40.2) | 289 (12.4) | <0.001 | |
| Rheumatism | 403 (4.29) | 126 (4.25) | 82 (2.31) | 33 (5.92) | 162 (6.94) | <0.001 | |
| Sepsis | 1144 (12.2) | 56 (1.89) | 651 (18.4) | 172 (30.9) | 265 (11.4) | <0.001 | |
| Thyroid disorder | 1051 (11.2) | 246 (8.30) | 398 (11.2) | 89 (16.0) | 318 (13.6) | <0.001 | |
| Valvulopathy | 2865 (30.5) | 1230 (41.5) | 446 (12.6) | 133 (23.9) | 1056 (45.2) | <0.001 | |
| Laboratory Measurement | Erythrocyte count [#/m] | 3.88 (3.38–4.37) | 3.88 (3.32–4.39) | 3.86 (3.39–4.35) | 3.82 (3.31–4.23) | 3.91 (3.44–4.39) | <0.001 |
| Erythrocyte distribution width [ratio] | 14.4 (13.5–15.7) | 13.9 (13.2–14.7) | 14.7 (13.7–16.2) | 15.1 (13.9–16.8) | 14.5 (13.7–15.9) | <0.001 | |
| Hemoglobin [g/dL] | 12.1 (10.6–13.4) | 12.6 (11.3–13.8) | 11.7 (10.2–13.2) | 11.5 (10.1–12.8) | 12.0 (10.6–13.4) | <0.001 | |
| Leukocyte count [#/nL] | 10.0 (7.30–13.7) | 9.4 (7.10–12.6) | 10.6 (7.50–14.6) | 10.6 (7.60–14.7) | 9.90 (7.10–13.4) | <0.001 | |
| Platelet count [#/nL] | 215 (163–279) | 197 (153–249) | 230 (171–299) | 212 (163–285) | 222 (167–286) | <0.001 | |
| Prothrombin time [s] | 14.5 (13.1–18.1) | 14.1 (13.0–16.0) | 14.7 (13.1–20.2) | 15.2 (13.4–20.7) | 14.6 (13.2–19.0) | <0.001 | |
| Serum calcium [mg/dL] | 8.60 (8.10–9.10) | 8.6 (8.20–9.00) | 8.60 (8.10–9.00) | 8.60 (8.10–9.10) | 8.70 (8.20–9.10) | <0.001 | |
| Serum creatinine [mg/dL] | 1.10 (0.80–1.50) | 1.00 (0.80–1.20) | 1.10 (0.80–1.70) | 1.30 (0.90–1.90) | 1.10 (0.90–1.50) | <0.001 | |
| Serum magnesium [mg/dL] | 2.00 (1.80–2.20) | 2.00 (1.80–2.30) | 1.90 (1.70–2.20) | 2.00 (1.80–2.30) | 2.00 (1.80–2.20) | <0.001 | |
| Serum potassium [mmol/L] | 4.20 (3.90–4.70) | 4.20 (3.90–4.60) | 4.20 (3.80–4.70) | 4.30 (3.80–4.80) | 4.20 (3.90–4.70) | <0.001 | |
| Serum sodium [mmol/L] | 139 (136–141) | 139 (137–141) | 139 (136–141) | 139 (136–141) | 139 (136–141) | <0.001 | |
| Observation | Heart Rate [BPM] | 85.5 (75.0–98.0) | 83.5 (75.0–91.0) | 87.8 (74.0–103) | 87.0 (74.0–104) | 86.0 (74.0–99.0) | <0.001 |
| Left Atrial Dilation | 4183 (44.5) | 898 (30.3) | 636 (17.9) | 525 (94.3) | 2124 (91.0) | <0.001 | |
| Right Atrial Dilation | 2813 (29.9) | 371 (12.5) | 230 (6.49) | 439 (78.8) | 1773 (75.9) | <0.001 | |
| Demographic | Age [years] | 76.5 (67.3–83.6) | 73.3 (65.1–80.5) | 78.0 (68.7–85.1) | 78.1 (69.2–85.4) | 77.8 (68.9–84.3) | <0.001 |
| Male sex | 5364 (57.1) | 2136 (72.1) | 1671 (47.1) | 277 (49.7) | 1280 (54.8) | <0.001 |
References
- Chugh, S.S.; Havmoeller, R.; Narayanan, K.; Singh, D.; Rienstra, M.; Benjamin, E.J.; Gillum, R.F.; Kim, Y.H.; McAnulty, J.H.; Zheng, Z.J.; et al. Worldwide Epidemiology of Atrial Fibrillation. Circulation 2014, 129, 837–847. [Google Scholar] [CrossRef]
- Yoshida, T.; Fujii, T.; Uchino, S.; Takinami, M. Epidemiology, prevention, and treatment of new-onset atrial fibrillation in critically ill: A systematic review. J. Intensive Care 2015, 3, 19. [Google Scholar] [CrossRef] [PubMed]
- Clayton, B.; Ball, S.; Read, J.; Waddy, S. Risk of thromboembolism in patients developing critical illness-associated atrial fibrillation. Clin. Med. 2018, 18, 282–287. [Google Scholar] [CrossRef] [PubMed]
- Shaver, C.M.; Chen, W.; Janz, D.R.; May, A.K.; Darbar, D.; Bernard, G.R.; Bastarache, J.A.; Ware, L.B. Atrial Fibrillation Is an Independent Predictor of Mortality in Critically Ill Patients*. Crit. Care Med. 2015, 43, 2104–2111. [Google Scholar] [CrossRef] [PubMed]
- Brugada, R.; Tapscott, T.; Czernuszewicz, G.Z.; Marian, A.; Iglesias, A.; Mont, L.; Brugada, J.; Girona, J.; Domingo, A.; Bachinski, L.L.; et al. Identification of a Genetic Locus for Familial Atrial Fibrillation. N. Engl. J. Med. 1997, 336, 905–911. [Google Scholar] [CrossRef] [PubMed]
- Kannel, W.; Wolf, P.; Benjamin, E.; Levy, D. Prevalence, incidence, prognosis, and predisposing conditions for atrial fibrillation: Population-based estimates 11Reprints are not available. Am. J. Cardiol. 1998, 82, 2N–9N. [Google Scholar] [CrossRef] [PubMed]
- Wijesurendra, R.S.; Casadei, B. Mechanisms of atrial fibrillation. Heart 2019, 105, 1860–1867. [Google Scholar] [CrossRef] [PubMed]
- Bosch, N.A.; Cimini, J.; Walkey, A.J. Atrial Fibrillation in the ICU. Chest 2018, 154, 1424–1434. [Google Scholar] [CrossRef] [PubMed]
- Wetterslev, M.; Haase, N.; Hassager, C.; Belley-Cote, E.P.; McIntyre, W.F.; An, Y.; Shen, J.; Cavalcanti, A.B.; Zampieri, F.G.; Guimaraes, H.P.; et al. New-onset atrial fibrillation in adult critically ill patients: A scoping review. Intensive Care Med. 2019, 45, 928–938. [Google Scholar] [CrossRef]
- Calvo, D.; Filgueiras-Rama, D.; Jalife, J. Mechanisms and Drug Development in Atrial Fibrillation. Pharmacol. Rev. 2018, 70, 505–525. [Google Scholar] [CrossRef]
- Bedford, J.P.; Johnson, A.; Redfern, O.; Gerry, S.; Doidge, J.; Harrison, D.; Rajappan, K.; Rowan, K.; Young, J.D.; Mouncey, P.; et al. Comparative effectiveness of common treatments for new-onset atrial fibrillation within the ICU: Accounting for physiological status. J. Crit. Care 2022, 67, 149–156. [Google Scholar] [CrossRef]
- Goette, A.; Borof, K.; Breithardt, G.; Camm, A.J.; Crijns, H.J.; Kuck, K.H.; Wegscheider, K.; Kirchhof, P.; on behalf of the EAST-AFNET 4 Investigators. Presenting Pattern of Atrial Fibrillation and Outcomes of Early Rhythm Control Therapy. J. Am. Coll. Cardiol. 2022, 80, 283–295. [Google Scholar] [CrossRef]
- Wetterslev, M.; Møller, M.H.; Granholm, A.; Hassager, C.; Haase, N.; Aslam, T.N.; Shen, J.; Young, P.J.; Aneman, A.; Hästbacka, J.; et al. Management of acute atrial fibrillation in the intensive care unit: An international survey. Acta Anaesthesiol. Scand. 2022, 66, 375–385. [Google Scholar] [CrossRef]
- Moskowitz, A.; Chen, K.P.; Cooper, A.Z.; Chahin, A.; Ghassemi, M.M.; Celi, L.A. Management of Atrial Fibrillation with Rapid Ventricular Response in the Intensive Care Unit. Shock 2017, 48, 436–440. [Google Scholar] [CrossRef]
- Walkey, A.J.; Hogarth, D.K.; Lip, G.Y. Optimizing Atrial Fibrillation Management. Chest 2015, 148, 859–864. [Google Scholar] [CrossRef] [PubMed]
- Inohara, T.; Shrader, P.; Pieper, K.; Blanco, R.G.; Thomas, L.; Singer, D.E.; Freeman, J.V.; Allen, L.A.; Fonarow, G.C.; Gersh, B.; et al. Association of of Atrial Fibrillation Clinical Phenotypes With Treatment Patterns and Outcomes. JAMA Cardiol. 2018, 3, 54. [Google Scholar] [CrossRef] [PubMed]
- Inohara, T.; Piccini, J.P.; Mahaffey, K.W.; Kimura, T.; Katsumata, Y.; Tanimoto, K.; Inagawa, K.; Ikemura, N.; Ueda, I.; Fukuda, K.; et al. A Cluster Analysis of the Japanese Multicenter Outpatient Registry of Patients with Atrial Fibrillation. Am. J. Cardiol. 2019, 124, 871–878. [Google Scholar] [CrossRef] [PubMed]
- Pastori, D.; Antonucci, E.; Milanese, A.; Menichelli, D.; Palareti, G.; Farcomeni, A.; Pignatelli, P. Clinical Phenotypes of Atrial Fibrillation and Mortality Risk—A Cluster Analysis from the Nationwide Italian START Registry. J. Pers. Med. 2022, 12, 785. [Google Scholar] [CrossRef] [PubMed]
- Suzuki, S.; Yamashita, T.; Otsuka, T.; Arita, T.; Yagi, N.; Kishi, M.; Semba, H.; Kano, H.; Matsuno, S.; Kato, Y.; et al. Identifying risk patterns in older adults with atrial fibrillation by hierarchical cluster analysis: A retrospective approach based on the risk probability for clinical events. IJC Heart Vasc. 2021, 37, 100883. [Google Scholar] [CrossRef] [PubMed]
- Vitolo, M.; Proietti, M.; Shantsila, A.; Boriani, G.; Lip, G.Y.H. Clinical Phenotype Classification of Atrial Fibrillation Patients Using Cluster Analysis and Associations with Trial-Adjudicated Outcomes. Biomedicines 2021, 9, 843. [Google Scholar] [CrossRef]
- Watanabe, E.; Inoue, H.; Atarashi, H.; Okumura, K.; Yamashita, T.; Kodani, E.; Kiyono, K.; Origasa, H. Clinical phenotypes of patients with non-valvular atrial fibrillation as defined by a cluster analysis: A report from the J-RHYTHM registry. IJC Heart Vasc. 2021, 37, 100885. [Google Scholar] [CrossRef]
- Johnson, A.E.; Pollard, T.J.; Shen, L.; Lehman, L.-w.H.; Feng, M.; Ghassemi, M.; Moody, B.; Szolovits, P.; Celi, L.A.; Mark, R.G. MIMIC-III, a freely accessible critical care database. Sci. Data 2016, 3, 160035. [Google Scholar] [CrossRef] [PubMed]
- Fromm, C.; Suau, S.J.; Cohen, V.; Likourezos, A.; Jellinek-Cohen, S.; Rose, J.; Marshall, J. Diltiazem vs. Metoprolol in the Management of Atrial Fibrillation or Flutter with Rapid Ventricular Rate in the Emergency Department. J. Emerg. Med. 2015, 49, 175–182. [Google Scholar] [CrossRef]
- Ding, E.Y.; Albuquerque, D.; Winter, M.; Binici, S.; Piche, J.; Bashar, S.K.; Chon, K.; Walkey, A.J.; McManus, D.D. Novel Method of Atrial Fibrillation Case Identification and Burden Estimation Using the MIMIC-III Electronic Health Data Set. J. Intensive Care Med. 2019, 34, 851–857. [Google Scholar] [CrossRef]
- Reisinger, S.J.; Ryan, P.B.; O’Hara, D.J.; Powell, G.E.; Painter, J.L.; Pattishall, E.N.; Morris, J.A. Development and evaluation of a common data model enabling active drug safety surveillance using disparate healthcare databases. J. Am. Med. Inform. Assoc. 2010, 17, 652–662. [Google Scholar] [CrossRef]
- Paris, N.; Lamer, A.; Parrot, A. Transformation and Evaluation of the MIMIC Database in the OMOP Common Data Model: Development and Usability Study. JMIR Med. Inform. 2021, 9, e30970. [Google Scholar] [CrossRef]
- Williams, E.M.V. A Classification of Antiarrhythmic Actions Reassessed After a Decade of New Drugs. J. Clin. Pharmacol. 1984, 24, 129–147. [Google Scholar] [CrossRef] [PubMed]
- Rubin, D. Multiple Imputation for Nonresponse in Surveys; John Wiley & Sons, Inc.: Hoboken, NJ, USA, 1987. [Google Scholar] [CrossRef]
- van Buuren, S.; Groothuis-Oudshoorn, K. mice: Multivariate Imputation by Chained Equations in R. J. Stat. Softw. 2011, 45, 1–67. [Google Scholar] [CrossRef]
- Bodner, T.E. What Improves with Increased Missing Data Imputations? Struct. Equ. Model. A Multidiscip. J. 2008, 15, 651–675. [Google Scholar] [CrossRef]
- Rosenbaum, P.R.; Rubin, D.B. The central role of the propensity score in observational studies for causal effects. Biometrika 1983, 70, 41–55. [Google Scholar] [CrossRef]
- Ridgeway, G.; Mccaffrey, D.; Morral, A.; Burgette, L.; Griffin, B.A. Twang: Toolkit for Weighting and Analysis of Nonequivalent Groups. R Package Version 1.0–1. R Foundation for Statistical Computing. 2006. Available online: http://www.cran.r-project.org (accessed on 22 July 2022).
- Gower, J.C. A General Coefficient of Similarity and Some of Its Properties. Biometrics 1971, 27, 857. [Google Scholar] [CrossRef]
- Gail, M.H.; Byar, D.P. Variance Calculations for Direct Adjusted Survival Curves, with Applications to Testing for No Treatment Effect. Biom. J. 1986, 28, 587–599. [Google Scholar] [CrossRef]
- Rubin, D.B. The Bayesian Bootstrap. Ann. Stat. 1981, 9, 130–134. [Google Scholar] [CrossRef]
- Kass, R.E.; Raftery, A.E. Bayes Factors. J. Am. Stat. Assoc. 1995, 90, 773–795. [Google Scholar] [CrossRef]
- Iwashyna, T.J.; Burke, J.F.; Sussman, J.B.; Prescott, H.C.; Hayward, R.A.; Angus, D.C. Implications of Heterogeneity of Treatment Effect for Reporting and Analysis of Randomized Trials in Critical Care. Am. J. Respir. Crit. Care Med. 2015, 192, 1045–1051. [Google Scholar] [CrossRef] [PubMed]
- Walkey, A.J.; Evans, S.R.; Winter, M.R.; Benjamin, E.J. Practice Patterns and Outcomes of Treatments for Atrial Fibrillation During Sepsis. Chest 2016, 149, 74–83. [Google Scholar] [CrossRef]
- Siu, C.W.; Lau, C.P.; Lee, W.L.; Lam, K.F.; Tse, H.F. Intravenous diltiazem is superior to intravenous amiodarone or digoxin for achieving ventricular rate control in patients with acute uncomplicated atrial fibrillation. Crit. Care Med. 2009, 37, 2174–2179. [Google Scholar] [CrossRef]
- Bair, E.; Tibshirani, R. Semi-Supervised Methods to Predict Patient Survival from Gene Expression Data. PLoS Biol. 2004, 2, e108. [Google Scholar] [CrossRef]
- Gaynor, S.; Bair, E. Identification of biologically relevant subtypes via preweighted sparse clustering. arXiv 2013, arXiv:abs/1304.3760. [Google Scholar]
- Johnson, A.; Pollard, T.; Mark, R. MIMIC-III Clinical Database (Version 1.4). 2016. Available online: https://physionet.org/content/mimiciii/1.4/ (accessed on 29 November 2021).


| Treatment Group | Active Principles | Mechanism of Action |
|---|---|---|
| Beta Blockers | Acebutolol | Decrease sympathetic activity by blocking ß-adrenergic receptors, reducing AV node conduction and calcium influx. |
| Esmolol | ||
| Labetalol | ||
| Metoprolol | ||
| Propranolol | ||
| Potassium Channel Blockers | Amiodarone | Prolong the duration of action potentials and refractory periods, preventing re-entrant activity. |
| Dofetilide | ||
| Dronedarone | ||
| Ibutilide | ||
| Sotalol | ||
| Calcium Channel Blockers | Dilatiazem Verapamil | Decrease conduction through the AV node, and shorten phase two of the cardiac action potential, decreasing myocardial contraction. |
| Magnesium Sulphate | Magnesium Sulphate | Stabilizes the membrane potential, prolongs refractory periods, and decreases AV node conduction and sinus node recovery times. |
| Category | Characteristic | Median (IQR)/n (%) |
|---|---|---|
| Medical History | Anemia | 1127 (11.99) |
| Arrhythmia History | 1959 (20.8) | |
| COPD | 1256 (13.4) | |
| Collagen disease | 115 (1.22) | |
| Cor pulmonale | 754 (8.02) | |
| Coronary artery atherosclerosis | 3461 (36.8) | |
| Diabetes | 2147 (22.8) | |
| Thyroid disorder | 1051 (11.2) | |
| Heart failure | 4128 (43.9) | |
| Hypertension | 4562 (48.5) | |
| Myocardial infarction | 933 (9.92) | |
| OSA | 403 (4.29) | |
| Medical History | Post-operative condition | 3250 (34.6) |
| Renal insufficiency | 3261 (34.7) | |
| Respiratory failure | 1450 (15.4) | |
| Rheumatism | 403 (4.29) | |
| Sepsis | 1144 (12.2) | |
| Valvulopathy | 2865 (30.5) | |
| Laboratory Measurements | Erythrocyte distribution width [ratio] | 14.4 (13.5–15.7) |
| Erythrocyte count [#/µm] | 3.88 (3.38–4.37) | |
| Serum calcium [mg/dL] | 8.60 (8.10–9.10) | |
| Serum creatinine [mg/dL] | 1.10 (0.80–1.50) | |
| Serum magnesium [mg/dL] | 2.00 (1.80–2.20) | |
| Serum potassium [mmol/L] | 4.20 (3.90–4.70) | |
| Serum sodium [mmol/L] | 139 (136–141) | |
| Hemoglobin [g/dL] | 12.1 (10.6–13.4) | |
| Leukocyte count [#/nL] | 10.0 (7.30–13.7) | |
| Platelet count [#/nL] | 215 (163–279) | |
| Prothrombin time [s] | 14.5 (13.1–18.1) | |
| Observation | Heart Rate [BPM] | 85.5 (75.0–98.0) |
| Left Atrial Dilation | 4183 (44.5) | |
| Right Atrial Dilation | 2813 (29.9) | |
| Demographics | Age [years] | 76.5 (67.3–83.6) |
| Male sex | 5364 (57.1) |
Disclaimer/Publisher’s Note: The statements, opinions and data contained in all publications are solely those of the individual author(s) and contributor(s) and not of MDPI and/or the editor(s). MDPI and/or the editor(s) disclaim responsibility for any injury to people or property resulting from any ideas, methods, instructions or products referred to in the content. |
© 2024 by the authors. Licensee MDPI, Basel, Switzerland. This article is an open access article distributed under the terms and conditions of the Creative Commons Attribution (CC BY) license (https://creativecommons.org/licenses/by/4.0/).
Share and Cite
Lacki, A.; Martinez-Millana, A. A Comparison of the Impact of Pharmacological Treatments on Cardioversion, Rate Control, and Mortality in Data-Driven Atrial Fibrillation Phenotypes in Critical Care. Bioengineering 2024, 11, 199. https://doi.org/10.3390/bioengineering11030199
Lacki A, Martinez-Millana A. A Comparison of the Impact of Pharmacological Treatments on Cardioversion, Rate Control, and Mortality in Data-Driven Atrial Fibrillation Phenotypes in Critical Care. Bioengineering. 2024; 11(3):199. https://doi.org/10.3390/bioengineering11030199
Chicago/Turabian StyleLacki, Alexander, and Antonio Martinez-Millana. 2024. "A Comparison of the Impact of Pharmacological Treatments on Cardioversion, Rate Control, and Mortality in Data-Driven Atrial Fibrillation Phenotypes in Critical Care" Bioengineering 11, no. 3: 199. https://doi.org/10.3390/bioengineering11030199