
Evaluating Short-Term and Long-Term Risks Associated with Renal Artery Stenosis Position and Severity: A Hemodynamic Study
 ,
,
Abstract
:
1. Introduction
2. Materials and Methods
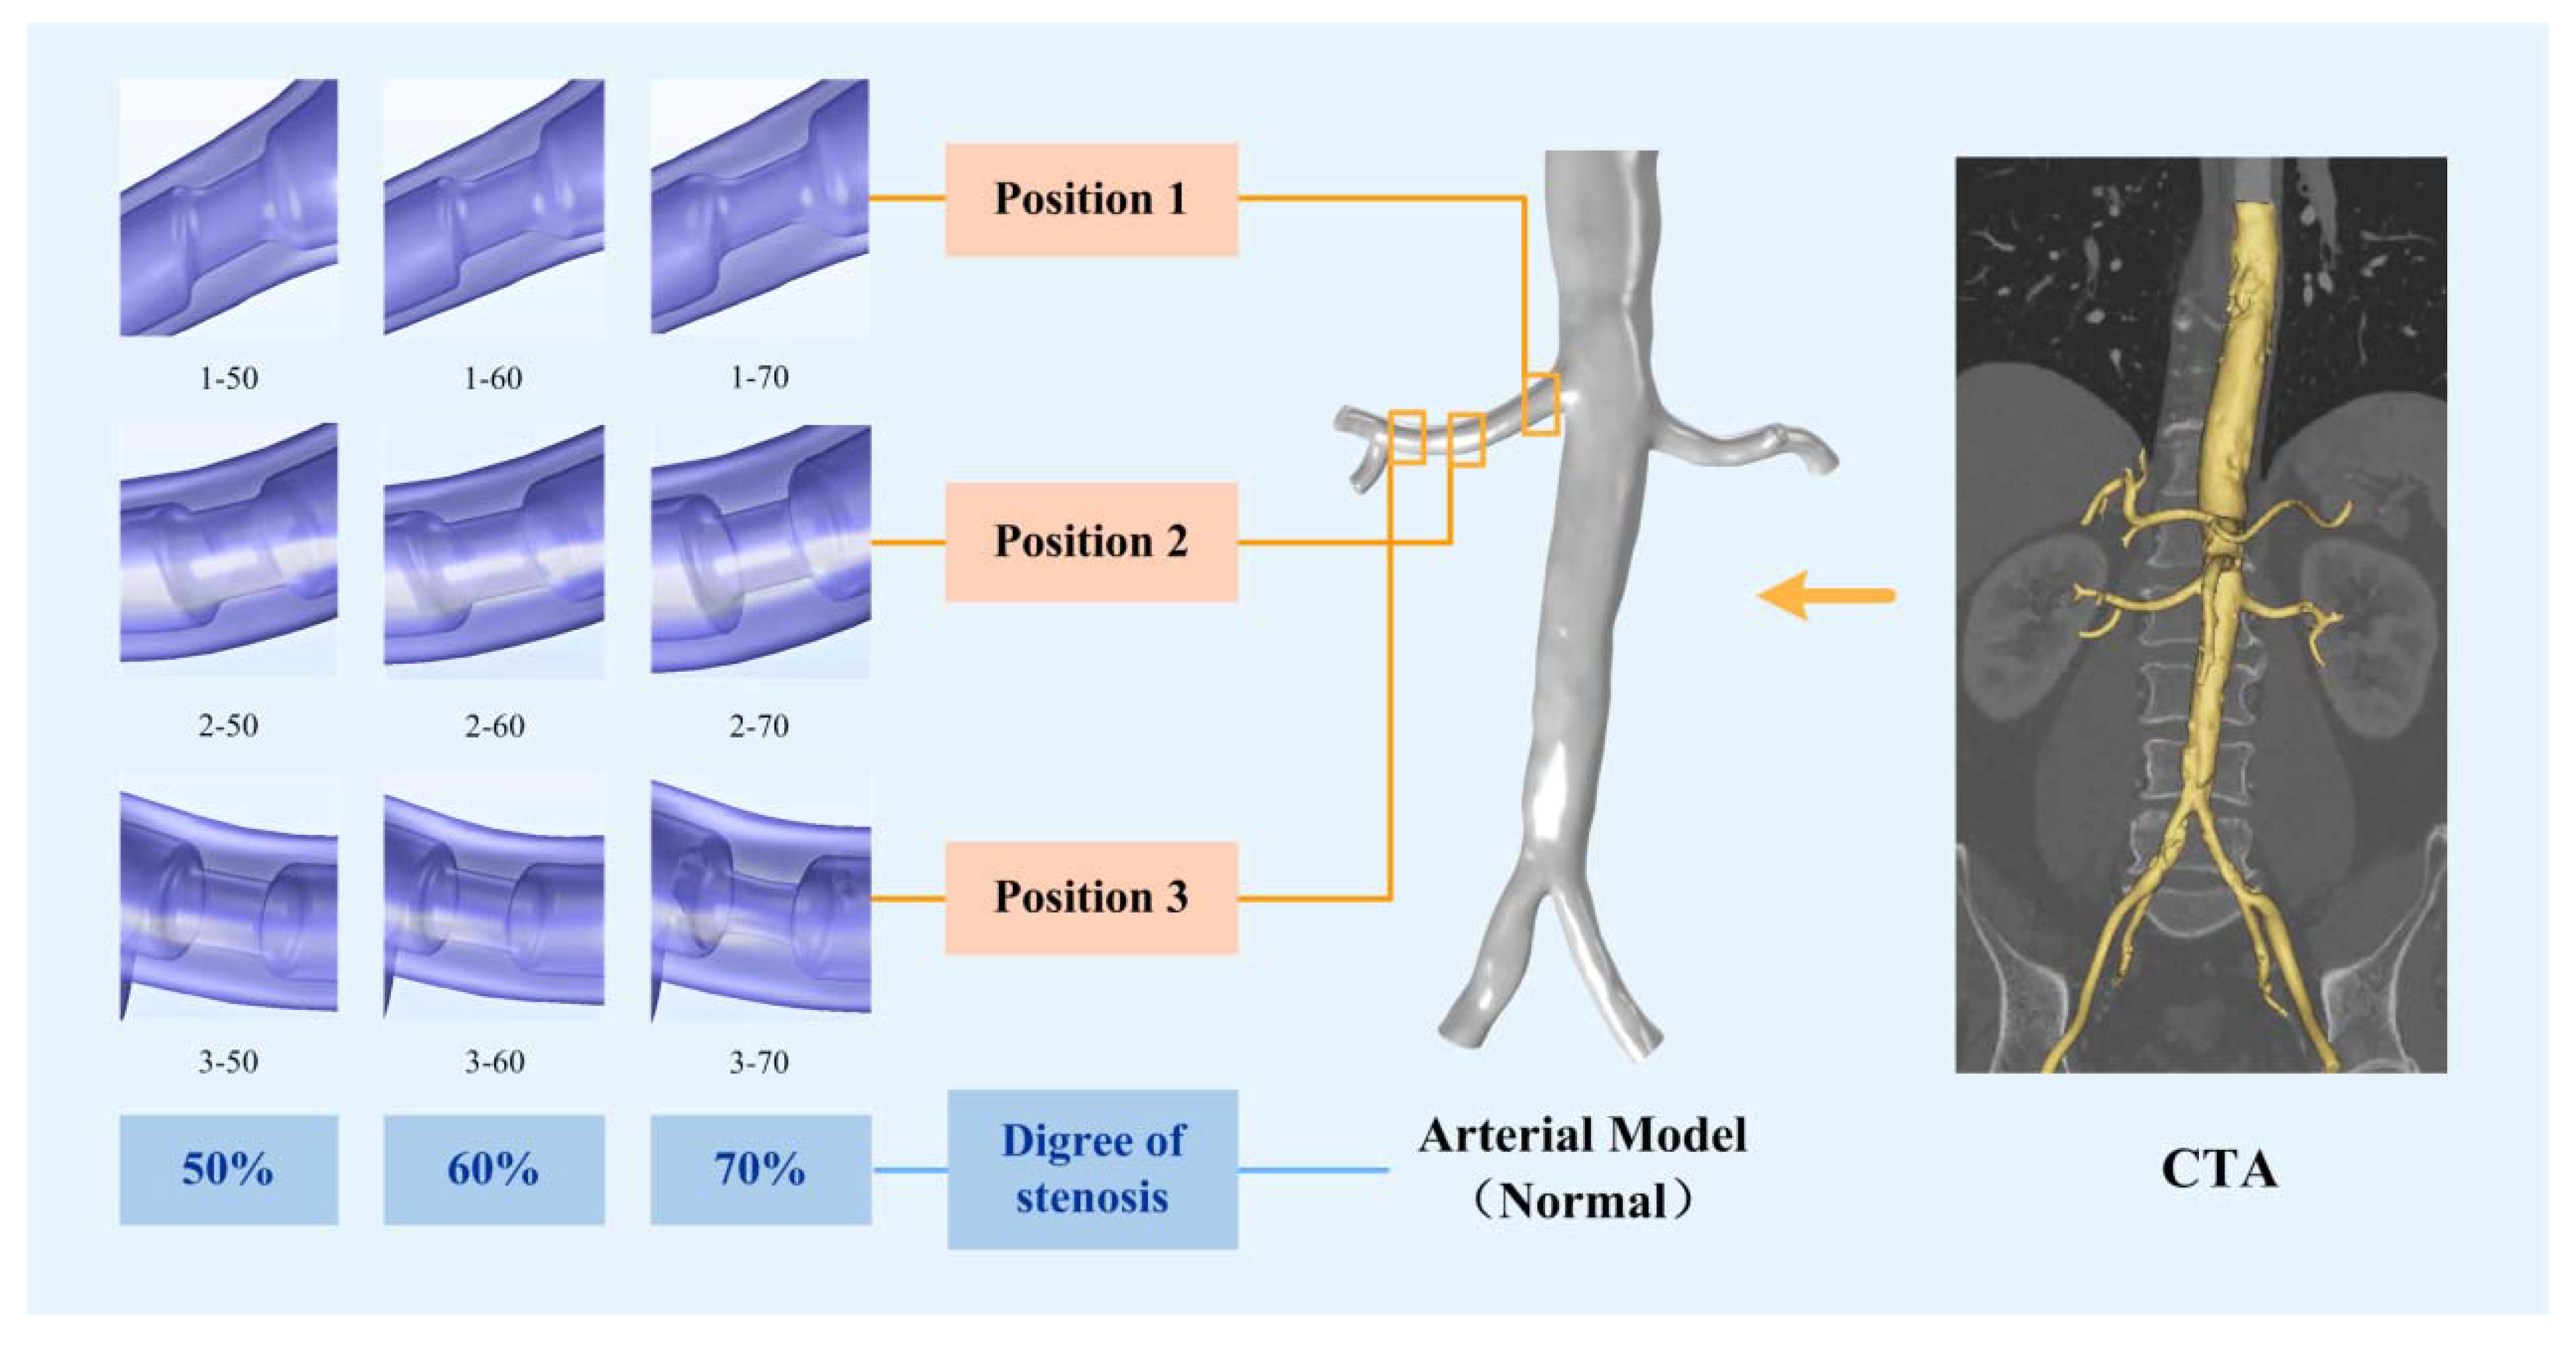
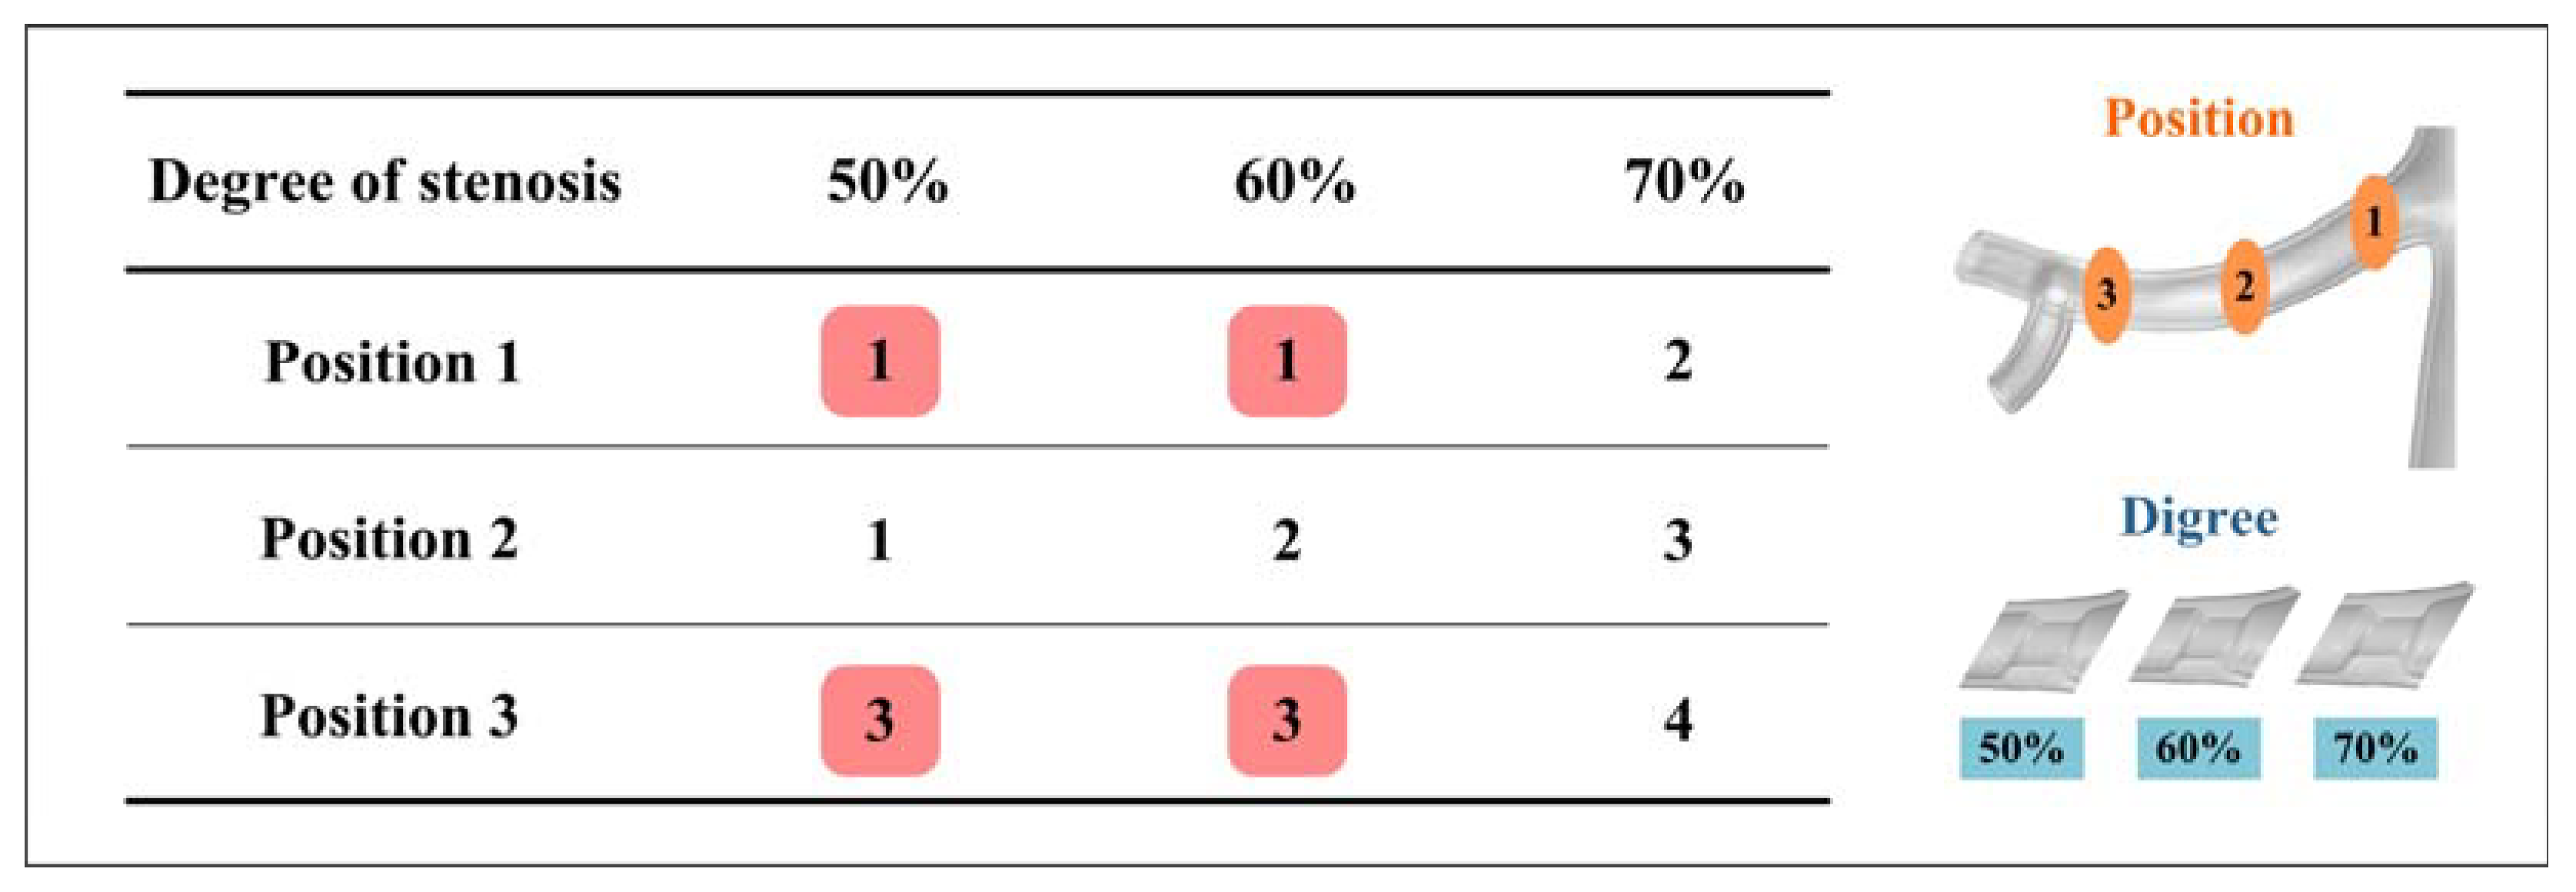
2.1. Geometry Modeling
2.2. Governing Equations
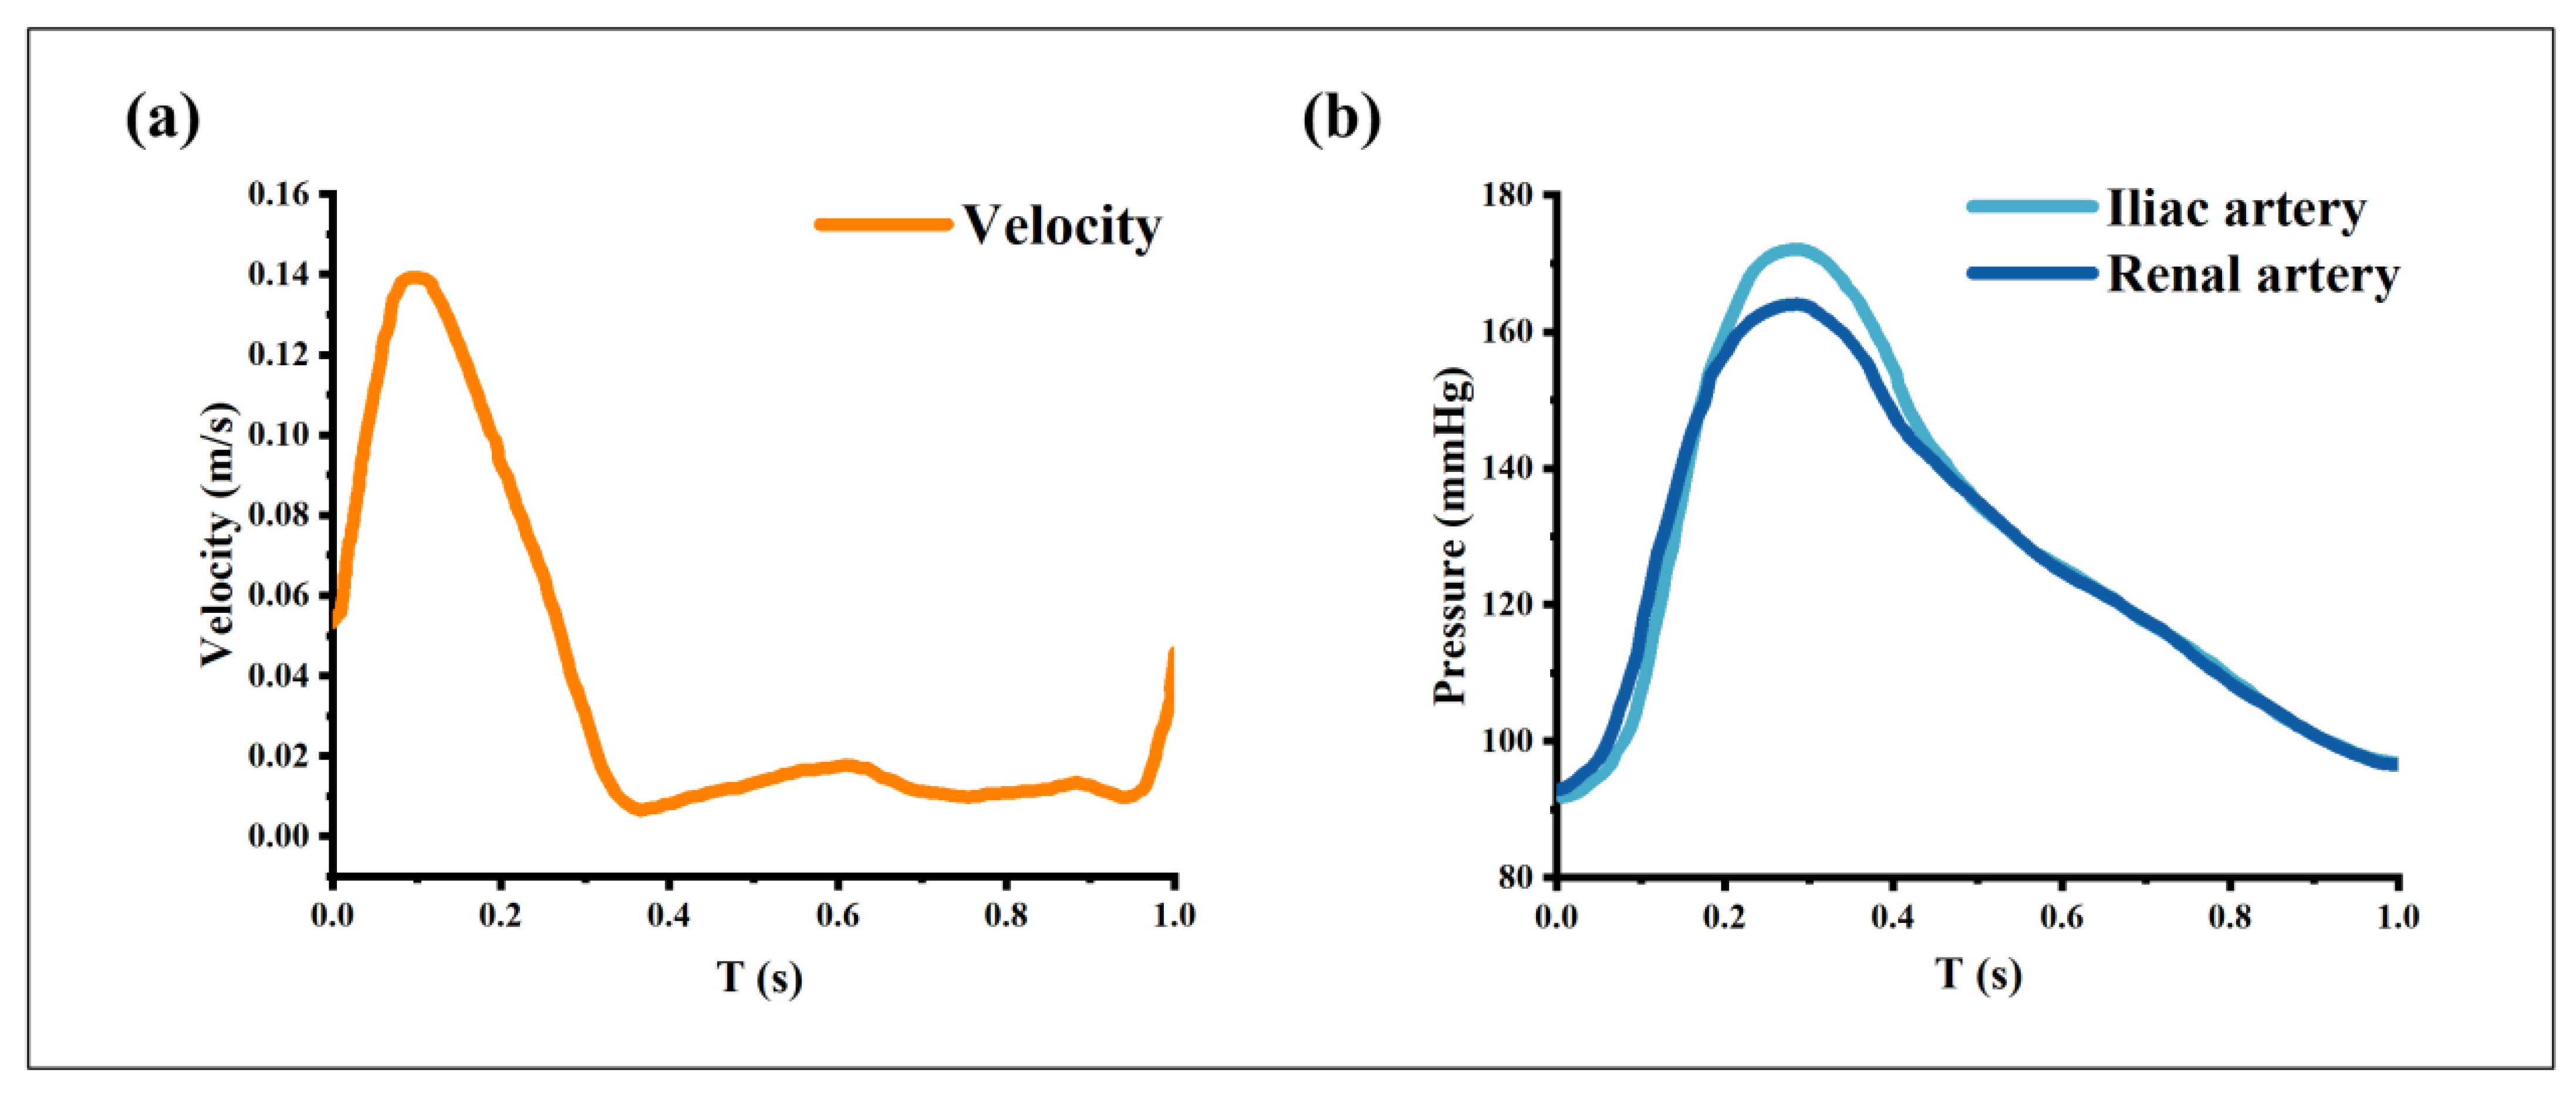
2.3. Boundary Condition and Calculation Methods
2.4. Related Indicators
3. Results
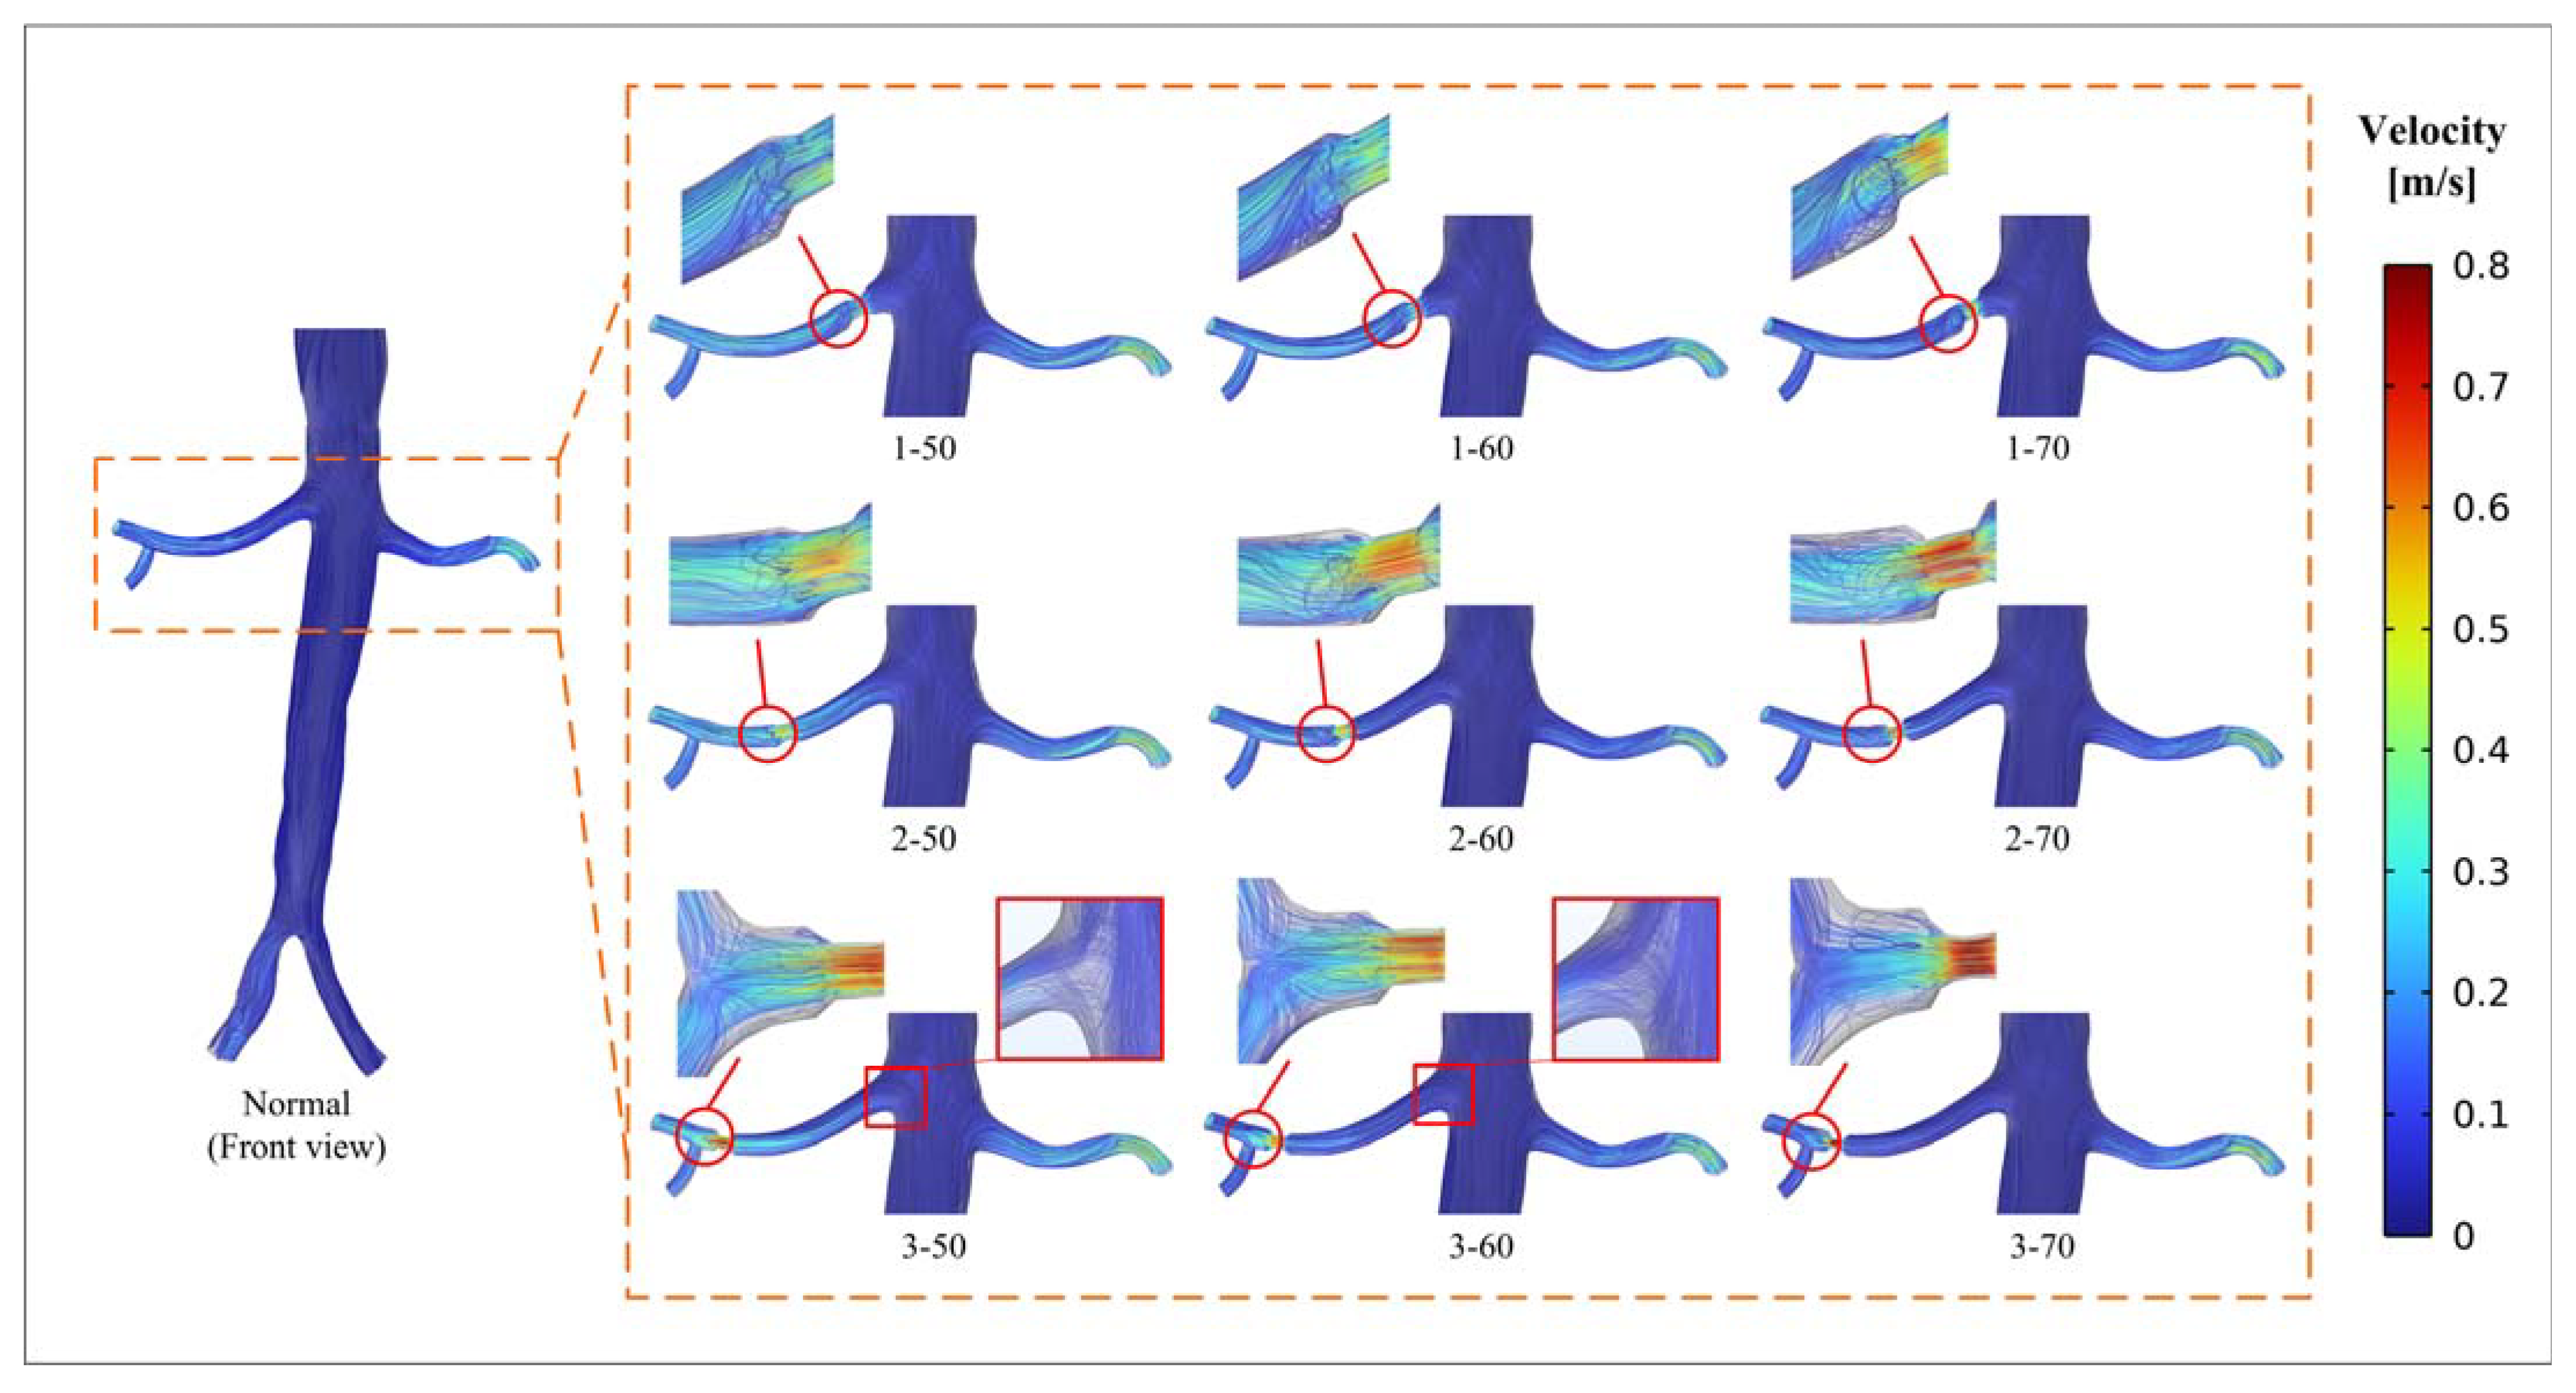
3.1. Flow Pattern
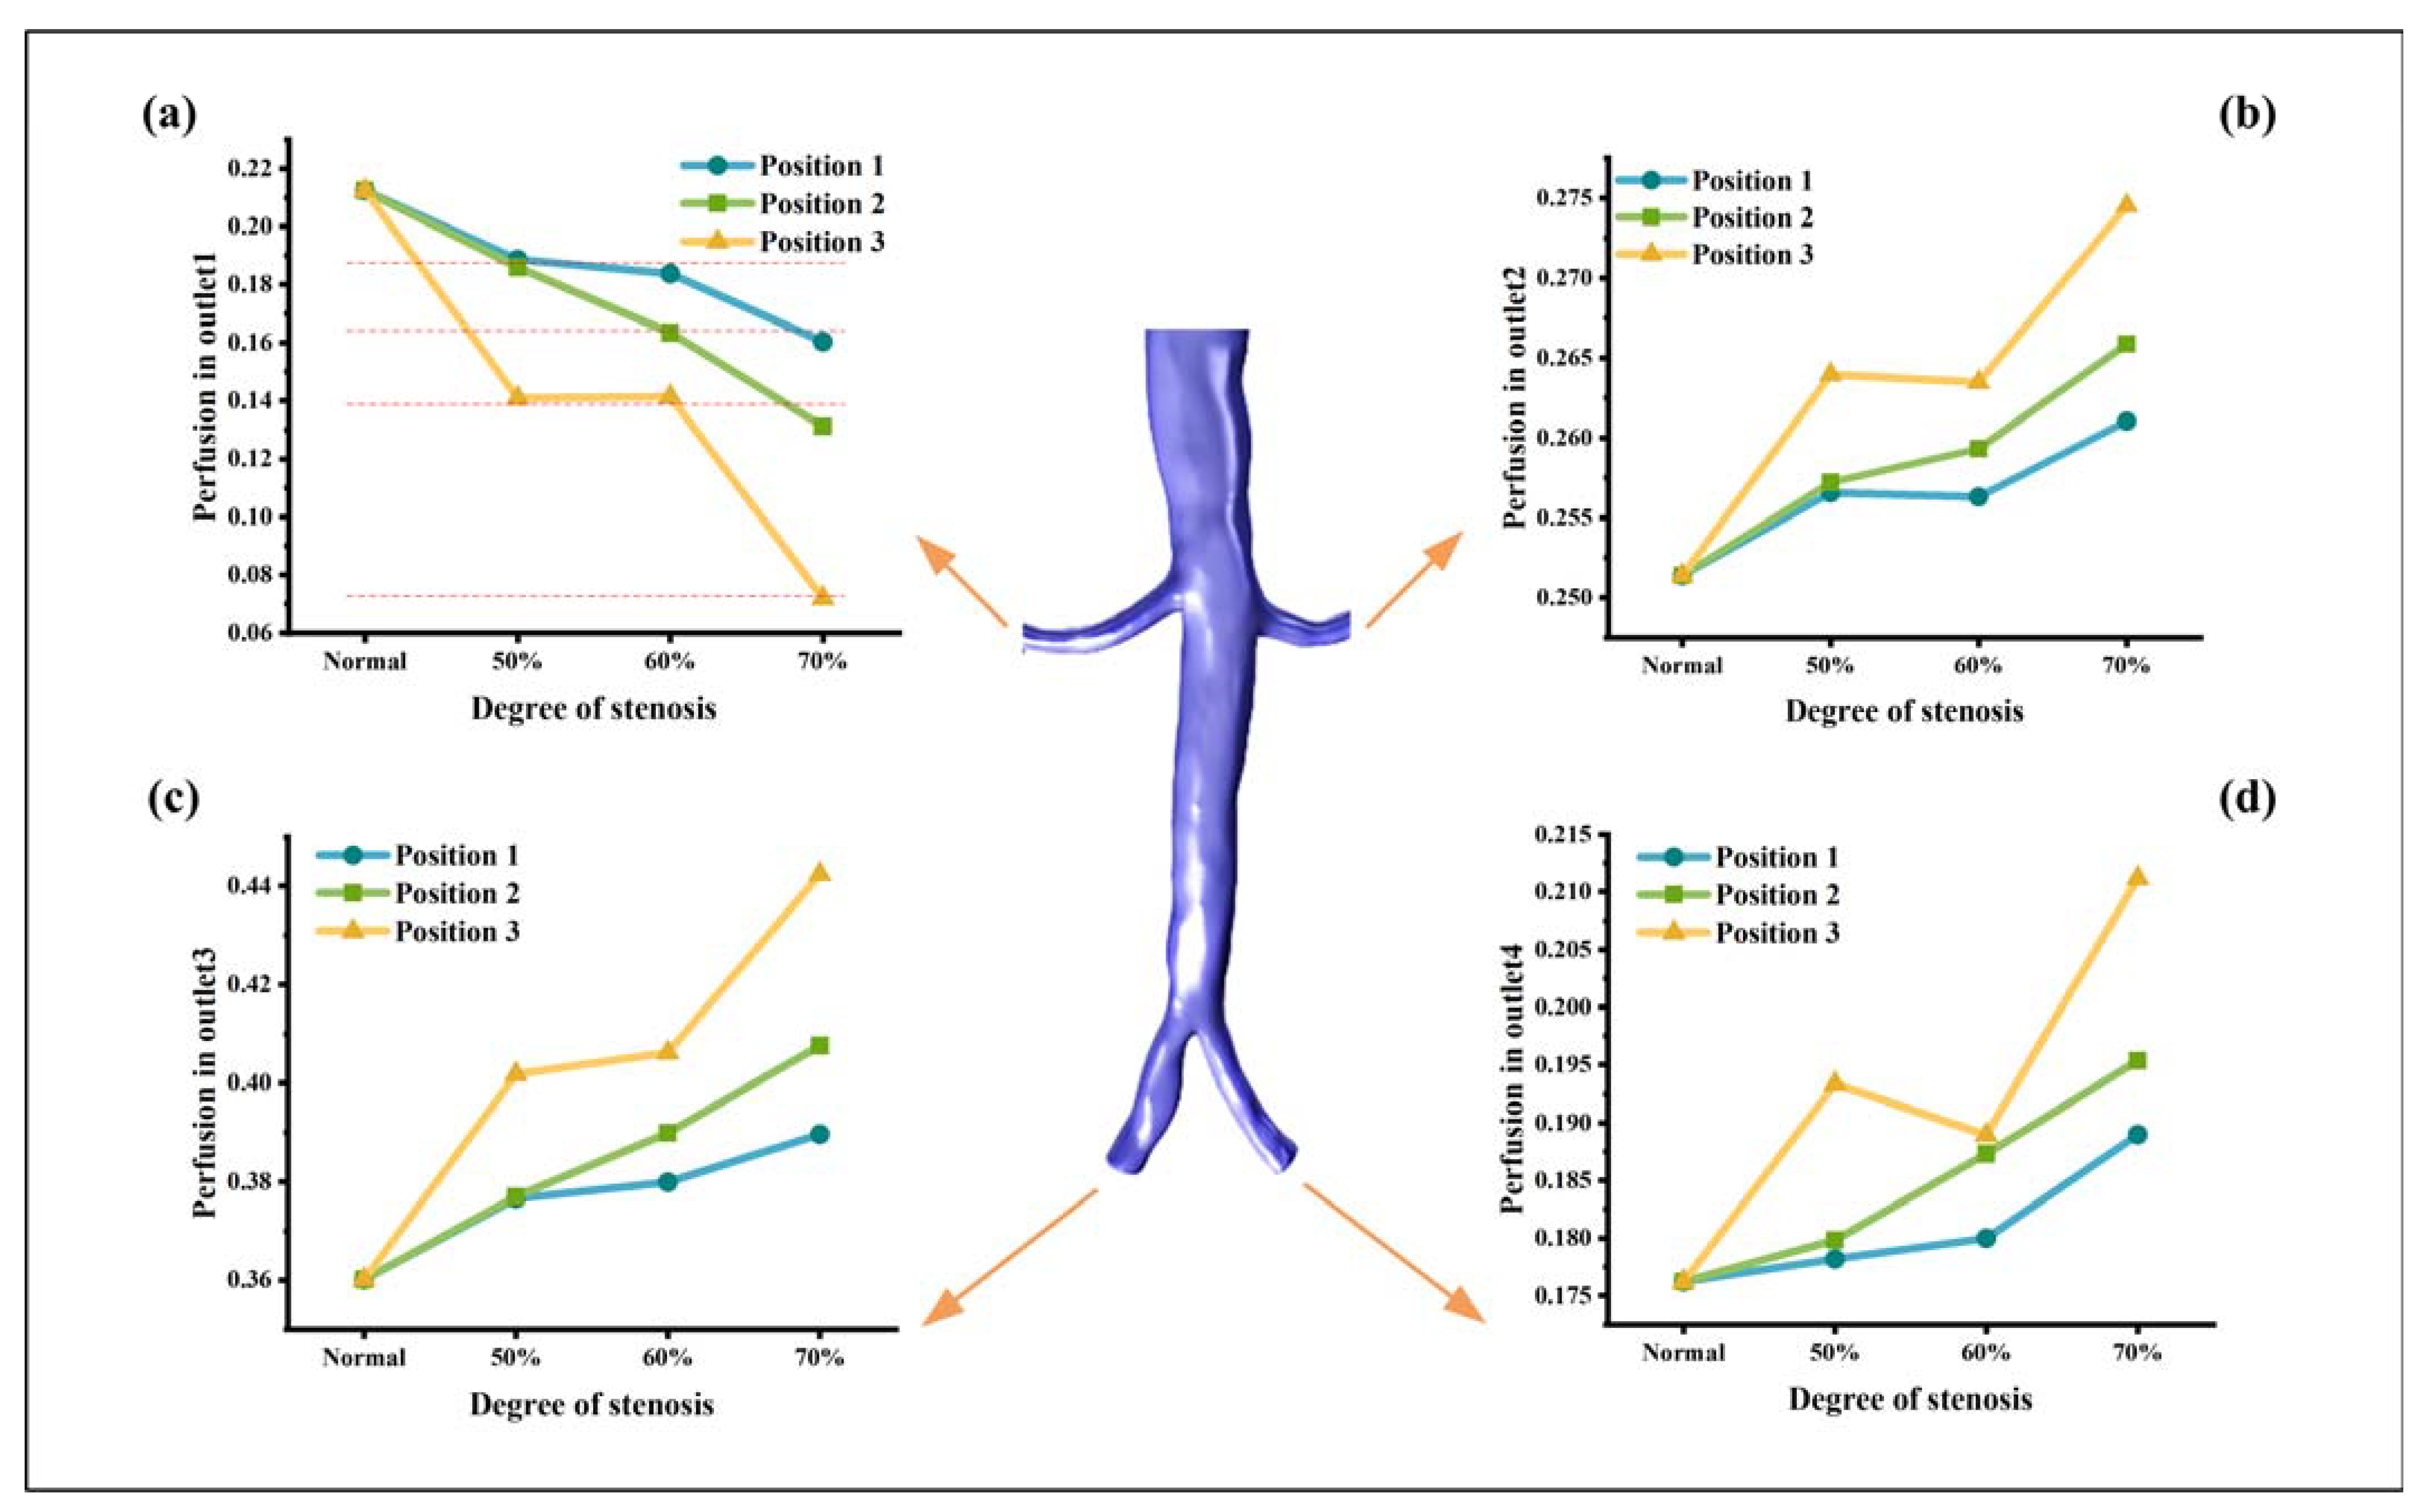
3.2. Renal Perfusion
3.3. WSS-Related Parameters
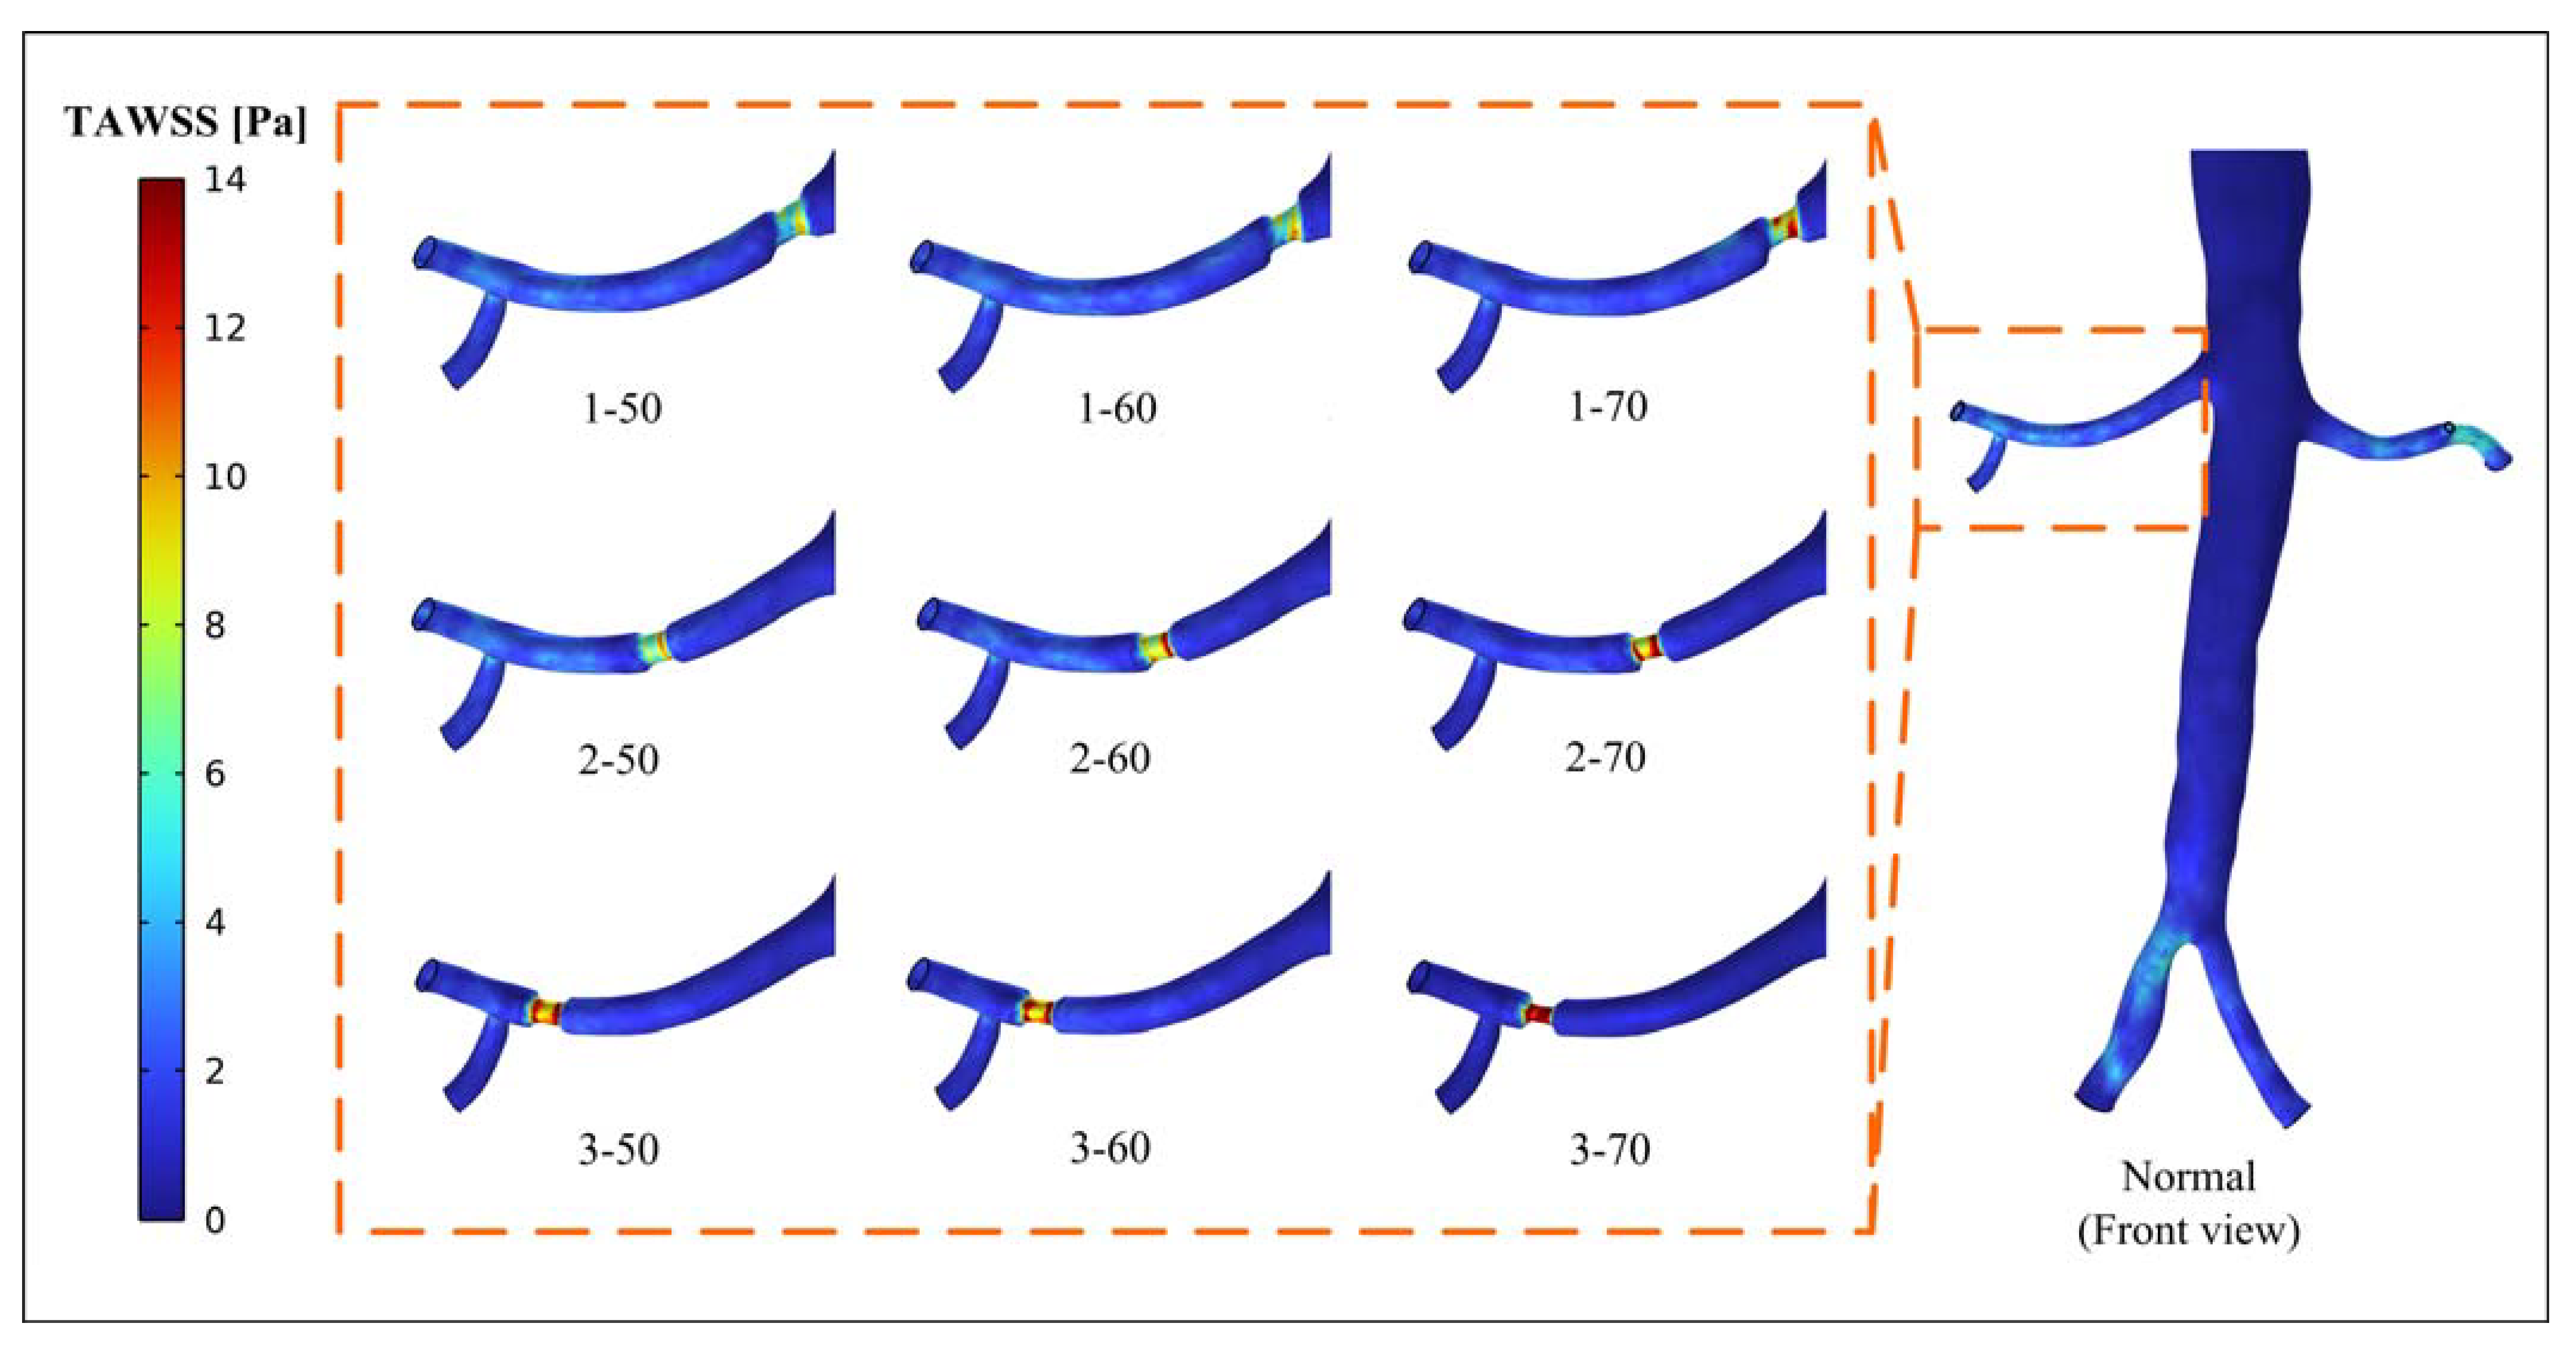
3.3.1. TAWSS
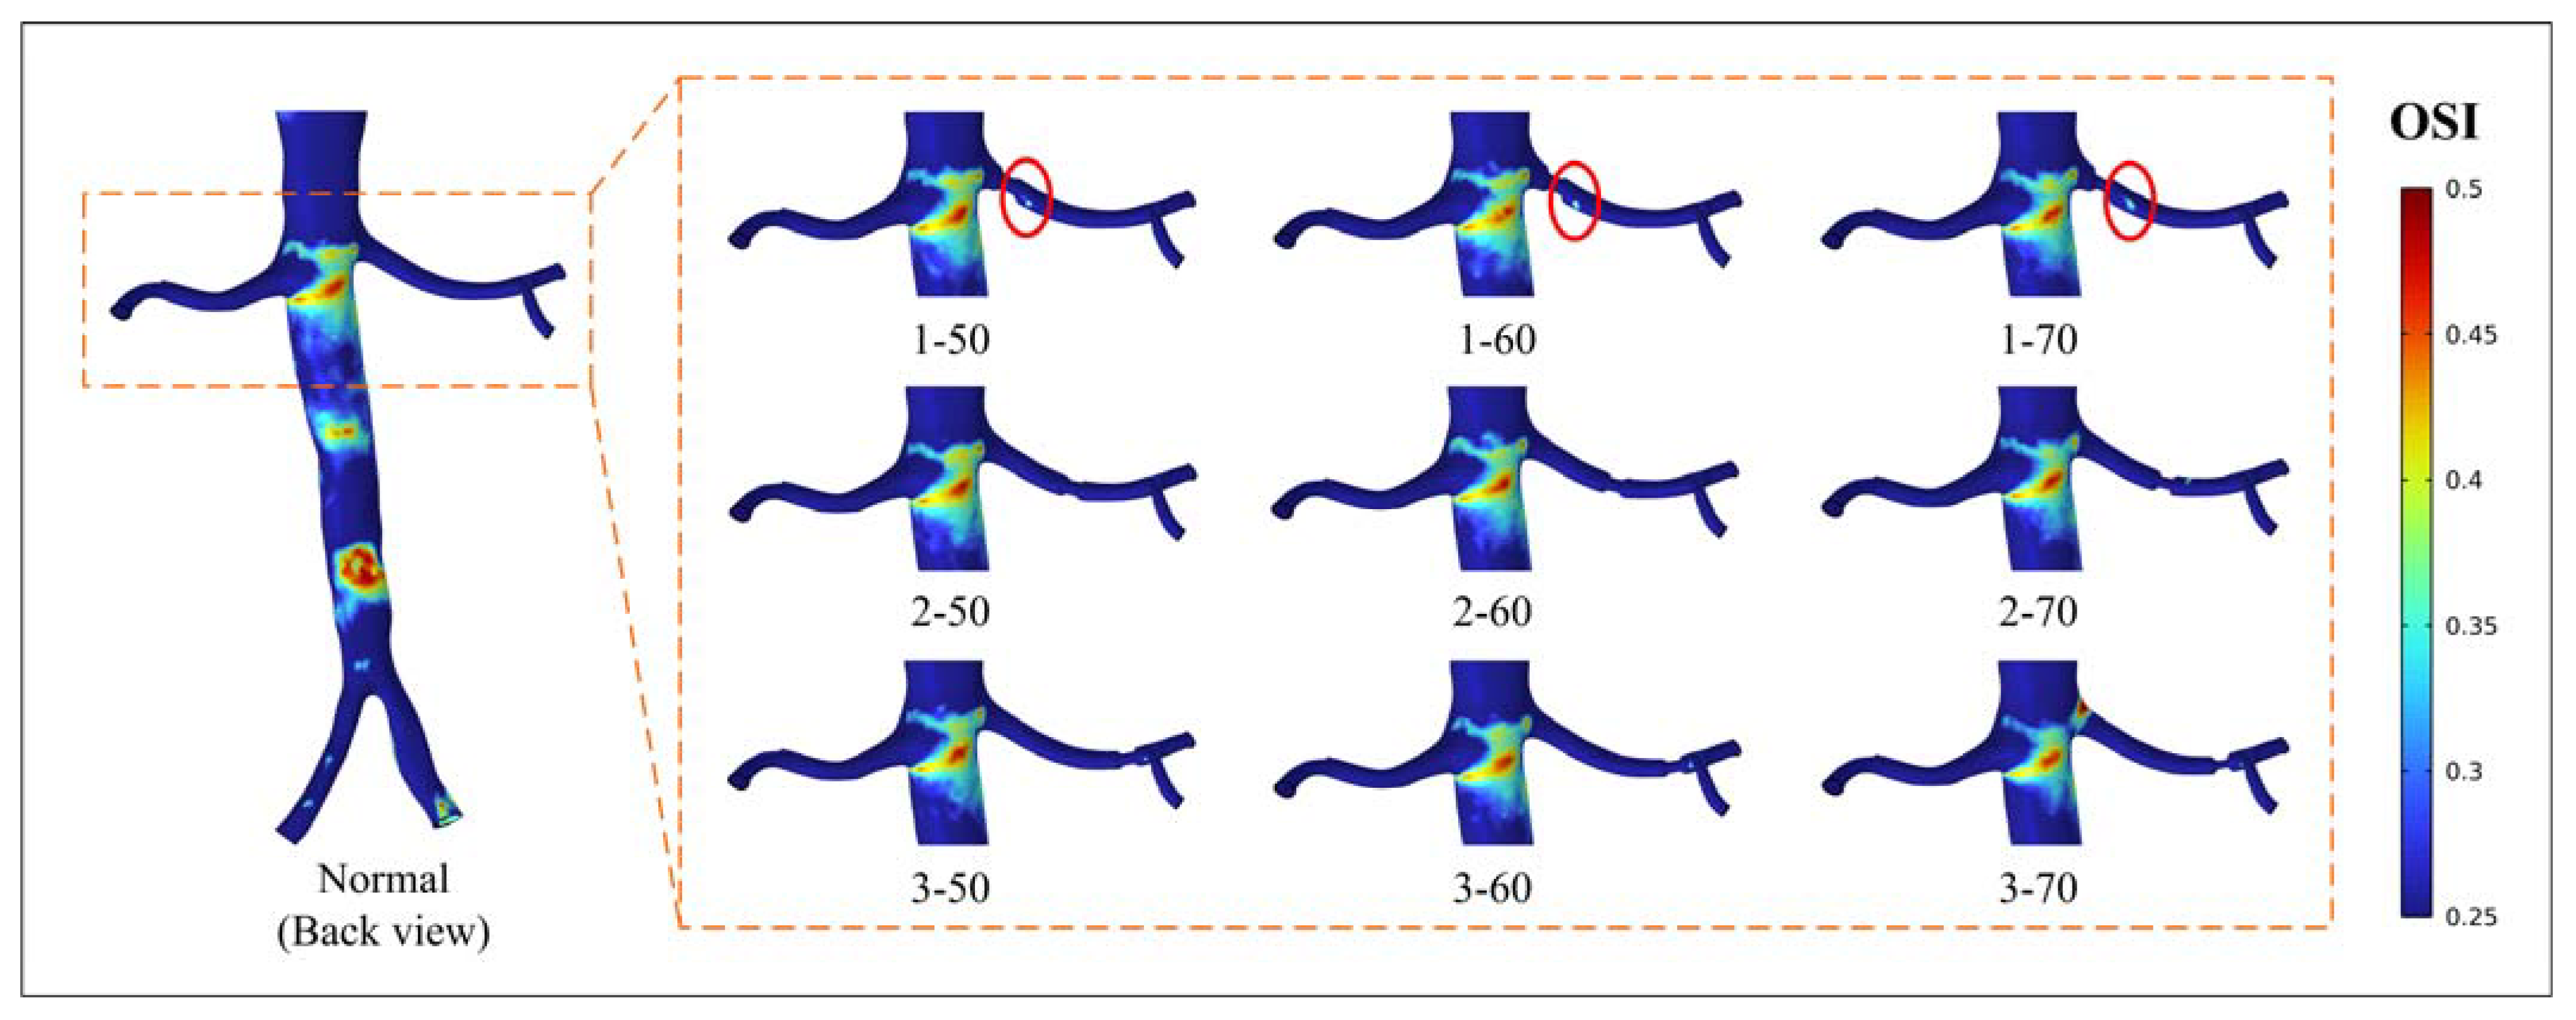
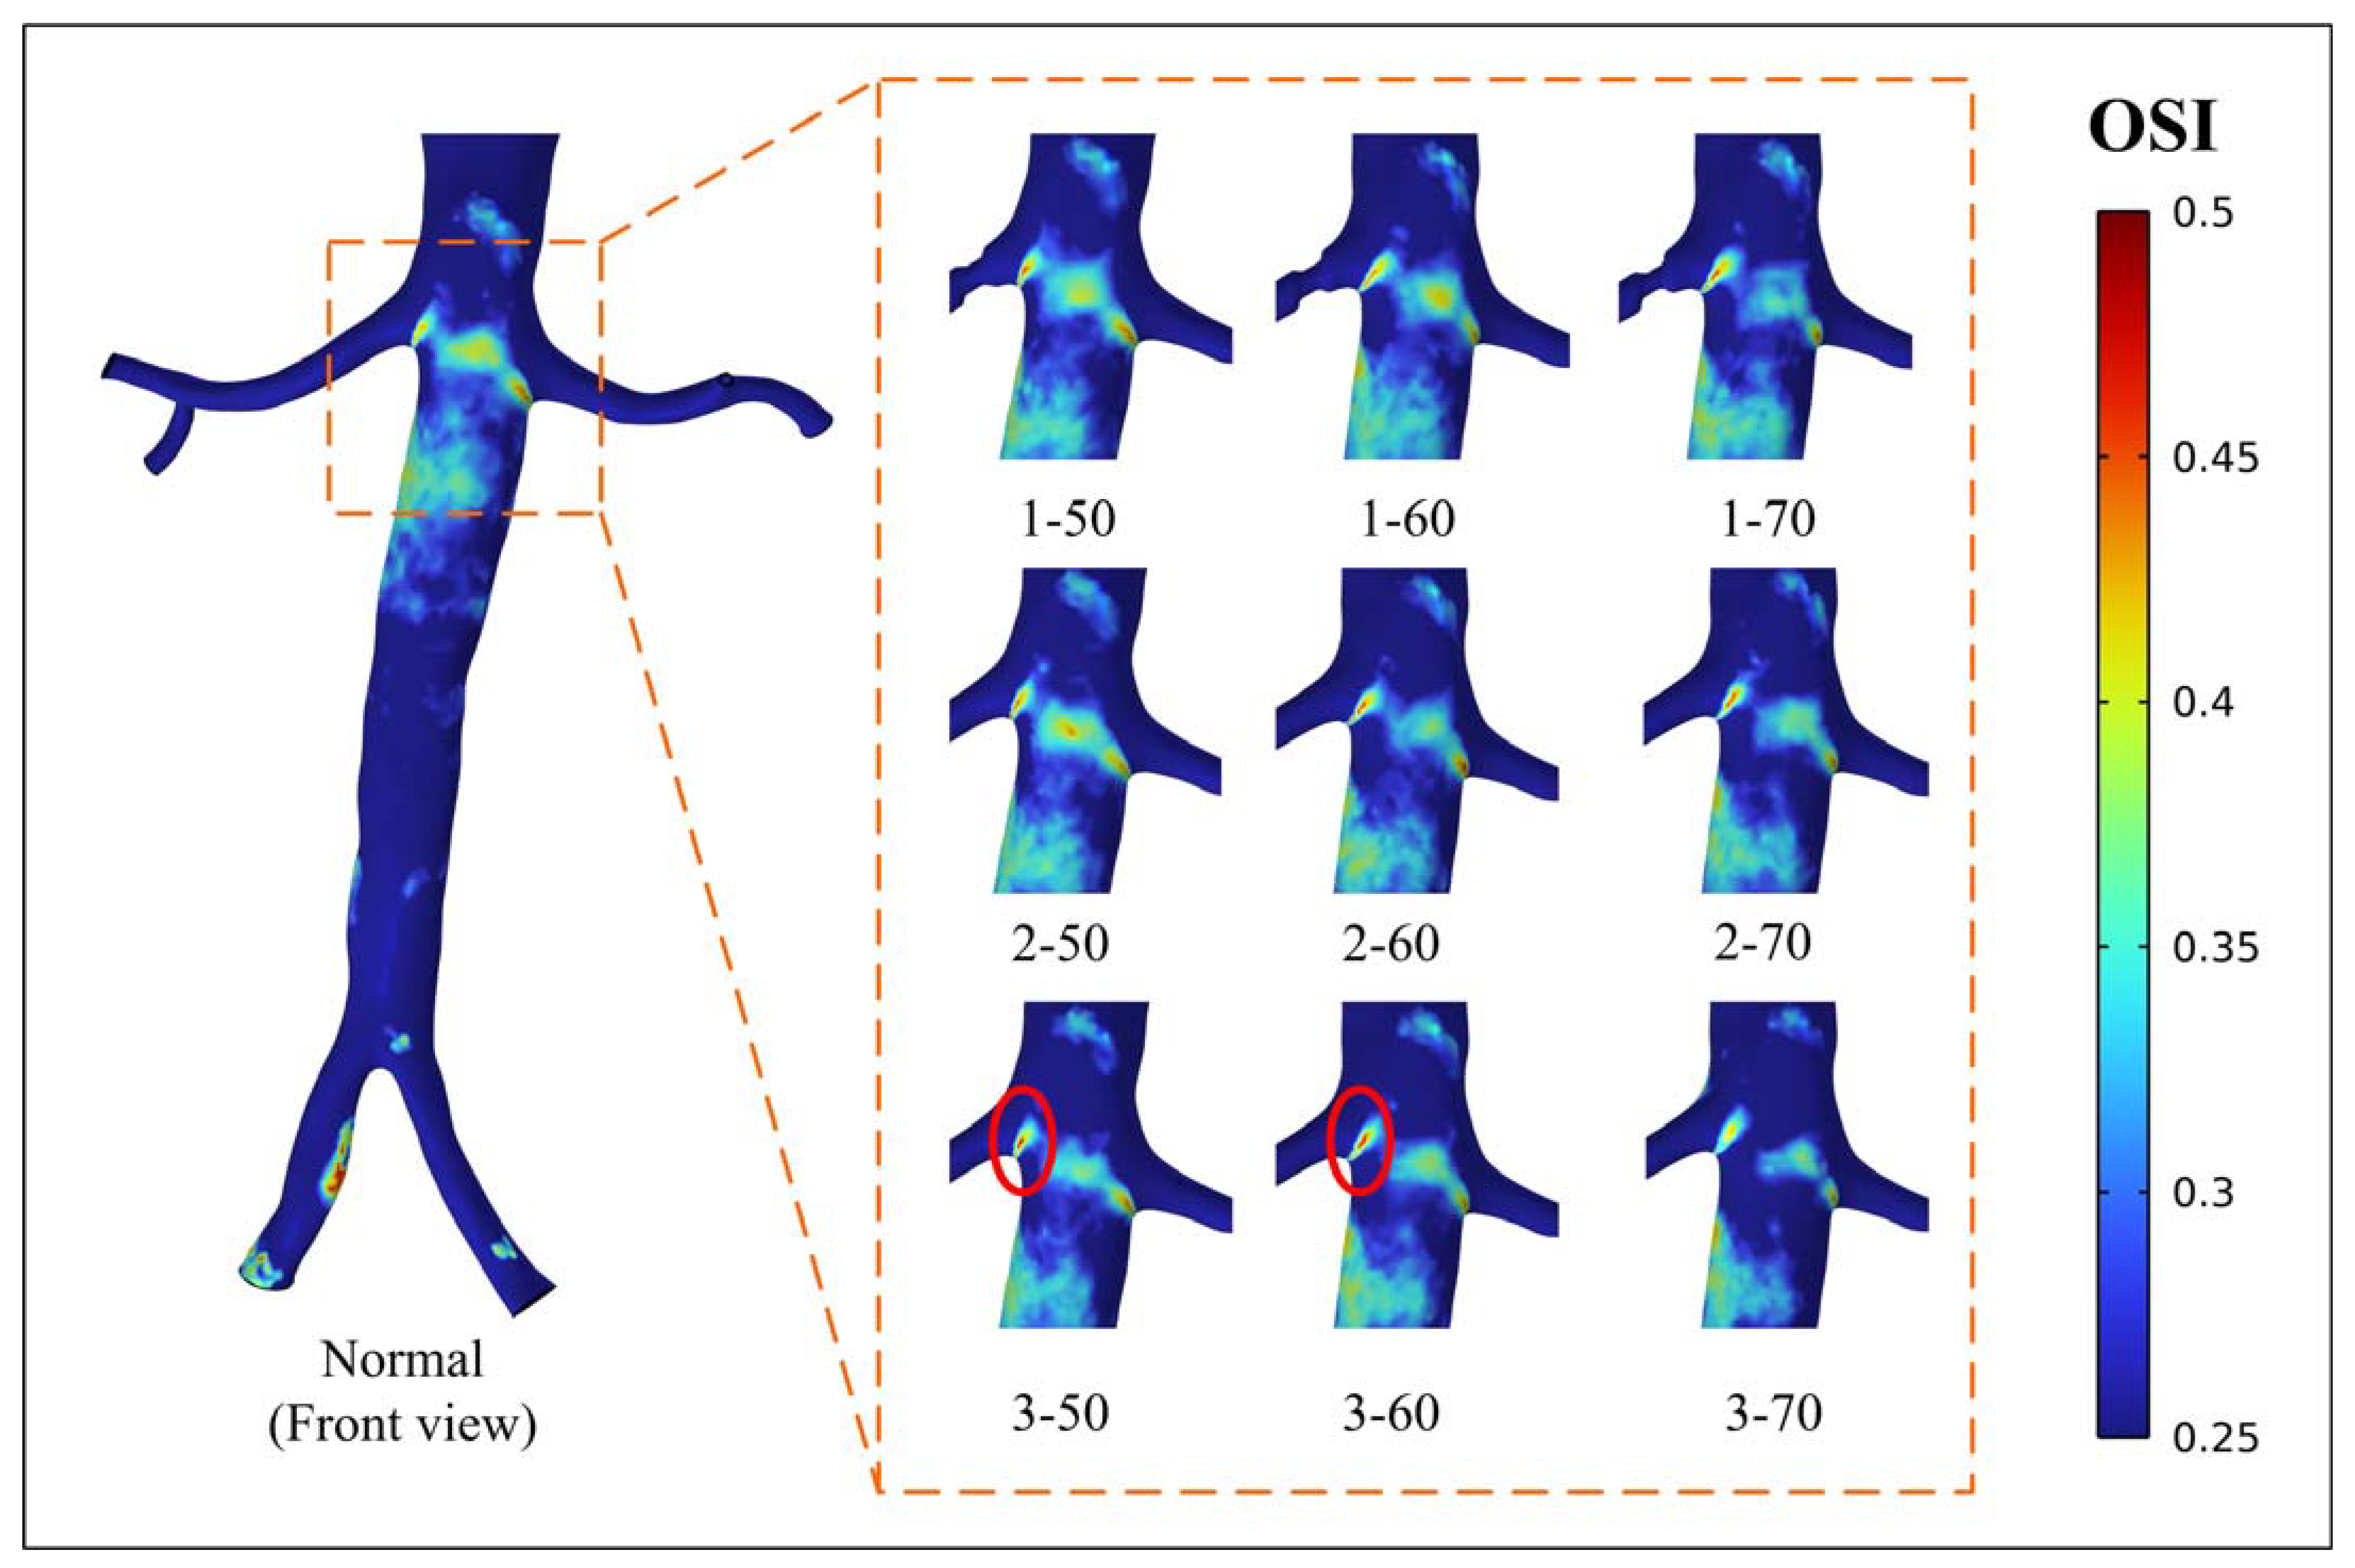
3.3.2. OSI
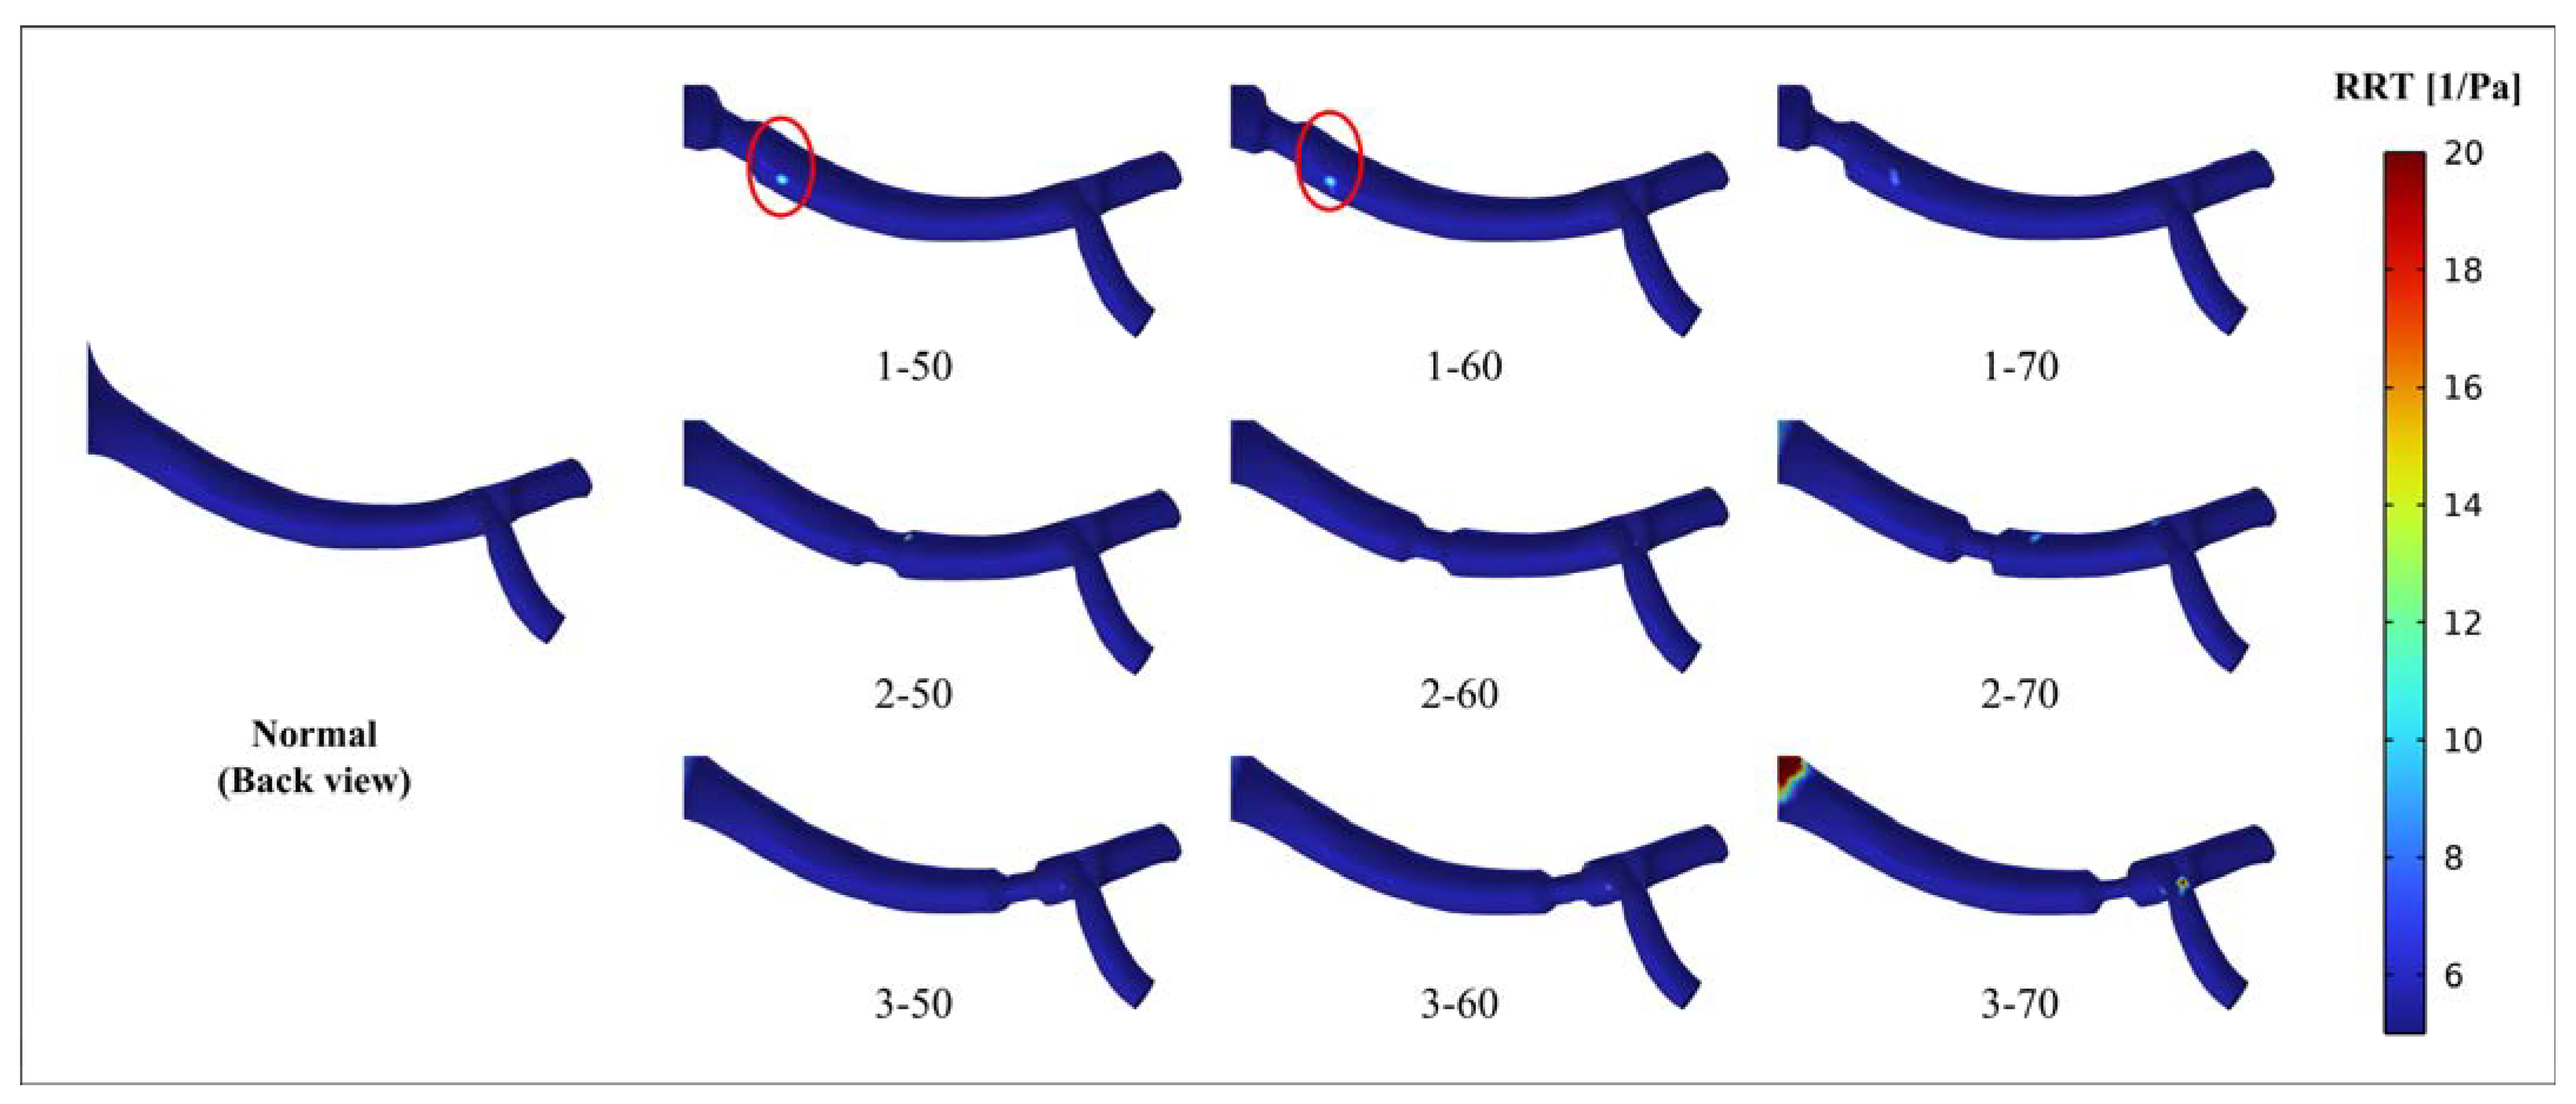
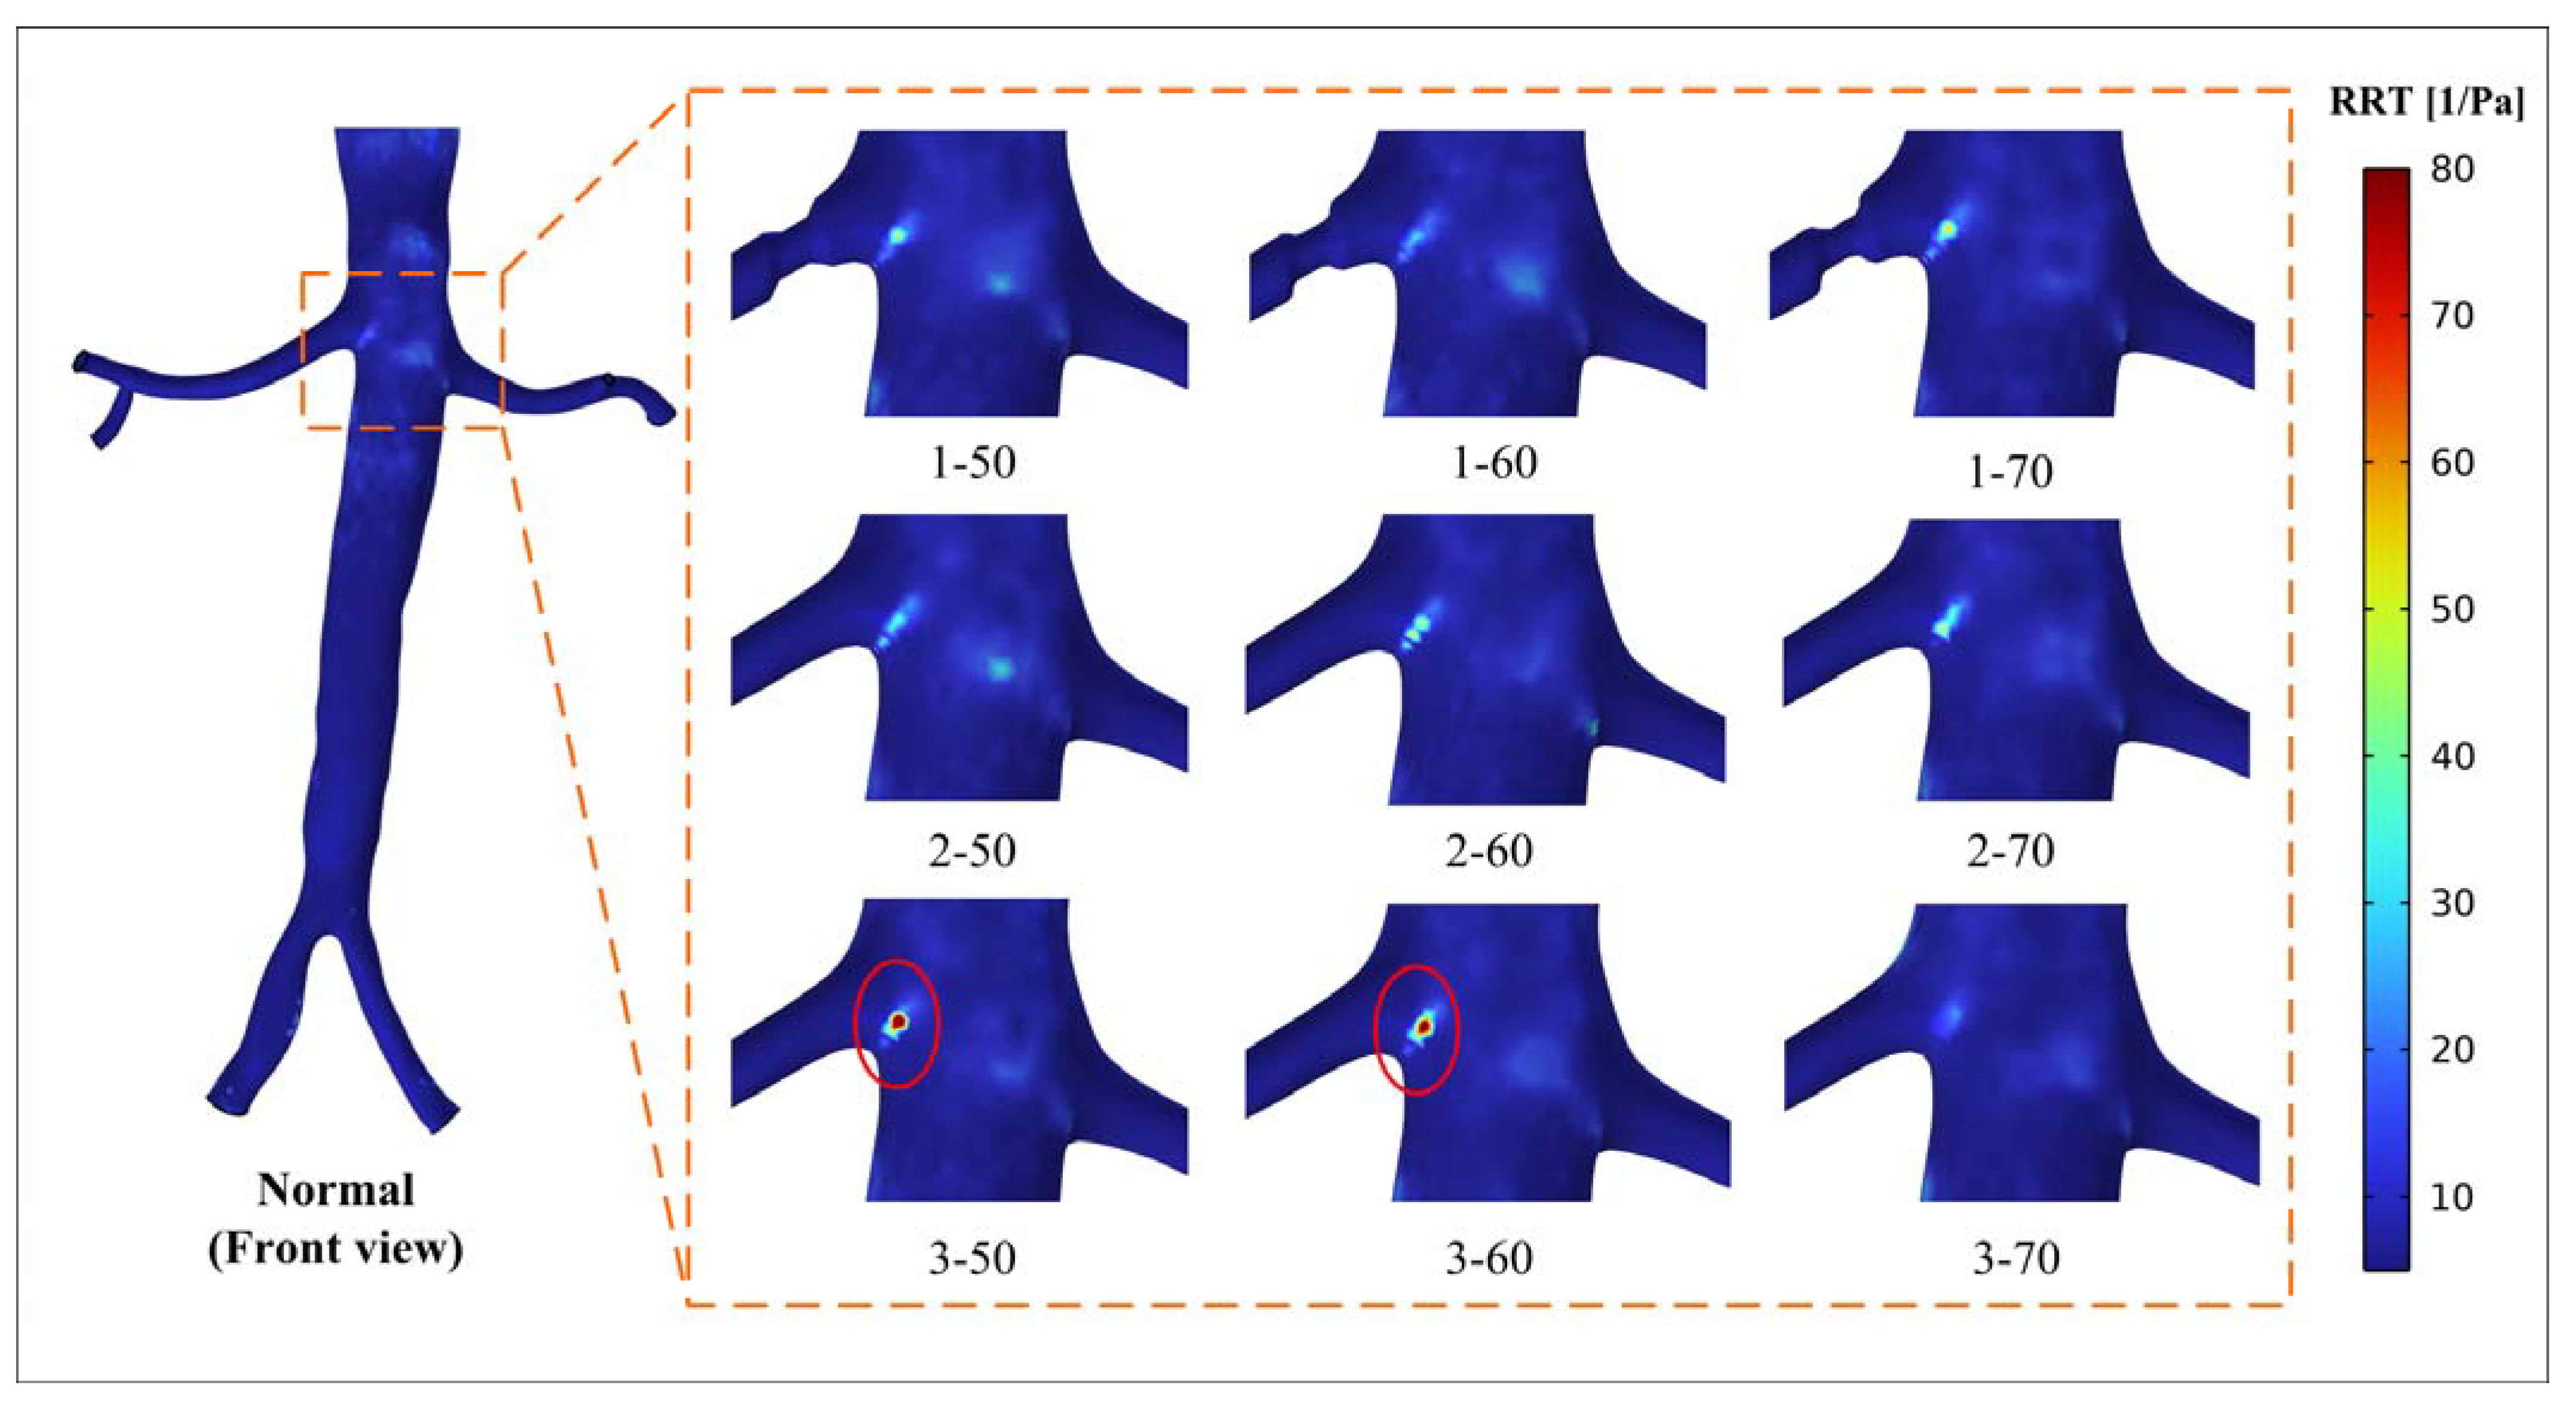
3.3.3. RRT
4. Discussion
5. Conclusions
Author Contributions
Funding
Institutional Review Board Statement
Informed Consent Statement
Data Availability Statement
Conflicts of Interest
References
- Malone, A.; Chari, D.; Cournane, S.; Naydenova, I.; Fagan, A.; Browne, J. Investigation of the Assessment of Low Degree (<50%) Renal Artery Stenosis Based on Velocity Flow Profile Analysis Using Doppler Ultrasound: An in-Vitro Study. Phys. Medica-Eur. J. Med. Phys. 2019, 65, 209–218. [Google Scholar] [CrossRef]
- Lao, D.; Parasher, P.S.; Cho, K.C.; Yeghiazarians, Y. Atherosclerotic Renal Artery Stenosis-Diagnosis and Treatment. Mayo Clin. Proc. 2011, 86, 649–657. [Google Scholar] [CrossRef] [PubMed]
- Dubel, G.J.; Murphy, T.P. The Role of Percutaneous Revascularization for Renal Artery Stenosis. Vasc. Med. 2008, 13, 141–156. [Google Scholar] [CrossRef] [PubMed]
- Hansen, K.J.; Edwards, M.S.; Craven, T.E.; Cherr, G.S.; Jackson, S.A.; Appel, R.G.; Burke, G.L.; Dean, R.H. Prevalence of Renovascular Disease in the Elderly: A Population-Based Study. J. Vasc. Surg. 2002, 36, 443–450. [Google Scholar] [CrossRef] [PubMed]
- Derkx, F.H.; Schalekamp, M.A. Renal Artery Stenosis and Hypertension. Lancet Lond. Engl. 1994, 344, 237–239. [Google Scholar] [CrossRef]
- Harding, M.B.; Smith, L.R.; Himmelstein, S.I.; Harrison, K.; Phillips, H.R.; Schwab, S.J.; Hermiller, J.B.; Davidson, C.J.; Bashore, T.M. Renal Artery Stenosis: Prevalence and Associated Risk Factors in Patients Undergoing Routine Cardiac Catheterization. J. Am. Soc. Nephrol. JASN 1992, 2, 1608–1616. [Google Scholar] [CrossRef]
- Miralles, M.; Corominas, A.; Cotillas, J.; Castro, F.; Clara, A.; Vidal-Barraquer, F. Screening for Carotid and Renal Artery Stenoses in Patients with Aortoiliac Disease. Ann. Vasc. Surg. 1998, 12, 17–22. [Google Scholar] [CrossRef]
- Swartbol, P.; Parsson, H.; Thorvinger, B.; Norgren, L. To What Extent Does Peripheral Vascular Disease and Hypertension Predict Renal Artery Stenosis? Int. Angiol. J. Int. Union Angiol. 1994, 13, 109–114. [Google Scholar]
- Xiong, Z.; Wang, Y.; Mou, Z.; Li, Y.; Liu, Z.; Wen, J.; Yuan, D.; Zheng, T. Longitudinal Computational Fluid Dynamics Study of Stenosis and Aneurysmal Degeneration of an Aortorenal Bypass. Biomech. Model. Mechanobiol. 2020, 19, 1965–1975. [Google Scholar] [CrossRef]
- Shukla, V.V. Secondary hypertension manifests renal artery stenosis and weakened kidney. J. Mech. Med. Biol. 2011, 11, 73–100. [Google Scholar] [CrossRef]
- Lee, Y.; Shin, J.-H.; Park, H.-C.; Kim, S.G.; Choi, S. A Prediction Model for Renal Artery Stenosis Using Carotid Ultrasonography Measurements in Patients Undergoing Coronary Angiography. BMC Nephrol. 2014, 15, 60. [Google Scholar] [CrossRef]
- Reynolds, H.R.; Tunick, P.A.; Benenstein, R.J.; Nakra, N.C.; Shah, A.; Spevack, D.M.; Kronzon, I. Frequency of Severe Renal Artery Stenosis in Patients with Severe Thoracic Aortic Plaque. Am. J. Cardiol. 2004, 94, 844–846. [Google Scholar] [CrossRef] [PubMed]
- Jiang, Y.; Zhang, M.-H. Atherosclerotic Renal Artery Stenosis: How Should We Do? Chin. Med. J. 2021, 134, 1402–1404. [Google Scholar] [CrossRef]
- Eardley, K.S.; Lipkin, G.W. Atherosclerotic Renal Artery Stenosis: Is It Worth Diagnosing? J. Hum. Hypertens. 1999, 13, 217–220. [Google Scholar] [CrossRef] [PubMed]
- Parikh, S.A.; Shishehbor, M.H.; Gray, B.H.; White, C.J.; Jaff, M.R. SCAI Expert Consensus Statement for Renal Artery Stenting Appropriate Use: Consensus Statement for Renal Arterial Intervention. Catheter. Cardiovasc. Interv. 2014, 84, 1163–1171. [Google Scholar] [CrossRef]
- Xiong, Z.; Yuan, D.; Wang, J.; Zheng, T.; Fan, Y. Influence of Renal Artery Stenosis Morphology on Hemodynamics. Comput. Methods Biomech. Biomed. Engin. 2021, 24, 1294–1301. [Google Scholar] [CrossRef] [PubMed]
- Klein, A.J.; Jaff, M.R.; Gray, B.H.; Aronow, H.D.; Bersin, R.M.; Diaz-Sandoval, L.J.; Dieter, R.S.; Drachman, D.E.; Feldman, D.N.; Gigliotti, O.S.; et al. SCAI Appropriate Use Criteria for Peripheral Arterial Interventions: An Update. Catheter. Cardiovasc. Interv. 2017, 90, E90–E110. [Google Scholar] [CrossRef]
- Malek, A.M.; Alper, S.L.; Izumo, S. Hemodynamic Shear Stress and Its Role in Atherosclerosis. JAMA 1999, 282, 2035–2042. [Google Scholar] [CrossRef]
- Xue, Y.; Liu, X.; Sun, A.; Zhang, P.; Fan, Y.; Deng, X. Hemodynamic Performance of a New Punched Stent Strut: A Numerical Study. Artif. Organs 2016, 40, 669–677. [Google Scholar] [CrossRef]
- Reininger, A.J.; Heijnen, H.F.G.; Schumann, H.; Specht, H.M.; Schramm, W.; Ruggeri, Z.M. Mechanism of Platelet Adhesion to von Willebrand Factor and Microparticle Formation under High Shear Stress. Blood 2006, 107, 3537–3545. [Google Scholar] [CrossRef]
- Duraiswamy, N.; Cesar, J.M.; Schoephoerster, R.T.; Moore, J.E. Effects of Stent Geometry on Local Flow Dynamics and Resulting Platelet Deposition in an in Vitro Model. Biorheology 2008, 45, 547–561. [Google Scholar] [CrossRef]
- Qiu, Y.; Wang, Y.; Fan, Y.; Peng, L.; Liu, R.; Zhao, J.; Yuan, D.; Zheng, T. Role of Intraluminal Thrombus in Abdominal Aortic Aneurysm Ruptures: A Hemodynamic Point of View. Med. Phys. 2019, 46, 4263–4275. [Google Scholar] [CrossRef] [PubMed]
- Zhang, X.; Chen, D.; Wu, M.; Dong, H.; Wan, Z.; Jia, H.; Liang, S.; Shao, J.; Zheng, J.; Xu, S.; et al. Functional Evaluation of Embedded Modular Single-Branched Stent Graft: Application to Type B Aortic Dissection with Aberrant Right Subclavian Artery. Front. Cardiovasc. Med. 2022, 9, 869505. [Google Scholar] [CrossRef]
- Kim, G.-B.; Park, K.-H.; Kim, S.-J. Hemodynamics and Wall Shear Stress of Blood Vessels in Aortic Coarctation with Computational Fluid Dynamics Simulation. Molecules 2022, 27, 1403. [Google Scholar] [CrossRef] [PubMed]
- Andayesh, M.; Shahidian, A.; Ghassemi, M. Numerical Investigation of Renal Artery Hemodynamics Based on the Physiological Response to Renal Artery Stenosis. Biocybern. Biomed. Eng. 2020, 40, 1458–1468. [Google Scholar] [CrossRef]
- Liu, M.; Sun, A.; Deng, X. Numerical and Experimental Investigation of the Hemodynamic Performance of Bifurcated Stent Grafts with Various Torsion Angles. Sci. Rep. 2018, 8, 12625. [Google Scholar] [CrossRef] [PubMed]
- Les, A.S.; Shadden, S.C.; Figueroa, C.A.; Park, J.M.; Tedesco, M.M.; Herfkens, R.J.; Dalman, R.L.; Taylor, C.A. Quantification of Hemodynamics in Abdominal Aortic Aneurysms During Rest and Exercise Using Magnetic Resonance Imaging and Computational Fluid Dynamics. Ann. Biomed. Eng. 2010, 38, 1288–1313. [Google Scholar] [CrossRef]
- Lee, S.-W.; Antiga, L.; Steinman, D.A. Correlations Among Indicators of Disturbed Flow at the Normal Carotid Bifurcation. J. Biomech. Eng.-Trans. ASME 2009, 131, 061013. [Google Scholar] [CrossRef]
- Moayeri, M.S.; Zendehbudi, G.R. Effects of Elastic Property of the Wall on Flow Characteristics through Arterial Stenoses. J. Biomech. 2003, 36, 525–535. [Google Scholar] [CrossRef]
- Georgakarakos, E.; Xenakis, A.; Georgiadis, G.S.; Argyriou, C.; Antoniou, G.A.; Schoretsanitis, N.; Lazarides, M.K. The Hemodynamic Impact of Misalignment of Fenestrated Endografts: A Computational Study. Eur. J. Vasc. Endovasc. Surg. 2014, 47, 151–159. [Google Scholar] [CrossRef]
- Korner, P.I. Cardiovascular Hypertrophy and Hypertension: Causes and Consequences. Blood Press. Suppl. 1995, 2, 6–16. [Google Scholar] [PubMed]
- Hathcock, J.J. Flow Effects on Coagulation and Thrombosis. Arterioscler. Thromb. Vasc. Biol. 2006, 26, 1729–1737. [Google Scholar] [CrossRef] [PubMed]
- Overeem, S.P.; de Vries, J.-P.P.M.; Boersen, J.T.; Slump, C.H.; Reijnen, M.M.P.J.; Versluis, M.; Jebbink, E.G. Haemodynamics in Different Flow Lumen Configurations of Customised Aortic Repair for Infrarenal Aortic Aneurysms. Eur. J. Vasc. Endovasc. Surg. 2019, 57, 709–718. [Google Scholar] [CrossRef] [PubMed]
- Liu, M.; Sun, A.; Deng, X. Hemodynamic Performance within Crossed Stent Grafts: Computational and Experimental Study on the Effect of Cross Position and Angle. Biomed. Eng. 2018, 17, 85. [Google Scholar] [CrossRef]
- Wootton, D.M.; Ku, D.N. Fluid Mechanics of Vascular Systems, Diseases, and Thrombosis. Annu. Rev. Biomed. Eng. 1999, 1, 299–329. [Google Scholar] [CrossRef]


Disclaimer/Publisher’s Note: The statements, opinions and data contained in all publications are solely those of the individual author(s) and contributor(s) and not of MDPI and/or the editor(s). MDPI and/or the editor(s) disclaim responsibility for any injury to people or property resulting from any ideas, methods, instructions or products referred to in the content. |
© 2023 by the authors. Licensee MDPI, Basel, Switzerland. This article is an open access article distributed under the terms and conditions of the Creative Commons Attribution (CC BY) license (https://creativecommons.org/licenses/by/4.0/).
Share and Cite
Zhao, Y.; Shi, Y.; Jin, Y.; Cao, Y.; Song, H.; Chen, L.; Li, F.; Li, X.; Chen, W. Evaluating Short-Term and Long-Term Risks Associated with Renal Artery Stenosis Position and Severity: A Hemodynamic Study. Bioengineering 2023, 10, 1002. https://doi.org/10.3390/bioengineering10091002
Zhao Y, Shi Y, Jin Y, Cao Y, Song H, Chen L, Li F, Li X, Chen W. Evaluating Short-Term and Long-Term Risks Associated with Renal Artery Stenosis Position and Severity: A Hemodynamic Study. Bioengineering. 2023; 10(9):1002. https://doi.org/10.3390/bioengineering10091002
Chicago/Turabian StyleZhao, Yawei, Yike Shi, Yusheng Jin, Yifan Cao, Hui Song, Lingfeng Chen, Fen Li, Xiaona Li, and Weiyi Chen. 2023. "Evaluating Short-Term and Long-Term Risks Associated with Renal Artery Stenosis Position and Severity: A Hemodynamic Study" Bioengineering 10, no. 9: 1002. https://doi.org/10.3390/bioengineering10091002