
Deep Learning Models for Automatic Upper Airway Segmentation and Minimum Cross-Sectional Area Localisation in Two-Dimensional Images

 ,
,  ,
,
Abstract
:1. Introduction
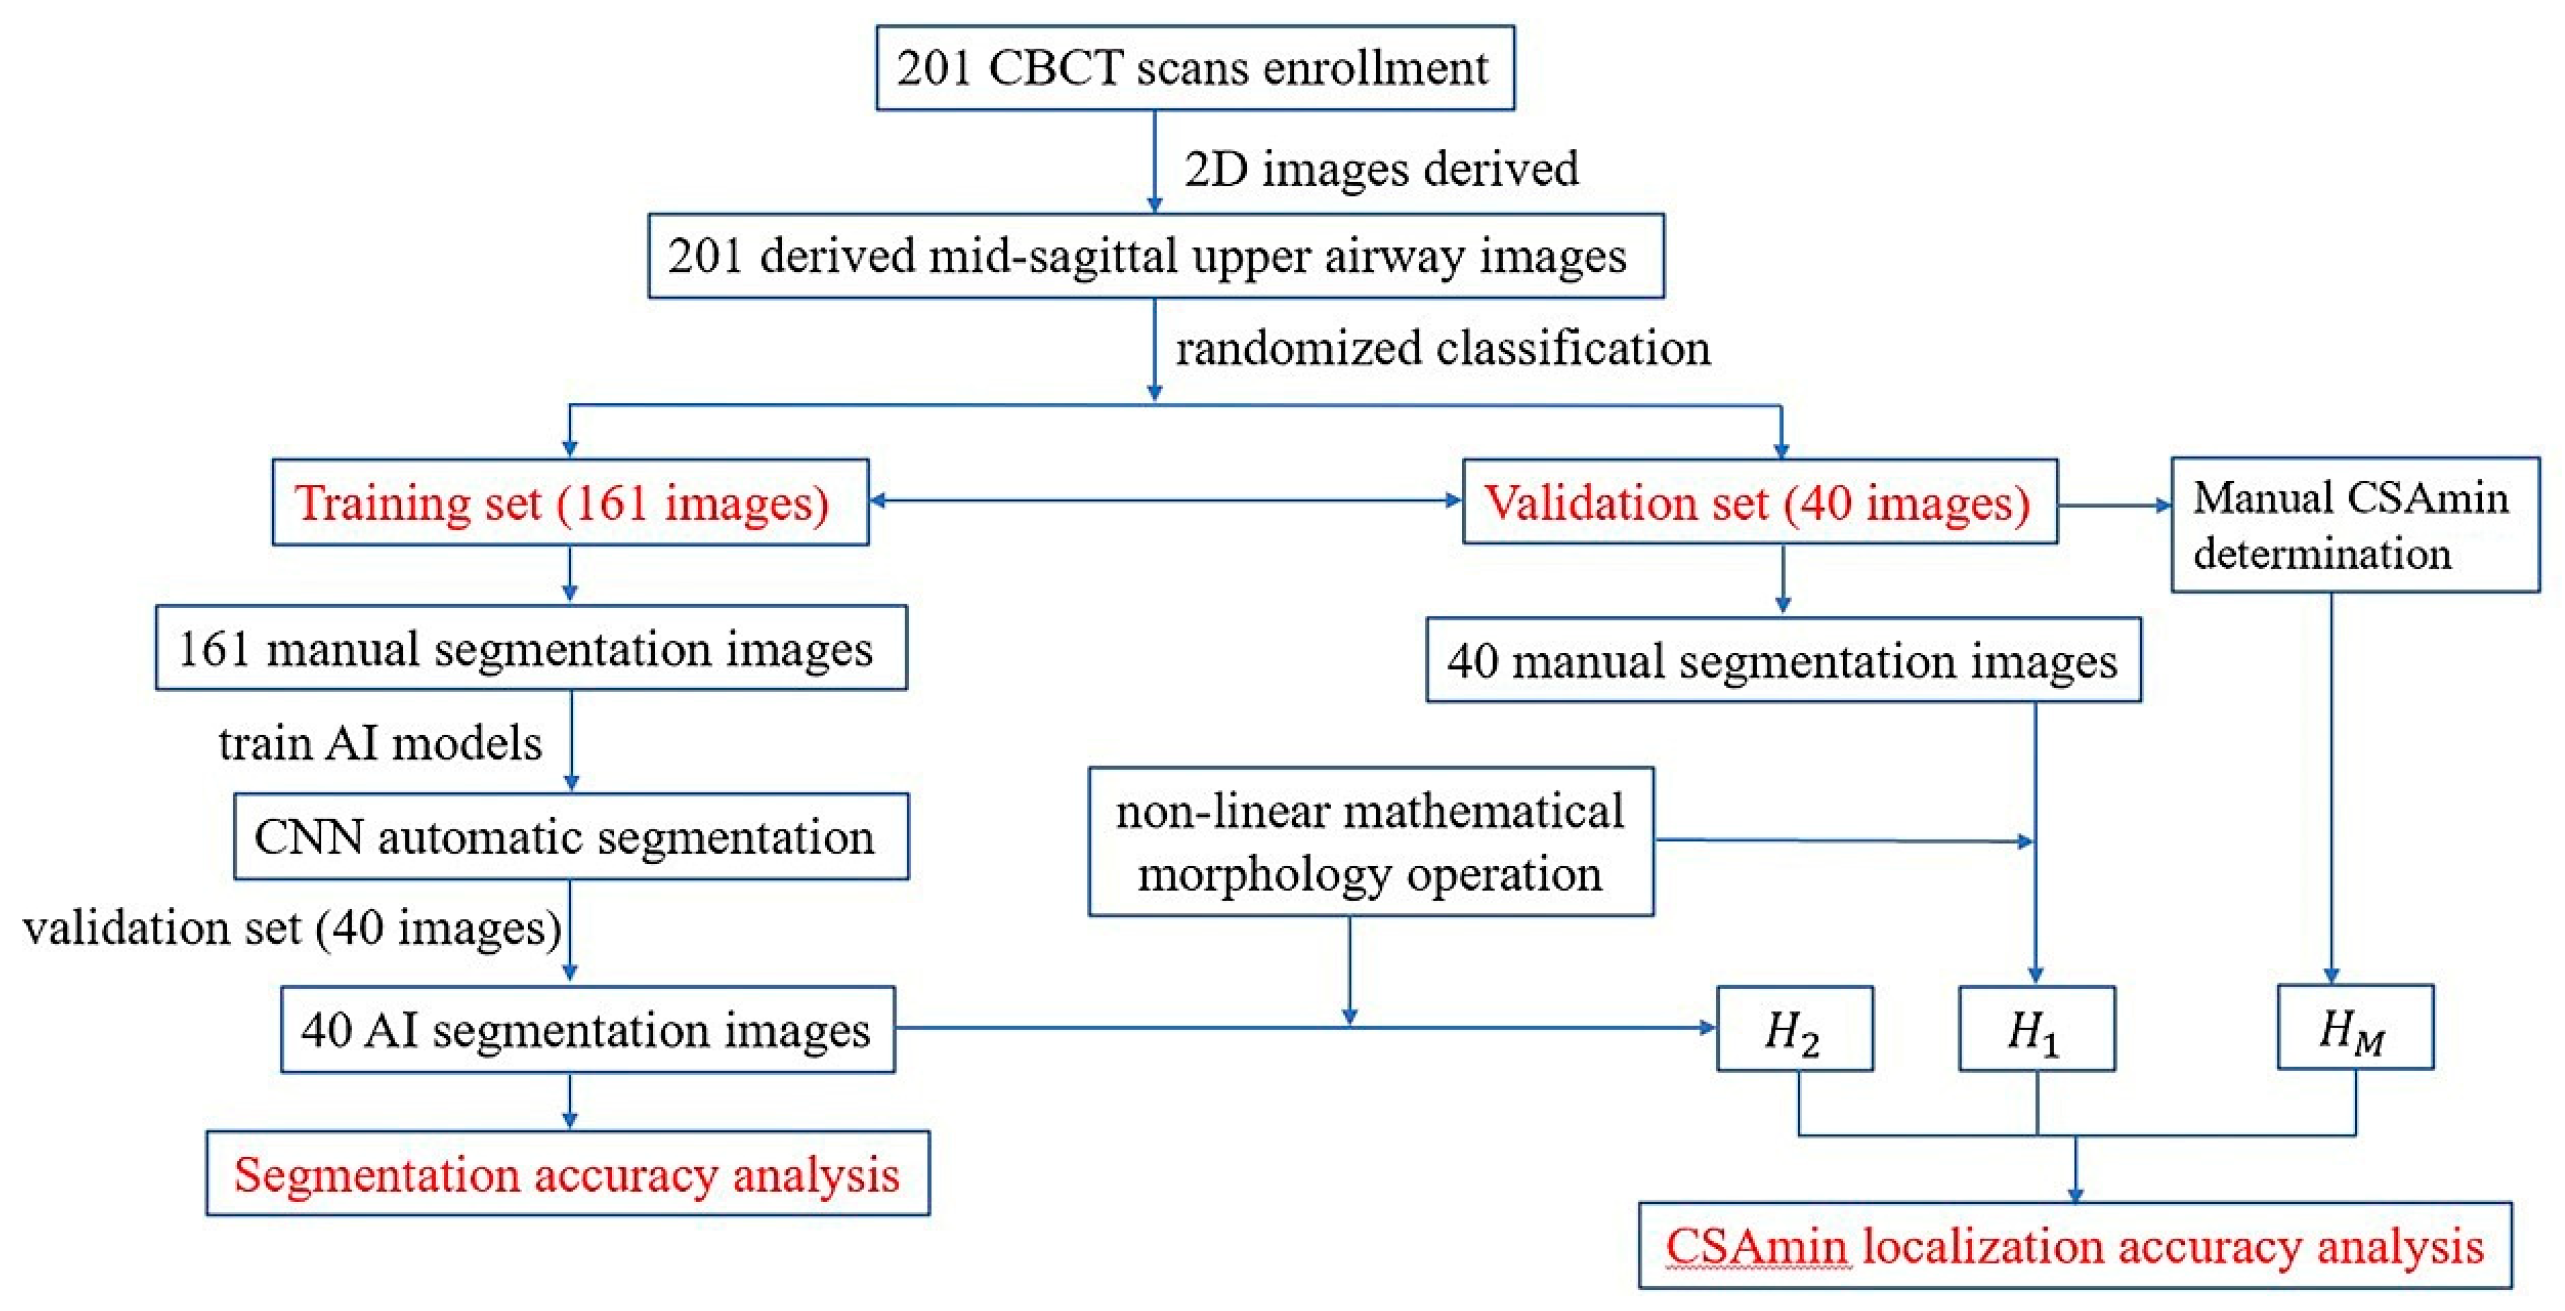
2. Materials and Methods
2.1. Data Collection
2.2. Consistency Tests
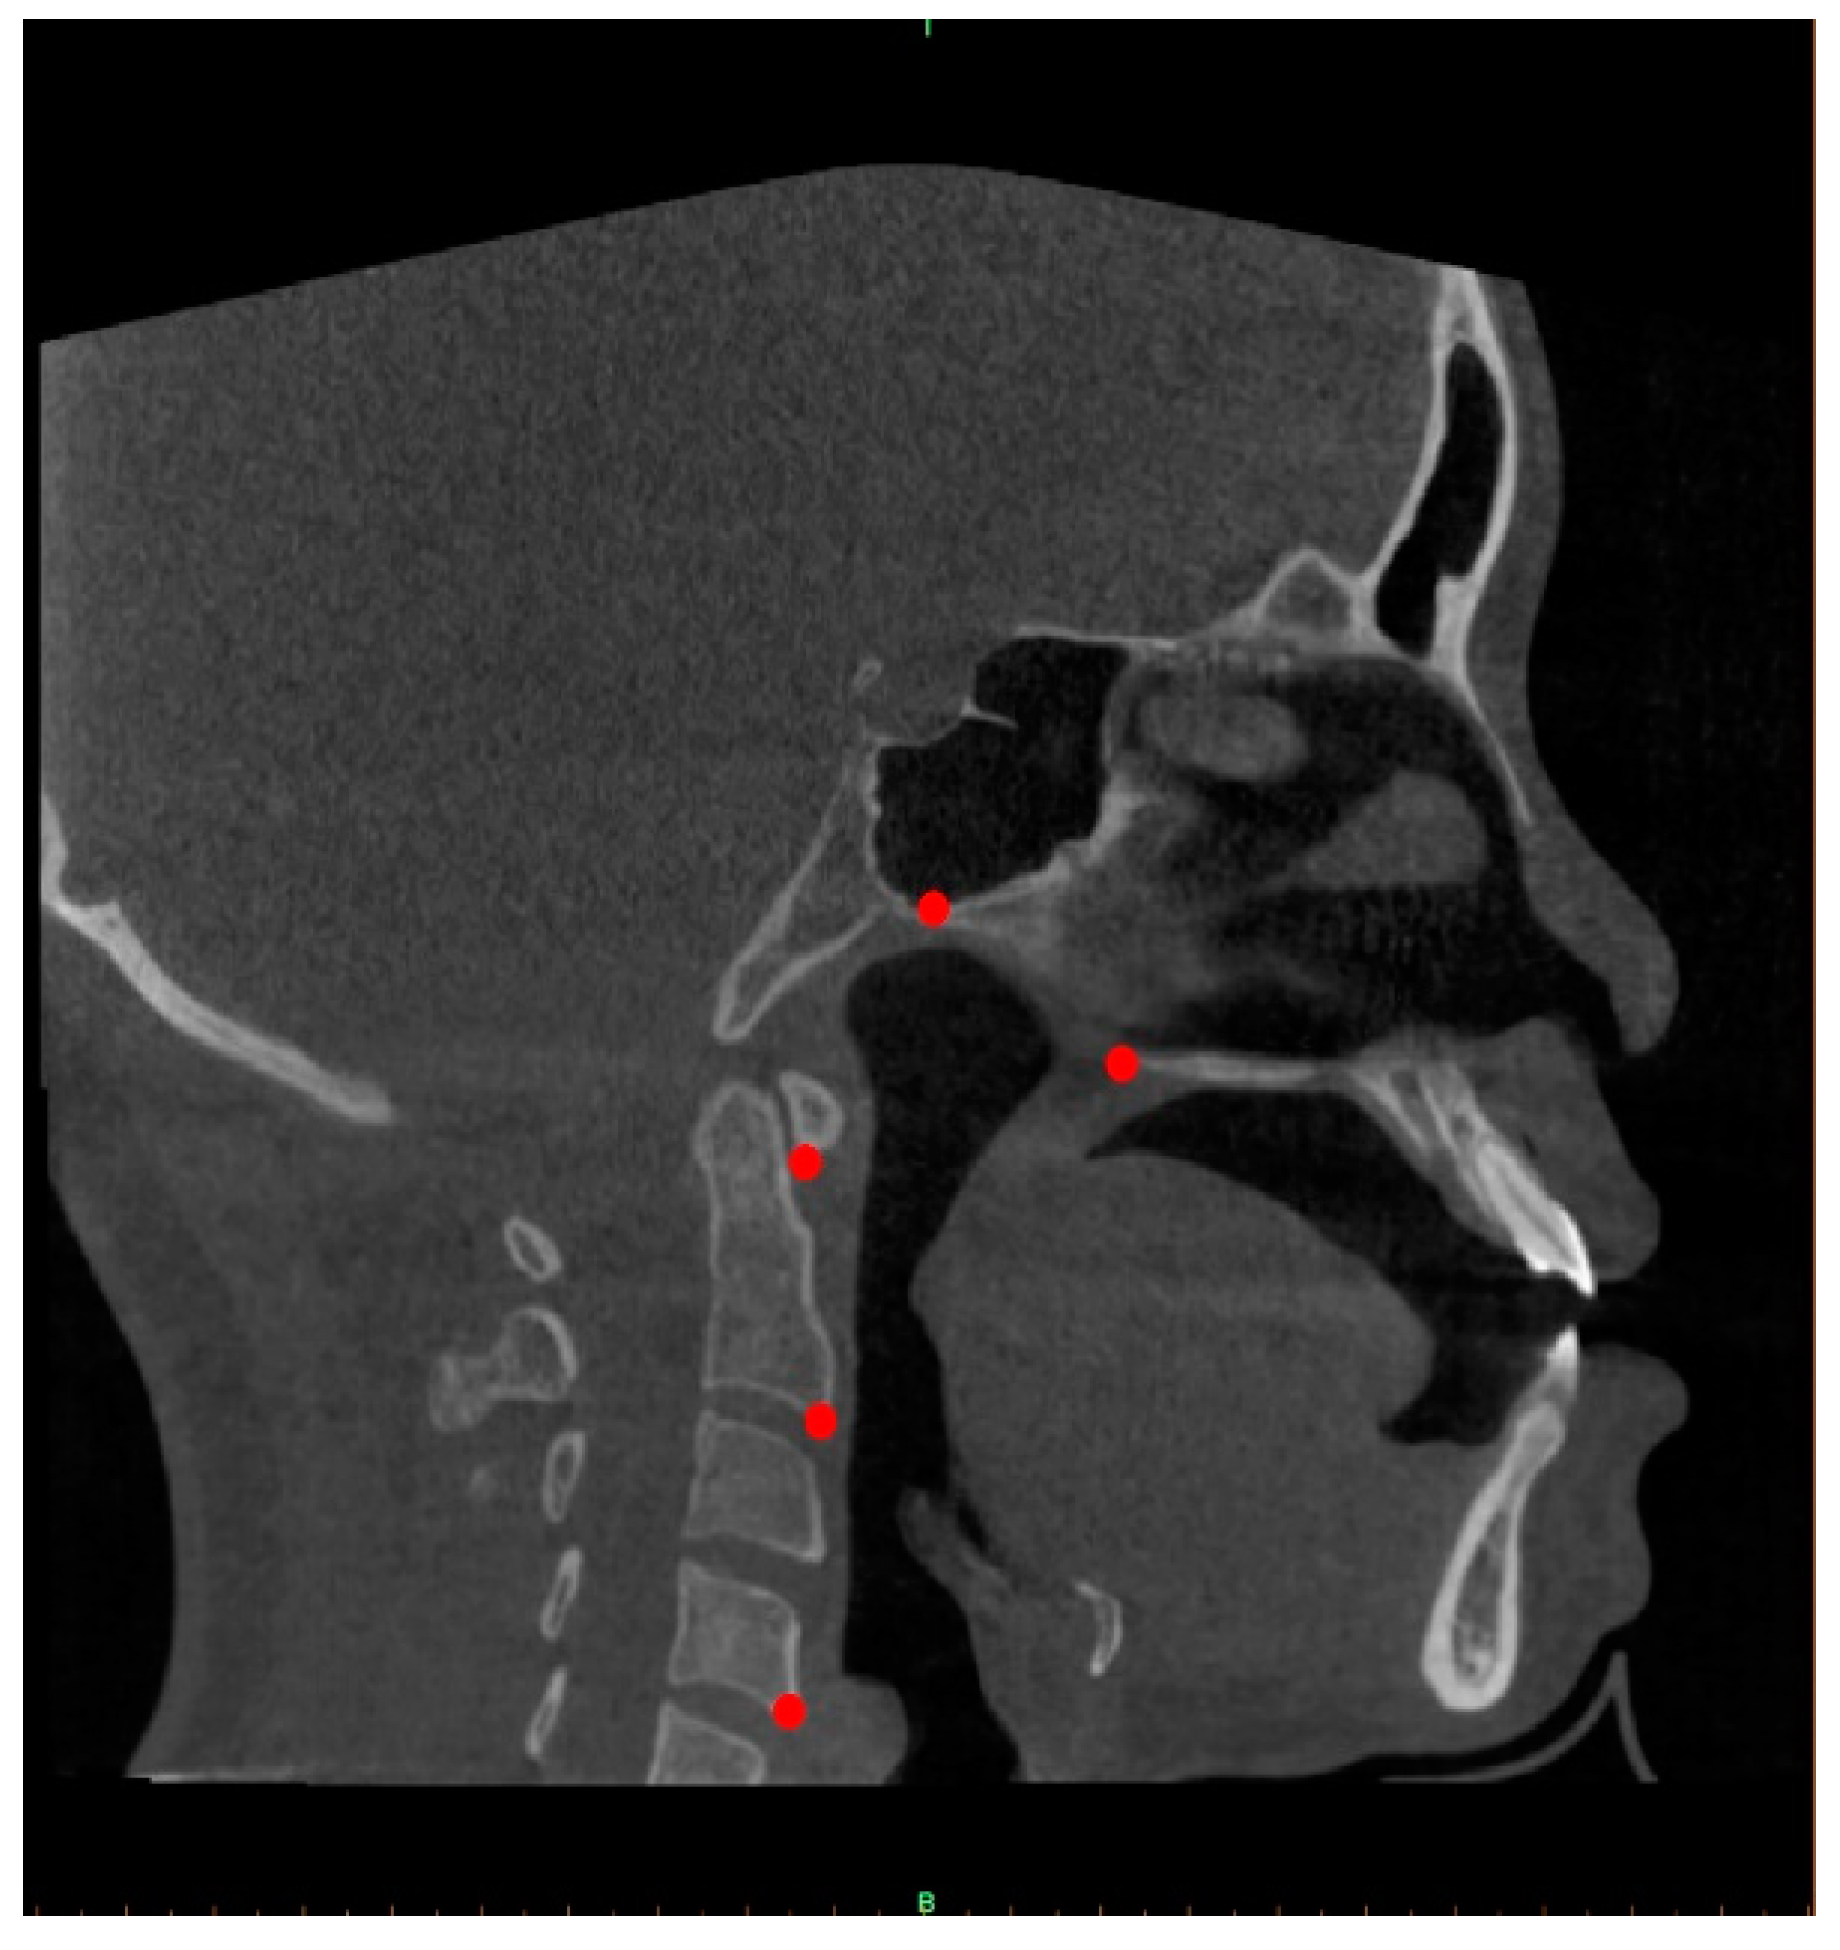
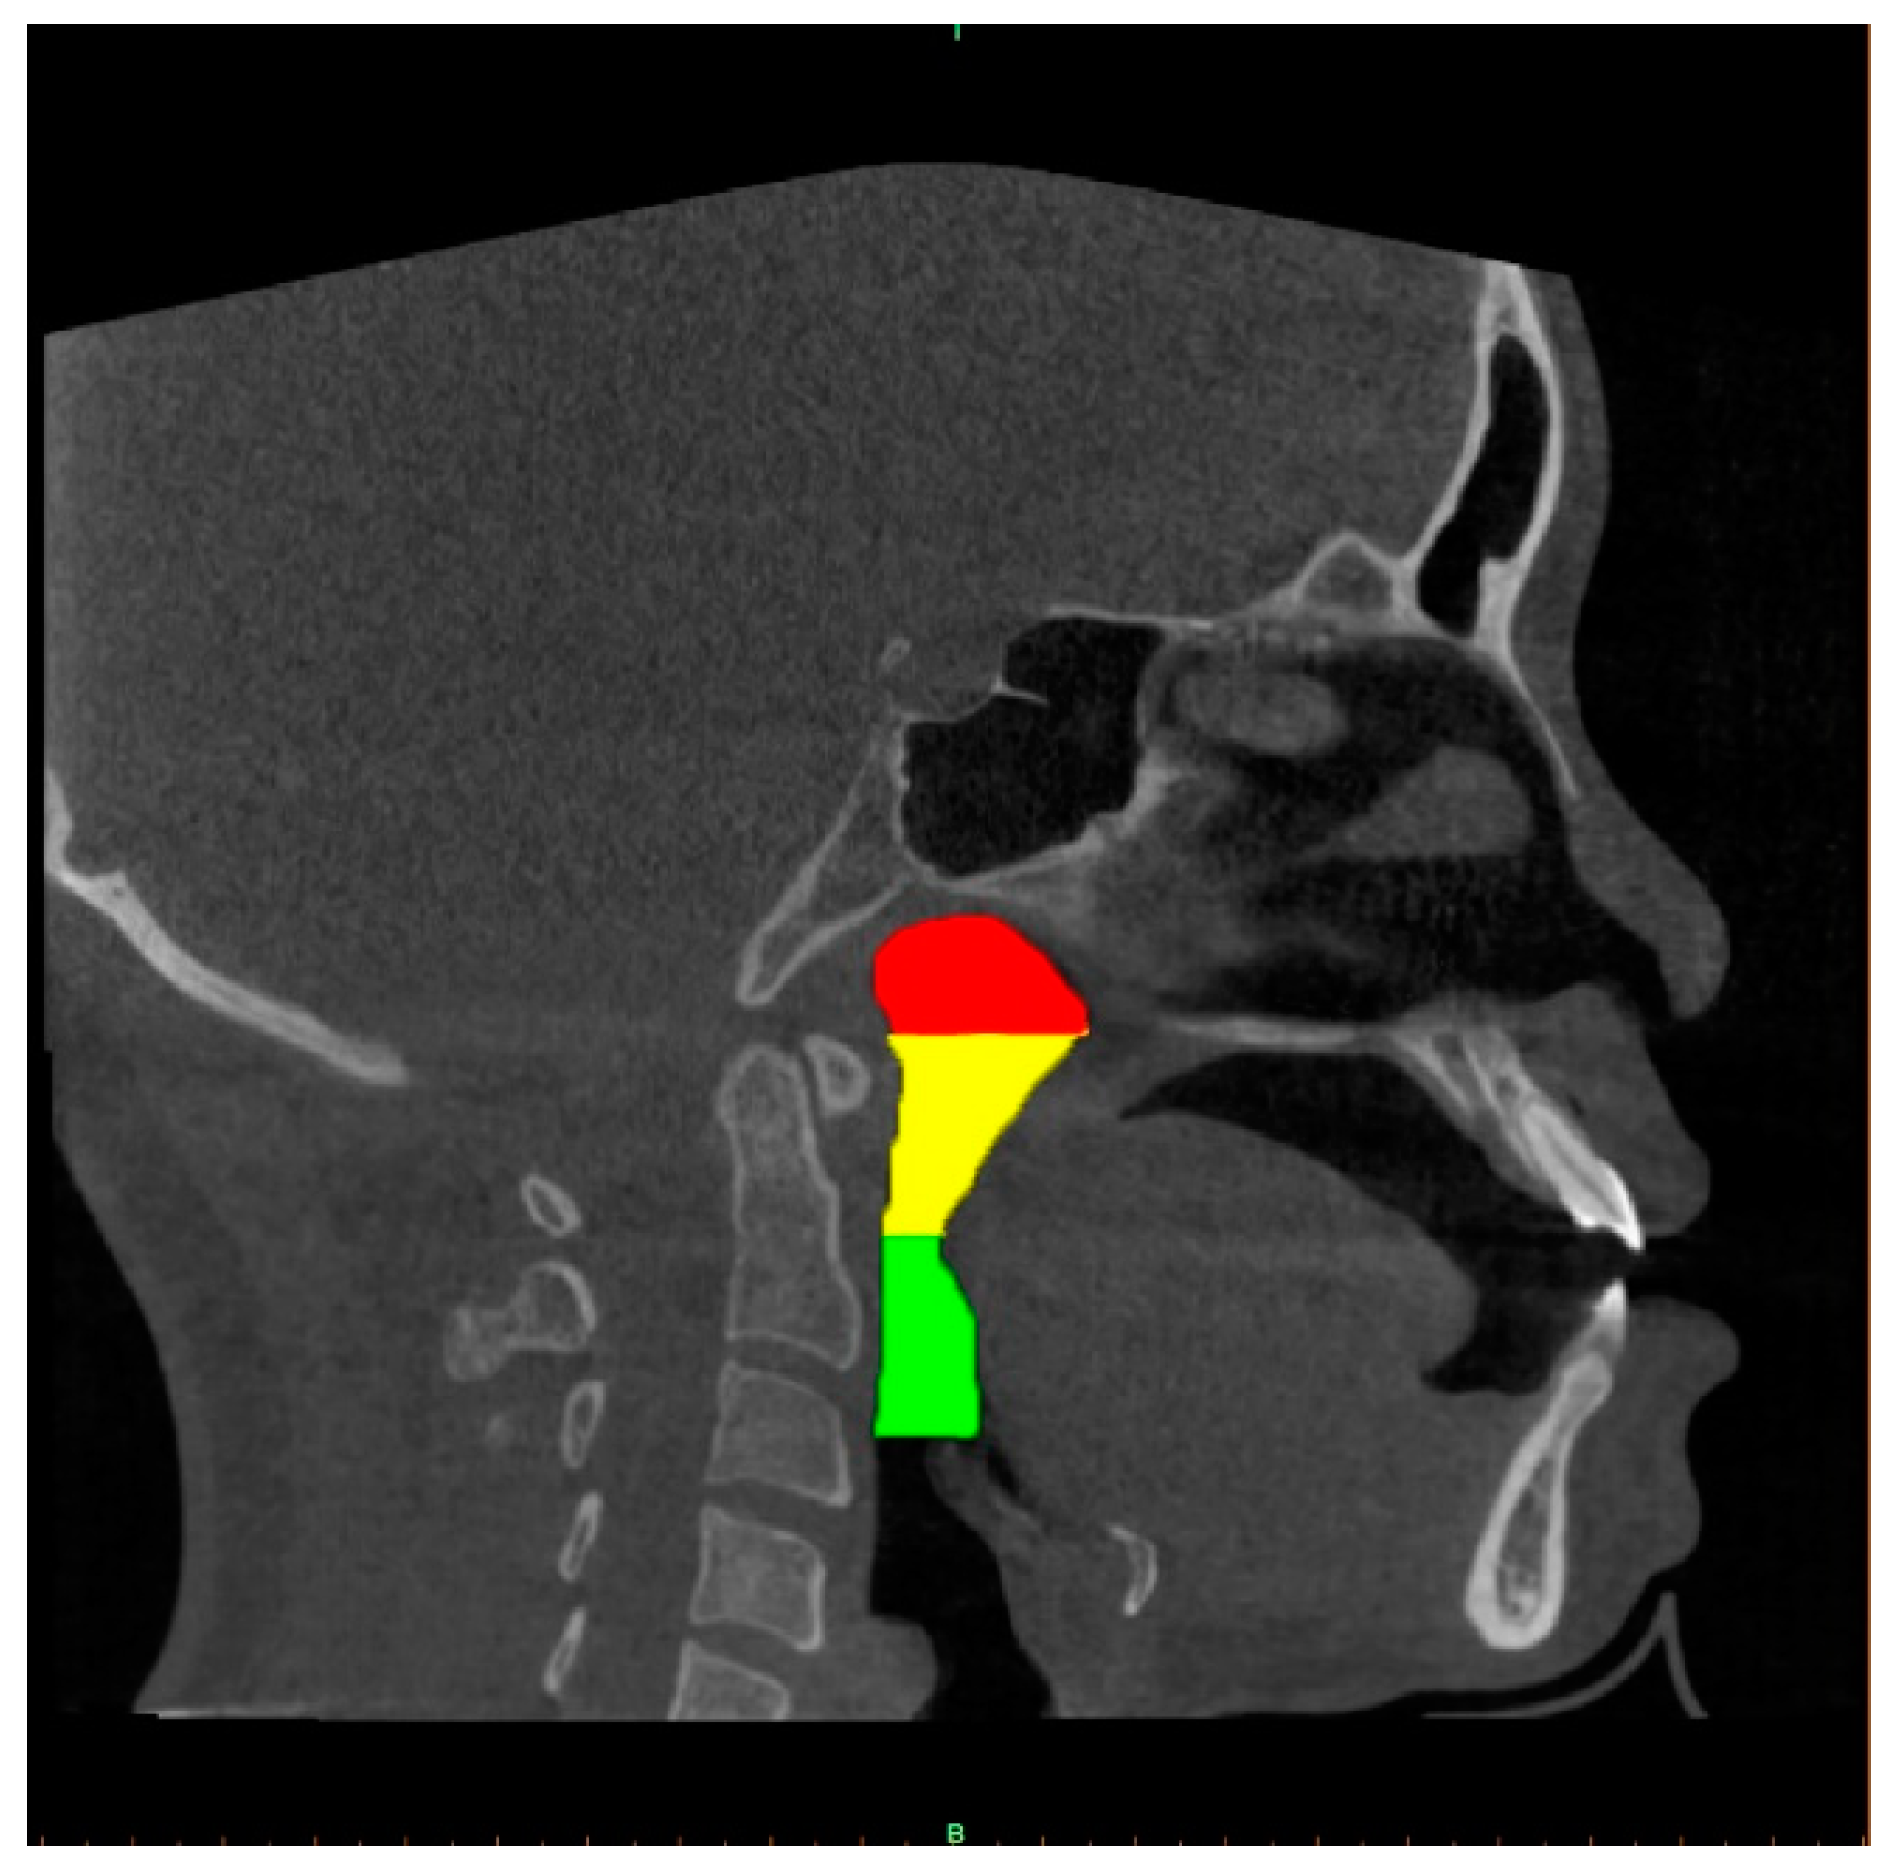
2.3. Determination of the Midsagittal Plane and Image Capture
2.4. Upper Airway Segmentation
2.4.1. Manual Segmentation of the Airway and Data Augmentation
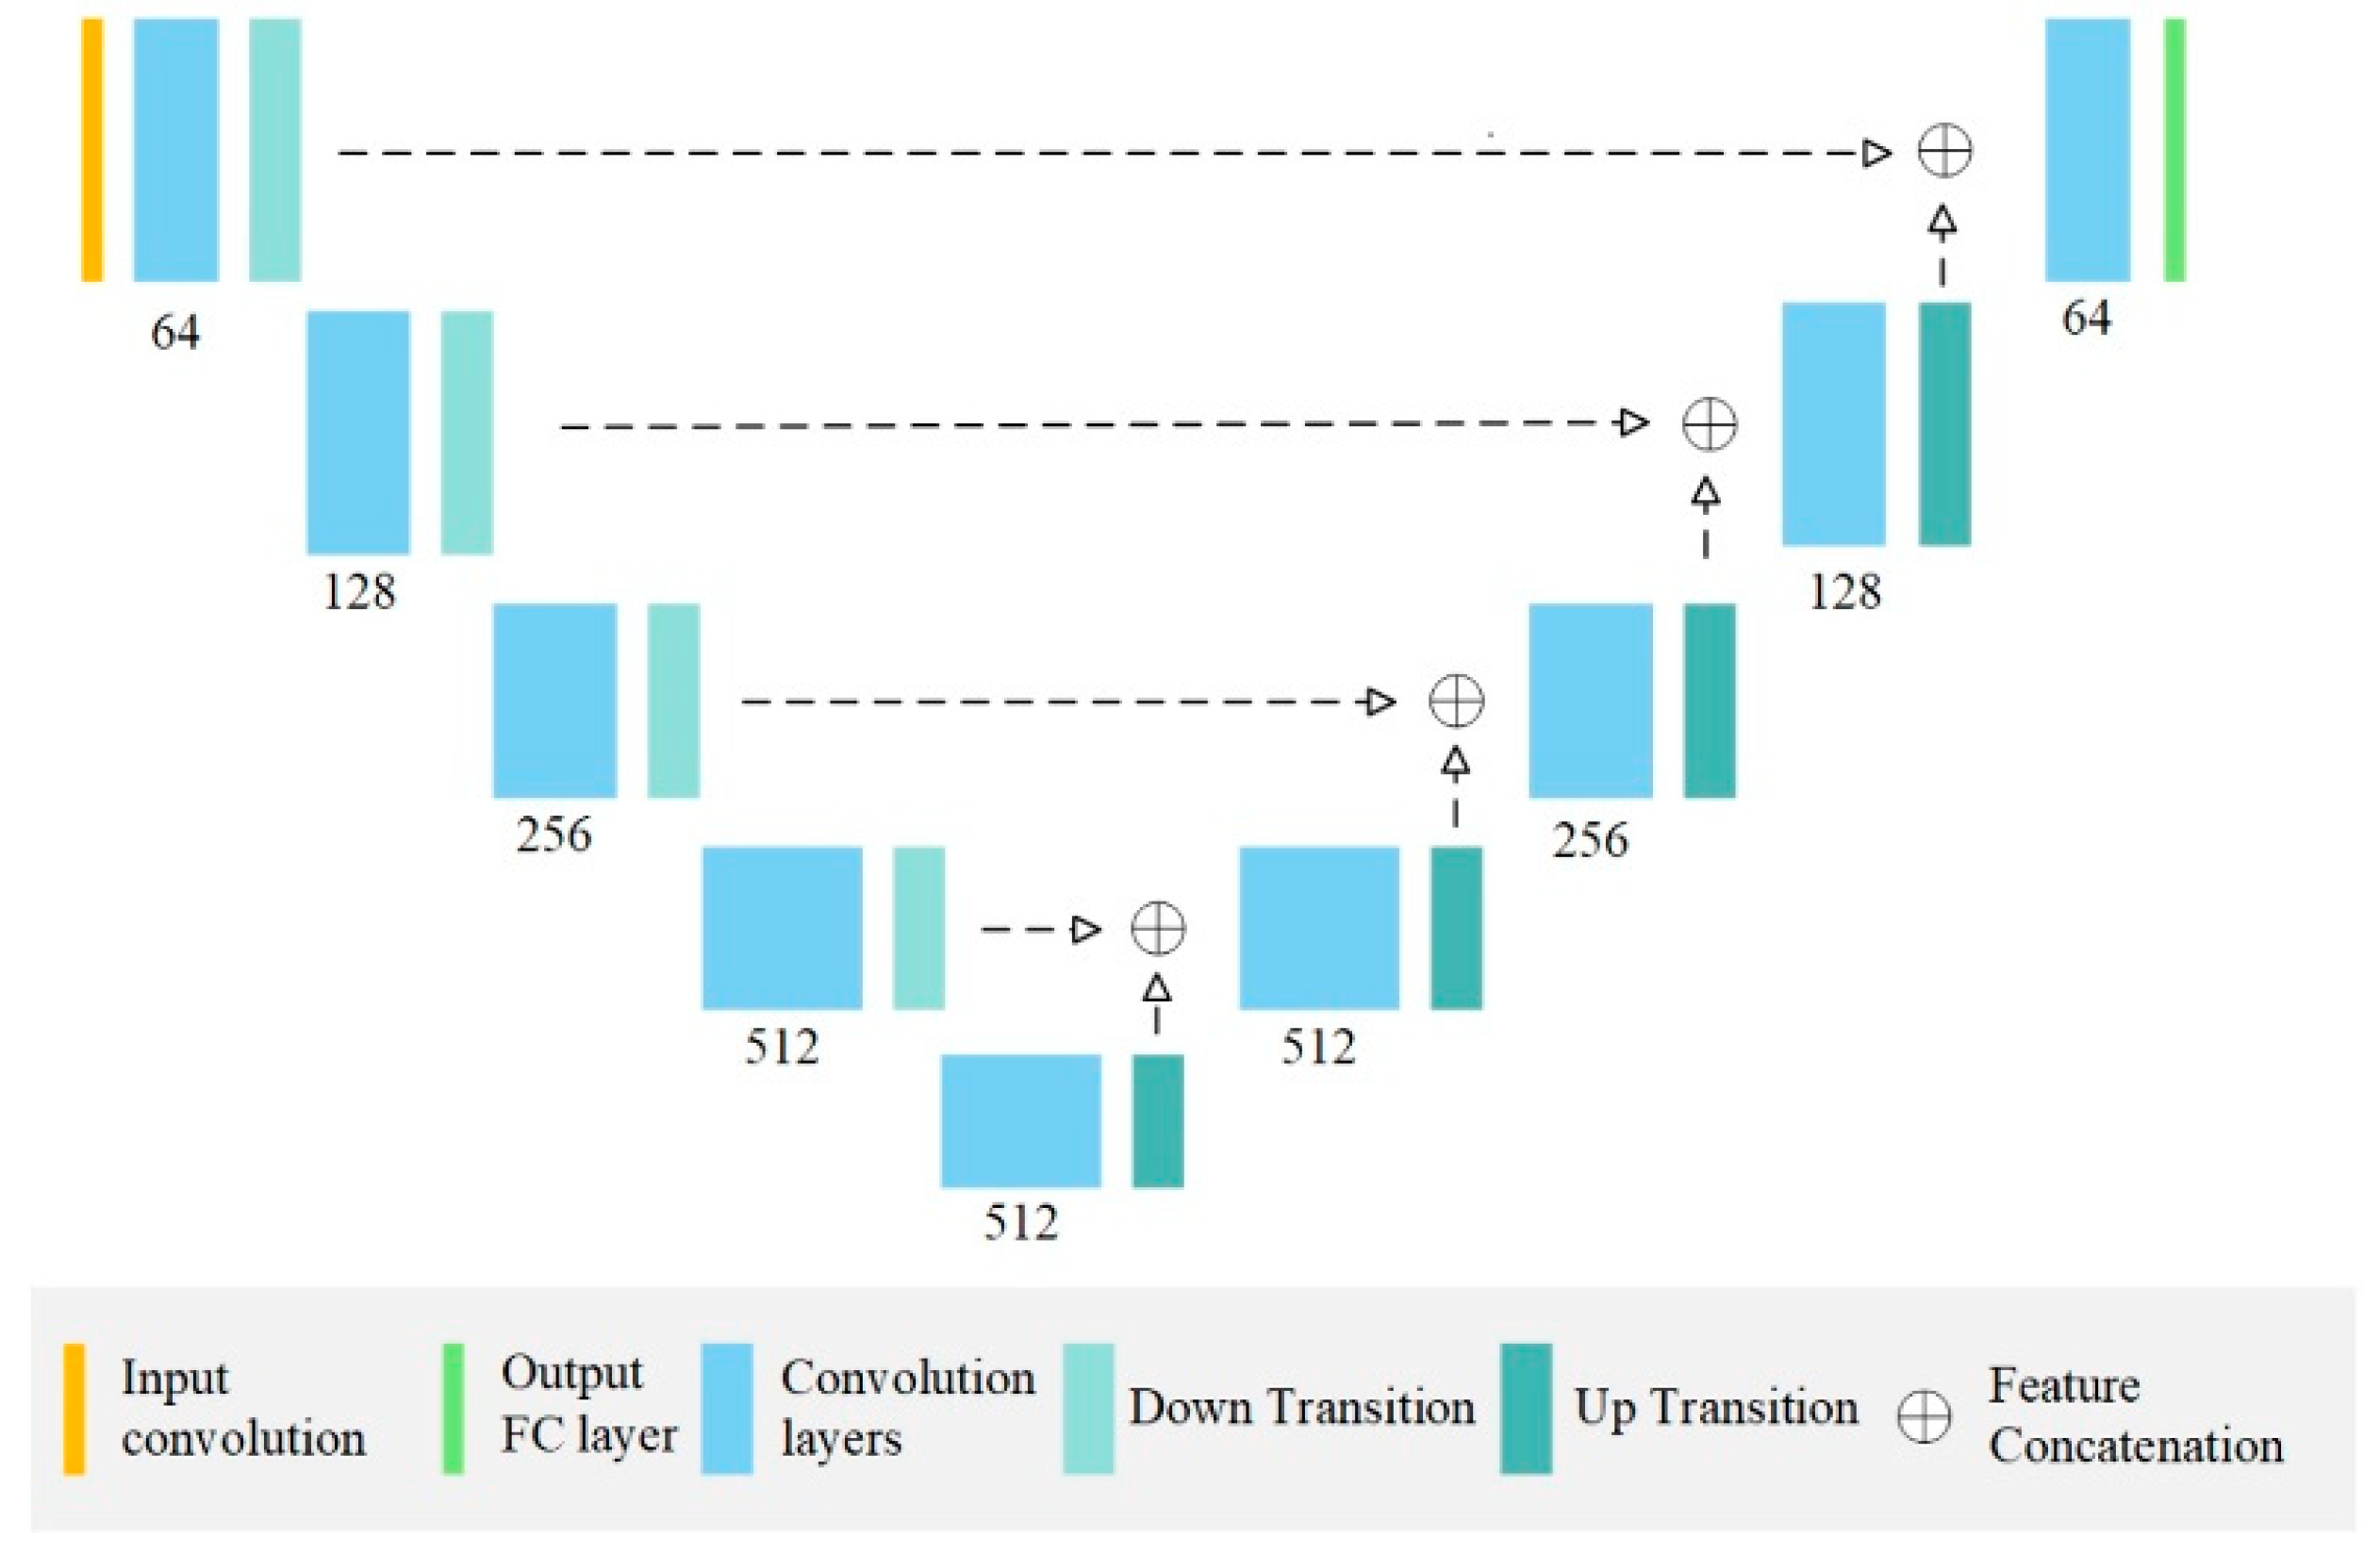
2.4.2. AI Segmentation Models
2.4.3. Evaluation Metrics for Airway Segmentation
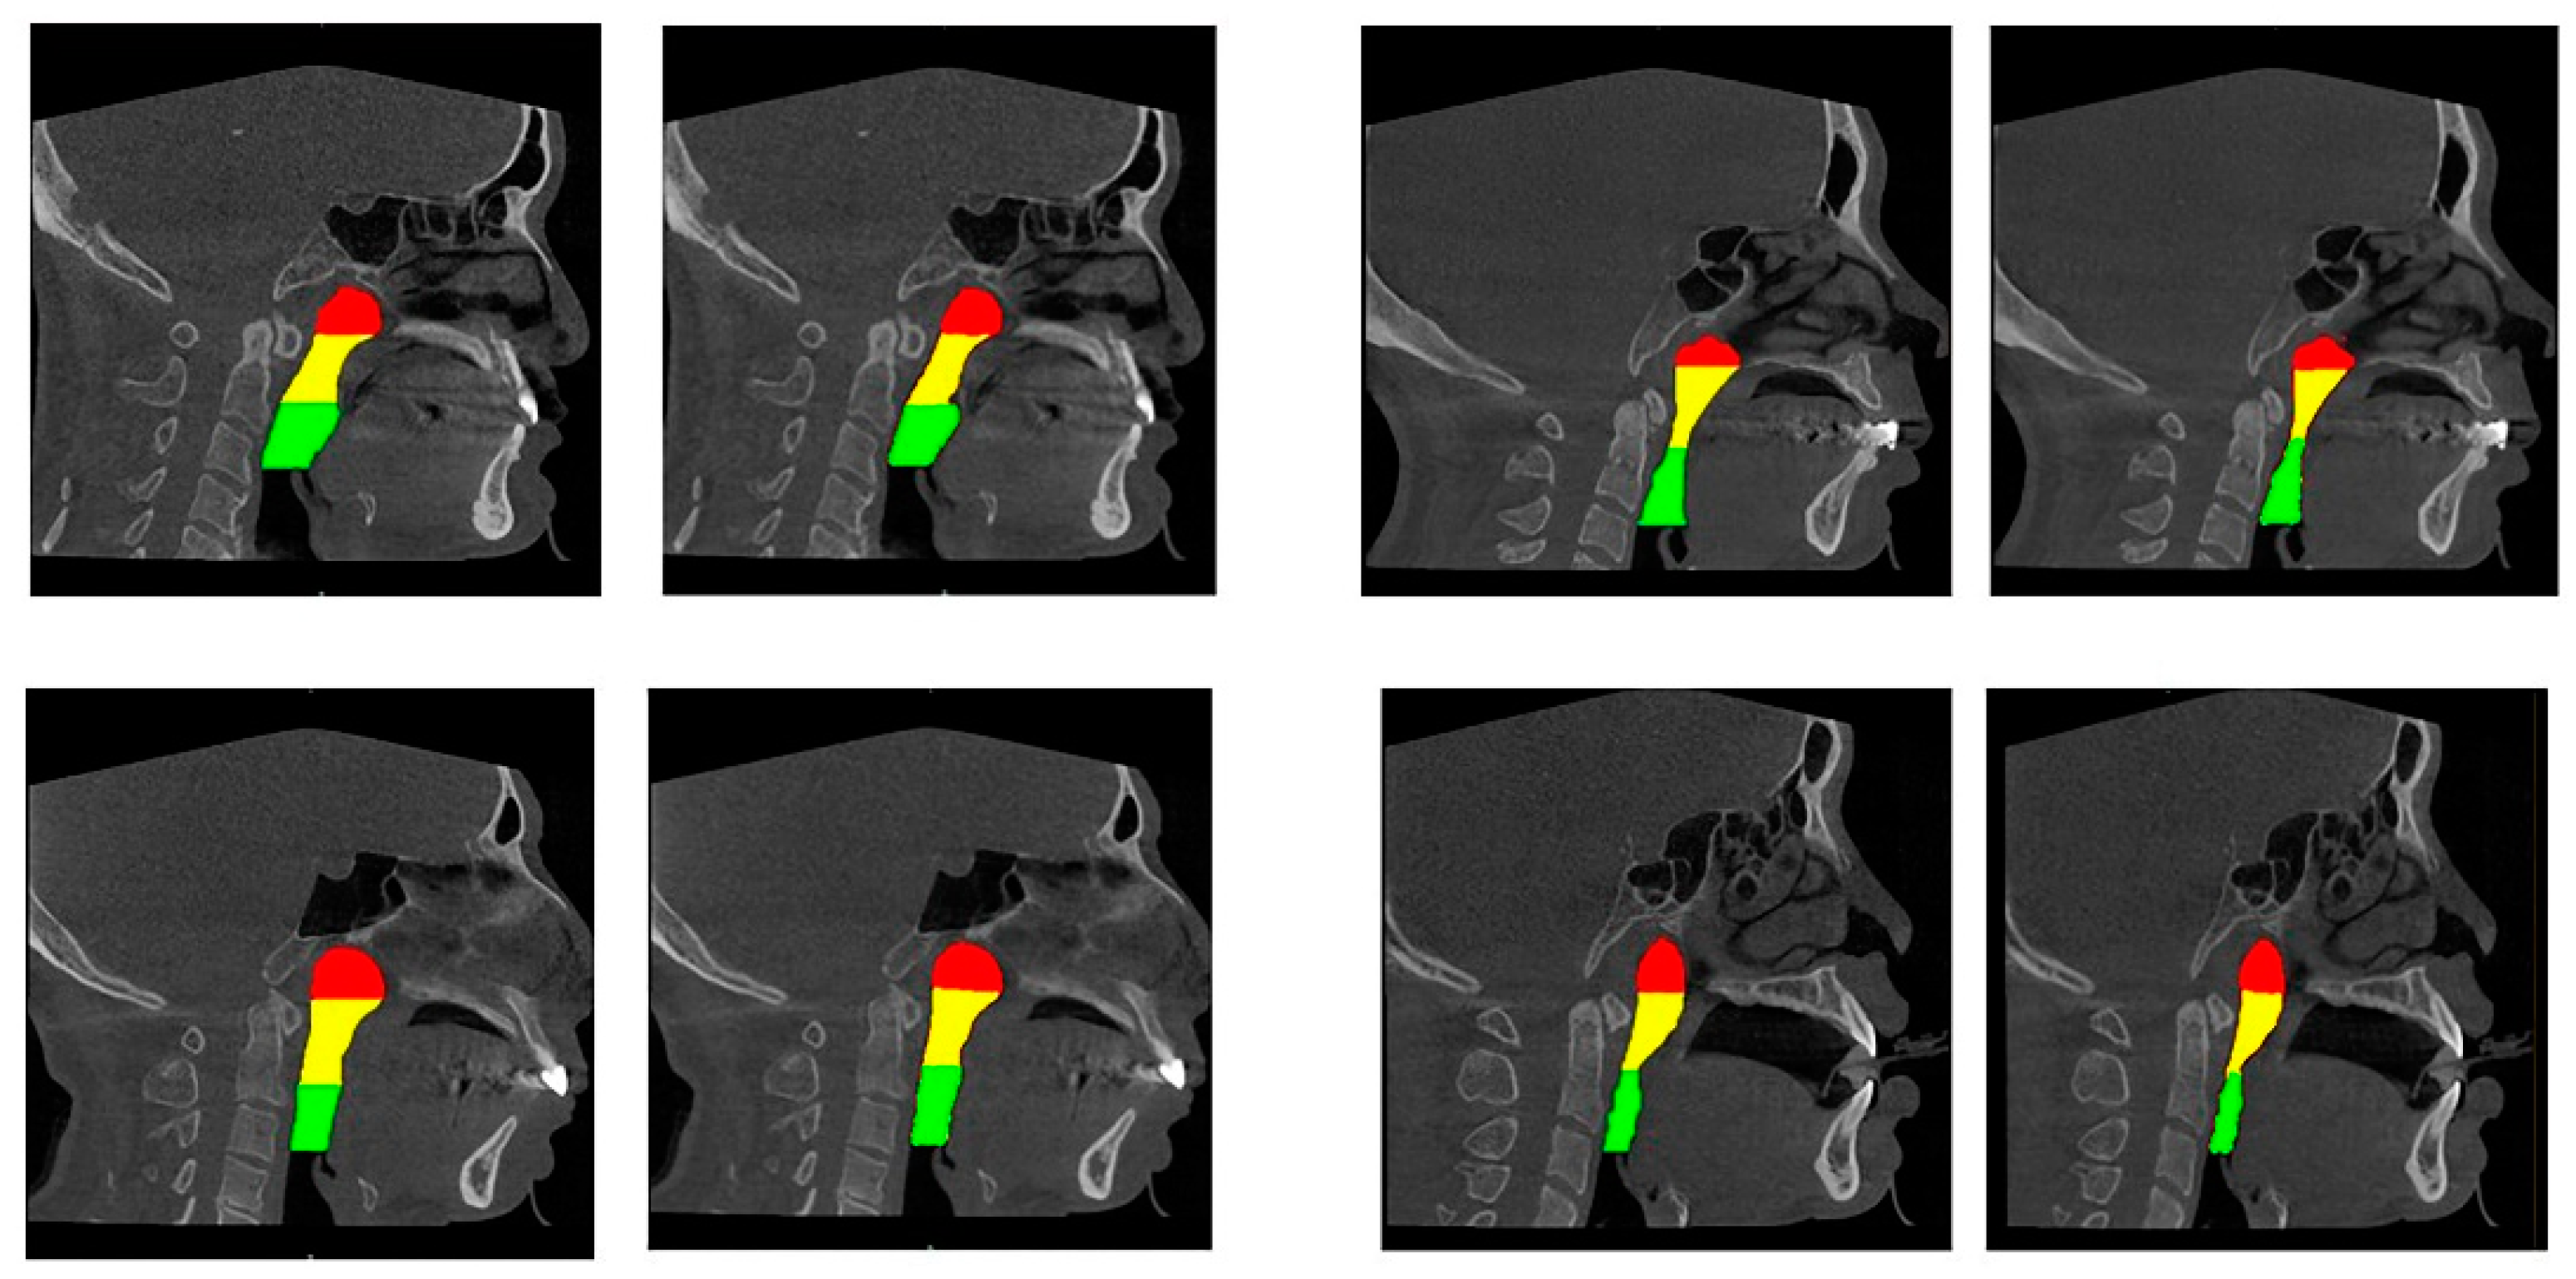
2.5. CSAmin Localisation Task
2.5.1. Manual Determination of CSAmin
2.5.2. AI-Driven Determination of CSAmin
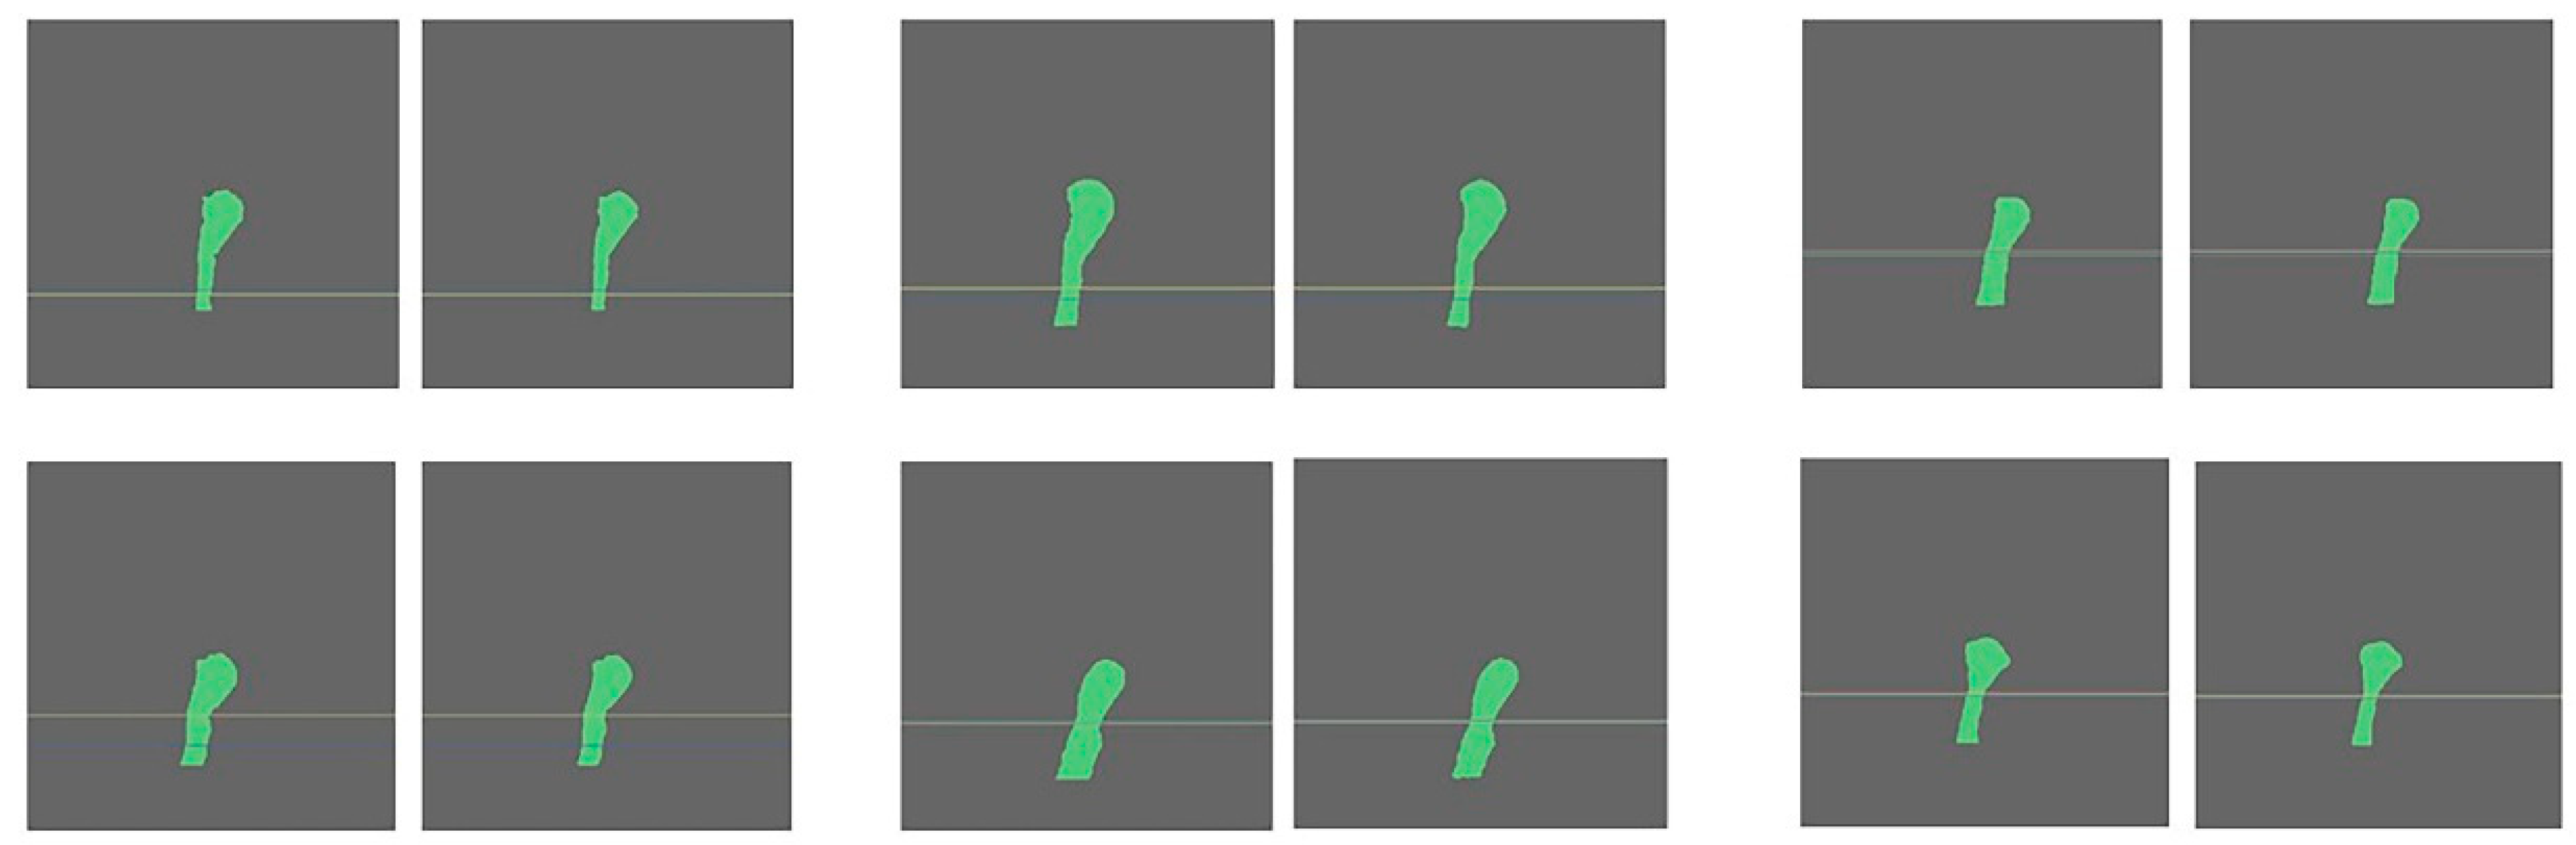
Erosion and Dilation
Computation and Prediction of CSAmin
2.6. Time Comparison
2.7. Statistical Analysis
3. Results
3.1. Accuracy Analysis for AI-Driven Upper Airway Segmentation
3.2. Accuracy Analysis for AI-Driven CSAmin Localisation
3.3. Time Comparison
4. Discussion
4.1. AI-Driven Segmentation Accuracy
4.2. AI-Driven CSAmin Localisation Accuracy
4.3. Limitations and Prospects
5. Conclusions
Author Contributions
Funding
Institutional Review Board Statement
Informed Consent Statement
Data Availability Statement
Conflicts of Interest
References
- Alsufyani, N.A.; Al-Saleh, M.A.; Major, P.W. CBCT assessment of upper airway changes and treatment outcomes of obstructive sleep apnoea: A systematic review. Sleep. Breath. 2013, 17, 911–923. [Google Scholar] [CrossRef]
- Dultra, F.; Tavares, A.; Dultra, J.A.; Salles, C.; Crusoe-Rebelo, I.M.; Barbosa, I.; Souza-Machado, A. Pharyngeal airspace of asthmatic individuals and those suffering from obstructive sleep apnea syndrome: Study by CBCT. Eur. J. Radiol. 2017, 95, 342–348. [Google Scholar] [CrossRef]
- Gottlieb, D.J.; Punjabi, N.M. Diagnosis and Management of Obstructive Sleep Apnea: A Review. JAMA 2020, 323, 1389–1400. [Google Scholar] [CrossRef]
- Javaheri, S.; Barbe, F.; Campos-Rodriguez, F.; Dempsey, J.A.; Khayat, R.; Javaheri, S.; Malhotra, A.; Martinez-Garcia, M.A.; Mehra, R.; Pack, A.I.; et al. Sleep Apnea: Types, Mechanisms, and Clinical Cardiovascular Consequences. J. Am. Coll. Cardiol. 2017, 69, 841–858. [Google Scholar] [CrossRef]
- Lugaresi, E.; Cirignotta, F.; Coccagna, G.; Piana, C. Some epidemiological data on snoring and cardiocirculatory disturbances. Sleep 1980, 3, 221–224. [Google Scholar] [CrossRef]
- Ahlqvist, J.; Eliasson, S.; Welander, U. The effect of projection errors on cephalometric length measurements. Eur. J. Orthod. 1986, 8, 141–148. [Google Scholar] [CrossRef]
- Vig, P.S.; Hall, D.J. The inadequacy of cephalometric radiographs for airway assessment. Am. J. Orthod. 1980, 77, 230–233. [Google Scholar] [CrossRef]
- Zondervan, R.L.; Hahn, P.F.; Sadow, C.A.; Liu, B.; Lee, S.I. Body CT scanning in young adults: Examination indications, patient outcomes, and risk of radiation-induced cancer. Radiology 2013, 267, 460–469. [Google Scholar] [CrossRef]
- Eslami, E.; Katz, E.S.; Baghdady, M.; Abramovitch, K.; Masoud, M.I. Are three-dimensional airway evaluations obtained through computed and cone-beam computed tomography scans predictable from lateral cephalograms? A systematic review of evidence. Angle Orthod. 2017, 87, 159–167. [Google Scholar] [CrossRef] [Green Version]
- Chen, H.; van Eijnatten, M.; Wolff, J.; de Lange, J.; van der Stelt, P.F.; Lobbezoo, F.; Aarab, G. Reliability and accuracy of three imaging software packages used for 3D analysis of the upper airway on cone beam computed tomography images. Dentomaxillofac Radiol. 2017, 46, 20170043. [Google Scholar] [CrossRef]
- Torres, H.M.; Evangelista, K.; Torres, E.M.; Estrela, C.; Leite, A.F.; Valladares-Neto, J.; Silva, M.A.G. Reliability and validity of two software systems used to measure the pharyngeal airway space in three-dimensional analysis. Int. J. Oral. Maxillofac. Surg. 2020, 49, 602–613. [Google Scholar] [CrossRef] [PubMed]
- Burkhard, J.P.; Dietrich, A.D.; Jacobsen, C.; Roos, M.; Lubbers, H.T.; Obwegeser, J.A. Cephalometric and three-dimensional assessment of the posterior airway space and imaging software reliability analysis before and after orthognathic surgery. J. Cranio Maxillofac. Surg. 2014, 42, 1428–1436. [Google Scholar] [CrossRef]
- Guijarro-Martinez, R.; Swennen, G.R. Three-dimensional cone beam computed tomography definition of the anatomical subregions of the upper airway: A validation study. Int. J. Oral. Maxillofac. Surg. 2013, 42, 1140–1149. [Google Scholar] [CrossRef]
- Katyal, V.; Pamula, Y.; Martin, A.J.; Daynes, C.N.; Kennedy, J.D.; Sampson, W.J. Craniofacial and upper airway morphology in pediatric sleep-disordered breathing: Systematic review and meta-analysis. Am. J. Orthod. Dentofacial Orthop. 2013, 143, 20–30e3. [Google Scholar] [CrossRef]
- Wong, S.H.; Al-Hasani, H.; Alam, Z.; Alam, A. Artificial intelligence in radiology: How will we be affected? Eur. Radiol. 2019, 29, 141–143. [Google Scholar] [CrossRef] [Green Version]
- Leite, A.F.; Gerven, A.V.; Willems, H.; Beznik, T.; Lahoud, P.; Gaeta-Araujo, H.; Vranckx, M.; Jacobs, R. Artificial intelligence-driven novel tool for tooth detection and segmentation on panoramic radiographs. Clin. Oral. Investig. 2021, 25, 2257–2267. [Google Scholar] [CrossRef]
- Casalegno, F.; Newton, T.; Daher, R.; Abdelaziz, M.; Lodi-Rizzini, A.; Schurmann, F.; Krejci, I.; Markram, H. Caries Detection with Near-Infrared Transillumination Using Deep Learning. J. Dent. Res. 2019, 98, 1227–1233. [Google Scholar] [CrossRef] [Green Version]
- Umer, F.; Habib, S. Critical Analysis of Artificial Intelligence in Endodontics: A Scoping Review. J. Endod. 2022, 48, 152–160. [Google Scholar] [CrossRef]
- De Vos, W.; Casselman, J.; Swennen, G.R. Cone-beam computerized tomography (CBCT) imaging of the oral and maxillofacial region: A systematic review of the literature. Int. J. Oral. Maxillofac. Surg. 2009, 38, 609–625. [Google Scholar] [CrossRef]
- Kim, H.S.; Kim, G.T.; Kim, S.; Lee, J.W.; Kim, E.C.; Kwon, Y.D. Three-dimensional evaluation of the pharyngeal airway using cone-beam computed tomography following bimaxillary orthognathic surgery in skeletal class III patients. Clin. Oral. Investig. 2016, 20, 915–922. [Google Scholar] [CrossRef]
- Chen, H.; Aarab, G.; de Ruiter, M.H.; de Lange, J.; Lobbezoo, F.; van der Stelt, P.F. Three-dimensional imaging of the upper airway anatomy in obstructive sleep apnea: A systematic review. Sleep. Med. 2016, 21, 19–27. [Google Scholar] [CrossRef] [PubMed]
- Schwab, R.J.; Pasirstein, M.; Pierson, R.; Mackley, A.; Hachadoorian, R.; Arens, R.; Maislin, G.; Pack, A.I. Identification of upper airway anatomic risk factors for obstructive sleep apnea with volumetric magnetic resonance imaging. Am. J. Respir. Crit. Care Med. 2003, 168, 522–530. [Google Scholar] [CrossRef]
- Hsu, W.E.; Wu, T.Y. Comparison of upper airway measurement by lateral cephalogram in upright position and CBCT in supine position. J. Dent. Sci. 2019, 14, 185–191. [Google Scholar] [CrossRef] [PubMed]
- Wang, C.W.; Peng, C.C. 3D Face Point Cloud Reconstruction and Recognition Using Depth Sensor. Sensors 2021, 21, 2587. [Google Scholar] [CrossRef]
- Ikeda, T.; Okano, S.; Hashimoto, N.; Kimura, K.; Kudo, K.; Tsutsumi, R.; Sasaki, S.; Kawasaki, J.; Miyashita, Y.; Wada, H. Histomorphological investigation of intrahepatic connective tissue for surgical anatomy based on modern computer imaging analysis. J. Hepatobiliary Pancreat. Sci. 2021, 28, 76–85. [Google Scholar] [CrossRef]
- Soares, J.M.; Cançado, H.R.; Sousa, A.A.; Moraes, G.M.; Carvalho, J.R.; Silva, G.S.; Porcaro-Salles, J.M. Prognostic factors for surgically resected squamous cell carcinoma of the lower oral cavity. Minerva Stomatol. 2014, 63, 341–349. [Google Scholar]
- Neelapu, B.C.; Kharbanda, O.P.; Sardana, V.; Gupta, A.; Vasamsetti, S.; Balachandran, R.; Rana, S.S.; Sardana, H.K. A pilot study for segmentation of pharyngeal and sino-nasal airway subregions by automatic contour initialization. Int. J. Comput. Assist. Radiol. Surg. 2017, 12, 1877–1893. [Google Scholar] [CrossRef]
- Neelapu, B.C.; Kharbanda, O.P.; Sardana, H.K.; Gupta, A.; Vasamsetti, S.; Balachandran, R.; Rana, S.S.; Sardana, V. The reliability of different methods of manual volumetric segmentation of pharyngeal and sinonasal subregions. Oral. Surg. Oral. Med. Oral. Pathol. Oral. Radiol. 2017, 124, 577–587. [Google Scholar] [CrossRef]
- Wang, M.; Jin, R.; Jiang, N.; Liu, H.; Jiang, S.; Li, K.; Zhou, X. Automated labeling of the airway tree in terms of lobes based on deep learning of bifurcation point detection. Med. Biol. Eng. Comput. 2020, 58, 2009–2024. [Google Scholar] [CrossRef]
- Maken, P.; Gupta, A.; Gupta, M.K. A systematic review of the techniques for automatic segmentation of the human upper airway using volumetric images. Med. Biol. Eng. Comput. 2023, 61, 1901–1927. [Google Scholar] [CrossRef]
- Sin, Ç.; Akkaya, N.; Aksoy, S.; Orhan, K.; Öz, U. A deep learning algorithm proposal to automatic pharyngeal airway detection and segmentation on CBCT images. Orthod. Craniofac Res. 2021, 2 (Suppl. S24), 117–123. [Google Scholar] [CrossRef]
- Garcia-Uceda, A.; Selvan, R.; Saghir, Z.; Tiddens, H.A.W.M.; de Bruijne, M. Automatic airway segmentation from computed tomography using robust and efficient 3-D convolutional neural networks. Sci. Rep. 2021, 11, 16001. [Google Scholar] [CrossRef]
- Leonardi, R.; Lo Giudice, A.; Farronato, M.; Ronsivalle, V.; Allegrini, S.; Musumeci, G.; Spampinato, C. Fully automatic segmentation of sinonasal cavity and pharyngeal airway based on convolutional neural networks. Am. J. Orthod. Dentofacial Orthop. 2021, 159, 824–835. [Google Scholar] [CrossRef] [PubMed]
- De Water, V.R.; Saridin, J.K.; Bouw, F.; Murawska, M.M.; Koudstaal, M.J. Measuring upper airway volume: Accuracy and reliability of Dolphin 3D software compared to manual segmentation in craniosynostosis patients. J. Oral. Maxillofac. Surg. 2014, 72, 139–144. [Google Scholar] [PubMed]
- Alsufyani, N.A.; Hess, A.; Noga, M.; Ray, N.; Al-Saleh, M.A.; Lagravere, M.O.; Major, P.W. New algorithm for semiautomatic segmentation of nasal cavity and pharyngeal airway in comparison with manual segmentation using cone-beam computed tomography. Am. J. Orthod. Dentofacial Orthop. 2016, 150, 703–712. [Google Scholar] [CrossRef] [PubMed] [Green Version]
- Weissheimer, A.; Menezes, L.M.; Sameshima, G.T.; Enciso, R.; Pham, J.; Grauer, D. Imaging software accuracy for 3-dimensional analysis of the upper airway. Am. J. Orthod. Dentofacial Orthop. 2012, 142, 801–813. [Google Scholar] [CrossRef]
- Chen, H.; Zhang, K.; Lyu, P.; Li, H.; Zhang, L.; Wu, J.; Lee, C.H. A deep learning approach to automatic teeth detection and numbering based on object detection in dental periapical films. Sci. Rep. 2019, 9, 3840. [Google Scholar] [CrossRef] [Green Version]
- Campos, L.D.; Trindade, I.E.K.; Yatabe, M.; Trindade, S.H.K.; Pimenta, L.A.; Kimbell, J.; Drake, A.F.; Trindade-Suedam, I.K. Reduced pharyngeal dimensions and obstructive sleep apnea in adults with cleft lip/palate and Class III malocclusion. Cranio 2021, 39, 484–490. [Google Scholar] [CrossRef]
- Nandi, P.R.; Charlesworth, C.H.; Taylor, S.J.; Nunn, J.F.; Dore, C.J. Effect of general anaesthesia on the pharynx. Br. J. Anaesth. 1991, 66, 157–162. [Google Scholar] [CrossRef]
- Isono, S.; Remmers, J.E.; Tanaka, A.; Sho, Y.; Sato, J.; Nishino, T. Anatomy of pharynx in patients with obstructive sleep apnea and in normal subjects. J. Appl. Physiol. 1997, 82, 1319–1326. [Google Scholar] [CrossRef]
- Heinz, J.; Stewart, K.; Ghoneima, A. Evaluation of two-dimensional lateral cephalogram and three-dimensional cone beam computed tomography superimpositions: A comparative study. Int. J. Oral. Maxillofac. Surg. 2019, 48, 519–525. [Google Scholar] [CrossRef] [PubMed]


| Reference Points | Explanation |
|---|---|
| PNS | Most posterior point of palate |
| VP | Most posterior point of vomer |
| CV1 | Most anterior inferior point of anterior arch of atlas |
| CV2 | Most anterior inferior point of anterior arch of second vertebra |
| CV4 | Most anterior inferior point of anterior arch of fourth vertebra |
| Model | DeepLab50 | DeepLab101 | ||||||||
|---|---|---|---|---|---|---|---|---|---|---|
| Precision | Recall | IoU | DSC | Size Difference | Precision | Recall | IoU | DSC | Size Difference | |
| Nasopharynx | 93.1 | 79.9 | 75.4 | 85.5 | 146.1 | 92.7 | 82.1 | 77.0 | 86.7 | 122.3 |
| Retropalatal pharynx | 87.3 | 90.4 | 79.8 | 88.6 | 102.1 | 89.1 | 89.5 | 80.6 | 89.1 | 101.1 |
| Retroglossal pharynx | 89.7 | 93.6 | 84.2 | 91.3 | 100.4 | 90.0 | 94.3 | 85.0 | 91.8 | 92.2 |
| Overall | 90.0 | 88.0 | 79.8 | 88.4 | 116.2 | 90.6 | 88.6 | 80.9 | 89.2 | 105.2 |
| p value | 0.369 | 0.381 | 0.415 | 0.488 | 0.039 * | 0.451 | 0.467 | 0.434 | 0.451 | 0.322 |
| Model | UNet18 | UNet36 | ||||||||
|---|---|---|---|---|---|---|---|---|---|---|
| Precision | Recall | IoU | DSC | Size Difference | Precision | Recall | IoU | DSC | Size Difference | |
| Nasopharynx | 90.8 | 85.5 | 78.8 | 87.9 | 83.0 | 90.3 | 85.9 | 78.6 | 87.7 | 90.5 |
| Retropalatal pharynx | 87.6 | 90.8 | 80.4 | 88.9 | 115.0 | 88.8 | 89.8 | 80.5 | 89.0 | 102.8 |
| Retroglossal pharynx | 92.0 | 91.3 | 84.4 | 91.3 | 101.5 | 91.3 | 91.0 | 83.6 | 90.7 | 101.8 |
| Overall | 90.2 | 89.2 | 81.2 | 89.4 | 99.8 | 90.1 | 88.9 | 80.9 | 89.1 | 98.4 |
| p value | 0.469 | 0.398 | 0.416 | 0.433 | 0.270 | 0.416 | 0.488 | 0.498 | 0.433 | 0.807 |
| CSAmin Localisation | Manual Work | Total | |
|---|---|---|---|
| Retropalatal pharynx | Retroglossal pharynx | ||
| AI prediction | |||
| Retropalatal pharynx | 27 | 0 | 27 |
| Retroglossal pharynx | 1 | 12 | 13 |
| Total | 28 | 12 | 40 |
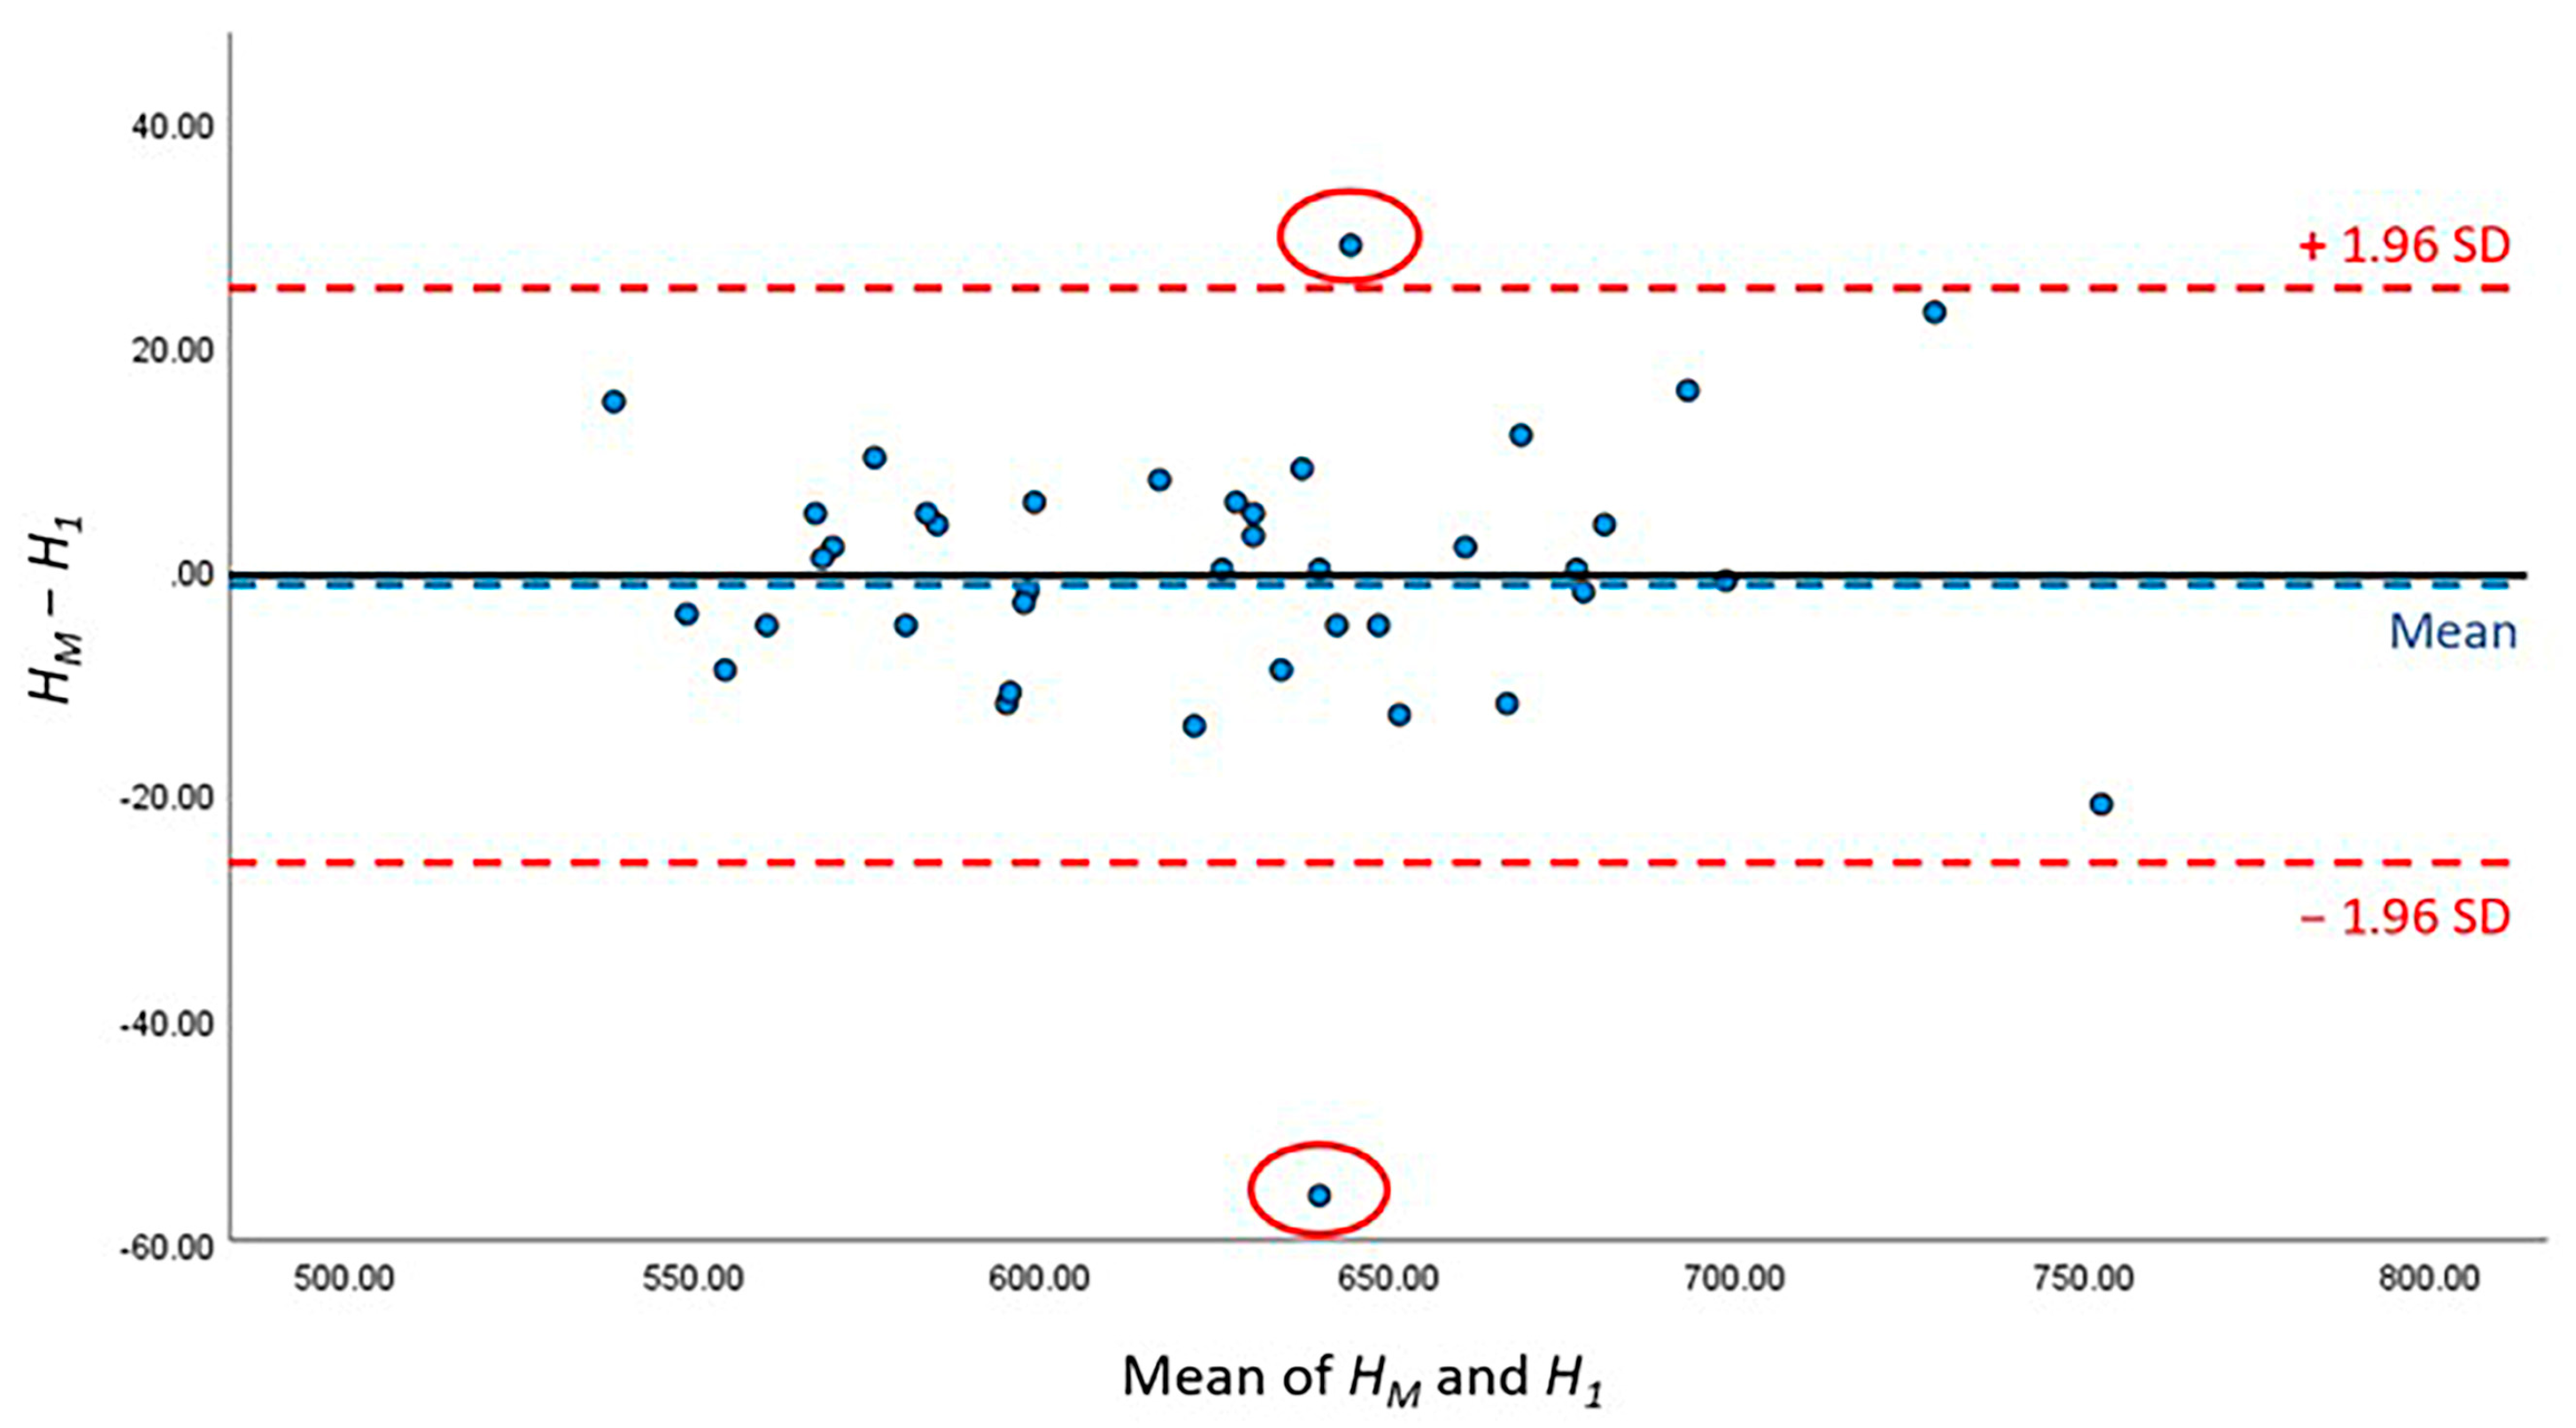
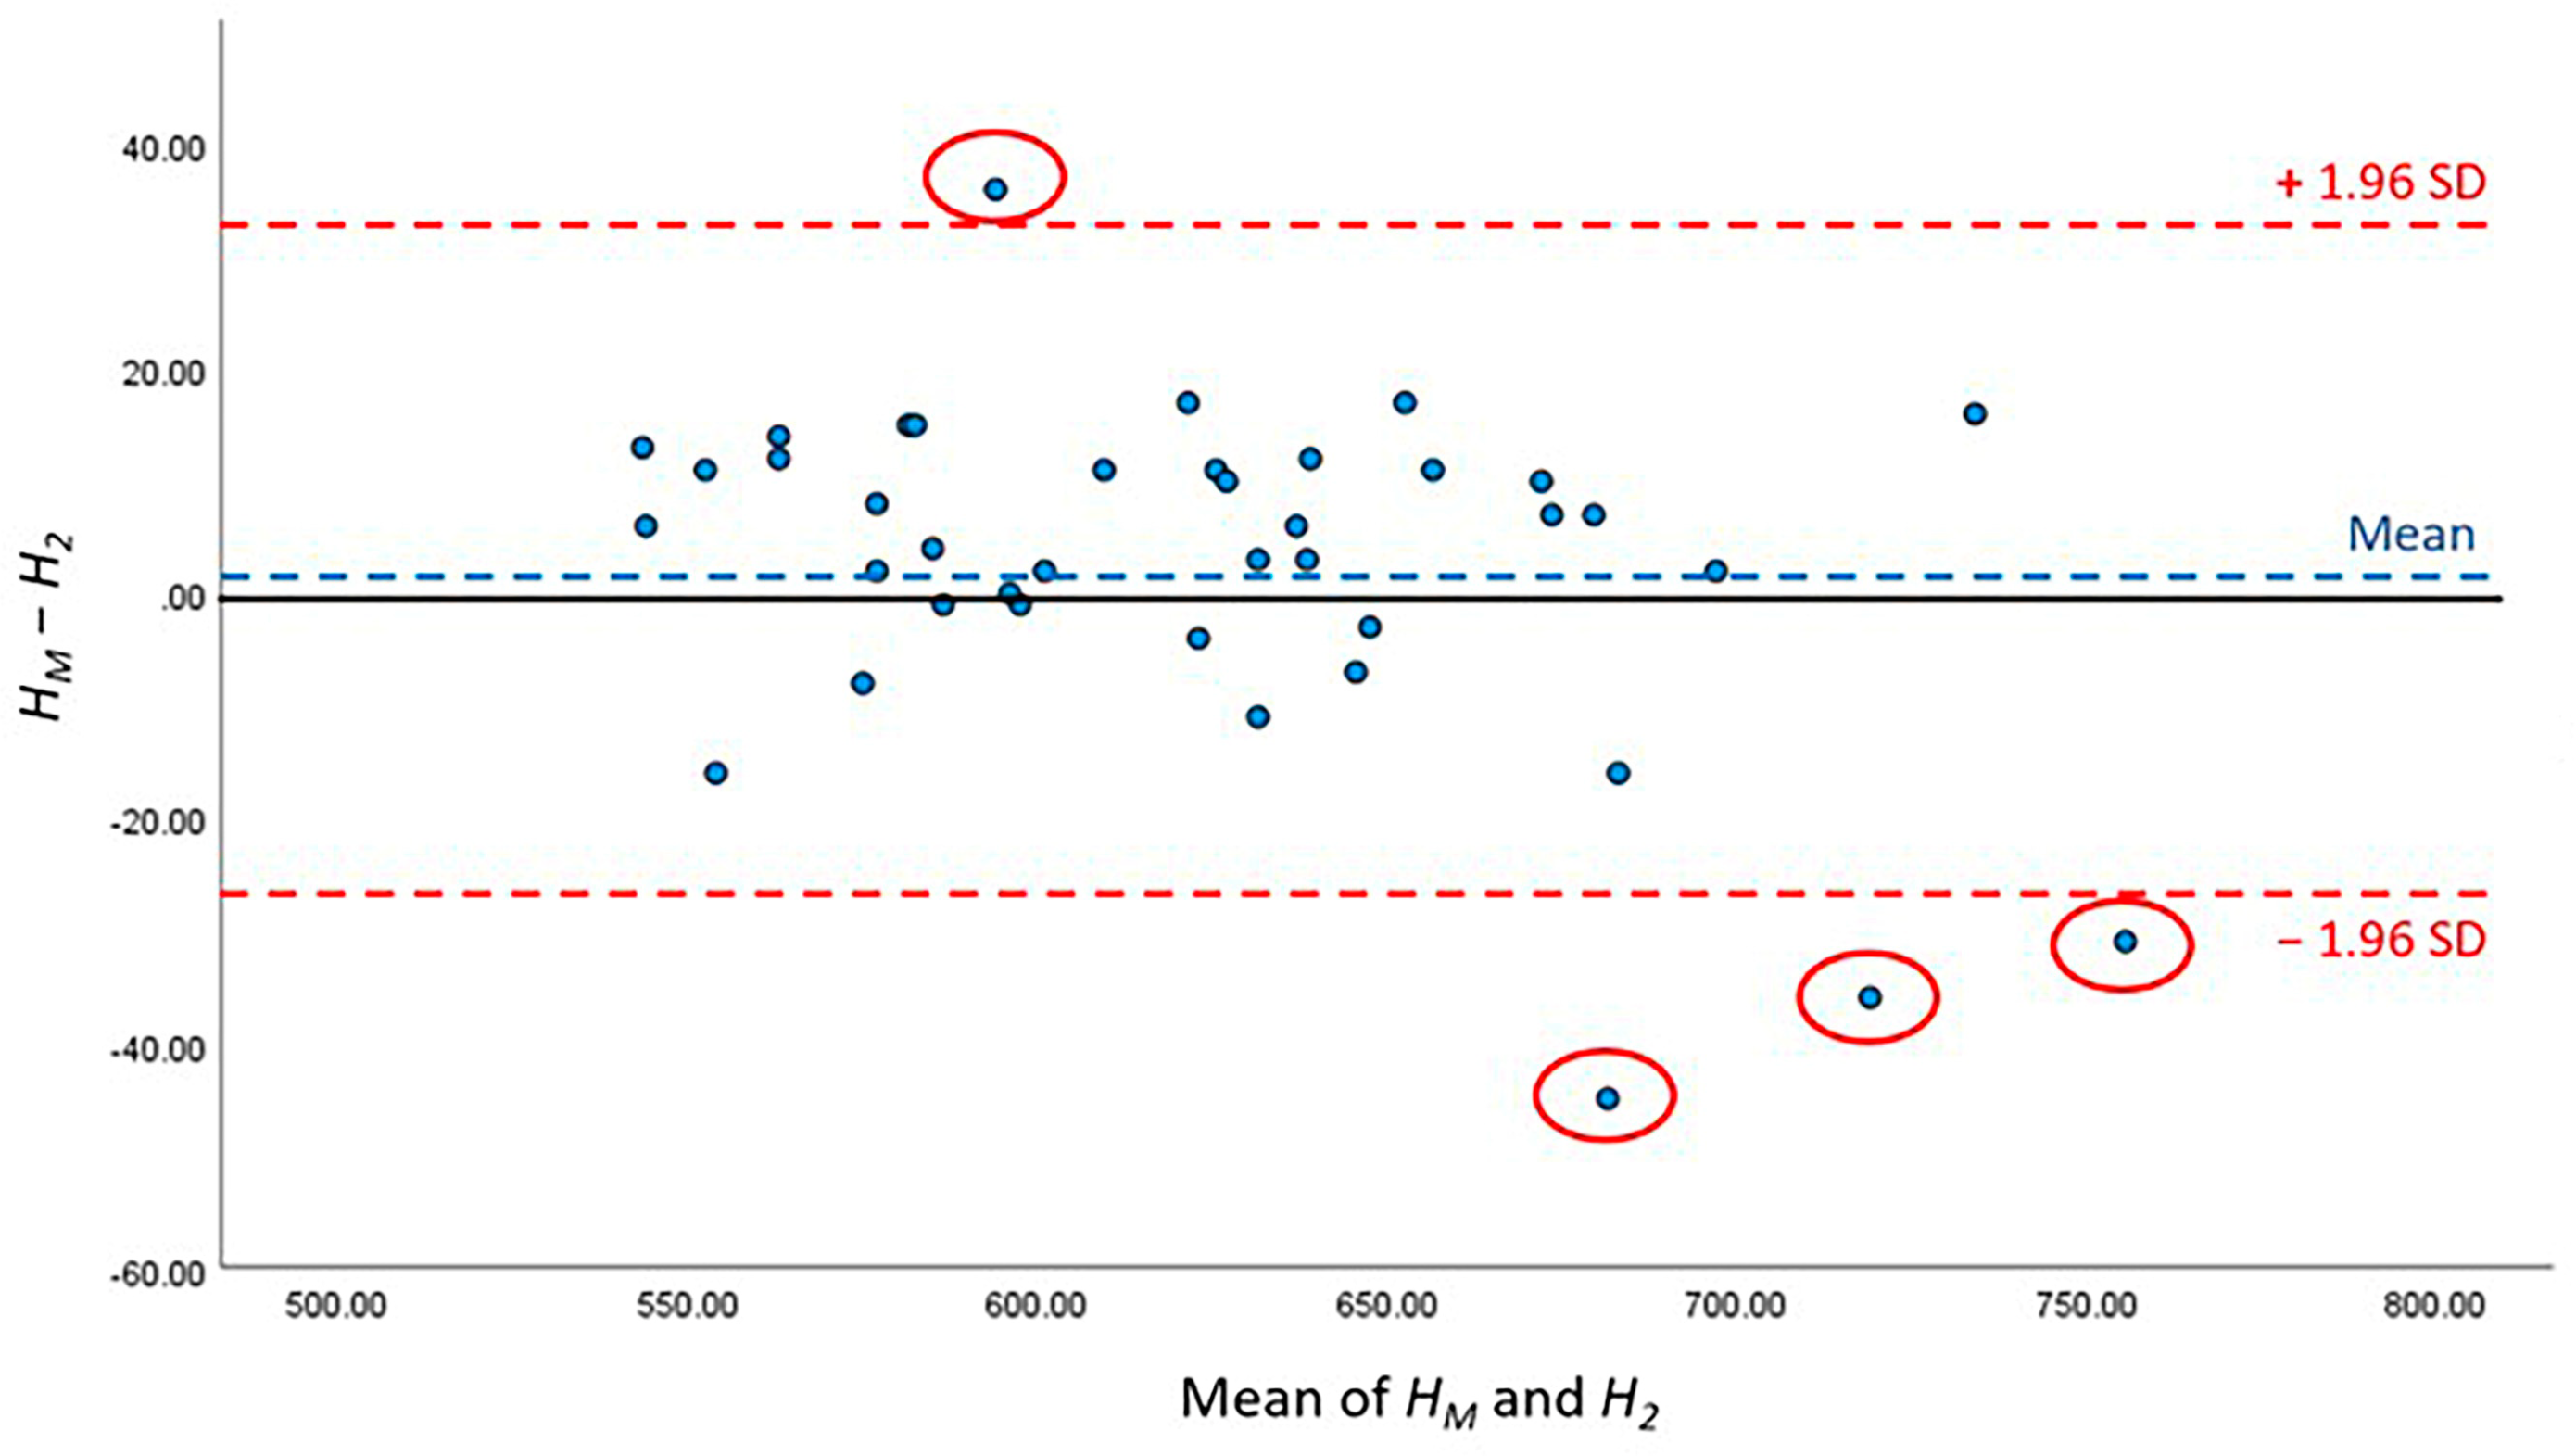
| Patient ID | HT (Pixel) | H1 (Pixel) | H2 (Pixel) | L1 (Pixel) | L2 (Pixel) | L1 (mm) | L2 (mm) |
|---|---|---|---|---|---|---|---|
| 1 | 701 | 685 | 737 | 16 | 36 | 3.52 | 7.91 |
| 2 | 642 | 633 | 649 | 9 | 7 | 1.98 | 1.54 |
| 3 | 612 | 668 | 576 | 56 | 36 | 12.31 | 7.91 |
| 4 | 547 | 551 | 541 | 4 | 6 | 0.88 | 1.32 |
| 5 | 597 | 599 | 598 | 2 | 1 | 0.44 | 0.22 |
| 6 | 589 | 601 | 574 | 12 | 15 | 2.64 | 3.3 |
| 7 | 587 | 583 | 583 | 4 | 4 | 0.88 | 0.88 |
| 8 | 640 | 645 | 634 | 5 | 6 | 1.1 | 1.32 |
| 9 | 742 | 763 | 726 | 21 | 16 | 4.62 | 3.52 |
| 10 | 662 | 660 | 651 | 2 | 11 | 0.44 | 2.42 |
| 11 | 550 | 559 | 537 | 9 | 13 | 1.98 | 2.86 |
| 12 | 615 | 629 | 604 | 14 | 11 | 3.08 | 2.42 |
| 13 | 640 | 640 | 637 | 0 | 3 | 0 | 0.66 |
| 14 | 590 | 601 | 575 | 11 | 15 | 2.42 | 3.3 |
| 15 | 571 | 569 | 579 | 2 | 8 | 0.44 | 1.76 |
| 16 | 578 | 583 | 576 | 5 | 2 | 1.1 | 0.44 |
| 17 | 633 | 628 | 630 | 5 | 3 | 1.1 | 0.66 |
| 18 | 569 | 568 | 557 | 1 | 12 | 0.22 | 2.64 |
| 19 | 558 | 563 | 547 | 5 | 11 | 1.1 | 2.42 |
| 20 | 645 | 658 | 633 | 13 | 12 | 2.86 | 2.64 |
| 21 | 675 | 663 | 691 | 12 | 16 | 2.64 | 3.52 |
| 22 | 581 | 571 | 573 | 10 | 8 | 2.2 | 1.76 |
| 23 | 740 | 717 | 771 | 23 | 31 | 5.05 | 6.81 |
| 24 | 631 | 625 | 620 | 6 | 11 | 1.32 | 2.42 |
| 25 | 632 | 629 | 622 | 3 | 10 | 0.66 | 2.2 |
| 26 | 630 | 639 | 613 | 9 | 17 | 1.98 | 3.74 |
| 27 | 677 | 679 | 667 | 2 | 10 | 0.44 | 2.2 |
| 28 | 626 | 626 | 637 | 0 | 11 | 0 | 2.42 |
| 29 | 621 | 613 | 625 | 8 | 4 | 1.76 | 0.88 |
| 30 | 546 | 531 | 562 | 15 | 16 | 3.3 | 3.52 |
| 31 | 596 | 599 | 596 | 3 | 0 | 0.66 | 0 |
| 32 | 570 | 565 | 556 | 5 | 14 | 1.1 | 3.08 |
| 33 | 602 | 596 | 600 | 6 | 2 | 1.32 | 0.44 |
| 34 | 683 | 679 | 676 | 4 | 7 | 0.88 | 1.54 |
| 35 | 677 | 677 | 670 | 0 | 7 | 0 | 1.54 |
| 36 | 698 | 699 | 696 | 1 | 2 | 0.22 | 0.44 |
| 37 | 659 | 630 | 704 | 29 | 45 | 6.37 | 9.89 |
| 38 | 661 | 673 | 644 | 12 | 17 | 2.64 | 3.74 |
| 39 | 586 | 581 | 587 | 5 | 1 | 1.1 | 0.22 |
| 40 | 646 | 651 | 649 | 5 | 3 | 1.1 | 0.66 |
| Mean | 625.13 | 625.73 | 622.58 | 8.85 | 11.50 | 1.95 | 2.53 |
| SD | 50.24 | 50.38 | 56.27 | 10.07 | 10.08 | 2.21 | 2.21 |
Disclaimer/Publisher’s Note: The statements, opinions and data contained in all publications are solely those of the individual author(s) and contributor(s) and not of MDPI and/or the editor(s). MDPI and/or the editor(s) disclaim responsibility for any injury to people or property resulting from any ideas, methods, instructions or products referred to in the content. |
© 2023 by the authors. Licensee MDPI, Basel, Switzerland. This article is an open access article distributed under the terms and conditions of the Creative Commons Attribution (CC BY) license (https://creativecommons.org/licenses/by/4.0/).
Share and Cite
Chu, G.; Zhang, R.; He, Y.; Ng, C.H.; Gu, M.; Leung, Y.Y.; He, H.; Yang, Y. Deep Learning Models for Automatic Upper Airway Segmentation and Minimum Cross-Sectional Area Localisation in Two-Dimensional Images. Bioengineering 2023, 10, 915. https://doi.org/10.3390/bioengineering10080915
Chu G, Zhang R, He Y, Ng CH, Gu M, Leung YY, He H, Yang Y. Deep Learning Models for Automatic Upper Airway Segmentation and Minimum Cross-Sectional Area Localisation in Two-Dimensional Images. Bioengineering. 2023; 10(8):915. https://doi.org/10.3390/bioengineering10080915
Chicago/Turabian StyleChu, Guang, Rongzhao Zhang, Yingqing He, Chun Hown Ng, Min Gu, Yiu Yan Leung, Hong He, and Yanqi Yang. 2023. "Deep Learning Models for Automatic Upper Airway Segmentation and Minimum Cross-Sectional Area Localisation in Two-Dimensional Images" Bioengineering 10, no. 8: 915. https://doi.org/10.3390/bioengineering10080915