Article

Flood Mitigation Measure and Water Storage in East Africa: An Analysis for the Rio Muaguide, Mozambique

1
Politecnico di Milano, DICA, 20133 Milan, Italy
2
DiZeta Ingegneria, 20133 Milan, Italy
3
Istituto OIKOS, 20134 Milan, Italy
4
Department of Earth and Environmental Sciences, Università degli Studi di Milano Bicocca, DISAT, 20126 Milan, Italy
5
Helvetas, 8021 Zürich, Switzerland
*
Author to whom correspondence should be addressed.
Hydrology 2021, 8(2), 92; https://doi.org/10.3390/hydrology8020092
Submission received: 27 April 2021 / Revised: 8 June 2021 / Accepted: 9 June 2021 / Published: 11 June 2021

Abstract

:
In the last century, floods have been more frequently hitting population and human activity, especially in the sub-Saharan context. The aim of this study is to propose suitable flood mitigation measures for the downstream part of the Rio Muaguide, which flows in northern Mozambique. In this terminal part of the river, the bed has been buried by sediment in many reaches; due to the reduction of the section conveyance, wide areas are inundated during the rainy season with negative consequences for several villages relying on subsistence agriculture. The design of any measure requires quantitative determinations but, as many less developed countries, Mozambique is affected by data scarcity. Therefore, in this study global and freely available data have been used to perform hydrologic and two-dimensional hydro-dynamic modelling, finally producing a flood hazard map. Particular care has been put into a critical analysis of several data sources, in terms of their suitability for the purposes of the work. Based on the modelling results and on field evidence, an intervention has been proposed with a double functionality of mitigating the effects of periodic floods and storing water to be used by the agricultural community during drier seasons. The proposed intervention combines restoring a sedimentation-less shape of the river sections and exploiting a natural basin as a storage basin. The methods applied and the intervention proposed for the Rio Muaguide are prototypal for several analogous streams in the coastal portion of Mozambique.

1. Introduction

Natural catastrophes due to climate change are increasing every year in terms of intensity and frequency. The poorest countries are most vulnerable, because means and awareness are much lower than in developed regions. In less developed countries, a key role in adaptation to climate change is played by NGO’s and by humanitarian/ environmentalist groups. Many of these countries are in sub-Saharan Africa, where 55% of the population lives in both extreme poverty and high flood risk [1] and 5% live in areas where droughts have catastrophic impacts on cropland. Even if this percentage may sound small, it means that 50 million people live in severely water-constrained agricultural areas [2]. In particular, Mozambique is one of the 10 countries with the largest number of poor people exposed to significant flood risk [1]. In the last years, tropical cyclones have affected the country, causing large flooded areas and hitting the population and activities. Only in 2019, two consecutive cyclones (Idai and Kenneth) hit Mozambique affecting more than 2.2 million people with a death toll of 648 [3]. Furthermore, in January 2021 another major cyclone (Eloise) struck the country and, according to the United Nations Office for the Coordination of Humanitarian Affairs (OCHA) preliminary reports [4], nearly 7000 people were displaced, and more than 5000 houses were damaged. Apart from cyclones, the country is affected by large floods during the rainy season (from November to April) with water remaining on the ground for long periods. Due to its long coast, finally, Mozambique is disseminated with rivers flowing eastward into the Indian Ocean, which multiplies the instances of flood-related issues.
Methods and tools to mitigate the negative consequences of floods are not fully mature in less developed countries. Therefore, one cannot aim at mitigating all situations, while some test streams can be considered in specific projects to develop prototypal solutions. The present study is thus focused onto the Rio Muaguide, which flows through Cabo Delgado (the northeast province of Mozambique, see Figure 1). The Rio Muaguide flows into the Indian Ocean near the city of Pemba, the capital of the province. In particular, the study area is located in the Metuge district, in the downstream part of the river, close to a 13 km reach which extends from the village of Nacuta to that of Nuamapala. Both villages are reached by flooding water during high-flow events. This region has been selected for the analysis because local authorities have recognized it as prone to flood; it is an agricultural area where tomatoes, cucumber, sugarcane and manioc are mostly cultivated. The crops are crossed by multiple sub-reaches, diverting from a principal channel. In fact, during the rainy season, the river carries a large amount of sand that deposits in this zone due to favourably low slope. Moreover, during high flows, the bank erosion determines a further availability of sediment for deposition. As a consequence, the river section is buried with sediment at several spots, increasing the likelihood of water taking multiple paths, thus enlarging the flooded area with higher risk for local villages.
Furthermore, according to the IWMI (International Water Management Institute) report [5] Mozambique is among the countries with greatest need for water storage. Therefore, the objective of the present study has been to propose an intervention able to achieve a dual purpose of flood prevention (the primary aim) and water harvesting [6]. In fact, in Africa 70% of the population is agriculture-dependent [7] and water availability is a crucial issue for many rural communities. In these contexts, a spate irrigation system could be a best solution, guaranteeing livelihood and increasing the people’s adaptive capacity to climate change [8,9,10,11,12,13]. However, in order to quantitatively support the proposal of a flood mitigation measure, the hazard assessment is of primary importance [14,15]. The latter requires a particular effort due to the data scarcity that typically characterizes less developed countries [16,17]. In this study a coupled hydrological and hydraulic model is presented, which provides improvement in floodplain simulation, especially in data scarce regions [18]. The study presented in this manuscript is part of a cooperation project called ADAPT, funded by the Italian Agency for Cooperation to Development. ADAPT took place in 2017–2020 with a primary objective of improving the local adaptation to the negative effects of climate change in two areas of Mozambique. The present manuscript, therefore, does not relate to a specific research (for example, the scaling properties of any hydrological process) but rather to a comprehensive application of known approaches to a real-world relevant case.
The manuscript is structured as follows. It first provides a description of the hydraulic conditions of the study area, mostly based on field evidence collected during a post-cyclone mission in 2019. Secondly, it describes the open data collected to support the quantitative analysis, and the used models. Third, the result of the hazard assessment is presented and compared to flood maps produced using satellite images of the cyclone Kenneth. Fourth, a mitigation measure is proposed in terms of restoring the river conveyance and exploiting an existing natural basin for water storage. The advantages of the proposed intervention as a win-win measure and the limitations of the approach are finally discussed.

2. Materials and Methods

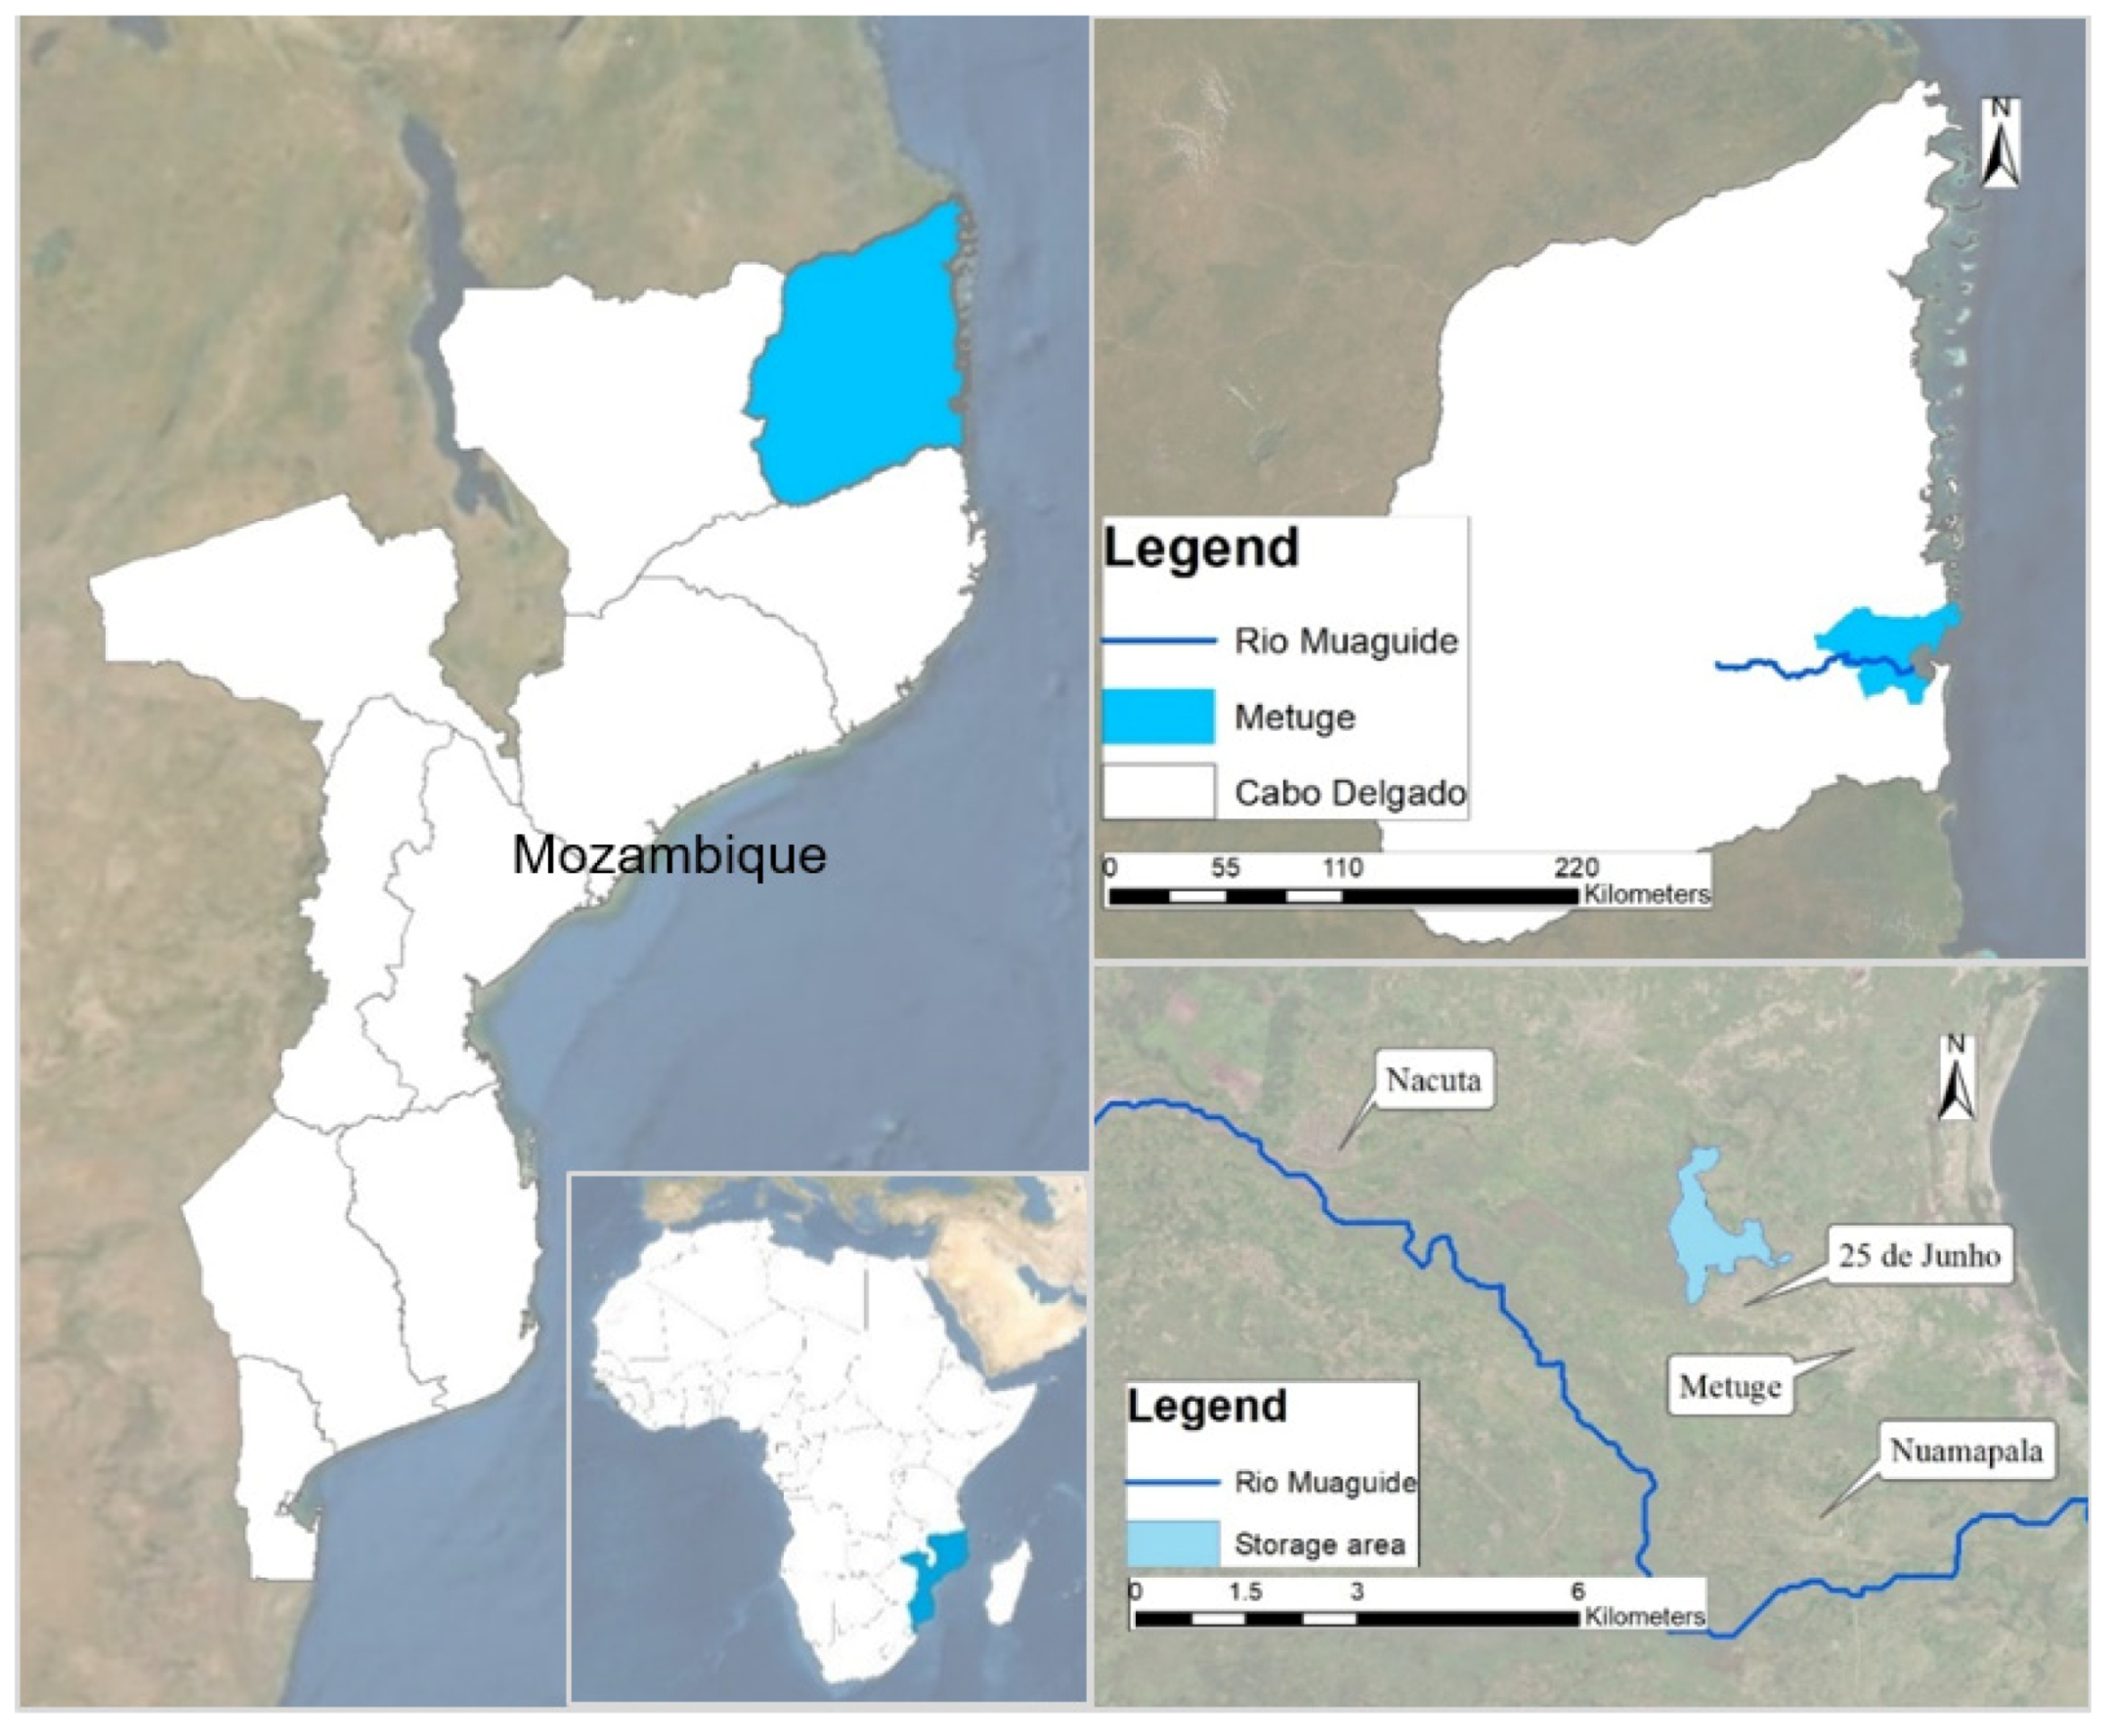
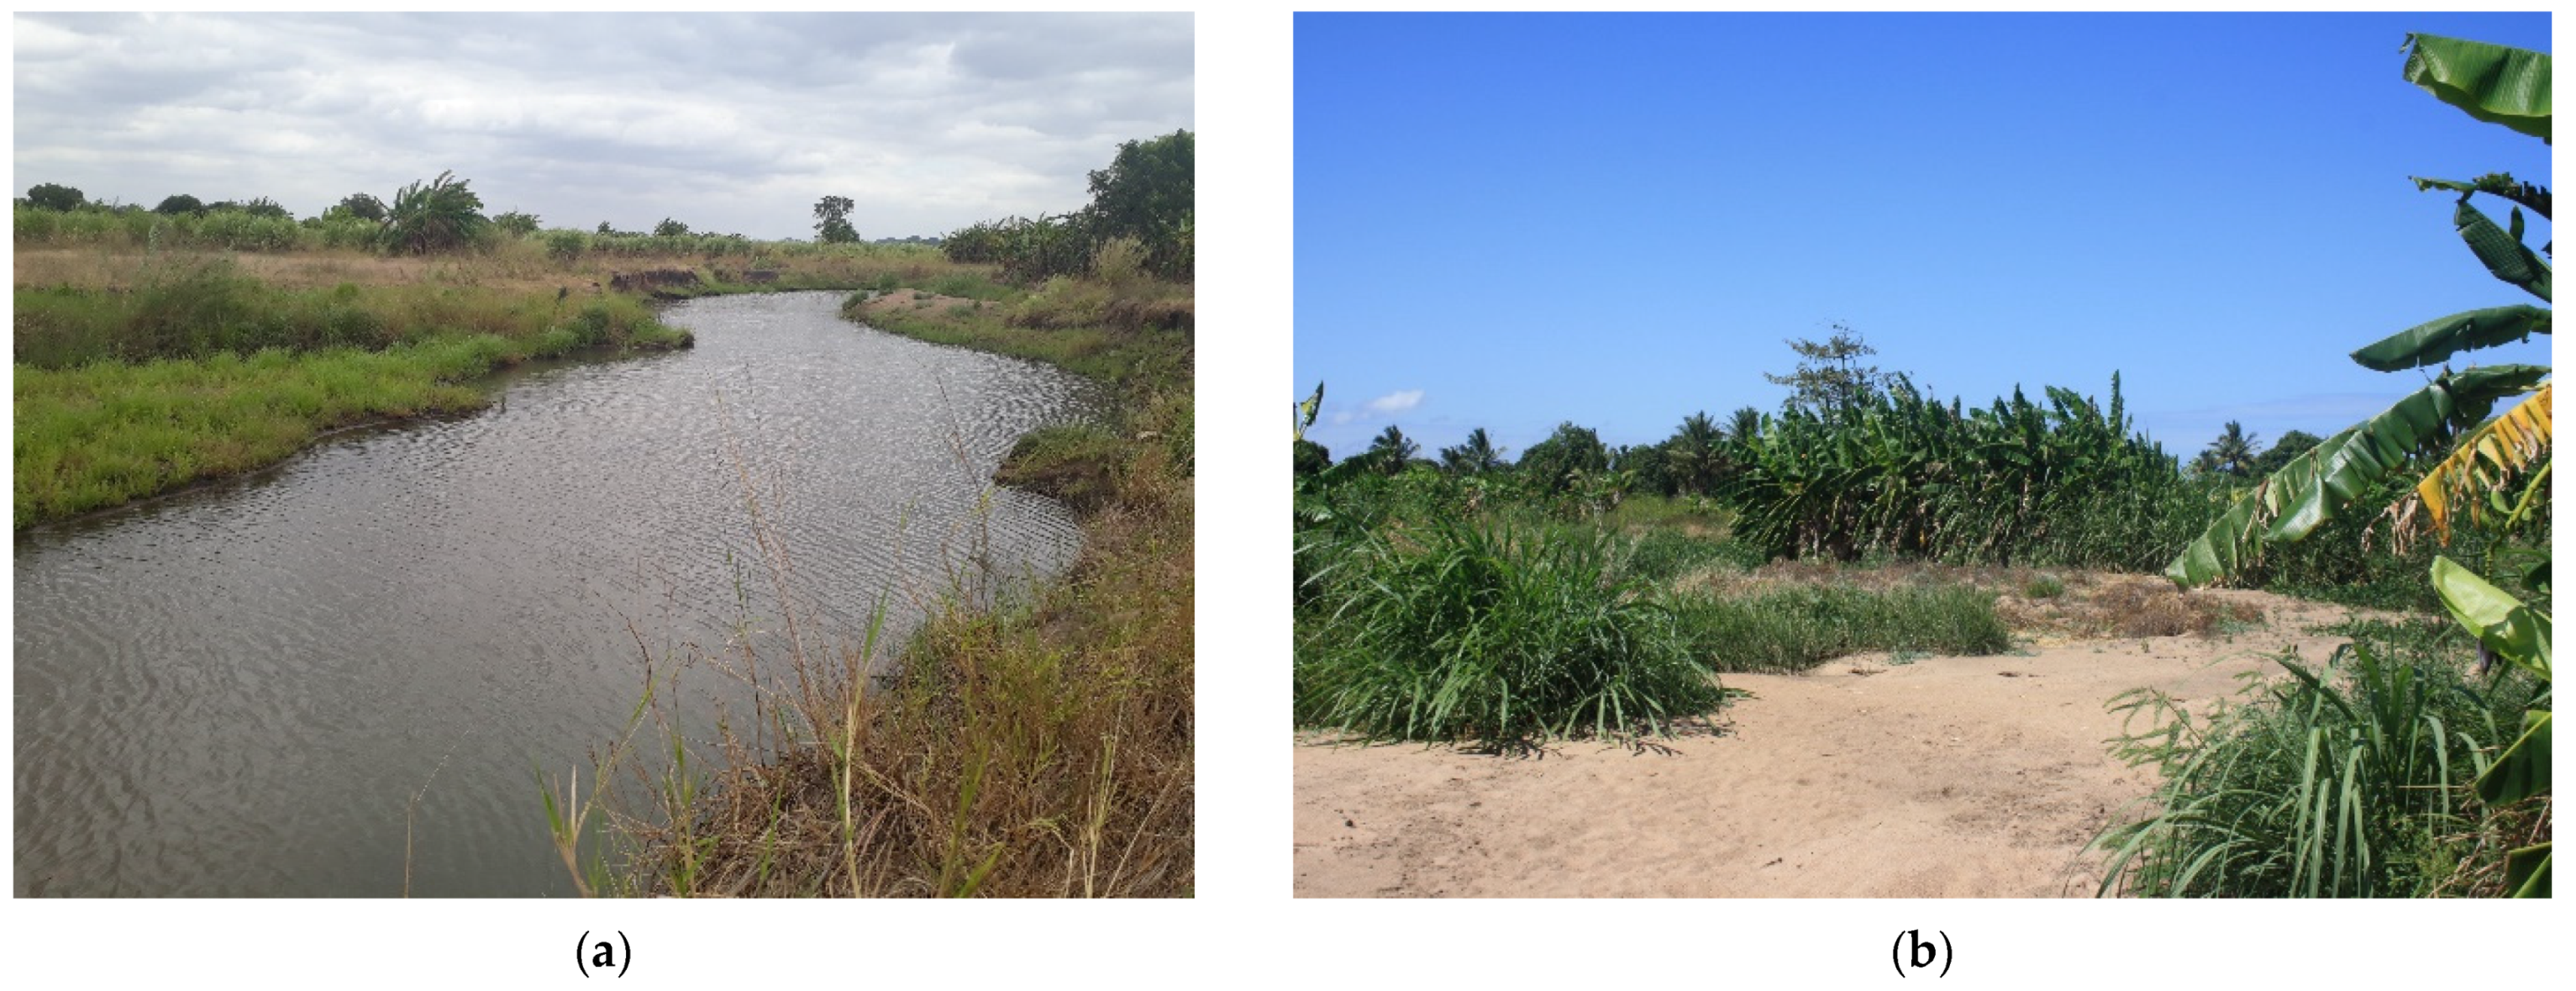
2.1. Hydraulic Conditions of the Study Site

A field survey of the area of interest was undertaken in September 2019, by which relevant observations, data and testimony of the population were collected. The survey was carried out a few months after the occurrence of cyclone Kenneth; walking along several sub-reaches of the Rio Muaguide and carrying a GPS receiver, it was possible to geolocate crucial spots. As already explained, the area is characterized by different channels diverting from the principal one, so the field trip was organized along different directions. The decision of exploring the specific routes depicted in Figure 2a was based on some paths detected on satellite images (even if with poor visibility due to a low resolution), on the evidence of the river network extracted from different Digital Elevation Models (DEMs, described later) on a hazard map (also shown later), and on the flooded area caused by cyclone Kenneth. The latter area is indicated with the red contour in the map of Figure 2a and has been obtained processing satellite images taken before/after the event; image processing has been performed with SNAP (http://step.esa.int/main/toolboxes/snap/, accessed on 19 May 2019), a free tool developed by the European Space Agency (ESA).
After the field survey, and also thanks to a collected photographic documentation of the vegetation and of the soil covering the area, an evaluation of the river functionality has been performed. The results have brought out four classes depicted in Figure 2b that represents the riverbed condition in several portions of the surveyed reaches. The latter have been ranked from poor condition, for a densely vegetated reach with few spots of water and where banks are almost absent, to a very good condition for stretches with water and well-defined banks (Figure 3). These stretches, maybe excavated by the high flow during cyclone Kenneth, originate from and soon evolve into a network of small streams, defined as in fair condition.
Finally, a key component of the river system is the natural reservoir near the village of 25 de Junho (Figure 1). At the time of the mission this natural reservoir contained a limited amount of water (since the trip was almost at the end of the dry season) but, during intense events, this basin works as a natural storage area for the water carried by the sub-reach investigated on 26 September. By interviewing the local population, it was ascertained that the water of this storage area is an extremely valuable resource for farmers during dry periods.

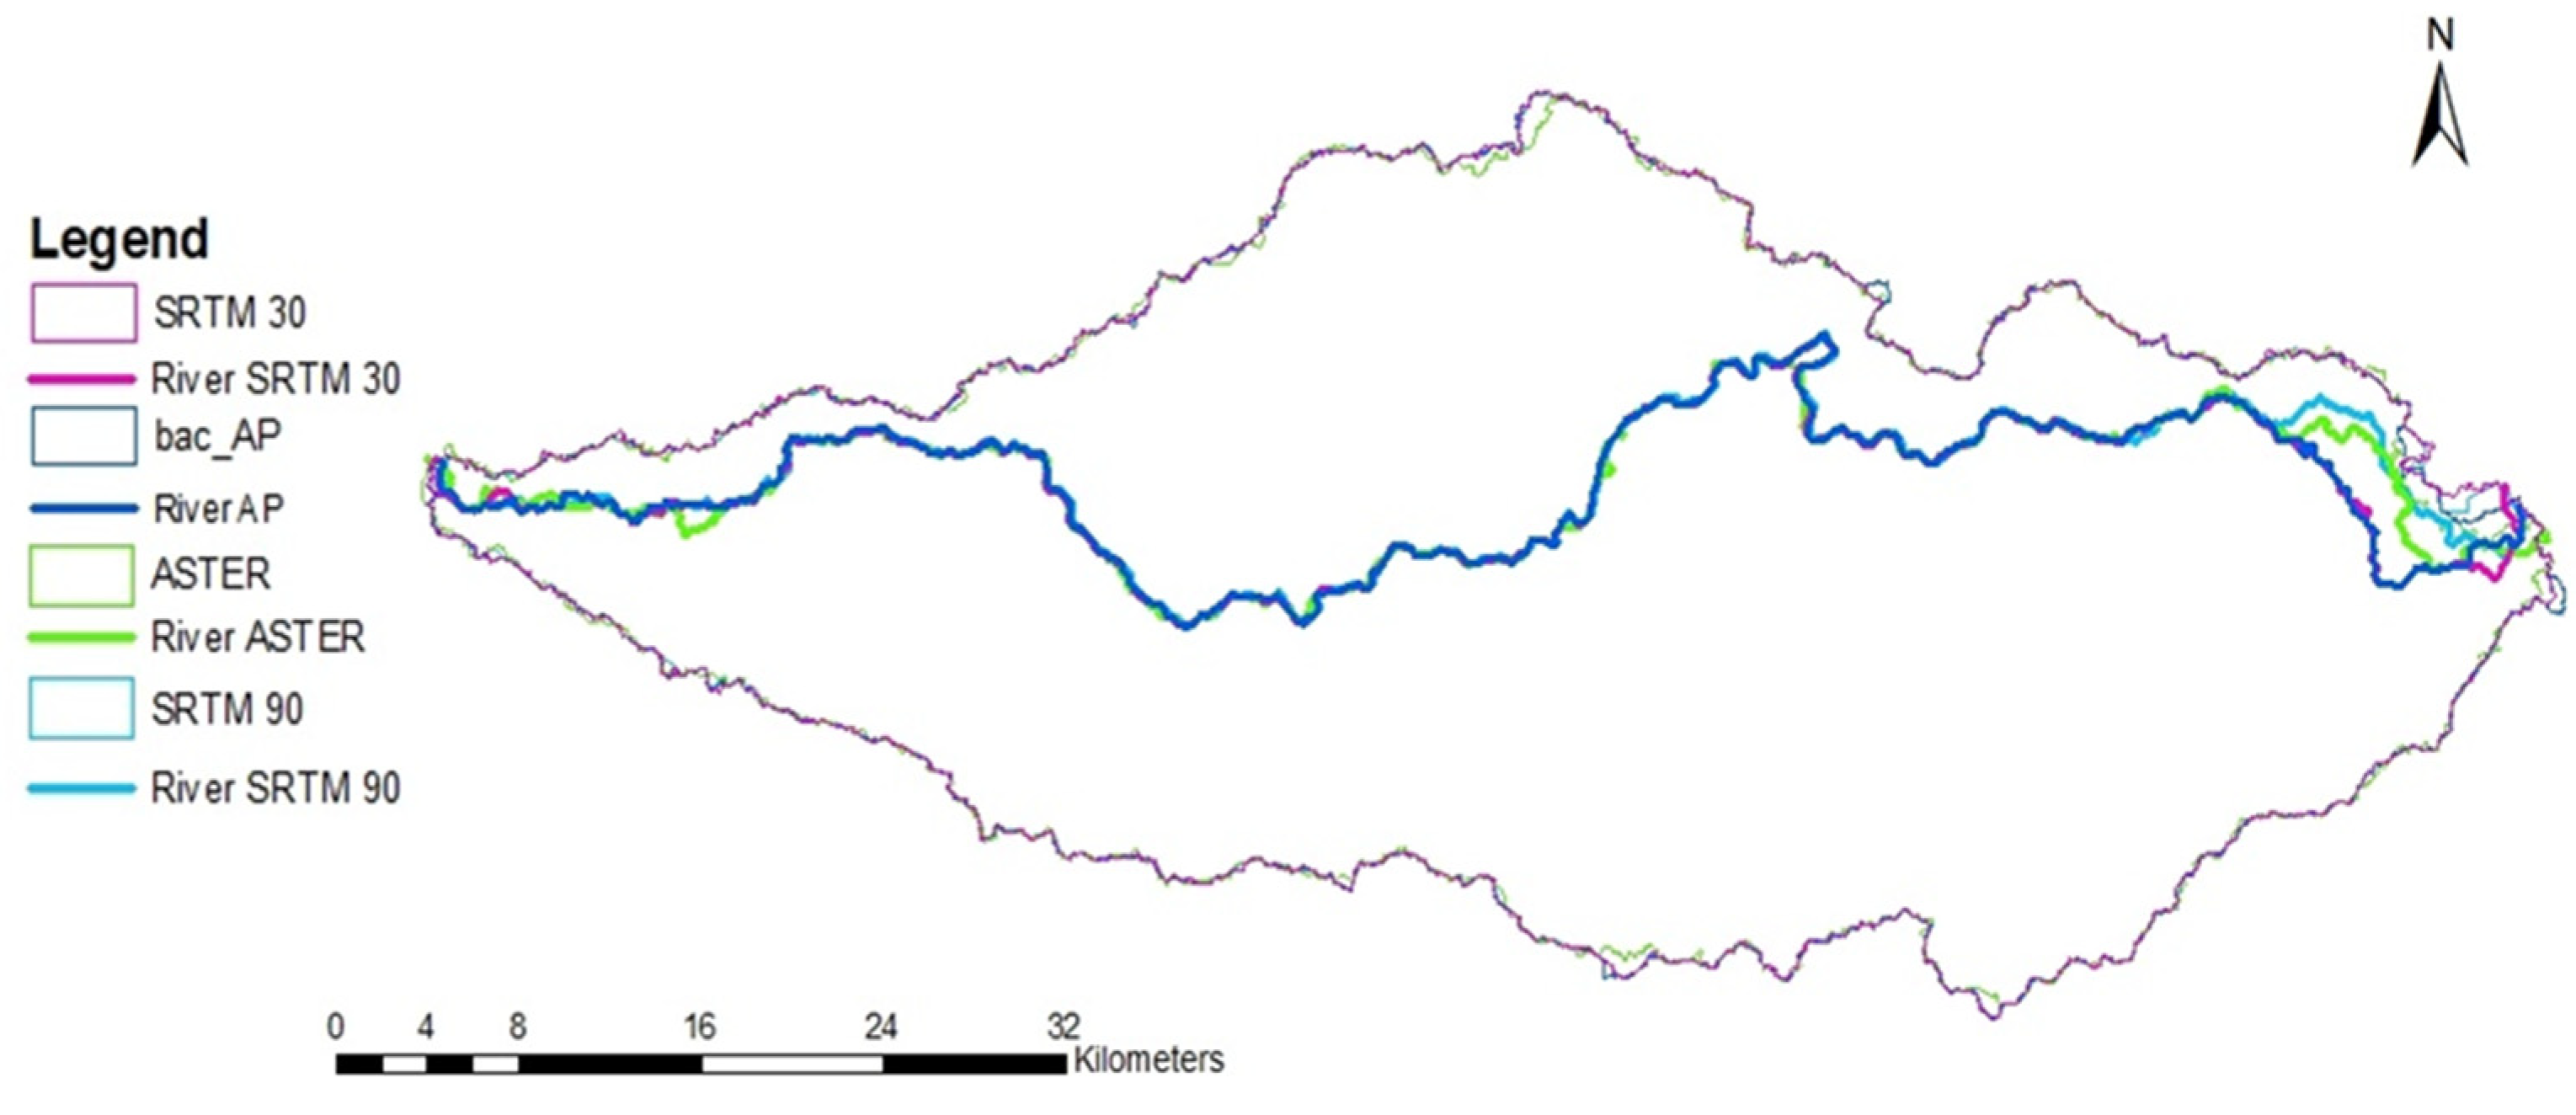
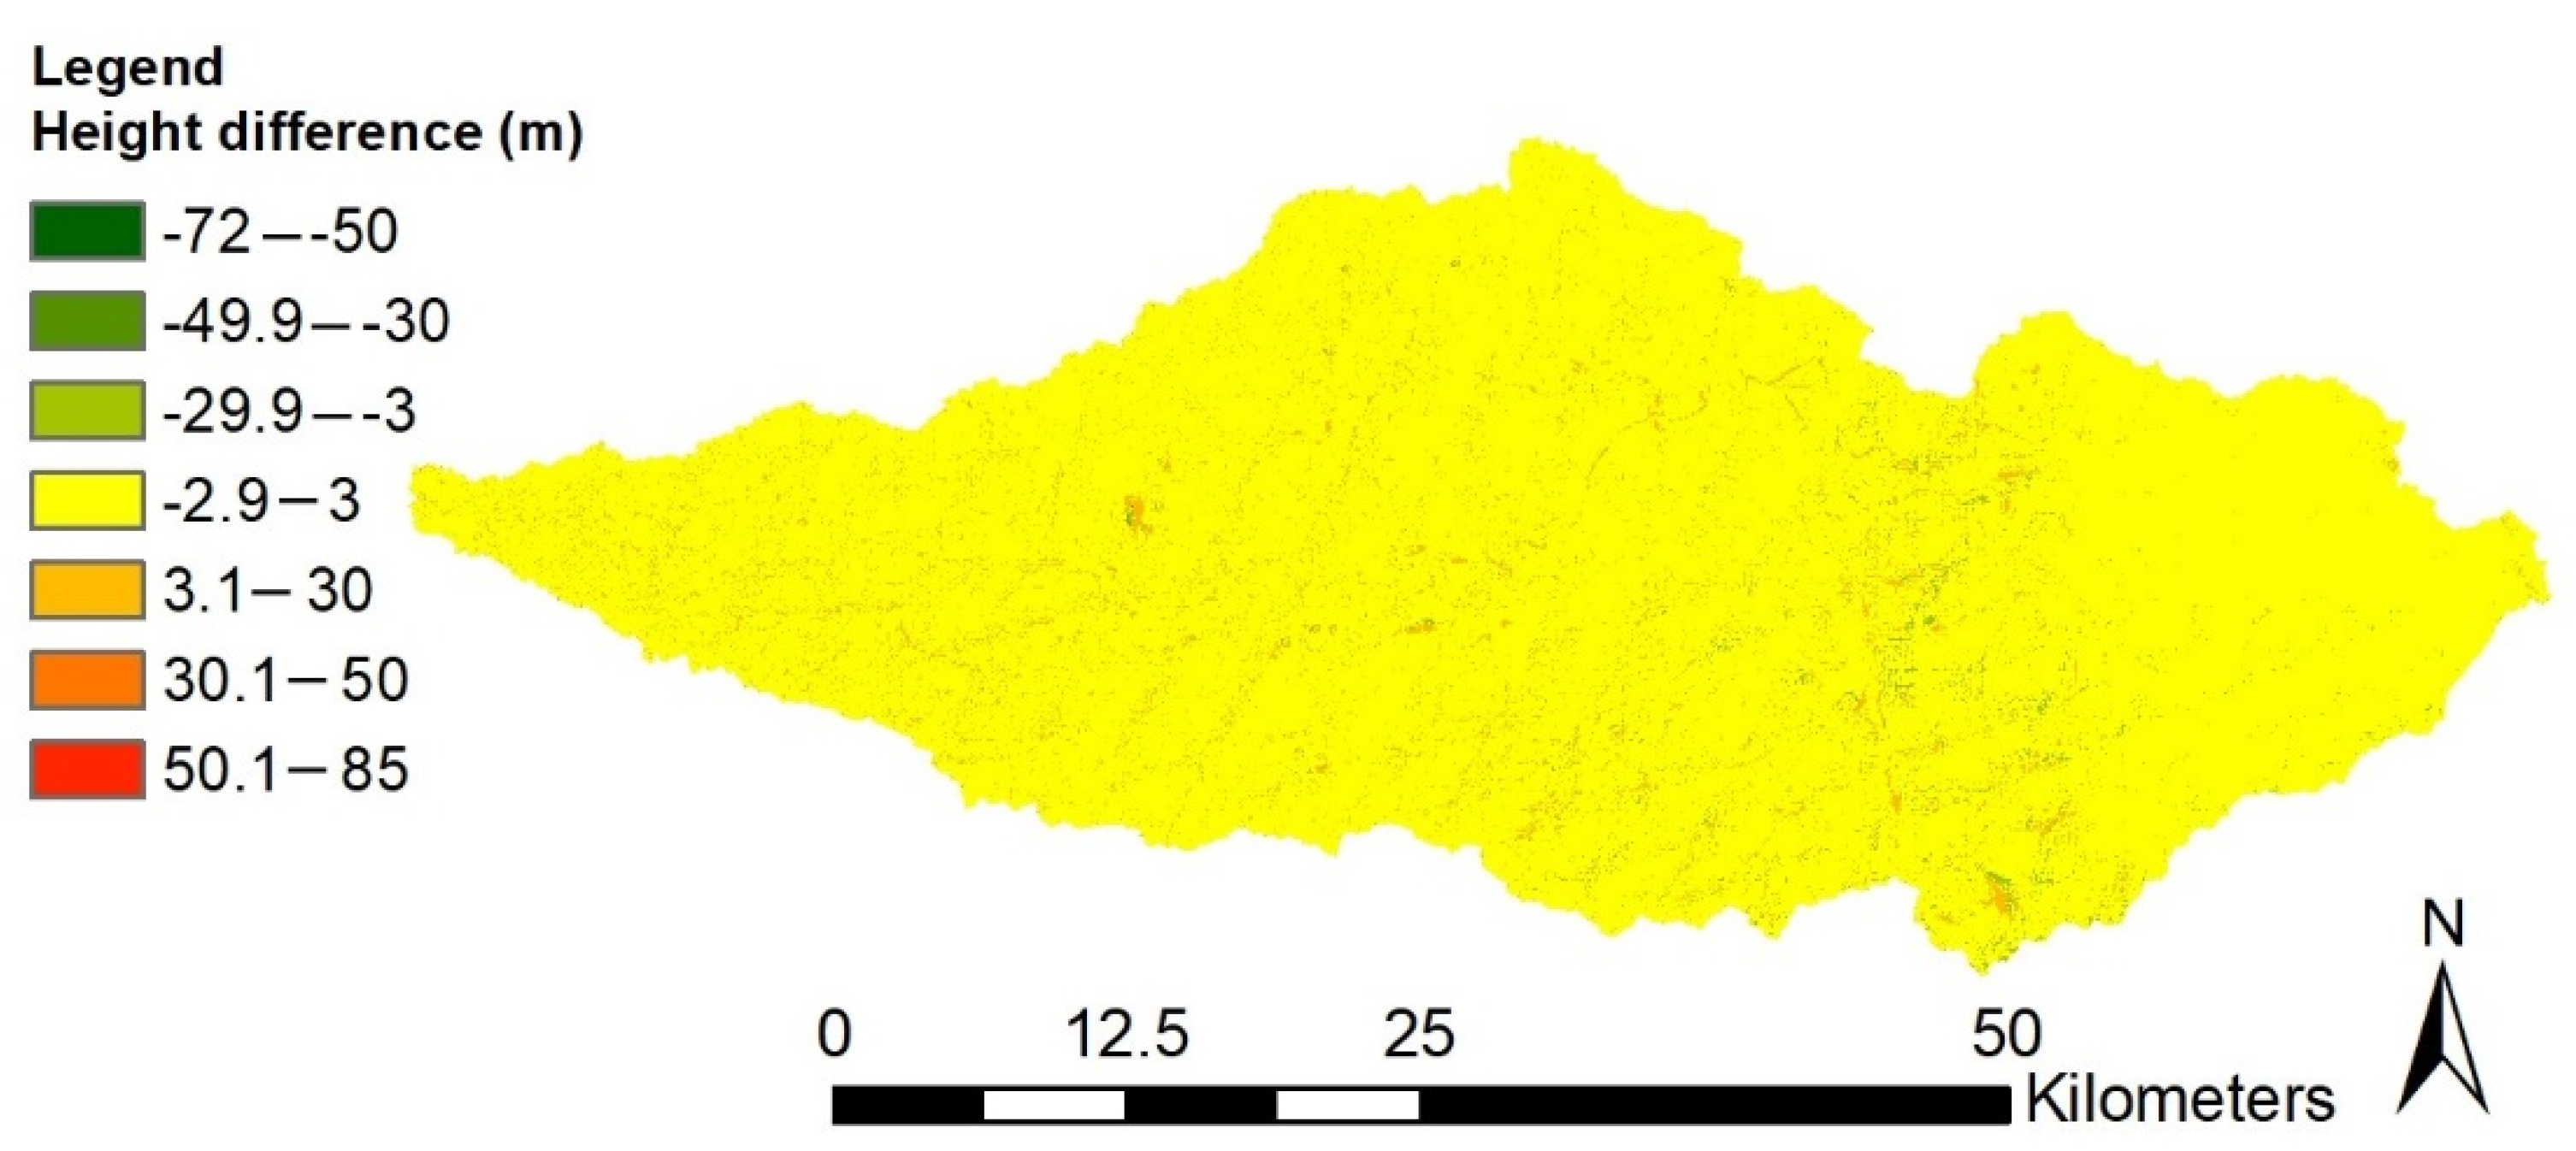
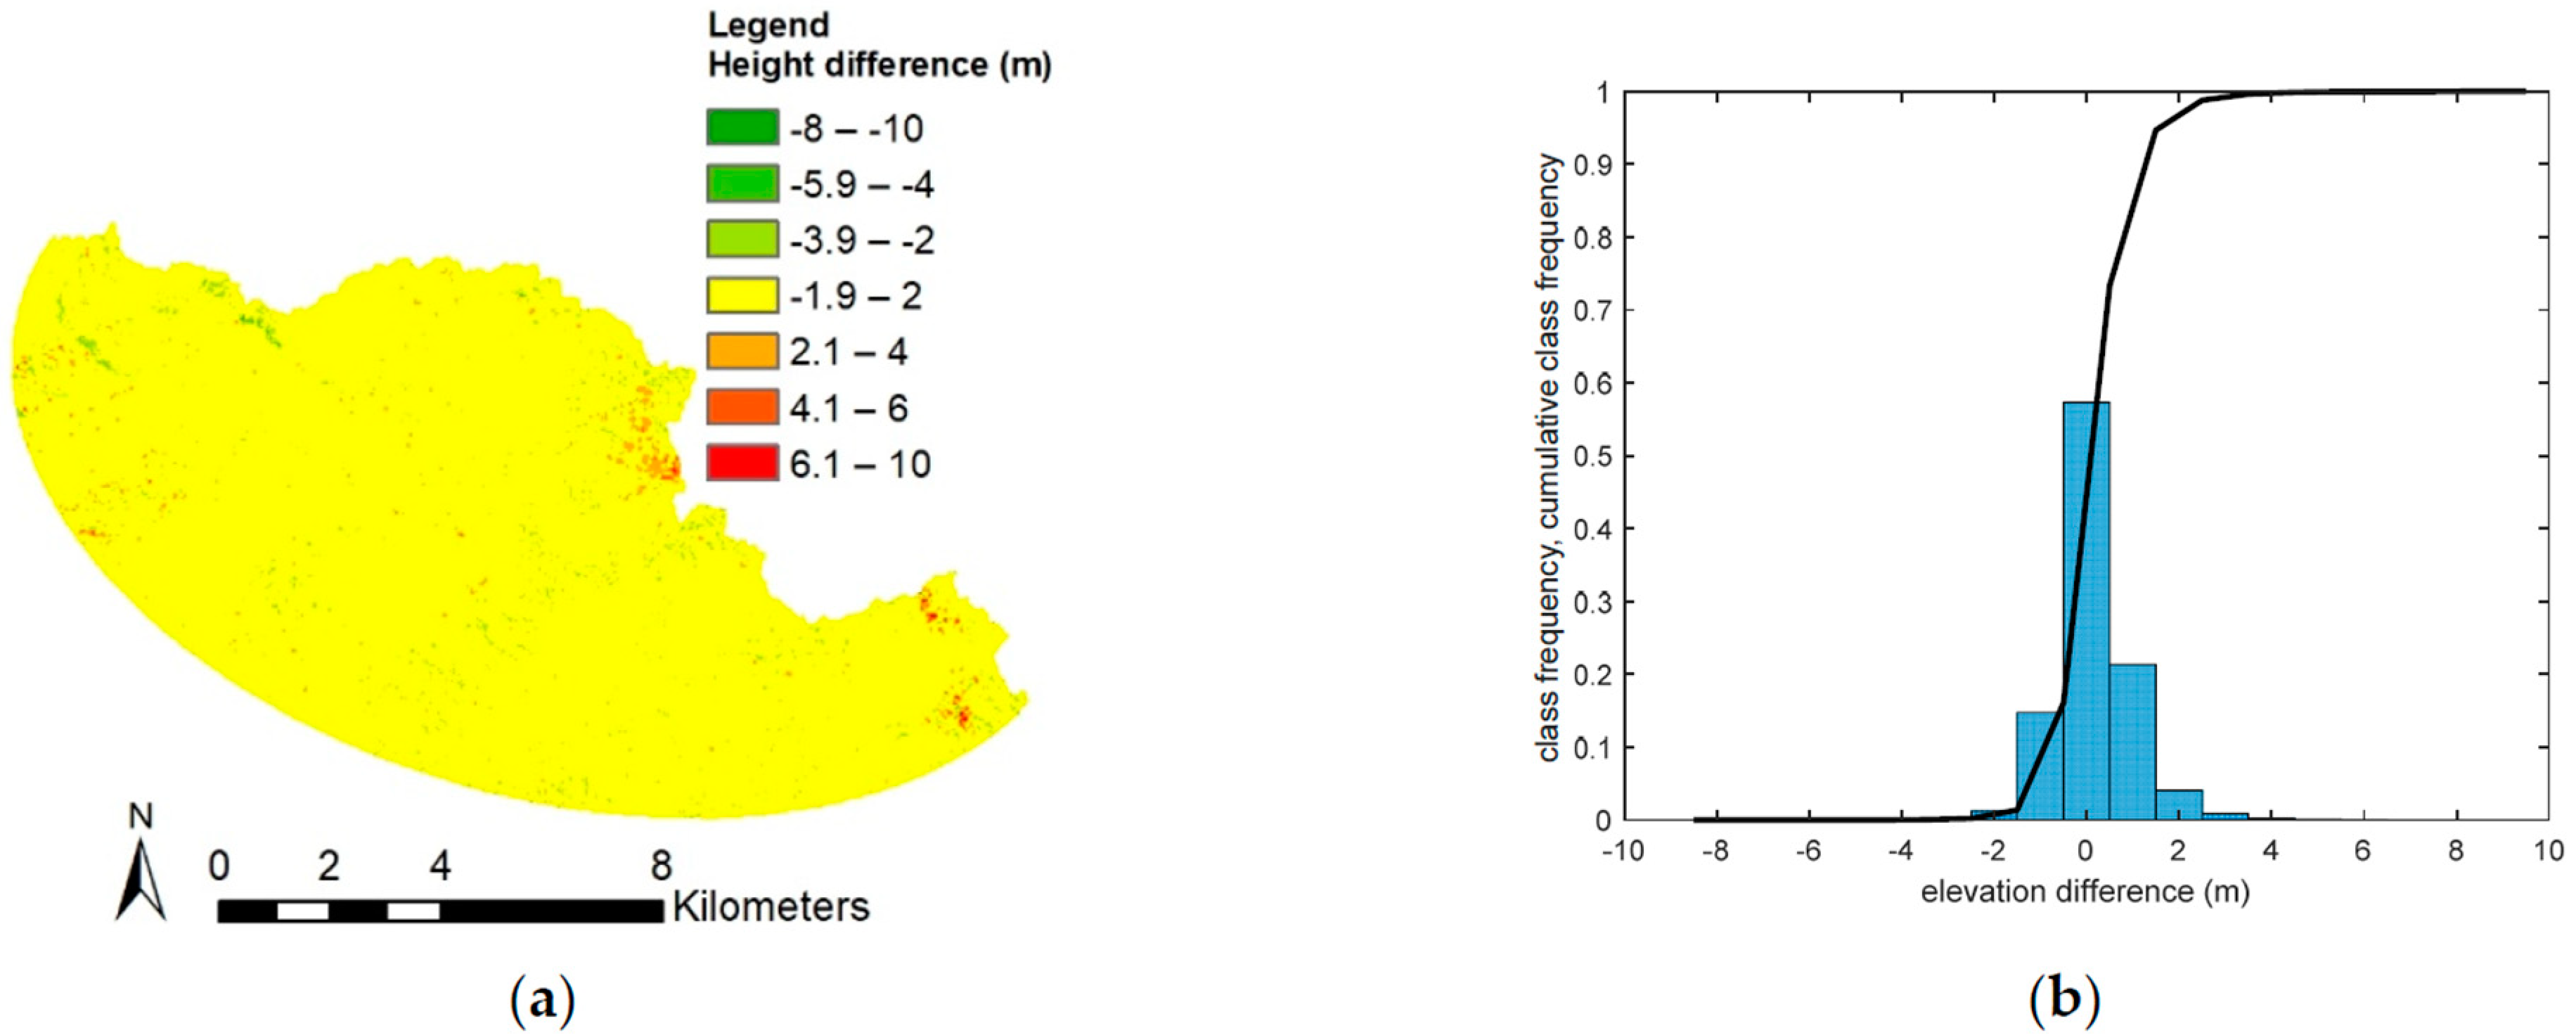
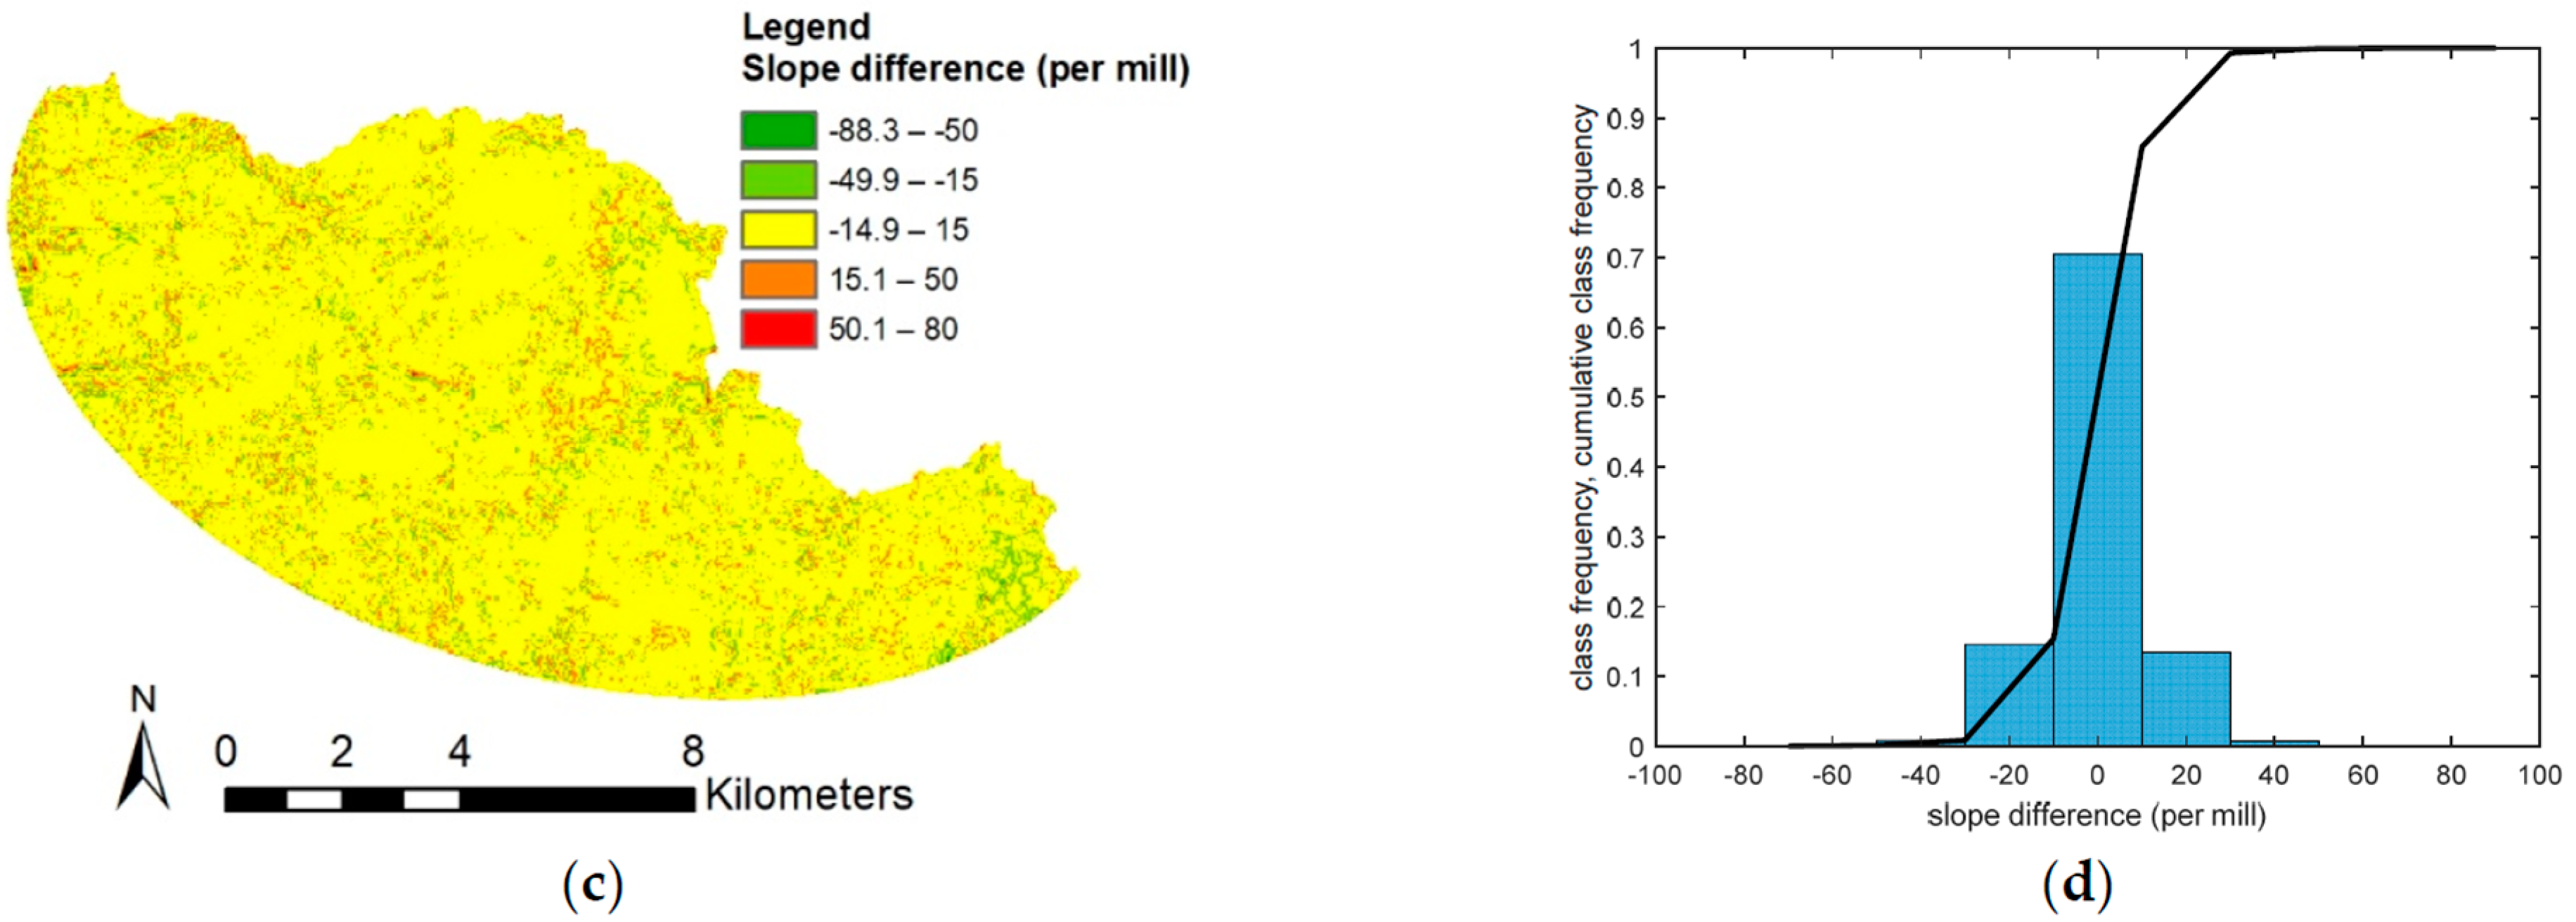
2.2. Data from Digital Elevation Models
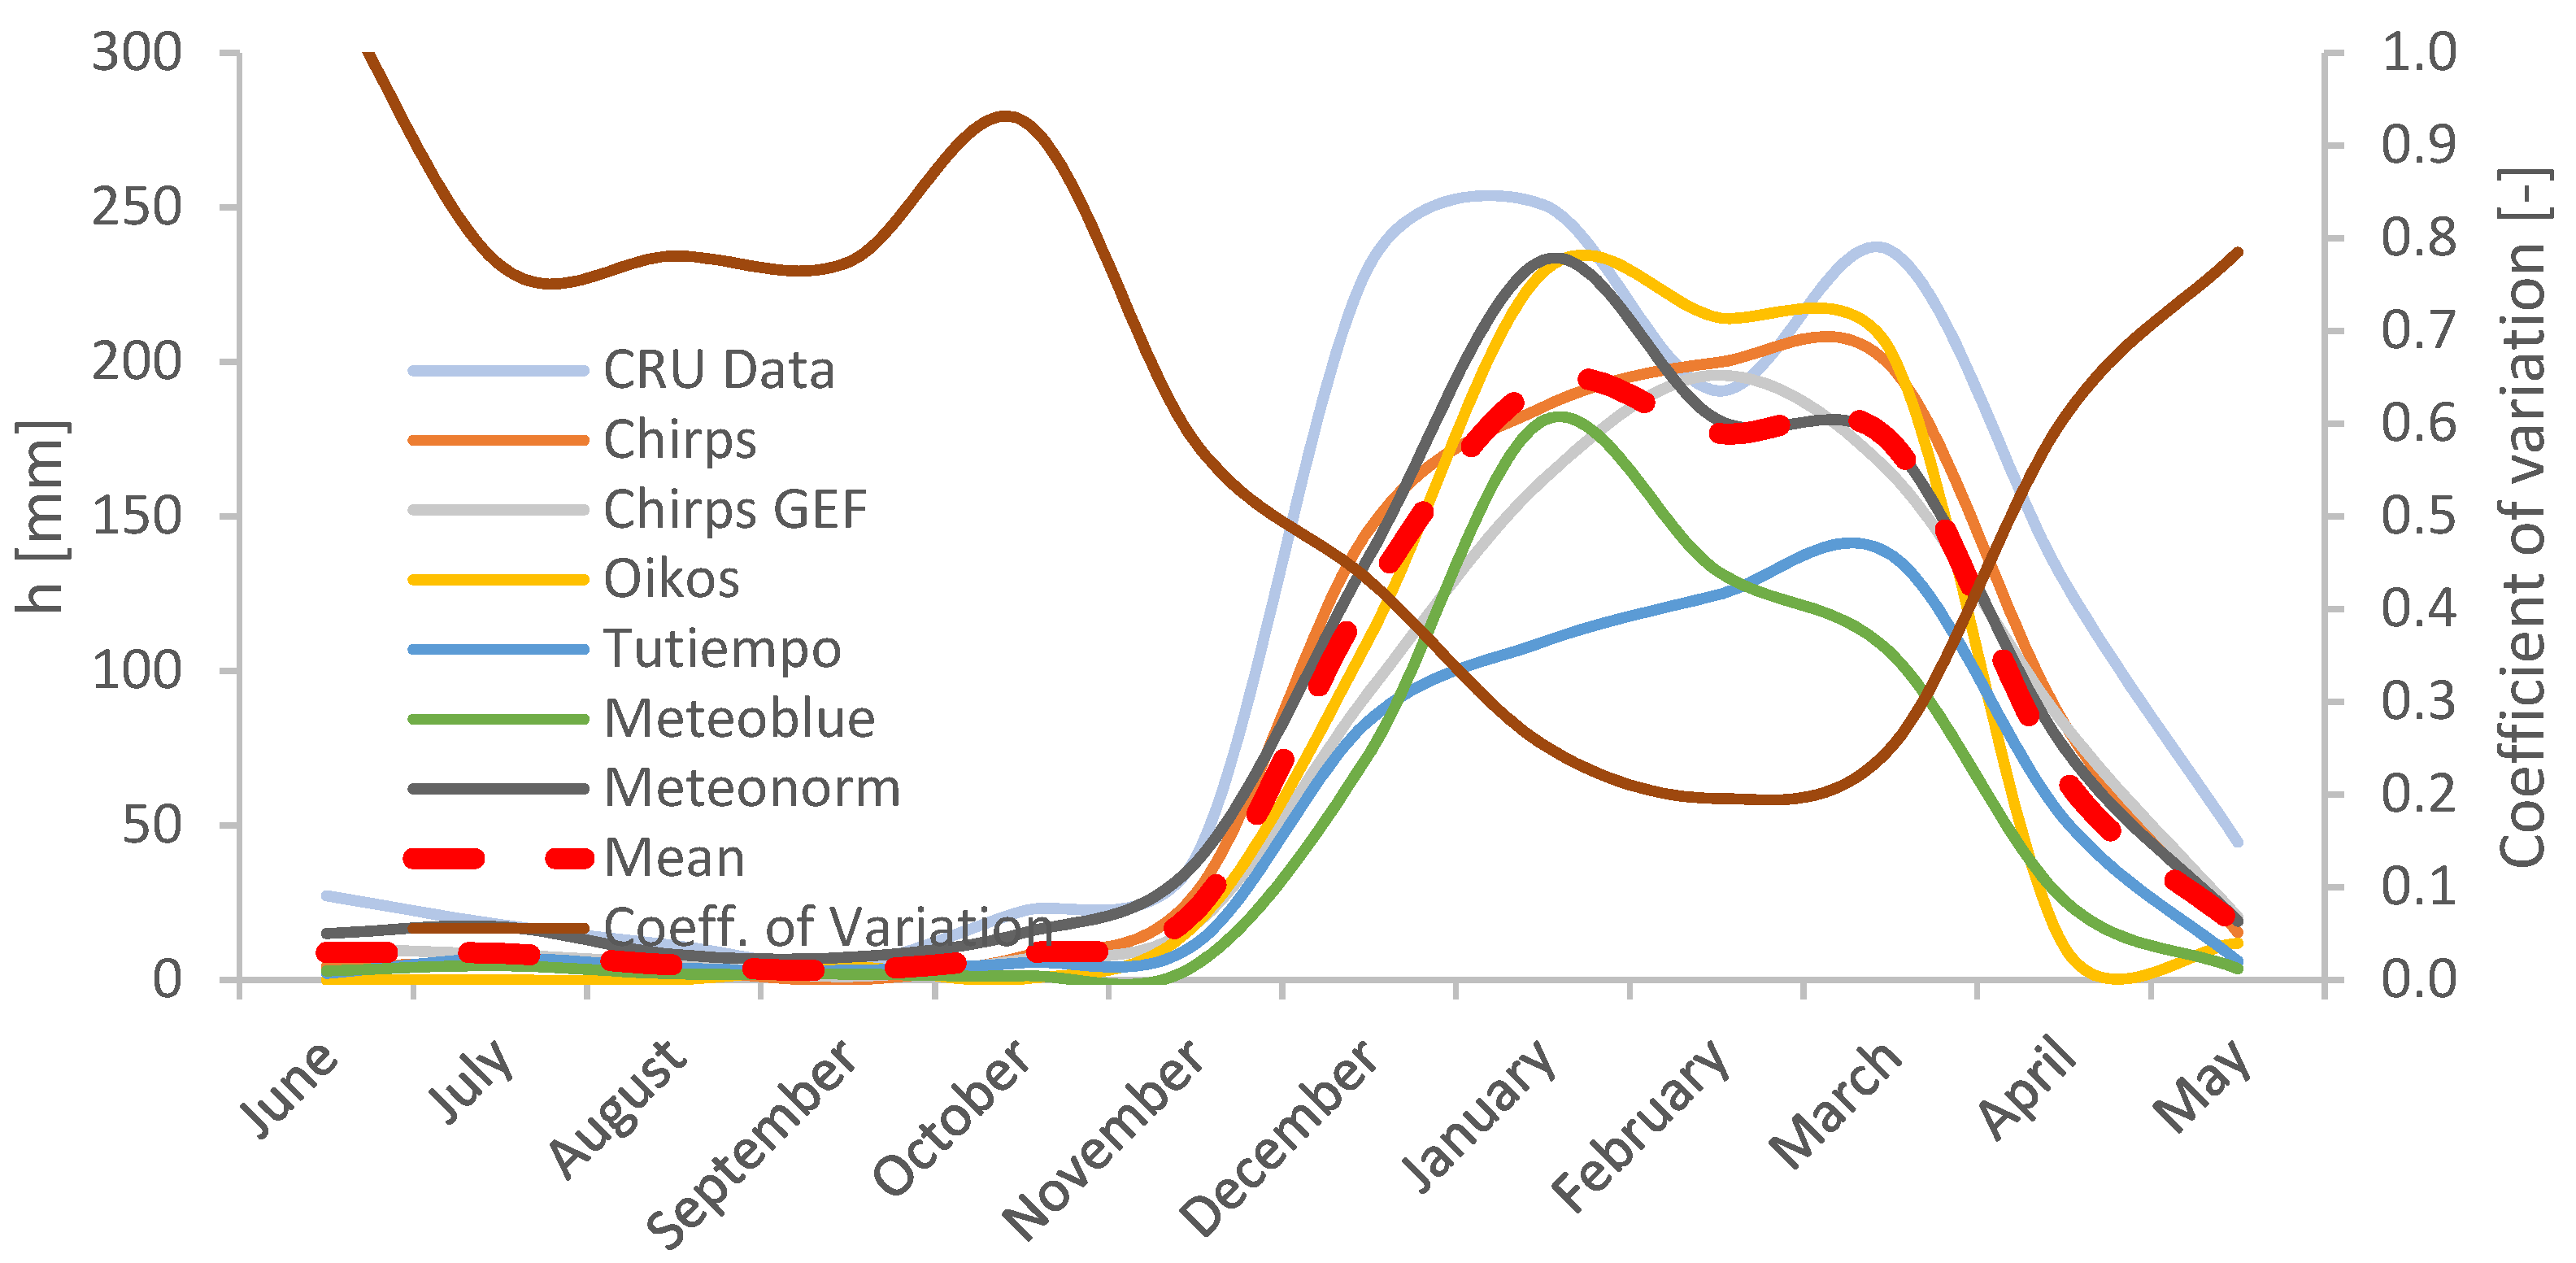
In this study, four different global open DEMs (Table 1) have been used. Using these products is the only possibility in the absence of better topographic data, even if they may present variable vertical accuracy and poor spatial resolution [19,20]. The latter ranges from 90 m, for the Shuttle Radar Topography Mission (SRTM; http://srtm.csi.cgiar.org, accessed on 19 May 2019) to 12.5 m, for the ALOS PALSAR DEM (Advanced Land Observing Satellite Phased Array type L-band Synthetic Aperture Radar; https://search.asf.alaska.edu/#/, accessed on 19 May 2019). Two other DEMs, with an intermediate spatial resolution of 30 m, have been considered: the first one is another SRTM DEM (https://dwtkns.com/srtm30m/, accessed on 19 May 2019) and the second one is The Advanced Spaceborne Thermal Emission and Reflection Radiometer Global Digital Elevation Model (ASTER GDEM; https://search.earthdata.nasa.gov/search/, accessed on 19 May 2019).
Unfortunately, since no elevation values of ground control points are available for this area, it is impossible to establish the vertical accuracy (in Table 1 the vertical accuracy ranges are furnished by websites of respective data providers and, in the case of ALOS PALSAR DEM, from the literature [22,23,24]). Therefore, the data from the different sources have been object compared in detail to assess, at least, their level of agreement.
A first comparison has been conducted computing and overlapping the watershed perimeter and the mainstream path; these features have been determined by applying hydrological GIS functions to the four raster DEMs. As can be seen from Figure 4, even if the watersheds obtained for the four DEMs are very similar to one another, the stream courses present some discrepancy in the study site. This could depend on elevations comparable to the vertical accuracies characterizing this area. Furthermore, some differences could have arisen from the DEMs being taken in different years (see again Table 1); in fact, it is to be borne in mind that extreme weather condition can produce large morphological changes in a territory, even in a short time period [25]. However, this comparison has highlighted some similarity between two sources (SRTM and ALOS PALSAR), with the third one (ASTER) differing from the others (it is considered here that the SRTM 90 and SRTM 30 DEMs are probably too correlated to be considered two independent sources).
Second, the elevation difference between couples of DEMs has been computed maintaining, as a common subtrahend, the SRTM DEM with the spatial resolution of 30 m. The differences have been initially computed for the entire watershed, as preliminarily determined by GIS operations (Figure 5). As expected, the two SRTM DEMs were in good agreement with each other; by contrast, the difference between ASTER and SRTM (not shown here; for further details, see [26]) was quite significant; finally, the comparison with ALOS PALSAR returned the better match, also in terms of maximum difference in elevation with respect to SRTM. In a further comparison, since the study area is much smaller than the entire basin, elevation differences have been also computed for an area covering only the final part of the river (Figure 6a,b) depicts the distribution and the cumulative distribution (in terms of class frequency of values) of the difference between the elevations of ALOS PALSAR and SRTM 30. As can be noted from Figure 6b, the difference between ALOS PALSAR and SRTM presents a tail vanishing after 4 m, while for the case of ASTER DEM it was negligible only for differences greater than 12–15 m (plot not shown here). It can be further considered that hydrological and hydraulic processes may depend on ground slopes beyond ground elevations; therefore, the SRTM and ALOS PALSAR have been compared also in terms of local slopes. A map of slope difference values and distributions of the difference samples are provided in Figure 6c,d, respectively. The most populated class is again that centred on zero, even though the class amplitude is relatively large compared to the typical slopes in the area (in the order of 1 to 2 per mill).
The ALOS PALSAR DEM was finally chosen to prosecute the analysis, as it was (i) in the group of two data in agreement with each other, (ii) presenting the best spatial resolution and (iii) reasonably recent.

2.3. Rainfall Data

The basin of the Rio Muaguide offers only very recent gauges with daily rainfall records available for a short time period; therefore, also for rainfall data, information available from different web services has been used in the present study. CRU (Climatic Research Unit; http://www.cru.uea.ac.uk/data, accessed on 19 May 2019) and CHIRPS data (Climate Hazards Group InfraRed Precipitation with Station data; https://www.chc.ucsb.edu/data/chirps, accessed on 19 May 2019) are gridded rainfall datasets that incorporate satellite imagery and data gained through the interpolation of the in-situ station data. The former service, furnished by the Climatic Research Unit of the University of East Anglia, provides monthly rainfall data for the last century while the latter, developed by the Climate Hazards Group of the University of California, supplies high-resolution (0.05°), daily rainfall dataset for the period from 1984 to near present [27,28]. Another source integrating water interpolated variables with satellite images is Meteonorm (https://meteonorm.com/en/, accessed on 19 May 2019), which presents two sets of monthly precipitation data for the city of Pemba, one from 1961 to 1990 and a more recent one ranging from 2000 to 2009. TuTiempo (https://it.tutiempo.net/, accessed on 19 May 2019) provides daily rainfall data taken from the interpolation of weather station records and information is available since 1980 until today. A last found service, Meteoblue (https://www.meteoblue.com/it/tempo/archive/export/, accessed on 19 May 2019), is not free but supplies weather simulation data with a temporal resolution of one hour; it provides climatic variables for any place of the Earth and since 1985.
All these sources have been compared on a mean monthly base. The time scale used for comparison was thus quite coarse, yet this was the minimum required to include all the sources. From Figure 7 the dry and the wet seasons can be clearly distinguished for each set of data, even if with some differences attributable to several causes such as point or systematic error, instrumental or recording error and method used for spatial interpolation of the data [17]. The plot includes also a mean curve, which has been computed as an average weighted on the number of years covered by each source, and a curve for a monthly coefficient of variation, estimated as the ratio between the standard deviation and the mean rainfall value. As discussed in other studies [17,29], the difference between the products was lower with higher rainfall. In fact, during the rainy season the coefficient of variation was below 20%, that has been considered encouraging for the reliability of the following evaluations. In the absence of a criterion to establish which source was most accurate, the analysis was prosecuted with the data of Meteoblue that provided the highest temporal resolution.

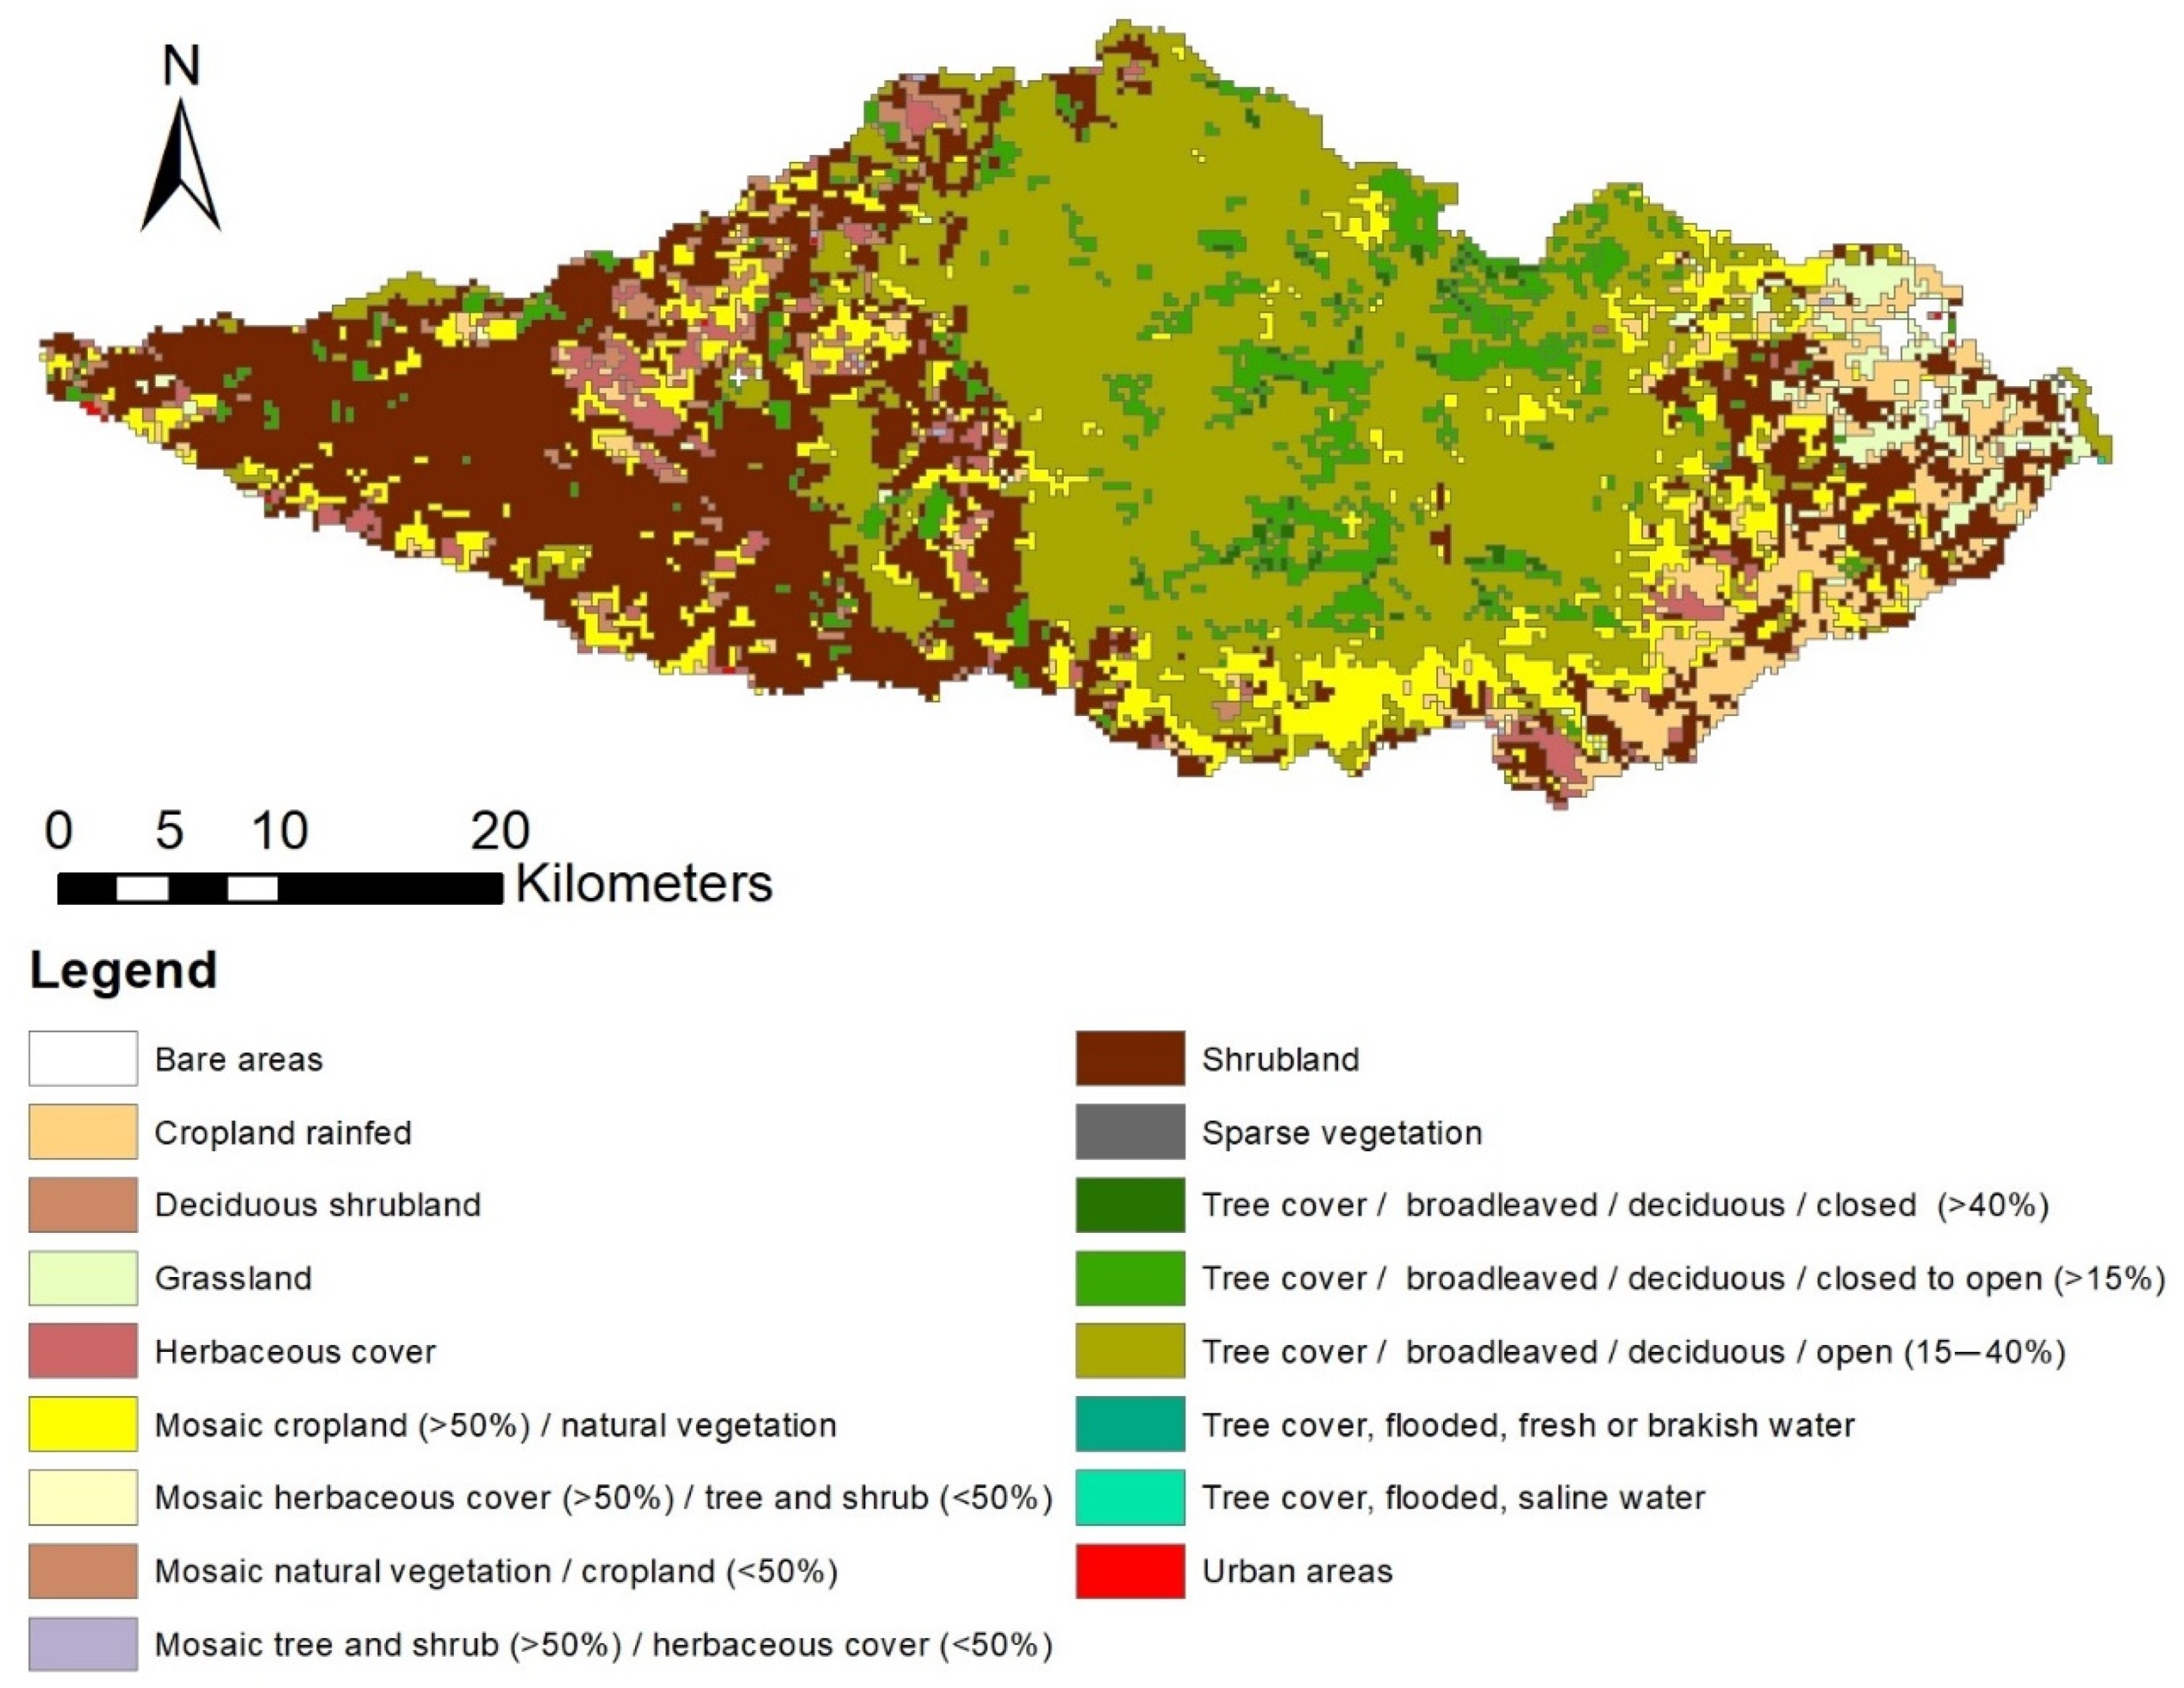
2.4. Soil Cover Data

Three freely available land cover maps have been found in order to characterize geomorphologically the catchments and, in Figure 8, one of them is shown (all the maps are presented in [25]). The first map was provided by Copernicus (https://emergency.copernicus.eu, accessed on 19 May 2019); the second one by FAO Geo-network service (http://www.fao.org/geonetwork/srv/en/main.home, accessed on 19 May 2019) while the last one was available from the ESA (http://maps.elie.ucl.ac.be/CCI/viewer/download.php, accessed on 19 May 2019). These maps have been used to determine a Curve Number (CN) as mentioned below.

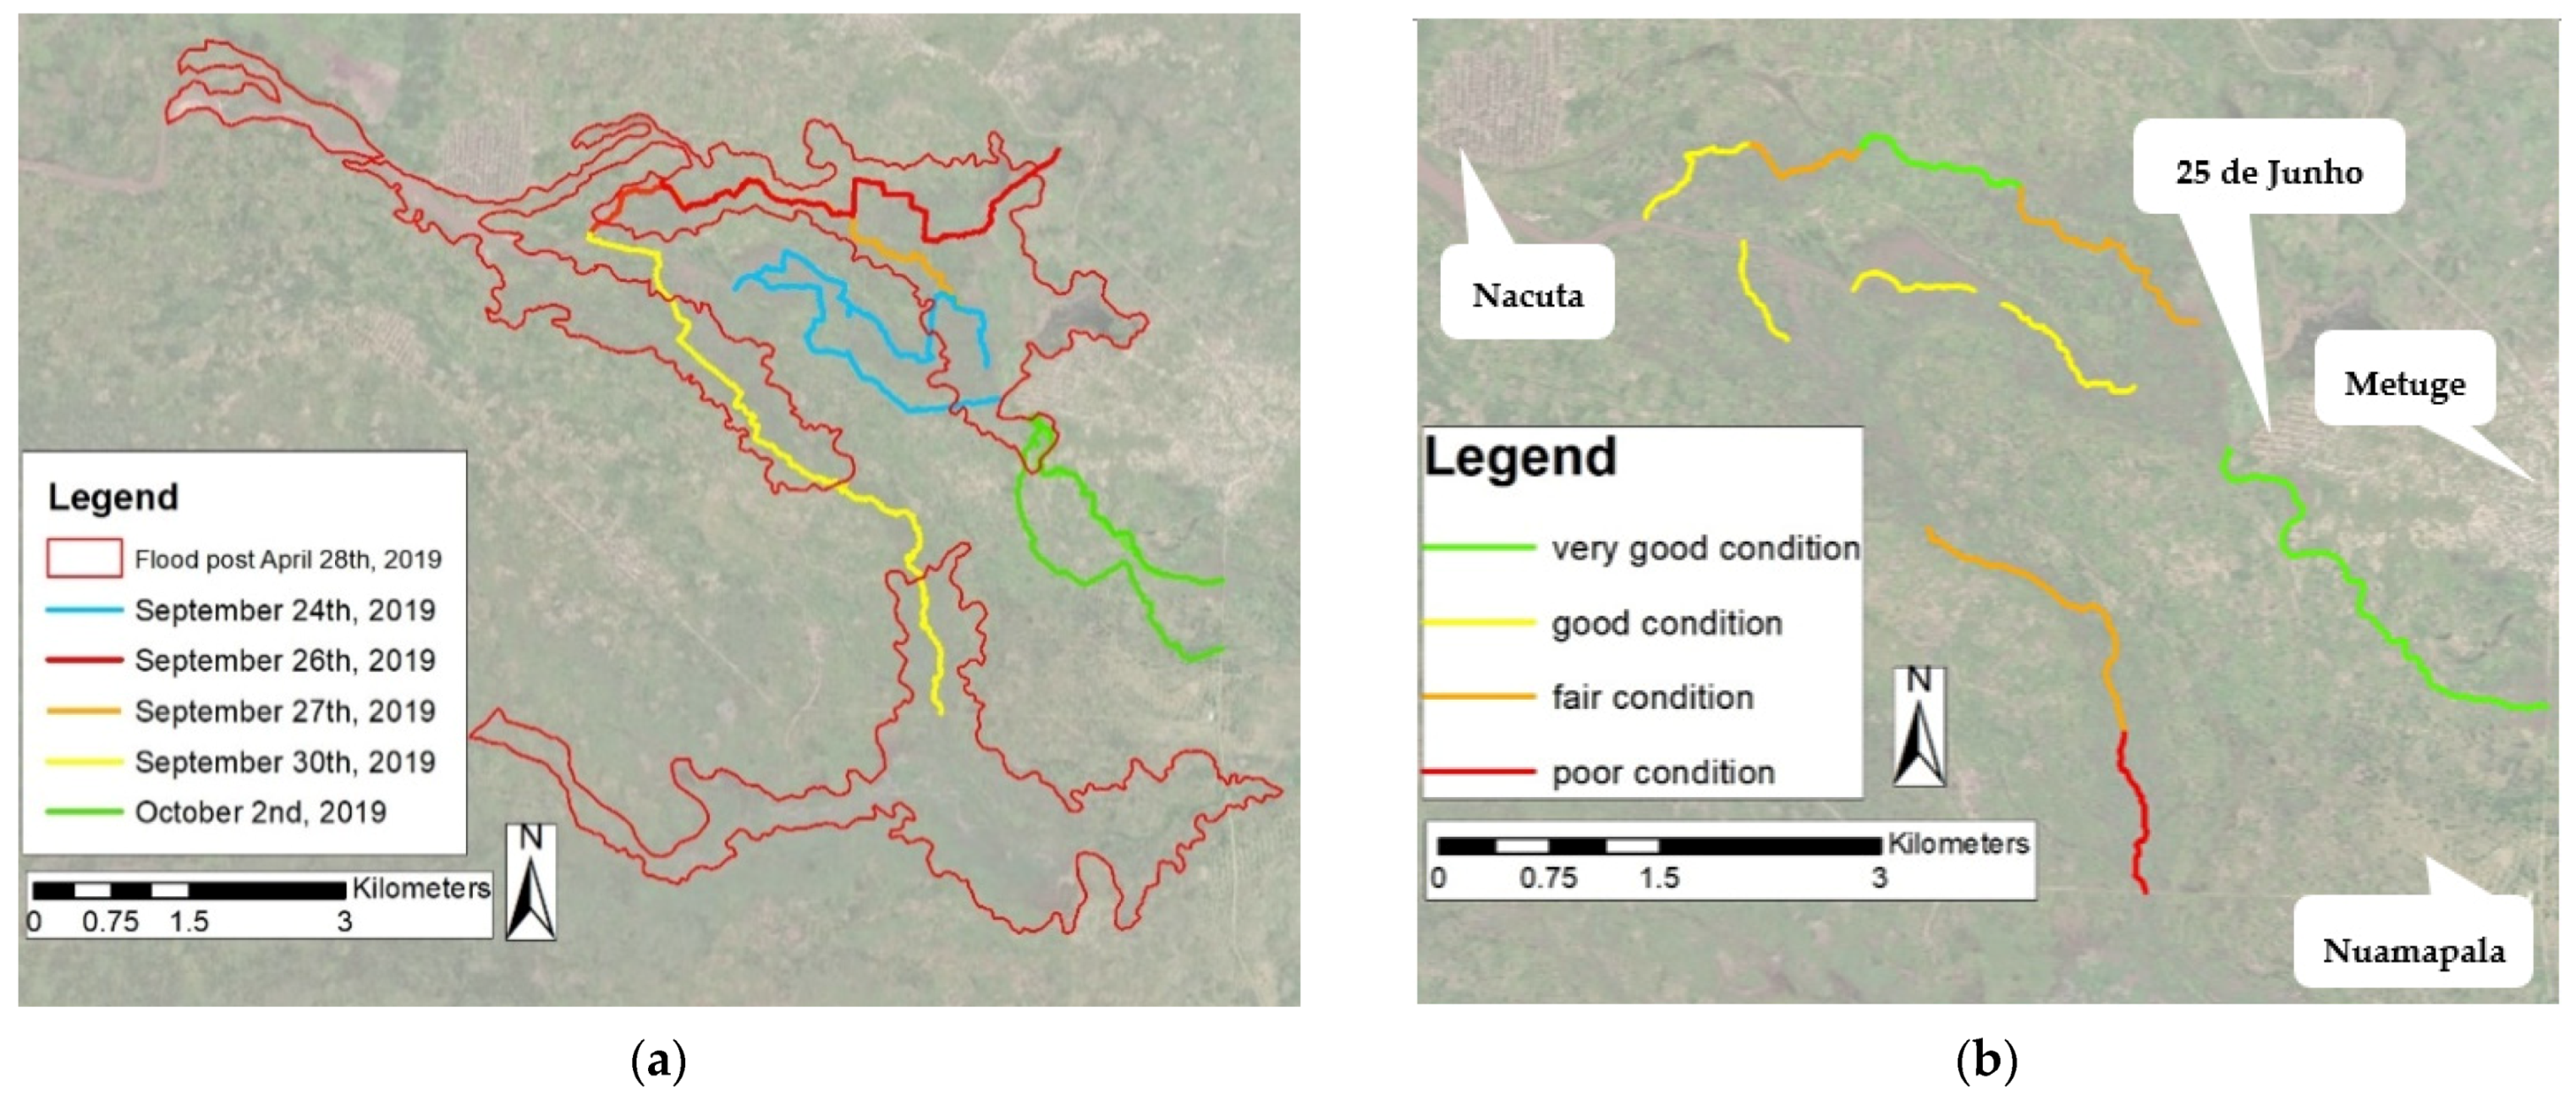
3. Hazard Assessment

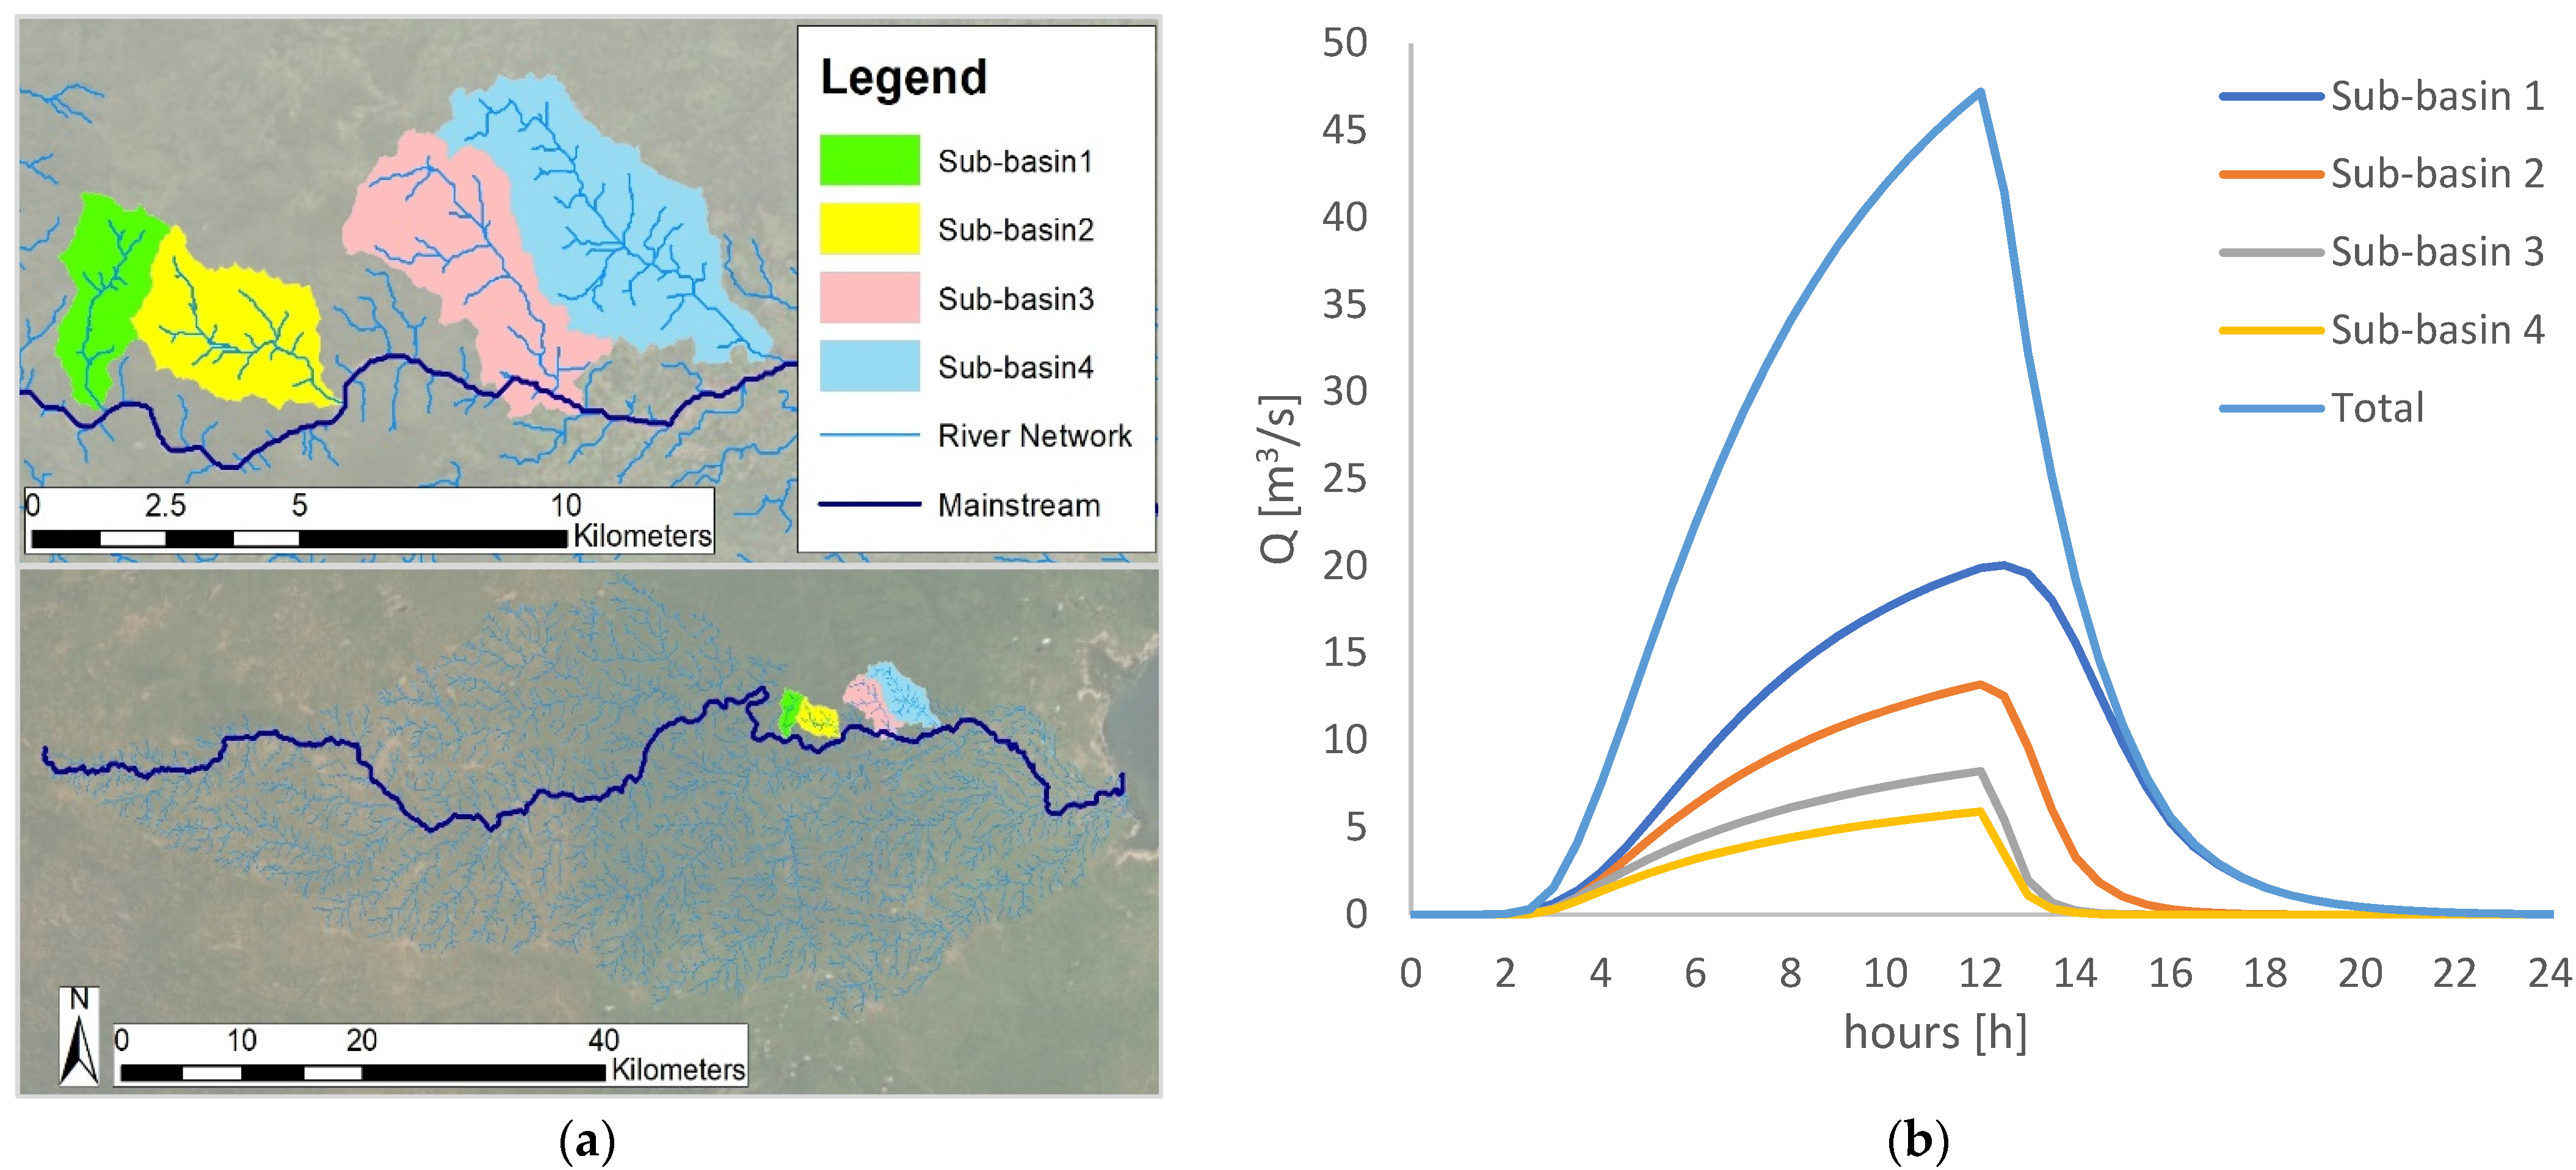
3.1. Hydrological Modelling

The software HEC-HMS (https://www.hec.usace.army.mil/software/hec-hms/, accessed on 19 May 2019) has been used to simulate a uniform rainfall on four sub-basins located immediately upstream of the study area, depicted in Figure 9a. In fact, in the study site rainfall events are mostly with short duration and localized over small areas.
For each sub-basin a time of concentration, ranging from 1 to 4 h, has been preliminarily computed with formulae available in the literature. Then, the rainfall data have been used to produce Depth-Duration-Curves based on the Gumbel probability distribution. Hydrological losses by infiltration have been estimated according to the SCS-CN method after determining the Curve Number (CN) based on the soil type. The CN is determined through lithological and land use information. For the lithology, the basin is usually classified as belonging to one of the four hydrological soil groups, ranked from class A (high permeability) to class D (very low permeability). Unfortunately, no lithological map is available for Mozambique but, according to [30], the area under study could be assumed as characterized by a medium-low permeability (classes B and C); therefore, the values of CN of these two classes have been averaged. For the land use information, the three soil cover maps presented in Section 2.4 have been considered. Finally, three CN values, for each sub-basin, have been determined considering different sources (Table 2).
A design return period of 10 years has been chosen for the hazard map production, since no standards are available for this region and considering the high frequency with which floods occur. The resulting hydrograph, depicted in Figure 9b, presents a peak discharge of 48 m3/s.

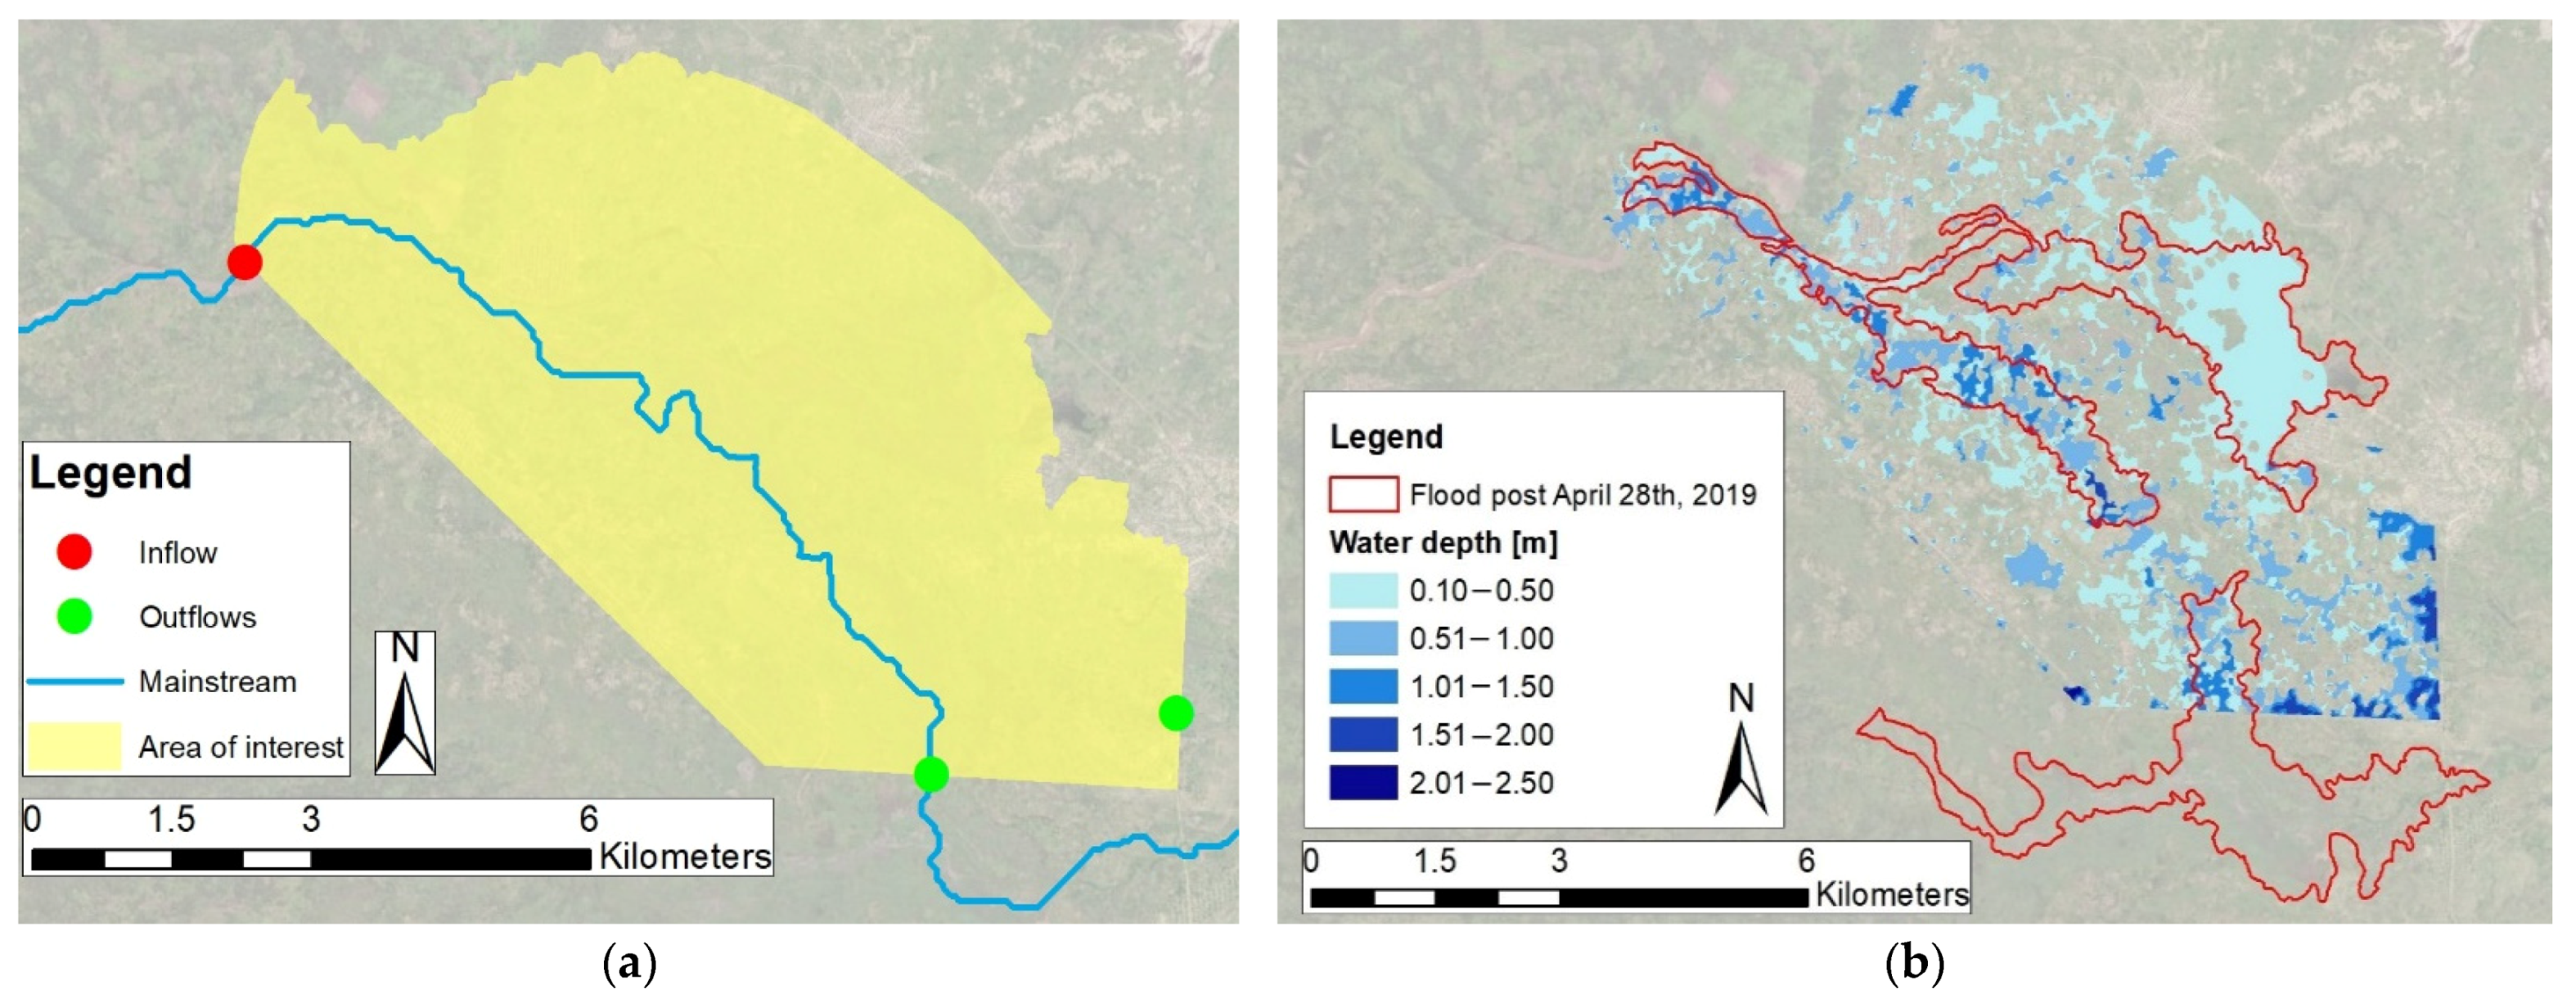
3.2. Hydraulic Modelling

A steady, two-dimensional hydraulic simulation has been run with the solver SToRM, included in the suit of the open suite IRIC (https://i-ric.org/en/, accessed on 19 May 2019). SToRM is a two-dimensional flow solver working with unstructured grid of triangular elements [31]. Figure 10a depicts the simulation domain and the location of the boundary conditions. The computational domain (in yellow) has been bounded by the watershed perimeter and by two secondary roads; furthermore, the village of Nacuta has been included in the domain as it is a key vulnerable location. A 3 km river distance has been ensured between the town and the upstream boundary condition, where the peak discharge of 48 m3/s was applied. Two outflows have been placed at the points where the river flows below the roads bounding the computational domain; at these crossings, multiple openings are present in the road embankments. A uniform coefficient of 0.035 s/m1/3 has been used for the entire area because, given the poor vertical accuracy of the DEM, a detailed roughness adjustment was unnecessary.
Figure 10b depicts the result of the two-dimensional flow simulation. The flooded area is concentrated along the principal channel of the Rio Muaguide, although several scattered areas are detected due to the poor DEM resolution. A tendency of the flood to propagate in the direction of the natural reservoir is spotted; furthermore, the model returned the basin as completely flooded. Along the boundary intersecting the two outlets, the water retained by the two secondary roads (that act as dams) presents high depths. The latter has been confirmed by the inhabitants of Nuamapala (see Figure 1) interviewed during the mission on site.
The map also depicts the cyclone Kenneth flood extent, in order to compare the final modelling result with a past event as the only possible tentative validation. The flooded area determined by the numerical simulation is quite in agreement with the area flooded during Kenneth; even acknowledging that the two events have extremely different magnitude, the similarity between the two areas is encouraging.

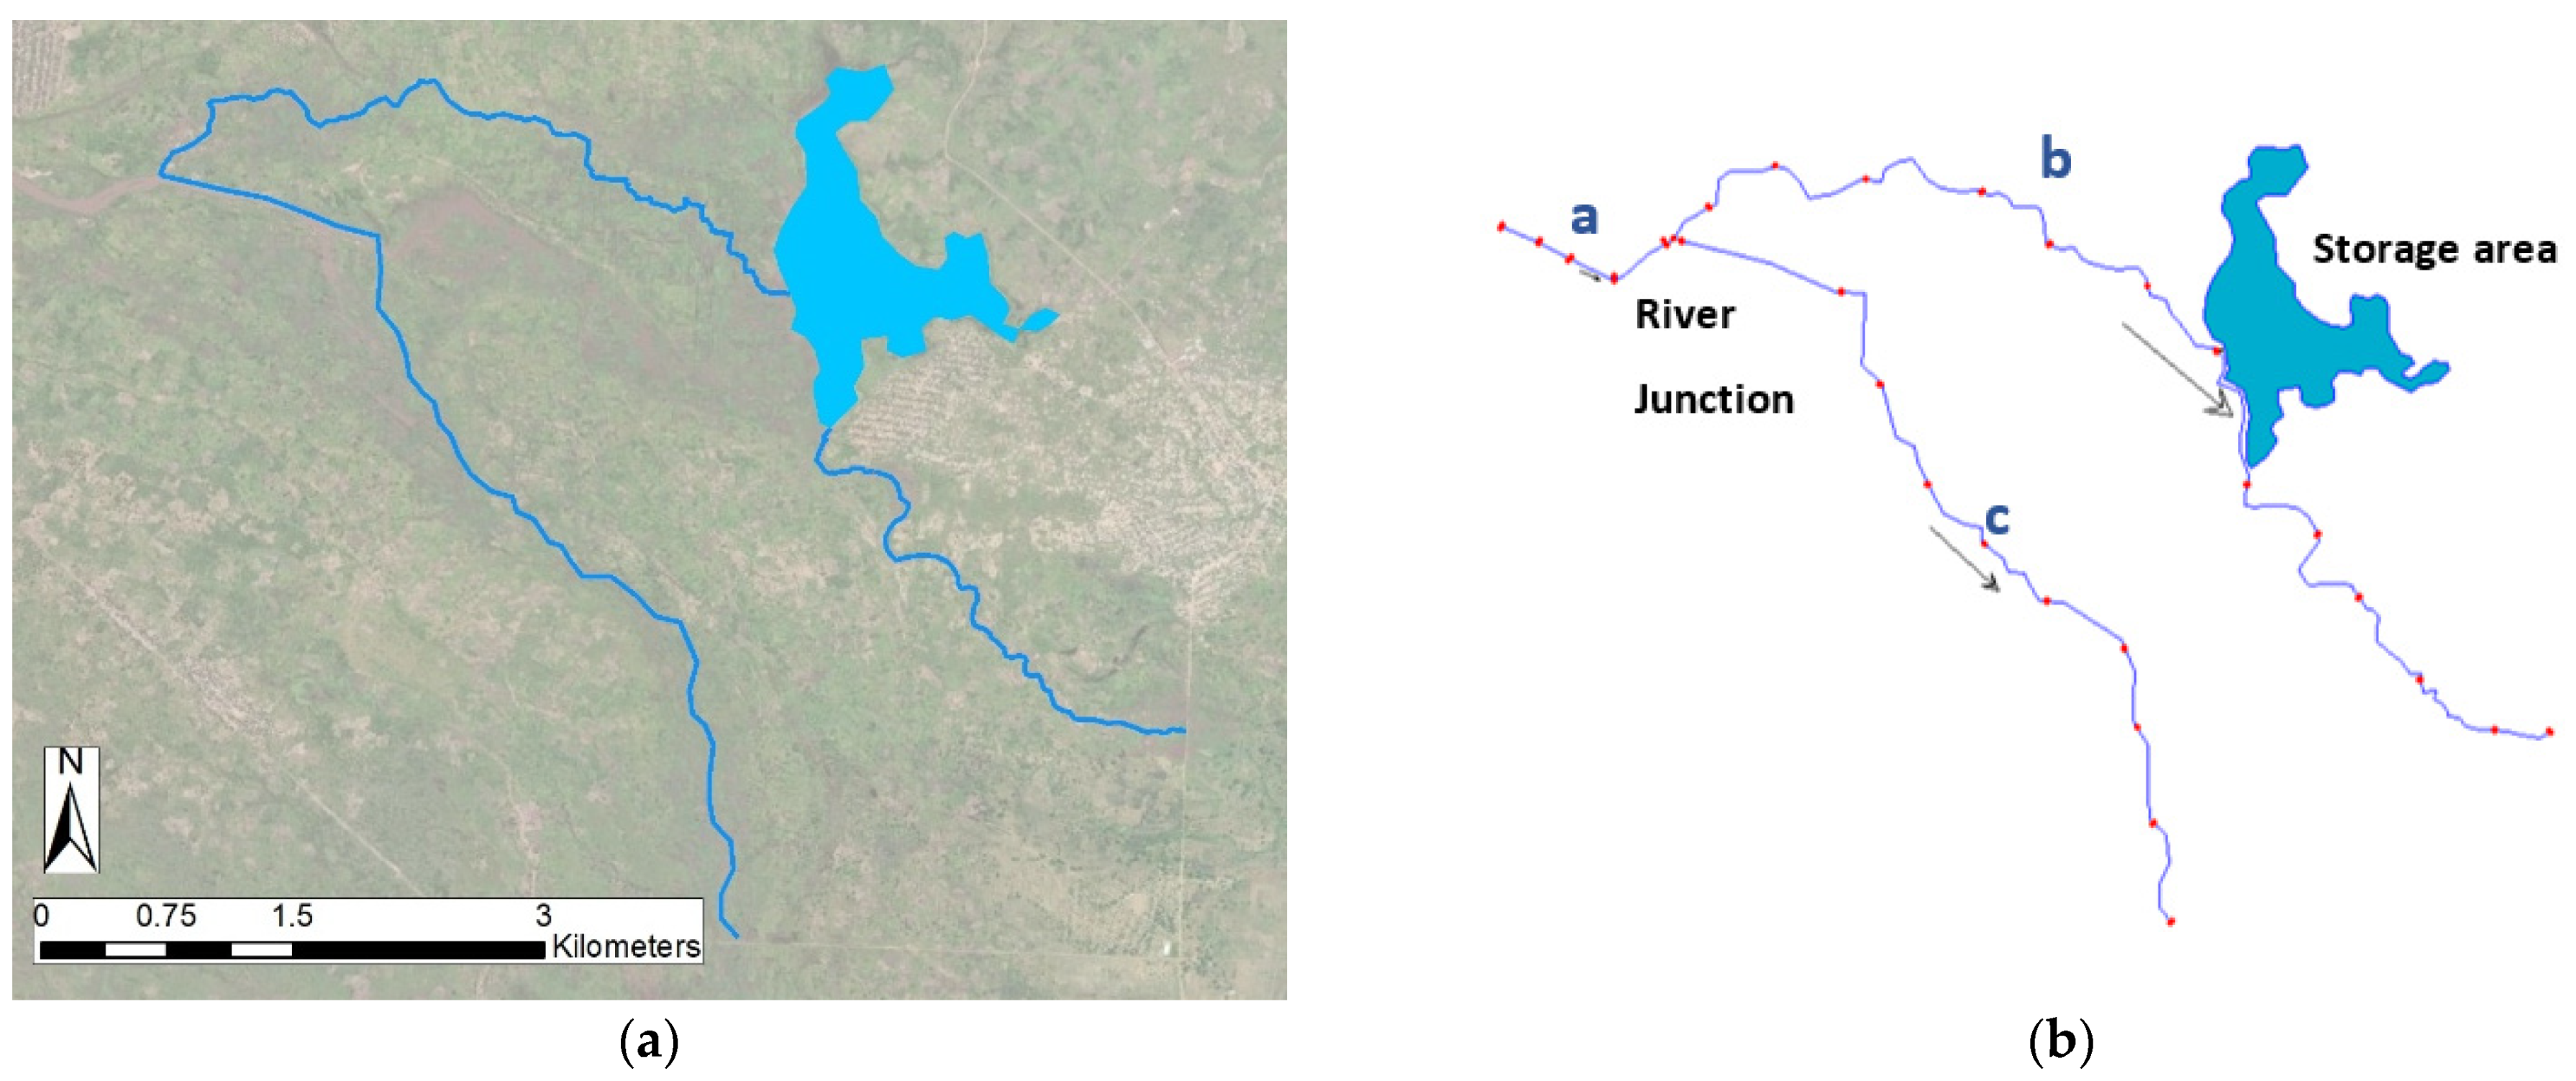
4. Modelling-Based Proposal of a Mitigation Measure

This project has been primarily aimed at the mitigation of flood risk for the rural area; a secondary objective of water storage has been pursued in order to ensure the availability of water to be used during the dry period by the agricultural community, thus realizing a win-win measure.
Any proposed intervention needs to be feasible employing simple technology, and to build upon the present state of the system. Let one consider that, apart from hydrological triggers, the progressive increase of flood hazard in the area has been mostly due to the deposition of sediment, supplied from the upstream portion of the watershed, that has completely buried the riverbed in some parts causing larger spread of water during the rainy season. Stemming from this, mitigation measures have been grounded on a general principle of restoring a good shape of the riverbed. Excavation down to a prior river shape was an obvious option. However, it also presented some shortcomings; first, excavated material could be a lot; second, lowering too much the water elevation would hinder the possibility of water transfer to the storage area. In order to cope with these issues, it has been thought that dug soil might be employed to build earthen levees. This idea would enable the excavation volume to be reduced, part of the excavated material to be reused and a more functional hydraulic connection to be maintained between the river and the natural reservoir towards a larger storage. These are relatively simple interventions, feasible in the area of interest.
A choice of river reaches to be restored has relied on the evidence of the hazard map, and on the reaches visited and tracked during the field survey with the evaluation of the riverbed condition (Figure 2 and Figure 3). Figure 11a depicts the channels considered in the intervention design, and the connection of the northern branch to the basin of 25 de Junho. These reaches exploit as much as possible those which have been already observed as being in good conditions and correspond to the paths taken by the flow during cyclone Kenneth (see again Figure 2a and Figure 10b).
In the design condition, all the reaches have been given a prismatic section and embankments have been considered as having a trapezoidal shape with 2-m top width and slopes of 3/2 (horizontal/vertical). While performing the virtual digging operations, the longitudinal profile of the thalweg has been regularized compared to the present situation where it presents some portions with adverse slope. The virtual building of embankments, instead, has been performed maintaining a proper freeboard above the water stage computed in each section, so that the levee height varied section by section. The determination of a design geometry has been an iterative process: starting from a first attempt of deep excavation without levees, the solution has been optimized step by step, by progressively reducing the section depth and width with rising levees.
Since the modelling objective was to maintain the water in the river sections, we have opted for avoiding a two-dimensional analysis with detailed topographic data. Thus, to explore how the design solution would contribute to mitigate the floods and store water in the basin, a one-dimensional flow analysis has been performed (using HEC-RAS, Hydrologic Engineering Center’s-River Analysis System; https://www.hec.usace.army.mil/software/hec-ras/, accessed on 19 May 2019). A plan of the model is presented in Figure 11b); the model included a river junction between channels a, b and c, and the natural basin as a storage area connected with reach b through a lateral structure. For any design configuration, a steady model has been used to determine thalweg and levee elevations with freeboard, while an unsteady run has been employed to quantify the water exchanges between reach b and the storage basin. The hydraulic simulations for design have been run considering a return period of 150 years, with a peak discharge of 100 m3/s. In this way the designed channels are obviously overestimated for the return period of 10 years used in Section 3; however, an increased return period has been considered in order to compensate some uncertainties related to the hydrological modelling (for example, we cannot exclude that the area with intense rainfall be larger, determining a higher flow rate).
The design profiles of the considered river reaches are depicted in Figure 12, where one notes: a smoothing of the bed profile compared to the present condition; a combination between sediment excavation and levee construction; a freeboard considered for the water profile with 100-y return period; the maximum profile that has been obtained for the 10-y return period. A different width of the excavation has been considered in the three reaches, with widths of 30 m for reach a and of 10 m for reaches b and c. The iterative design process that has led to the configuration depicted here is presented in detail in [26]. The synthetic properties of the design configuration are as follows: the volume of excavated material is equal to 410,000 m3 and a great part of it (370,000 m3) is used for the construction of the levees, achieving a good balance between excavation and reuse.
As mentioned, hydraulic simulations in unsteady flow have furnished the estimates of the water volume that could be stored in the natural reservoir during a high-flow event. The stored volume equals 470,000 m3 and 130,000 m3 for the return periods of 100 of 10 years, respectively.

5. Discussion

The scope of this manuscript is to propose a suitable flood mitigation measure, combined with an intervention devoted to water harvesting, for the rural area of Metuge. In less developed countries, a major challenge to such studies comes from the scarcity of good-quality data; in the present work open, or at least cheap, global data have been used to produce a flood hazard map, which is of primary importance to set up interventions.
In particular, we have considered four DEMs with a coarser spatial resolution than those typically used in hydraulic modelling. A critical comparison of the different sources checking their level of agreement is a viable option to cope with the lack of ground true data. Among those in accordance, the source with higher spatial resolution has been chosen to proceed with the computations. Since no rain gauges with long time series are present in our area, we have retrieved several rainfall services ranging from monthly to hourly temporal resolution. In addition, in this case one has to, at least, critically compare the information provided by the different services; therefore, we have performed a monthly averaged comparison and, even some differences were spotted, we have found that during the rainy season the overall coefficient of variation was under the 20%. The rainfall source with hourly dataset has been used in the models. Finally, three soil cover maps have been used to produce the Curve Number, indispensable for the hydrological modelling. The sources produced similar results; hence, an averaged value has been used for the CN. Generally speaking, the comparison of data from multiple sources is a crucial methodological step to be always performed.
All these data have been used to characterize the present state of the system. Therefore, a hydrological modelling, first, and a hydraulic analysis, second, have been performed to assess the flood hazard of the area for a relatively low return period. A coupled modelling procedure, like the one of this study, is a viable way forward in several similar other studies undertaken in the Africa continent and, in particular, in data scarce basins, as recently reviewed by [18].
Validation is a key need of any modelling study. However, it has been unfortunately impossible to validate the used data and the quantitative results obtained. A comparison between a modelled flooded area and that related to cyclone Kenneth has been the only, though week, possible validation. Even if the two events were quite different, the inundated areas were reasonably in agreement; nevertheless, the software SNAP returns only the flood extension and no information about local depths is available. However, in a region where no data are available the use of open data may be the only viable option if resources do not enable extensive monitoring campaigns to be carried on [32].
Increasing a design return period is a viable way to account for a number of uncertainties affecting present-state and design-state simulations. In the present work we have considered a reference return period of 10 years and a much larger one of 150 years to compensate (even if, unfortunately, in a hardly quantifiable manner) the uncertainties related not only to the data but also to the assumptions made for hydrological modelling.
The mission on site was crucial to design suitable mitigation measure for the context. The field survey revealed channels in different conditions. Some stretches presented a well-defined riverbed, probably excavated during the cyclone Kenneth. However, the river also presented many branches completely filled with sediment, supplied from the upstream portions of the basin, which causes the periodic inundation of the area. Therefore, the mitigation measures have referred to sediment excavation to enable the restoration of riverbed and, thus, its conveyance. The concept behind the intervention was to propose a nature-based solution that would not upset the current morphology but, instead, would be inspired and supported by it [33]. Therefore, the design intervention has relied, as much as possible, on river reaches that present already a good condition (see Figure 2b and Figure 11). Moreover, the exploitation of these channels would permit to transfer water to the natural reservoir present in this area, pursuing the second objective of this project (harvesting water to be used by the agricultural community also in dry seasons). Since the only bed excavation was leading to a considerable amount of material waste, the excavation has been coupled with levee construction, using the same material dug for the riverbed restoration. The design of the earthen embankments would permit to propose an intervention with a relatively low depth of excavation, which is cost-effective for our area. Moreover, even though the use of an earthen levee makes the water elevation higher than that of the surrounding ground and requires additional maintenance, it would ensure a better exploitation of the natural basin (because conversely, with a deeper excavation of the reaches, a lower water elevation would hinder the possibility of water storage). After a series of trials, performed changing the excavation depth and, consequently, the levee conformation, the solution presented has yielded a good balance between the sediment excavated and reused to build the levees, a good exploitation of the storage capacity of the basin and the ability to protect the study area up to a flood discharge of 100 m3/s.
Future monitoring shall assess the performance of the proposed mitigation measure and its possible impacts on the surroundings. Furthermore, since after the realization of the mitigation measure, the process of bed filling with sediment will proceed, periodic maintenance of the intervention must be foreseen to guarantee a functionality over time. Previous experiences with similar systems have highlighted their vulnerability to siltation (e.g., [9,10,11]). We have attempted a preliminary estimate of a volume of material supplied to the study site by erosion over the upstream portions of the catchments. Treasuring previous experience ([34,35,36]) in the use of bulk erosion models like the Universal Soil Loss Equation (USLE or similar) and the method for potential erosion (EPM), we have attempted a preliminary estimation of supplied sediment volumes. A first estimate has been obtained with the EPM method considering the entire catchments and a period of one year, obtaining about 64,000 m3. A second one has been instead obtained following the method of [36] to consider the four basins already used for the hydrological determination and a return period of 150 years, obtaining 60 m3 as an estimate for a single event over a portion of the catchments. The former computation corresponds to a considerable fraction of the volume that would need to be extracted to realize the intervention, as it is a bulk estimate for the entire basin. The latter volume is instead a minor percentage of the dredged volume, thus stimulating further consideration of the intervention. In a revised estimation of sediment volume conveyed downstream, use could be also made of distributed soil erosion models. However, an alternative to remedy this problem could be to couple the intervention presented with an upstream measure, preventing the intense sediment transport and, in turn, the sediment aggradation in the study site.
The present study, which includes a number of phases from data-seeking to the design of a mitigation measure, can be a prototypical solution exportable in similar contexts; in particular, the procedure adopted to study the final part of the Rio Muaguide can be applied to other rivers of Mozambique, but also to catchments in other less developed countries affected by data scarcity and limited budget possibilities. In fact, the application of the methods to other rivers in Mozambique is within the objectives of the project PRONTIDÃO (Preparação para as Mudanças Climáticas e Igualdade na Província de Cabo Delgado), that has been funded by the European Union in Mozambique and will take place in 2021–2024. Furthermore, this new project will empower institutions at local and national level and will enhance young citizens’ engagement in both planning and implementing adaptive strategies; a participatory approach shall help decrease the inhabitants’ vulnerability to natural disasters and enhance the engagement of the civil society.

6. Conclusions

In order to meet an objective of flood hazard assessment and mitigation for a rural area in the province of Cao Delgado in Mozambique, this paper has recognized that key issues are the availability of (possibly, open) data; the numerical models to be used; proposals for interventions; feedback on and monitoring of proposed measures.
The typical scarcity of data that affects less developed countries makes scholars refer to large-scale data, like elevation models from shuttle missions or satellite-based information for rain. A critical comparison of the different data sources is irremissible, with a specific intention of privileging one sources among a group of concurring ones.
The models used for hydrological and hydraulic simulation of active processes are, obviously, affected by uncertainty. Validation needs to be pursued, even if it can be hardly rigorous in the absence of specific observations.
Engineering measures for flood hazard in agricultural areas of countries with marked seasonality need to target both flood mitigation and water harvesting. This manuscript could not address a continuous monitoring of the performance of any intervention, since the technical proposal was limited to a preliminary stage where, however, it is important to identify major possible pitfalls to be analysed in a second round of design.

Author Contributions

Proposal, D.B., G.C. and A.G.; methodology, all; data collection and modeling, B.C. and S.R.; data analysis, all; original draft preparation, S.R.; review and editing, all; revision after submission, S.R. and A.R. All authors have read and agreed to the published version of the manuscript.

Funding

This research was funded by the Italian Agency for Cooperation to Development through the ADAPT project.

Data Availability Statement

The data used in this manuscript are available from the cited sources.

Acknowledgments

We gratefully acknowledge the Italian Agency for Cooperation to Development which financially supported the ADAPT project, of which the study presented is part. We also would like to thank the Career Service of the Politecnico di Milano for the logistic support provided in the organization of the mission on site of B.C. and S.R. Two anonymous Reviewers provided comments and suggestions for the manuscript improvement.

Conflicts of Interest

The authors declare no conflict of interest.

References

  1. Rentschler, J.; Salhab, M. People in Harm’s Way: Flood Exposure and Poverty in 189 Countries; Policy Research Working Paper No. 9447; World Bank: Washington, DC, USA, 2020; Available online: https://openknowledge.worldbank.org/handle/10986/34655 (accessed on 13 January 2021).
  2. FAO. The State of Food and Agriculture 2020. Overcoming Water Challenges in Agriculture; FAO: Rome, Italy, 2020. [Google Scholar] [CrossRef]
  3. Hierink, F.; Rodrigues, N.; Muñiz, M.; Panciera, R.; Ray, N. Modelling geographical accessibility to support disaster response and rehabilitation of a healthcare system: An impact analysis of Cyclones Idai and Kenneth in Mozambique. BMJ Open 2020, 10, e039138. [Google Scholar] [CrossRef] [PubMed]
  4. United Nations Office for the Coordination of Humanitarian Affairs. Southern Africa—Tropical Cyclone Eloise. Flash update N.7. 24 January 2021. Available online: https://reliefweb.int/report/mozambique/southern-africa-tropical-cyclone-eloise-flash-update-no7-24-january-2021 (accessed on 25 January 2021).
  5. McCartney, M.; Rebelo, L.-M.; Xenarios, S.; Smakhtin, V. Agricultural Water Storage in an Era of Climate Change: Assessing Need and Effectiveness in Africa; IWMI Research Report 152; International Water Management Institute (IWMI): Colombo, Sri Lanka, 2013. [Google Scholar] [CrossRef] [Green Version]
  6. Kalantari, Z.; Santos Ferreira, C.S.; Keesstra, S.; Destouni, G. Nature-based solutions for flood-drought risk mitigation in vulnerable urbanizing parts of East-Africa. Curr. Opin. Environ. Sci. Health 2018, 5, 73–78. [Google Scholar] [CrossRef]
  7. Bodian, A.; Dezetter, A.; Diop, L.; Deme, A.; Djaman, K.; Diop, A. Future climate change impacts on streamflows of two main West Africa river basins: Senegal and Gambia. Hydrology 2018, 5, 21. [Google Scholar] [CrossRef] [Green Version]
  8. Van Steenbergen, F.; Verheyen, O.; van Aarst, S.; Mehari, A. Spate irrigation, livelihood improvement and adaptation to climate variability and change. IFAD/MetaMeta/UNESCO-IHE. 2008. Available online: https://sswm.info/sites/default/files/reference_attachments/STEENBERGEN%20et%20al%20ny%20Spate%20Irrigation.pdf (accessed on 15 January 2021).
  9. Mehari, A.; Van Steenbergen, F.; Schultz, B. Modernization of spate irrigated agriculture: A new approach. Irrig. Drain. 2011, 60, 163–173. [Google Scholar] [CrossRef]
  10. Komakech, H.C.; Mul, M.L.; van der Zaag, P.; Rwehumbiza, F.B. Water allocation and management in an emerging spate irrigation system in Makanya catchment, Tanzania. Agric. Water Manag. 2011, 98, 1719–1726. [Google Scholar] [CrossRef]
  11. Gebrehiwot, K.A.; Haile, A.M.; de Fraiture, C.M.S.; Chukalla, A.D.; Embaye, T.G.G. Optimizing flood and sediment management of spate irrigation in Aba’ala Plains. Water Resour. Manage. 2015, 29, 833–847. [Google Scholar] [CrossRef]
  12. Gebremariam, H.L.; Haile, A.M. Improving spate flow diversions in spate irrigation intake structures. ISH J. Hydraul. Eng. 2020. [Google Scholar] [CrossRef]
  13. Fujihara, Y.; Tanakamaru, H.; Tada, A.; Adam, B.M.A.; Elamin, K.A.E. Analysis of cropping patterns in Sudan’s Gash spate irrigation system using Landsat 8 images. J. Arid Environ. 2020, 173, 104044. [Google Scholar] [CrossRef]
  14. Lumbroso, D.; Ramsbottom, D.; Spaliveiro, M. Sustainable flood risk management strategies to reduce rural communities’ vulnerability to flooding in Mozambique. J. Flood Risk Manag. 2008, 1, 34–42. [Google Scholar] [CrossRef]
  15. Farooq, M.; Shafique, M.; Khattak, M.S. Flood hazard assessment and mapping of River Swat using HEC-RAS 2D model and high-resolution 12-m TanDEM-X DEM (WorldDEM). Nat. Hazards 2019, 97, 477–492. [Google Scholar] [CrossRef]
  16. Álvarez, M.; Puertas, J.; Peña, E.; Bermúdez, M. Two-dimensional dam-break flood analysis in data-scarce regions: The case study of chipembe dam, Mozambique. Water 2017, 9, 432. [Google Scholar] [CrossRef] [Green Version]
  17. Mahe, G.; New, M.; Paturel, J.E.; Cres, A.; Dezetter, A.; Dieulin, C.; Boyer, J.F.; Rouche, N.; Servat, E. Comparing available rainfall gridded datasets for West Africa and the impact on rainfall-runoff Modelling Results, the case of Burkina-Faso. Water SA 2008, 34, 529–536. [Google Scholar] [CrossRef] [Green Version]
  18. Chomba, I.C.; Banda, K.E.; Winsemius, H.C.; Chomba, M.J.; Mataa, M.; Ngwenya, V.; Sichingabula, H.M.; Nyambe, I.A.; Ellender, B. A review of coupled hydrologic-hydraulic models for floodplain assessments in Africa: Opportunities and challenges for floodplain wetland management. Hydrology 2021, 8, 44. [Google Scholar] [CrossRef]
  19. Karlsson, J.M.; Arnberg, W. Quality analysis of SRTM and HYDRO1K: A case study of flood inundation in Mozambique. Int. J. Remote Sens. 2011, 32, 267–285. [Google Scholar] [CrossRef]
  20. Khaddor, I.; Achab, M.; Hafidi Alaoui, A. Estimation of peak discharge in a poorly gauged catchment based on a specified hyetograph model and geomorphological parameters: Case study for the 23–24 October 2008 flood, KALAYA basin, Tangier, Morocco. Hydrology 2019, 6, 10. [Google Scholar] [CrossRef] [Green Version]
  21. Abrams, M.; Crippen, R.; Fujisada, H. ASTER global Digital Elevation Model (GDEM) and ASTER global water body dataset (ASTWBD). Remote Sens. 2020, 12, 1156. [Google Scholar] [CrossRef] [Green Version]
  22. Shawky, M.; Moussa, A.; Hassan, Q.K.; El-Sheimy, N. Pixel-based geometric assessment of channel networks/orders derived from global Spaceborne Digital Elevation Models. Remote Sens. 2019, 11, 235. [Google Scholar] [CrossRef] [Green Version]
  23. Kumar, A.; Negi, H.S.; Kumar, K.; Shekhar, C. Accuracy validation and bias assessment for various multi-sensor open-source DEMs in part of the Karakoram region. Remote Sens. Letters. 2020, 11, 893–902. [Google Scholar] [CrossRef]
  24. Khal, M.; Algouti, A.; Algouti, A.; Akdim, N.; Stankevich, S.A.; Menenti, M. Evaluation of open Digital Elevation Models: Estimation of topographic indices relevant to erosion risk in the Wadi M’Goun watershed, Morocco. AIMS Geosci. 2020, 6, 231–257. [Google Scholar] [CrossRef]
  25. Schumann, G.J.-P.; Bates, P.D. The need for a high-accuracy, open-access global DEM. Front. Earth Sci. 2018, 6, 1–5. [Google Scholar] [CrossRef]
  26. Corti, B.; Rrokaj, S. Flood Risk Assessment and Mitigation for Rio Muaguide in Cabo Delgado, Mozambique. Master’s Thesis, Politecnico di Milano, Milan, Italy, 2019. [Google Scholar]
  27. Bichet, A.; Diedhiou, A. West African Sahel has become wetter during the last 30 years, but dry spells are shorter and more frequent. Clim Res. 2018, 75, 155–162. [Google Scholar] [CrossRef] [Green Version]
  28. Mouhamed, L.; Kouakou, K.; Adeline, B.; Arona, D.; Salomon, O.; Issiaka, S. Using the CHIRPS dataset to investigate historical changes in precipitation extremes in West Africa. Climate 2020, 8, 84. [Google Scholar] [CrossRef]
  29. Toté, C.; Patricio, D.; Boogaard, H.; Van der Wijngaart, R.; Tarnavsky, E.; Funk, C. Evaluation of satellite rainfall estimates for drought and flood monitoring in Mozambique. Remote Sens. 2015, 7, 1758–1776. [Google Scholar] [CrossRef] [Green Version]
  30. Macey, P.; Miller, J.; Rower, C.; Grantham, G.; Siegfried, P.; Armstrong, R.; Kemp, J.; Bacalu, J. Geology of the Monapo Klippe, NE Mozambique and its significance for assembly of central Gondwana. Precambiran Res. 2013, 233, 259–281. [Google Scholar] [CrossRef]
  31. Nelson, J.M.; Shimizu, Y.; Abe, T.; Asahi, K.; Gamou, M.; Inoue, T.; Iwasaki, T.; Kakinuma, T.; Kawamura, S.; Kimura, I.; et al. The international river interface cooperative: Public domain flow and morphodynamics software for education and applications. Adv. Water Resour. 2016, 93, 62–74. [Google Scholar] [CrossRef]
  32. Biotto, D.; Cancelliere, G.; Corti, B.; Giovannini, A.; Radice, A.; Rrokaj, S. Inundation hazard analysis using open data from the web: Application to the Rio Muaguide in Mozambique. River Flow 2020, 2020, 1415–1423. [Google Scholar] [CrossRef]
  33. Bokhove, O.; Kelmanson, M.A.; Kent, T.; Piton, G.; Tacnet, J.-M. Communicating (nature-based) flood-mitigation schemes using flood-excess volume. River Res. Applic. 2019, 35, 1402–1414. [Google Scholar] [CrossRef] [Green Version]
  34. Brambilla, D.; Longoni, L.; Papini, M.; Giorgetti, E.; Radice, A. On analysis of sediment sources toward proper characterization of hydro-geological hazard for mountain environments. Int. J. Saf. Secur. Eng. 2011, 1, 423–437. [Google Scholar] [CrossRef]
  35. Radice, A.; Giorgetti, E.; Brambilla, D.; Longoni, L.; Papini, M. On integrated sediment transport modelling for flash events in mountain environments. Acta Geophys. 2012, 60, 191–213. [Google Scholar] [CrossRef]
  36. Longoni, L.; Ivanov, V.I.; Brambilla, D.; Radice, A.; Papini, M. Analysis of the temporal and spatial scales of soil erosion and transport in a mountain basin. Ital. J. Eng. Geol. Environ. 2016, 16, 17–30. [Google Scholar] [CrossRef]
Figure 1. Localization of the study area.
Hydrology 08 00092 g001
Figure 2. (a) Routes tracked during the field survey and contour of the flooded area obtained from satellite images taken after cyclone Kenneth (28 April 2019; Kenneth reached its peak intensity on 25 April). (b) Map of the sub-reach classification.
Hydrology 08 00092 g002
Figure 3. (a) A reach labelled as in very good condition with a width of 15–20 m. (b) A vegetated and completely buried riverbed of 5–6 m indicating a poor condition.
Hydrology 08 00092 g003
Figure 4. Basin perimeters and mainstream paths for the four DEMs.
Hydrology 08 00092 g004
Figure 5. Map of the elevation difference between Alos Palsar DEM and SRTM 30 DEM.
Hydrology 08 00092 g005
Figure 6. Differences between ALOS PALSAR and SRTM 90 DEM in the study site. (a) Map of the elevation difference. (b) Frequency distributions of the elevation difference. (c) Map of the slope difference. (d) Frequency distributions of the slope difference.
Hydrology 08 00092 g006aHydrology 08 00092 g006b
Figure 7. Comparison of the average monthly distribution of all the sources, coefficient of variation and mean curves.
Hydrology 08 00092 g007
Figure 8. Soil cover map from ESA.
Hydrology 08 00092 g008
Figure 9. (a) Location of the four sub-basins. (b) Discharge hydrograph resulting from the hydrological modelling with a return period of 10 years.
Hydrology 08 00092 g009
Figure 10. (a) Computational domain, main river path and boundary condition location. (b) Water depth map returned by the hydrodynamic model and flood extent obtained from satellite images taken after cyclone Kenneth (red boundary, same as in Figure 2).
Hydrology 08 00092 g010
Figure 11. (a) Map of the intervention proposed: considered channels and natural reservoir. (b) HEC-RAS scheme used for the modelling: reaches, river junction, storage area and sections.
Hydrology 08 00092 g011
Figure 12. (a) Water profile of reach a and c computed in steady condition with the flow rate of 48 m3/s and 100 m3/s. Comparison of the levee proposed and the present state of the system. The red arrow indicates the position of the river junction. (b) Analogous depiction for reach b. The red arrow here indicates the position of the lateral structure connecting the river to the natural basin.
Hydrology 08 00092 g012aHydrology 08 00092 g012b
Table 1. Summary of the DEM features.
DEMCell Size1st AcquisitionRealisedAbsolute Vertical Accuracy
SRTM90 m20002004<16 m
SRTM30 m20002014<16 m
ASTER GDEM30 m2000–2007 [21]2009<17 m
ALOS PALSAR12.5 m2006–201120114–17 m
Table 2. Table of CN values computed for each sub-basin and for each source of soil cover map.
Sub-BasinCopernicusESAFAO Geo-NetworkAverage CN
Sub-basin 177.0077.0078.8977.63
Sub-basin 277.0077.0078.8377.61
Sub-basin 377.0077.8186.1780.83
Sub-basin 477.0096.3486.6085.98
Publisher’s Note: MDPI stays neutral with regard to jurisdictional claims in published maps and institutional affiliations.

