1. Introduction
Stormwater runoff is defined as the amount of rainfall that is unable to infiltrate the ground and instead flows over the land into streams, rivers, or lakes as surface runoff. While flowing over the land surface, it picks up materials such as leaves, stones, and sediments, but also non-biodegradable plastics, trash, and other pollutants [
1]. There are two key drivers which result in stormwater runoff: (i) rapid and unplanned urbanization, and (ii) climate change. The relation between urbanization and economic growth is a complex one, yet the former has been strongly associated with bringing progress to a nation [
2].
Urbanization alters the nature of surface perviousness by reducing the ability of water to infiltrate soil and, thus, the majority of water runs as overland water. Stormwater runoff in urbanizing areas ranges from 10% in areas with natural land cover to 55% in areas with 75% to 100% surface imperviousness [
3]. While the percent increase is relational, it is region specific and will depend upon the stormwater infiltration facilities as well as on the level of imperviousness. The higher the surface imperviousness, the more surface runoff. Unplanned urbanization, instead of enhancing natural pathways for the flow of water, replaces the surface by installing artificial drainage systems [
4]. The second key driver for runoff is climate change, the manifestation of anthropogenic activities, which is characterized by extreme rainfall events. Stormwater runoff further intensifies in urban areas where natural drainages meant to carry excess stormwater are replaced by unplanned built up areas with inefficient artificial drainage systems [
5].
The severity of adverse runoff impacts can vary across the physical components in an urban watershed. Urbanization and climate change result in an increased runoff rate, less groundwater recharge, a greater magnitude of river flow, and the recurrence of small to major urban floods [
4,
6,
7,
8,
9].
To study the effect of stormwater runoff on downstream water quality, Mohit and Sellu [
10] conducted a comparative impact study of an urban, a suburban, and a rural stream, collecting dry and wet samples from 12 sites. They found that the urban stream had the highest levels of biochemical oxygen demand (BOD), orthophosphate, total suspended sediment (TSS), and surfactant concentrations. The study highlights a strong correlation between the level of development in the watershed and impervious surface coverage with BOD. Similar results were observed in an urban catchment of the rapidly urbanizing Bhatinda city in India [
11]. While the primary effects are mostly observed in the hydrological systems and urban flooding, secondary effects include vulnerability to health risks in humans as well as animals and marine or aquatic life [
9,
12].
Various comparative and standalone studies carried out through hydrological modeling, such as the soil and water assessment test (SWAT), and field observations emphasize that infiltration facilities have a higher efficiency than storage facilities in reducing runoff volumes [
13,
14]. These structures primarily mimic natural processes as they behave as a source control and decentralized stormwater absorption system to facilitate the reduction in surface runoff, minimize environmental degradation, and enhance infiltration. These are developed via a combination of sound site planning, and structural and nonstructural techniques. Some sustainable stormwater management practices include rain gardens, biofiltration swales, bioretention pits, pervious pavements, and green roofs [
6,
15].
Using the SWMM model, Zahmatkesh et al. [
16] investigated the impact of low impact development practices, such as rainwater harvesting, porous pavement, and bioretention, in mitigating the effects of climate change on stormwater runoff in a watershed of New York City. With the implementation of low impact development practices for 2- and 50-year return period extreme precipitation events, both runoff volume and peak discharge reduced significantly. Hunt et al. [
17], through field observations and hydrological modeling, reported that bioretention pits can reduce 0% to 99% of sediment and nutrient losses due to the protective vegetation layer as it acts as a natural filter. Similarly, in Monash University, Melbourne, Hatt et al. [
18] observed peak flow reductions between 49% and 80% for different rain gardens. Additionally, the vegetation of rain gardens effectively removed the suspended solids and heavy metals by 90%.
Various assessment tools for evaluating the sustainability of stormwater practices have been studied. A study conducted by Zhou et al. [
19] in Denmark on urban flood modeling used a hedonic valuation model for cost-benefit analysis and revealed that a conventional drainage system, with traditional storage or source control facilities, has greater efficiency in controlling and reducing the impacts of stormwater runoff. Furthermore, Zhou et al. [
19] analyzed the performance of open urban drainage systems using the cost-benefit approach (CBA) and discussed the socio-economic benefits of the sustainable urban drainage system, such as mitigating flood risks and enhancing the recreational value of local neighborhoods. To validate this research finding, Zhou [
5] further reviewed various assessment tools and highlighted the use of cost-benefit analysis, life cycle assessment tools, and multi-criteria analysis as measures to study economic benefits of rooftop gardens in addressing urban water management issues.
India is on the brink of an urban revolution, with an expected 600 million predicted to reside in cities by 2031 [
20]. India is prone to major river flood risk and has been experiencing urban floods in recent years. Unplanned rapid urbanization is attributed as one of the main reasons behind the increase in flood risks. Indian cities need to adopt unprecedented solutions to tackle urban stormwater runoff to mitigate the unforeseeable occurrence of hydro-meteorological hazards. Studies on decentralized stormwater infiltration practices are largely lacking, especially in developing countries. Gogate et al. [
15] assessed various decentralized facilities, focusing on their advantages and disadvantages in the context of India, and found varying impacts of infiltration measures with region, type of development, soil, and drainage. Andimuthu et al. [
21] tested the performance of urban storm drainage networks and infiltration control measures for urban flood mitigation under a climate change scenario in Chennai city, India. Aside from the use of urban stormwater drainage networks, stormwater best management practices, such as permeable pavements, rain gardens, green roofs, street planters, rain barrels, infiltration trenches and vegetative swales, in hydrologic modeling were suggested to provide more accurate and effective flood management systems.
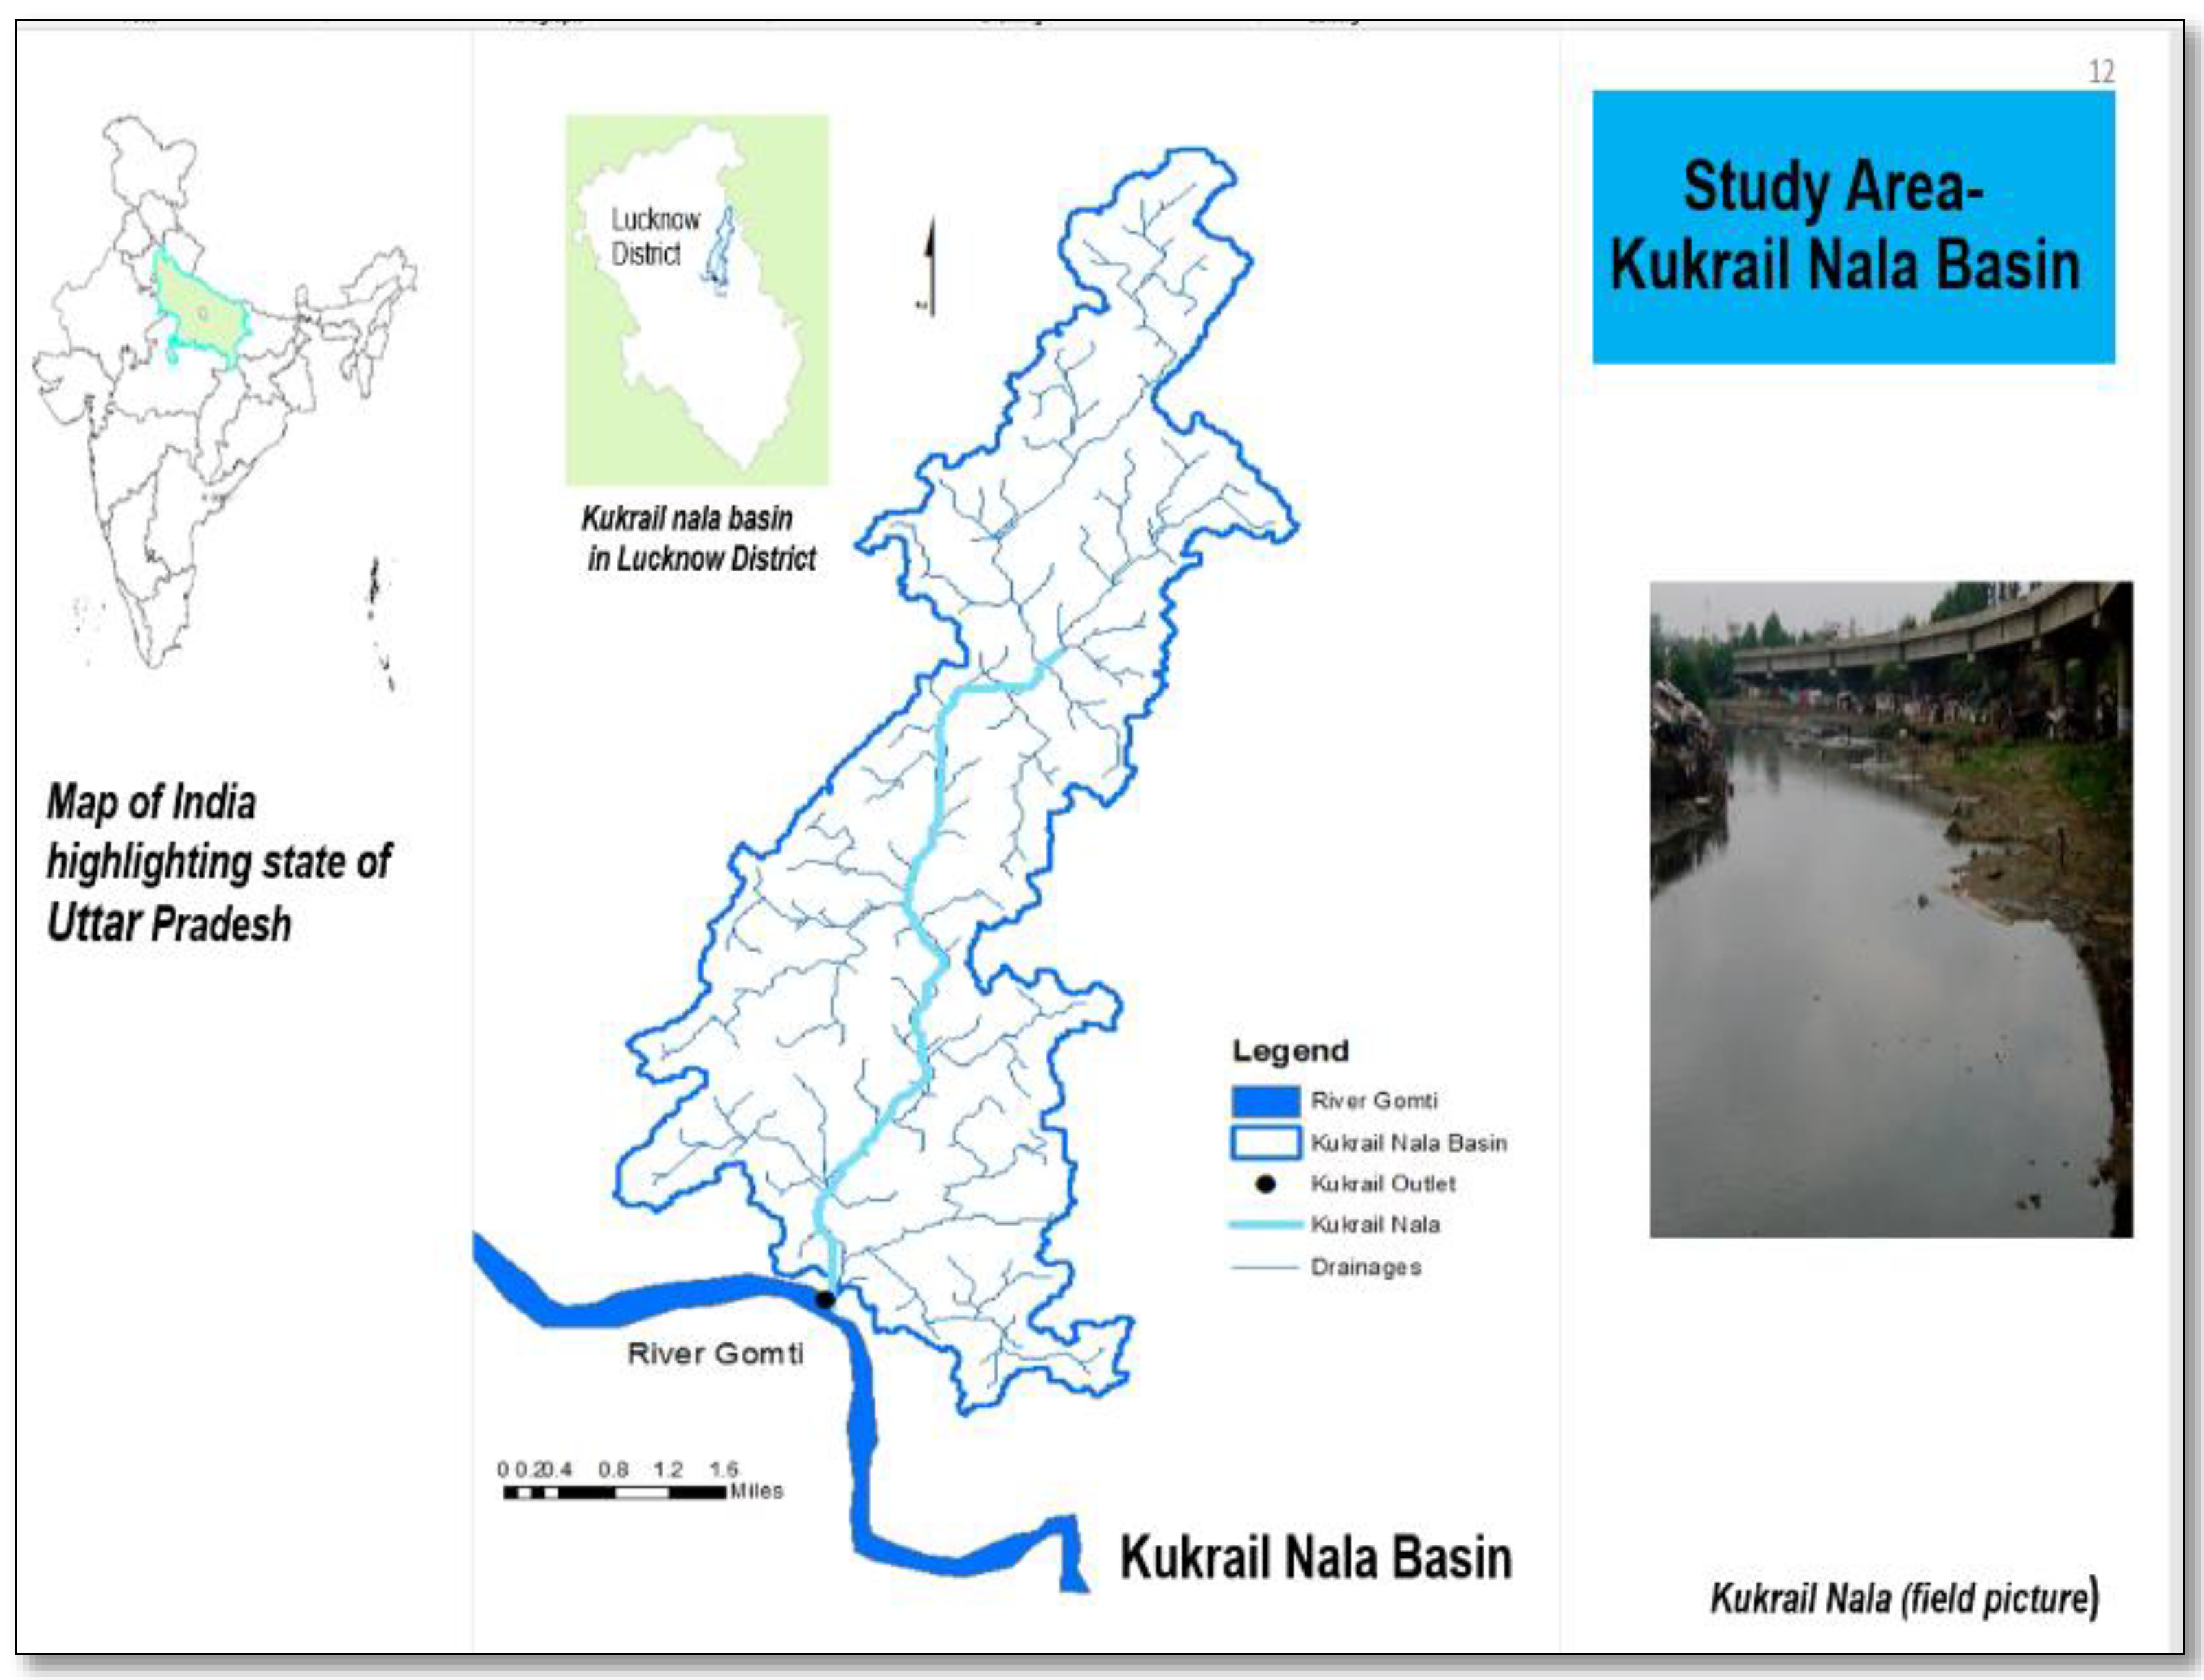
These drawbacks form the main rationale of this study, which is to assess the decentralized stormwater infiltration practices under different physical variability in the context of an urban area in a developing economy such as India. This study focuses on the cumulative impact of stormwater runoff at a catchment scale, when the infiltration facilities are implemented at a local scale, as it can help in reducing the numerous effects of urban floods and waterlogging in unfavorable conditions. Lucknow city is facing an unprecedented decline in groundwater level with each passing year. Most of the rain received during the monsoon season, instead of being stored and infiltrated, is subjected to flow as stormwater runoff. Hence, the objective of urban stormwater runoff modeling in this study is to see: (i) how present and future land use and rainfall will have an impact on surface runoff, and (ii) how decentralized or decentralized infiltration practices at the household level can reduce the impact.
3. Results
The following results were obtained for ten different scenarios (
Figure 3,
Table 2):
Scenario 1: the hydrograph with a daily maximum rainfall of 199 mm resulted in a peak discharge of 182 m3/s. The peak discharge at 17:00 h depicted a lag period of 5 h.
Scenario 2: the daily maximum rainfall of 256.64 mm generated a peak discharge of 259 m3/s. The excess rainfall of 104 mm at 12:00 h and a peak discharge at 17:00 h depicted the same lag time as in scenario 1.
Scenario 3: the daily maximum rainfall of 299.72 mm led to an excess rainfall of 123.4 mm and a peak discharge of 315 m3/s. Analysis of the rainfall hyetograph and flood hydrograph pointed to a time lag of 4 h with extreme rainfall at 12:00 h and peak discharge at 16:00 h.
Scenario 4: the daily maximum rainfall of 226.06 mm generated a peak discharge of 324 m3/s and a steep rising climb. The hydrograph suggested that the lag period was reduced to 2 h, with excess rainfall of 54 mm at 13:00 h and a peak discharge at 15:00 h.
Scenario 5: the daily maximum rainfall of 290.06 mm generated a peak discharge of 426 m3/s. A steep rise in flow hydrograph, starting at 06:00 h, and a peak rise at 13:00 h depicted that the time of concentration reduced with a lag period of 3 h.
Scenario 6: the daily maximum rainfall of 337.8 mm, which is an excess of 81 mm, generated a high peak discharge of 509 m3/s at 15:00 h. The flow hydrograph depicted that the lag period reduced to just 2 h with high runoff volumes.
Scenario 7: the daily maximum rainfall of 256.54 mm generated a discharge of 40 m3/s at 02:00 h. The highest rainfall was recorded at 10:00 h. A peak discharge of 174 m3/s was observed at 18:00 h with a lag time of 8 h.
Scenario 8: the daily maximum rainfall of 299.72 mm resulted in a discharge of 67 m3/s at 02:00 h for alternative land use land cover condition. Extreme rainfall was recorded at 11:00 h. The peak discharge, 204 m3/s, was observed at 17:00 h with a lag time of 7 h.
Scenario 9: the daily maximum rainfall of 290.06 mm resulted in a flow discharge of 56 m3/s at 02:00 h. Extreme rainfall was recorded at 10:00 h and a peak discharge of 174 m3/s was observed at 18:00 h with lag time of 8 h.
Scenario 10: the daily maximum rainfall of 337.8 mm resulted in a flow discharge of 72 m3/s at 03:00 h. Extreme rainfall was recorded at 10:00 h. A peak discharge of 232 m3/s was observed at 17:00 h with lag time of 7 h.
A Pearson product-moment correlation coefficient was computed to assess the relationship between the peak rainfall values of 50- and 100-year return periods for the years 2016 and 2030 with consideration of the infiltration facilities and runoff volume at the outlet of the Kukrail Nala basin (
Figure 4a,b). For scenarios without infiltration facilities, a strong and positive correlation was found between the two variables’ peak rainfall and runoff volumes. There was a positive correlation between the two variables with r = 0.98,
n = 5, and
p = 0.055. Despite of strong positive correlation between peak rainfall and runoff volumes, the relation was not significant as
p > 0.05. On the other hand, for the scenarios with infiltration facilities, a scatterplot between peak rainfall and runoff volumes revealed a strong and positive correlation. The relation was quite significant as
p = 0.003. Runoff volume for each scenario is shown is
Table 3.
4. Discussion
Each scenario has a different characteristic for its hydrograph. Six scenarios (1–6) did not consist of any infiltration facilities. Later, alternative stormwater capture measures (scenarios 7–10) were applied to test their impacts on the flow hydrograph for effectively reducing the runoff volume.
4.1. Without Infiltration Systems in Practice
With a 50-year return period and a peak discharge of 182 m
3/s for current conditions (scenario 1), the study revealed that peak discharge will increase by 42% and 73% for the increase in rainfall, corresponding to scenarios 2 and 3, respectively. This is in line with the already established correlation between increased imperviousness and surface runoff. An average increase of 2.5 times was reported in peak stormflow with the absence of stormwater drains as impervious coverage increases from 0% to 100% [
27]. This would result in an increase in runoff volume by 34% in scenario 2 and 61% in scenario 3. However, the percent increase in runoff volumes from scenario 2 to 3 was 20% and depended largely on the calibrated climate models used. Meanwhile, for a 100-year return period, the peak discharge of 324.4 m
3/s under scenario 4 was projected to increase by 31.4% and 57% in scenario 5 and 6, respectively. This would result in an increase in runoff volumes by 31% and 49.9% in scenarios 5 and 6, respectively, from a business as usual scenario. However, the percent increase in runoff volumes from scenario 5 to scenario 6 was projected to be around only 13%. The slope, as observed in scenario 1 through 6, have similar observations as the steeper the slope, the less lag time and the higher the peak discharge and runoff volume. Sharma and Shukla [
22] found similar observations in their studies. The percentage increase in the runoff volume will also depend on manmade stormwater drainage, which were not present in the land use land cover data. The increase in sudden peak and smaller lag times also represents the smaller time of concentration as scenario changes from stabilized to unstabilized ones.
4.2. With Infiltration Systems in Practice
A significant reduction in peak discharge and runoff volumes was observed by attenuating the excess precipitation through source control infiltration measures. It resulted in an overall decrease for the 50-year return period in both scenarios 7 and 8, and a similar observation was made under scenario 9 and scenario 10 for the 100-year return period. A decrease in peak discharge and runoff volumes by 48% and 51%, respectively, was observed for scenario 7 with infiltration facilitates, in comparison to scenario 2 with no infiltration measures. Similarly, under scenario 8 with infiltration measures, the peak discharge and runoff volumes were reduced by 54% and 10%, respectively, in comparison to scenario 3 with no infiltration measures. For the 100-year return period, a decrease in peak discharge and runoff volumes by 59.5% and 4%, respectively, was observed for scenario 9, in comparison to scenario 5 with no infiltration measures. Similarly, under scenario 10 with infiltration measures, the peak discharge and runoff volumes reduced by 54.4% and 12%, respectively, in comparison to scenario 6 with no infiltration measures. The decentralized stormwater facilities in the 50-year return period had extreme values that were more effective in reducing the runoff volumes as compared to the extreme values for the 100-year return period. The amount of infiltration will depend not just on type of decentralized measure, but also how well it is maintained, and the results of discharge will vary from a connected green roof system (more than 50% absorption on the roof) to pervious pavement (material of manufacturing). Additionally, maintenance and clearance of associated drainage will also impact the runoff discharge.
However, for managing flood water and stormwater reduction, we need to look for the best management practices, which are practically feasible, low cost, and easy to maintain, especially in resource-limited countries like India. The most important task is to estimate the carrying capacity and stability of the existing stormwater management system. Different possible management options are considered via demand supply gap analysis and cost-benefit analysis. Some of the most common solutions are gutter filters, infiltration trenches, permeable pavements, decentralized retention ponds, street sweeping on a regular basis to prevent the choking of sewerage pipes, and surface sand filters, etc. Another crucial component for the success of stormwater management practices is community awareness, as the community is largely unaware about the advantages of this management system and are not willing to participate in maintenance works.
4.3. Correlation Analysis
Although there is a positive relation between rainfall and runoff, this relationship was not significant for several scenarios without infiltration facilities. This result resonated with the findings of Miguez and Magalhaes [
3], which mentioned that rainfall may not be the only criteria for high runoff volumes and other factors like geography, and geomorphology, etc., might also impact runoff volume. However, runoff volumes can be significantly reduced with infiltration facilities at times of peak rainfall events. It can be also said that infiltration measures are more suitable for an average climate with extreme rainfall of a 50-years return period. The infiltration rate may not be effective if rainfall under extreme climate with a 100-years return period occurs.
Thus, it can be said that the capacity of decentralized infiltration facilities to reduce the runoff volume and peak discharge depend not only on land use and rainfall, but also on the soil condition and topography of the watershed (slope and time of concentration). While there is a correlation between land use and rainfall with runoff volume, it might be strong or weak depending upon the condition of the area. The closer the distance between the facilities in a gradient, the more the infiltration. It should also be noted that the infiltration facilities are more effective for short-term planning.
4.4. BMP Implementation Challenges
Lucknow city has witnessed a major decline in water bodies which were once the natural sponge for water storage and infiltration. Low- to medium-cost housing with infiltration facilities could lead to incurring a higher per unit cost value, which might make it unaffordable for many low to middle-income families. The regular operational and maintenance cost of the facilities might influence the willingness of people to adopt it at a household level and hence was considered a threat. The current developmental activities in the peripheral area, resulting in higher abstraction of groundwater and lower infiltration, was also seen as a threat. Lastly, as a part of a developing nation, water management is not considered a priority when providing necessities for human survival, namely food, shelter, and water, are more pressing. In the absence of strong groundwater management policies, urbanizing areas are witnessing faster depletion of groundwater. While surface imperviousness plays a role in increased runoff, it is also believed that having a small built-up area of less than 200 square feet leaves one with no other option but to construct homes without any gardens. Most people are unaware of decentralized infiltration facilities as a result of loopholes in the regulatory body, due to a communication gap between various departments, and the inconsistency in the field data collection as well as a lack of data. The lack of communication in higher authorities trickles down to the public, where awareness regarding the source of stormwater control is low. The present conditions of the city, which have made it difficult to practice decentralized stormwater management, include a lack of technical expertise, soil conditions, and maintenance cost. Maintaining these facilities is a continuous challenge. Moreover, the government does not provide any subsidies for maintenance and there are no provisions (tax rebate, grants, etc.) for green infrastructure. If the available facilities are not properly maintained, causing runoff and urban flooding, it is less likely that the decentralized management system will work. There are no frameworks or committees to investigate policies specifically looking into subsidies for infiltration facilities. This could directly affect any implementation practices and, from an economic viewpoint, it is difficult to say if it will succeed in the future.
The monsoon is witnessing a shift in its pattern. While there is not much change in the annual rainfall received, the intensity and frequency has altered. At present, the drainage system and other traditional systems fail due to the heavy rainfall, which might cause the decentralized stormwater infiltration facilities to fail too.
The following 5 strategies were suggested as the best to promote the idea of stormwater infiltration practices:
- WT1:
a stakeholders workshop on integrated water resource management with the involvement of citizens;
- WT2:
preparation of strategic plans to promote decentralized stormwater infiltration practices and segregated and designated pipelines through the Master Plan, with a focus on climate change;
- WT3:
the involvement of real estate for developing solar plus water secured societies;
- WT4:
focusing on research and development by investing in it and expanding the base of technical experts among the growing population;
- WT5:
making the procedure of policymaking more transparent through coherent government policies and with a focus on climate change.
5. Conclusions
Replenishment of surface and ground waterbodies through rainfall is a natural phenomenon necessary to maintain the geo-hydrological balance of nature. Urbanization and climate change pose a severe threat to the quality and quantity of waterbodies. It is essential to recognize the associated risks of excess runoff from urban areas to enhance not just the quality of the environment, but an overall quality of life. Conventional centralized flood management systems are reported to have several limitations. There is much to be learned from non-conventional, decentralized stormwater management systems that municipalities have adopted to cope with urban floods and waterlogging in several parts of developed countries. However, these facilities need to be mainstreamed into the communities of vulnerable areas in the rapidly urbanizing cities of developing nations, where the cities are overburdened with more complex stormwater. To achieve that, research based on local conditions, practices, and management strategies should be understood in detail and incorporated with more advanced scientific knowledge to tackle the problems of conventional stormwater management systems.
This study delved into the hydrological assessment of decentralized stormwater management practices in an urban watershed of Lucknow city in Northern India. The study explored multiple scenarios based on current and future projections of land use and climate change to understand impacts of urbanization and precipitation on stormwater runoff. The results showed an increased runoff volume with the rapid urbanization and climate change. Implementation of infiltration facilities using the local landscape can have different impacts on the volume of runoff. The stormwater modeling study results showed that conversion of impervious surfaces to pervious ones by installing a decentralized facility can help infiltrate the water and immediately curb the peak runoff discharge. Decentralized stormwater runoff infiltration systems are a relatively new concept in most developing countries, and Lucknow city is no different. However, keeping in mind the growing scarcity of water resources and climate change, more studies around best strategies to conserve water quality and quantity should be encouraged at a policy level.


