Communication

Establishing Stage–Discharge Rating Curves in Developing Countries: Lake Tana Basin, Ethiopia

by
Teshager A. Negatu
1,2,
Fasikaw A. Zimale
1,* and
Tammo S. Steenhuis
1,3,*
1
Faculty of Civil and Water Resource Engineering, Bahir Dar Institute of Technology, Bahir Dar University, Bahir Dar, Ethiopia
2
Abbay Basin Development Office, Bahir Dar, Ethiopia
3
Department of Biological and Environmental Engineering, Cornell University, Ithaca, NY 14850, USA
*
Authors to whom correspondence should be addressed.
Hydrology 2022, 9(1), 13; https://doi.org/10.3390/hydrology9010013
Submission received: 1 December 2021 / Revised: 28 December 2021 / Accepted: 30 December 2021 / Published: 12 January 2022

Abstract

:
A significant constraint in water resource development in developing countries is the lack of accurate river discharge data. Stage–discharge measurements are infrequent, and rating curves are not updated after major storms. Therefore, the objective is to develop accurate stage–discharge rating curves with limited measurements. The Lake Tana basin in the upper reaches of the Blue Nile in the Ethiopian Highlands is typical for the lack of reliable streamflow data in Africa. On average, one stage–discharge measurement per year is available for the 21 gaging stations over 60 years or less. To obtain accurate and unique stage–discharge curves, the discharge was expressed as a function of the water level and a time-dependent offset from zero. The offset was expressed as polynomial functions of time (up to order 4). The rating curve constants and the coefficients for the polynomial were found by minimizing the errors between observed and predicted fluxes for the available stage–discharge data. It resulted in unique rating curves with R2 > 0.85 for the four main rivers. One of the river bottoms of the alluvial channels increased in height by up to 3 m in 60 years. In the upland channels, most offsets changed by less than 50 cm. The unique rating curves that account for temporal riverbed changes can aid civil engineers in the design of reservoirs, water managers in improving reservoir management, programmers in calibration and validation of hydrology models and scientists in ecological research.

1. Introduction

Accurate stream flow records are indispensable in hydrologic information systems, water resources and flood plain management, disaster warning, and validation of models at catchment and basin-wide scales [1,2,3]. These discharge records are obtained by converting the semi-continuous measurement of the river stage using stage–discharge relationships (also called rating curves).
The scientific literature on quantifying discharge is primarily concerned with the uncertainty of rating curve measurements, including inaccuracies in the calibration of the flow measurement instrumentation and the uncertainty in estimating the parameters to changes in river geometry [4,5,6,7,8,9].
All research on the rating curve uncertainty has been carried out in data-rich environments in developed countries with funded and well-functioning institutions where stage-discharge measurement and related environmental data are regularly taken [4,8]. In one of the few manuscripts recognizing that data is scarce, Manfreda [10] proposed a method to accurately calculate high discharges from existing intermediate discharge measurements by taking the channel shape and wetted perimeter into account. None of these studies address improving rating curves in developing nations where the maintenance of a stream gauge network is poor because funds are unavailable [11] and the personnel is inexperienced. Consequently, stage–discharge measurements are infrequent in developing countries [12,13].
One of these regions with scarce records is the 15,094 km2 Lake Tana basin in the headwaters of the Blue Nile in the Ethiopian Highlands. However, detailed knowledge about its resources is lacking due to insufficient monitoring in the past. About 30% of the data set for the gauging stations in the Tana basin were observed during the last five years (2016–2021). The river in the basin with the most measurements is the Gumara. It drains a 1302 km2 area and has 149 stage–discharge measurements during the past 60 years. The Gilgel Abbay, the largest river in the basin, has only 30 stage–discharge measurements over the same 60 years period. For all rivers, significant data gaps exist during political turmoil and conflicts.
Like other developing regions, the Ethiopian Highlands have a monsoon climate where large storms often rearrange the stream by either sedimentation or scouring [2,14], shifting the rating curve [4,15,16,17]. The calibration of stage–discharge curves [17] for these rivers is crucial for accurate streamflow records, especially in areas where channel bed elevations change.
Lake Tana basin, as a development corridor, is entertaining significant investments in the water sector. The planning of projects in this basin is hampered by a lack of accurate long-term streamflow data. Current methods used by planners and engineers in Ethiopia include finding separate rating curves for short periods [18,19]. Several rating curves are developed from the measurements over short periods without considering preceding or successive information with rating curve coefficients outside the range expected for natural streams. These rating curves are only suitable for ranges within measured discharges and result in unrealistic discharge estimates outside the measurement range. So, the objective is to develop a simple method for developing rating curves that account for temporal changes in the stream channel bed.
The method is tested in the Lake Tana Basin in Ethiopia. The procedures developed are valid for other locations where streamflow records are infrequent, and stage–discharge curves were not updated regularly. It also allows for determining the uncertainty in the measured discharge data.

2. Materials and Methods

2.1. Study Area

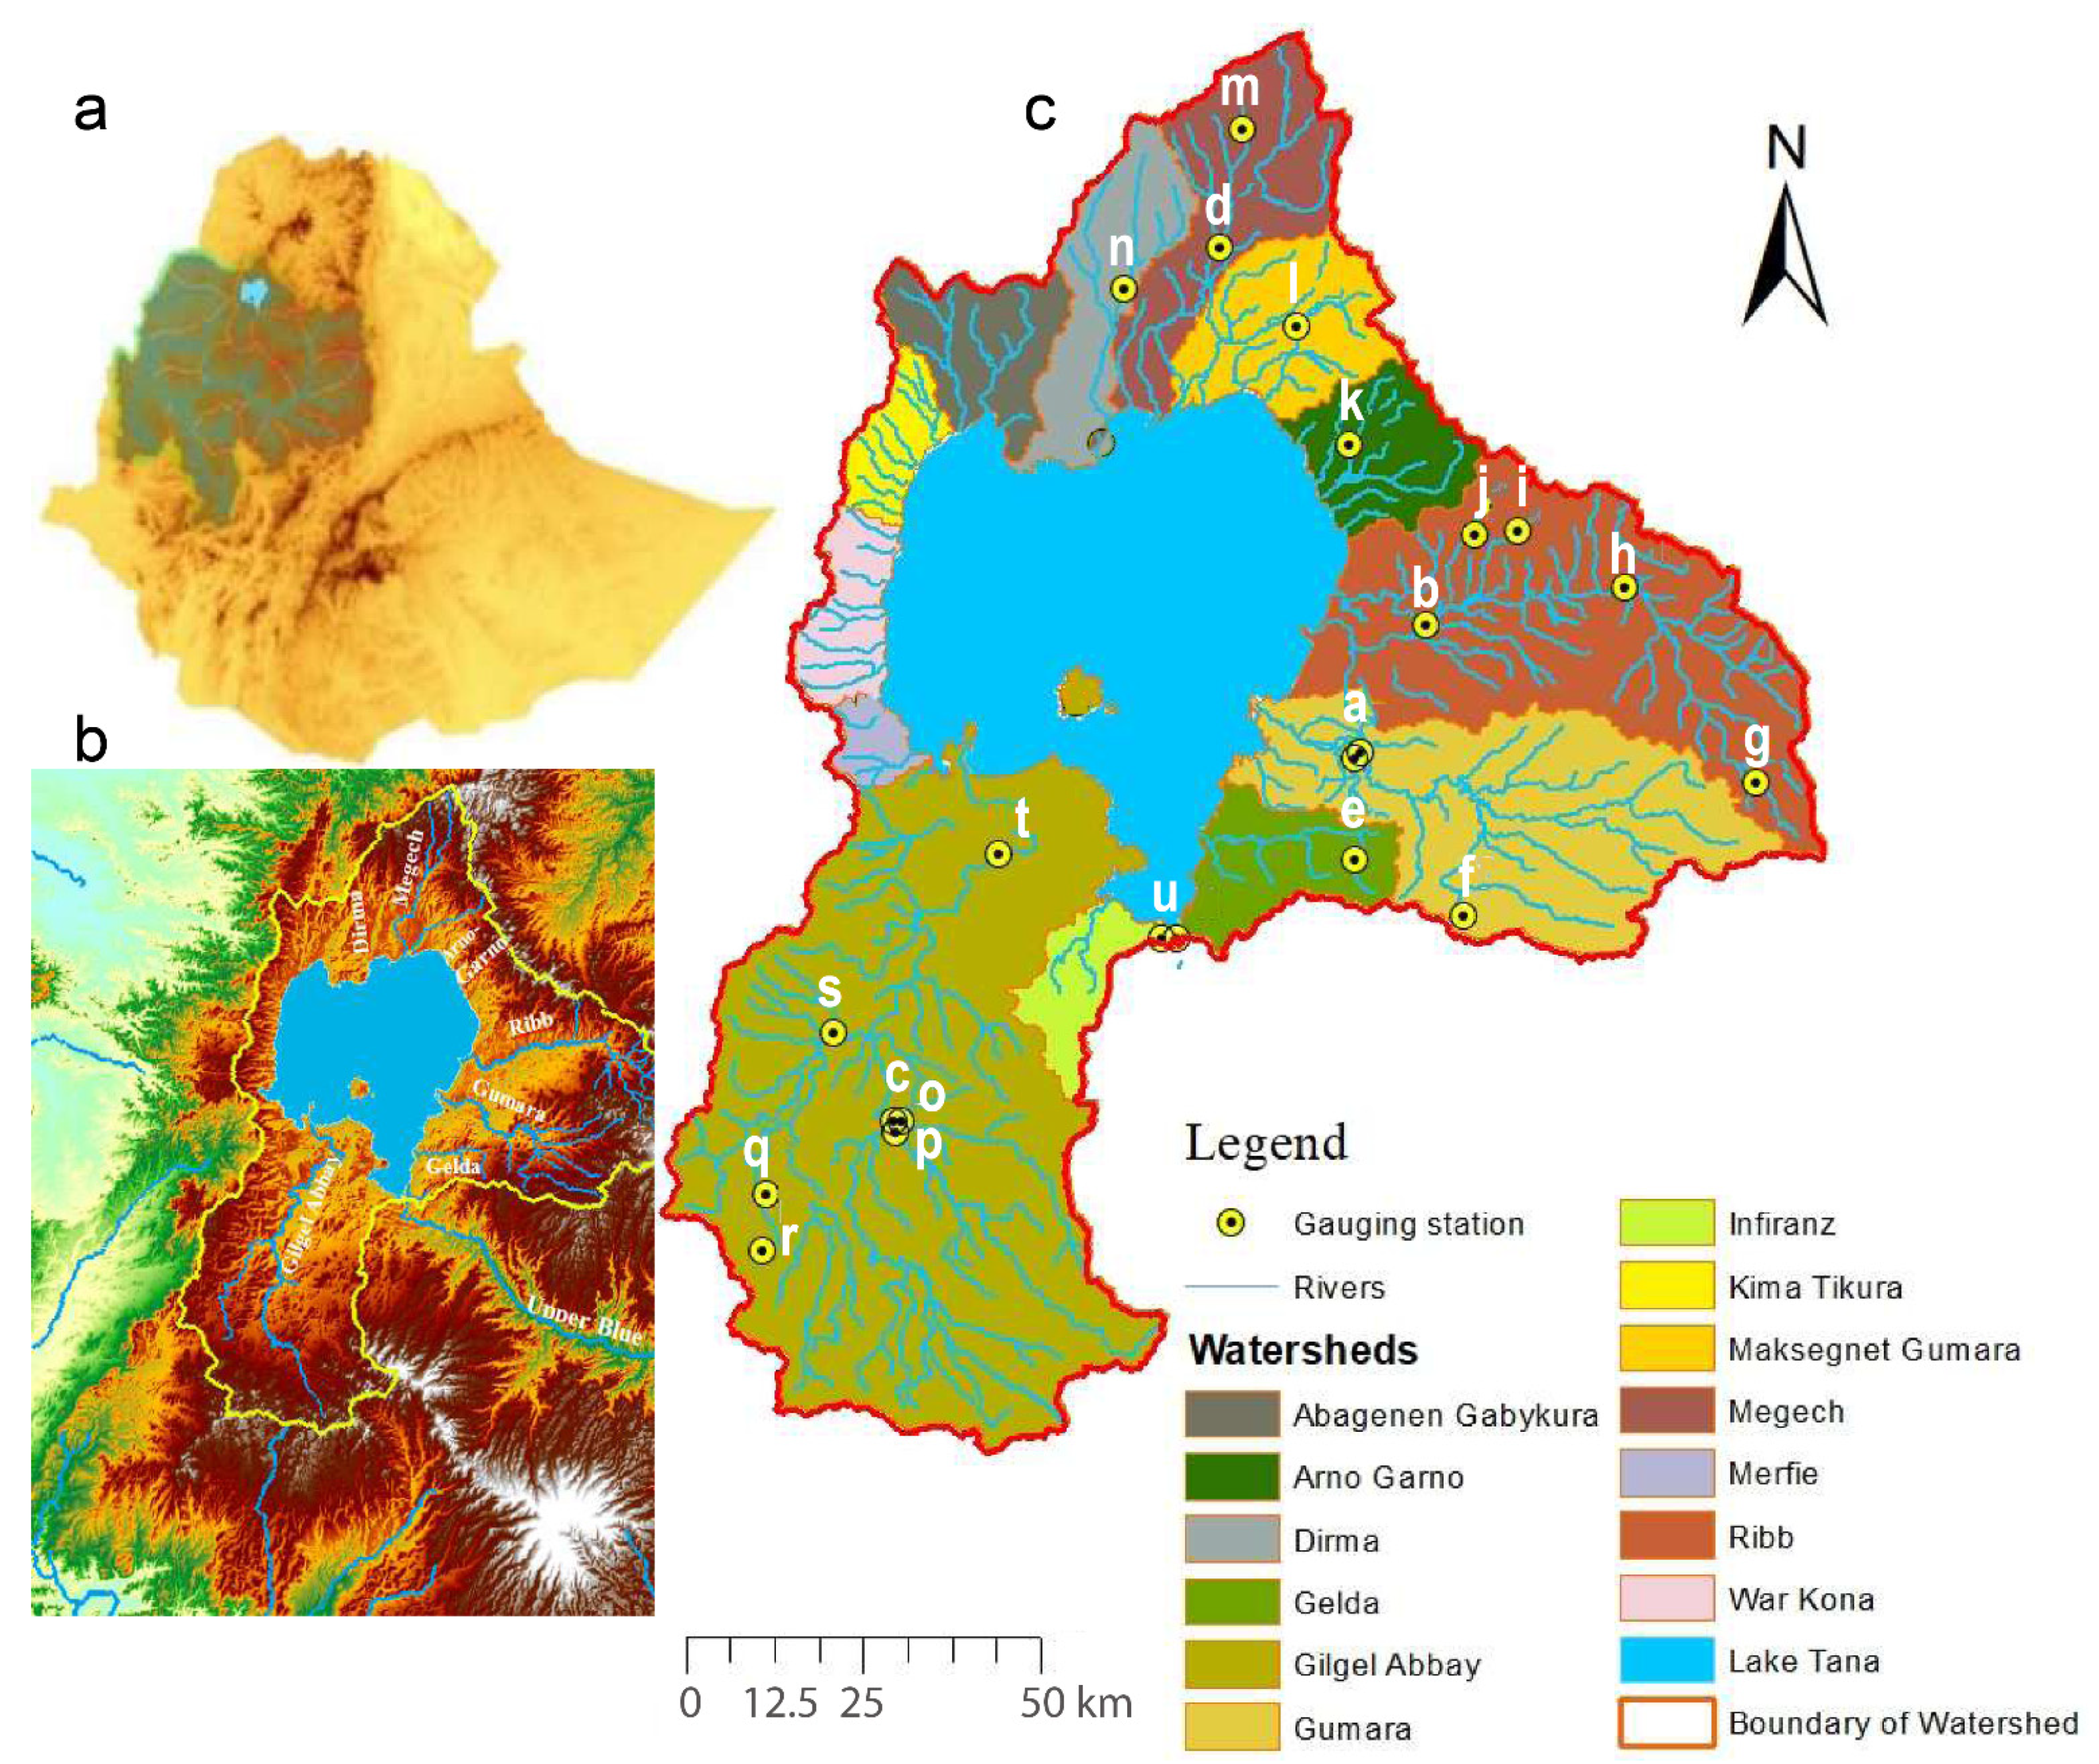
2.1.1. The Lake Tana Basin and Its River System

The 3014 km2 Lake Tana occupies a shallow depression in Ethiopian highlands. It is the source of the Blue Nile that was formed by a lava dam [20]. Four principal rivers, Gumara, Ribb, Megech, Gilgel Abbay, and 40 small creeks, feed the lake from the 12,080 km2 basin (Figure 1). The Gumara and Ribb watersheds are situated in the eastern part of the Lake Tana basin, accounting for 30% of the total basin area (Figure 1). The Gilgel Abbay watershed in the south is the largest, draining 31%, and the Megech is in the north, the smallest of the four watersheds has an area of 460 km2. The elevation in the basin ranges from the average lake level at 1786 m a.s.l to 4135 m a.s.l. The primary land use in the basin is subsistence agriculture.
The Lake Tana basin is undergoing rapid development. Agriculture has been intensifying since the 1950s [12], which increased erosion in the uplands and sedimentation in the flood plains. The Ethiopian government designated the Lake Tana basin as a growth corridor in 2009 as part of the Growth and Transformation Plan [21,22,23,24,25,26]. As a component of this effort, the Koga and Ribb dams were built to store water for irrigation in the dry monsoon phase [27,28]. The Seraba pump irrigation system is partially operational. Two other dams (Jemma and Gilgel Abbay) are planned for the upcoming years. In 2010, Beles hydroelectric power became operational [29] through a tunnel from Lake Tana to the Beles. Ultimately, 80,000 ha will be irrigated in the Lake Tana basin [18,30].

2.1.2. Gauging Stations and Data Collection

Stage–discharge measurements for 21 gauging stations in the Lake Tana basin were obtained from the Abbay Basin Authority (ABA). The gauging stations are listed in Table 1, and the locations are shown in Figure 1. At these gauging stations, the daily discharges were measured by a current meter in wading or otherwise from existing bridges by operating on cranes (Figure 2). Records were available from the Ministry of Water Resources Irrigation and Electricity (MoWIE) and Abbay Basin Development Office (ABDO) for the four major rivers for 60 years for the Gilgel Abbay, Ribb, Gumara, and Megech (Table 1). The Kirari station near Addis Zemen had the shortest record of three years (Table 1).
In addition, during 2019 and 2020, stage–discharge measurement and surveys of cross-sections were measured for the following stream gauges: Gilgel Abbay at Bikolo, Koga at Bikolo, Gumara at Woreta (Figure 1 and Figure 2a), Ribb near Addis Zemen (Figure 1 and Figure 2b), Megech at Azezo, Dirma at Koladeba, Abbay at Bahir Dar Peda below the outlet of Lake Tana. The total number of observations varied greatly from 149 for the lower reaches of the Gumara to 16 for Jemma near Bikolo (Table 1). The stage–discharge measurements for the four main rivers started in 1960 (Table 1). Unfortunately, data were not collected for many stations during unrest between 1970 and 1980 and 1997 to 2004.
The flow control conditions varied among stations and ranged from unstable in the alluvial plains with a low conveyance capacity to stable channel control in the uplands [33,34]. The heavy erosion in the uplands of Lake Tana increased the elevation of the flood plain and the bottom of the channel. The bottom of the stream channel of Gumara at Woreta is increased by about 2 m [35], and the Ribb near Addis Zemen increased by 3 m [12]. The other station affected is Megech at Azezo (Table 1; Figure 1). The remaining stations are in uplands with moderate to steep gradients where the river cross-sections change due to the transport of boulders and cobbles at times of high discharge leading to either deposition or scouring (Table 1). Therefore, fitting a single rating curve with a constant offset to all stage–discharge measurements leads to inaccurate discharge estimates [13,36,37].

2.2. Methods

2.2.1. The Rating and Offset Equations

Stage–discharge rating curves convert recorded water levels (stage/height) to discharge [15,38,39,40]. The rating curve can be expressed as [16,41,42,43,44,45]:
  Q ( t ) = C [ h ( t ) h o ( t ) ] n
where Q ( t ) is the discharge (m3/s), h ( t )   is the water level above the reference level (m), n is the exponent, C is the discharge coefficient, and h o ( t )   is the height of the river bottom above a reference called the offset and may change throughout the record [17,46]. The value of ho is positive when the bottom is above this initial reference level or negative when the riverbed is below this level. Both C and n are constant as long as the cross-section of the river does not change.
Based on the assumption that the C and n are invariant in time, the offset h o ( t ) can be calculated for each pair of stage and discharge measurements by rearranging Equation (1) as:
h o ( t ) = h ( t ) [ Q ( t ) C ] 1 n
The water depth above the bottom of the river at time t, h * ( t ) , can be written as
h * ( t ) = h ( t ) h o ( t )
The stage–discharge curve for a variable channel bottom height can be expressed using Equations (1)–(3) as:
Q ( t ) = C [ h * ( t ) ] n
This equation can then be used with the original unadjusted data to calculate the streamflow data as:
Q a ( t ) = C a [ [ Q o C o ] 1 n o h o ( t ) ] n a
where the subscript o indicates that the observed discharge in the record calculated with the original rating curve with coefficients C o and n o ; the subscript a denotes the corrected and actual flows with the newly calibrated coefficients C a and n a .
So far, we have implicitly assumed that width of the channel remains the same. For example, when the channel becomes wider, the flow increases for the same water level and the same offset. An increase in channel width is equivalent to a decrease in offset. Thus, the offset fitted to the measured stage–discharge data should be considered as an “effective offset” for channels that change in depth and width.

2.2.2. Procedure to Find C, n, and h o ( t )

Based on the assumption that throughout the period of record, C and n remain constant, and the offset h o ( t ) can be written as a polynomial function of time, C, n and h o ( t )   can be found by minimizing the difference between observed discharge during the stage–discharge measurement and discharge calculated with Equation (2). An example to find the optimum C and n for the Megech gauging station at Azezo (1964–2020) with 97 stage–discharge measurements is given in Figure 3.

2.2.3. Observed Relationships of the Stage–Discharge Measurements

The Megech gauging station, as one illustration of such relationships, consists of 97 observed stage–discharge (h-Q) data points available since 1960 are plotted in Figure 4. Different colors are used for different periods: 1960–1983; 1984–2006; and 2007–2020. Obviously, the relationship between stage and discharge is not unique (Figure 4a). For example, the observed stage height for the observed flow of 10 m3/sec increases in time. Between 1960 to sometime before 1983, the stage was 0.6 m. The stage was 0.82 m from the 1980s to 1996. It increased to 1.0 m in around 2010, after which it decreased to 0.70 m in 2021.

2.2.4. Finding the Optimum Values

The optimum C and n values in Equation (1) for a river gauging station are found in a two-step procedure. The first step is carried out in Excel by calculating the h 0 ( t ) values iteratively with Equation (2) for all stage–discharge pairs using the rating function. Then the h 0 ( t ) values are plotted as a function of time. Next, the polynomials with orders 1 to 4 are fitted through the data points of h 0 ( t ) and t by systematically changing the C and n values such that a visually realistic line is obtained with a high R2 and minimum RMSE, and that reduces the distance between the clusters of h 0 ( t ) at any time t (Appendix A). Outliers that do not belong to any of the clusters (i.e., more than two times the average distance between the data points in the clusters) were removed from the dataset.
In the second step, the lowest order polynomial was selected using the non-linear “nls” function of the R program until the polynomial coefficients were significant at the 5% level. The program performs an analysis of variance (ANOVA, using a partial F-test). It tests the null hypothesis that a lower-order polynomial is sufficient (p < 0.05) to validate the data against the alternative hypothesis that a higher-order polynomial is required. The analysis is performed by nesting the polynomials, i.e., the lower-order polynomials as a subset of the higher-order polynomial. For example, for the Megech, we found that the polynomial coefficients were significant at the 5% level for the fourth order polynomial.

2.2.5. Confidence Intervals

After the best fit polynomial was determined, the upper confidence boundary is found by adding two times the standard error (2SE) from the predicted value. The lower boundary is found by subtracting two times the standard error (2SE). The standard error of the non-linear fit of the offset-time polynomial, and the 95% confidence intervals (after removing the outlier) are given in Figure 4.

2.2.6. Stage Discharge Curve

With the above-described procedure, the optimized values of C and n for the selected polynomial in Equation (1) are used to obtain the new rating curve as an h*(t) function. The value of h*(t) is equal to the difference of the observed stage height and the offset, h o ( t ) at time t. The coefficient C = 29.48 and the exponent n = 2.49 of the rating curves of Megech are determined with the procedure described above (Figure 3c).

3. Results

The data for the long-term stations on the three major rivers are presented in the main text in the next section. The specifics for the fourth-largest river, Megech, were given above to explain the method followed. All 21 stations, including the four presented in the main text and the remaining 17 stations with at least 15 stage–discharge measurements (as recommended [42]) are displayed in Appendix B and Appendix C, and are intended for researchers and modelers in the Lake Tana basin.

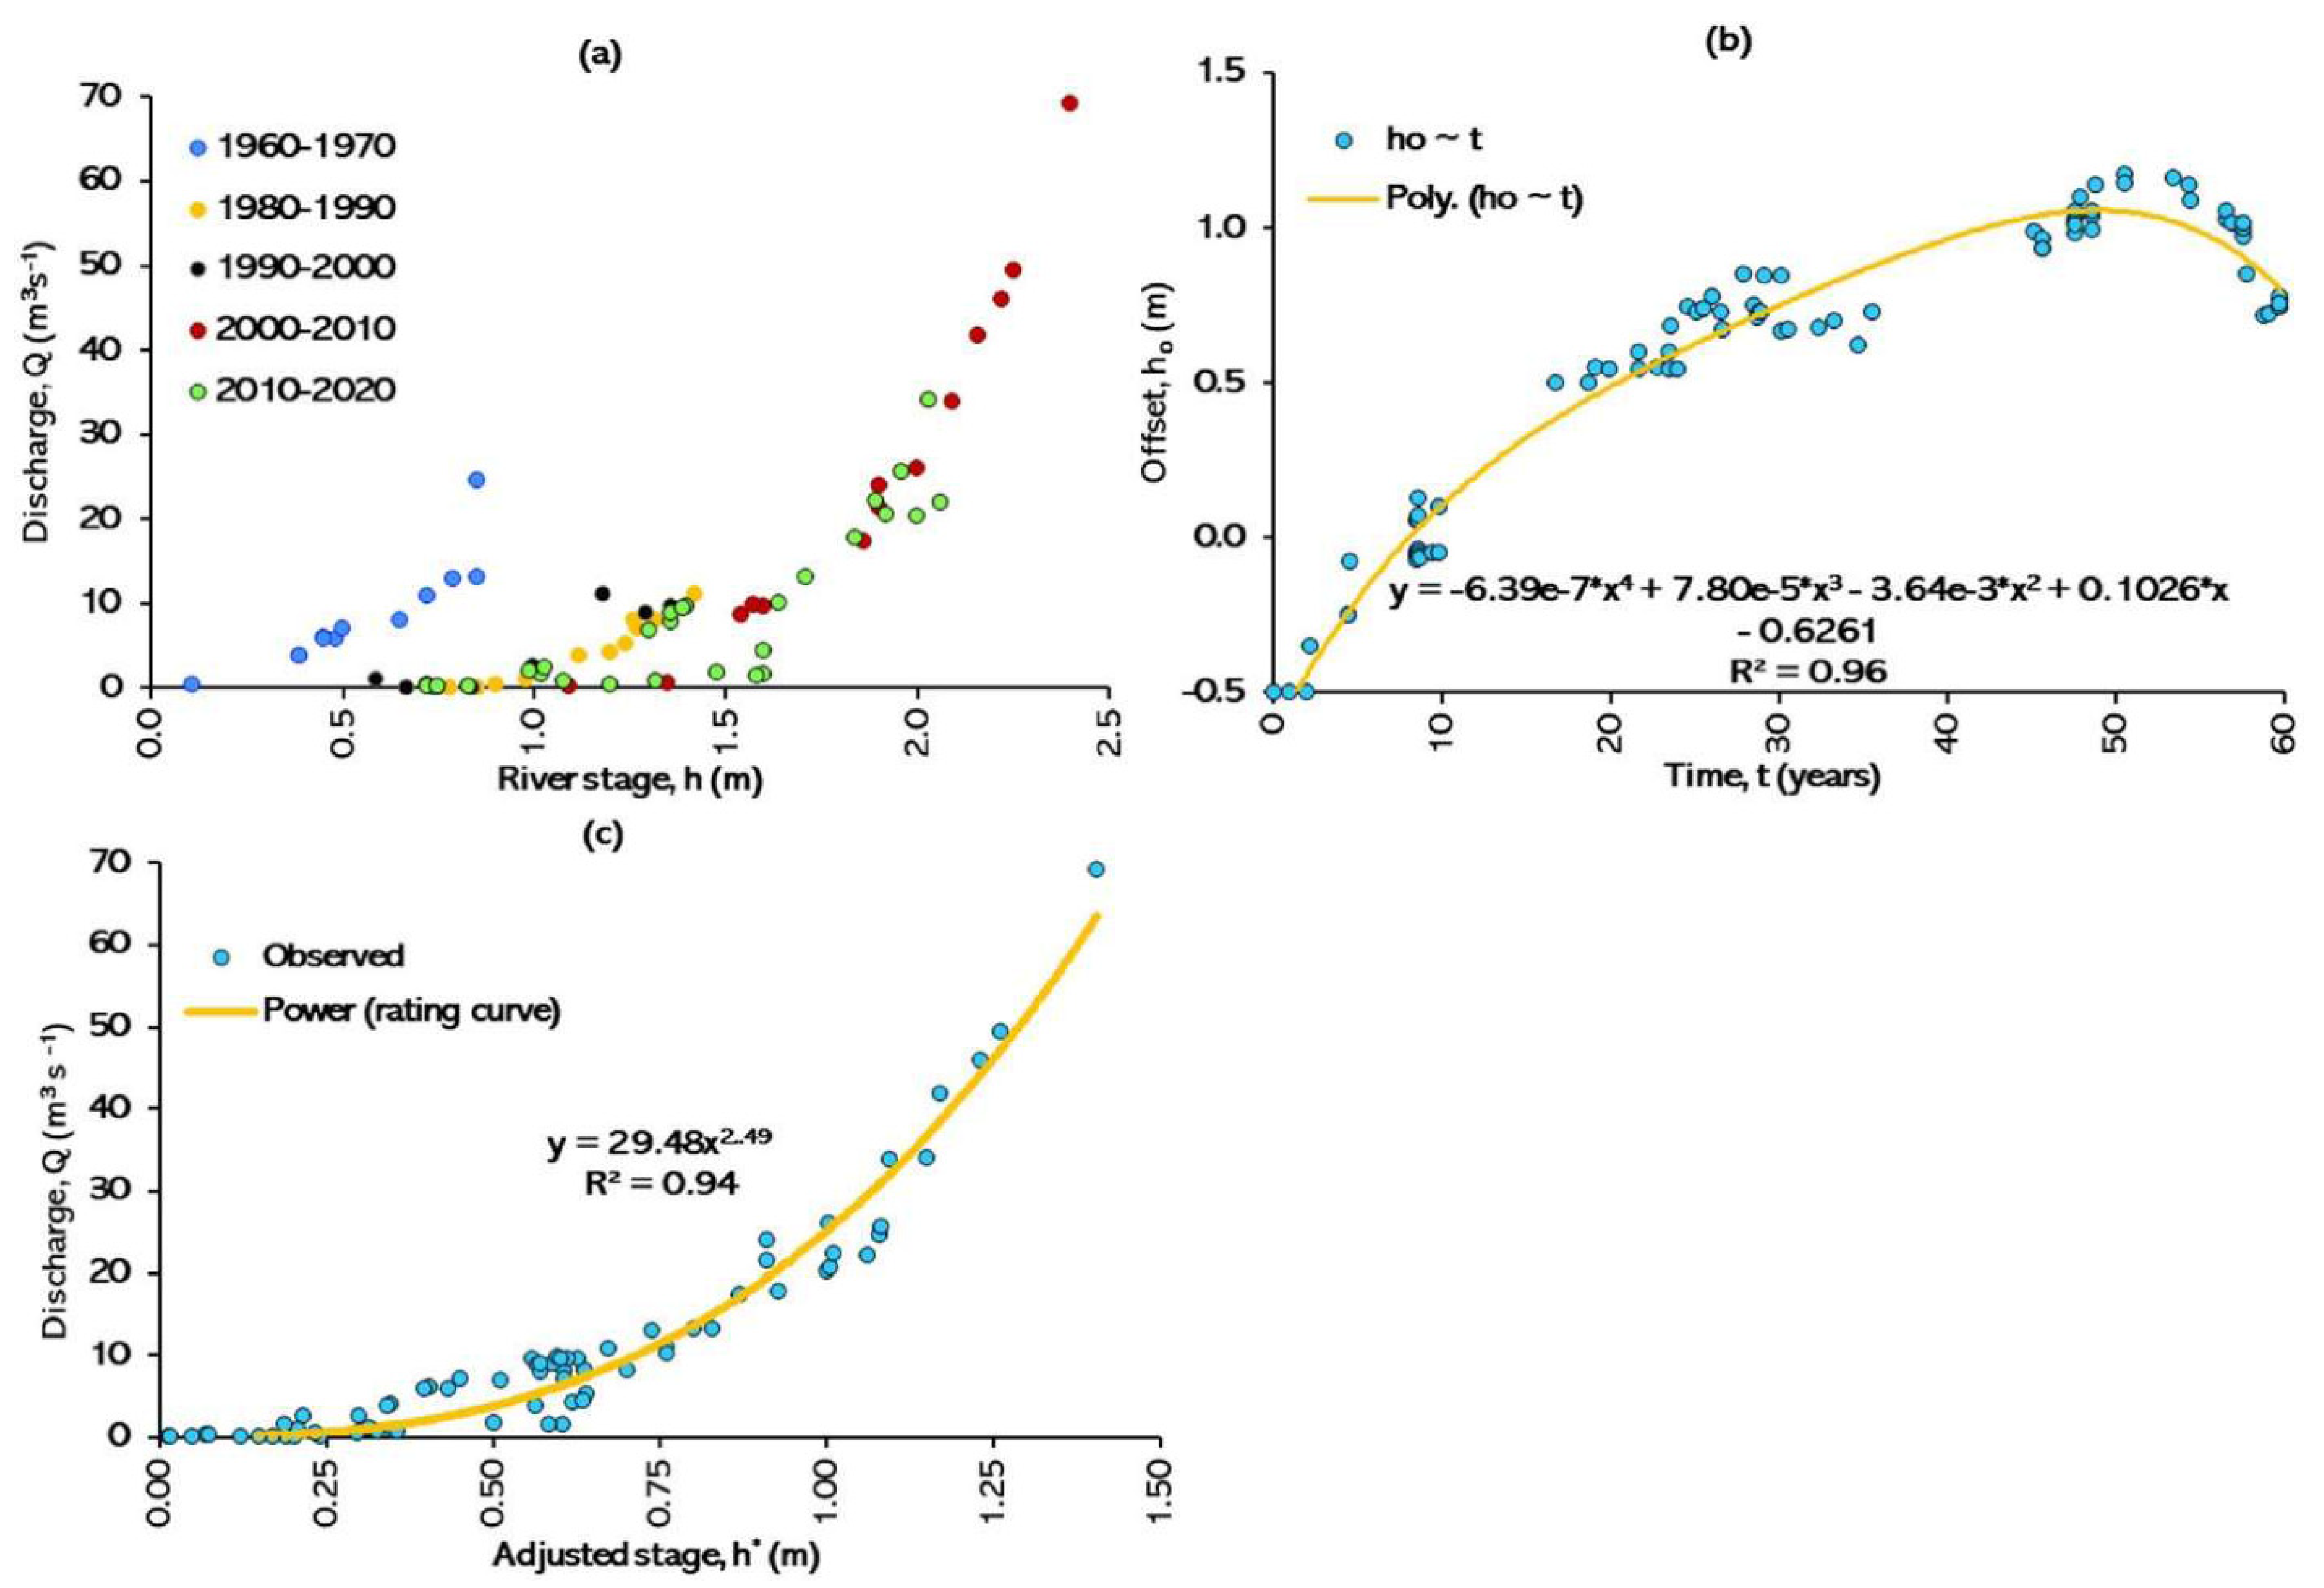
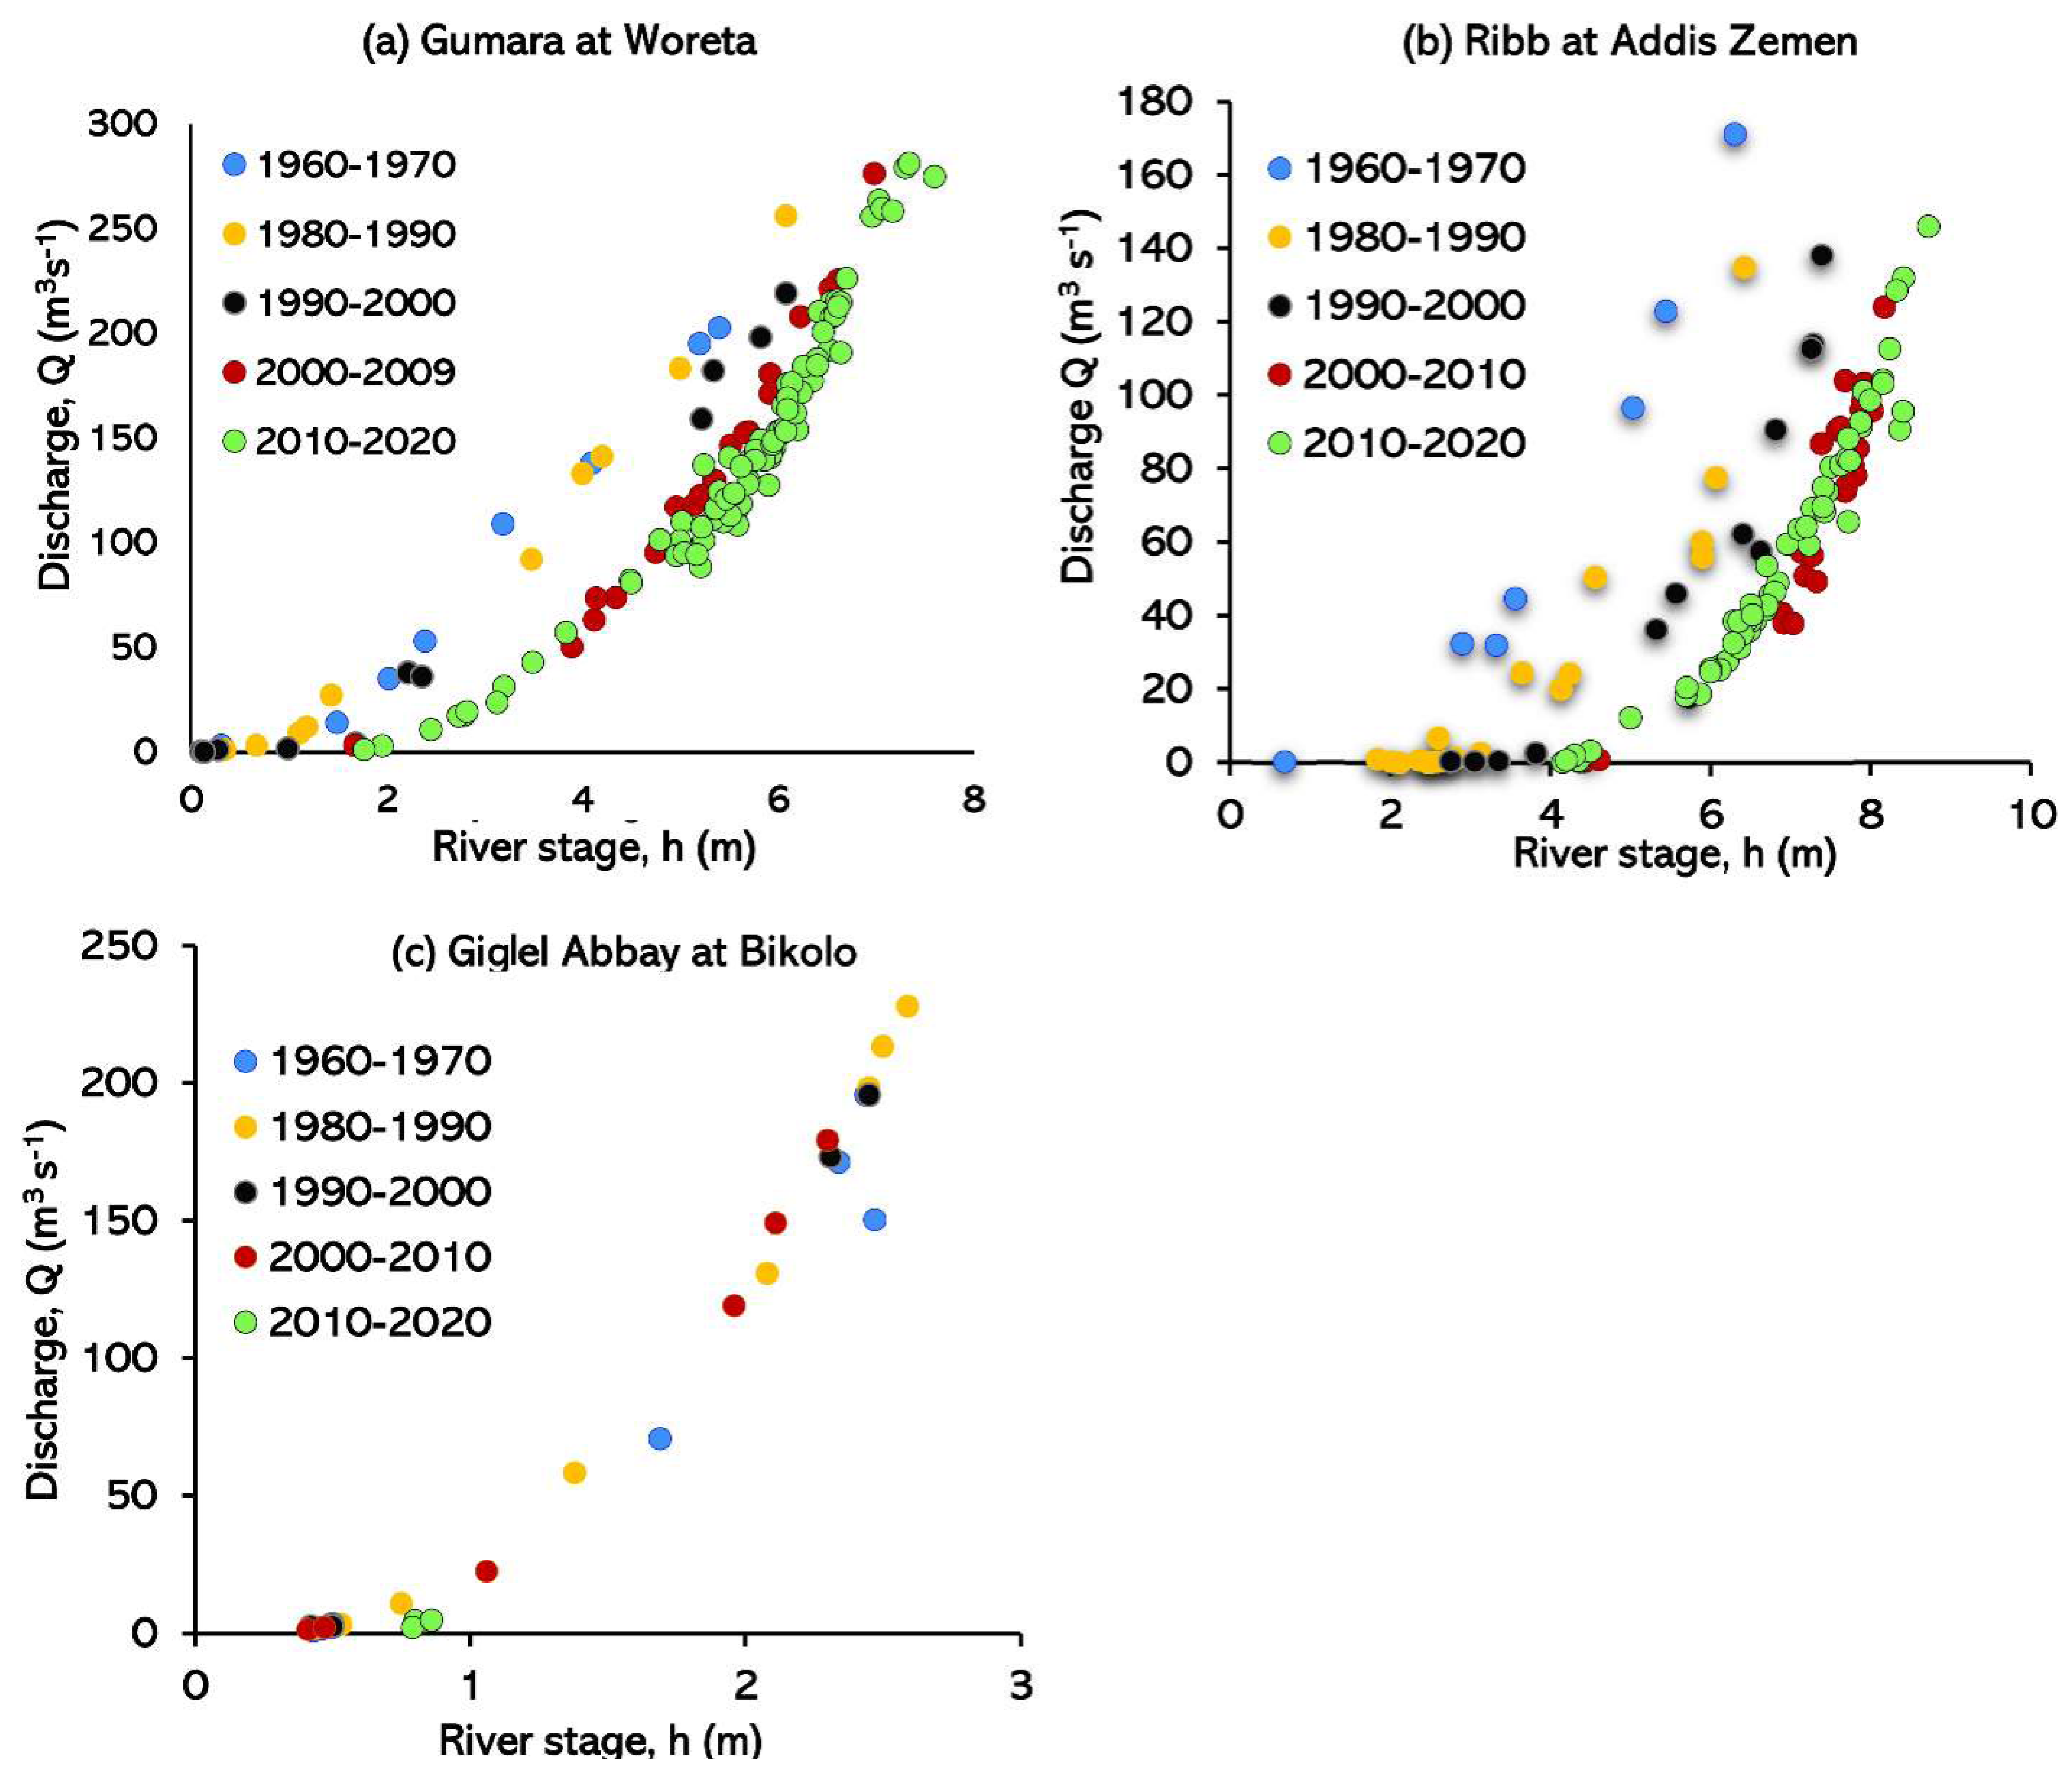
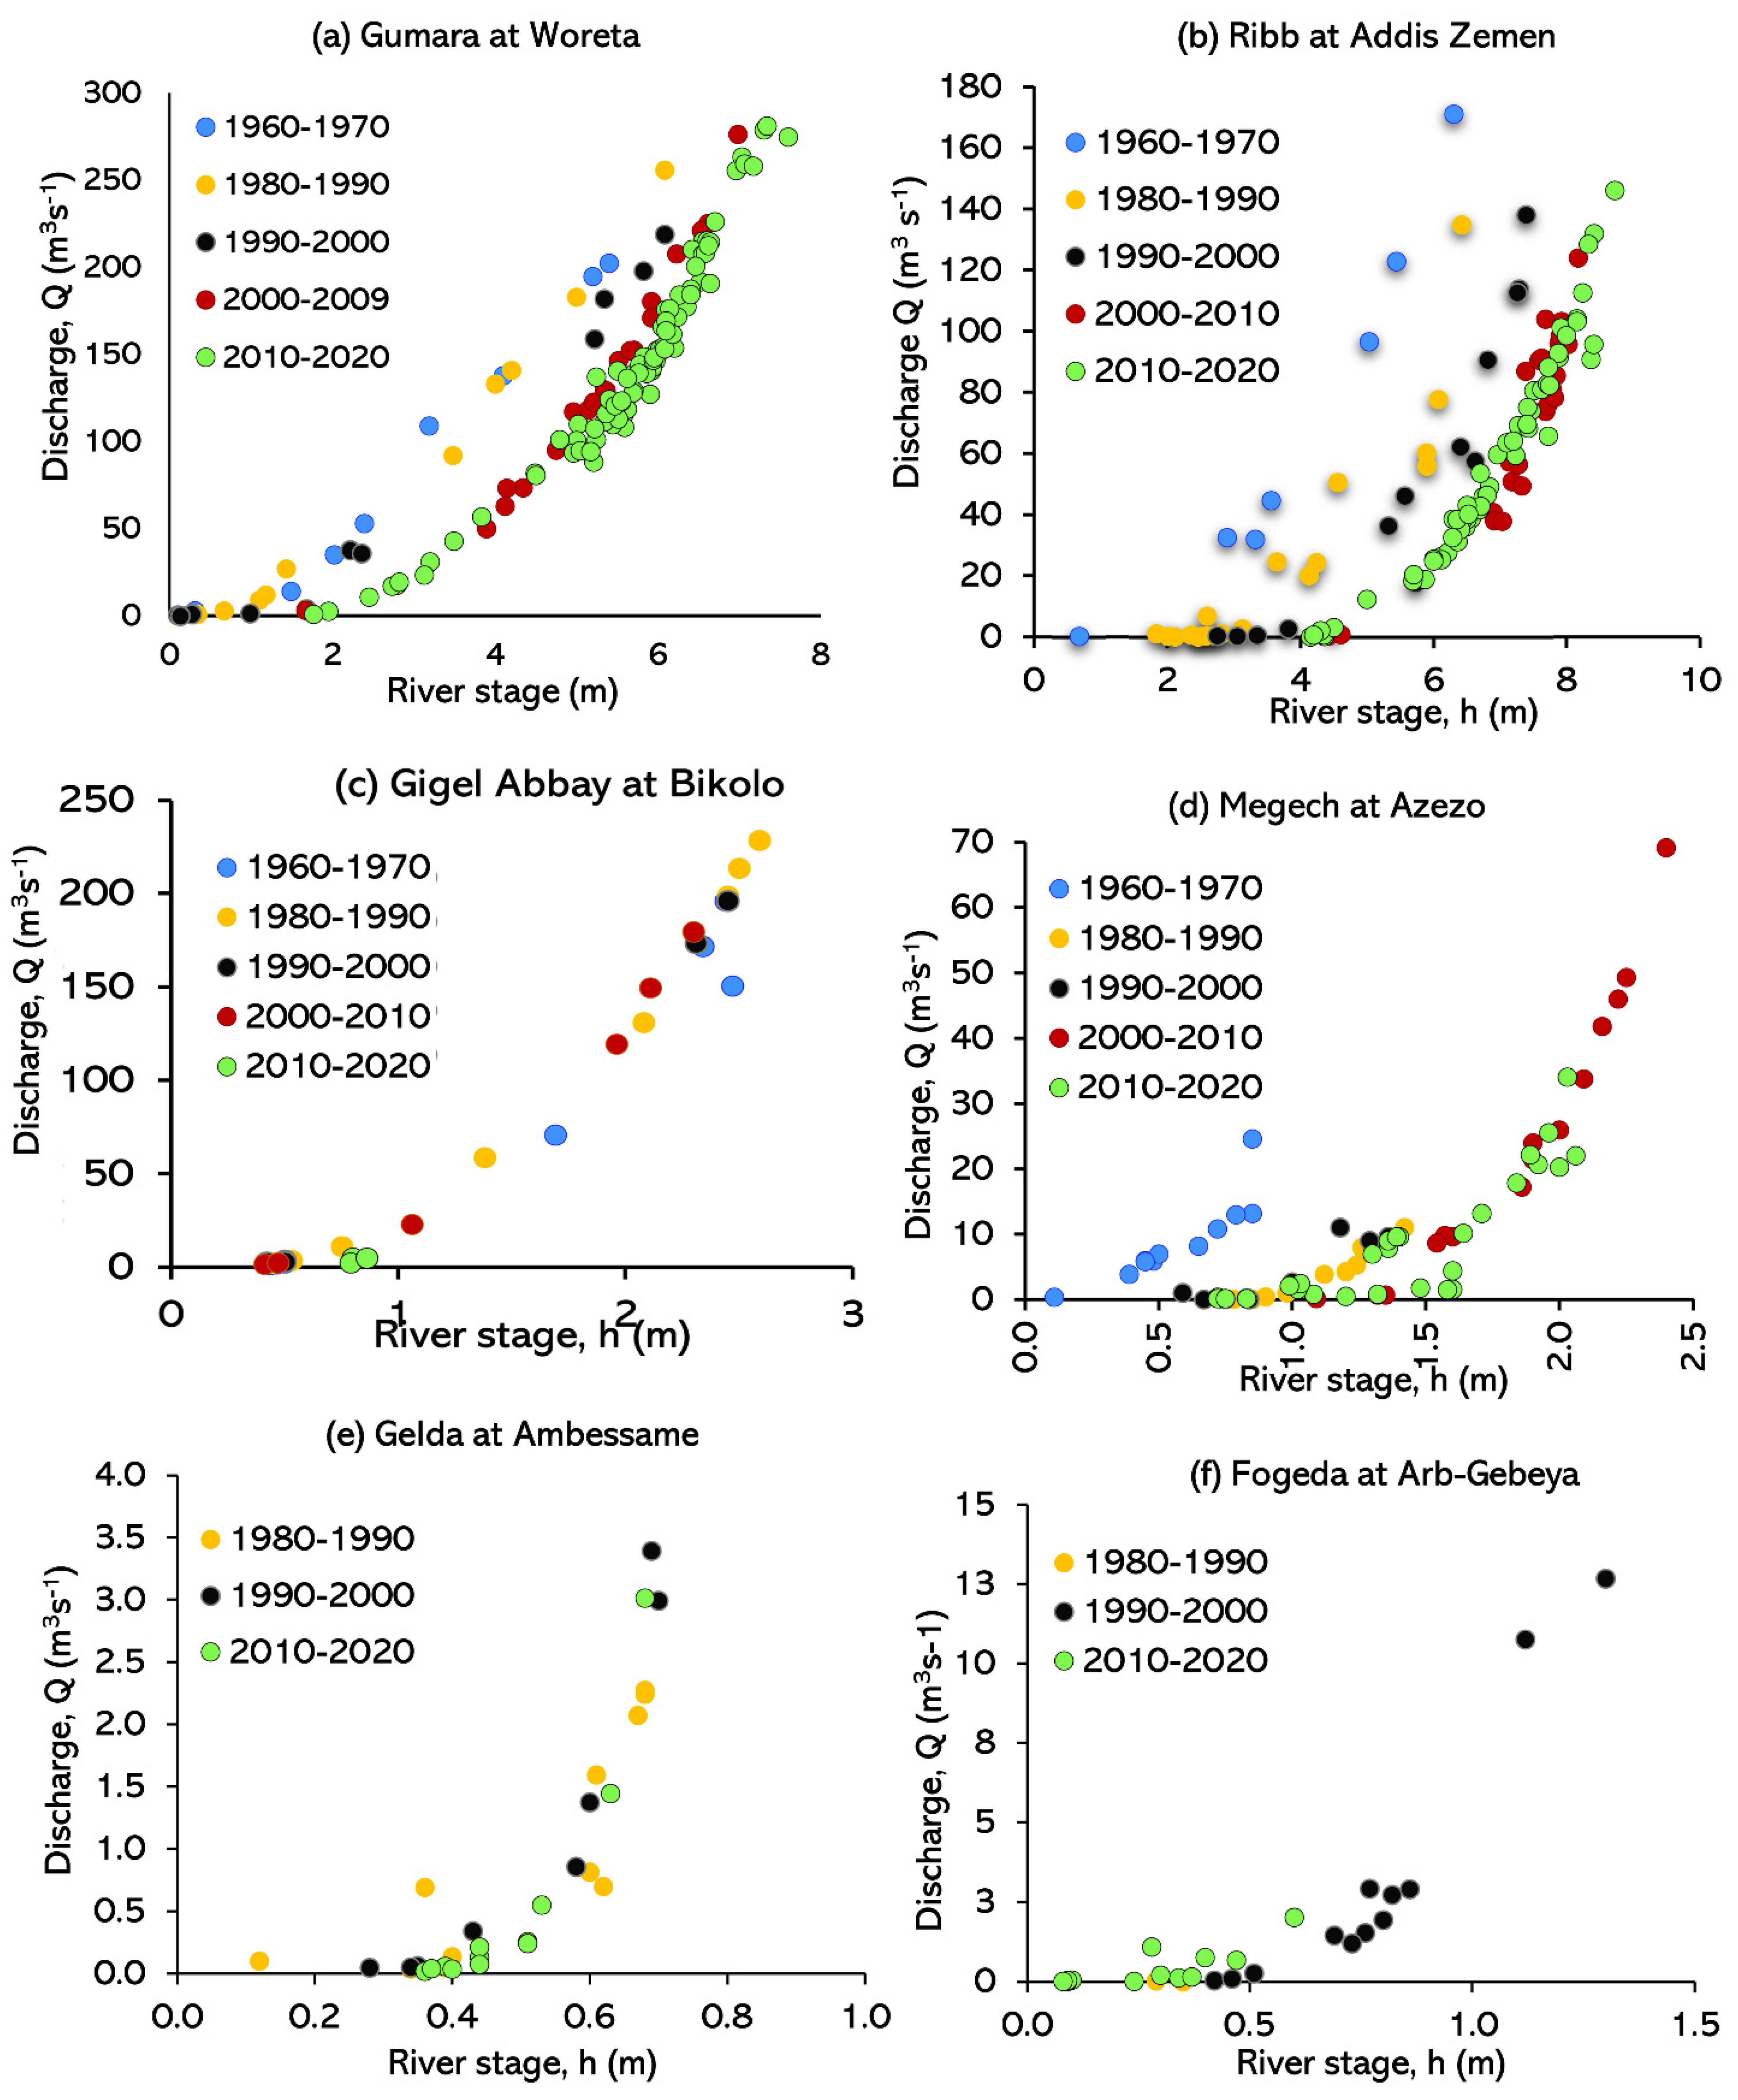
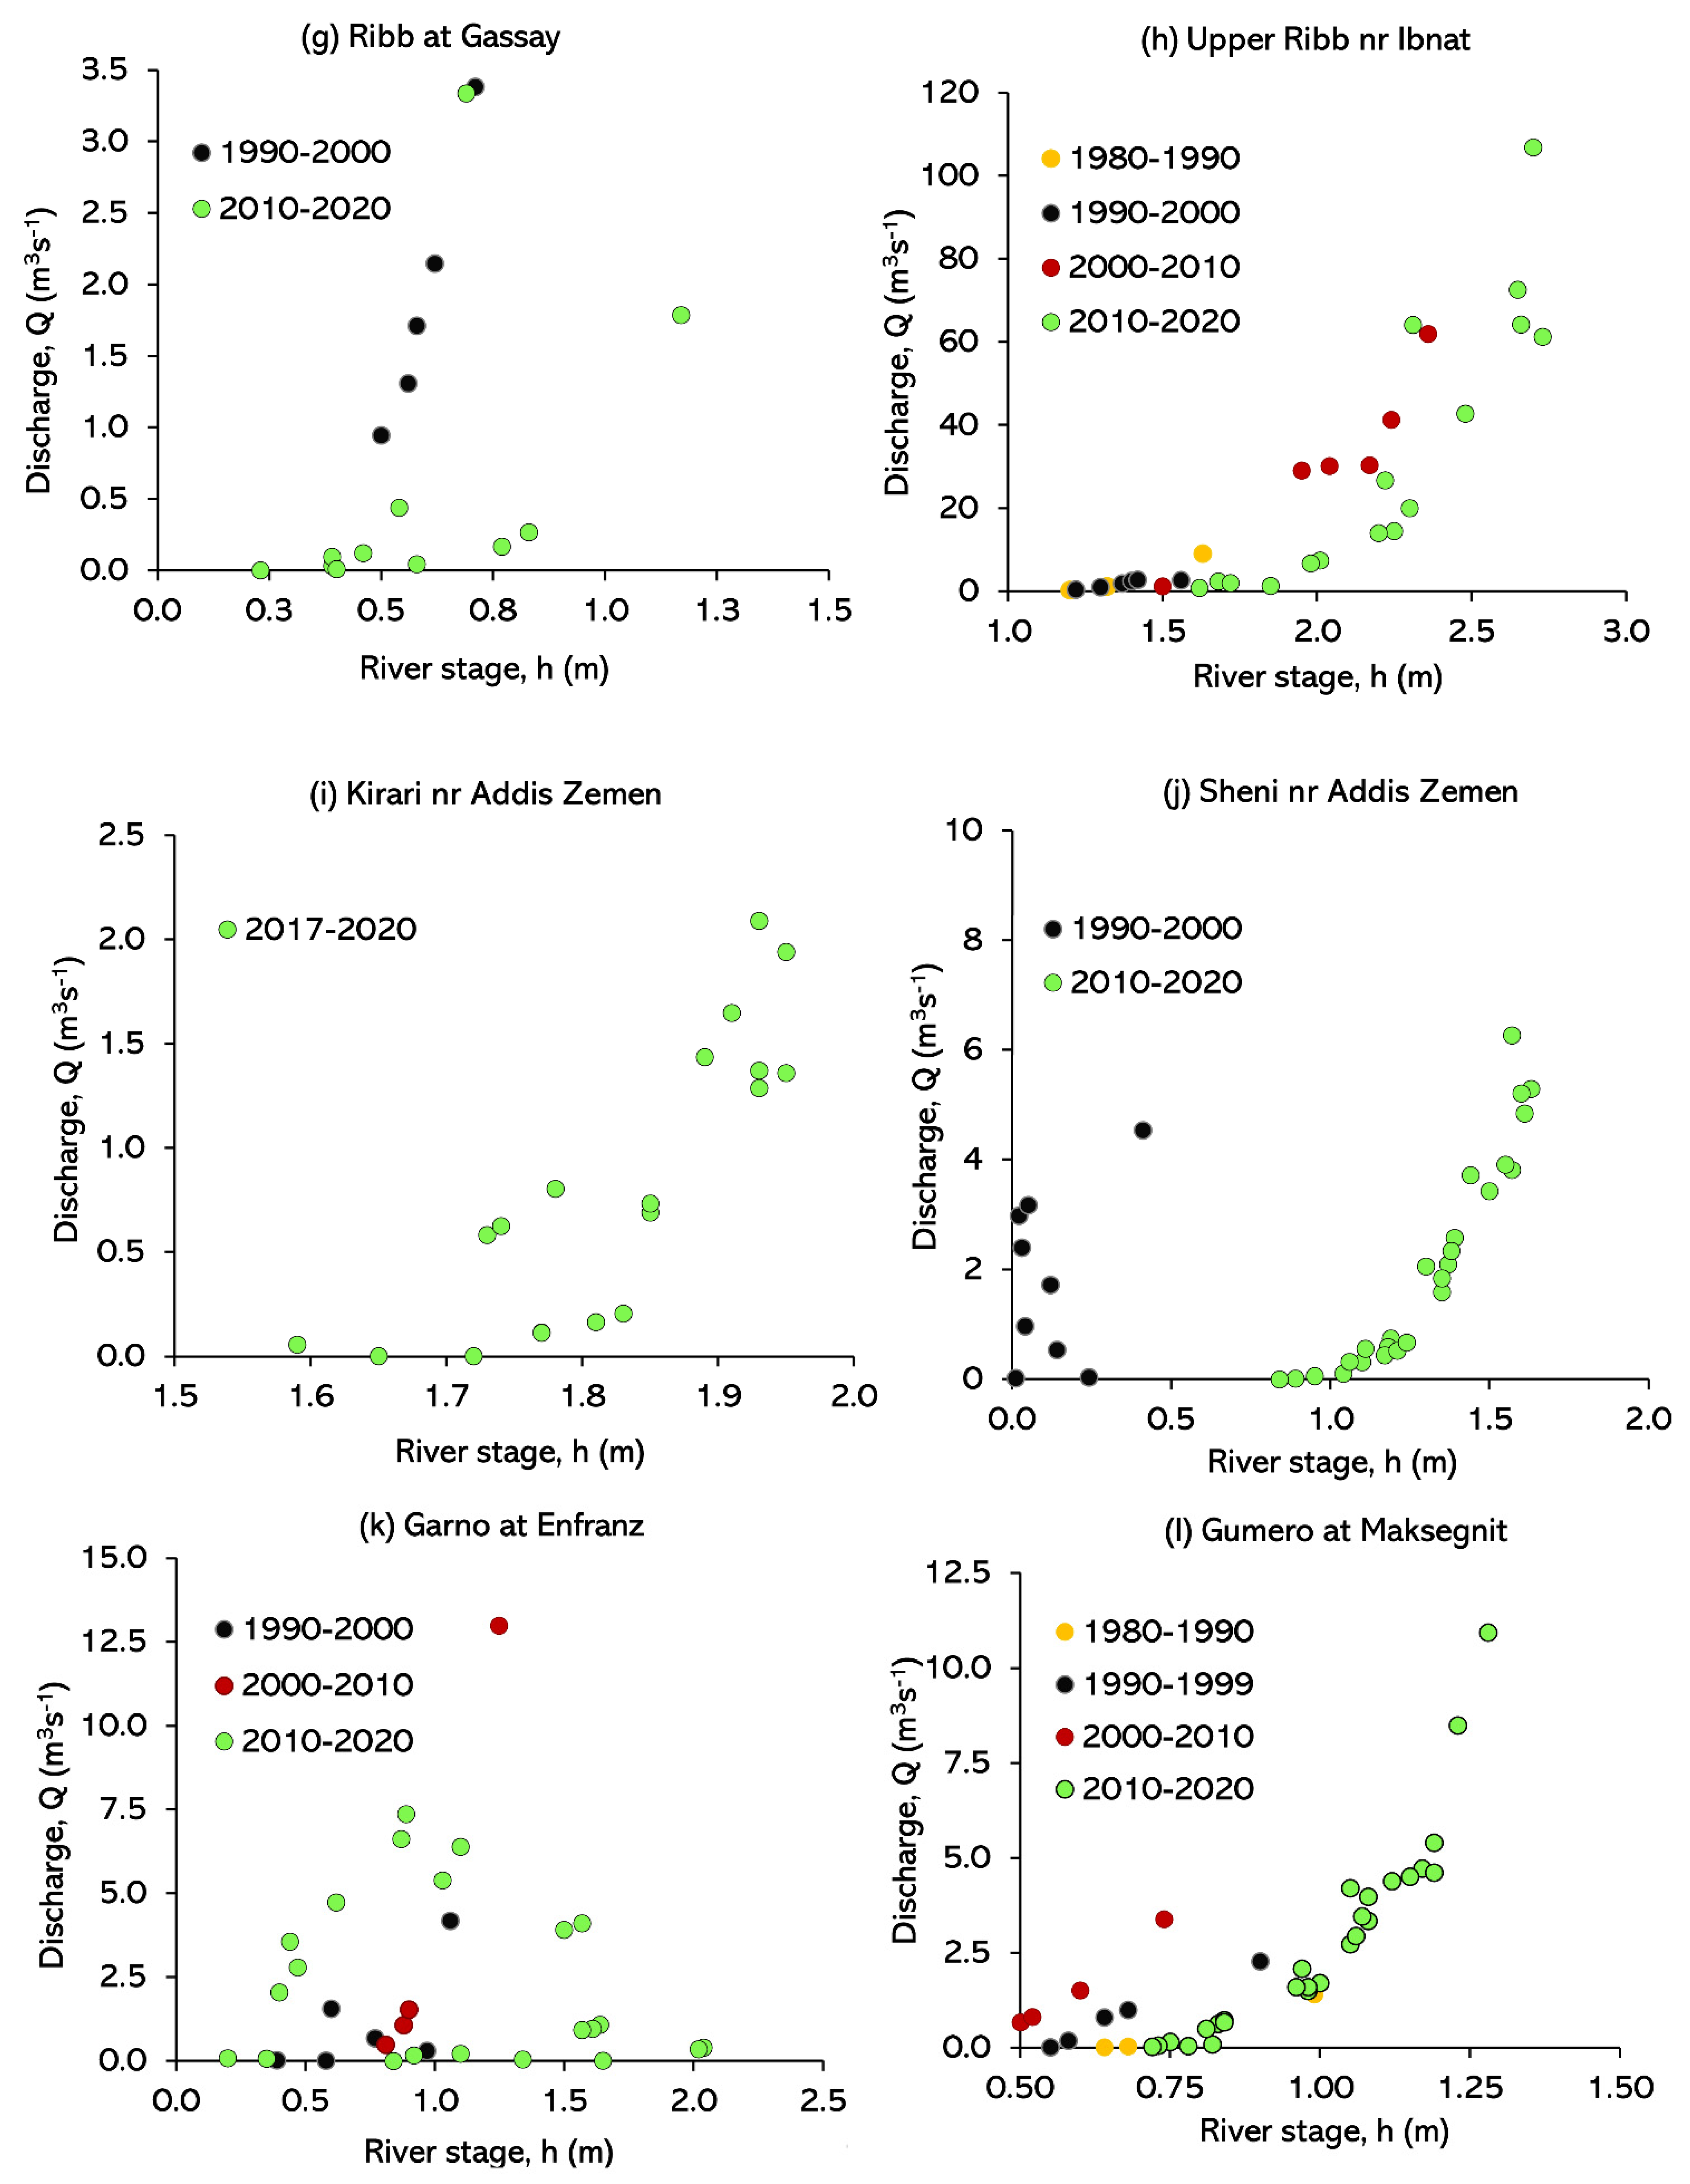
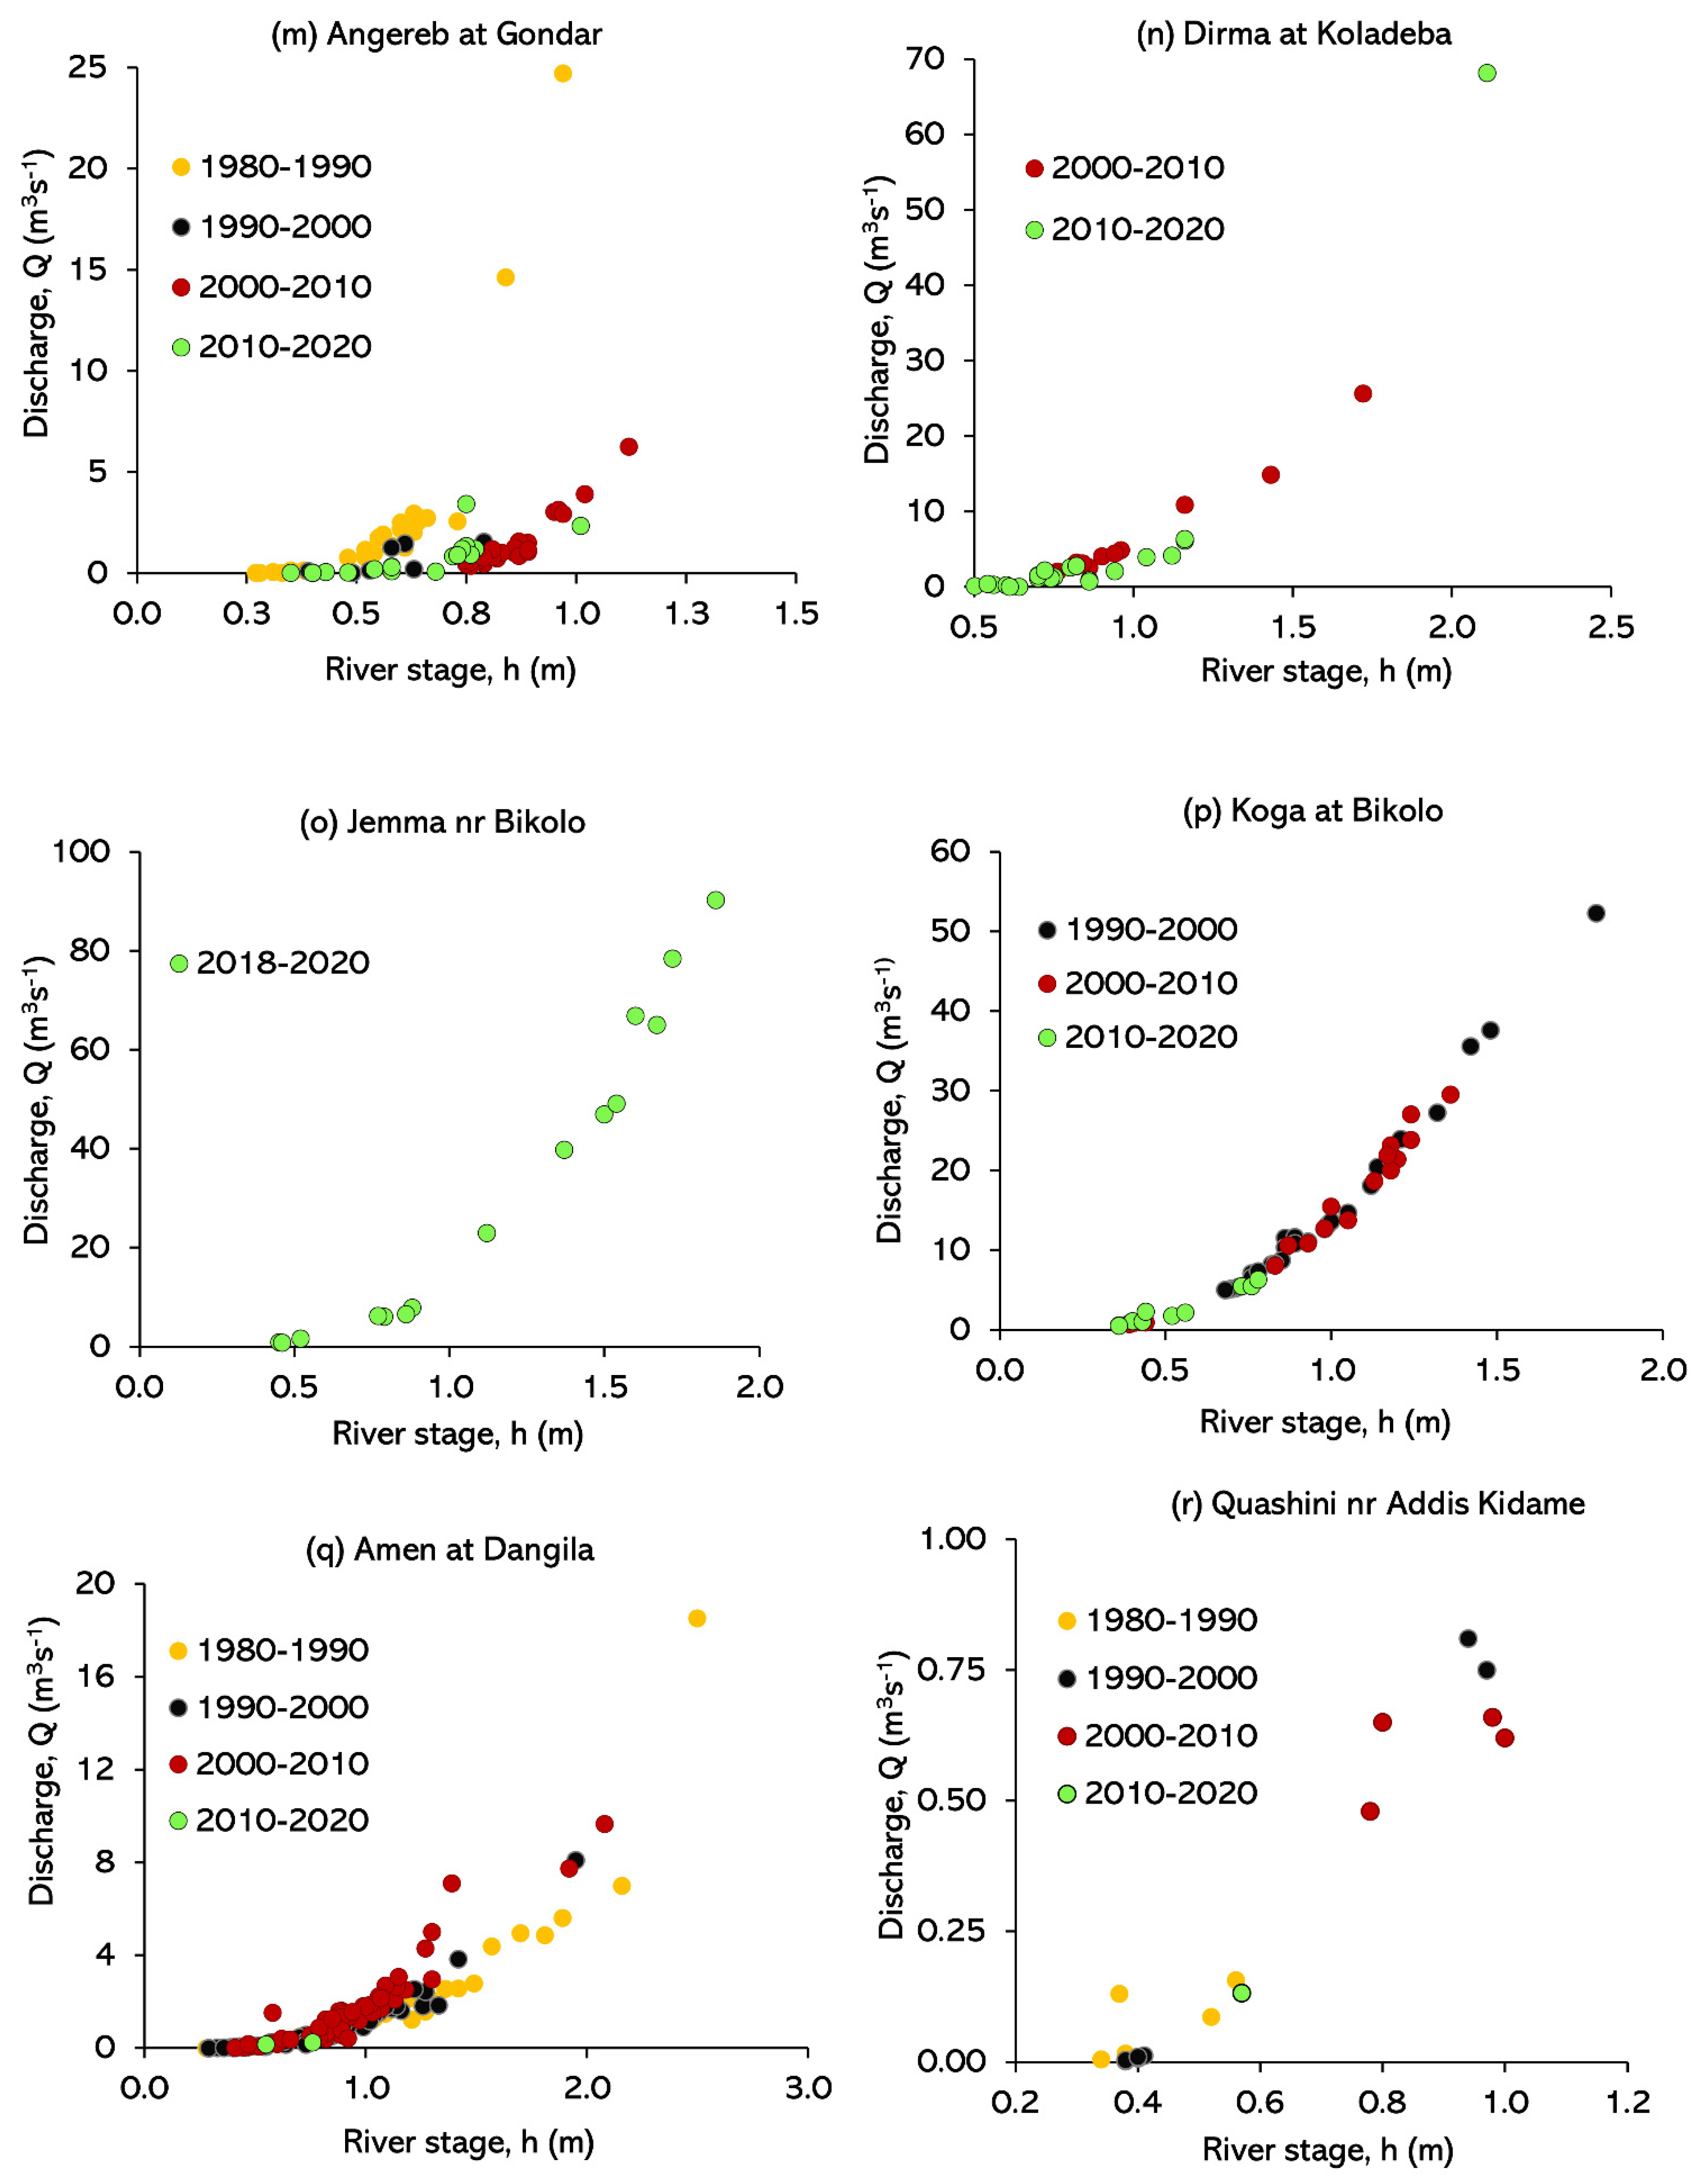
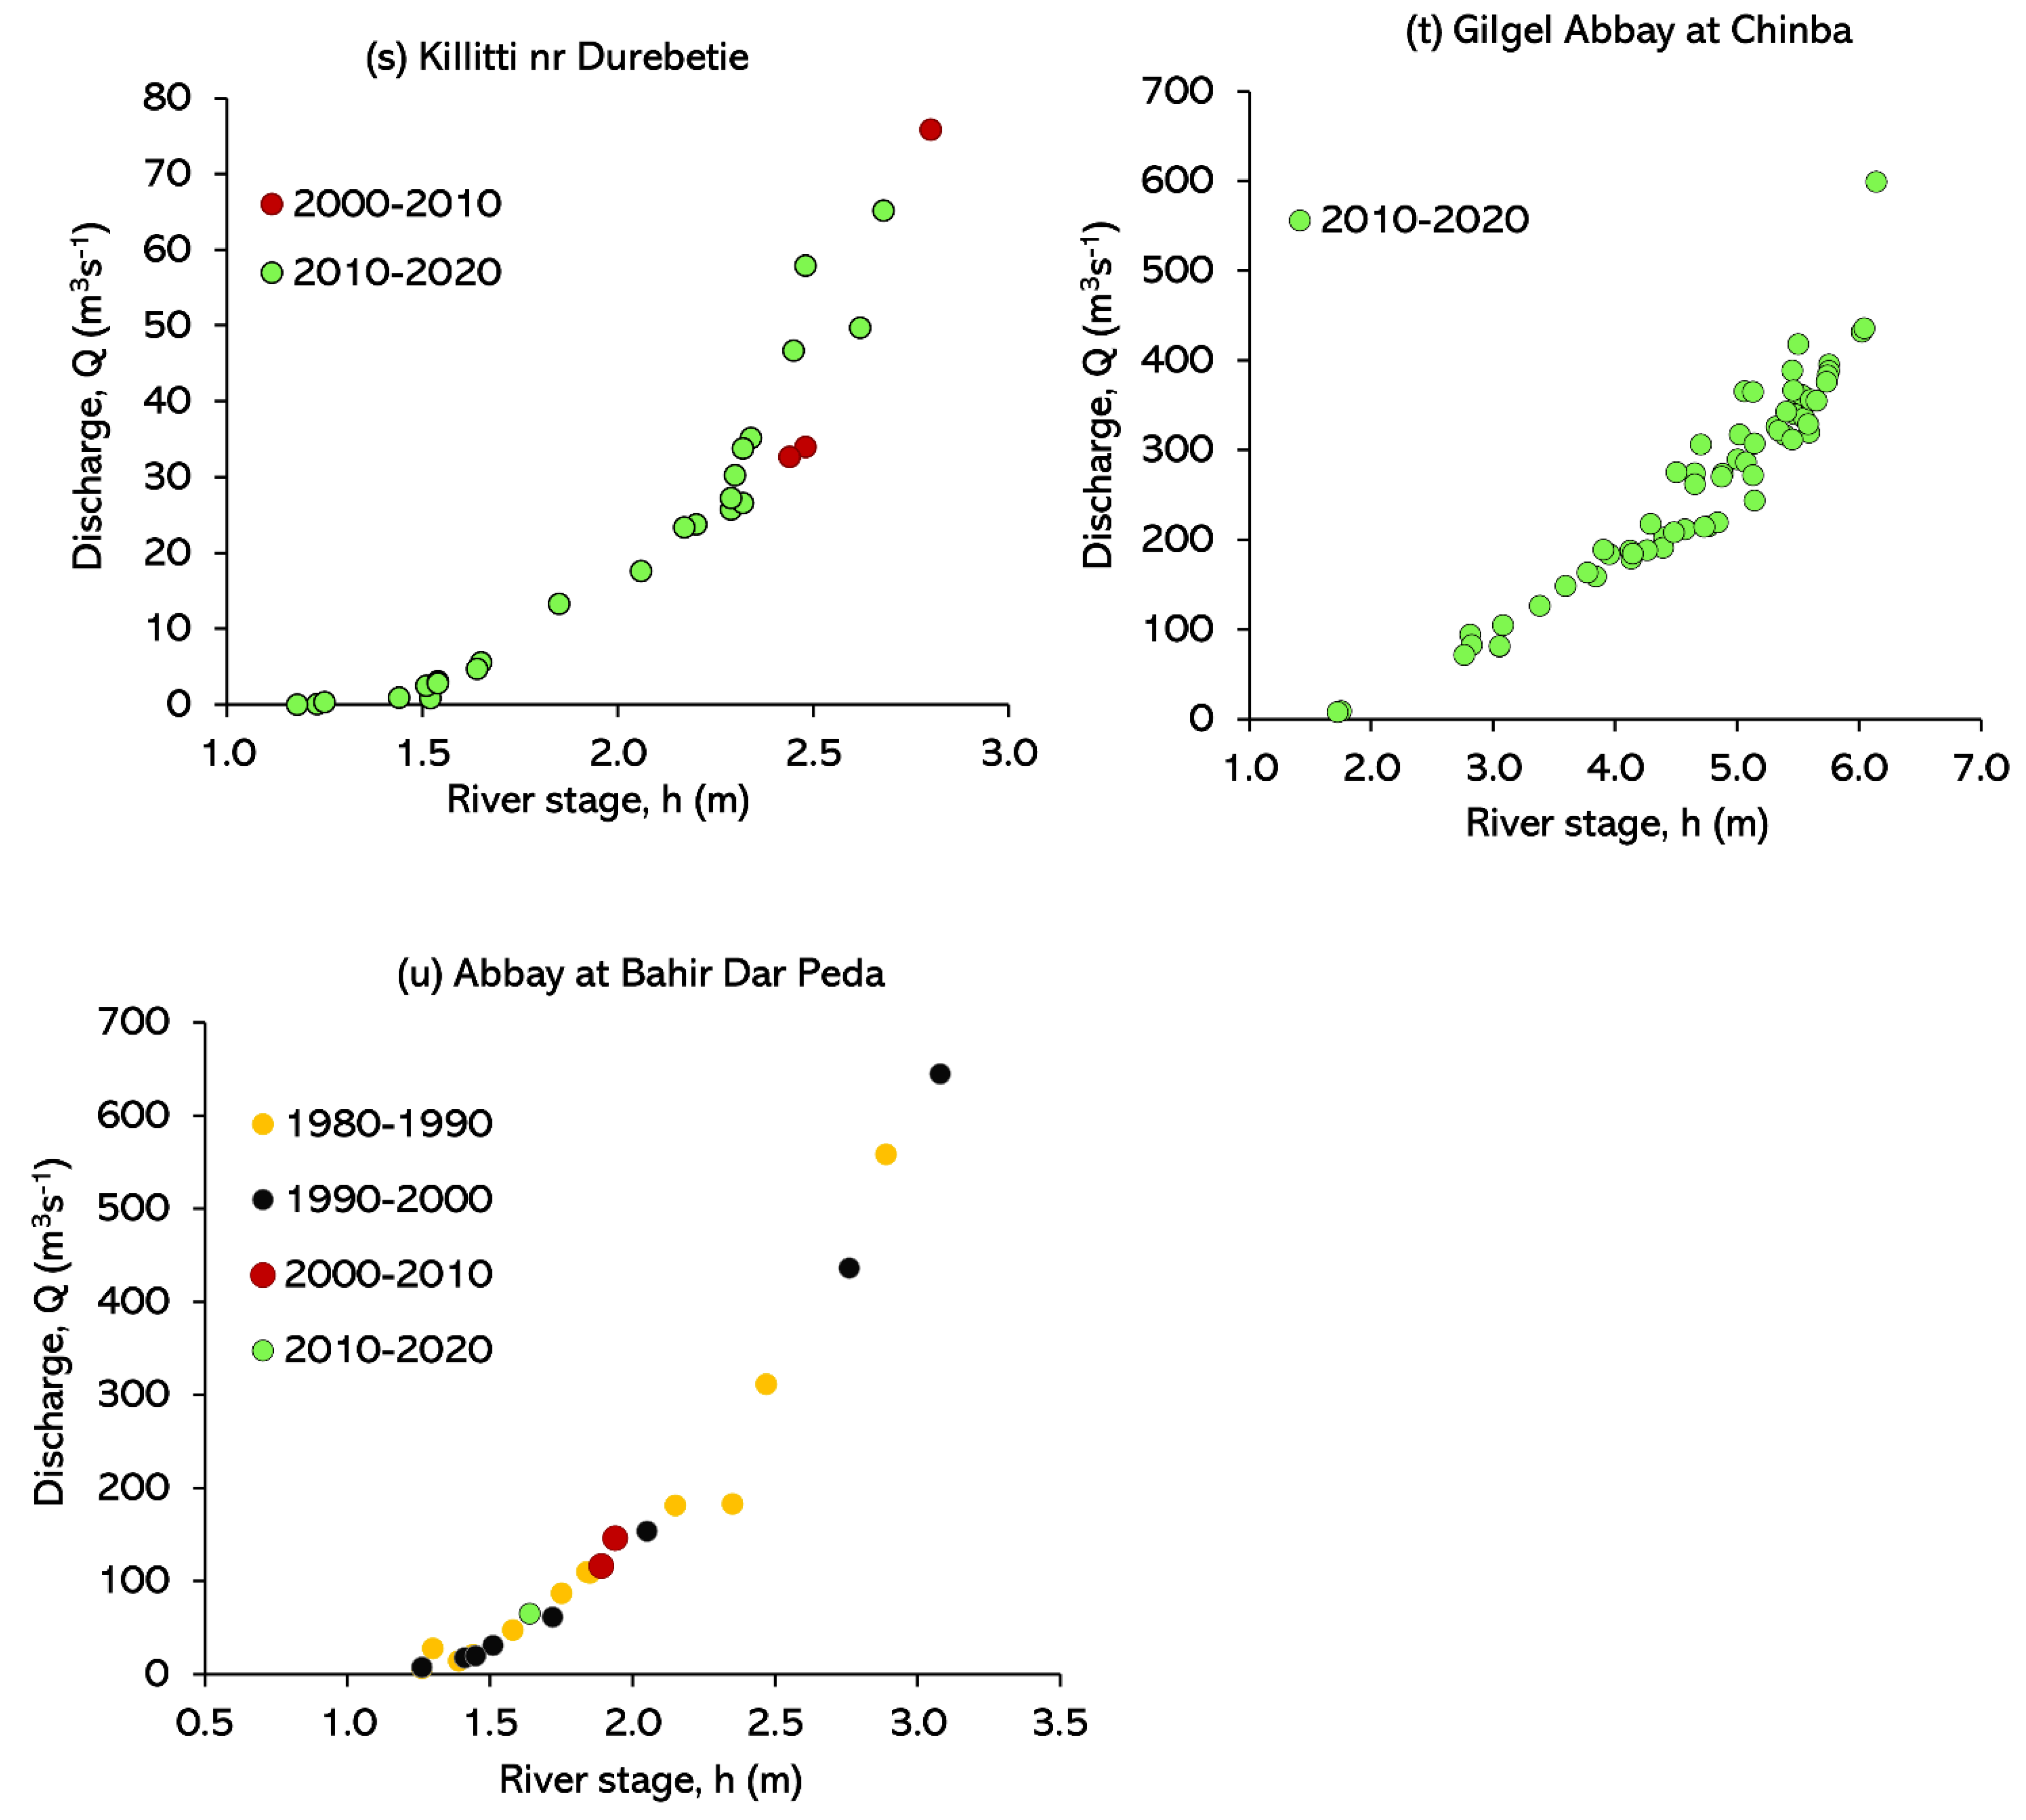
3.1. Stage–Discharge Measurements
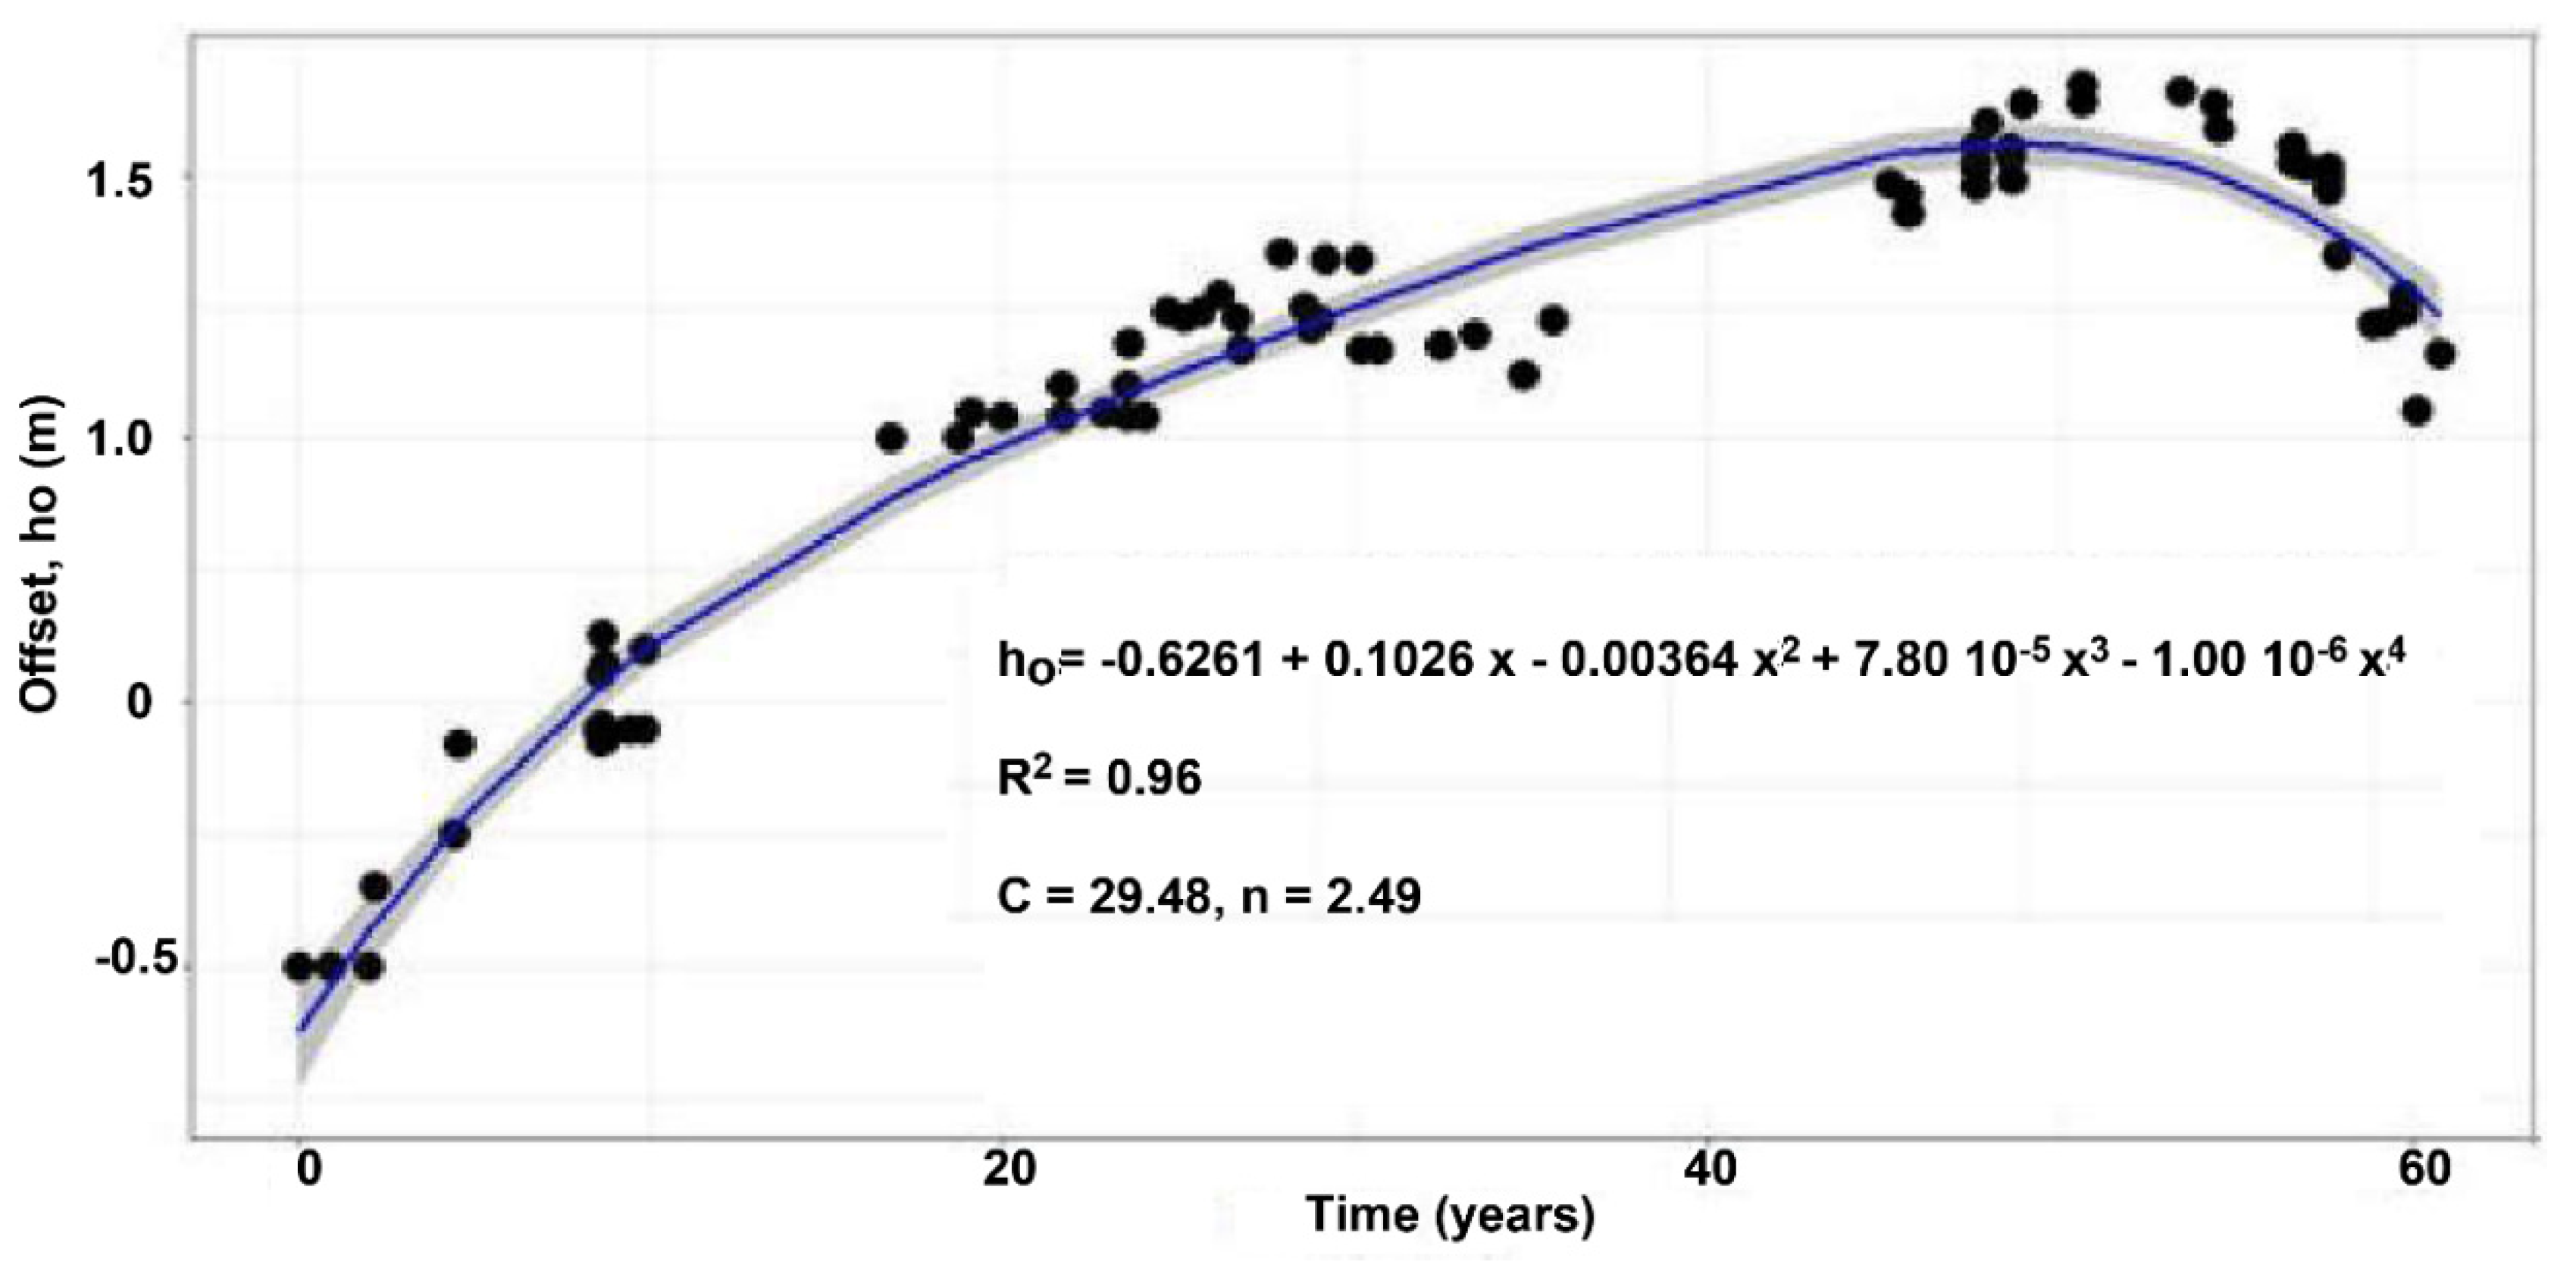
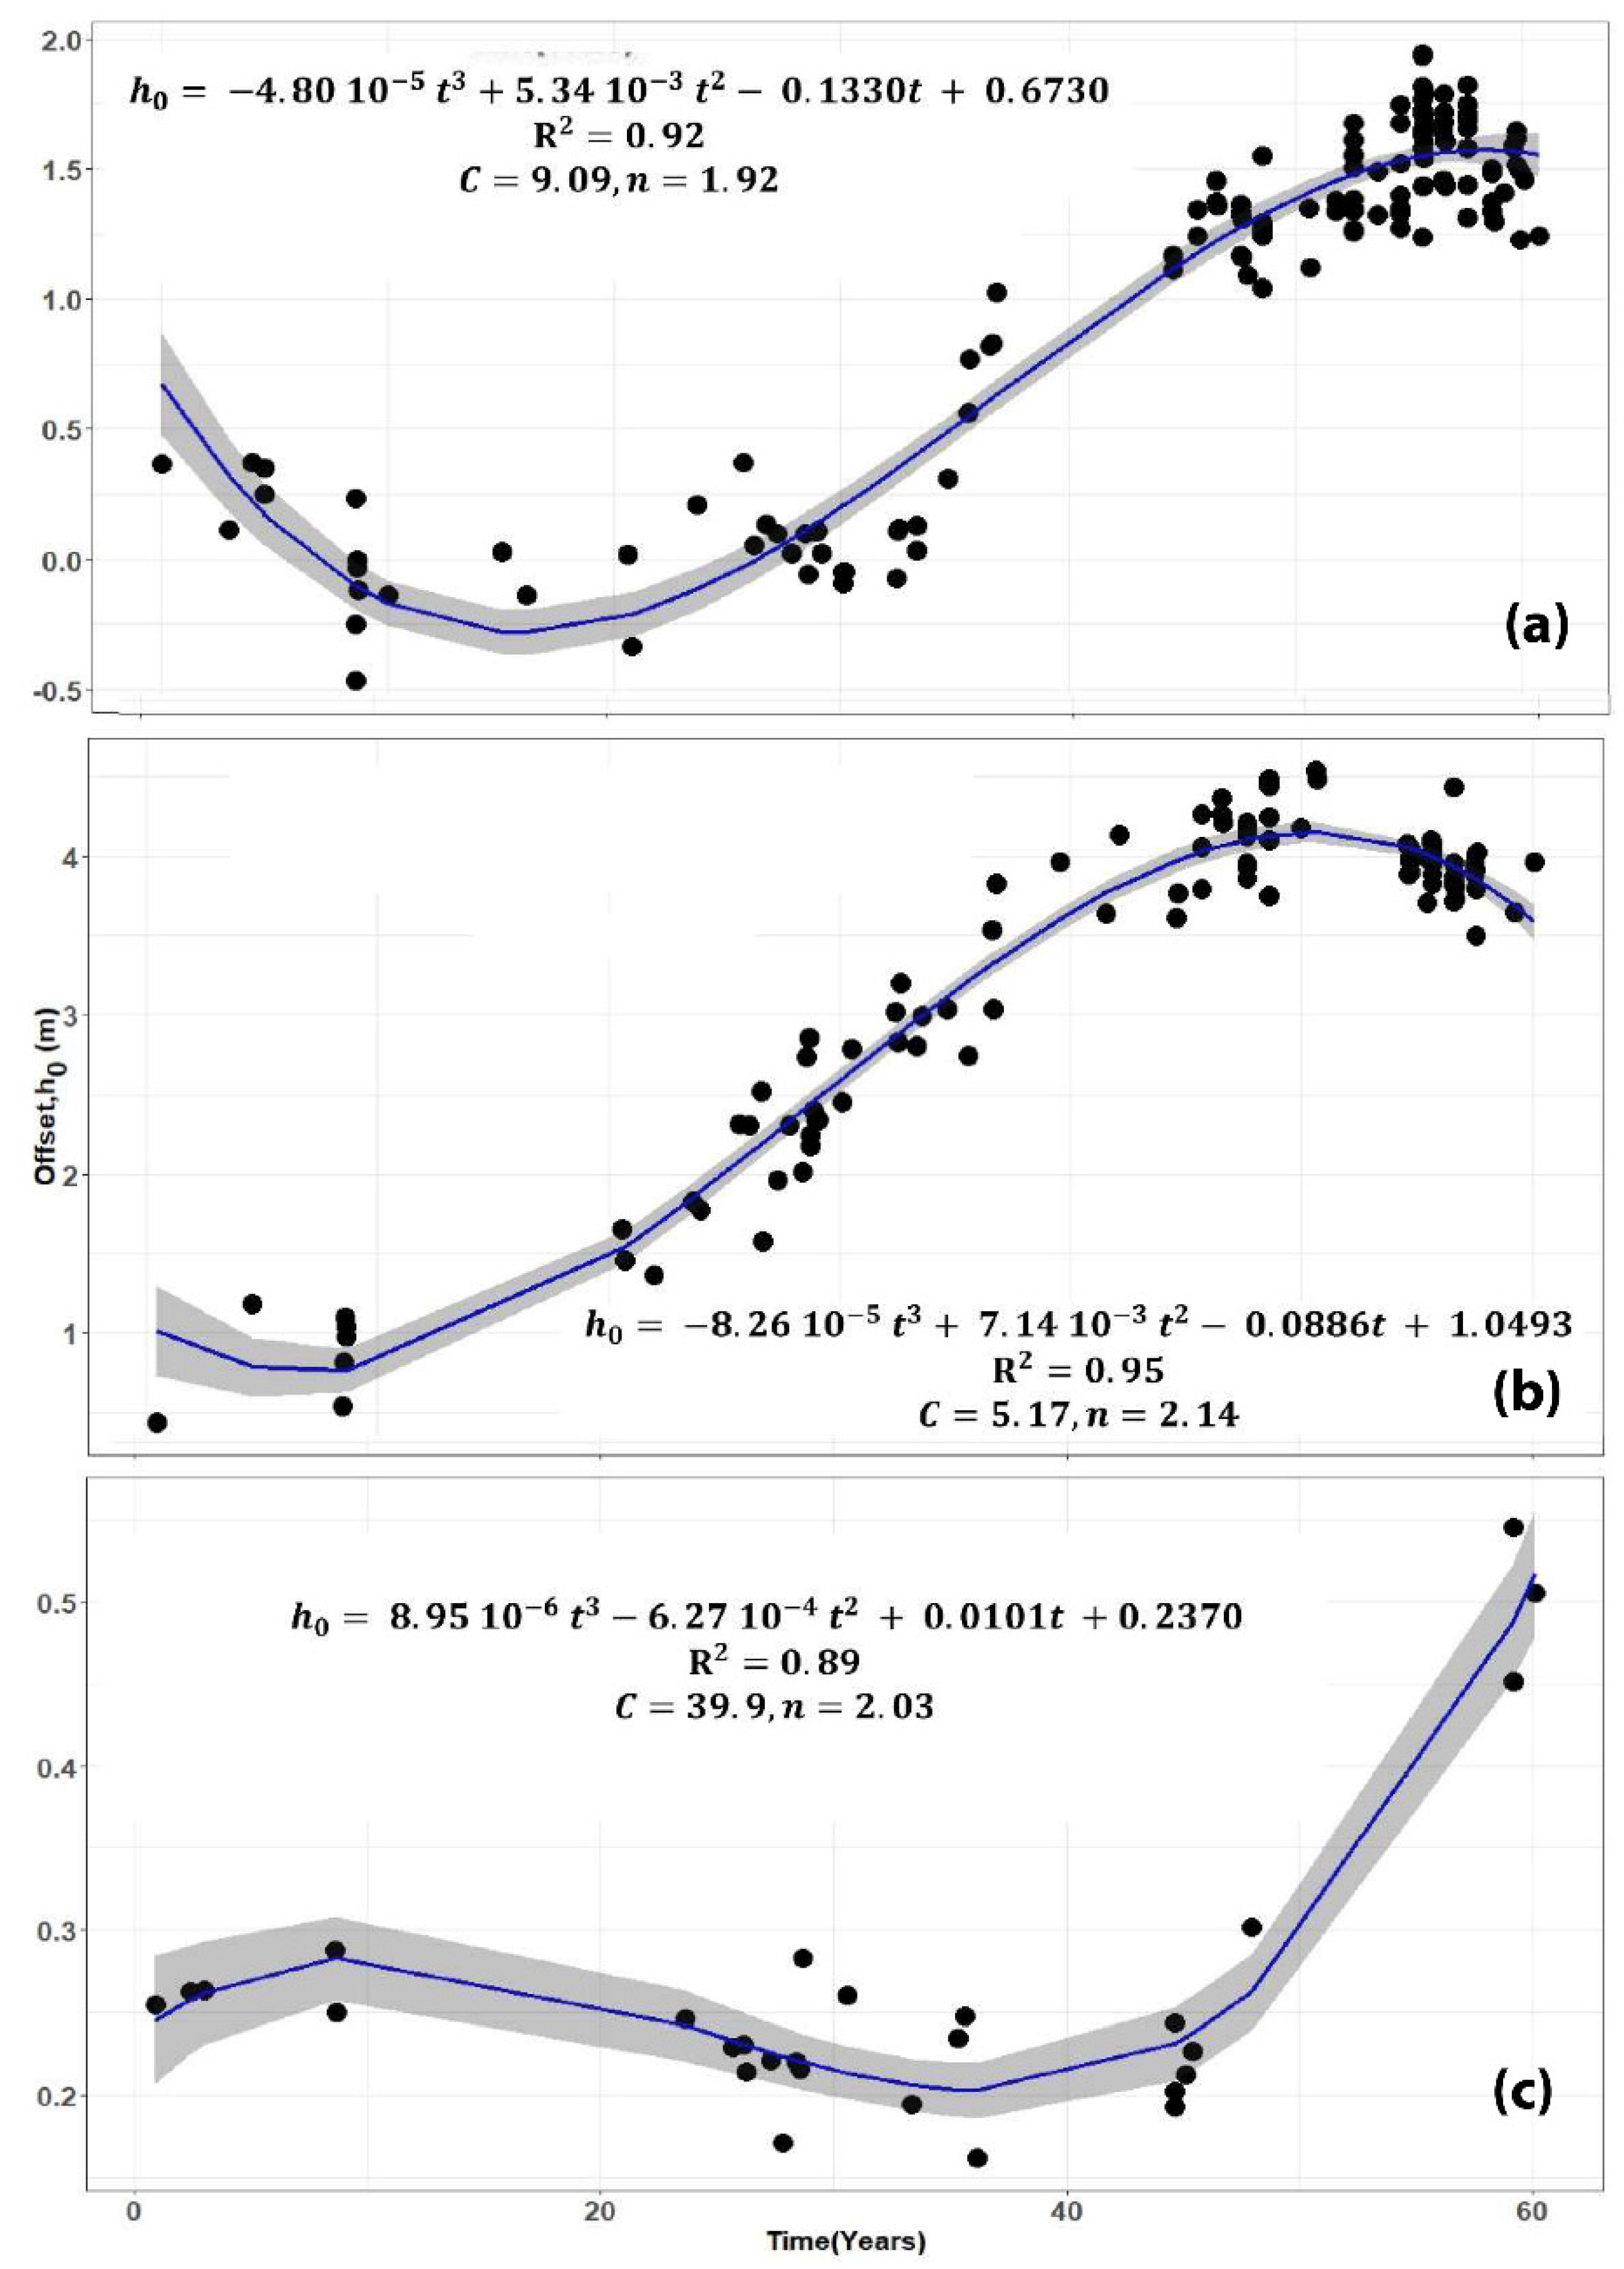
The stage and corresponding discharge measurements in the stream channel at the gauging stations of the three largest rivers (Gumara, Rib, and Gilgel Abbay) are shown in Figure 5, and for the Megech, the fourth-largest river, in Figure 3a. Measurements of the stage and discharge for these four stations started in 1960 (called hereafter “long-term river monitoring stations”). The stage–discharge data for the remaining 17 gauges in the Lake Tana basin are provided in Appendix B. The condition of channels at the gauging stations and the number of stage–discharge measurements are given in Table 1.
Like the Megech, the stage–discharge curves in Figure 5 for the long-term river monitoring stations do not exhibit a unique relationship between discharge and the stage height. For example, at a stage height of 6 m for the Ribb at Addis Zemen (Figure 5b), the discharge is around 120 m3s−1 in the initial period from 1960 to 1987. It is approximately 60 m3s−1 from 1988–1989 and about 20 m3s−1 from 2000 to 2020. As indicated in Table 1, sediment deposited in the stream channel (and surrounding lands) at this gauging station increased the bed height over time. The measurements for Gumara at Woreta also show that the discharge decreases in time for a particular stage height (Figure 5a) due to a high sediment load and the resulting increase in bed height (Table 1). In the mid-1990s, the discharge at a particular stage decreased for the Gilgel Abbay at Bikolo (Figure 5c), likely due to a large storm in September 1996 that scoured the rocky bed [47].
Several of the remaining 17 gauging stations (Appendix B Figure A1e–u) have nearly unique and well behaved stage–discharge measurements, such as Gelda at Ambessame (Appendix B Figure A1e), Dirma at Koladeba (Appendix B Figure A1n), Jemma near Bikolo (Appendix B Figure A1o), and Koga at Bikolo (Appendix B Figure A1p). These gauging stations have stable channel controls, and only relatively small changes in the cross-sections may occur during the largest runoff events (Table 1). Examples of the gauging stations with a poor correspondence between stage and discharge are Ribb at Gassay (Appendix B Figure A1g), Upper Ribb near Ibnat (Appendix B Figure A1h), Kirari near Addis Zemen (Appendix B Figure A1i), Sheni near Addis Zemen (Appendix B Figure A1j), Garno at Enfranz (Appendix B Figure A1k), Angereb at Gondar (Appendix B Figure A1m), and Amen at Dangila (Appendix B Figure A1q). These stations are located at steep sections of the river with deposition or removal of boulders. In one case, the station was moved (Sheni at Addis, Table 1). Some of the stations are very recent: Kirari near Addis Zemen (Appendix B Figure A1i), Jemma near Bikolo (Appendix B Figure A1o), and Gilgel Abbay at Chinba (Appendix B Figure A1t). Despite the short time, there is already variability in the stage height and corresponding discharge.

3.2. Offset

The optimized parameters the constant C , the exponent n , and the offset h o ( t ) that define the rating curve in Equation (1) are listed for each of the 21 gauging stations in Table 2. The offset is expressed as a polynomial of the lowest order with statistically significant coefficients as a function of time t. The plots of polynomials listed in Table 2 are shown in Figure 4 for the Megech, Figure 6 for the three long-term gauging stations, and Supplemental Materials Section S1 for all the gauging stations. For floodplain gauging stations (Gumara at Woreta and Ribb at Addis Zemen), the offsets were expressed by a third-degree polynomial, whereas gauging stations in the uplands such as Megech at Azezo, Garno at Enfranz and Gumero at Maksegnit were characterized by a fourth-degree polynomial.
The maximum and minimum offsets are less than 30 cm for the stream gauging stations identified in Section 3.1 with nearly unique stage–discharge curves (Supplemental Materials Section S1e,o,p). Other stations with a 30–40 cm or smaller difference between the maximum and minimum fitted offset of the polynomial are the Gilgel Abbay (Figure 5c, Supplemental Materials Section S1c), Fogeda at Arb-Gebeya (Supplemental Materials Section S1f), Kirari at Addis Zemen (Supplemental Materials Section S1i), Angereb at Gondar (Supplemental Materials Section S1m), Dirma at Koladeba (Supplemental Materials Section S1n), Amen at Dangila (Supplemental Materials Section S1q), Quashini near Addis Kidame (Supplemental Materials Section S1r), Killitti near Durebetie (Supplemental Materials Section S1s), Gilgel Abbay at Chinba (Supplemental Materials Section S1t), and Abbay at Bahir Dar Peda (Supplemental Materials Section S1u). The rating curves were not unique for these stations because the offset changed seasonally. High flows in July and August cause either the deposition of boulders and gravel from upstream or scouring [32]. Subsequent smaller storms bring the riverbed morphology back to the original configuration. The measurement of Amen at Dangila demonstrates the seasonal changes in offset at Dangila (Supplemental Materials Section S1q), where the offsets vary by 40 cm. The Gilgel Abbay at Chinba is another example where the measurement varied by almost 75 cm in 2015 (year 1) (Supplemental Materials Section S1t). A polynomial with an order of four or less cannot capture the seasonal difference in seasonal changes. The effect of seasonal differences in offsets is addressed in a subsequent manuscript
As shown in Supplemental Materials Section S1, the fitted offset for the remaining stations changed more than 30 cm. Three of these stations are in the plains around Lake Tana. For the Gumara at Woreta (Figure 6a), the offset declines first slightly when the measurement started in 1960. The offset is near zero around 1980 (year 20), then increases over 30 years by 1.5 m. The offset after 2010 decreased (year 50) (Figure 6b). The offset of the Ribb at Addis Zemen has the same pattern as the Gumara. The increase in offset started around 1970 (year 10), increased by 3 m, and decreased after 2010 (year 50, Figure 6b). The offset of the Megech at Azezo (Figure 4) was 60 cm below the gage level when the measurements started in 1960 and increased steadily to approximately 1 m in 2005 (year 51) to 1.20 in 2011 to 2012 and then decreased by 30 cm in 2021. The difference between the maximum and minimum offset for two other stations on the Ribb (i.e., the Ribb at Gassay and the Upper Ribb near Ibnat, Supplemental Materials Section S1g,h) was around 50 cm. Finally, the offset from Garno at Enfranz (Supplemental Materials Section S1k) has increased by almost 2 m from 2017 to 2021 (year 30–34). A bridge was constructed, and boulders, cobbles, and gravel from the upper mountainous area increased the height of the riverbed.

3.3. Confidence Bands in a Non-Linear Regression Curve Fitting

The gray shaded area in Figure 6 indicates two times the standard error from the predicted offset. It demonstrates that the uncertainty of the offset was greater in the 1960s for three rivers (Figure 6) than later in the record when more measurements were available. Since the scale of the Y-axis are not the same for the various graphs of h o ( t ) , the error confidence of the streams with minor changes in the offset seems more extensive than those with a significant temporal difference in offset. The highest or lowest outliers were removed because the outliers lied distantly from the boundary of the 95% confidence interval.

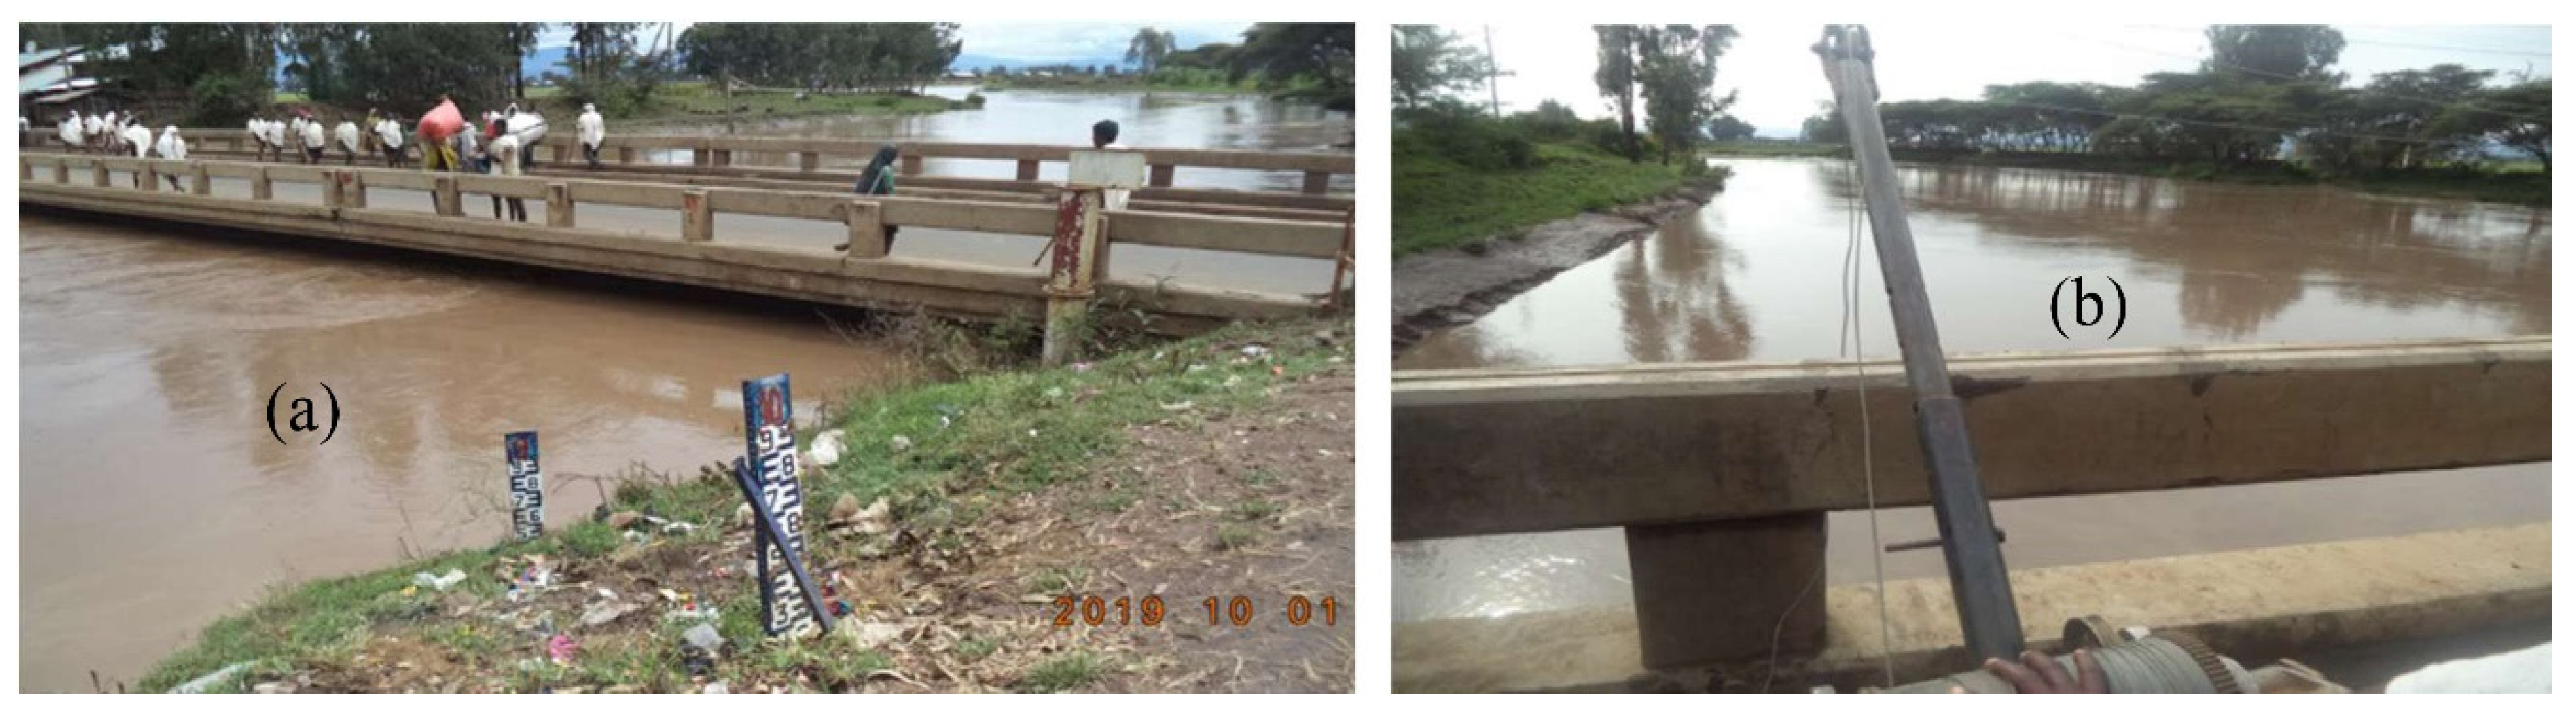
3.4. Field Validation of the Predicted Offset

Recent observations (2019–2021) are used to check the validity of the fitted offset against the occasional measurements. The offset of the Gumara at Woreta in the Fogera plain was measured on 2 June 2020 and on 18 March 2021. On 2 June, during base flow conditions, the water depth was 1.30 m. The staff gauge reading was 2.78 m. The difference between the two is equal to 1.48 m, similar to the fitted offset displayed in Figure 6a in 2020 (year 60). A similar offset of 1.5 m was observed on 18 March 2021. Finally, in the Gumara gauge maintenance log, the hydrology technician noted that in 2011 (year 51), the staff gauge was buried by 1 m of sediment. It is slightly less than the 1.2 m in Figure 6a.
The other station in the Fogera plain is the Ribb river. The 0.95 m offset in 1960 increased to 4.1 m in 2008 and 4.17 in 2012 and dropped to 4.1 in 2014 and 4.0 m in 2016. The offset values were closer to that reported in [32]. The offset for the Megech at Azezo was checked on 19 March 2021. Based on gauged reading and measured water depths, the offset at the deepest point in the river channel was calculated as 0.70 m. This closely fitted the offset of 0.73 m in Figure 3b and Figure 4. Finally, offsets in the mountainous upstream were also checked. The measured offset for Ribb at Gassay was 0.20 m, Kirari near Addis Zemen was observed as 1.52 m, and the Gumero Maksegnit was 0.75 m. These were all within 10 cm of the fitted results (Supplemental Materials Section S1g,i,l). Thus, we can conclude that the annual variation in offset is well represented by the technique used.

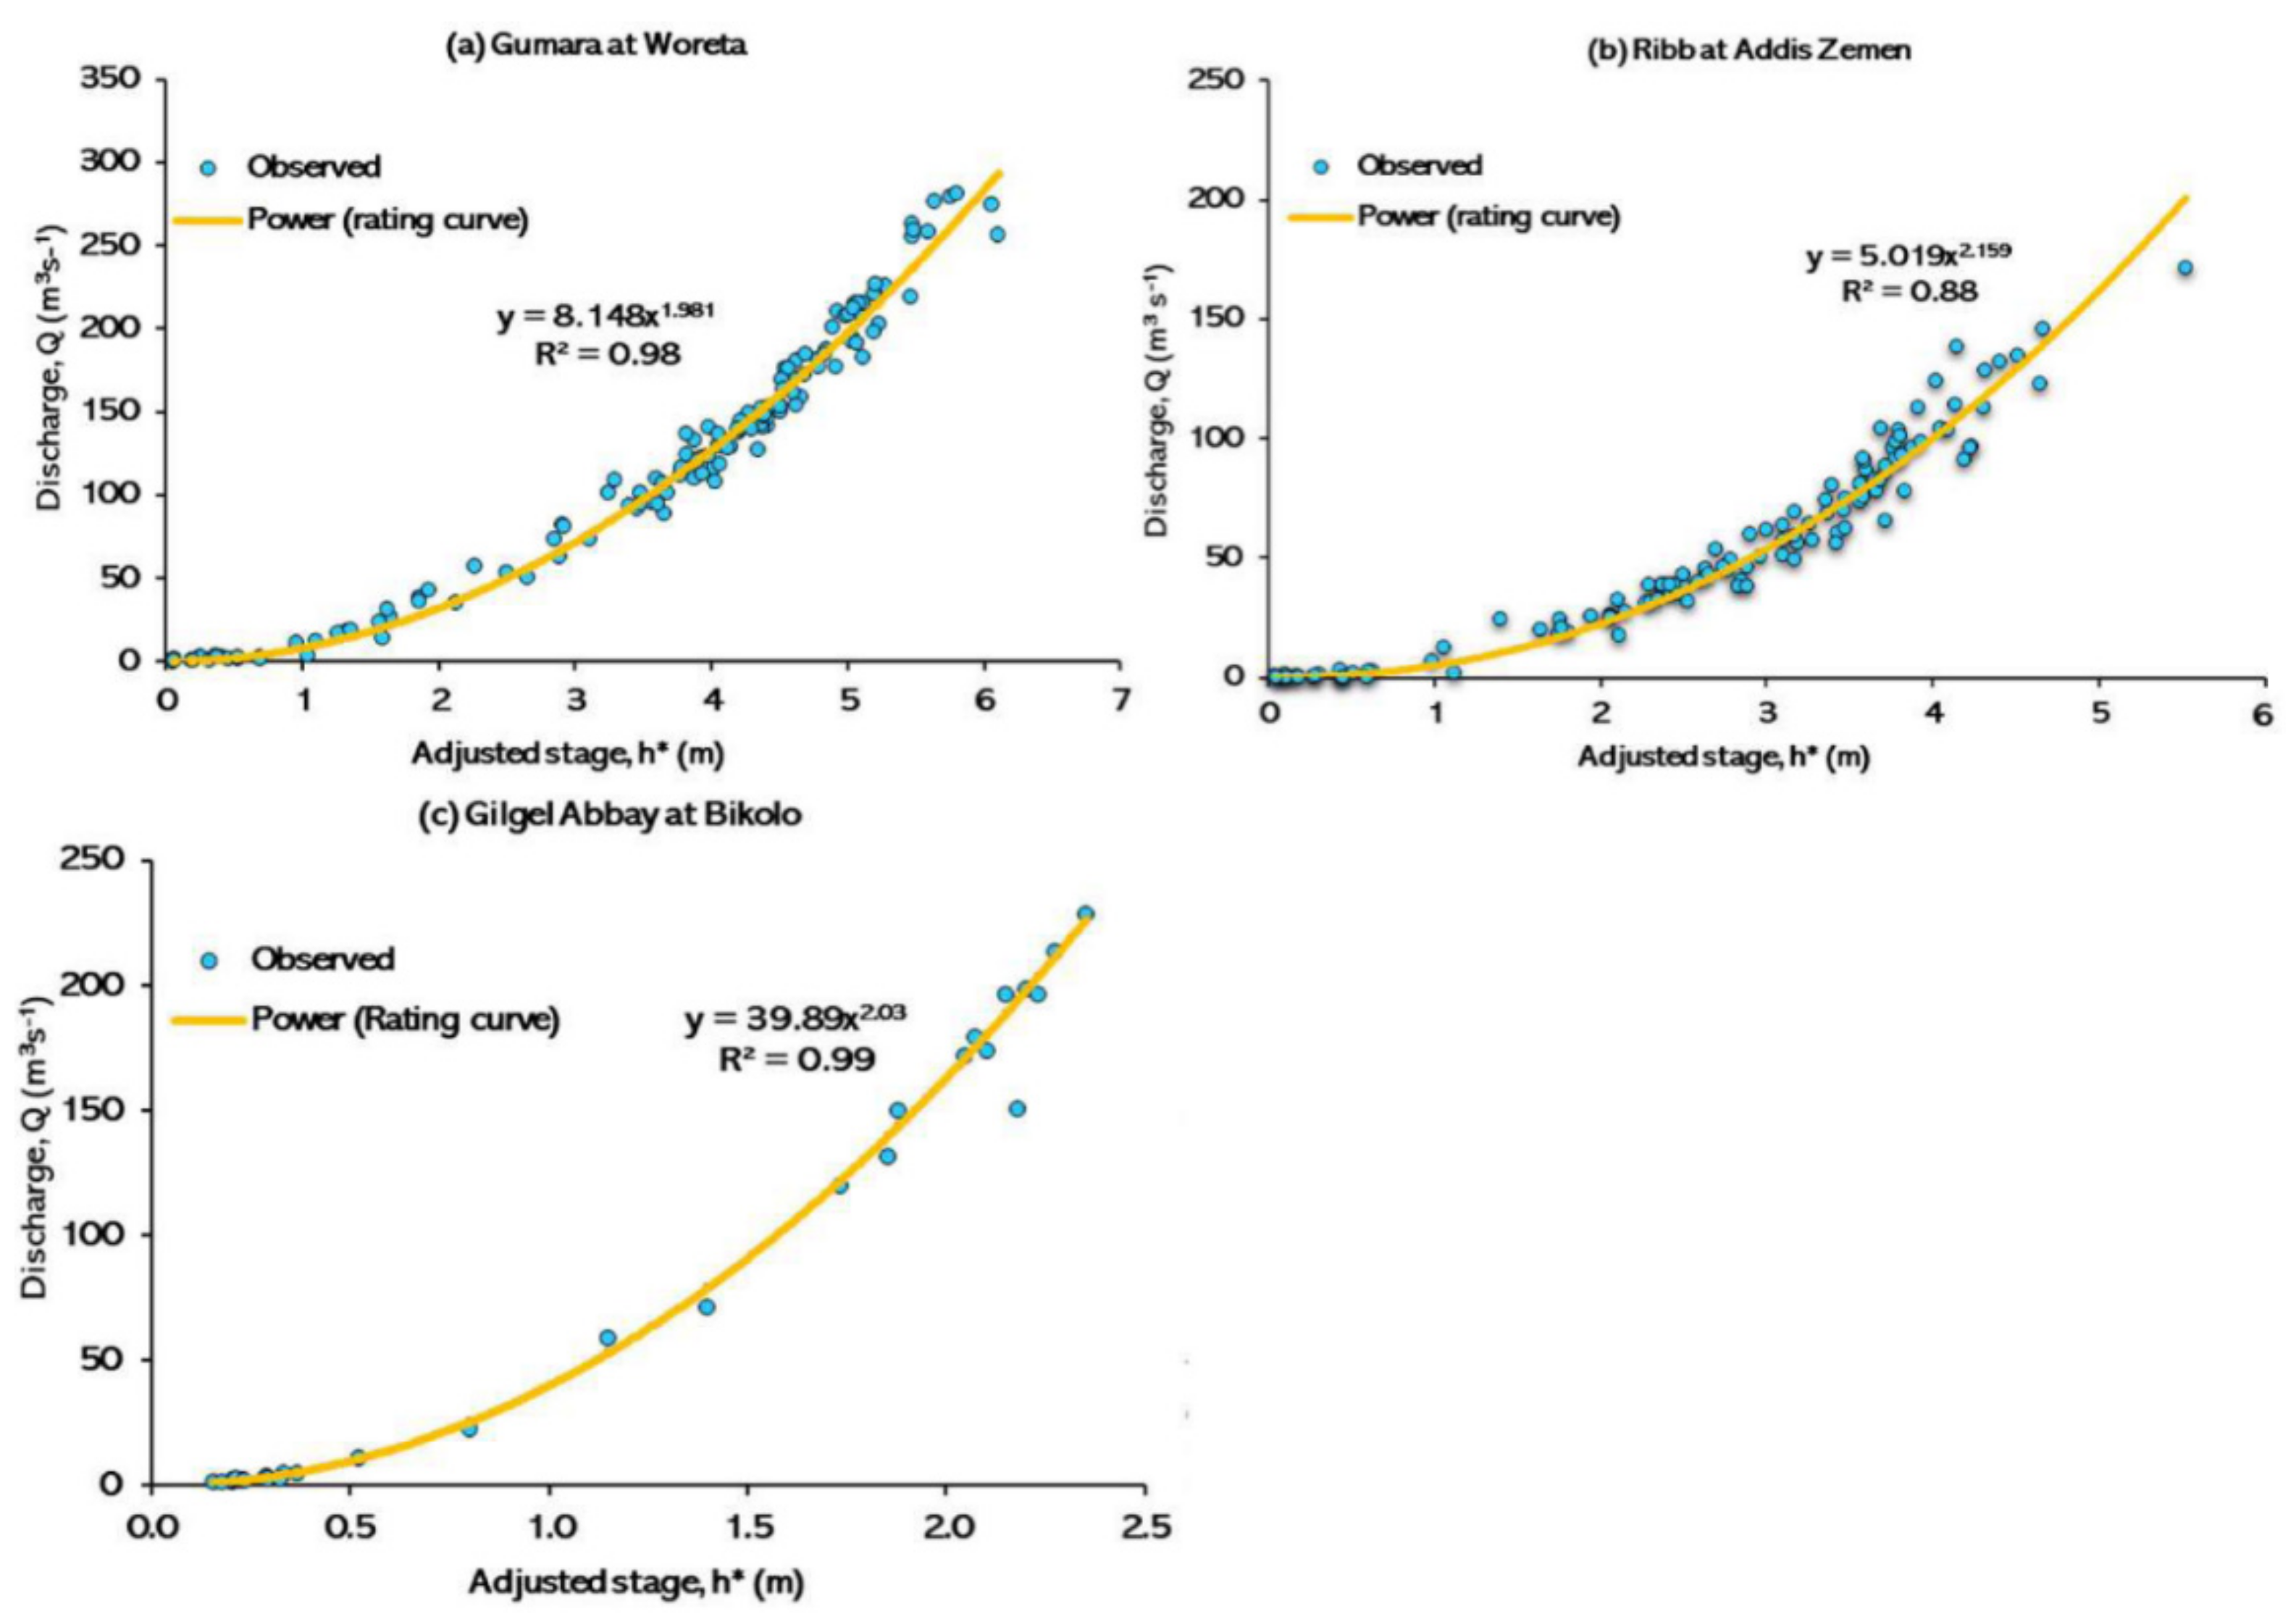
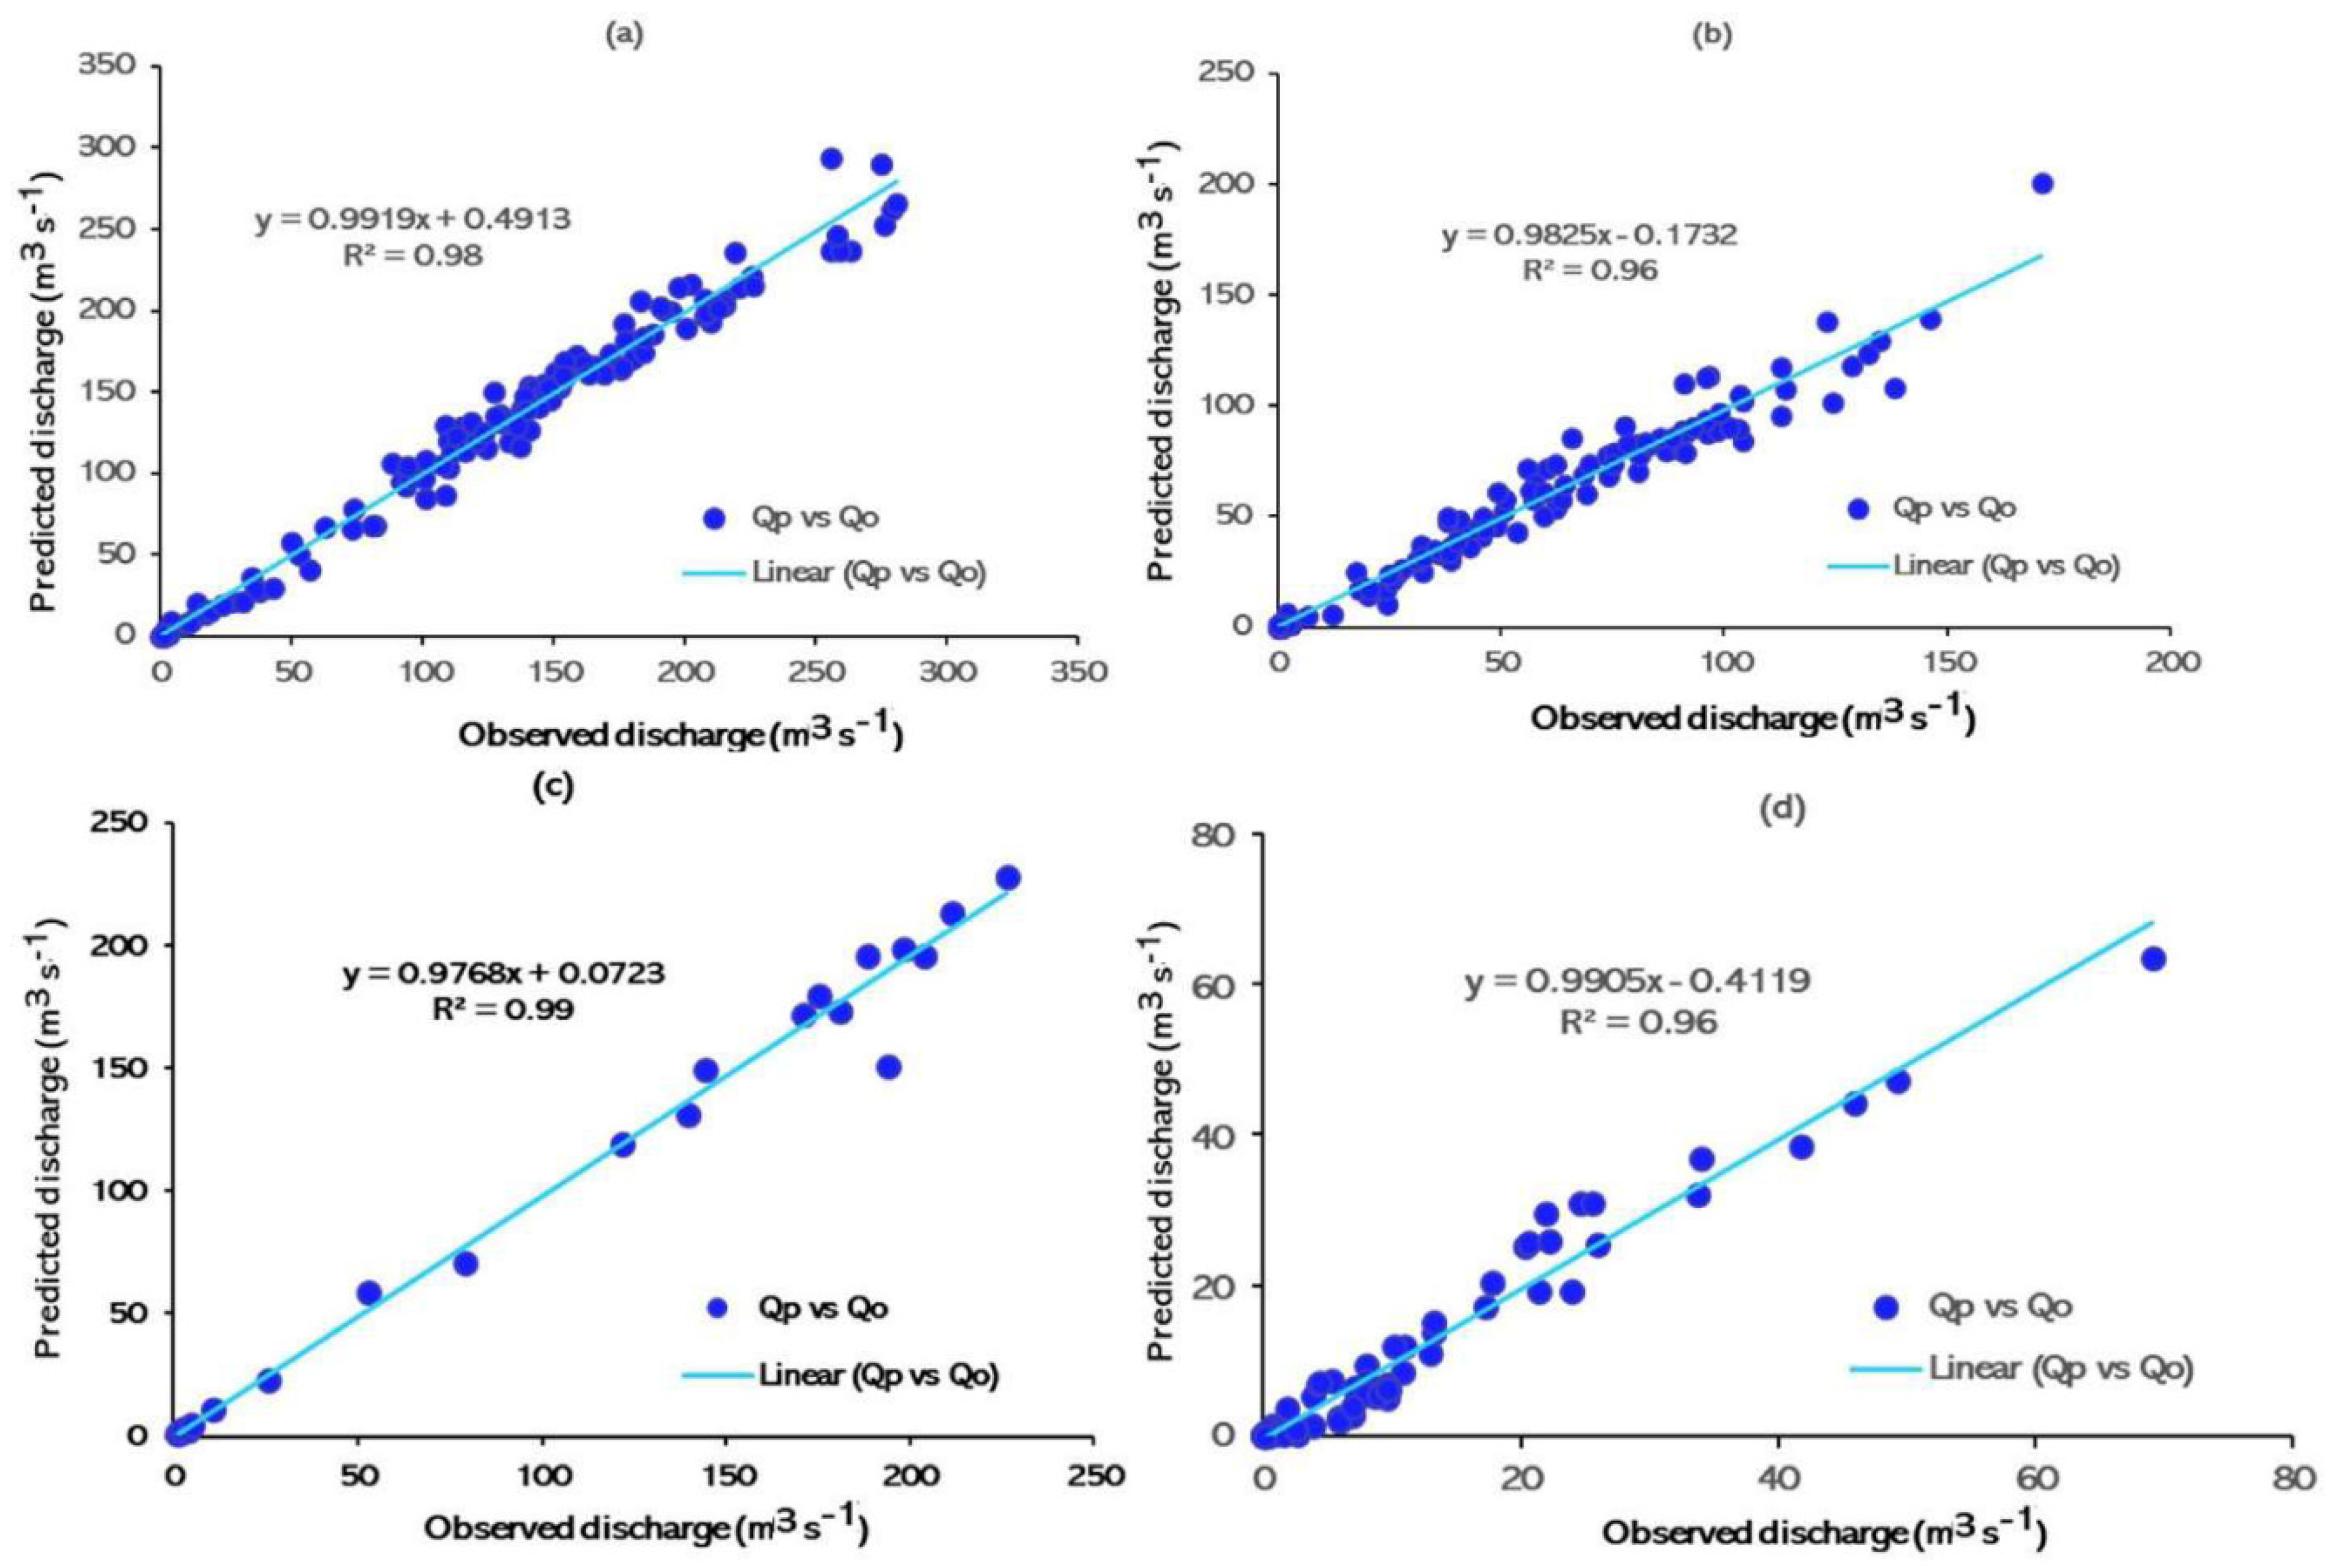
3.5. Final Rating Curves: Observed versus Predicted

The discharge plotted as a function of the adjusted stage height h*(t) shows considerably less scattering in Figure 7 and Appendix C than the stage–discharge data in Figure 5 and Appendix B. The stage–discharge functions for all 21 stations are tabulated in Table 2. The improvement is especially remarkable for the three long-term gauging stations in the planes around Lake Tana: the Gumara at Woreta (Figure 5a and Figure 7a); the Ribb at Addis Zemen (Figure 5b and Figure 7b); and Megech at Azezo (Figure 3a,c). The coefficient of determination (R2) was over 90% for these stations (Table 2, last column). The adjusted rating curve for the Gilgel Abbay at Bikolo fitted the measured data well, too, with an R2 of 89% (Figure 7c). The observed vs. predicted values are shown in Figure 8. The stage–discharge curves for the Ribb at Gassay and the Upper Ribb near Ibnat (Appendix B and Appendix C Figure A2g,h) improved significantly as well, and the scatter was greatly reduced. However, for several stations, the spread in the data remained with several stage–discharge relationships that had an R2 below 70%, which was mainly caused by the seasonal variation in the riverbed elevation.

3.6. The Rating Curve Exponents

The rating curves exponent, n, varied between 1.40 for Koga at Bikolo (Table 2, Appendix C Figure A2p) to around 3.5 for the Angereb at Gondar (Table 2, Appendix C Figure A2m). In most cases, the rating curve R2 was above 90% (5th column, Table 2; Appendix C). A few stations had a poor fit, especially Garno at Enfranz (Appendix C Figure A2k).
A value of about two for the exponent of the rating curves in large natural channels with a parabolic shape is appropriate [48]. Table 2 and Figure 7 show that exponents of the rating curves for the largest three rivers were in this range: 1.92 for the Gumara at Woreta, 2.14 for the Ribb at Addis Zemen, and 2.03 for the Gilgel Abbay at Bikolo. The shape of the channel affects the rating curve exponent [48]. For example, for triangular channels, the exponent n is 2.67. Moreover, channel roughness impacts the shiftable nature of the river bed in the gauging stations of the mountain gorges [49]. Table 2 and Appendix C show that the Megech at Azezo, Gelda at Ambessame, the Kirari near Addis Zemen, the Gumero at Maksegnit, and several other stations located in the uplands have rating curve exponents close to 2.7. Exponents of 3.0 or greater are expected for stations with section control and overbank flows [4,16,45,50]. The Upper Ribb near Ibnat and the Angereb near Gondar are the two such cases (Table 2, Appendix C Figure A2h,m). A value of n less than two indicates a channel control [16] for gauging stations in Table 2. The Koga at Bikolo is a good example (Table 2, Appendix C Figure A2p).

4. Discussion

In most developing countries, stage–discharge measurements are infrequent. Therefore, standard methods cannot be used to determine the rating curves of rivers. Furthermore, most of these countries have monsoon climates where all the rain falls in a three- to six-month period, resulting in high flows that easily can change the channel bottom elevation. Based on the occasional stage–discharge measurements, a method was developed and applied to the Lake Tana basin to find the height of the channel bed with respect to the zero-gauge height. The method was applied for 21 river gauging stations in the basin with measurement records ranging from 3 to 60 years. We found that stations at the mountainous uplands with stable channel configuration generally varied less than 30 cm per rainy season (Supplemental Materials Section S1). For the gauging stations located in plains around Lake Tana, the net channel bottom increased up to 3.0 m in 60 years (1960–2021).
The increase in offset (representing the bed elevations) starting in the period from 1970–1980 (years 10–20) and ending around 2010 (year 50, Figure 6a,b) for the Gumara and Ribb is supported by other studies investigating sediment transport and deposition in the Lake Tana basin. For example, Kebedew et al. [51], who compared bathymetric surveys of Lake Tana in 1940, 1987, 2006, and 2017, found that the annual sediment deposition before 1987 was only half of the period from 1987 to 2006. After 2006, the deposition was similar or slightly less than the period before. The peninsula development of the Gumara and the Gilgel Abbay exhibits the same pattern [12,51]: Between 1940 and 1987, peninsula expansion near the Gilgel Abbay and Gumara only increased marginally and expanded rapidly after that [51]. Similarly, the length of the Gilgel Abbay peninsula increased when the first Landsat image was available in 1972, after which it remained nearly constant [52].
The riverbed increases to 2010 and the declines after that for the Gumara at Woreta and Ribb at Addis Zemen in the Fogera Plain (Figure 6a,b) were caused by anthropogenic factors. The Ribb and the Gumara were dredged in 2008 and 2009 to prevent flooding of the newly constructed highway [53,54]. Dredging also occurred from 2014 to 2016 and from 2020 to 2021 associated with the dyke construction along the banks. Another activity that deepened the river bed was sand mining by individuals who sell sand to Bahir Dar for construction purposes [40]. The exponential expansion of Bahir Dar started around 2005. Finally, the dam for a large irrigation reservoir was completed in the middle reaches of the Ribb in 2018, reducing the sediment load [55] derived from the headwater area.
Despite the increase in offset before 2010, the channel remained intact. The river overtopped its banks regularly during the rain phase and deposited as much as 3 cm of sediment annually on the floodplain [12]. Consequently, the riverbed was not significantly affected despite the increase in bottom elevation [13,32,56] (Figure 5a,b). It is not evident from existing written documentation why the Megech (Figure 4) offset increases before the Gumara and Ribb (Figure 6a,b) from the 1960s to the 1970s. However, it might have been related to the agricultural intensification that started earlier around Gondar and the surrounding areas. In the uplands, the offsets for gauging stations were smaller and occurred at different times than stations in the alluvial plains. The bed height changed in high flow events due to either scouring or deposition of boulders and gravels, after which smaller events brought the channel back to equilibrium conditions. In the alluvial plains, the capacity to remove the sediment remained constant while the supply greatly increased, resulting in a net increase in bed height

5. Conclusions

Accurate discharge data aid in more efficiently utilizing the donor and government funds provided to the water sector. Stage–discharge measurements are infrequent in most developing countries, and rating curves are not updated after major storms. In this manuscript, a technique is developed that uses the infrequent stage–discharge measurements to develop a rating curve in which the offset varies with time.
The technique was applied to the Lake Tana basin in the Ethiopian Highlands. Furthermore, 21 stream gauges with occasional stage–discharge measurements were available for 3–60 years. Time-dependent offset polynomial functions of up to the fourth order were developed to fit the available historical stage–discharge measurements. The calculated offsets were as large as 3 m in the alluvial plains to less than 75 cm for the upland station. Occasional historical measurement of the offset agreed with the predicted values. Replotting the stage–discharge data adjusted for the calculated offset reduced the scatter of the data. In all, the technique can improve the accuracy of streamflow and will allow the ministry to improve its published discharge data in the Lake Tana basin. It will require additional funds because most stage readings are not electronically available. However, with the war raging currently, it is likely not be a high priority for funding.

Supplementary Materials

The following are available online at https://www.mdpi.com/article/10.3390/hydrology9010013/s1, Section S1: Fitted polynomials of the offset as a function of time, constants and exponent of modified rating curves.

Author Contributions

The three authors were involved in all aspects of this paper. All authors have read and agreed to the published version of the manuscript.

Funding

This research received no external funding.

Data Availability Statement

All data are available from the sources mentioned in the manuscript.

Acknowledgments

We thank the FDRE Ministry of Water Resources Irrigation and Electricity (MoWIE) and Abbay Basin Development Office (ABDO) that supported this research. Special thanks to the Directorate of Research and Development in MoWIE and the Directorate of Hydrometry at ABDO. Finally, the help of the staff, the hydrologists, and the hydrology technicians of ABDO are very much appreciated.

Conflicts of Interest

The authors declare that they do not have a conflict of interest with any of the content reported in this manuscript.

Appendix A

Statistical Performance Metrics

Calibration of rating curve parameters is achieved by minimizing the error between the observed Q-h values and the fitted rating curve using Nash–Sutcliffe Efficiency (NSE), Coefficient of determination, and Root Mean Square.
The Nash–Sutcliffe efficiency (NSE) determines the relative magnitude of the residual variance compared to the measured data variance [57]:
NSE = 1 [ i = 1 n ( Q i o Q i s ) 2 i = 1 n ( Q i o Q i m ) 2 ]
where Qio is the observation value, Qis is the model value for the variable being simulated, Qim is the average of discharge observations, and n is the number of observations [58]. Nash–Sutcliffe efficiency indicates how well the plot of observed versus simulated data fits the 1:1 line.
The model performance can be evaluated with the coefficient of determination, the R2:
R 2 = 1 [ i n ( Q i o Q i s ) 2 i n ( Q i o Q i m ) 2 ]
The lower limit of the R2 is equal to zero when there is no correlation between the observed and predicted values, R2 = 1 for a perfect fit.
RMSE is a standard way to measure the error of a model in predicting quantitative data. It is defined as:
RMSE = 1 ( i n ( Q i o Q i S ) n )
RMSE is the standard deviation of the residuals (prediction errors). It is a measure of how spread out these residuals are. The magnitude of RMSE varies with the size of values of the parameter. It is commonly used in regression analysis and for prediction purposes to compare observed and model results. RMSE values closer to zero are the best.

Appendix B

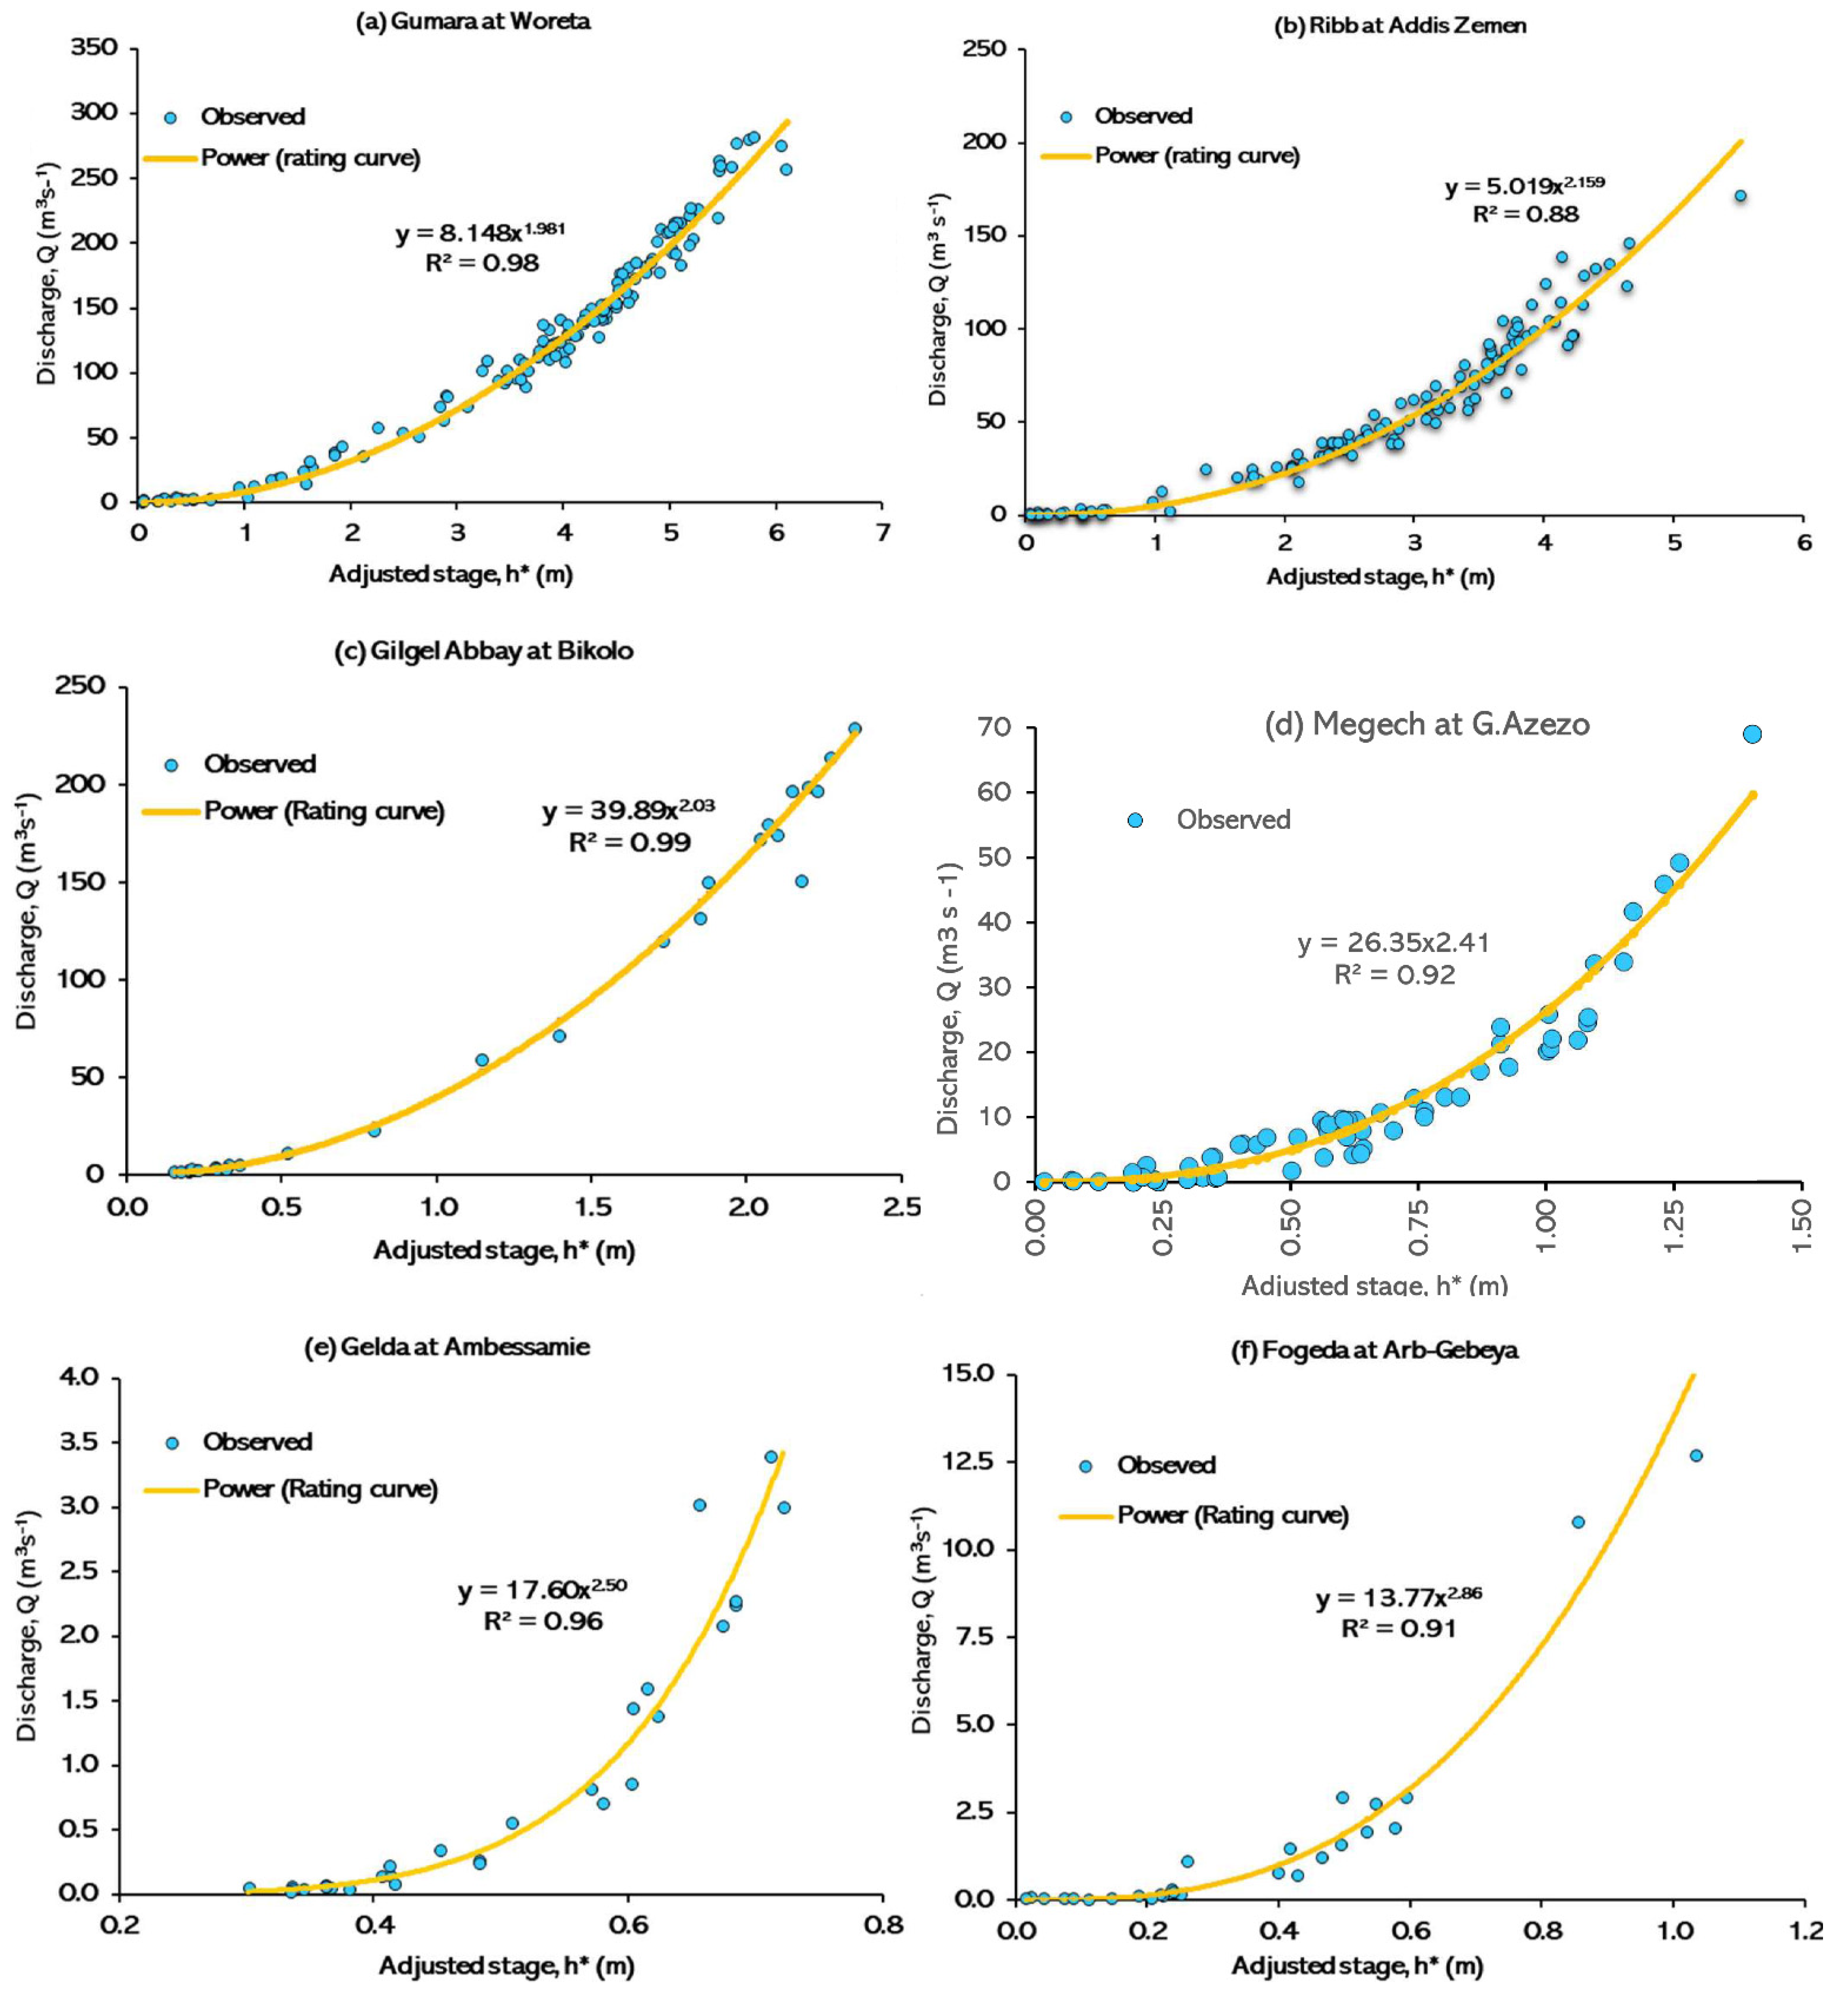
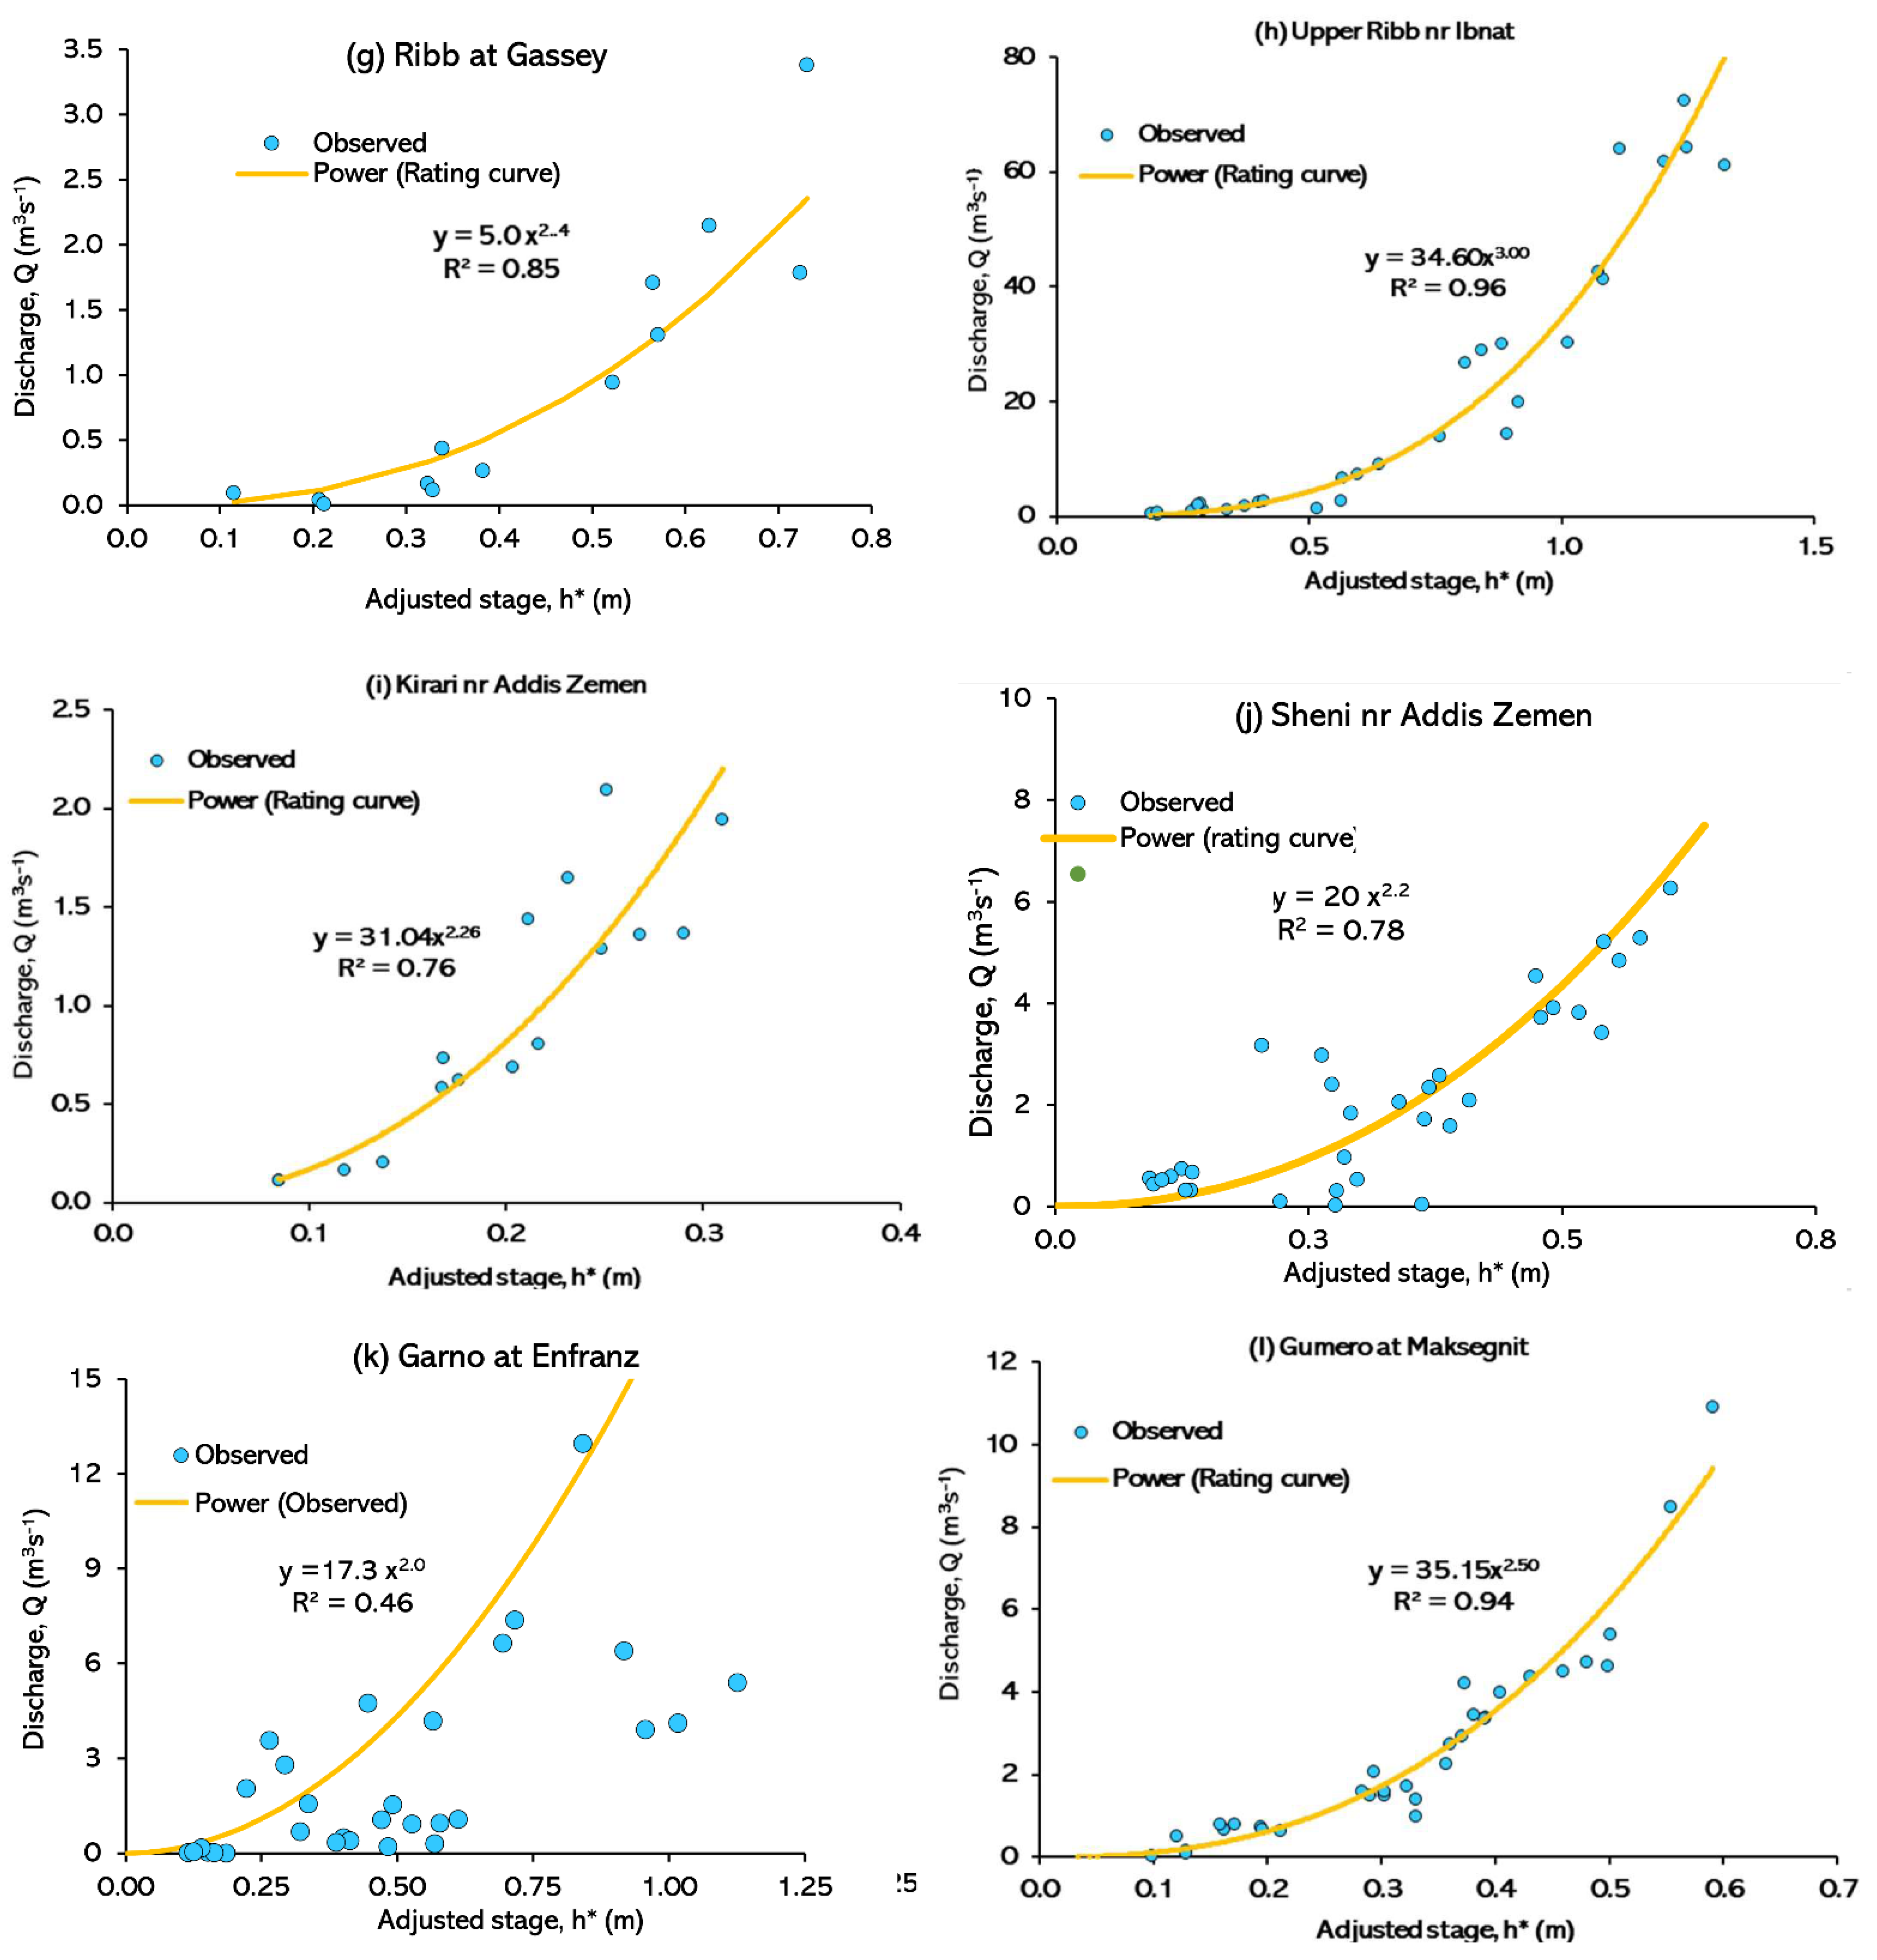
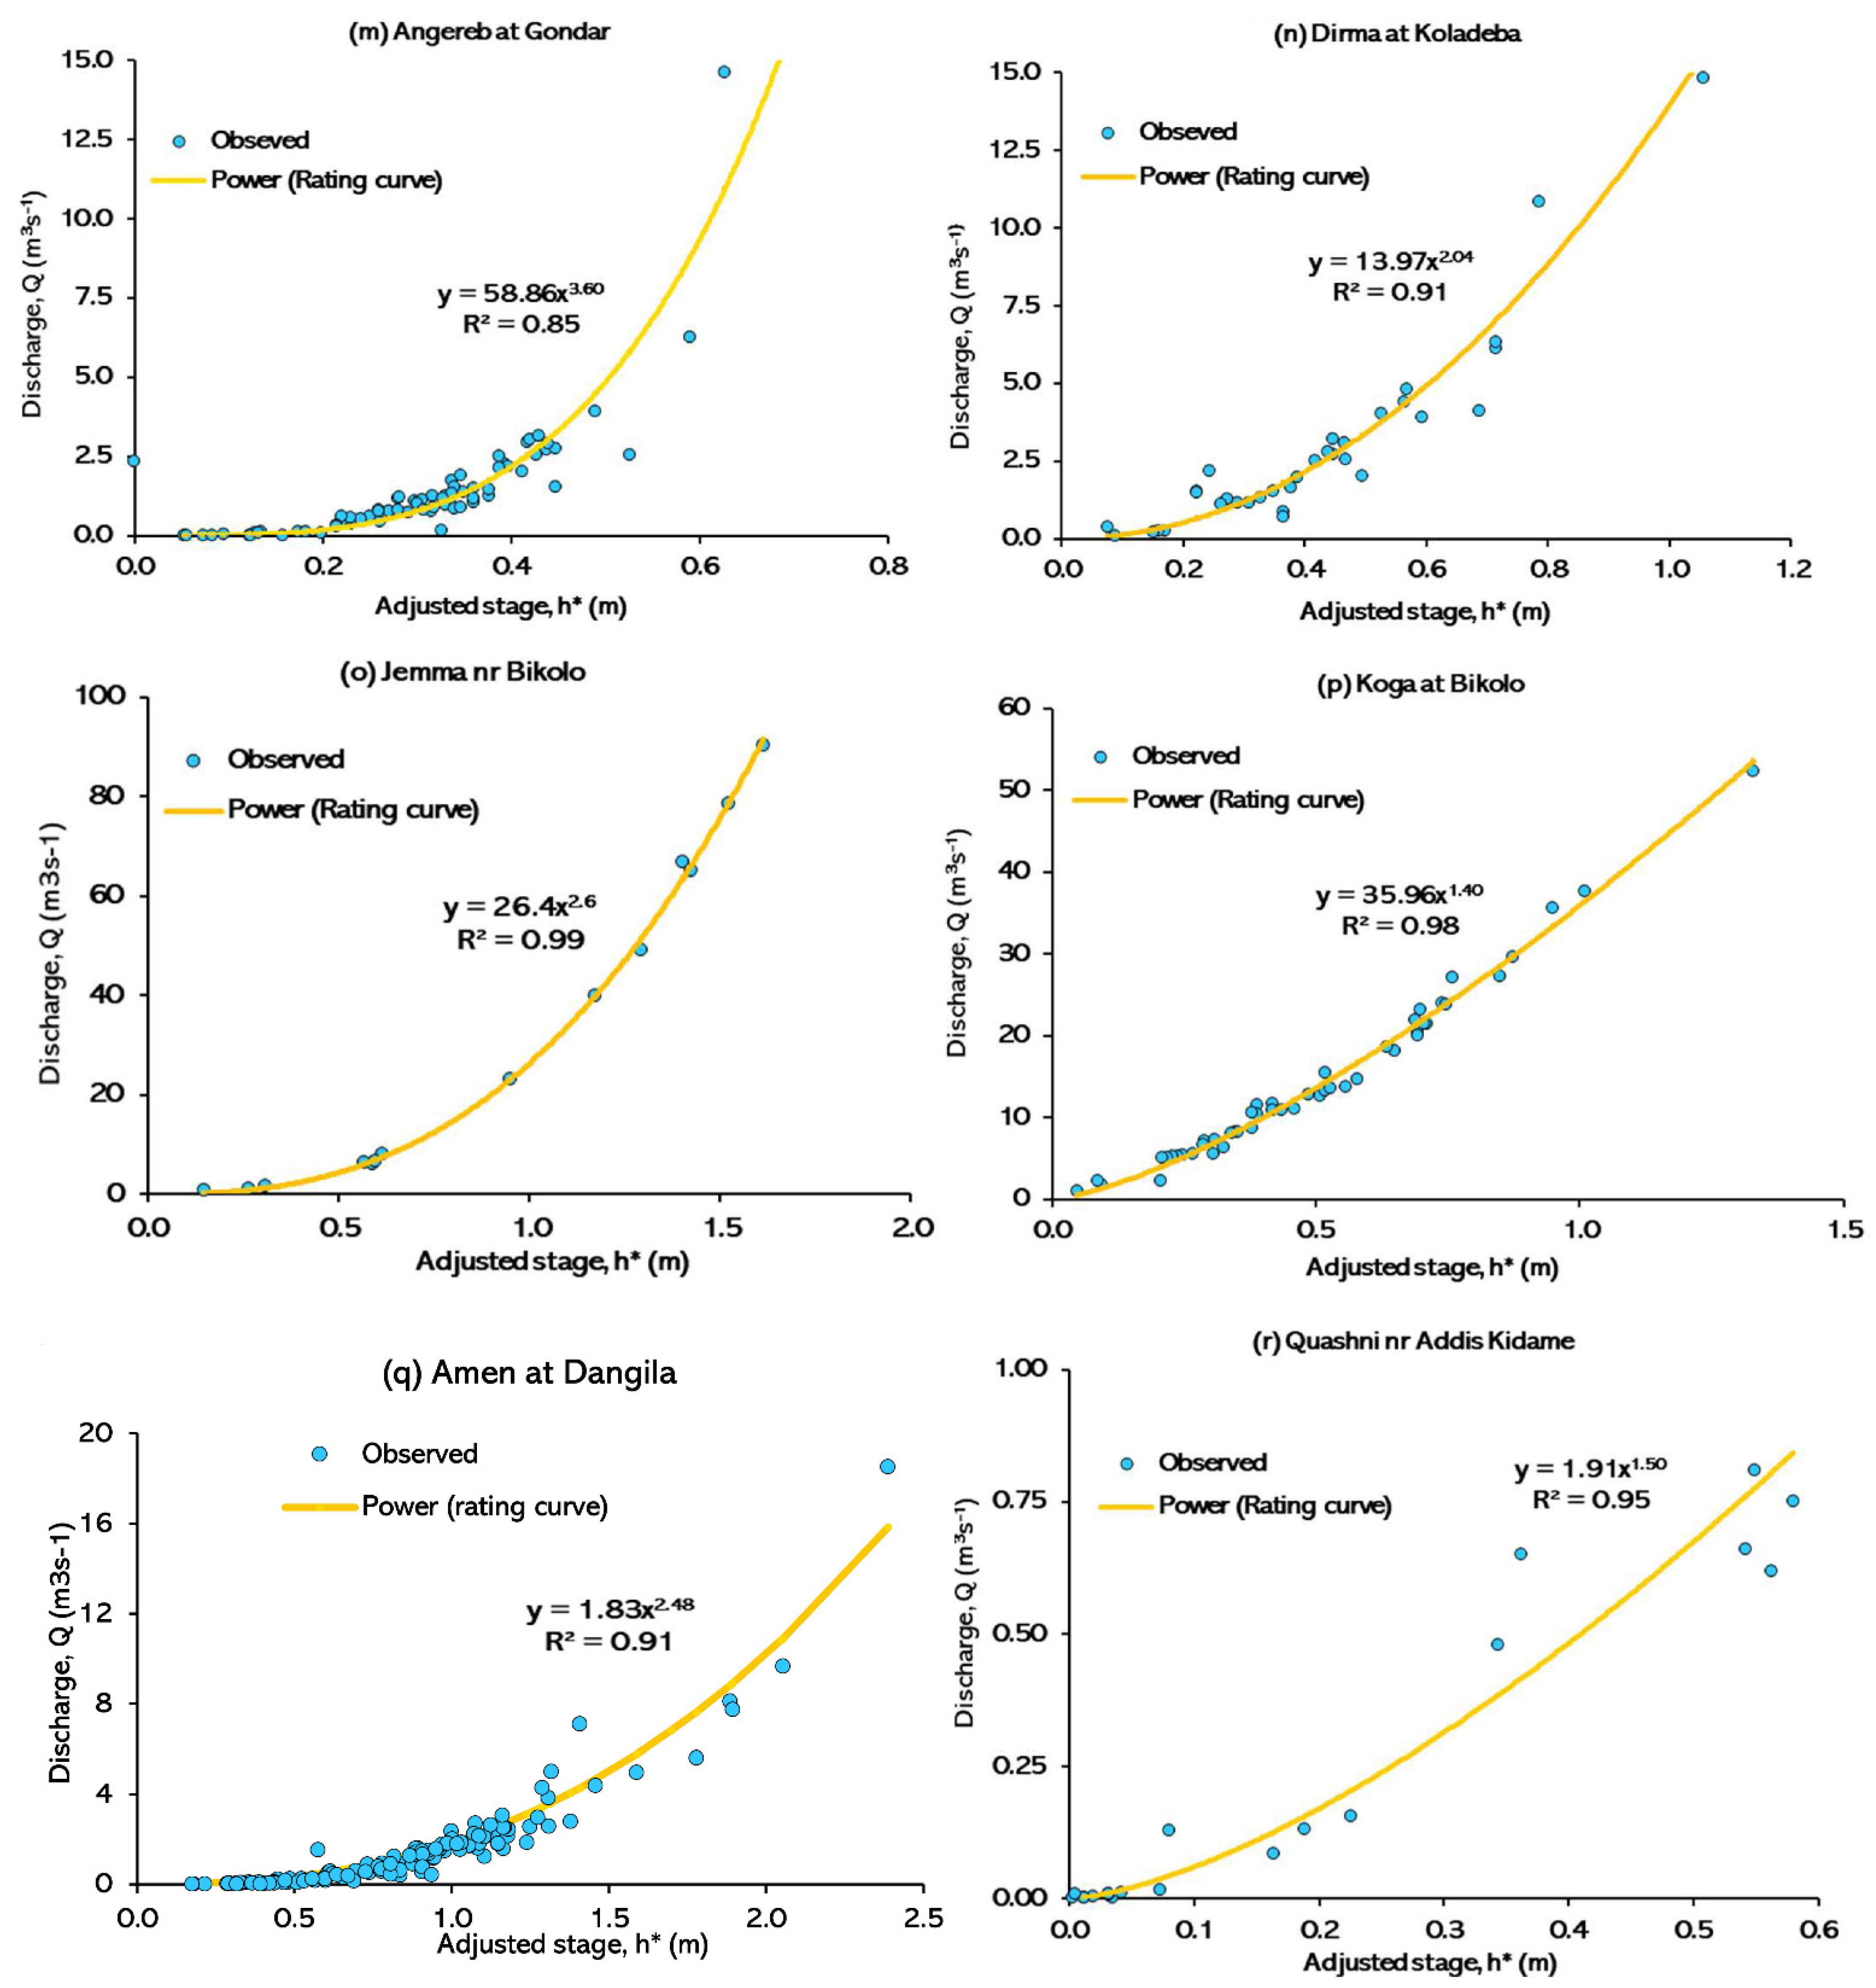
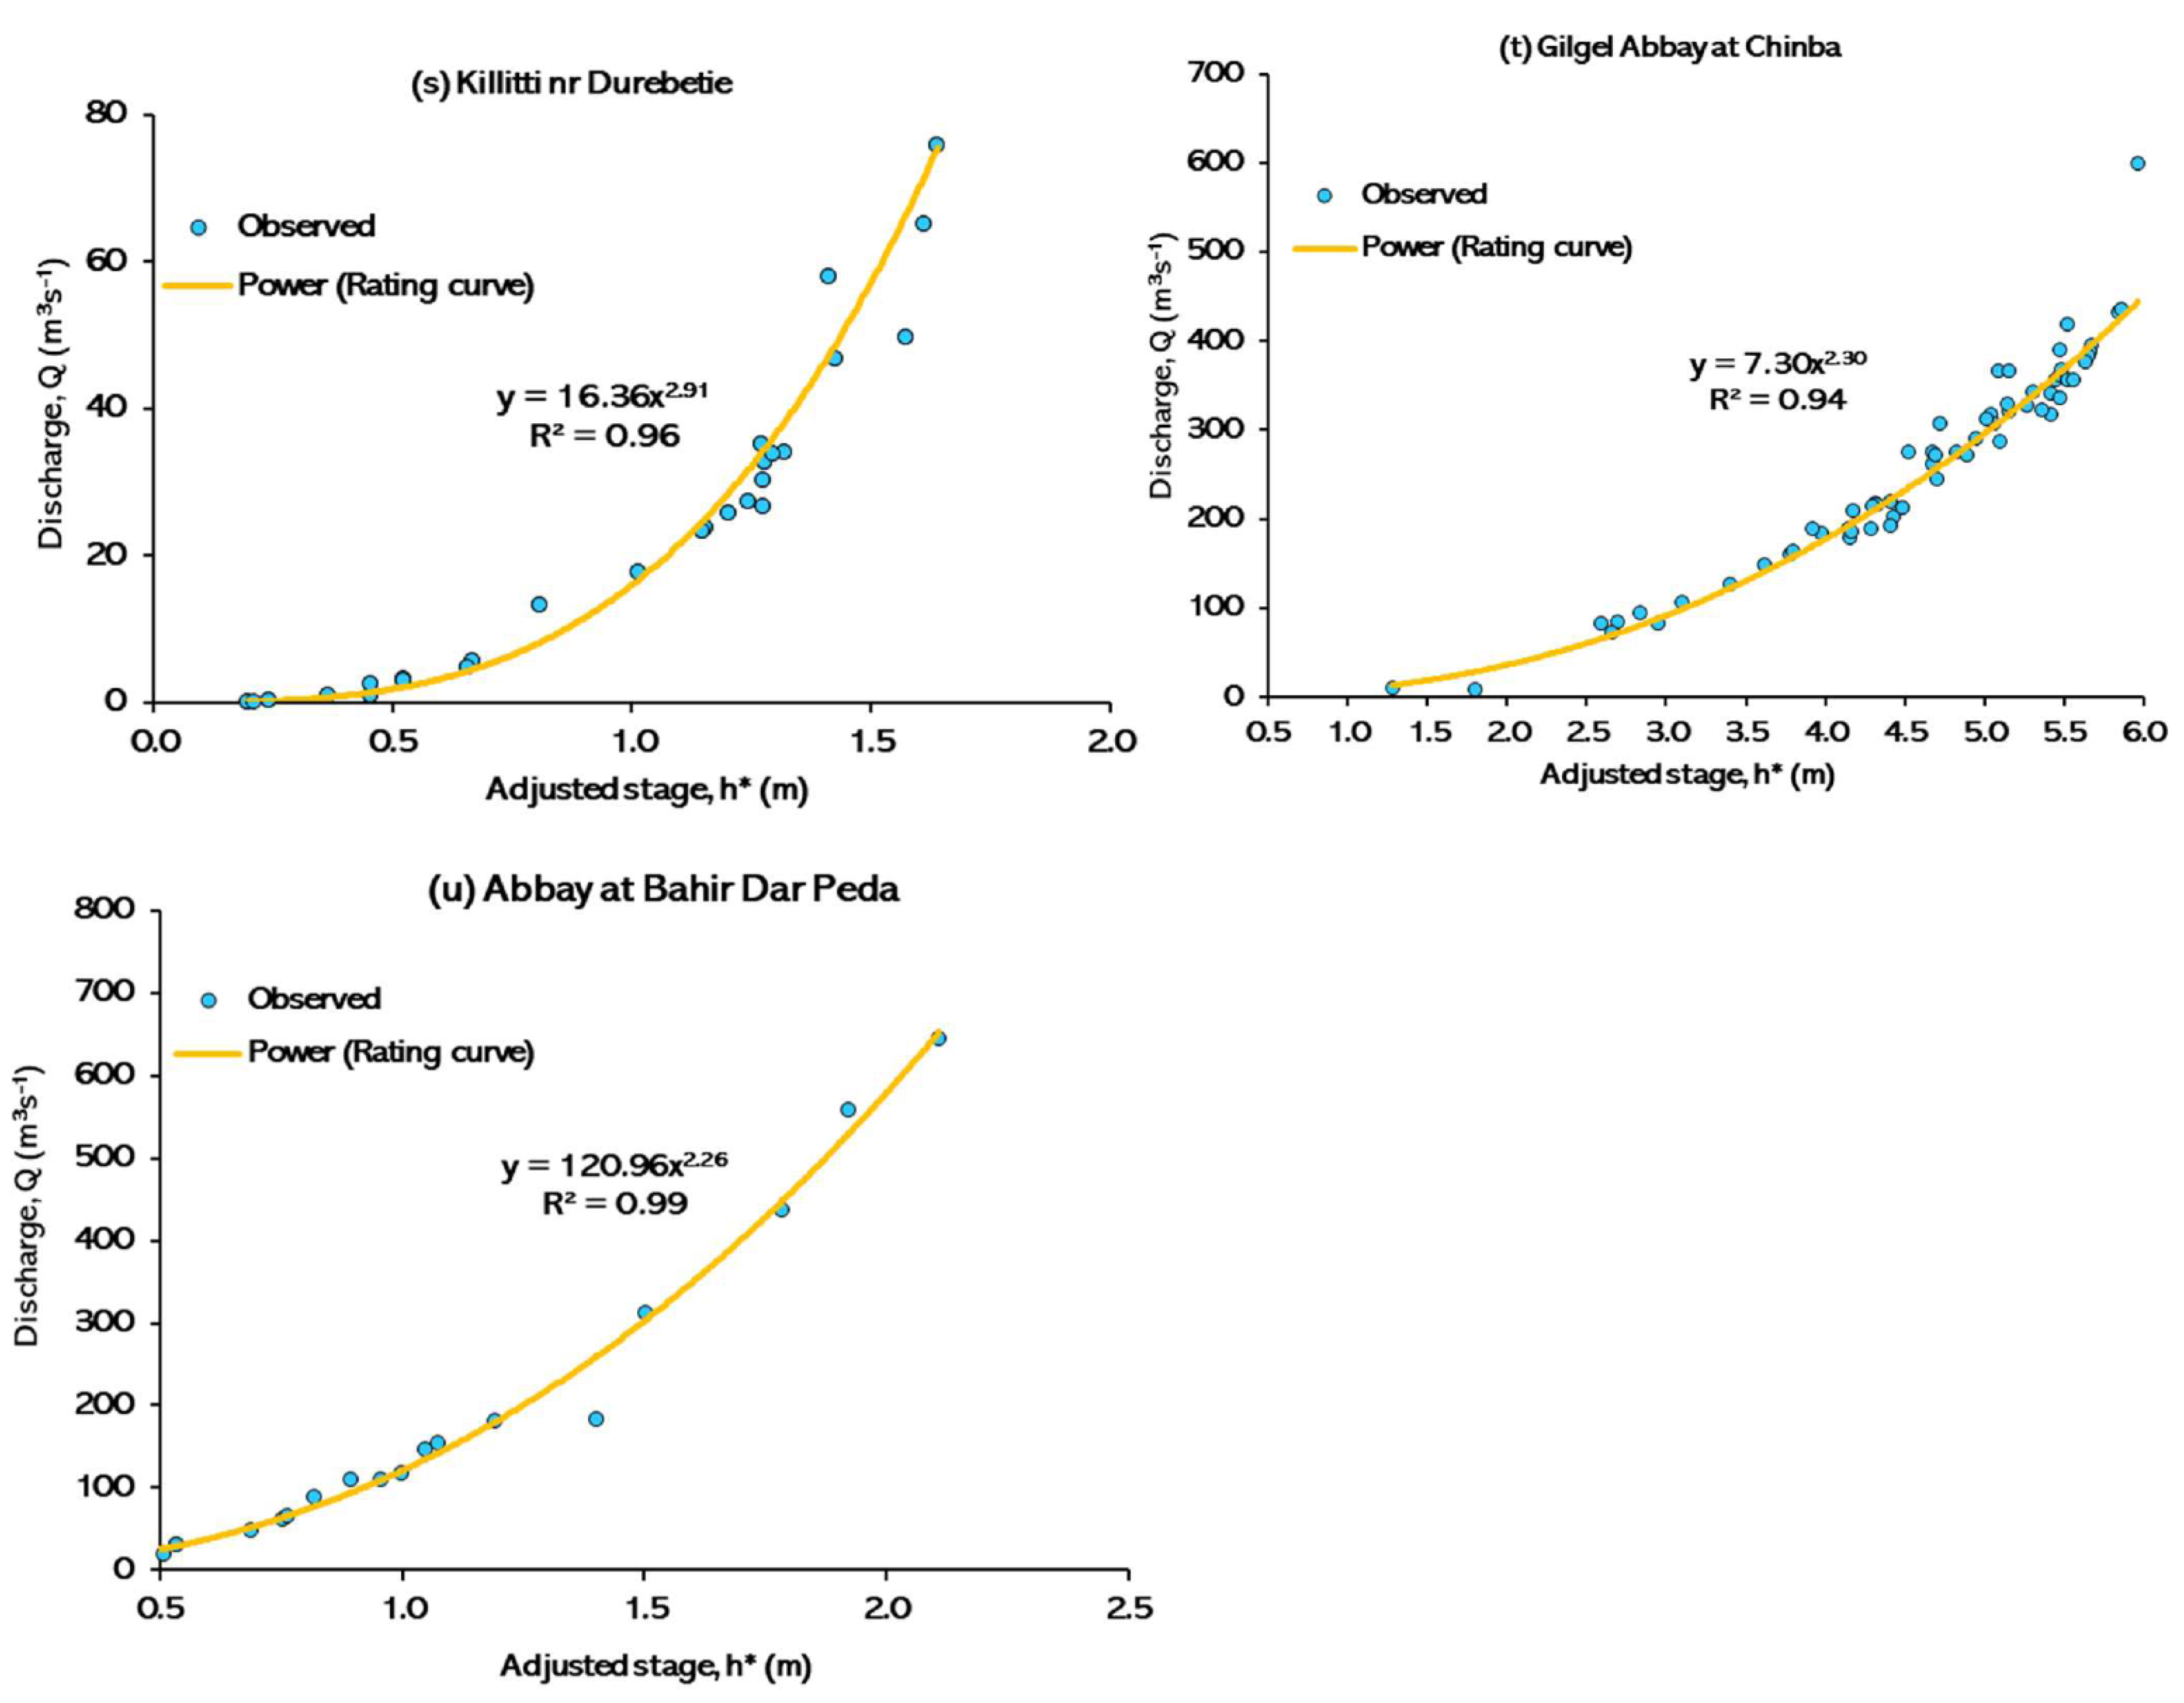
Original Stage–Discharge Rating Curves

The original stage–discharge data for the 21 stations listed in Table 1 in the Lake Tana Basin are shown below. For completeness, all gauging station shown in the main text are are shown.
Figure A1. Available stage–discharge data pairs arranged by the decade they were measured for gauging stations in the Lake Tana basin, (a) Gumara at Woreta, (b) Ribb at Addis Zemen, (c) Gilgel Abbay at Bikolo, and (d) Megech at Gondar Azezo; secondary or tertiary stations: (e) Gelda at Ambessame, (f) Fogeda at Arb-Gebeya, (g) Ribb at Gassay, (h) Upper Ribb near Ibnat, (i) Kirari near Addis Zemen, (j) Sheni at Addis Zemen, (k) Garno at Enfranz, (l) Gumero at Maksegnit, (m) Angereb at Gondar; (n) Dirma at Koladeba, (o) Jemma at Bikolo, (p) Koga at Bikolo, (q) Amen at Dangila, (r) Quashini near Addis Kidame, (s) Killitti at Durebetie, and (t) Gilgel Abbay at Chinba, and the Lake Tana outflow gauging station (u) Abbay at Bahir Dar Peda.
Hydrology 09 00013 g0a1aHydrology 09 00013 g0a1bHydrology 09 00013 g0a1cHydrology 09 00013 g0a1d

Appendix C

Modified Stage–Discharge Rating Curves

Plots of the modified stage discharge data for the 21 stations listed in Table 1 in the Lake Tana Basin are presented. For completeness, the figures of the Gumara, Ribb, Gilgel Abbay, and Megech are included.
Figure A2. Stage discharge curves after adjusted for the offset for the gauging station in the Lake Tana (a) Gumara at Woreta, (b) Ribb at Addis Zemen, (c) Gilgel Abbay at Bikolo, and (d) Megech at Gondar Azezo; secondary or tertiary stations: (e) Gelda at Ambessame, (f) Fogeda at Arb-Gebeya, (g) Ribb at Gassay, (h) Upper Ribb near Ibnat, (i) Kirari near Addis Zemen, (j) Sheni at Addis Zemen, (k) Garno at Enfranz, (l) Gumero at Maksegnit, (m) Angereb at Gondar; (n) Dirma at Koladeba, (o) Jemma at Bikolo, (p) Koga at Bikolo, (q) Amen at Dangila, (r) Quashini near Addis Kidame, (s) Killitti at Durebetie, and (t) Gilgel Abbay at Chinba, and theLake Tana outflow gauging station (u) Abbay at Bahir Dar Peda. The offset as a function of the number of years after the first measurement are shown in Table 2.
Hydrology 09 00013 g0a2aHydrology 09 00013 g0a2bHydrology 09 00013 g0a2cHydrology 09 00013 g0a2d

References

  1. Grover, N.C.; Hoyt, J.C. Accuracy of Streamflow Data; 400D; 1916.-pubs.er.usgs.gov, G.P.O.: Washington, DC, USA.
  2. Hamilton, A.S.; Moore, R.D. Quantifying uncertainty in streamflow records. Can. Water Resour. J. Rev. Can. Ressour. Hydr. 2013, 37, 3–21. [Google Scholar] [CrossRef]
  3. Whitfield, P.H.; Pomeroy, J.W. Assessing the quality of the streamflow record for a long-term reference hydrometric station: Bow River at Banff. Can. Water Resour. J. Rev. Can. Ressour. Hydr. 2017, 42, 391–415. [Google Scholar] [CrossRef]
  4. Mansanarez, V.; Renard, B.; Le Coz, J.; Lang, M.; Darienzo, M. Shift happens! Adjusting stage-discharge rating curves to morphological changes at known times. Water Resour. Res. 2019, 55, 2876–2899. [Google Scholar] [CrossRef]
  5. McMillan, H.K.; Westerberg, I.K. Rating curve estimation under epistemic uncertainty. Hydrol. Processes 2015, 29, 1873–1882. [Google Scholar] [CrossRef]
  6. Van Eerdenbrugh, K.; Van Hoey, S.; Verhoest, N.E.C. Identification of temporal consistency in rating curve data: Bidirectional Reach (BReach). Water Resour. Res. 2016, 52, 6277–6296. [Google Scholar] [CrossRef] [Green Version]
  7. Le Coz, J. A Literature Review of Methods for Estimating the Uncertainty Associated with Stage-Discharge Relations. WMO Rep. PO6a. 2012, p. 21. Available online: http://citeseerx.ist.psu.edu/viewdoc/download?doi=10.1.1.400.8656&rep=rep1&type=pdf (accessed on 9 January 2022).
  8. Morlot, T.; Perret, C.; Favre, A.C.; Jalbert, J. Dynamic rating curve assessment for hydrometric stations and computation of the associated uncertainties: Quality and station management indicators. J. Hydrol. 2014, 517, 173–186. [Google Scholar] [CrossRef] [Green Version]
  9. McMahon, T.A.; Peel, M.C. Uncertainty in stage–discharge rating curves: Application to Australian Hydrologic Reference Stations data. Hydrol. Sci. J. 2019, 64, 255–275. [Google Scholar] [CrossRef] [Green Version]
  10. Manfreda, S. On the derivation of flow rating curves in data-scarce environments. J. Hydrol. 2018, 562, 151–154. [Google Scholar] [CrossRef]
  11. Hamilton, S.; Watson, M.; Pike, R. The Role of the Hydrographer in Rating Curve Development. Conflu. J. Watershed Sci. Manag. 2019, 3. [Google Scholar] [CrossRef] [Green Version]
  12. Abate, M.; Nyssen, J.; Moges, M.M.; Enku, T.; Zimale, F.A.; Tilahun, S.A.; Adgo, E.; Steenhuis, T.S. Long-Term Landscape Changes in the Lake Tana Basin as Evidenced by Delta Development and Floodplain Aggradation in Ethiopia. Land Degrad. Dev. 2017, 28, 1820–1830. [Google Scholar] [CrossRef]
  13. Zimale, F.A.; Moges, M.A.; Alemu, M.L.; Ayana, E.K.; Demissie, S.S.; Tilahun, S.A.A.; Steenhuis, T.S. Budgeting suspended sediment fluxes in tropical monsoonal watersheds with limited data: The Lake Tana basin. J. Hydrol. Hydromech. 2018, 66, 65. [Google Scholar] [CrossRef] [Green Version]
  14. Davies, P.M. Climate change implications for river restoration in global biodiversity hotspots. Restor. Ecol. 2010, 18, 261–268. [Google Scholar] [CrossRef]
  15. Braca, G. Stage-Discharge Relationships in Open Channels: Practices and Problems; Dipartimento di Ingegneria Civile e Ambientale, Università degli Studi di Trento: Trento, Italy, 2008. [Google Scholar]
  16. Rantz, S.E. Measurement and Computation of Streamflow; U.S. Government Printing Office: Washington, DC, USA, 1982; Volume 2. [Google Scholar]
  17. Reitan, T.; Petersen-Øverleir, A. Dynamic rating curve assessment in unstable rivers using Ornstein-Uhlenbeck processes. Water Resour. Res. 2011, 47. [Google Scholar] [CrossRef]
  18. BRL Ingénierie and MCE. Environmental and Social Impact Assessment of Irrigation and Drainage Schemes at Megech Pump (Seraba), Ribb and Anger Dam; 1/2: Main Report; Ministry of Water Resources: Addis Ababa, Ethiopia, 2010. [Google Scholar]
  19. BCEOM. Abbay River Basin Integrated Development Master Plan Project; Phase 2; Ministry of Water, Resources: Addis Ababa, Ethiopia, 1999. [Google Scholar]
  20. Chorowicz, J.; Collet, B.; Bonavia, F.F.; Mohr, P.; Parrot, J.F.; Korme, T. The Tana basin, Ethiopia: Intra-plateau uplift, rifting and subsidence. Tectonophysics 1998, 295, 351–367. [Google Scholar] [CrossRef]
  21. Alemayehu, T.; McCartney, M.; Kebede, S. Improved water and land management in the Ethiopian highlands: Its impact on downstream stakeholders dependent on the Blue Nile. Intermediate Results Dissemination Workshop held at the International Livestock Research Institute (ILRI), Addis Ababa, Ethiopia, 5–6 February 2009. Available online: https://www.weap21.org/downloads/LakeTana.pdf (accessed on 9 January 2022).
  22. BRL Ingénierie. Hydraulics Infrastructures; Ribb Plain—Flood Appraisal BRL: Addis Ababa, Ethiopia, 2015. [Google Scholar]
  23. BRL Ingénierie—Royal HaskoningDHV—T&A. Institutional Set Up Studies of The Ethiopian Nile (Abbay) Basin Project; Ministry of Water Resources: Addis Ababa, Ethiopia, 2008; p. 12. [Google Scholar]
  24. Worqlul, A.W.; Collick, A.S.; Rossiter, D.G.; Langan, S.; Steenhuis, T.S. Assessment of surface water irrigation potential in the Ethiopian highlands: The Lake Tana Basin. Catena 2015, 129, 76–85. [Google Scholar] [CrossRef]
  25. Water Works Design and Supervision Enterprise and TAHAL Consulting Eng. Design of Dams in Lake Tana Sub-Basin Project, Ribb Dam Design; Ribb Feasibility Study Final; Ministry of Water Resources: Addis Ababa, Ethiopia, 2008. [Google Scholar]
  26. Water Works Design and Supervision Enterprise and TAHAL Consulting Eng. Design of Irrigation and Drainage Projects in Lake Tana Sub-Basin, Jemma Irrigation Project, Volume 3—Hydrological Studies; Jemma Irigation Project: Addis Ababa, Ethiopia, 2008. [Google Scholar]
  27. Legesse, S.A. Environmental Protection in the Lake Tana Basin. In Social and Ecological System Dynamics in the Lake Tana Basin, Ethiopia; Stave, K., Goshu, G., Aynalem, S., Eds.; Springer: Cham, Switzerland, 2017; pp. 433–452. [Google Scholar]
  28. SMEC. Hydrological Study of the Tana-Beles Sub-Basins, Surface Water Investigation; 5089018; Ministry of Water Resources: Addis Ababa, Ethiopia, 2008. [Google Scholar]
  29. Annys, S.; Adgo, E.; Ghebreyohannes, T.; Van Passel, S.; Dessein, J.; Nyssen, J. Impacts of the hydropower-controlled Tana-Beles interbasin water transfer on downstream rural livelihoods (northwest Ethiopia). J. Hydrol. 2019, 569, 436–448. [Google Scholar] [CrossRef]
  30. Dessie, M.; Verhoest, N.E.; Adgo, E.; Poesen, J.; Nyssen, J. Scenario-based decision support for an integrated management of water resources. Int. J. River Basin Manag. 2017, 15, 485–502. [Google Scholar] [CrossRef]
  31. Mott MacDonald. Growth Corridor for Tana and Beles Regions: Endowments, Potential and Constraints, Appendix 1A Land and Water Endowments; Ministry of Water Resources: Addis Ababa, Ethiopia, 2009. [Google Scholar]
  32. SMEC. Hydrological Study of the Tana-Beles Sub-Basins, Hydrological Monitoring Network (Review and Recommendations); MoWE: Addis Ababa, Ethiopia, 2008. [Google Scholar]
  33. Eastern Nile Transboundary Regional Office. Flood Risk Mapping for Pilot Areas in Ethiopia: Final Report to the Eastern Nile Technical Regional Office; ENTRO: Addis Ababa, Ethiopia, 2010; pp. 1–206. [Google Scholar]
  34. Mekonnen, D.F. Satellite Remote Sensing for Soil Moisture Estimation: Gumara Catchement, Ethiopia; Master of Science in Geo-information Science and Earth Observation; Technische Universität München: Enschede, The Netherlands, 2009. [Google Scholar]
  35. Abate, M.; Nyssen, J.; Steenhuis, T.S.; Moges, M.M.; Tilahun, S.A.; Enku, T.A.; Adgo, E. Morphological changes of Gumara River channel over 50 years, upper Blue Nile basin, Ethiopia. J. Hydrol. 2015, 525, 152–164. [Google Scholar] [CrossRef]
  36. Petersen-Øverleir, A. Modelling stage–discharge relationships affected by hysteresis using the Jones formula and non-linear regression. Hydrol. Sci. J. 2006, 51, 365–388. [Google Scholar] [CrossRef] [Green Version]
  37. Shrestha, K.B. Evaluation of Converting Stage to Discharge Using Normal Rating Curve for Flood Routing Studies; M. Technology, M. Tech: Roorkee, India, 2000. [Google Scholar]
  38. Gore, J.A.; Banning, J. Chapter 3—Discharge measurements and streamflow analysis. In Methods in Stream Ecology; Hauer, F.R., Lamberti, G.A., Eds.; Academic Press: Boston, MA, USA, 2017; Volume 1, pp. 49–70. [Google Scholar] [CrossRef]
  39. Lowe, L.; Szemis, J.; Webb, J.A. Chapter 15—Uncertainty and Environmental ater. In Water for the Environment; Academic Press: Cambridge, MA, USA; Elsevier BV: Amsterdam, The Netherlands, 2017; pp. 317–344. [Google Scholar] [CrossRef]
  40. Zhang, W.; Wang, W.G.; Zheng, J.H.; Wang, H.G.; Wang, G.; Zhang, J.S. Reconstruction of stage–discharge relationships and analysis of hydraulic geometry variations: The case study of the Pearl River Delta, China. Glob. Planet. Chang. 2015, 125, 60–70. [Google Scholar] [CrossRef]
  41. Herschy, R.W. Streamflow Measurement, 3rd ed.; CRC Press: London, UK, 2009. [Google Scholar]
  42. ISO 18320:2020; Hydrometry—Measurement of Liquid Flow in Open Channels—Determination of the Stage–Discharge Relationship. standards.iteh.ai. International Standard: Geneva, Switzerland, 2020.
  43. Kennedy, E.J. Discharge Ratings at Gaging Stations; Department of the Interior, US Geological Survey G.P.O: Washington, DC, USA, 1984. [Google Scholar]
  44. Schmidt, A.R. Analysis of Stage–Discharge Relations for Open-Channel Flows and Their Associated Uncertainties. Ph.D. Thesis, University of Illinois, Urbana-Champaign, IL, USA, 2002. [Google Scholar]
  45. WMO. Manual on Stream Gauging. Volume II—Computation of Discharge Ed.; WMO-No. 1044; World Meteorological Organization (WMO): Geneva, Switzerland, 2010; Volume II. [Google Scholar]
  46. Guerrero, J.L.; Westerberg, I.K.; Halldin, S.; Xu, C.Y.; Lundin, L.C. Temporal variability in stage–discharge relationships. J. Hydrol. 2012, 446, 90–102. [Google Scholar] [CrossRef]
  47. Alemu, M.L.; Worqlul, A.W.; Zimale, F.A.; Tilahun, S.A.; Steenhuis, T.S. Water Balance for a Tropical Lake in the Volcanic Highlands: Lake Tana, Ethiopia. Water 2020, 12, 2737. [Google Scholar] [CrossRef]
  48. Hamilton, S.; Maynard, R.; Kenney, T. Comparative Investigation of Canadian, US, and Australian Stage-Discharge Rating Curve Development. In Proceedings of the AHA 2016 Conference, Canberra 18th Australian Hydrographers Association Conference Canberra, Canberra, Australia, 24–27 November 2016. [Google Scholar]
  49. Leon, J.G.; Calmant, S.; Seyler, F.; Bonnet, M.P.; Cauhopé, M.; Frappart, F.; Filizola, N.; Fraizy, P. Rating curves and estimation of average water depth at the upper Negro River based on satellite altimeter data and modeled discharges. J. Hydrol. 2006, 328, 481–496. [Google Scholar] [CrossRef] [Green Version]
  50. Royal HaskoningDHV and Delft Hydraulics. How to Establish Stage Discharge Rating Curve; Hydrology Project; World Bank and Government of The Netherlands: New Delhi, India, 1999. [Google Scholar]
  51. Kebedew, M.G.; Tilahun, S.A.; Zimale, F.A.; Steenhuis, T.S. Bottom sediment characteristics of a tropical lake: Lake Tana, Ethiopia. Hydrology 2020, 7, 18. [Google Scholar] [CrossRef] [Green Version]
  52. Poppe, L.; Frankl, A.; Poesen, J.; Admasu, T.; Dessie, M.; Adgo, E.; Deckers, J.; Nyssen, J. Geomorphology of the Lake Tana basin, Ethiopia. J. Maps 2013, 9, 431–437. [Google Scholar] [CrossRef] [Green Version]
  53. Disaster Prevention and Food Security Program Coordination Office of the ANRS (DPFSCO). ANRS Flood Risk Assessment for Mitigation Study; DPFSCO: Bahir Dar, Ethiopia, 2014. [Google Scholar]
  54. Disaster Prevention and Food Security Program Coordination Office of the ANRS (DPFSCO). ANRS Ribb River Training Work and Socio-Economic Impact Assessment Project Study; DPFSCO: Bahir Dar, Ethiopia, 2014. [Google Scholar]
  55. Mulatu, C.A.; Crosato, A.; Moges, M.M.; Langendoen, E.J.; McClain, M. Morphodynamic trends of the Ribb River, Ethiopia, prior to dam construction. Geosciences 2018, 8, 255. [Google Scholar] [CrossRef] [Green Version]
  56. Hupp, C.R.; Schenk, E.R.; Kroes, D.E.; Willard, D.A.; Townsend, P.A.; Peet, R.K. Patterns of floodplain sediment deposition along the regulated lower Roanoke River, North Carolina: Annual, decadal, centennial scales. Geomorphology 2015, 228, 666–680. [Google Scholar] [CrossRef]
  57. Nash, J.E.; Sutcliffe, J.V. River flow forecasting through conceptual models part I—A discussion of principles. J. Hydrol. 1970, 10, 282–290. [Google Scholar] [CrossRef]
  58. Moriasi, D.N.; Arnold, J.G.; Van Liew, M.W.; Bingner, R.L.; Harmel, R.D.; Veith, T.L. Model Evaluation Guidelines for Systematic Quantification of Accuracy in Watershed Simulations. Trans. ASABE 2007, 50, 885–900. [Google Scholar] [CrossRef]
Figure 1. Lake Tana basin and the location of the Gauging stations: (a) Tana basin as part of Blue Nile (Abbay) basin; (b) Lake Tana basin and its river system of the major rivers—Gumara, Ribb, Gilgel Abbay and Megech); (c) the location of gauging stations a = Gumara at Woreta, b = Ribb at Addis Zemen, c = Gilgel Abbay at Bikolo, and d = Megech at Gondar Azezo; secondary or tertiary stations: e = Gelda at Ambessame, f = Fogeda at Arb-Gebeya, g = Ribb at Gassay, h = Upper Ribb near Ibnat, i = Kirari near Addis Zemen, j = Sheni at Addis Zemen, k = Garno at Enfranz, l = Gumero at Maksegnit, m = Angereb at Gondar; n = Dirma at Koladeba, o = Jemma at Bikolo, p = Koga at Bikolo, q = Amen at Dangila, r = Quashini near Addis Kidame, s = Killitti at Durebetie, and t = Gilgel Abbay at Chinba, and outflow gauging station: u = Abbay at Bahir Dar Peda.
Hydrology 09 00013 g001
Figure 2. Rivers at full stage: (a) Submerged gauging staff by sediment depositions at Ribb near Addis Zemen station (2019), (b) Flow measurements on Ribb at Addis Zemen using crane over the bridge during peak flows (2016).
Hydrology 09 00013 g002
Figure 3. Example of steps in finding the stage–discharge curve for infrequent stage-discharge measurements for the Megech at Azezo (1960–2021): (a) actual stage-discharge measurement, (b) fitted polynomial of the offset vs. time since 1960, and (c) stage-discharge curve with the discharge plotted against the adjusted stage h*. The adjusted stage equals the sum of the measured stage height and the offset.
Hydrology 09 00013 g003
Figure 4. Polynomial of offset vs. time in years after the start of measurements in 1960 for the Megech at Azezo (1960–2021); the grey shade is the 95% confidence interval.
Hydrology 09 00013 g004
Figure 5. Stage-discharge measurements of the long-term gauging stations in the Lake Tana basin; (a) Gumara at Woreta, (b) Ribb at Addis Zemen, and (c) Gilgel Abbay at Bikolo.
Hydrology 09 00013 g005
Figure 6. Polynomialunction fitted to relationships of offset ( h o ) versus the number of years (t) after the first observation (1960 in this case) for stage-discharge measurements of the gauging stations on the major rivers in the Lake Tana basin: (a) Gumara at Woreta (1960–2020), (b) Ribb at Addis Zemen (1960–2020) gauging stations, and on non-alluvial channel reaches such as (c) Gilgel Abbay at Bikolo (1960–2020) gauging stations. C is the discharge coefficient, and n is the exponent in Equation (1). Gray shaded area 6 indicates two times the standard error from the predicted offset.
Hydrology 09 00013 g006
Figure 7. Modified stage-discharge Q-h* relationship for gauging stations established on the alluvial channels (a) Gumara at Woreta and (b) Ribb at Addis Zemen, and (c) the non-alluvial channel Gilgel Abbay at Bikolo. h* is the adjusted stage height and is the difference between the observed stage height and the offset h o ( t ) at the time of measurement in Table 2.
Hydrology 09 00013 g007
Figure 8. Observed versus predicted flow relationships established after adjusting the stage-discharge curves for gauging stations: (a) Gumara at Woreta and (b) Ribb at Addis Zemen, (c) Gilgel Abbay at Bikolo, and (d) Megech at Azezo.
Hydrology 09 00013 g008
Table 1. Hydrologic observation stations and their flow control in the Lake Tana basin based on field surveys from 2016 to 2021 and literature review [19,31,32]).
Gauging Station
(See Figure 1)
WatershedPeriod and Number of ObservationsFlow Control Conditions
aGumara at WoretaGumara1960–2021149Unstable control, high flow measurements conducted on the bridge
bRibb at Addis ZemenRibb1960–2021128Unstable control, high sediment (sand) deposition, small gradient
cGilgel Abbay at BikoloGilgel Abbay1960–202030Rocky and stable control, the oldest and a basic hydrometric station
dMegech at AzezoMegech1960–202197Unstable shiftable bed (pebbles and small boulders) pool with no flow control
eGelda at AmbessameGumara1983–202133Scouring and deposition
fFogeda at Arb-GebeyaGumara1985–202127Shiftable mountainous and pool in the left (concave) side of the stream
gRibb at GassayRibb1984–202020Shiftable, scouring on the channel bed
hUpper Ribb nr IbnatRibb1980–202033Pool and mountainous gorge installed to gather data for the Ribb reservoir site
iKirari near Addis ZemenRibb2017–202021Shiftable, fill and scouring, mainly dictated by aggradation from the bed material
jSheni at Addis ZemenRibb1990–202037Station location changed, sand deposition
kGarno at EnfranzArno-Garno1987–202139Shiftable, boulders, and cobbles at a mountainous stream
lGumero at MaksegnitGumero1984–202036Pool, river bed with gravels and cobbles
mAngereb at GondarMegech1982–202182Shiftable reach, mountainous with boulders and cobbles
nDirma at KoladebaDirma2000–202139Stable channel control (small depositions), but affected by bridge construction
oJemma nr BikoloGilgel Abbay2018–202116Stable, depositions as rock, cobbles, and gravel fill
pKoga at BikoloGilgel Abbay1990–201958Permanent, natural control and in-stream vegetation (upstream of the bridge)
qAmen at DangilaGilgel Abbay1988–2016134Scouring with small vegetations on the banks
rQuashini nr Addis KidameGilgel Abbay1984–201620Small scouring of the channel bed and grassed banks
sKillitti at DurebetieGilgel Abbay2007–202127Pool, erosion and deposition
tGilgel Abbay at ChinbaGilgel Abbay2014–202165Depositions and silt channel bed
uAbbay at Bahir Dar PedaLake Tana1983–201535Permanent, straight reach, vegetated stable banks, gentle slope, good condition
Table 2. Stage-discharge rating curves, the effective offset h o (m) as a function of the time t in yeara after the first year of observation for the gauging stations in the Lake Tana basin. The gauging station locations are given in Figure 1. Q (m3·s−1) is the discharge, R2 = the linear regression coefficient, and RMSE = Root mean square error m3·s−1. The last column indicates the extent to which the offset is dependent on the time since the beginning of the observations.
Gauging StationStage-Discharge Eq1st yrR2RMSE Offset ,   h 0 R2
aGumara at Woreta Q = 9.09 ( h h 0 ) 1.92 19600.9810.3 h 0 = 4.80 × 10 5   t 3 + 5.34 × 10 3   t 2 0.1330 t + 0.6730 0.92
bRibb at Addis Zemen Q = 5.17 ( h h 0 ) 2.14   19600.968.26 h 0 = 8.26 × 10 5   t 3 + 7.14 × 10 3   t 2 0.0886 t + 1.0493 0.95
cGilgel Abbay at Bikolo Q = 39.89   ( h h 0 ) 2.03 19600.998.74 h 0 = 8.95 × 10 6   t 3 6.27 × 10 4   t 2 + 0.0101 t   + 0.2370     0.89
dMegech at G. Azezo Q = 29.48   ( h h 0 ) 2.49 19600.962.75 h 0 = 1.00 × 10 6   t 4 + 7.80 × 10 5 t 3 3.64 × 10 3   t 2 + 0.1026 t 0.6261 0.96
eGelda at Ambessame Q = 17.60 ( h h 0 ) 2.50 19830.960.27 h o = 1.19 × 10 4   t 3 + 6.27 × 10 3   t 2 0.0697 t + 0.1520 0.65
fFogeda at Arb G. Q = 13.77 ( h h 0 ) 2.86   19850.960.63 h o = 4.18 × 10 4   t 2 + 0.0086 t + 0.2280 0.76
gRibb at Gassay Q = 5.0 ( h h 0 ) 2.4   19840.853.74 h o = 1.11 × 10 4   t 3 + 5.74 × 10 3   t 2 0.0613 t + 0.1460 0.89
hUpper Ribb nr Ibnat Q = 34.60 ( h h 0 ) 3.0   19800.965.66 h o = 8.13 × 10 7   t 3 + 4.07 × 10 4   t 2 0.0079 t + 1.0300 0.84
iKirari nr Addis Z Q = 42.71 ( h h 0 ) 2.44   20170.770.31 h o = 3.66 × 10 2   t 2 + 0.1820 t + 1.46 0.59
jSheni nr Addis Z. Q = 20 ( h h 0 ) 2.20   19900.763.37 h o = 0.0415 t 0.2005 0.94
kGarno at Enfranz Q = 17.3 ( h h 0 ) 2.00 19870.465.30 h o = 2.03 × 10 5   t   4 8.69 × 10 4   t 3 + 5.80 × 10 3   t 2 + 0.0601 t 0.1330   0.86
lGumero at Maksegnit Q = 35.15 ( h h 0 ) 2.50   19840.950.58 h o = 6.92 × 10 6   t 4 + 5.17 × 10 4   t 3 1.12 × 10 2   t 2 + 0.0580 t + 0.5930 0.93
mAngereb at Gondar Q = 58.86 ( h h 0 ) 3.50   19820.930.88 h o = 4.92 × 10 5   t 3 + 2.47 × 10 3   t 2 0.0188 t + 0.2430 0.96
nDirma at Koladeba Q = 13.97 ( h h 0 ) 2.04 20000.934.73 h o = 5.91 × 10 4   t 2 0.0077 t + 0.3980 0.30
oJemma nr Bikolo Q = 26.40 ( h h 0 ) 2.60   20180.992.42 h o = 5.79 × 10 2   t 3 + 3.30 × 10 1   t 2 0.5330 t + 0.4240   0.74
pKoga at Bikolo Q = 35.96 ( h h 0 ) 1.40   19900.991.09 h o = 5.02 × 10 4 t 2 + 0.0111 t + 0.4360 0.60
qAmen at Dangila Q = 1.83 ( h h 0 ) 2.48   19880.910.13 h o = 8.70 × 10 5   t 3 2.75 × 10 3   t 2 + 0.0137 t + 0.1810 0.67
rQuashini nr Addis Kidame Q = 1.91 ( h h 0 ) 1.50   19840.930.08 h o = 1.44 × 10 5   t 3 1.08 × 10 3   t 2 + 0.0241 t + 0.2620 0.46
sKillitti nr Durebetie Q = 15.80 ( h h 0 ) 2.90   20070.964.19 h o = 0.0010 t + 1.1500 0.55
tGilgel Abbay at Chinba Q = 7.30 ( h h 0 ) 2.30   20140.9427.40 h o = 9.50 × 10 3   t 2 + 8.97 × 10 2   t 0.1270   0.36
uAbbay at Peda Q = 121.0 ( h h 0 ) 2.26   19830.9917.90 h o = 3.19 × 10 5   t 3 1.80 × 10 3   t 2 + 0.0247 t + 0.8770 0.22
Publisher’s Note: MDPI stays neutral with regard to jurisdictional claims in published maps and institutional affiliations.

