
Coastal Erosion Caused by River Mouth Migration on a Cuspate Delta: An Example from Thanh Hoa, Vietnam

 ,
,  and
and 
Abstract
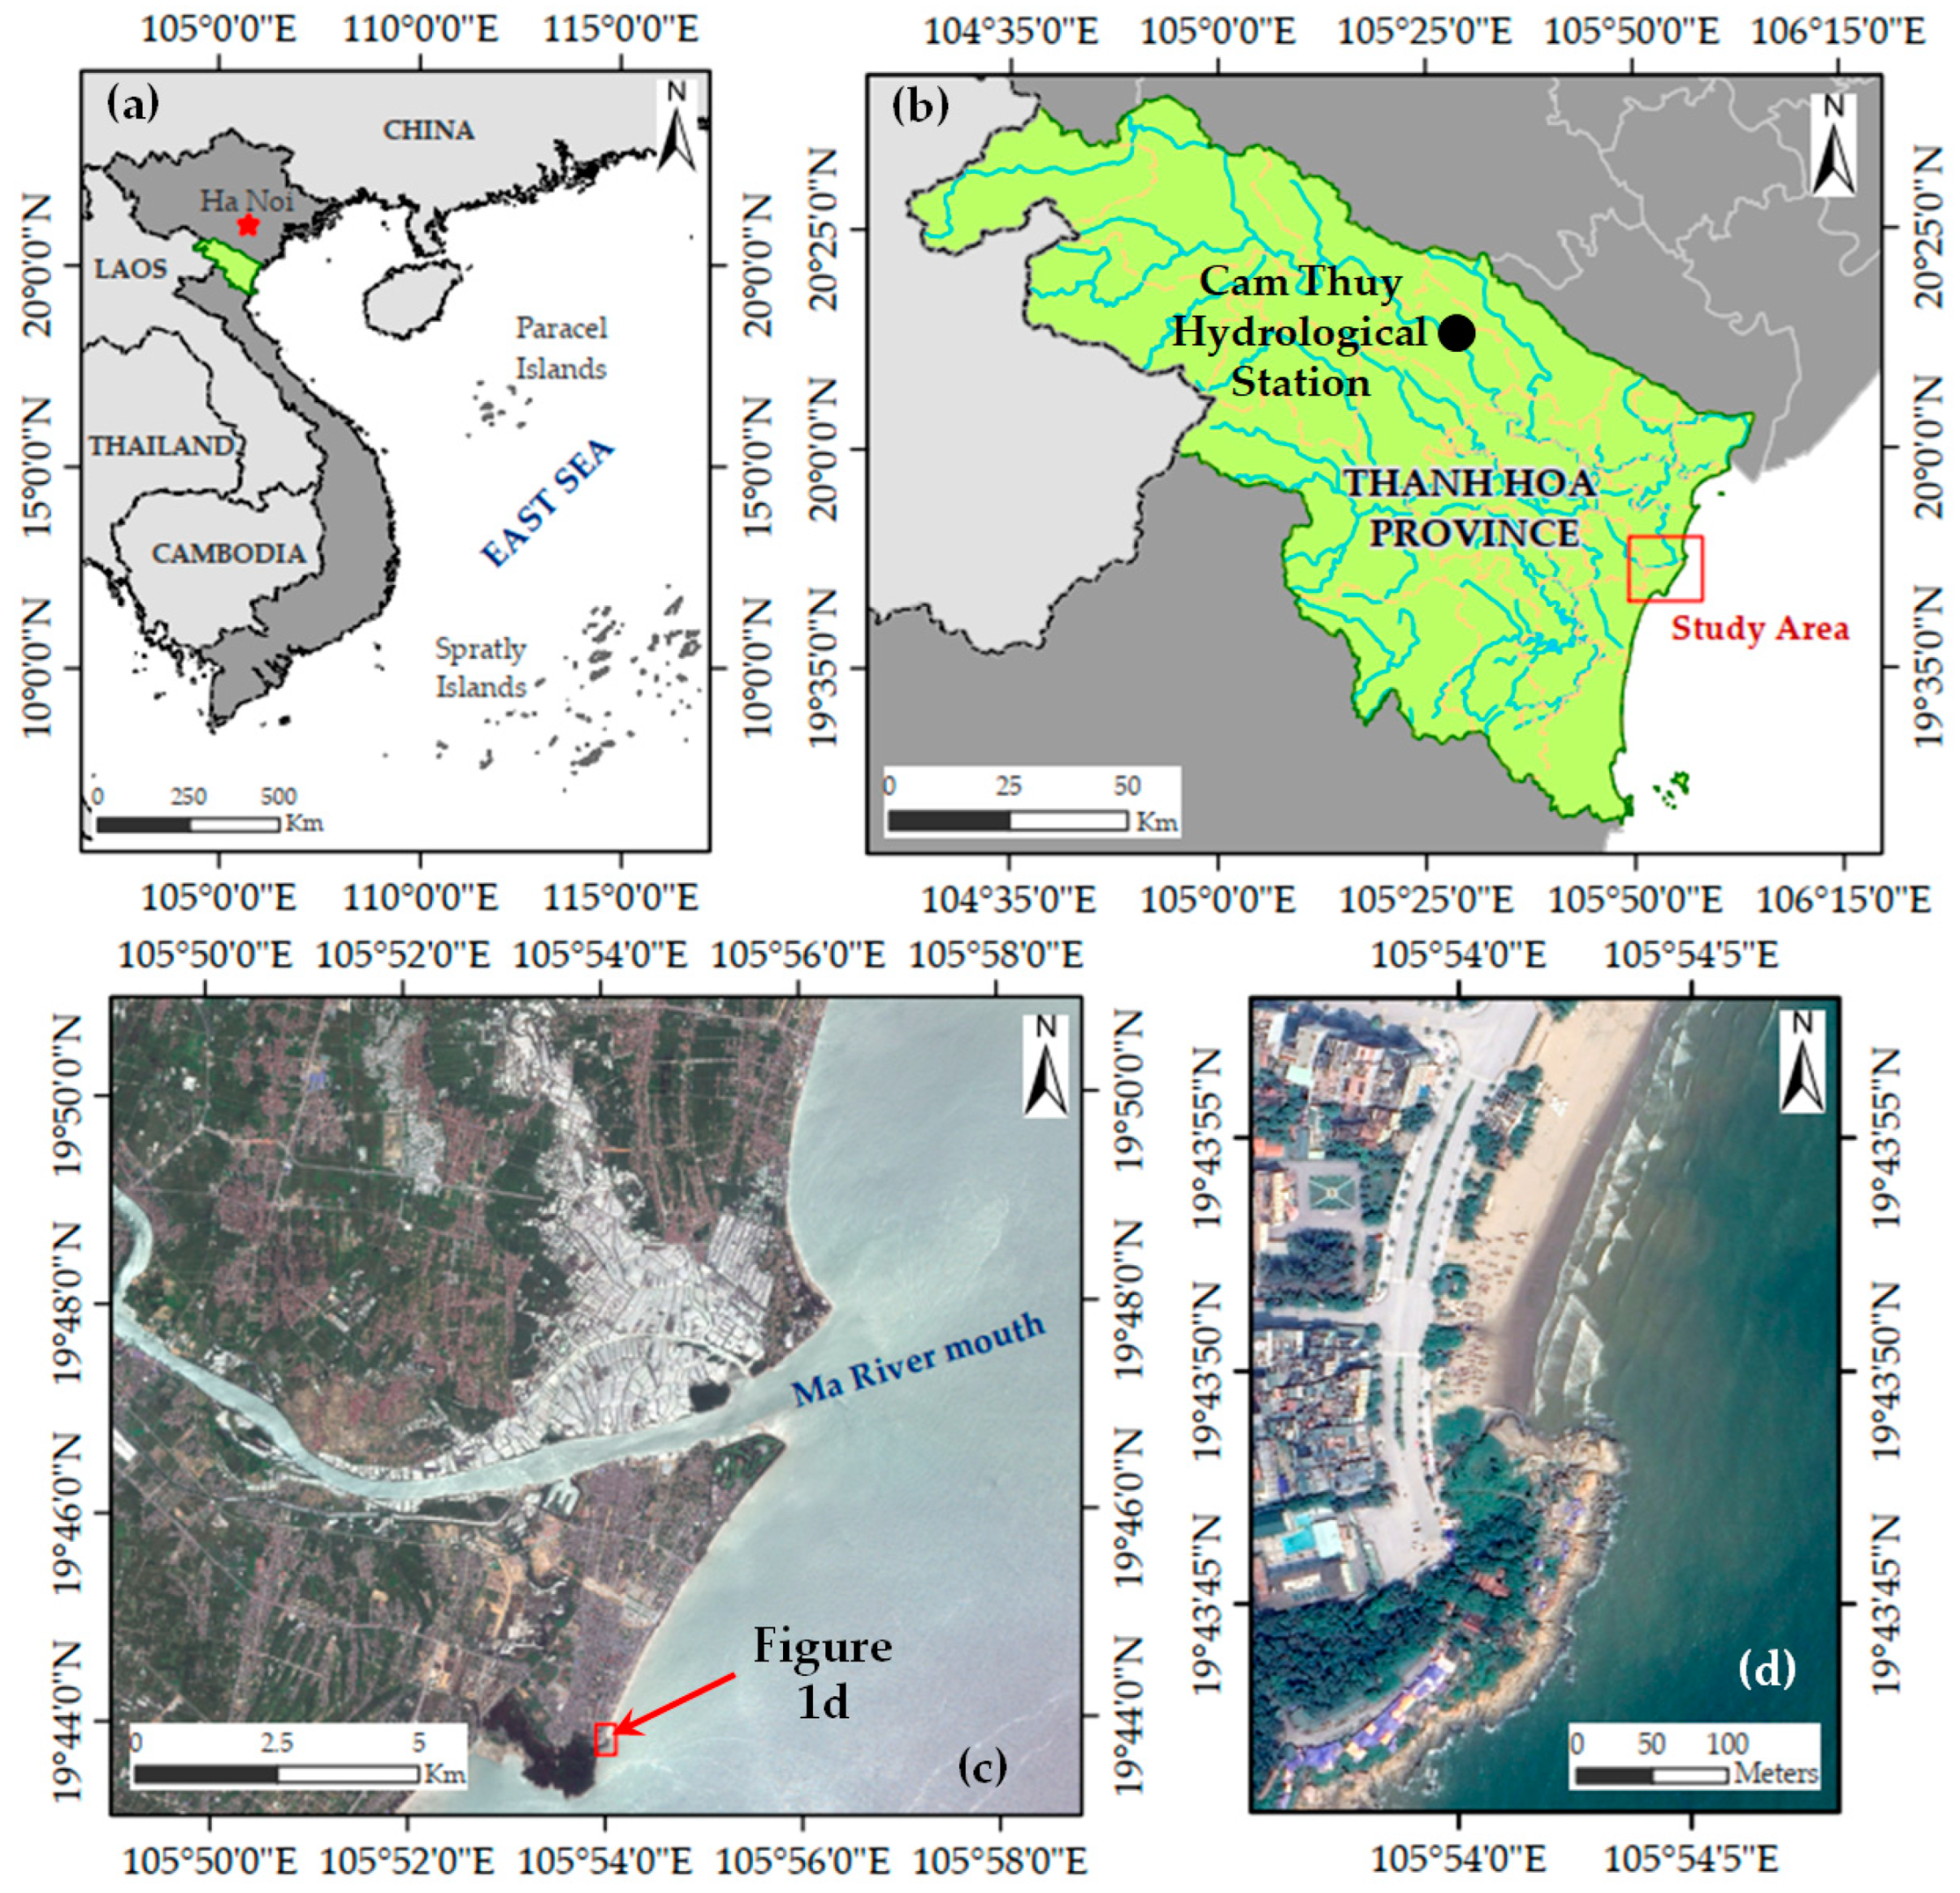
:1. Introduction
2. Materials and Methods
2.1. Landsat Image Analysis
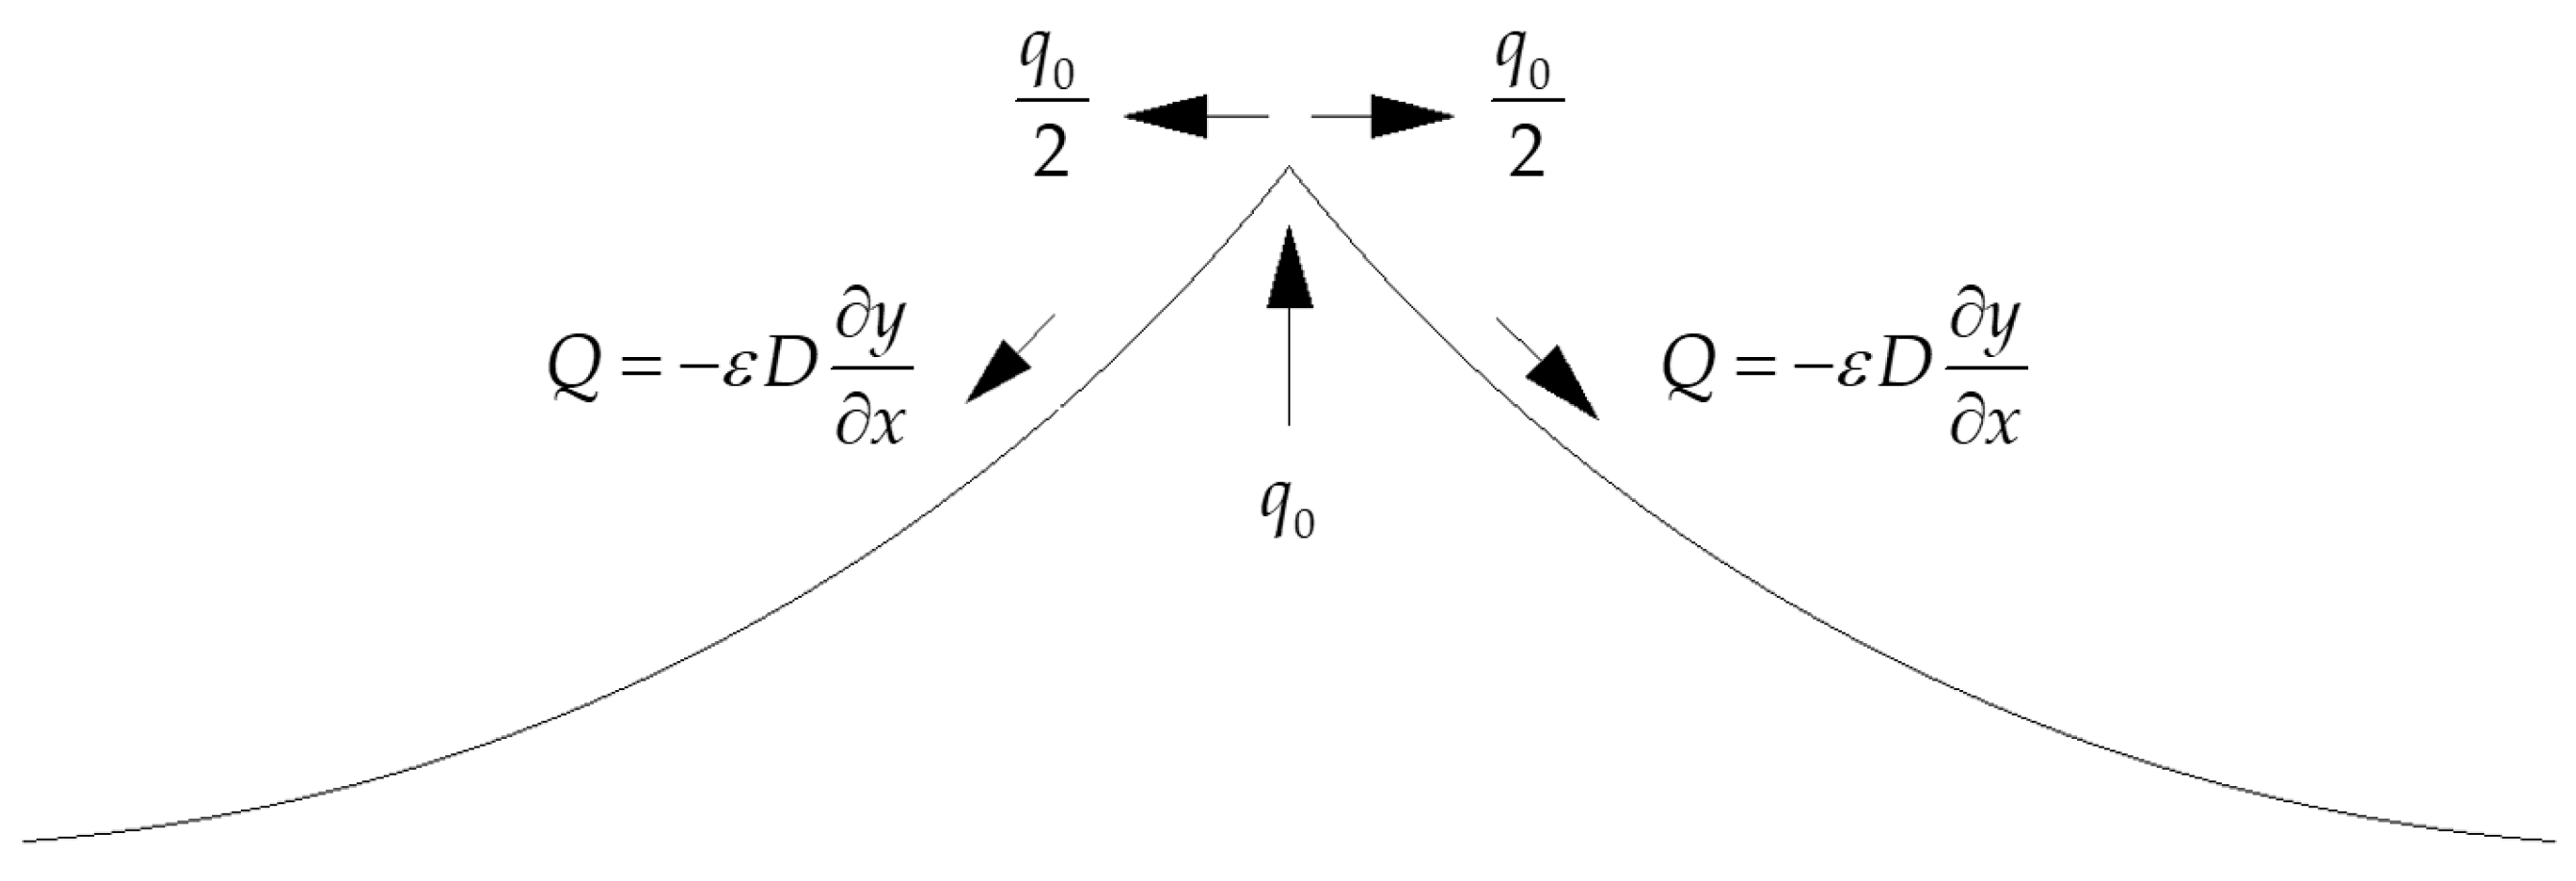
2.2. Application of Analytical Solutions for Shoreline Changes
2.3. Geometrical Characteristics of the Cuspate Delta
2.3.1. Evolution of the Cuspate Delta
2.3.2. Shoreline Orientations at the River Mouth
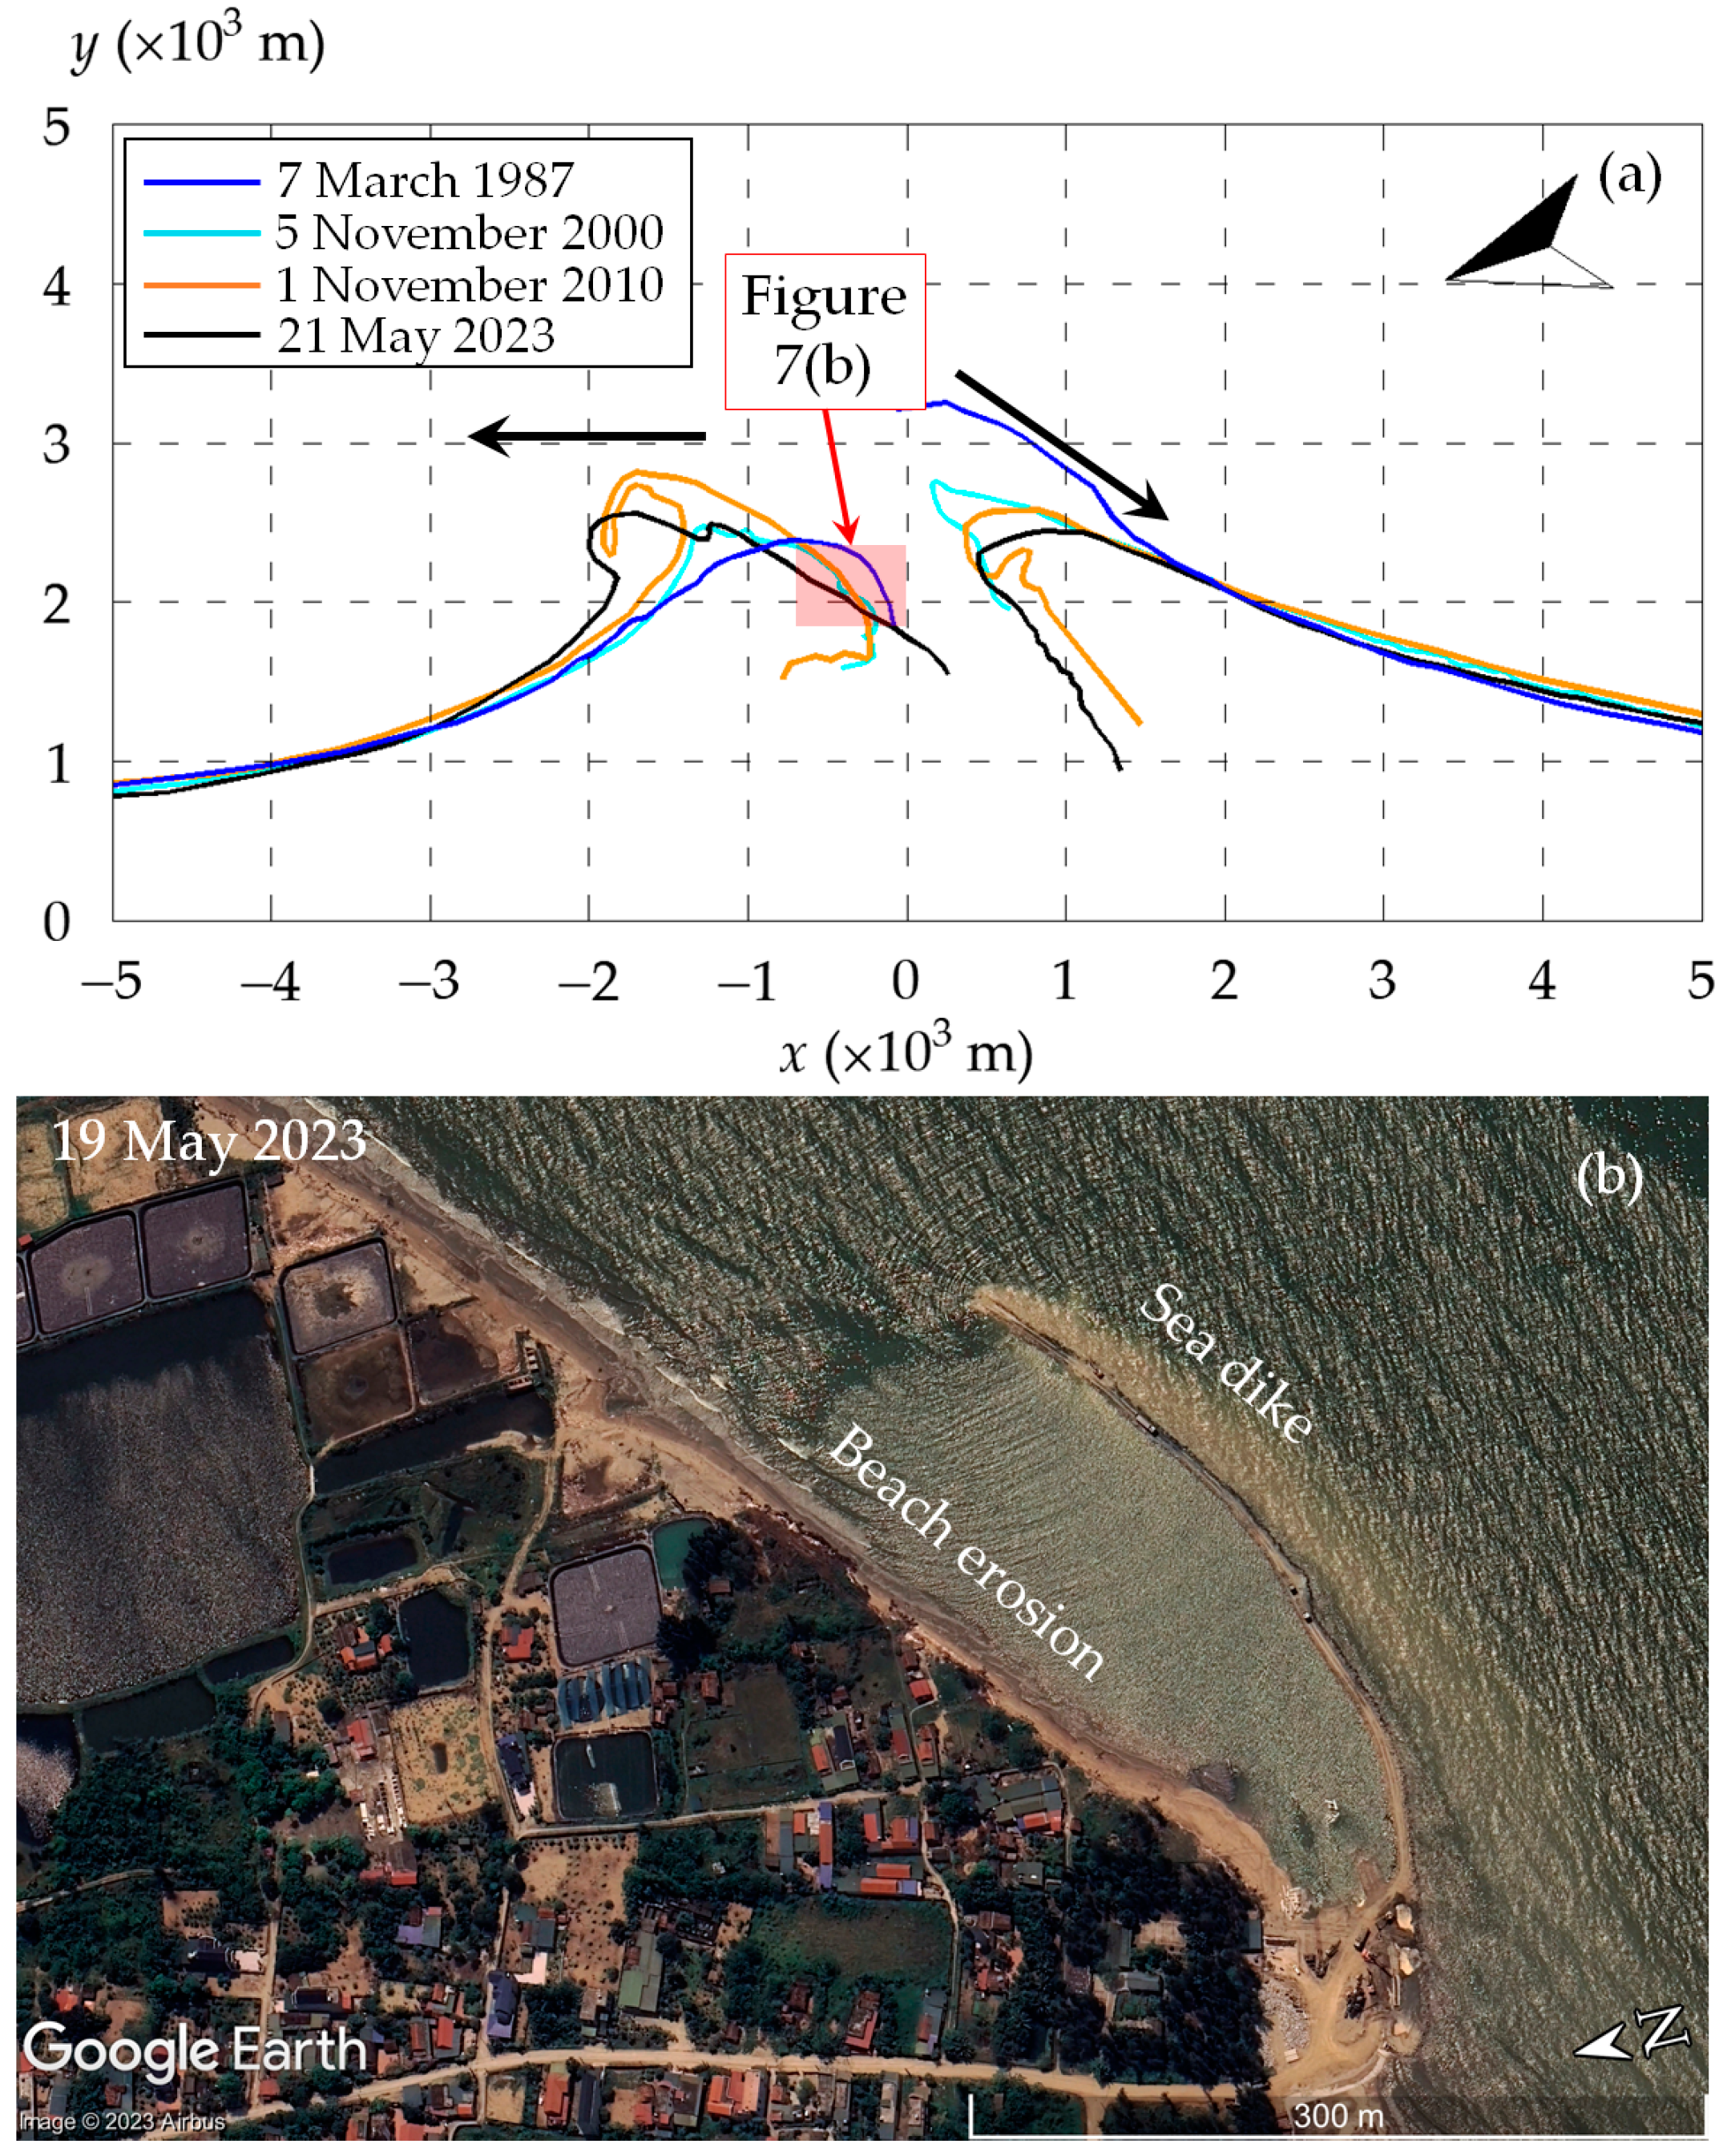
3. Results
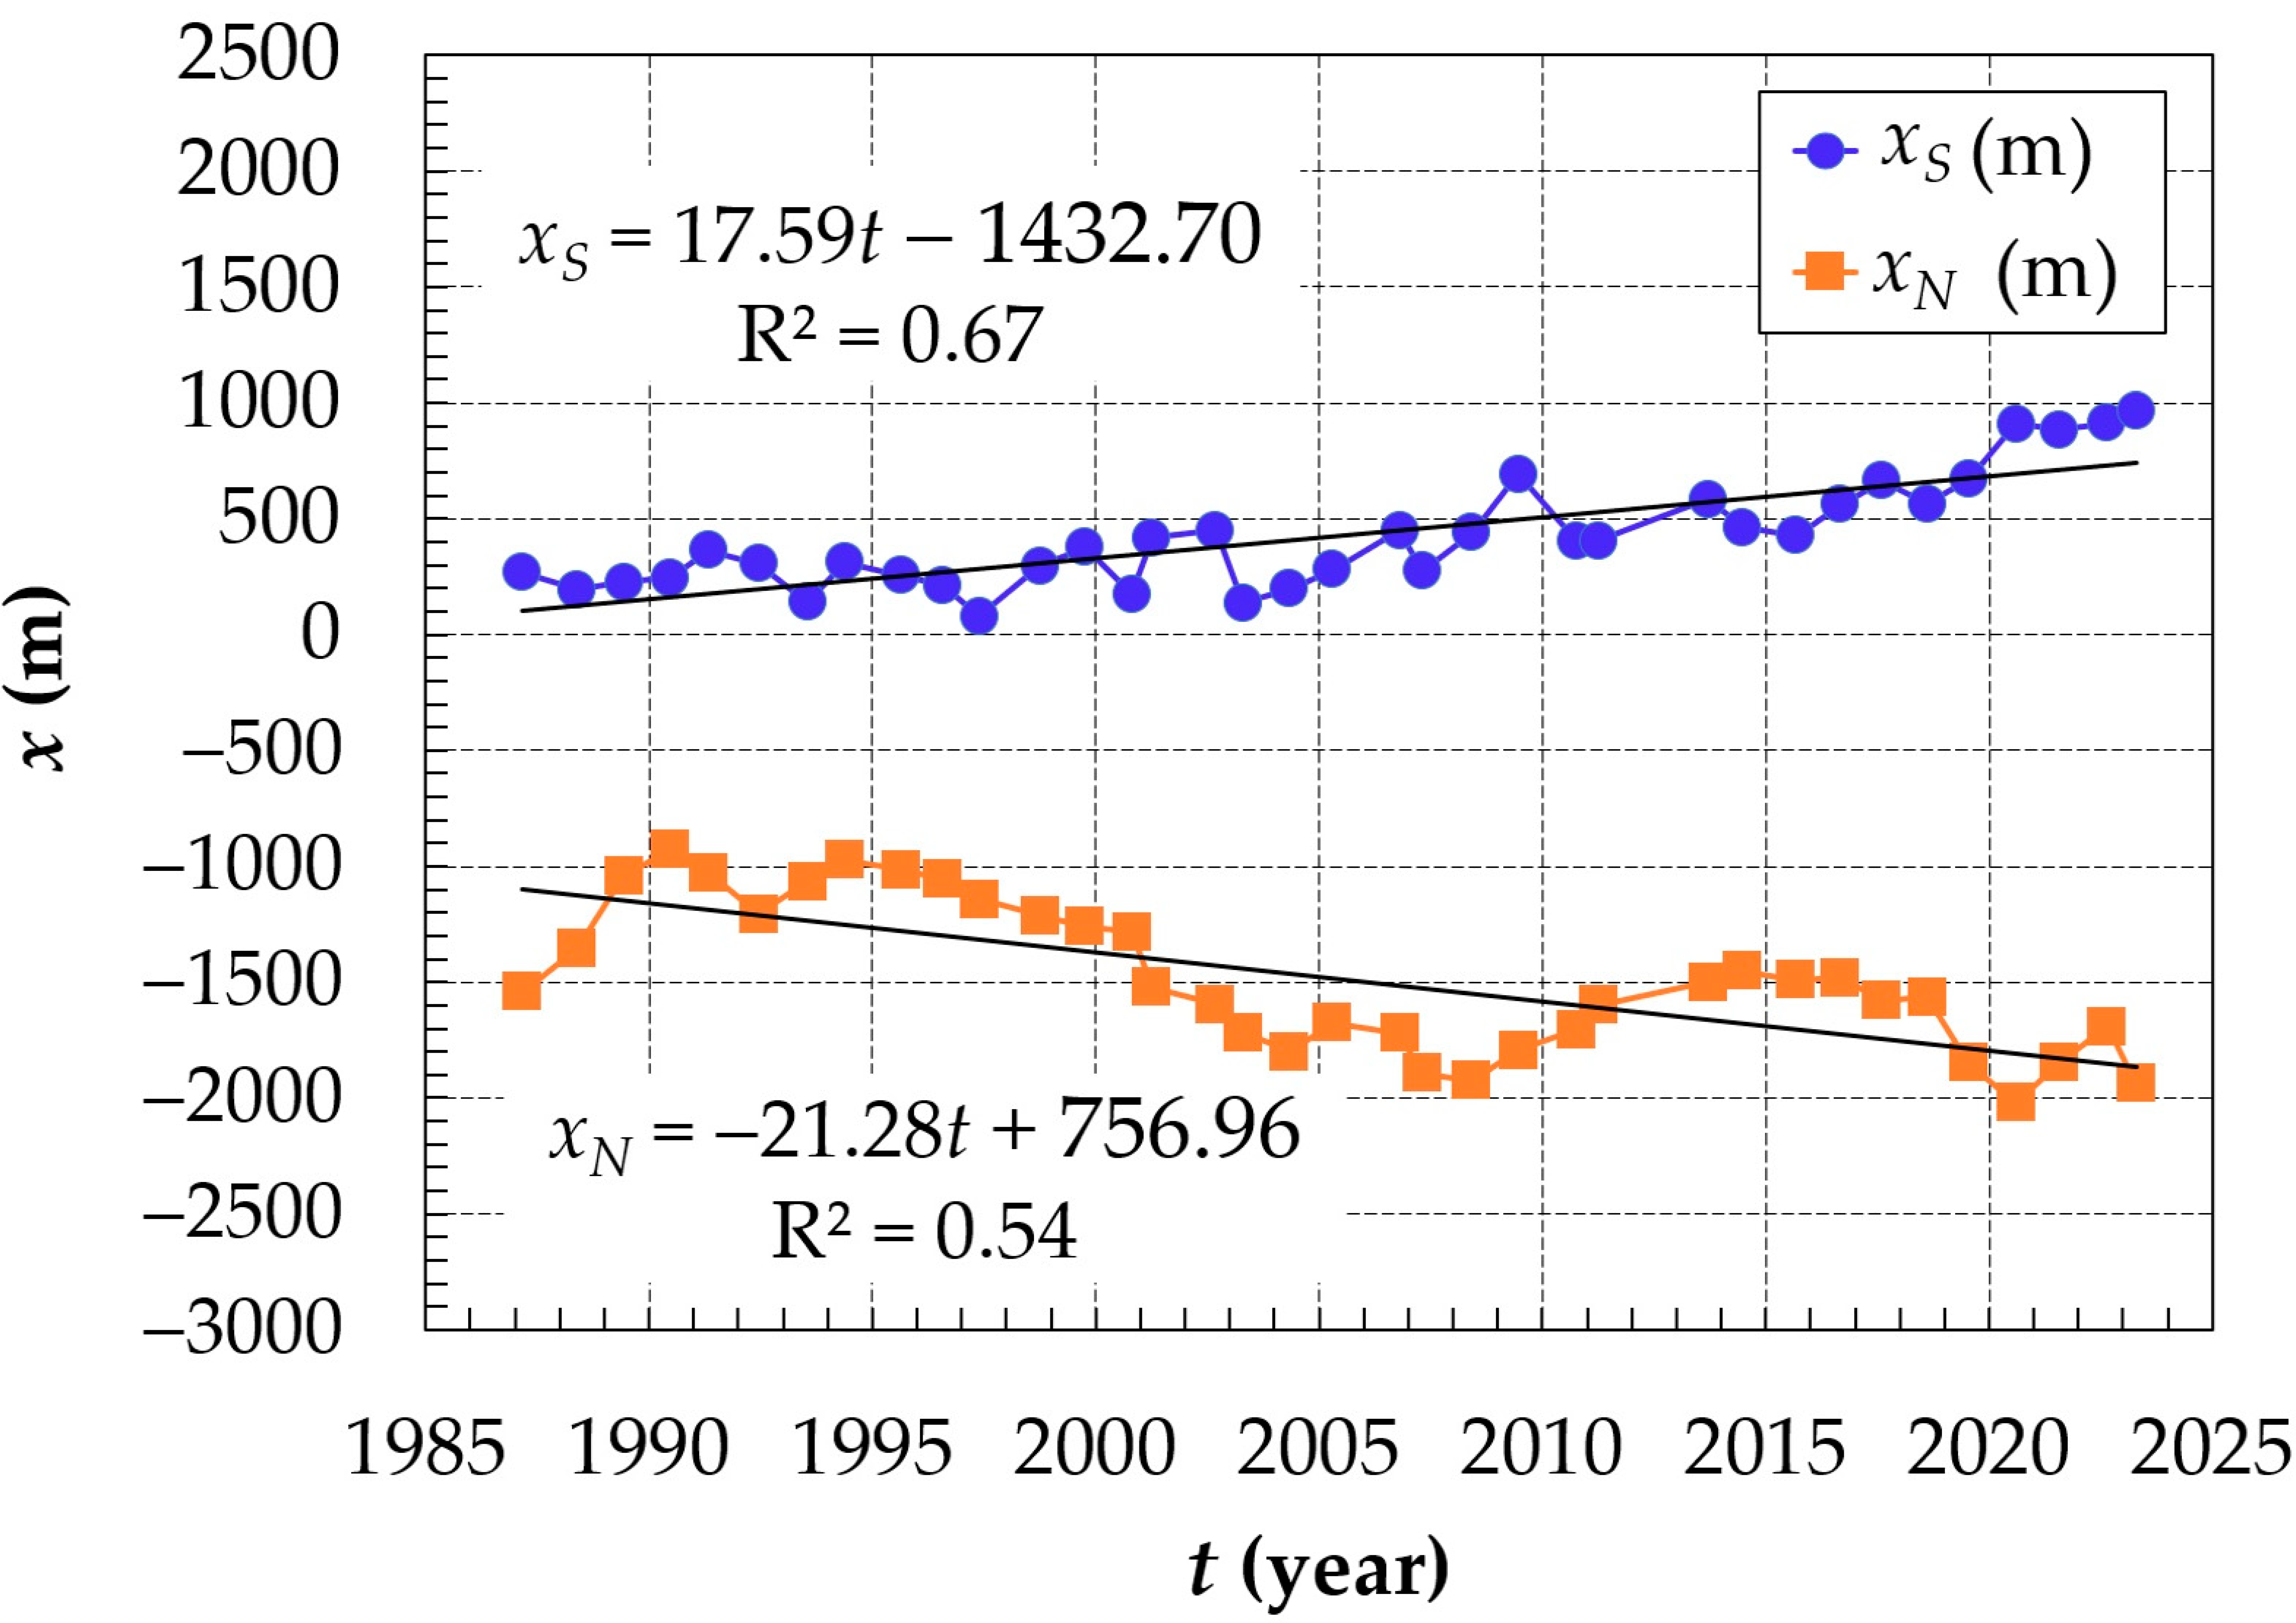
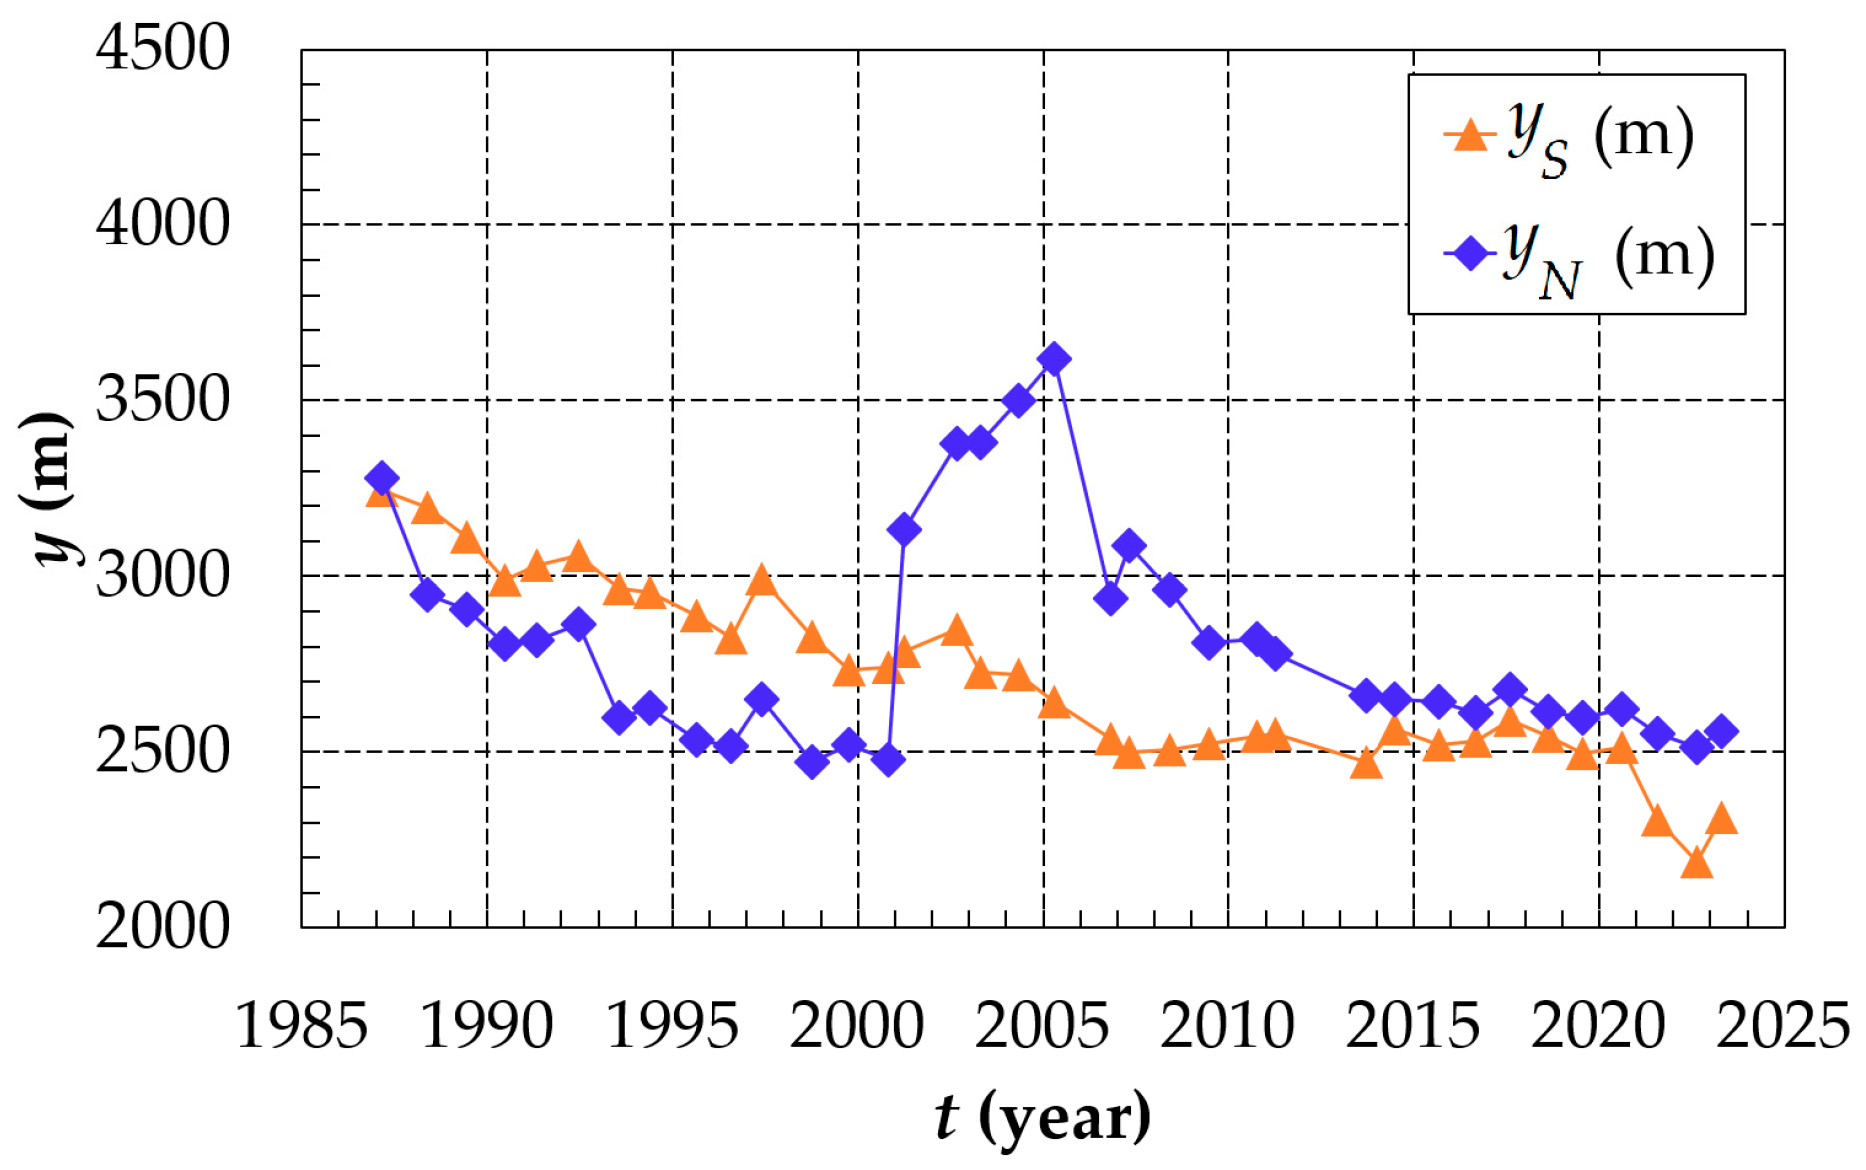
3.1. Temporal Variations in Shorelines at the River Mouth
3.2. Diffusion Coefficient for Sand Transport Induced by Breaking Waves
3.3. Geometrical Characteristics of the Cuspate Delta
3.3.1. Evolution of the Cuspate Delta
3.3.2. Shoreline Orientations at the River Mouth
4. Discussion
- -
- Sand supply from the Ma River:
- -
- Sand transported to the north:
- -
- Sand transported to the south:
5. Conclusions
- -
- The northern part of the Ma River delta has experienced northward movement, leading to severe coastal erosion at the mouth of the river.
- -
- In contrast, the southern part of the Ma River Delta has been moving southward and landward.
- -
- The sand diffusion coefficient at the Ma River delta was calculated to be 90 m2/day, indicating the rate at which sand particles are transported.
- -
- The present investigation provides an evaluation of the supply of sand originating from the Ma River to the delta’s lobes. According to the analytical solution, the estimated annual sand supply amounts to approximately 350,000 m3/year. Additionally, an alternative approach based on the shoreline orientations at the mouth of the river yields a slightly higher value of approximately 380,000 m3/year. This discrepancy underscores the reliability of the sand supply assessment derived through the methodologies utilized.
- -
- The research also highlights the asymmetric configuration of the shapes of the shoreline at the mouth of the Ma River, as seen in the uneven distribution of sediment to the delta flanks in which the ratio of sand supplied to the north ranges from 55% to 75%.
Author Contributions
Funding
Data Availability Statement
Conflicts of Interest
References
- Wright, L.D.; Coleman, J.M. Variations in Morphology of Major River Deltas as Functions of Ocean Wave and River Discharge Regimes. AAPG Bull. 1973, 57, 370–398. [Google Scholar] [CrossRef]
- Komar, P.D. Computer models of delta growth due to sediment input from rivers and longshore transport. Geol. Soc. Am. Bull. 1973, 84, 2217–2226. [Google Scholar] [CrossRef]
- Galloway, W.E. Process Framework for Describing the Morphologic and Stratigraphic Evolution of Deltaic Depositional Systems; Datapages, Inc.: Tulsa, OK, USA, 1975. [Google Scholar]
- Pranzini, E. A model for cuspate delta erosion. In Waterfront Planning and Development; ASCE: Reston, VA, USA, 1989; pp. 4345–4357. [Google Scholar]
- Refaat, H.E.-d.A.A. The Formation and Reduction Processes of River Deltas and Their Control. Ph.D. Thesis, Kyoto University, Kyoto, Japan, 1990. [Google Scholar]
- Mikhailova, M. Sediment balance in nontidal river mouths and method of calculation of protruding delta formation. Water Resour (Vodn. Resur.) 1995, 5, 502–510. [Google Scholar]
- Pranzini, E. Updrift river mouth migration on cuspate deltas: Two examples from the coast of Tuscany (Italy). Geomorphology 2001, 38, 125–132. [Google Scholar] [CrossRef]
- Bhattacharya, J.P.; Giosan, L. Wave-influenced deltas: Geomorphological implications for facies reconstruction. Sedimentology 2003, 50, 187–210. [Google Scholar] [CrossRef]
- Mikhailova, M. Quantitative assessment of the role of deltas in the processes of deposition of river sediments. Water Resour. 2007, 34, 644–656. [Google Scholar] [CrossRef]
- Seybold, H.; Andrade, J.S., Jr.; Herrmann, H.J. Modeling river delta formation. Proc. Natl. Acad. Sci. USA 2007, 104, 16804–16809. [Google Scholar] [CrossRef]
- Nienhuis, J.H. Plan-View Evolution of Wave-Dominated Deltas. Ph.D. Thesis, Massachusetts Institute of Technology, Cambridge, MA, USA, 2016. [Google Scholar]
- Quan, N.C.; Hung, P.V. Characteristics of dynamic geomorphology of coastal-river mouth zones of Ma river, Thanh Hoa province. Vietnam J. Earth Sci. 2016, 38, 59–65. [Google Scholar]
- Besset, M.; Anthony, E.J.; Sabatier, F. River delta shoreline reworking and erosion in the Mediterranean and Black Seas: The potential roles of fluvial sediment starvation and other factors. Elem. Sci. Anthr. 2017, 5, 54. [Google Scholar] [CrossRef]
- Tuan, N.Q.; Tin, H.C.; Quang, L.; Tuan, T.A. Historical Monitoring of Shoreline Changes in the Cua Dai Estuary, Central Vietnam Using Multi-Temporal Remote Sensing Data. Geosciences 2017, 7, 72. [Google Scholar] [CrossRef]
- Anthony, E.J.; Besset, M.; Zainescu, F.; Sabatier, F. Multi-Decadal Deltaic Land-Surface Changes: Gauging the Vulnerability of a Selection of Mediterranean and Black Sea River Deltas. J. Mar. Sci. Eng. 2021, 9, 512. [Google Scholar] [CrossRef]
- Quang, D.N.; Ngan, V.H.; Tam, H.S.; Viet, N.T.; Tinh, N.X.; Tanaka, H. Long-Term Shoreline Evolution Using DSAS Technique: A Case Study of Quang Nam Province, Vietnam. J. Mar. Sci. Eng. 2021, 9, 1124. [Google Scholar] [CrossRef]
- Broaddus, C.M.; Vulis, L.M.; Nienhuis, J.H.; Tejedor, A.; Brown, J.; Foufoula-Georgiou, E.; Edmonds, D.A. First-Order River Delta Morphology Is Explained by the Sediment Flux Balance from Rivers, Waves, and Tides. Geophys. Res. Lett. 2022, 49, e2022GL100355. [Google Scholar] [CrossRef]
- Duy, D.V.; Tanaka, H.; Larson, M.; Viet, N.T. A Theory for Estuarine Delta Formation with Finite Beach Length under Sediment Supplied from the River. J. Mar. Sci. Eng. 2022, 10, 947. [Google Scholar] [CrossRef]
- Lappe, R.; Ullmann, T.; Bachofer, F. State of the Vietnamese Coast—Assessing Three Decades (1986 to 2021) of Coastline Dynamics Using the Landsat Archive. Remote Sens. 2022, 14, 2476. [Google Scholar]
- Ghiasian, M.; Carrick, J.; Rhode-Barbarigos, L.; Haus, B.; Baker, A.C.; Lirman, D. Dissipation of wave energy by a hybrid artificial reef in a wave simulator: Implications for coastal resilience and shoreline protection. Limnol. Oceanogr. Methods 2021, 19, 1–7. [Google Scholar] [CrossRef]
- Duc, D.M.; Nhuan, M.T.; Ngoi, C.V. An analysis of coastal erosion in the tropical rapid accretion delta of the Red River, Vietnam. J. Asian Earth Sci. 2012, 43, 98–109. [Google Scholar] [CrossRef]
- Anthony, E.J.; Brunier, G.; Besset, M.; Goichot, M.; Dussouillez, P.; Nguyen, V.L. Linking rapid erosion of the Mekong River delta to human activities. Sci. Rep. 2015, 5, 14745. [Google Scholar] [CrossRef] [PubMed]
- Tanaka, H.; Viet, N.T.; Hoang, V.C.; Duy, D.V. Erosion mechanism of Cua Dai Beach, Central Vietnam. J. Jpn. Soc. Civ. Eng. Ser. B3 (Ocean Eng.) 2015, 71, I_449–I_454. [Google Scholar] [CrossRef]
- Fan, D.; Nguyen, D.V.; Su, J.; Bui, V.V.; Tran, D.L. Coastal morphological changes in the Red River Delta under increasing natural and anthropic stresses. Anthr. Coasts 2019, 2, 51–71. [Google Scholar] [CrossRef]
- Nguyen, M.Q.; Vu, V.H.; Mai, T.T.; To, X.B.; Tran, N.D.; Dang, M.T.; Dang, X.T.; Nguyen, T.M.; Hoang, V.T.; Giap, T.K.C. Geomorphological sedimentary characteristics in the coastal area of Ma river delta, Thanh Hoa province. Vietnam J. Mar. Sci. Technol. 2021, 21, 283–298. [Google Scholar] [CrossRef]
- Do, A.T.K.; Kralli, V.E.; De Vries, S.; Nguyen, V.T.; Stive, M.J.F. Morphodynamics of a Seasonal Inlet: A Case Study Using Remote Sensing and Numerical Modelling for Cua Dai Inlet, Central Vietnam. In Proceedings of the APAC 2019, Singapore, 20–22 June 2019; Springer: Singapore, 2020; pp. 417–425. [Google Scholar]
- Duc Anh, N.Q.; Tanaka, H.; Tam, H.S.; Tinh, N.X.; Tung, T.T.; Viet, N.T. Comprehensive Study of the Sand Spit Evolution at Tidal Inlets in the Central Coast of Vietnam. J. Mar. Sci. Eng. 2020, 8, 722. [Google Scholar] [CrossRef]
- Nguyen, N.-M.; Van, D.D.; Le, D.T.; Cong, S.D.; Pham, N.T.; Nguyen, Q.; Tran, B.; Wright, D.P.; Tanim, A.H.; Anh, D.T. Wave reduction efficiency for three classes of breakwaters on the coastal Mekong Delta. Appl. Ocean Res. 2022, 129, 103362. [Google Scholar] [CrossRef]
- Zemann, M.; van der Linden, R.; Trinh Cong, D.; Vu, D.H.T.; Nguyen, N.M.; Seidel, F.; Oberle, P.; Nestmann, F.; Fink, A.H. Modelling ocean wave conditions at a shallow coast under scarce data availability—A case study at the western coast of the Mekong Delta, Vietnam. EGUsphere 2023, 2023, 1–22. [Google Scholar] [CrossRef]
- Tanaka, H.; Hoang, V.C.; Viet, N.T. Investigation of morphological change at the Cua Dai river mouth through satellite image analysis. Coast. Eng. Proc. 2016, 1, sediment.9. [Google Scholar] [CrossRef]
- Hein, C.J.; Fallon, A.R.; Rosen, P.; Hoagland, P.; Georgiou, I.Y.; FitzGerald, D.M.; Morris, M.; Baker, S.; Marino, G.B.; Fitzsimons, G. Shoreline dynamics along a developed river mouth barrier island: Multi-decadal cycles of erosion and event-driven mitigation. Front. Earth Sci. 2019, 7, 103. [Google Scholar] [CrossRef]
- Lawson, S.K.; Tanaka, H.; Udo, K.; Hiep, N.T.; Tinh, N.X. Morphodynamics and Evolution of Estuarine Sandspits along the Bight of Benin Coast, West Africa. Water 2021, 13, 2977. [Google Scholar] [CrossRef]
- Carvalho, B.C.; Gomes, C.L.d.S.; Guerra, J.V. Spatio-temporal morphological variability of a tropical barrier island derived from the Landsat collection. Front. Remote Sens. 2023, 4, 1111696. [Google Scholar] [CrossRef]
- Duy, D.V.; Ty, T.V.; Thanh, T.N.; Minh, H.V.T.; De, C.V.; Duong, V.H.T.; Dan, T.C.; Viet, N.T.; Tanaka, H. Sand Spit Morphology at an Inlet on Phu Quoc Island, Vietnam. Water 2023, 15, 1941. [Google Scholar] [CrossRef]
- McFeeters, S.K. The use of the Normalized Difference Water Index (NDWI) in the delineation of open water features. Int. J. Remote Sens. 1996, 17, 1425–1432. [Google Scholar] [CrossRef]
- Larson, M.; Hanson, H.; Kraus, N.C. Analytical Solutions of the One-Line Model of Shoreline Change; Coastal Engineering Research Center: Vicksburg, MS, USA, 1987. [Google Scholar]
- World Bank. Vietnam—Trung Son Hydropower Project: Environmental Assessment (Vol. 7): Supplementary Environmental and Social Impact Assessment (English); World Bank Group: Washington, DC, USA, 2009. [Google Scholar]
- Rosati, J.D.; Walton, T.; Bodge, K. Longshore Sediment Transport. In Coastal Engineering Manual; U.S. Army Corps of Engineers: Washington, DC, USA, 2002; p. 119. [Google Scholar]
- Yen, H.P.H.; Nhan, T.T.T.; Nghi, T.; Toan, N.Q.; Khien, H.A.; Lam, D.D.; Van Long, H.; Thanh, D.X.; Hung, N.T.; Trang, N.T.H.; et al. Late Pleistocene-Holocene sedimentary evolution in the coastal zone of the Red River Delta. Heliyon 2021, 7, e05872. [Google Scholar] [CrossRef] [PubMed]
- Hallermeier, R.J. Uses for a calculated limit depth to beach erosion. In Coastal Engineering 1978; Amer Society of Civil Engineers: Reston, VA, USA, 1978; pp. 1493–1512. [Google Scholar]
- Thompson, E.F.; Harris, D.L. A Wave CI imatology for US Coastal Waters. In Proceedings of the Offshore Technology Conference, Houston, TX, USA, 1–3 May 1972; OnePetro: Richardson, TX, USA, 1972. [Google Scholar]
- Thanh, H.N.; Cuong, V.D.; Tajima, Y.; Cuong, T.V. Numerical modeling of Hydrodynamics and sediment transport processes in Ma rivier estuary, Vietnam. In Proceedings of the 19th IAHR-APD Congress, Hanoi, Vietnam, 21–24 September 2014. [Google Scholar]
- Uda, T. Japan’s Beach Erosion: Reality and Future Measures; World Scientific: Singapore, 2010. [Google Scholar]
- Duy, D.V.; Tanaka, H.; Mitobe, Y.; Duc Anh, N.Q.; Viet, N.T. Sand Spit Elongation and Sediment Balance at Cua Lo Inlet in Central Vietnam. J. Coast. Res. 2018, 81, 32–39. [Google Scholar] [CrossRef]
- Paladio-Hernandez, A.; Salles, P.; Arriaga, J.; López-González, J. Characterization of the Morphological Behavior of a Sand Spit Using UAVs. J. Mar. Sci. Eng. 2022, 10, 600. [Google Scholar] [CrossRef]
- Furuike, K.; Uda, T.; Serizawa, M.; San-nami, T.; Ishikawa, T. Model for predicting long-term beach changes originating from accretive features of a natural delta coast. In Asian and Pacific Coasts 2009: (In 4 Volumes, with CD-ROM); World Scientific: Singapore, 2010; pp. 266–272. [Google Scholar]
- Uda, T.; Shiho, M.; Toshiro, S.-N.; Masumi, S. A Long-Term Prediction of Beach Changes around River Delta using Contour-Line-Change Model. In Sedimentary Processes; Gemma, A., Ed.; IntechOpen: Rijeka, Croatia, 2019; p. Ch. 5. [Google Scholar] [CrossRef]
- Hu, N.; Murray, A.B.; Ratliff, K.M.; Little, Z.; Hutton, E.W.H. Wave-Climate Asymmetry Influence on Delta Evolution and River Dynamics. Geophys. Res. Lett. 2022, 49, e2021GL096315. [Google Scholar] [CrossRef]
- Ashton, A.; Murray, A.B.; Arnoult, O. Formation of coastline features by large-scale instabilities induced by high-angle waves. Nature 2001, 414, 296–300. [Google Scholar] [CrossRef]
- Ashton, A.D.; Giosan, L. Wave-angle control of delta evolution. Geophys. Res. Lett. 2011, 38. [Google Scholar] [CrossRef]
- Gao, J.; Ma, X.; Dong, G.; Chen, H.; Liu, Q.; Zang, J. Investigation on the effects of Bragg reflection on harbor oscillations. Coast. Eng. 2021, 170, 103977. [Google Scholar] [CrossRef]
- Gao, J.; Shi, H.; Zang, J.; Liu, Y. Mechanism analysis on the mitigation of harbor resonance by periodic undulating topography. Ocean Eng. 2023, 281, 114923. [Google Scholar] [CrossRef]


| No. | Date | Sensor | Resolution (m) | Data Source |
|---|---|---|---|---|
| 1 | 7 March 1987 | TM | 30 | Landsat 5 |
| 2 | 28 May 1988 | TM | 30 | Landsat 5 |
| 3 | 16 June 1989 | TM | 30 | Landsat 5 |
| 4 | 5 July 1990 | TM | 30 | Landsat 5 |
| 5 | 14 February 1991 | TM | 30 | Landsat 5 |
| 6 | 24 June 1992 | TM | 30 | Landsat 5 |
| 7 | 29 July 1993 | TM | 30 | Landsat 5 |
| 8 | 29 May 1994 | TM | 30 | Landsat 5 |
| 9 | 5 September 1995 | TM | 30 | Landsat 5 |
| 10 | 6 August 1996 | TM | 30 | Landsat 5 |
| 11 | 6 June 1997 | TM | 30 | Landsat 5 |
| 12 | 15 October 1998 | TM | 30 | Landsat 5 |
| 13 | 18 October 1999 | TM | 30 | Landsat 5 |
| 14 | 5 November 2000 | TM | 30 | Landsat 5 |
| 15 | 19 July 2001 | TM | 30 | Landsat 5 |
| 16 | 24 September 2002 | TM | 30 | Landsat 5 |
| 17 | 6 May 2003 | TM | 30 | Landsat 5 |
| 18 | 24 May 2004 | TM | 30 | Landsat 5 |
| 19 | 11 May 2005 | TM | 30 | Landsat 5 |
| 20 | 6 November 2006 | TM | 30 | Landsat 5 |
| 21 | 1 May 2007 | TM | 30 | Landsat 5 |
| 22 | 20 June 2008 | TM | 30 | Landsat 5 |
| 23 | 9 July 2009 | TM | 30 | Landsat 5 |
| 24 | 1 November 2010 | TM | 30 | Landsat 5 |
| 25 | 26 April 2011 | TM | 30 | Landsat 5 |
| 26 | 8 October 2013 | OLI/TIRS | 30 | Landsat 8 |
| 27 | 23 July 2014 | OLI/TIRS | 30 | Landsat 8 |
| 28 | 15 January 2015 | OLI/TIRS | 30 | Landsat 8 |
| 29 | 7 October 2016 | OLI/TIRS | 30 | Landsat 8 |
| 30 | 31 July 2017 | OLI/TIRS | 30 | Landsat 8 |
| 31 | 2 July 2018 | OLI/TIRS | 30 | Landsat 8 |
| 32 | 18 May 2019 | OLI/TIRS | 30 | Landsat 8 |
| 33 | 20 May 2020 | OLI/TIRS | 30 | Landsat 8 |
| 34 | 23 May 2021 | OLI/TIRS | 30 | Landsat 8 |
| 35 | 8 April 2022 | OLI/TIRS | 30 | Landsat 8 |
| 36 | 21 May 2023 | OLI/TIRS | 30 | Landsat 9 |
| Diffusion Coefficient, ε (m2/day) | Unknown |
| Sand supply from the river, q0 (m3/year) | 390,000 |
| Formation time, t (year) | 500 |
| Depth of closure, DC (m) | 5.6 |
| Berm height, DB (m) | 1.8 |
| Length of the shoreline, L (m) | 6900 |
| Diffusion coefficient, ε (m2/day) | 90 |
| Sand supply from the river, q0 (m3/year) | 350,000 |
| Formation time, t (year) | 500 |
| Depth of closure, DC (m) | 5.6 |
| Berm height, DB (m) | 1.8 |
| Length of the shoreline, L (m) | 6900 |
Disclaimer/Publisher’s Note: The statements, opinions and data contained in all publications are solely those of the individual author(s) and contributor(s) and not of MDPI and/or the editor(s). MDPI and/or the editor(s) disclaim responsibility for any injury to people or property resulting from any ideas, methods, instructions or products referred to in the content. |
© 2023 by the authors. Licensee MDPI, Basel, Switzerland. This article is an open access article distributed under the terms and conditions of the Creative Commons Attribution (CC BY) license (https://creativecommons.org/licenses/by/4.0/).
Share and Cite
Duy, D.V.; Ty, T.V.; Than, C.T.N.; Thang, C.N.; Hong, H.T.C.; Viet, N.T.; Tanaka, H. Coastal Erosion Caused by River Mouth Migration on a Cuspate Delta: An Example from Thanh Hoa, Vietnam. Hydrology 2023, 10, 189. https://doi.org/10.3390/hydrology10090189
Duy DV, Ty TV, Than CTN, Thang CN, Hong HTC, Viet NT, Tanaka H. Coastal Erosion Caused by River Mouth Migration on a Cuspate Delta: An Example from Thanh Hoa, Vietnam. Hydrology. 2023; 10(9):189. https://doi.org/10.3390/hydrology10090189
Chicago/Turabian StyleDuy, Dinh Van, Tran Van Ty, Cao Tan Ngoc Than, Cu Ngoc Thang, Huynh Thi Cam Hong, Nguyen Trung Viet, and Hitoshi Tanaka. 2023. "Coastal Erosion Caused by River Mouth Migration on a Cuspate Delta: An Example from Thanh Hoa, Vietnam" Hydrology 10, no. 9: 189. https://doi.org/10.3390/hydrology10090189