
Influence of Dissolved Oxygen, Water Level and Temperature on Dissolved Organic Carbon in Coastal Groundwater
 , ,
, ,
Abstract
:1. Introduction
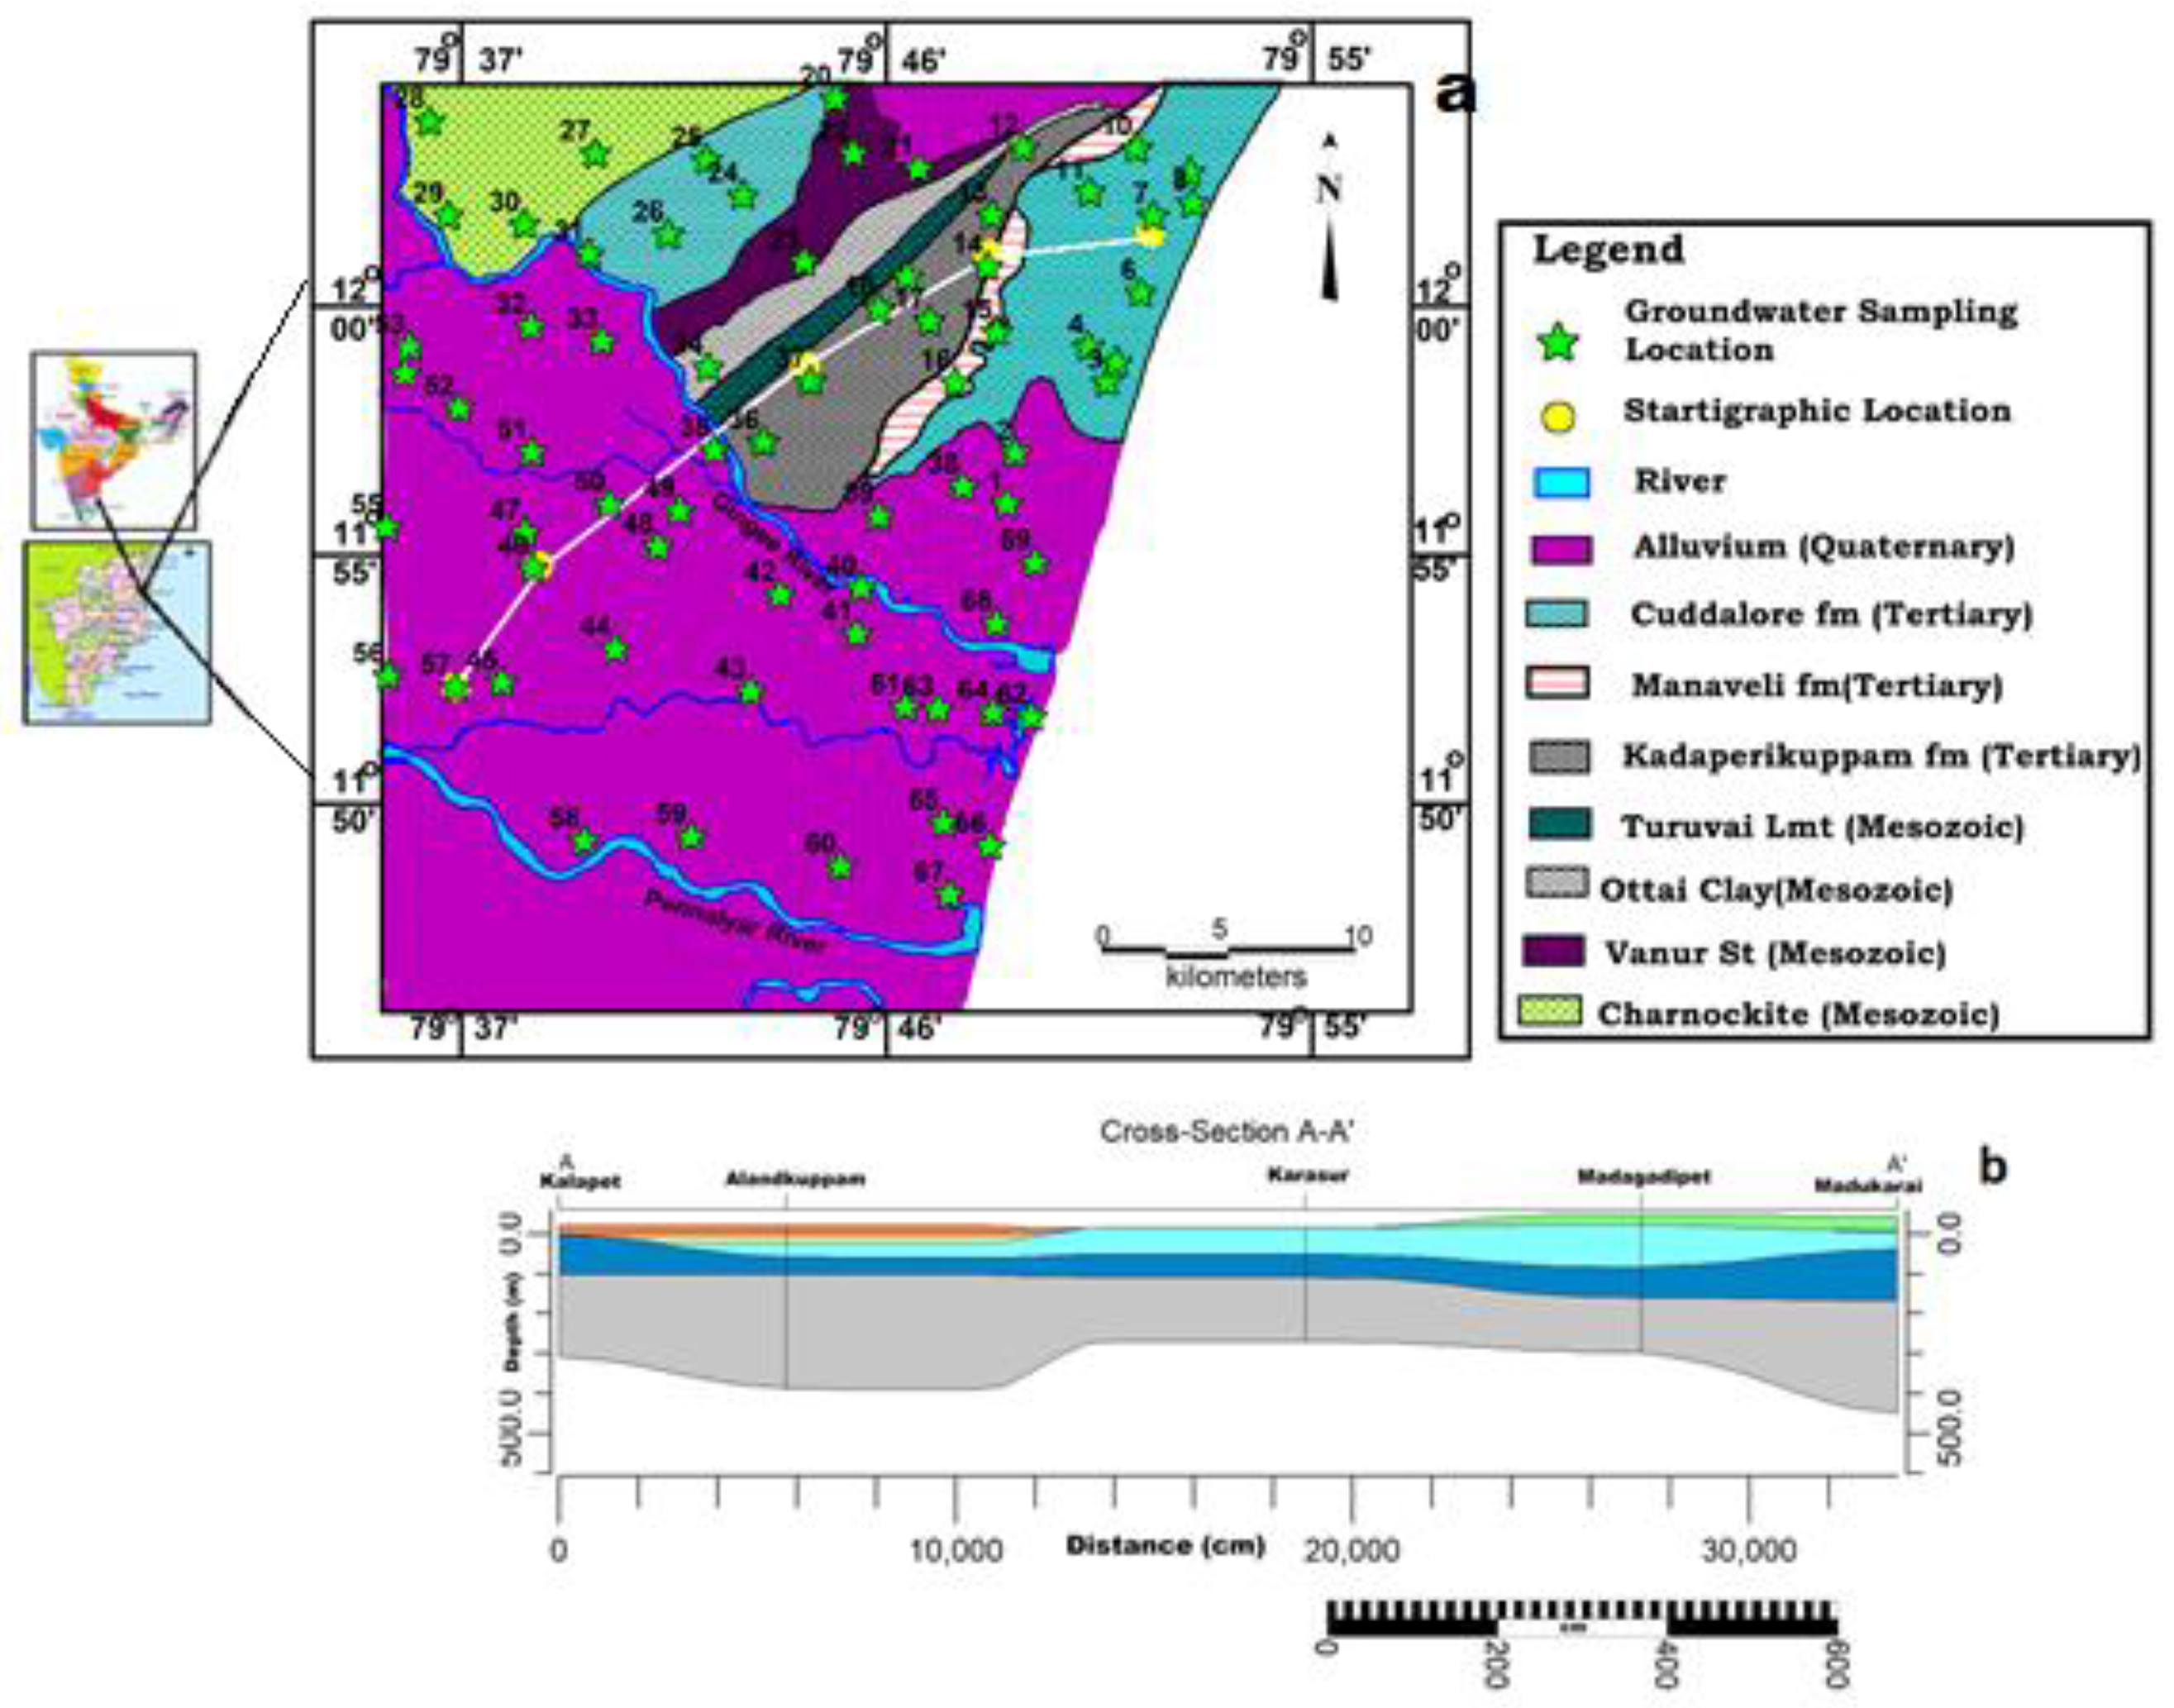
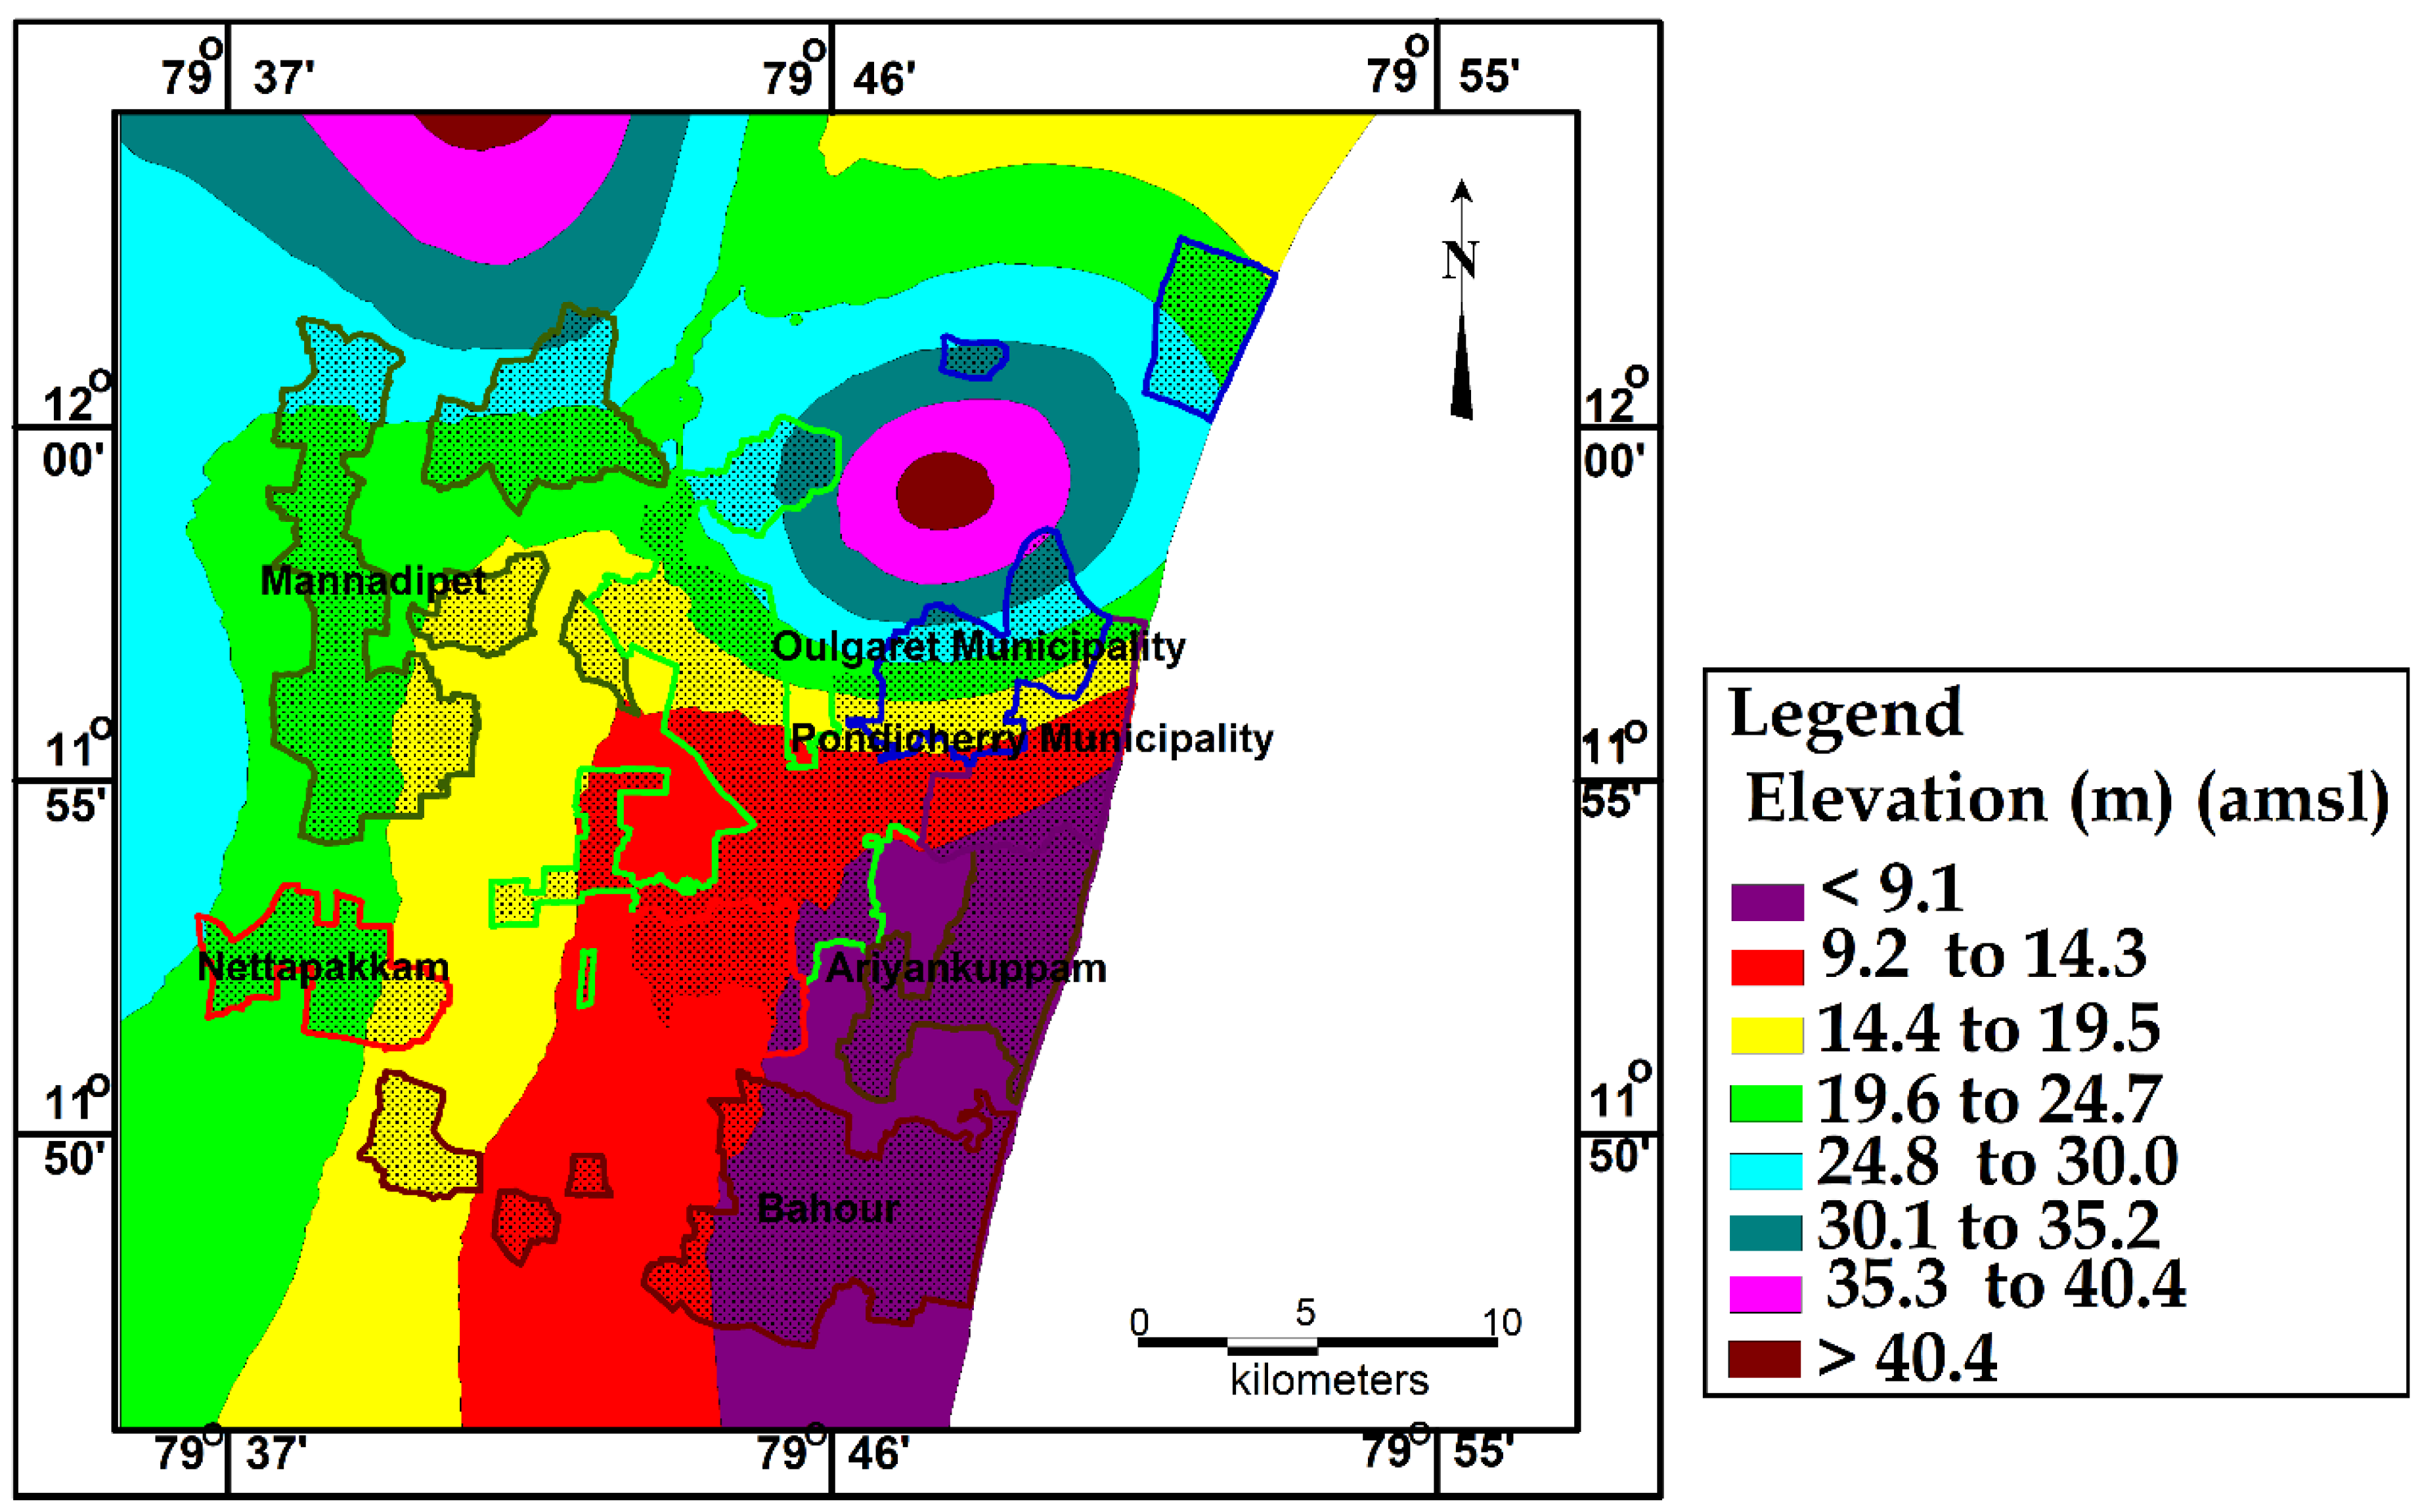
2. Study Area
3. Materials and Methods
4. Results and Discussion
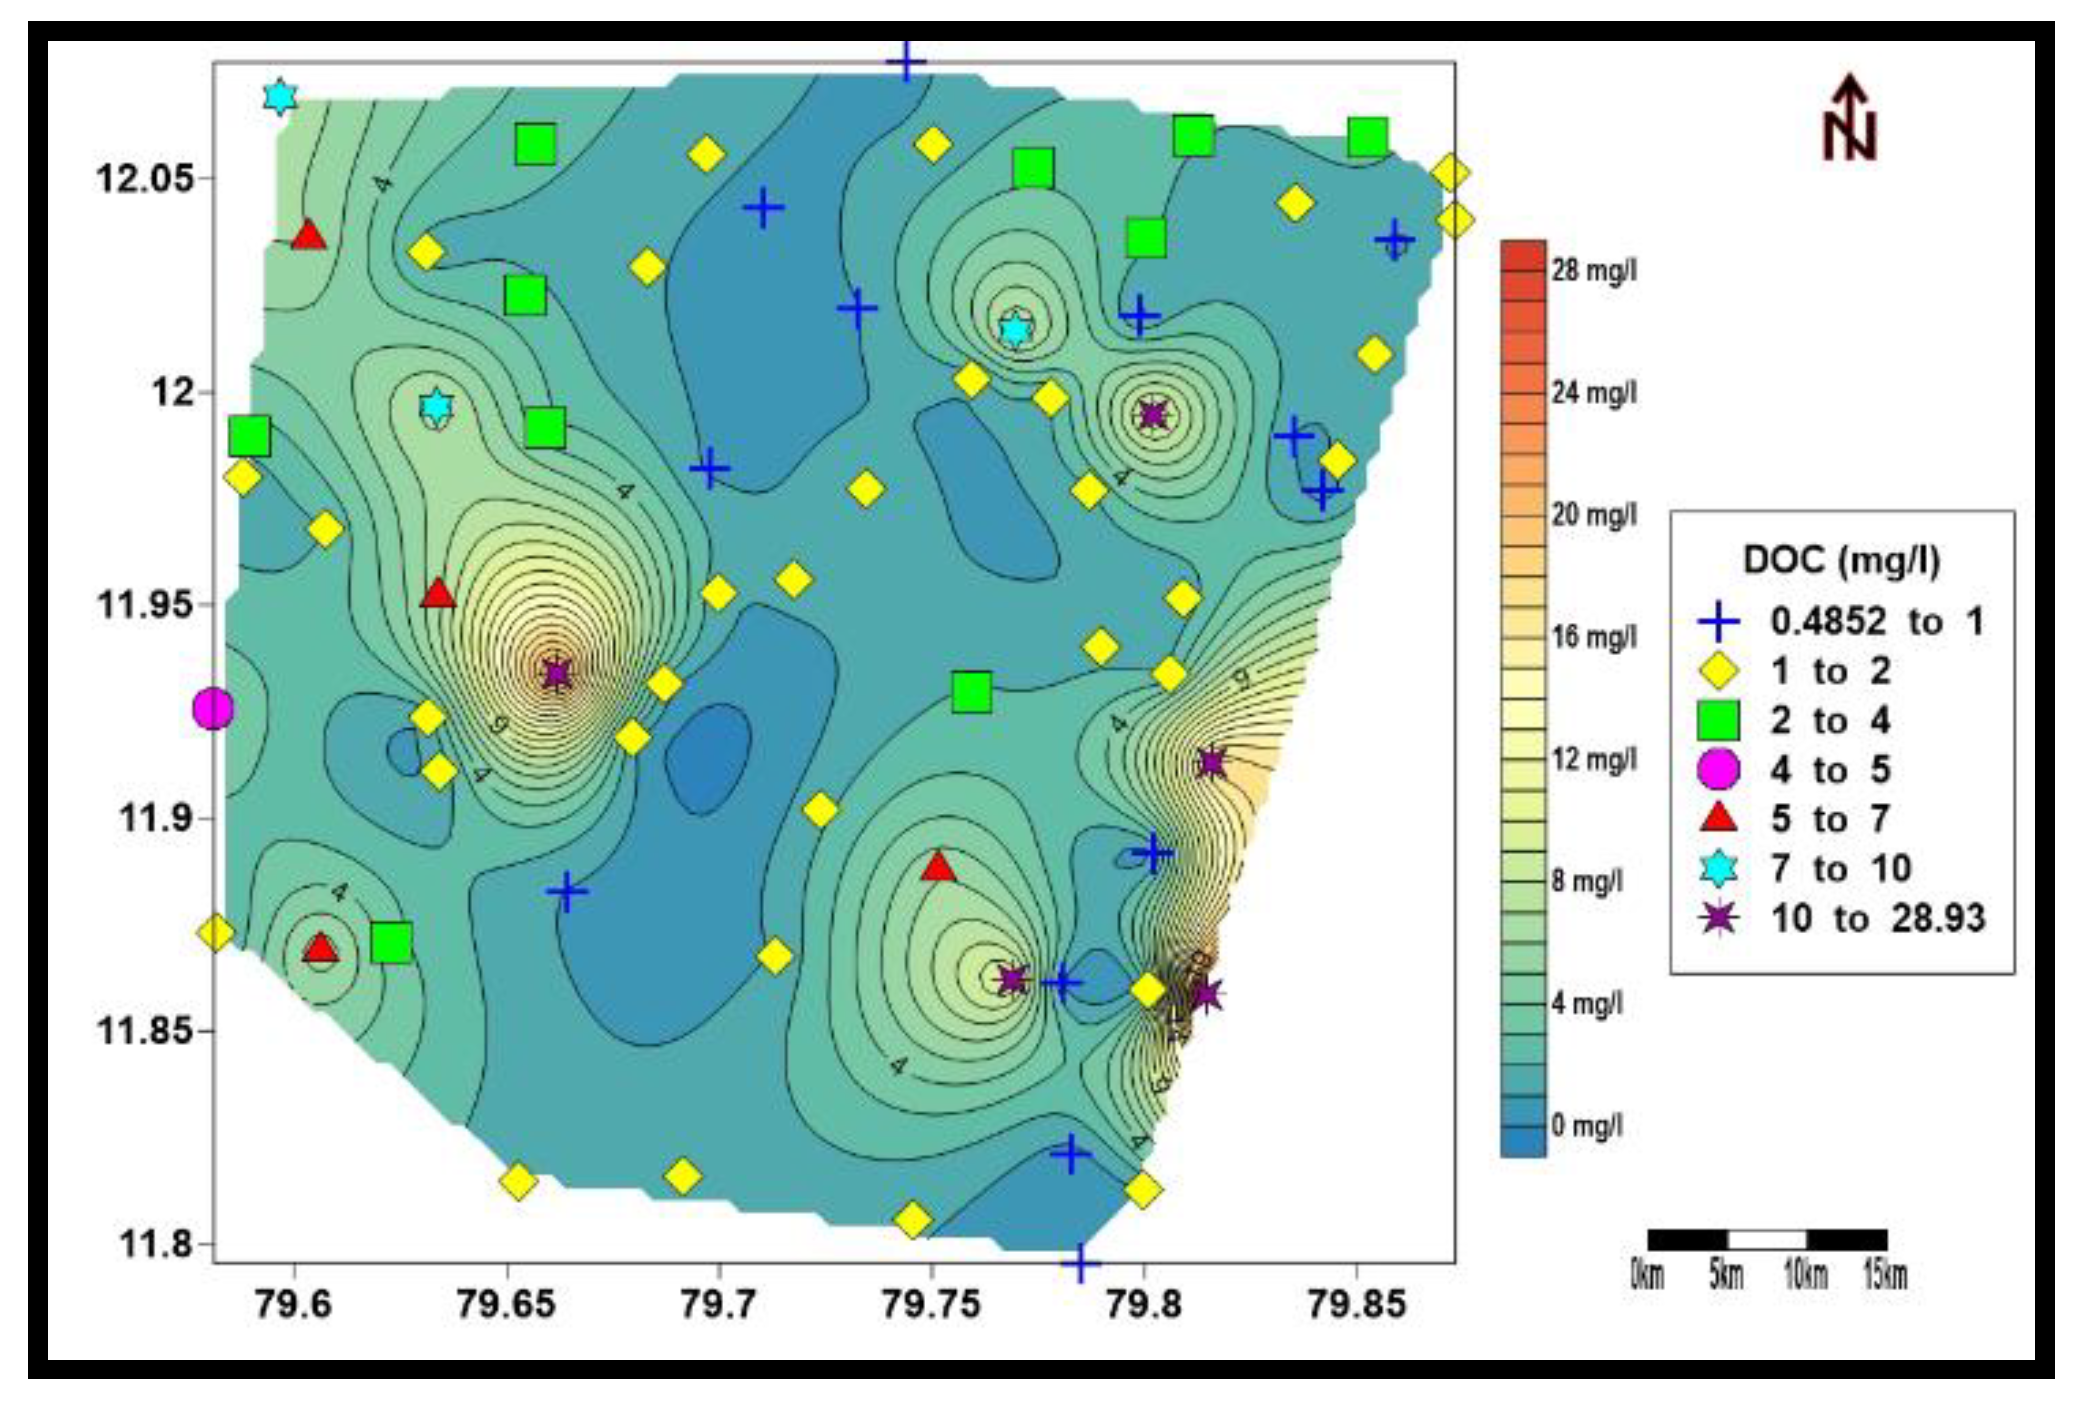
4.1. DOC in Groundwater
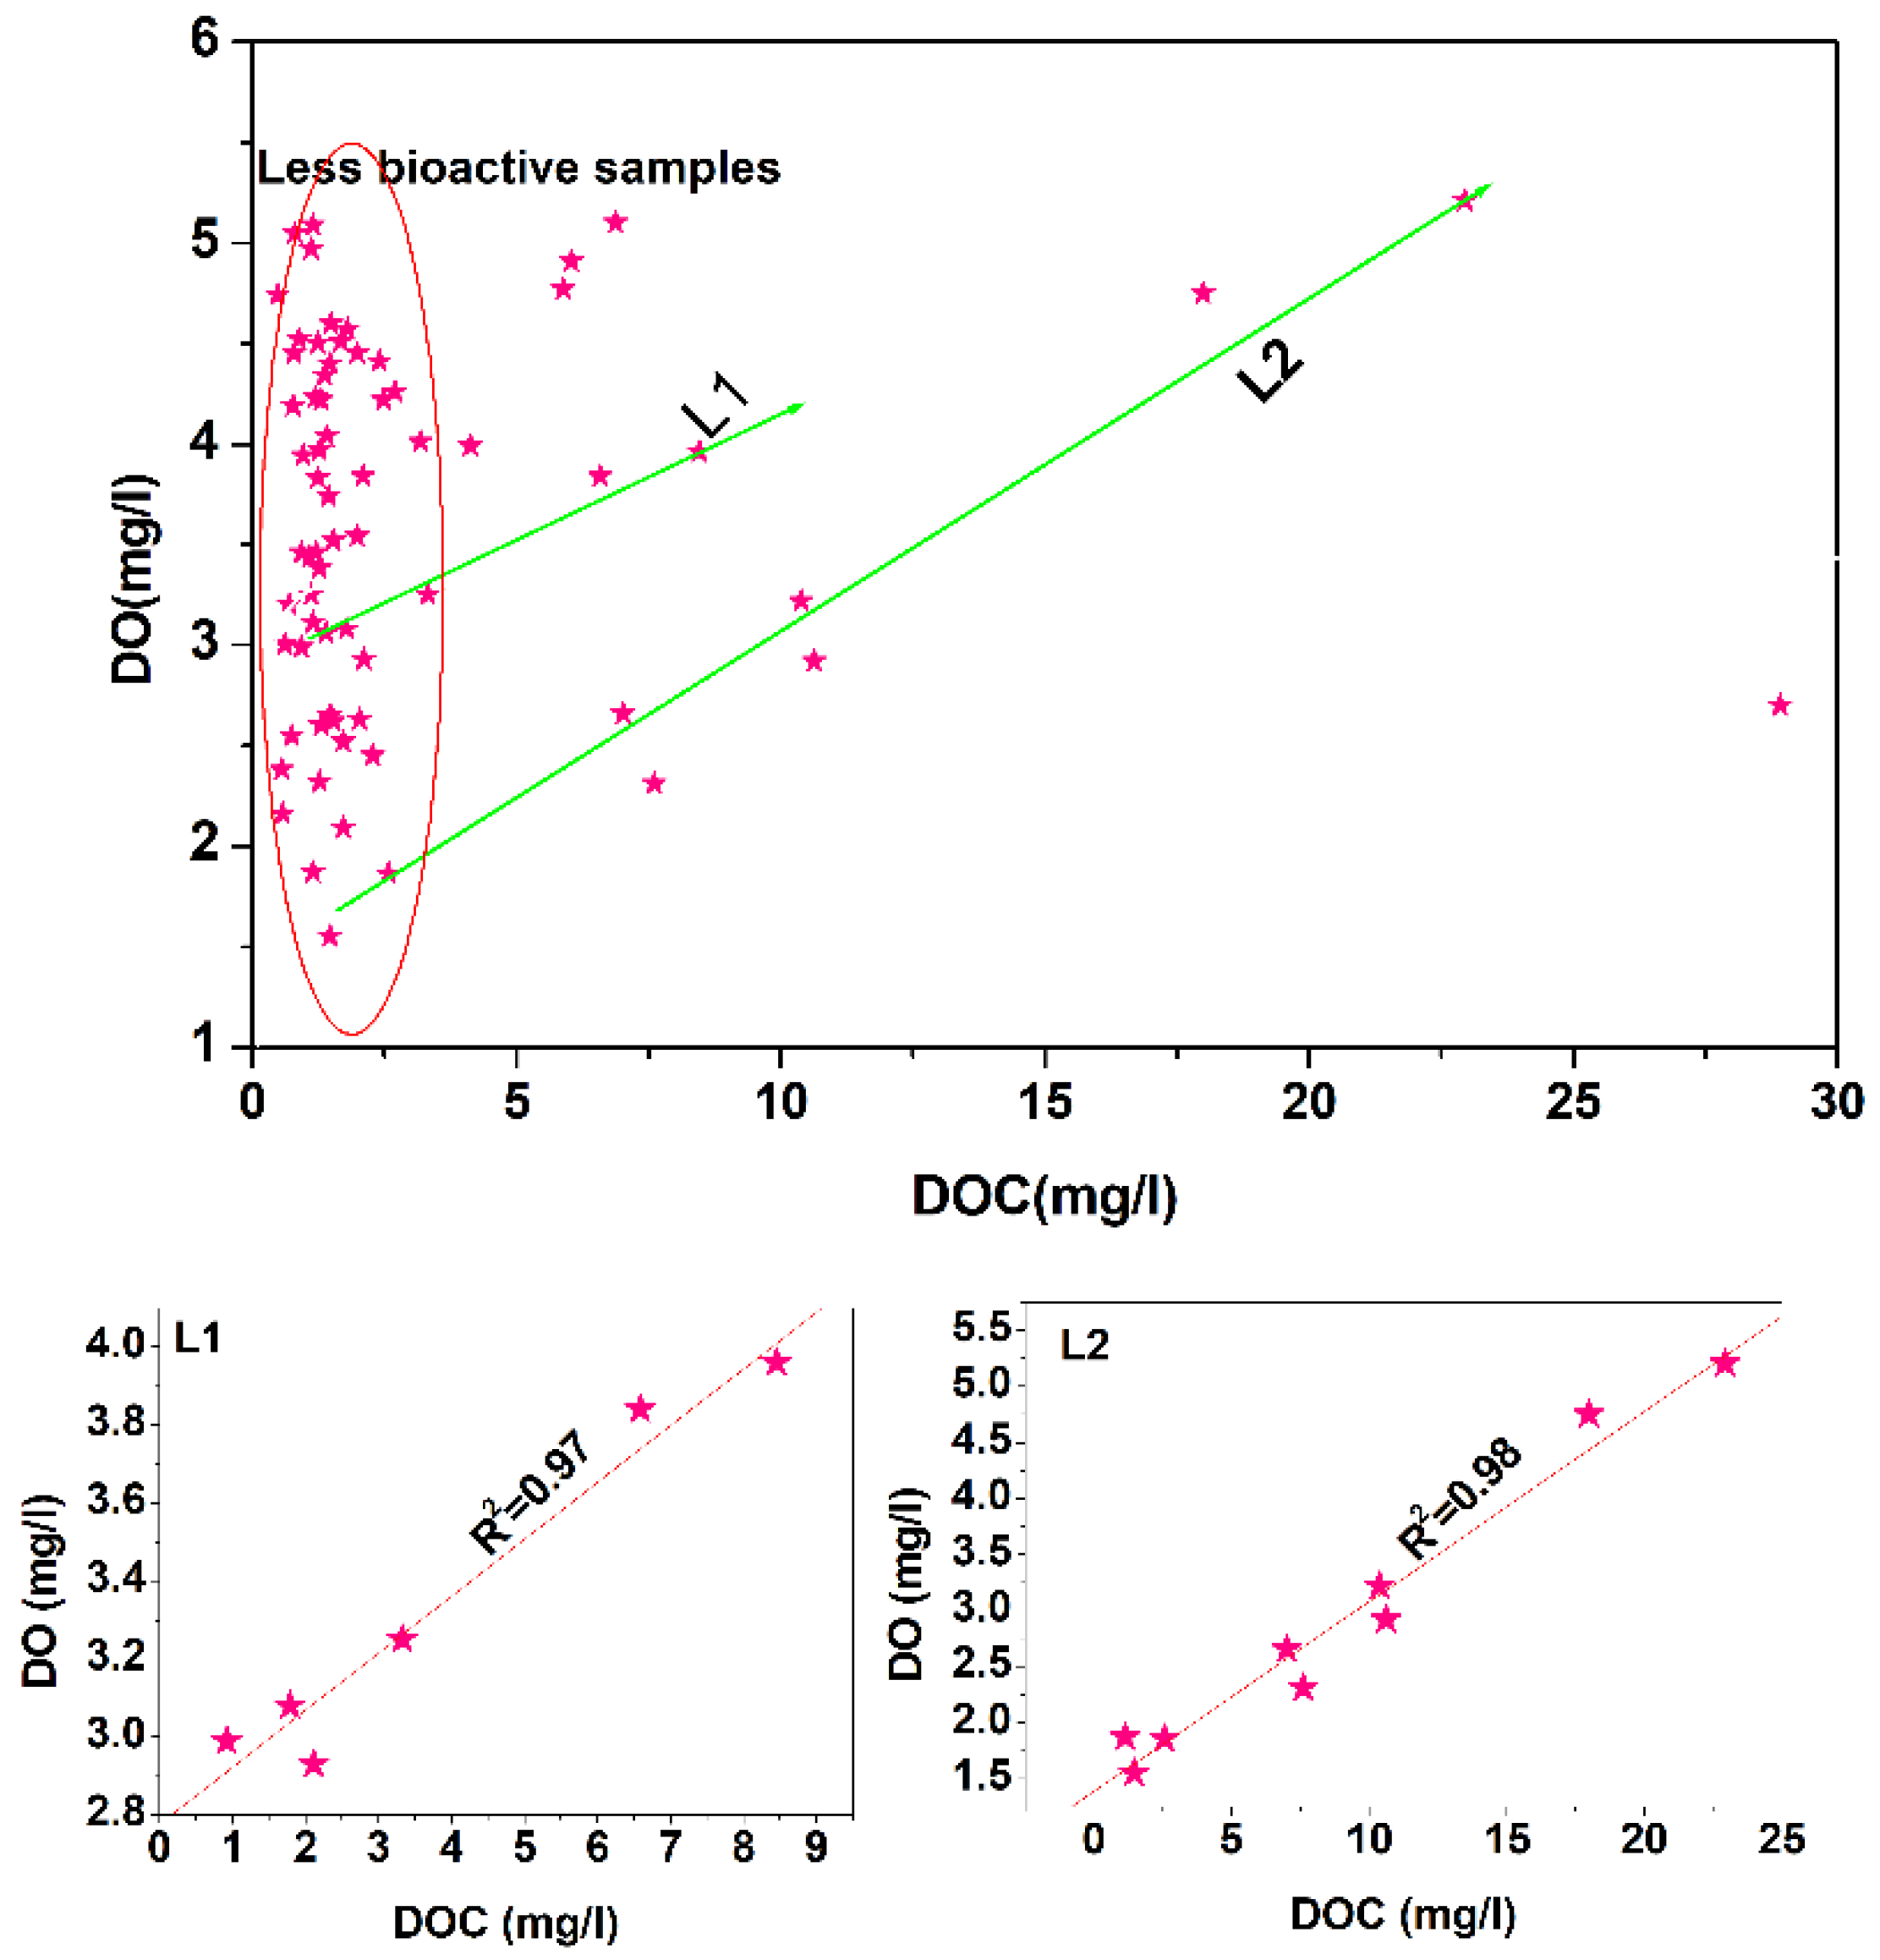
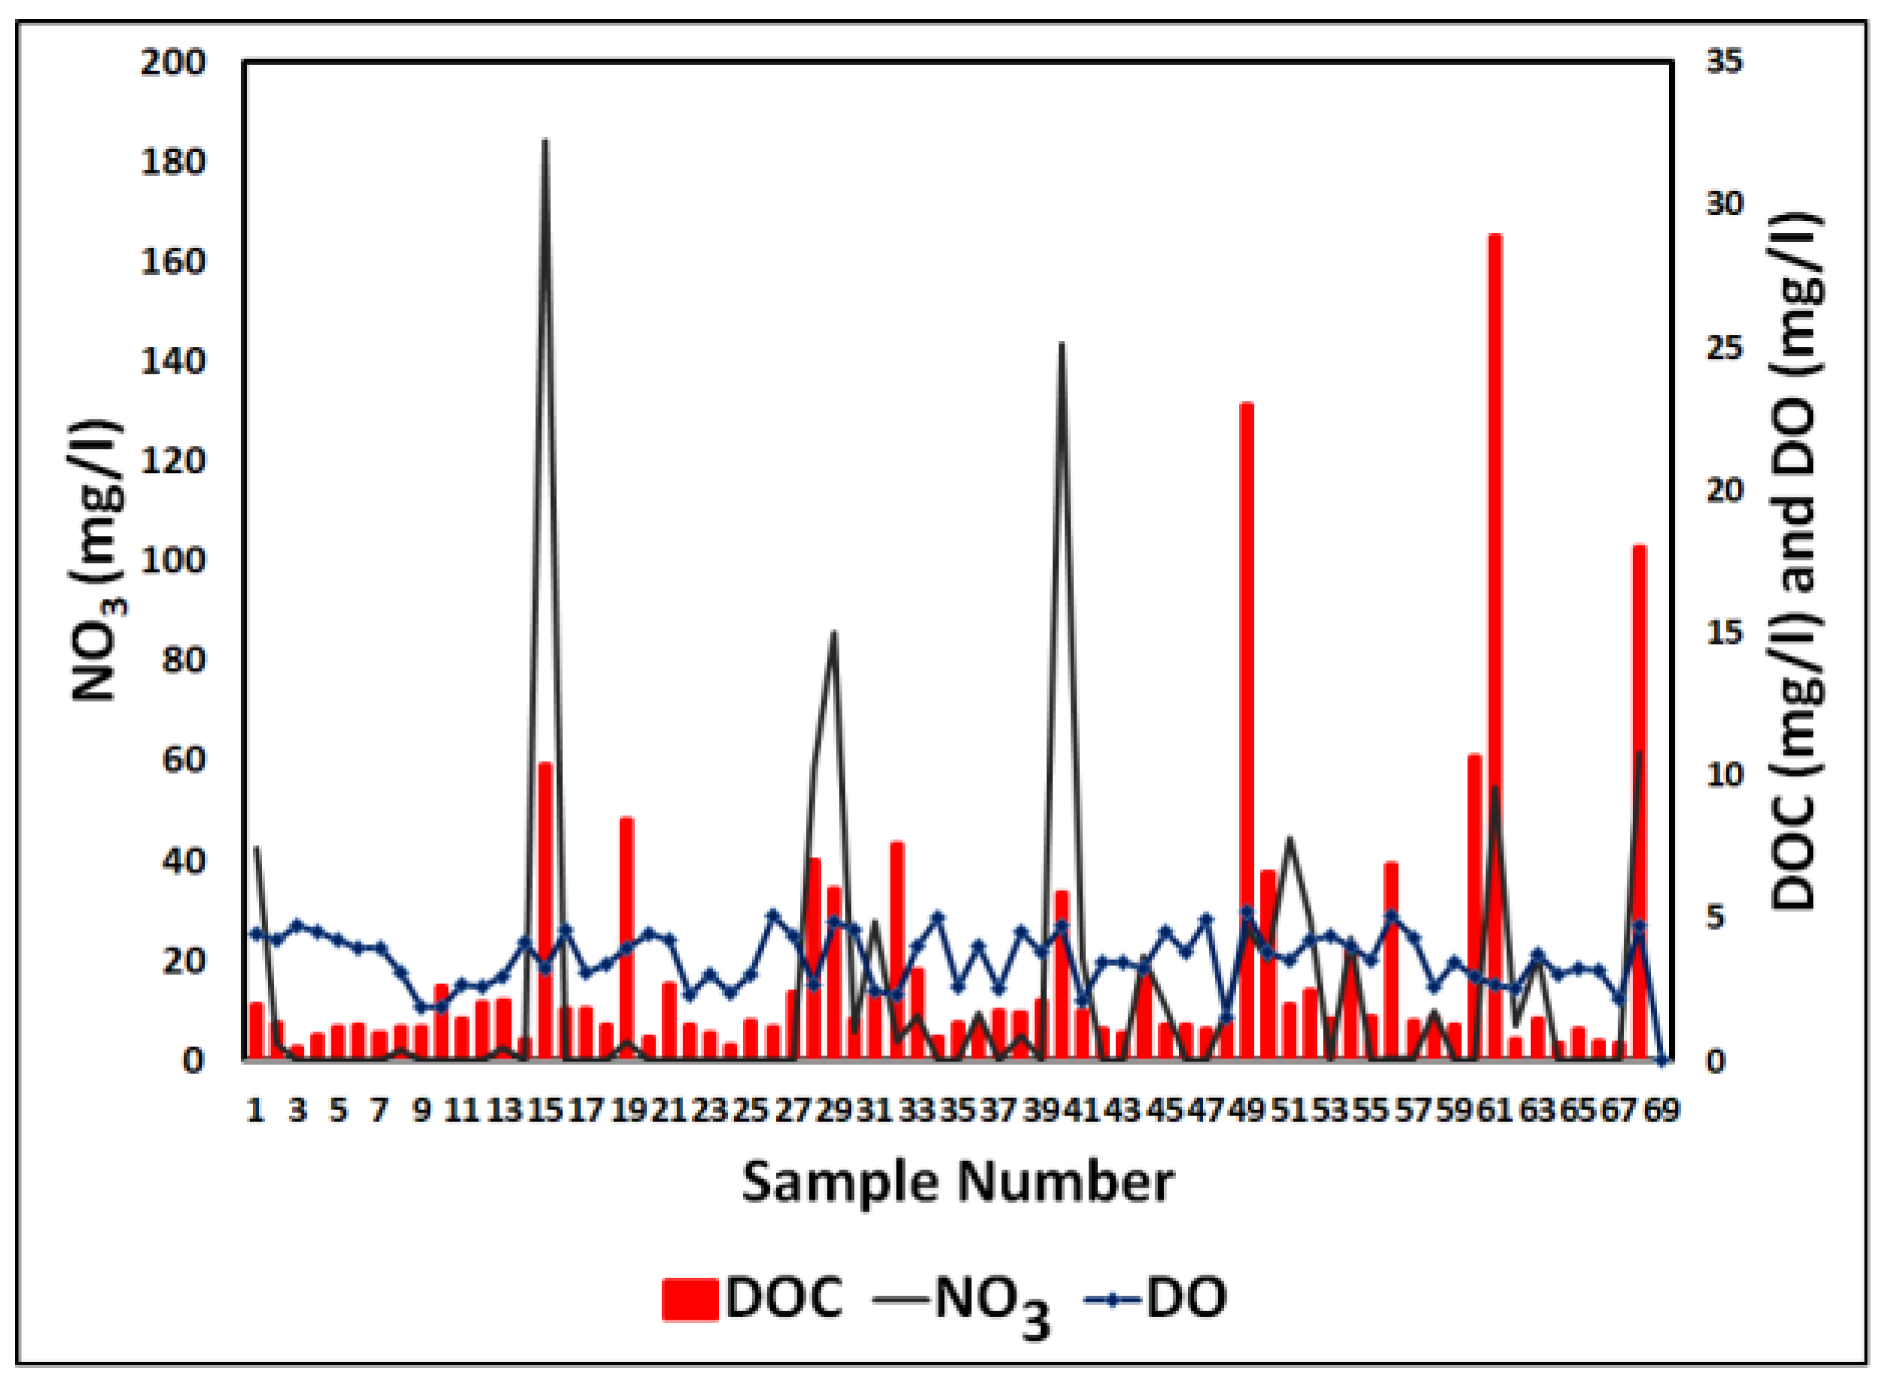
4.2. Relationship between DO and DOC
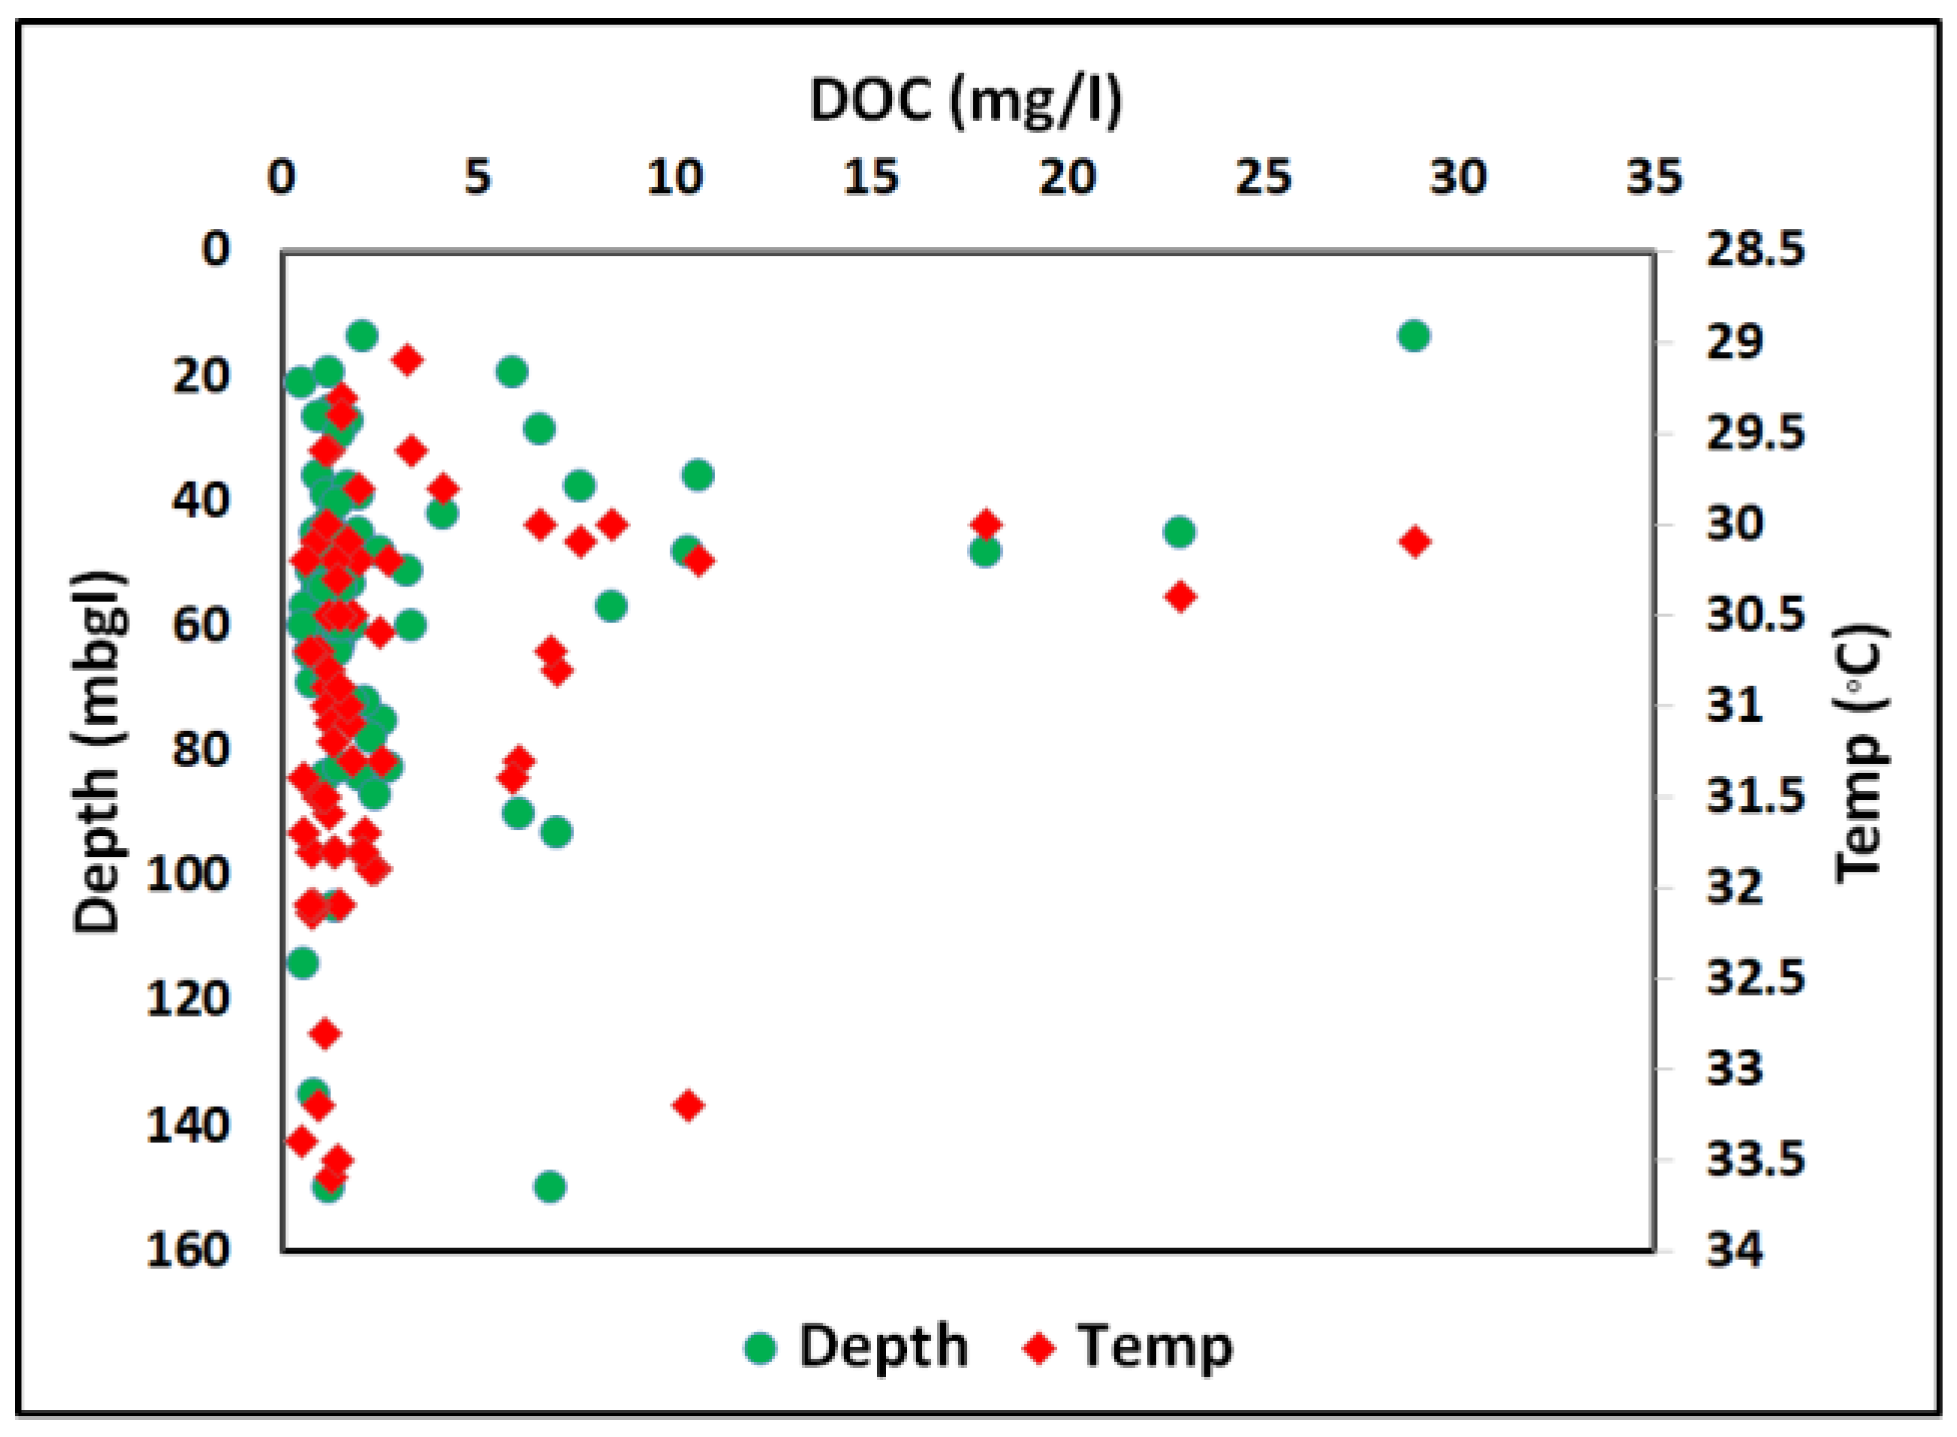
4.3. Temperature and Water Level
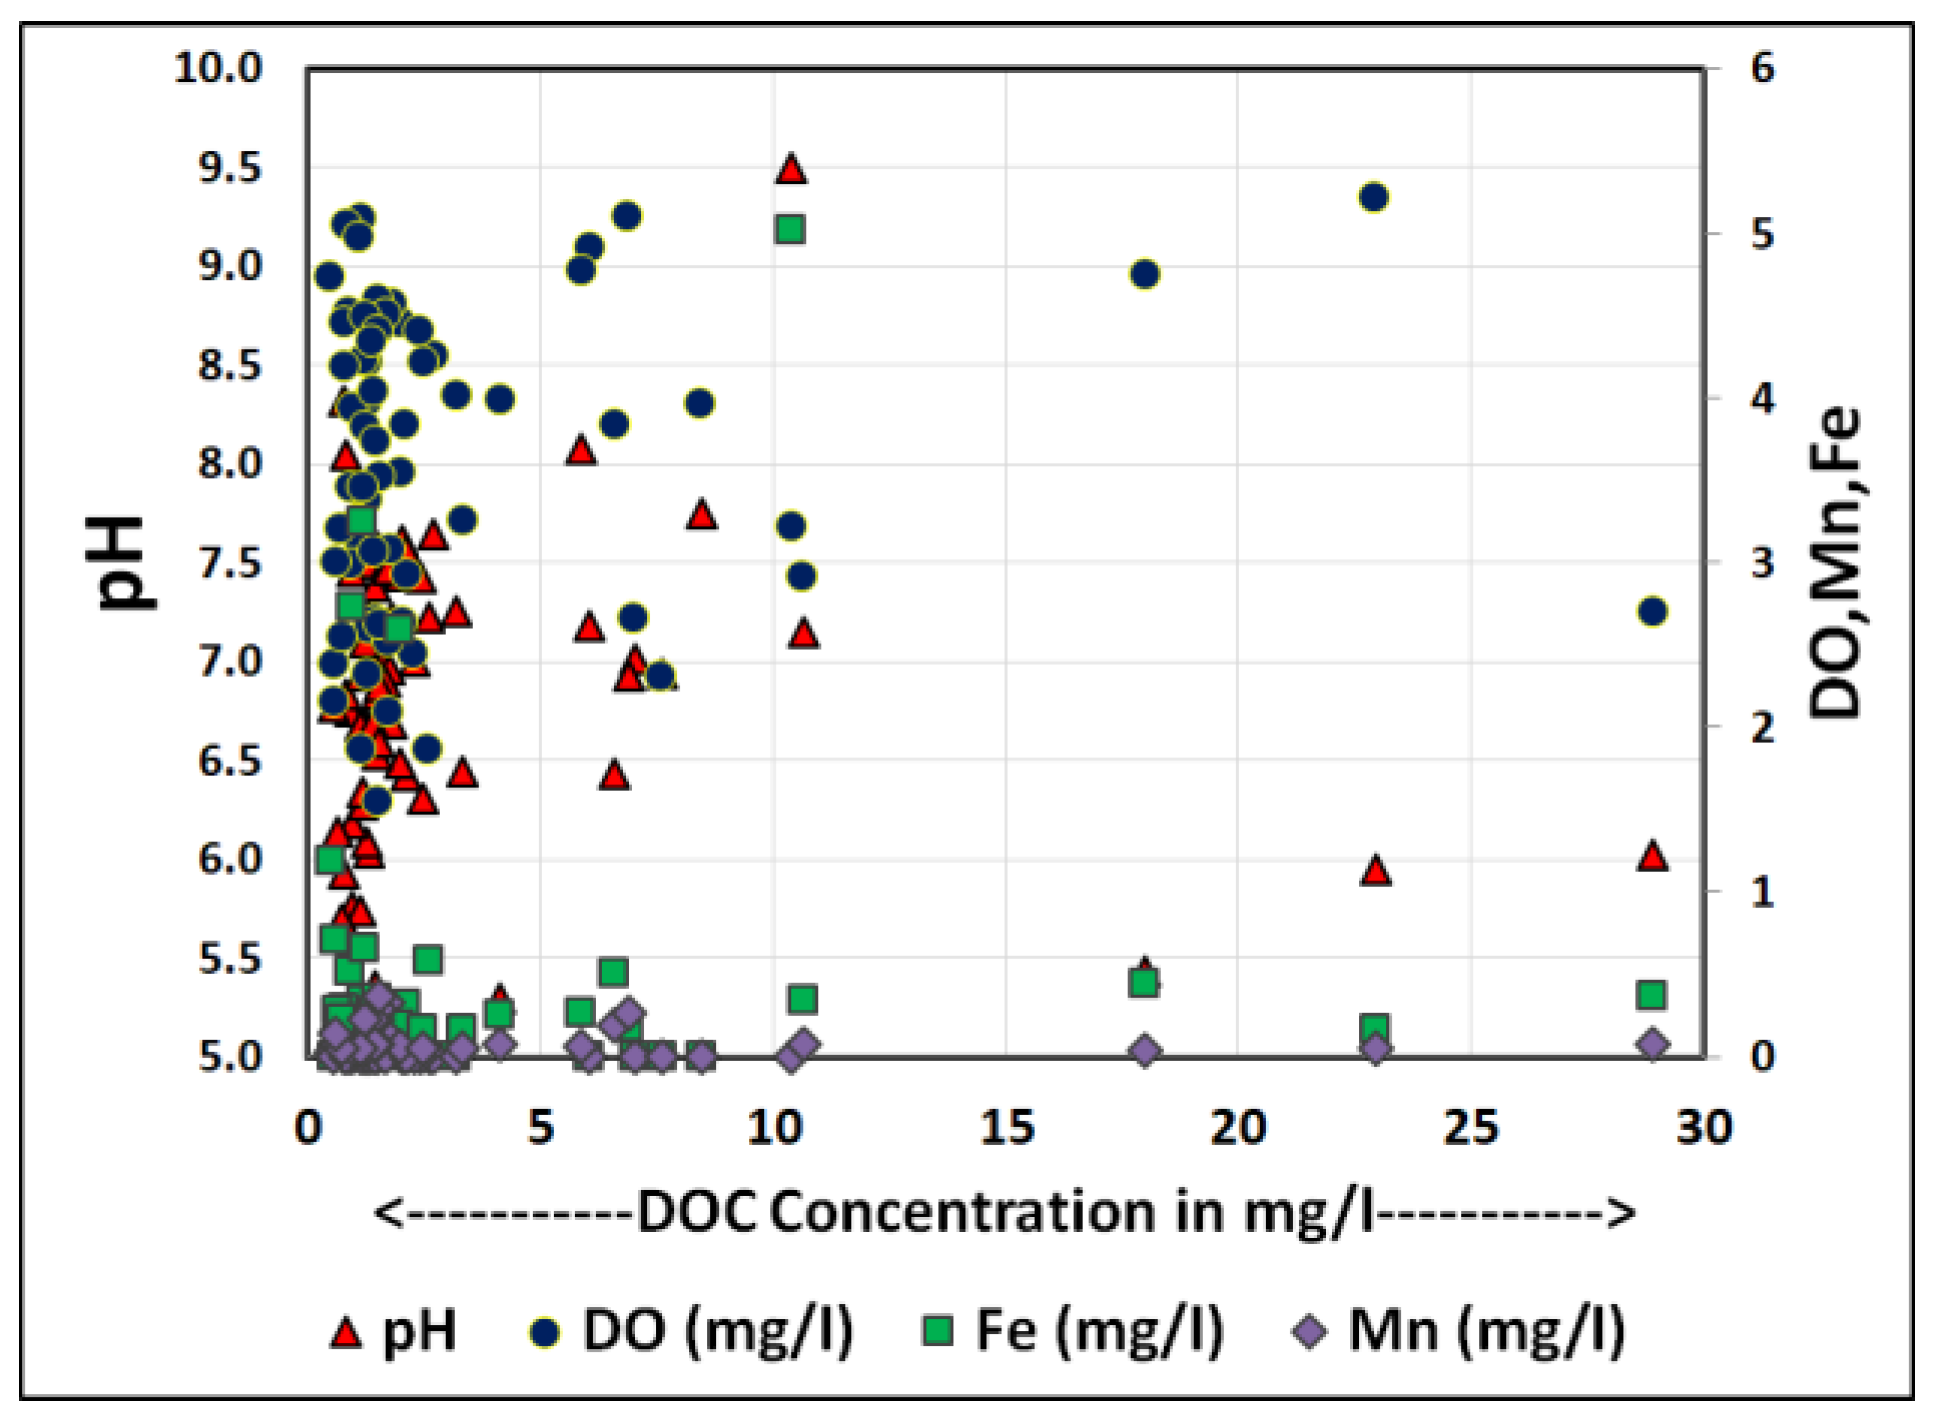
4.4. Other Observed Groundwater Constituents
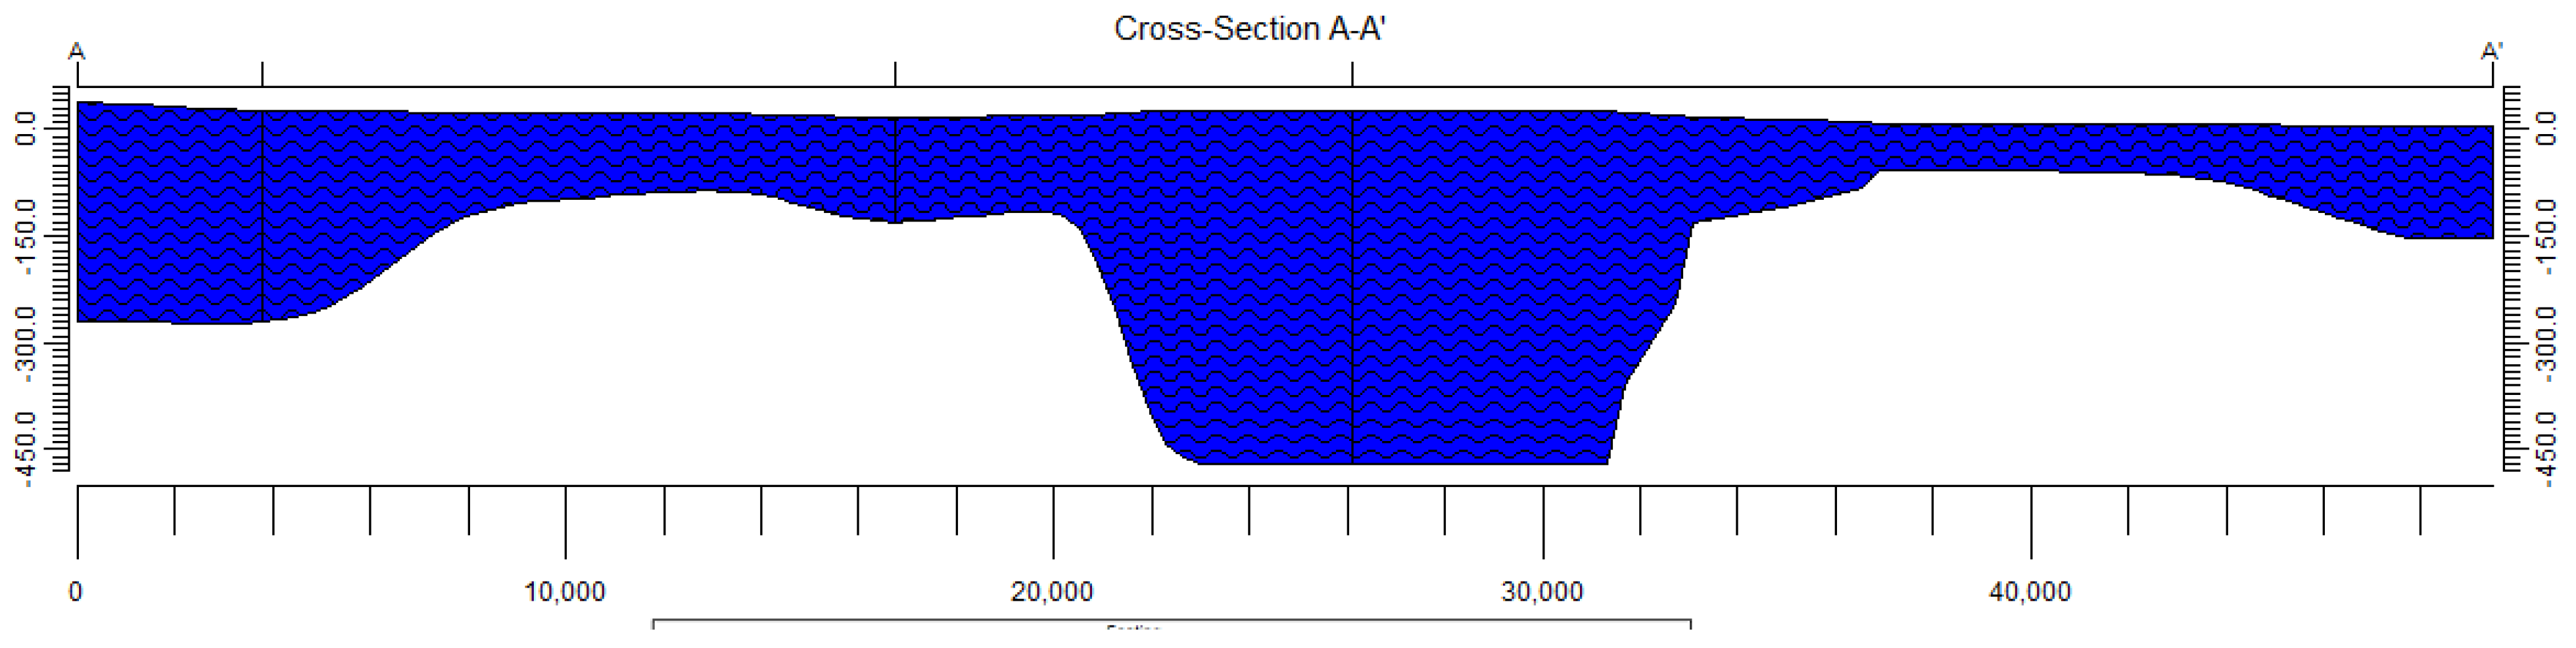
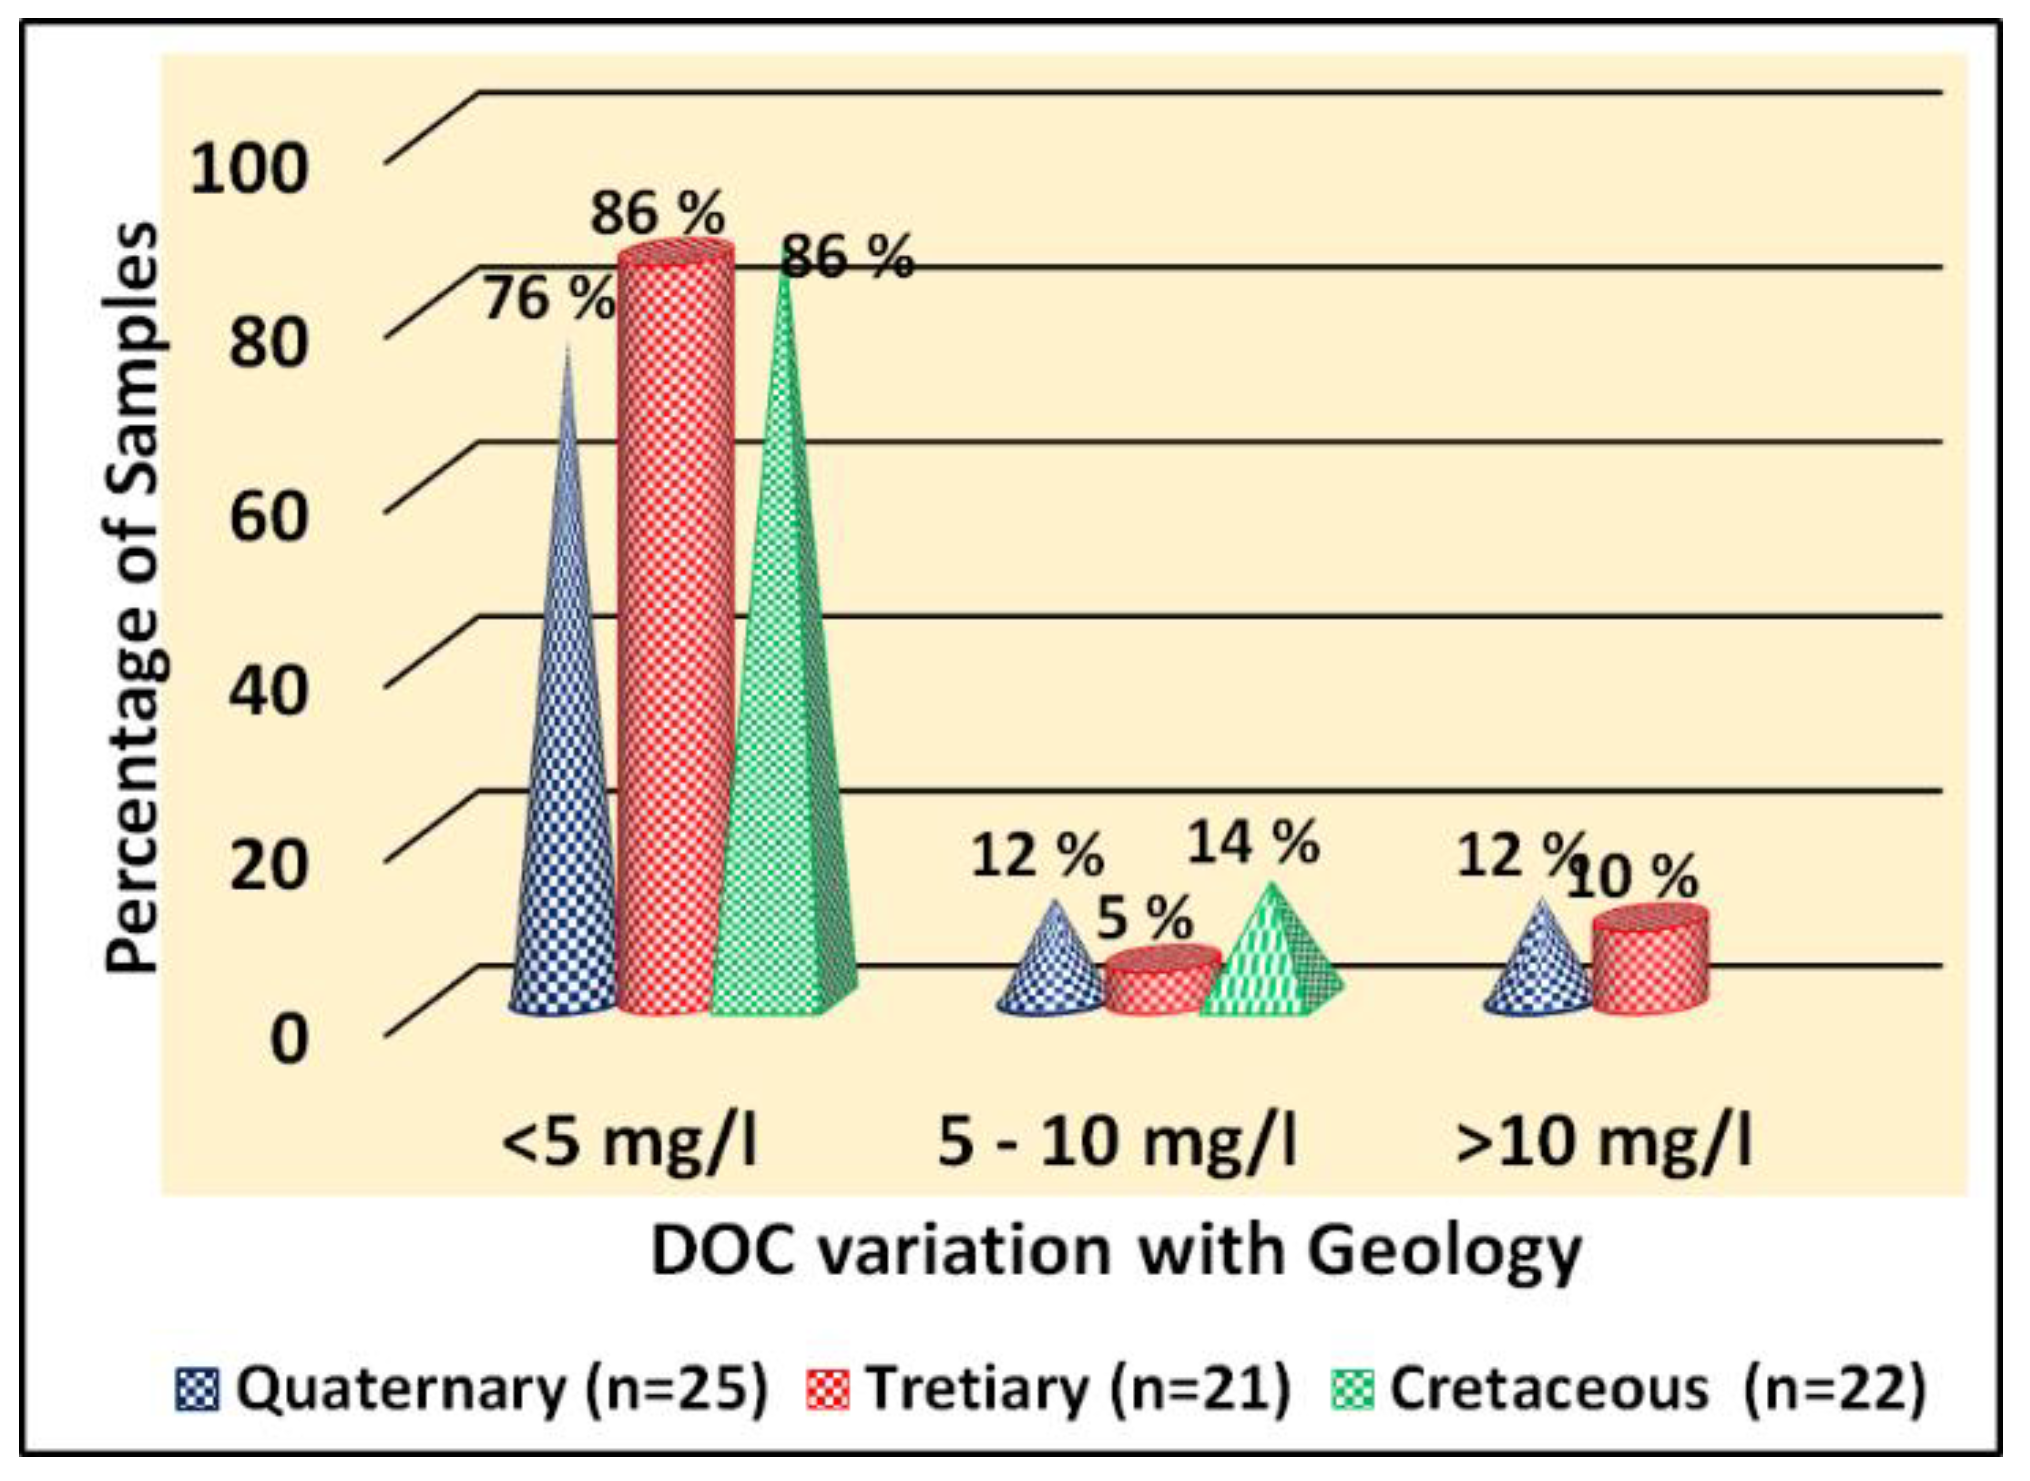
4.5. Geology and Groundwater Evolution
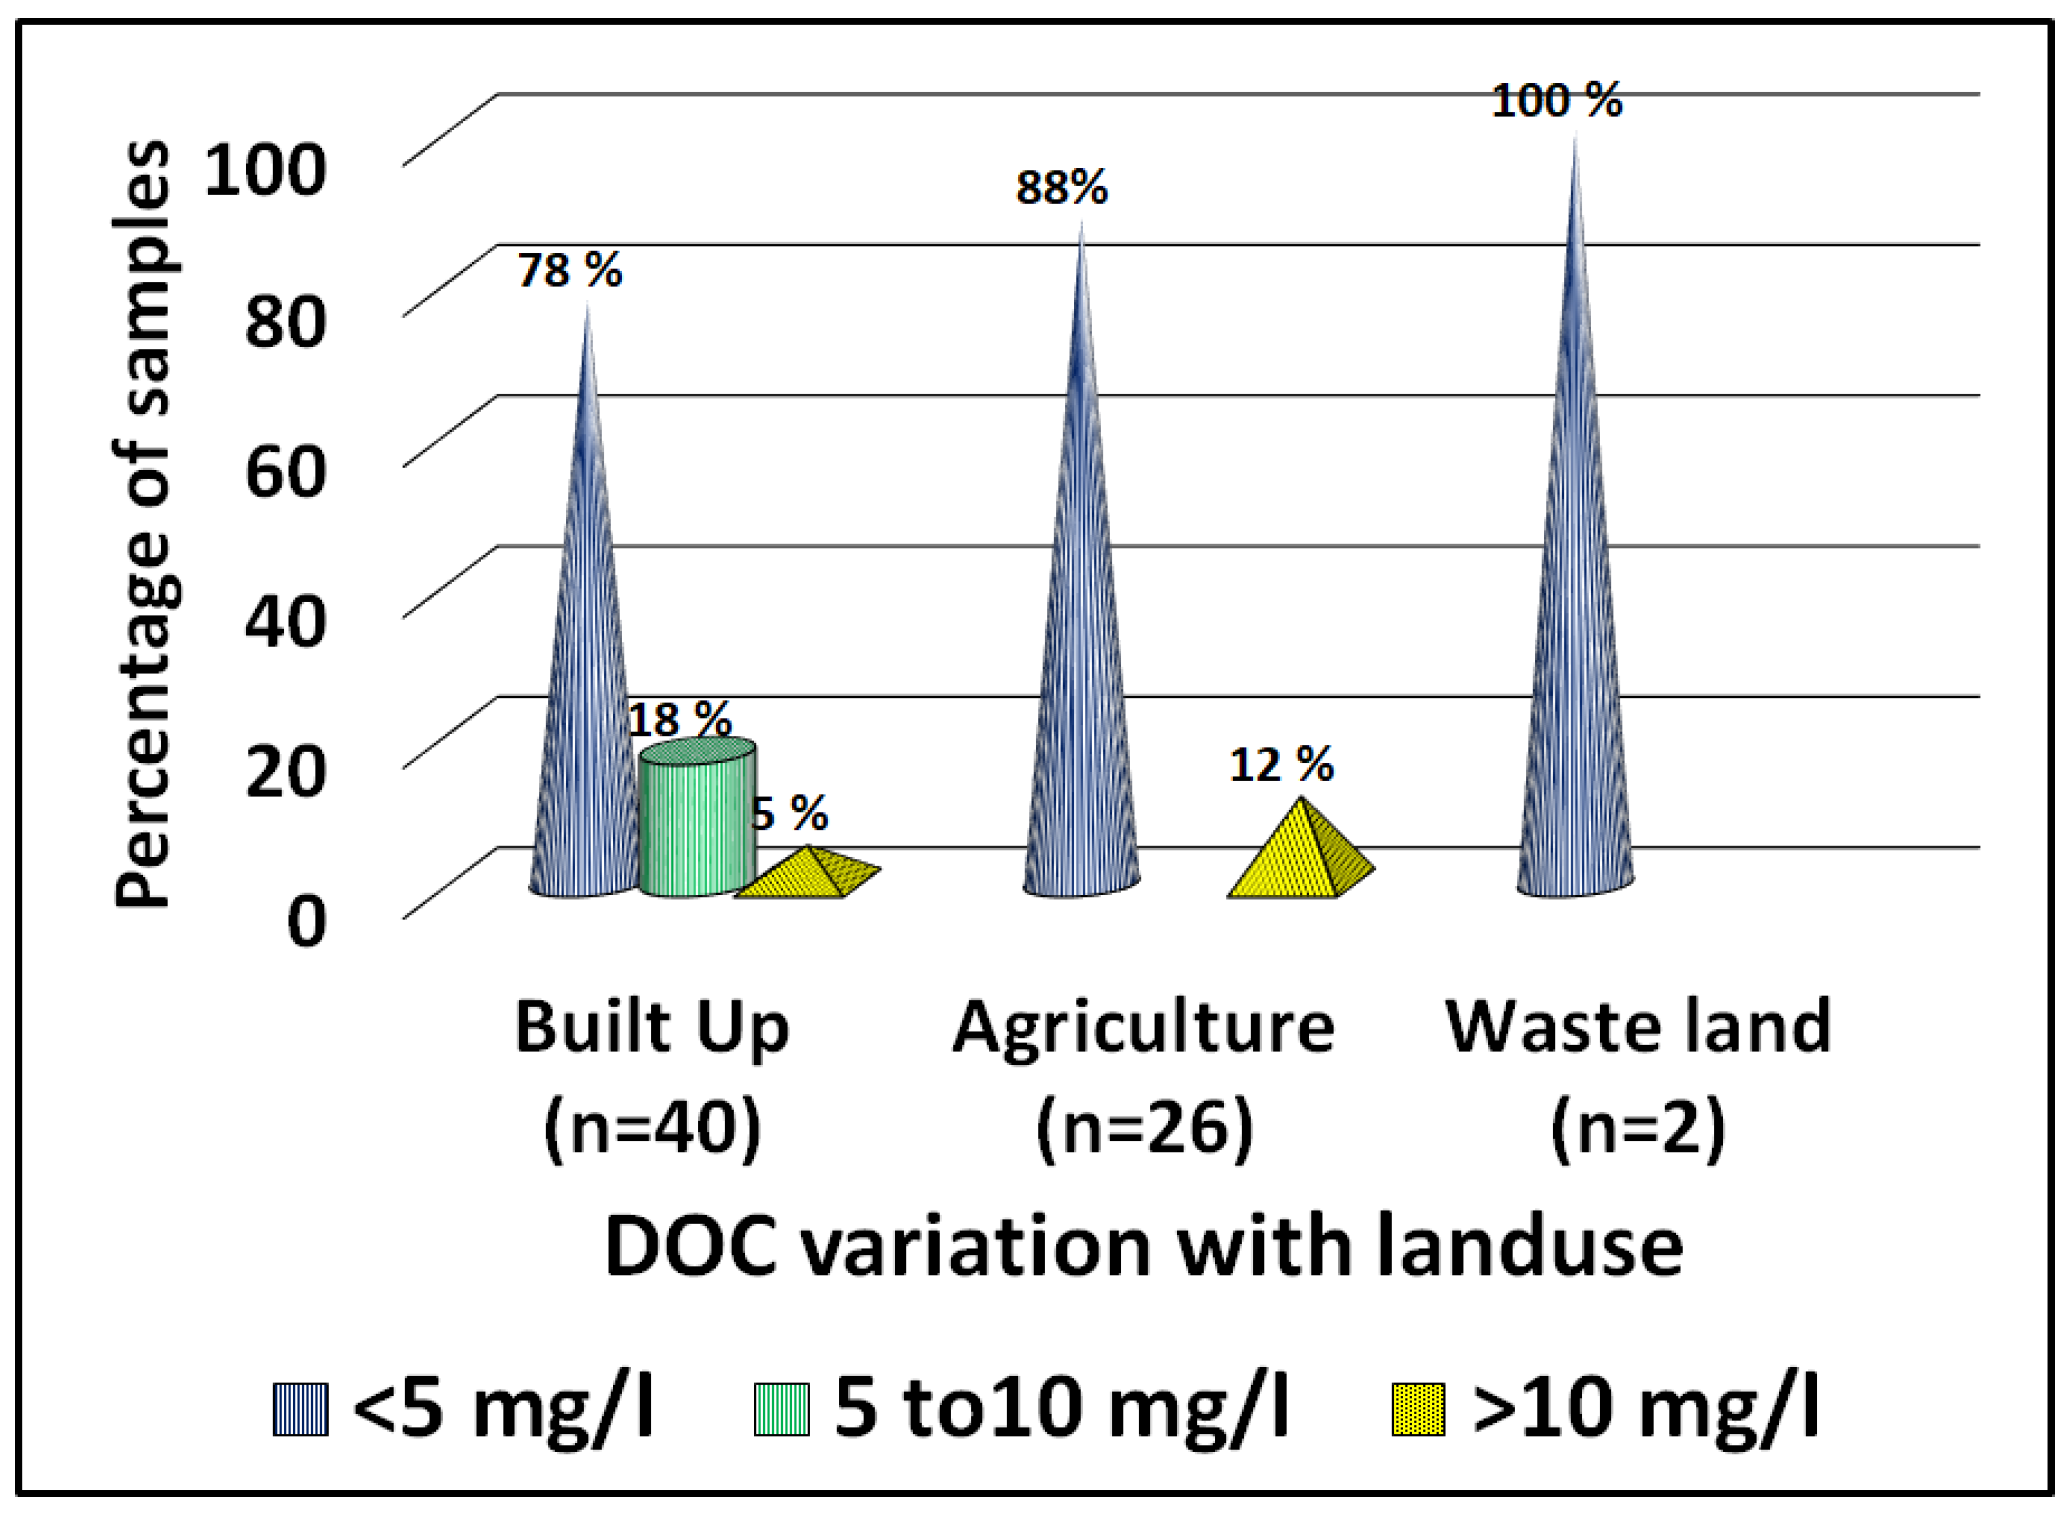
4.6. Representation of DOC on Land Use
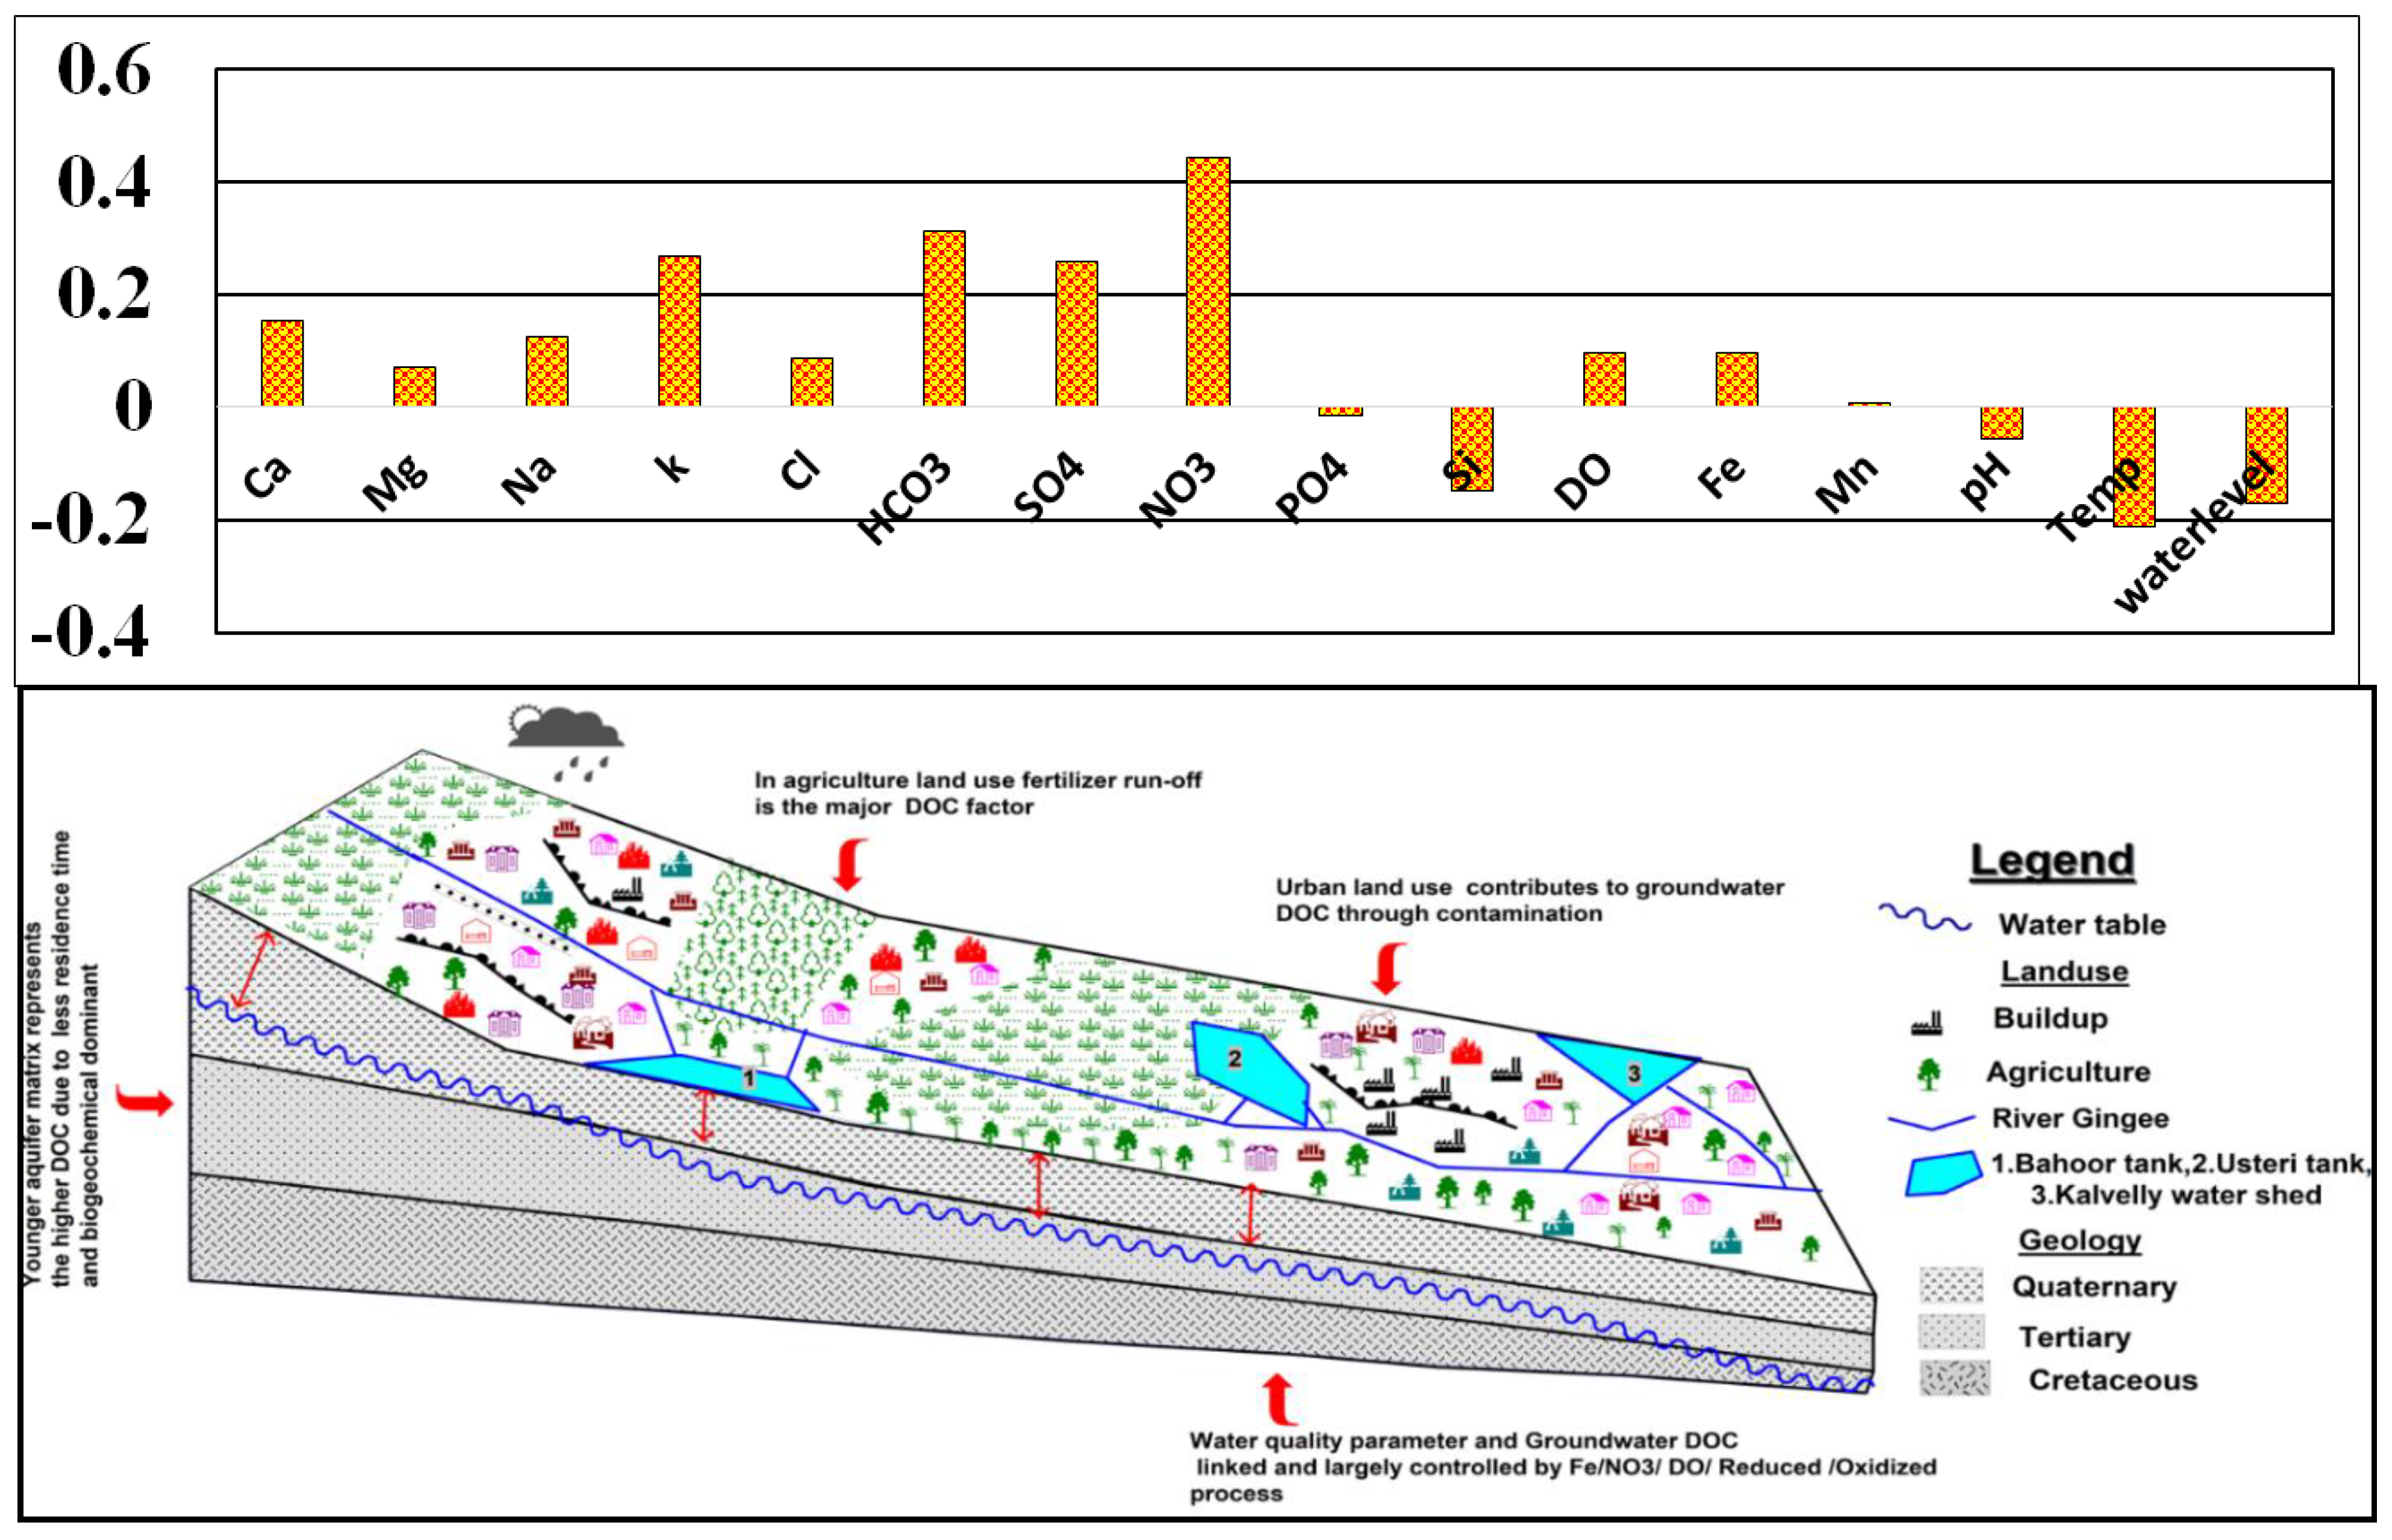
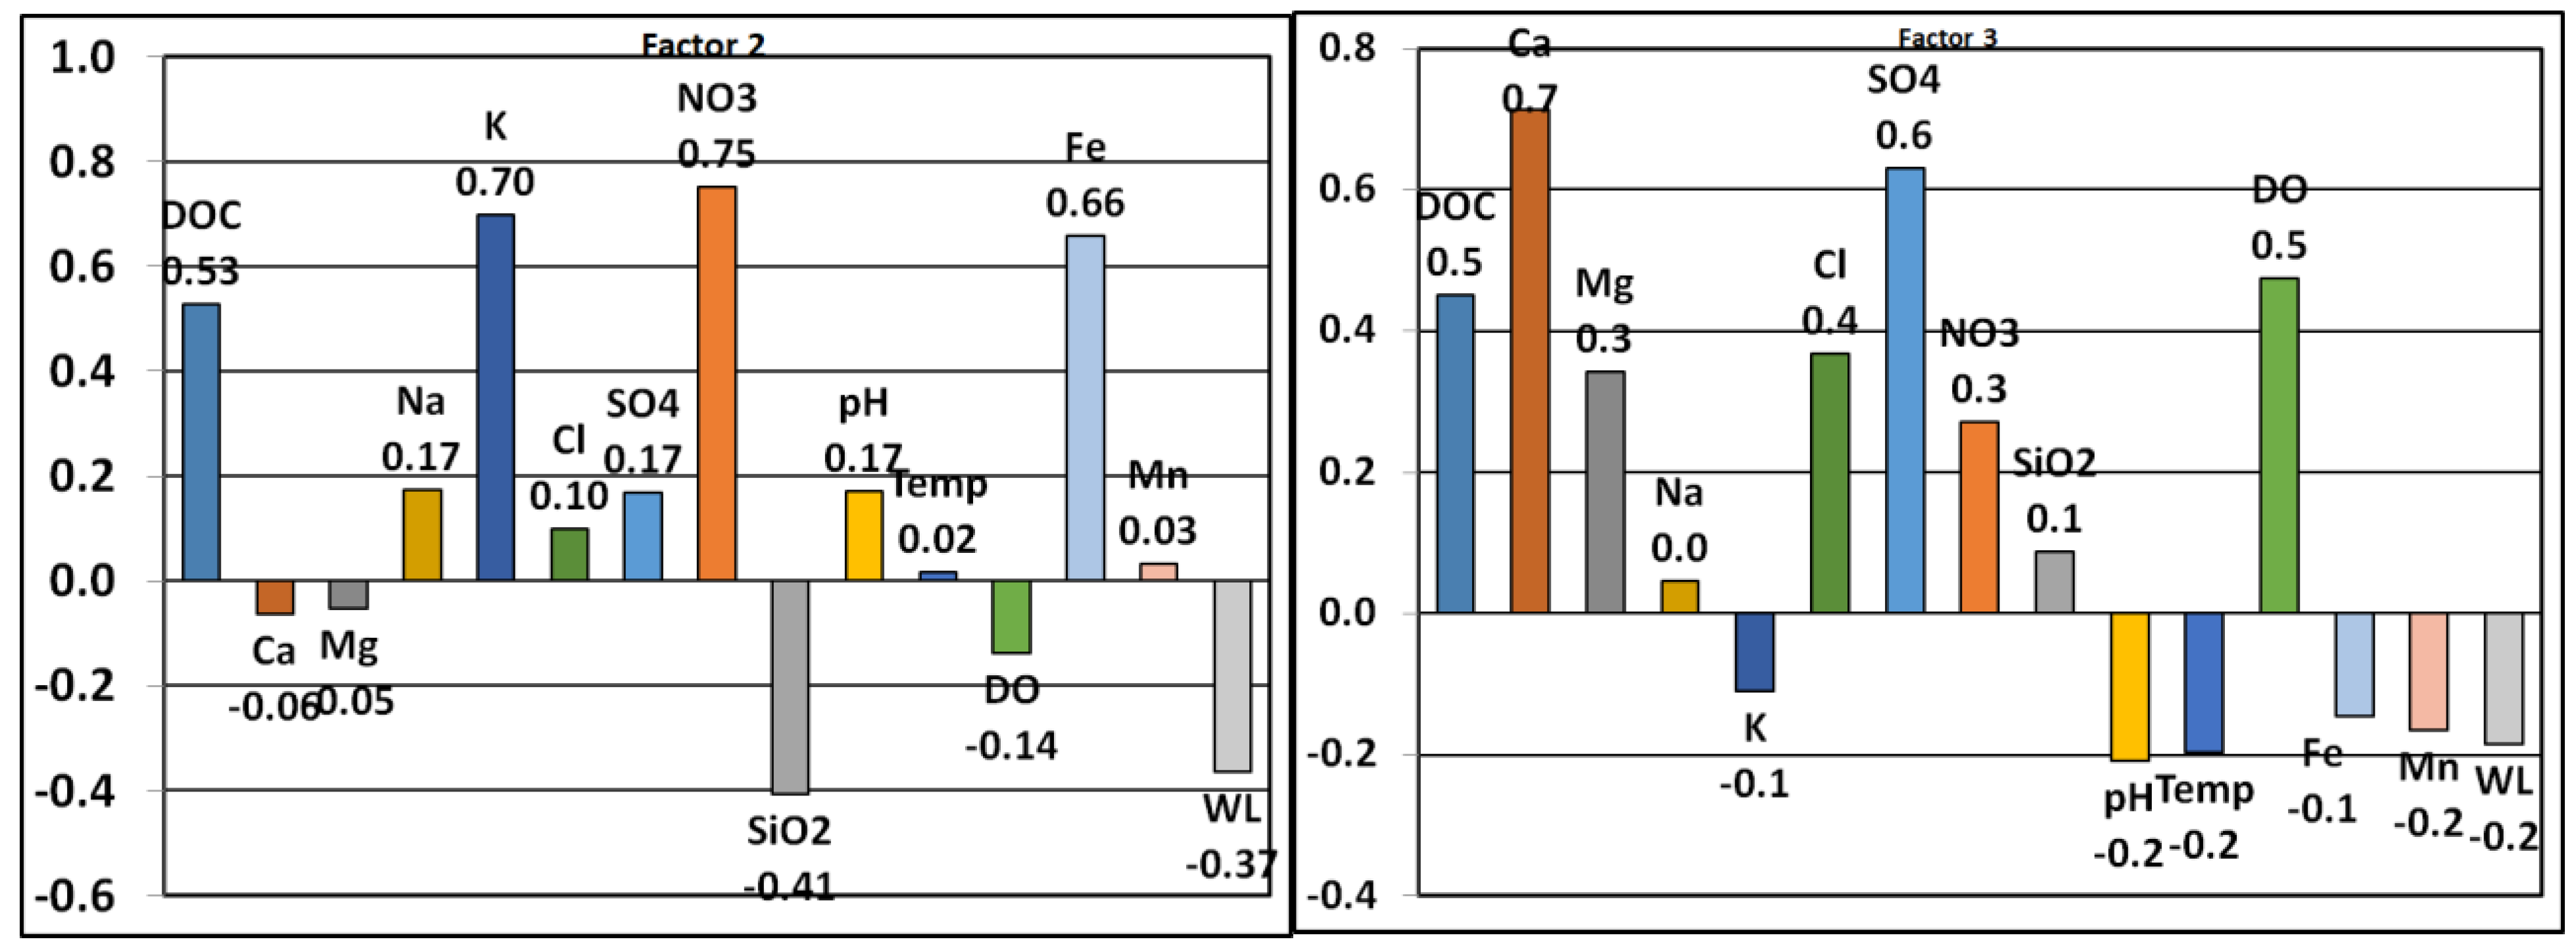
4.7. Groundwater-Dissolved Organic Carbon Controls
5. Conclusions
Supplementary Materials
Author Contributions
Funding
Institutional Review Board Statement
Informed Consent Statement
Data Availability Statement
Conflicts of Interest
References
- Evans, S.; Campbell, C.; Naidenko, O.V. Cumulative risk analysis of carcinogenic contaminants in United States drinking water. Heliyon 2019, 5, e02314. [Google Scholar] [CrossRef] [PubMed] [Green Version]
- Findlay, S.; Sinsabaugh, R.L. Unravelling the sources and bioavailability of dissolved organic matter in lotic aquatic ecosystems. Mar. Freshw. Res. 1999, 50, 781–790. [Google Scholar] [CrossRef]
- Sadiq, R.; Rodriguez, M.J. Disinfection by-products (DBPs) in drinking water and predictive models for their occurrence: A review. Sci. Total Environ. 2004, 321, 21–46. [Google Scholar] [CrossRef] [PubMed]
- Lawson, M.; Polya, D.A.; Boyce, A.J.; Bryant, C.; Ballentine, C.J. Tracing organic matter composition and distribution and its role on arsenic release in shallow Cambodian groundwaters. Geochim. Cosmochim. Acta 2016, 178, 160–177. [Google Scholar] [CrossRef]
- Fleck, J.A.; Bossio, D.A.; Fujii, R. Dissolved organic carbon and disinfection by-product precursor release from managed peat soils. J. Environ. Qual. 2004, 33, 465–475. [Google Scholar] [CrossRef]
- Bauer, M.; Blodau, C. Mobilization of arsenic by dissolved organic matter from iron oxides, soils and sediments. Sci. Total Environ. 2006, 354, 179–190. [Google Scholar] [CrossRef]
- Leenheer, J.A. Occurrence of dissolved organic carbon in selected groundwater samples in the United States. U.S. Geol. Surv. J. Res. 1974, 2, 361–369. [Google Scholar]
- Thurman, E.M. Organic Geochemistry of Natural Waters; Martinus Nijhoff/DR W. Junk Publishers: Dordrecht, The Netherlands, 1985; p. 497. [Google Scholar]
- Aiken, G. Organic matter in ground water. In U.S. Geological Survey Open File; Report 02–89; USGS: Reston, VA, USA, 1989; p. 7. [Google Scholar]
- McMahon, P.B.; Chapelle, F.H. Redox processes and the water quality of selected principal aquifer systems. Groundwater 2008, 46, 259–285. [Google Scholar] [CrossRef]
- Tesoriero, A.J.; Puckett, L.J. O2 reduction and denitrification rates in shallow aquifers. Water Resour. Res. 2011, 47, W12522. [Google Scholar] [CrossRef]
- Boyer, E.W.; Hornberger, G.M.; Bencala, K.E.; McKnight, D.M. Response characteristics of DOC flushing in an alpine catchment. Hydrol. Process. 1998, 11, 1635–1647. [Google Scholar] [CrossRef]
- Baker, M.A.; Valett, H.M.; Dahm, C.N. Organic carbon supply and metabolism in a shallow groundwater ecosystem. Ecology 2000, 81, 3133–3148. [Google Scholar] [CrossRef]
- McMahon, P.B.; Chapelle, F.H. Microbial production of organic acids in aquitard sediments and its role in aquifer geochemistry. Nature 1991, 349, 233–235. [Google Scholar] [CrossRef]
- Chapelle, F.H. Dissolved Organic Carbon in Groundwater Systems; The Groundwater Project: Guelph, ON, Canada, 2022. [Google Scholar] [CrossRef]
- Davidson, E.A.; Janssens, I.A. Temperature sensitivity of soil carbon decomposition and feedbacks to climate change. Nature 2006, 440, 165–173. [Google Scholar] [CrossRef] [Green Version]
- Jenkinson, D.S.; Adams, D.E.; Wild, A. Model estimates of CO2 emissions from soil in response to global warming. Nature 1991, 351, 304–306. [Google Scholar] [CrossRef]
- Maghrebi, M.; Noori, R.; Partani, S.; Araghi, A.; Barati, R.; Farnoush, H.; Haghighi, A.T. Iran’s Groundwater Hydrochemistry. Earth Space Sci. 2021, 8, 8. [Google Scholar] [CrossRef]
- Maghrebi, M.; Noori, R.; Sadegh, M.; Sarvarzadeh, F.; Akbarzadeh, A.E.; Karandish, F.; Barati, R.; Taherpour, H. Anthropogenic Decline of Ancient, Sustainable Water Systems: Qanats. Ground Water 2022, 61, 1. [Google Scholar] [CrossRef]
- Foster, S.S.D.; Chilton, P.J. Groundwater: The processes and global significance of aquifer degradation. Philos. Trans. R. Soc. Lond. Ser. B 2003, 358, 1957–1972. [Google Scholar] [CrossRef] [Green Version]
- Harvey, C.F.; Swartz, C.H.; Badruzzaman, A.B.M.; Keon-Blute, N.; Yu, W.; Ali, M.A.; Jay, J.; Beckie, R.; Niedan, V.; Ahmed, M.F.; et al. Arsenic mobility and groundwater extraction in Bangladesh. Science 2002, 298, 1602. [Google Scholar] [CrossRef] [Green Version]
- Goñi, M.A.; Gardner, I.R. Seasonal dynamics in dissolved organic carbon concentrations in a coastal water-table aquifer at the forest marsh interface. Aquat. Geochem. 2003, 9, 209–232. [Google Scholar] [CrossRef]
- Shen, Y.; Hetal, C.F. Origins and bioavailability of dissolved organic matter in groundwater. Biogeochemistry 2015, 122, 61–78. [Google Scholar] [CrossRef]
- Thayalakumaran, T.; Bristow, K.L.; Charlesworth, P.B.; Fass, T. Geochemical conditions in groundwater systems: Implications for the attenuation of agricultural nitrate. Agric. Water Manag. 2008, 95, 103–115. [Google Scholar] [CrossRef]
- Chapelle, F.H.; Bradley, P.M.; Journey, C.A.; McMahon, P.B. Assessing the relative bioavailability of DOC in regional groundwater systems. Groundwater 2013, 51, 363–372. [Google Scholar] [CrossRef] [PubMed]
- Thayalakumaran, T.; Lenahan, M.J.; Bristow, K.L. Dissolved organic carbon in groundwater overlain by irrigated sugarcane. Groundwater 2015, 53, 525–530. [Google Scholar] [CrossRef] [PubMed]
- Rivett, M.O.; Buss, S.R.; Morgan, P.; Smith, J.W.N.; Bemment, D.C. Nitrate attenuation in groundwater: A review of biogeochemical controlling processes. Water Res. 2008, 42, 4215–4232. [Google Scholar] [CrossRef] [PubMed]
- McDonough, L.K.; Santos, I.R.; Andersen, M.S.; O’Carroll, D.M.; Rutlidge, H.; Meredith, K.; Oudone, P.; Bridgeman, J.; Gooddy, D.C.; Sorensen, J.P.R.; et al. Changes in global groundwater organic carbon driven by climate change and urbanization. Nat. Commun. 2020, 11, 1–10. [Google Scholar] [CrossRef] [PubMed] [Green Version]
- Kalbitz, K.; Solinger, J.H.; Park, B.; Michalzik, B.; Matzner, E. Controls on the dynamics of dissolved organic matter in soils: A review. Soil Sci. 2000, 165, 277–304. [Google Scholar] [CrossRef]
- Blondin, F.; Simon, L.; Maazouzi, C.; Foulquier, A.; Delolme, C.; Marmonier, P. Dynamics of dissolved organic carbon (DOC) through stormwater basins designed for groundwater recharge in urban area: Assessment of retention efficiency. Water Res. 2015, 81, 27–37. [Google Scholar] [CrossRef]
- Artinger, R.; Buckau, G.; Geyer, S.; Fritz, P.; Wolf, M.; Kim, J.I. Characterization of groundwater humic substances: Influence of sedimentary organic carbon. Appl. Geochem. 2000, 15, 97–116. [Google Scholar] [CrossRef]
- Raymond, M.F.; Mallèn, G.; Engel, M.; Ahmed, A.; Rossi, P. Characterizing aquifer heterogeneity using bacterial and bacteriophage tracers. J. Environ. Qual. 2015, 44, 1448–1458. [Google Scholar]
- Thilagavathi, R.; Chidambaram, S.; Prasanna, M.V.; Thivya, C.; Singaraja, C. A study on groundwater geochemistry and water quality in layered aquifers system of Pondicherry region, southeast India. Appl. Water Sci. 2012, 2, 253–269. [Google Scholar] [CrossRef] [Green Version]
- Sridharan, M.; Senthil Nathan, D. Hydrochemical Facies and Ionic Exchange in Coastal Aquifers of Puducherry Region, India: Implications for Seawater Intrusion. Earth Syst. Environ. 2017, 1, 5. [Google Scholar] [CrossRef]
- Thilagavathi, R.; Chidambaram, S.; Thivya, C.; Tirumalesh, K.; Venkatramanan, S.; Pethaperumal, S.; Prasanna, M.V.; Ganesh, N. Influence of variations in rainfall pattern on the hydrogeochemistry of coastal groundwater—An outcome of periodic observation. Environ. Sci. Pollut. Res. 2019, 26, 29173–29190. [Google Scholar] [CrossRef]
- Thilagavathi, R.; Chidambaram, S.; Thivya, C.; Prasanna, M.V.; Tirumalesh, K.; Pethaperumal, S. Assessment of groundwater chemistry in layered coastal aquifers using multivariate statistical analysis. Sustain. Water Resour. Manag. 2017, 3, 55–69. [Google Scholar] [CrossRef]
- Chidambaram, S.; Prasanna, M.V.; Karmegam, U.; Singaraja, C.; Pethaperumal, S.; Manivannan, R.; Anandhan, P.; Tirumalesh, K. Significance of pCO2 values in determining carbonate chemistry in groundwater of Pondicherry region, India. Front. Earth Sci. 2011, 5, 197–206. [Google Scholar] [CrossRef]
- Thilagavathi, R.; Chidambaram, S.; Thivya, C.; Prasanna, M.V.; Singaraja, C.; Tirumalesh, K.; Pethaperumal, S. Delineation of natural and anthropogenic process controlling hydrogeochemistry of layered aquifer sequence. Proc. Natl. Acad. Sci. USA 2014, 84, 95–108. [Google Scholar] [CrossRef]
- Thilagavathi, R.; Chidambaram, S.; Thivya, C.; Prasanna, M.V.; Pethaperuamal, S.; Tirumalesh, K. A Study on the Behaviour of Total Carbon and Dissolved Organic Carbon in Groundwaters of Pondicherry Region, India. Int. J. Earth Sci. Eng. 2014, 7, 1537–1550. [Google Scholar]
- Pethaperumal, S.; Chidambaram, S.; Prasanna, M.V.; Verma, V.N.; Balaji, K.; Ramesh, R.; Karmegam, P.; Paramaguru, U. A study on groundwater quality in the Pondicherry region. EcoChronicle 2008, 3, 85–90. [Google Scholar]
- Tirumalesh, K.; Ramakumar, K.L.; Prasad, M.B.K.; Chidambaram, S.; PethaPerumal, S.; Prakash, D.; Nawani, N. Microbial evaluation of groundwater and its implications on redox condition of a multi-layer sedimentary aquifer system. Environ. Process. 2015, 2, 331.e346. [Google Scholar] [CrossRef] [Green Version]
- Pethaperumal, S. Study on Groundwater Chemistry in the Pondicherry Region. Ph.D. Thesis, Annamalai University, Tamil Nadu, India, October 2010. [Google Scholar]
- Thilagavathi, R.; Chidambaram, S.; Thivya, C.; Prasanna, M.V.; Tirumalesh, K.; Pethaperuamal, S. Dissolved Organic Carbon in Multilayered Aquifers of Pondicherry Region (India): Spatial and Temporal Variability and Relationships to Major Ion Chemistry. Nat. Resour. Res. 2017, 26, 119–135. [Google Scholar] [CrossRef]
- Regan, S.; Hynds, P.; Flynn, R. An overview of dissolved organic carbon in groundwater and implications for drinking water safety. Hydrogeol. J. 2017, 25, 959–967. [Google Scholar] [CrossRef]
- Christensen, J.B.; Jensen, D.L.; Christensen, T.H. Effect of dissolved organic carbon on the mobility of cadmium, nickel and zinc in leachate polluted groundwater. Water Res. 1996, 30, 3037–3049. [Google Scholar] [CrossRef]
- Fujita, Y.; Ding, W.-H.; Reinhard, M. Identification of wastewater dissolved organic carbon characteristics in reclaimed wastewater and recharged groundwater. Water Environ. Res. 1996, 68, 867–876. [Google Scholar] [CrossRef]
- Makehelwala, M.; Wei, Y.; Weragoda, S.K.; Weerasooriya, R.; Zheng, L. Characterization of dissolved organic carbon in shallow groundwater of chronic kidney disease affected regions in Sri Lanka. Sci. Total Environ. 2018, 660, 865–875. [Google Scholar] [CrossRef] [PubMed]
- Makehelwala, M.; Wei, Y.; Weragoda, S.K.; Weerasooriya, R. Ca2+ and SO42− interactions with dissolved organic matter: Implications of groundwater quality for CKDu incidence in Sri Lanka. J. Environ. Sci. 2020, 88, 326–337. [Google Scholar] [CrossRef] [PubMed]
- Ramesh, R.; Purvaja, R.; Senthilvel, A. National assessment of shoreline change: Puducherry coast. In NCSCM/MoEF Report; NCSCM: Chennai, India, 2011; pp. 1–57. [Google Scholar]
- Mani Murali, R.; Ankita, M.; Amrita, S.; Vethamony, P. Coastal vulnerability assessment of Puducherry coast, India using analytical hierarchical process. Nat. Hazards Earth Syst. Sci. 2013, 1, 509–555. [Google Scholar] [CrossRef] [Green Version]
- Thilagavathi, R.; Chidambaram, S.; Ramanatahan, A.L.; Rao, M.S.; Prasanna, M.V.; Tirumalesh, K.; Pethaperumal, S. An attempt to evaluate the influence of geomorphology on the hydrogeology of coastal aquifer. Ind. J. Geomorphol. 2013, 18, 103–114. [Google Scholar]
- Bhuvan Statistical Data WMS. Available online: https://bhuvan-ras2.nrsc.gov.in/cgi-bin/LULC250K.exe (accessed on 25 March 2019).
- Thilagavathi, R.; Chidambaram, S.; Prasanna, M.V.; Pethaperumal, S. A study on the interpretation of spontaneous potential and resistivity logs in layered aquifer sequence of Pondicherry Region, South India. Arab. J. Geosci. 2013, 7, 3715–3729. [Google Scholar] [CrossRef]
- CGWB. Ground Water Resources and Development Prospects in Pondicherry Region; CGWB: Pondicherry, India, 1993.
- American Public Health Associated—APHA. Standard Methods for the Examination of Water and Wastewater, 19th ed.; APHA: Washington, DC, USA, 1998.
- Chan, C.C.; Lam, H.; Zhang, X.-M. Practical Approaches to Method Validation and Essential Instrument Qualification; Wiley: Hoboken, NJ, USA, 2010. [Google Scholar]
- Reckhow, D.A. Analysis of Total Organic Carbon TOC SOP ver3; University of Massachusetts, Environmental Engineering Research Laboratory: Amherst, MA, USA, 2012. [Google Scholar]
- Hounslow, A.W. Water Quality Data: Analysis and Interpretation; CRC Lewis: Boca Raton, FL, USA, 1995; p. 397. [Google Scholar]
- Technical support document for ontario drinking water standards. In Objectives and Guidelines; Ministry of the Environment: Ottawa, ON, Canada, 2003; ISBN 4449e01.
- Richardson, S.D. Encyclopedia of Environmental Analysis and Remediation; Wiley: New York, NY, USA, 1998; pp. 1398–1421. [Google Scholar]
- Amy, G.L.; Tan, L.; Davis, M.K. The effects of ozonation and activated carbon adsorption on trihalomethane speciation. Water Res. 1991, 25, 191–202. [Google Scholar] [CrossRef]
- Pan, Y.; Zhang, X. Four groups of new aromatic halogenated disinfection byproducts: Effect of bromide concentration on their formation and speciation in chlorinated drinking water. Environ. Sci. Technol. 2013, 47, 1265–1273. [Google Scholar] [CrossRef]
- Chapelle, F.H.; Bradley, P.B.; Kaiser, M.K.; Benner, R. Dissolved oxygen as an indicator of bioavailable dissolved organic carbon in groundwater. Groundwater 2012, 50, 230–241. [Google Scholar] [CrossRef]
- Foulquier, A.; Malard, F.; Mermillod-Blondin, F.; Datry, T.; Simon, L.; Montuelle, B.; Gilbert, J. Vertical change in dissolved organic carbon and oxygen at the water table region of an aquifer recharged with storm water: Biological uptake or mixing? Biogeochemistry 2010, 99, 31–47. [Google Scholar] [CrossRef]
- Hinke, S.R.; Tesoriero, A.J. Nitrogen speciation and trends, and prediction of denitrification extent, in shallow US groundwater. J. Hydrol. 2013, 509, 343–353. [Google Scholar] [CrossRef]
- Hunt, C.D., Jr. Ground-water quality and its relation to land use on Oahu, Hawaii, 2000–2001. In Water-Resources Investigations Report 2004, 03-4305; USGS: Reston, VA, USA, 2004; p. 76. [Google Scholar]
- McMahon, P.B.; Chapelle, F.H.; Bradley, P.M. Evolution of redox processes in groundwater. In Aquatic Redox Processes; Tratnyek, P.G., Grundl, T.J., Haderlein, S.B., Eds.; ACS Symposium Series; American Chemical Society: Washington, DC, USA, 2011; Volume 1071.6. [Google Scholar]
- Weymann, D.; Well, R.; Flessa, H.; von der Heide, C.; Deurer, M.; Meyer, K.; Konrad, C.; Walther, W. Groundwater N2O emission factors of nitrate-contaminated aquifers as derived from denitrification progress and N2O accumulation. Biogeosciences 2008, 5, 1215–1226. [Google Scholar] [CrossRef] [Green Version]
- Chapelle, F.H.; Bradley, P.M.; Dan, J.G.; Tiedeman, P.J.; Lacombe, K.; Kaiser, K.; Benner, R. Biochemical indicators for the bioavailability of organic carbon in ground water. Groundwater 2008, 47, 108–121. [Google Scholar] [CrossRef]
- Grieve, I.C. Seasonal, hydrological, and land management factors controlling dissolved organic carbon concentrations in the loch fleet catchments, Southwest Scotland. Hydrol. Process 1990, 4, 231–239. [Google Scholar] [CrossRef]
- Harvey, J.W.; Fuller, C.C. Effect of enhanced manganese oxidation in the hyporheic zone on basin-scale geochemical mass balance. Water Resour. Res. 1998, 34, 623–636. [Google Scholar] [CrossRef] [Green Version]
- Tipping, E.; Reddy, M.M.; Hurley, M.A. Modeling electrostatic and heterogeneity effects on proton dissociation from humic substances. Environ. Sci. Technol. 1990, 24, 1700–1705. [Google Scholar] [CrossRef]
- BIS. Indian Standard Specifications for Drinking Water 2012; BIS: New Delhi, India, 2012.
- Bone, S.E.; Charette, M.A.; Lamborg, C.H.; Gonneea, M.E. Has submarine groundwater discharge been overlooked as a source of mercury to coastal waters. Environ. Sci. Technol. 2012, 41, 3090–3095. [Google Scholar] [CrossRef]
- Black, F.J.; Paytan, A.; Knee, K.L.; Sieyes, N.R.; Gangull, P.M.; Gray, E.; Flegal, R. Submarine groundwater discharge of total mercury and monomethyl mercury to central California coastal waters. Environ. Sci. Technol. 2009, 43, 5652–5659. [Google Scholar] [CrossRef]
- Appelo, C.; Postma, D. Geochemistry. In Groundwater and Pollution, 2nd ed.; Balkema: Rotterdam, The Netherlands, 2005. [Google Scholar]
- Nakayama, F.S.; Bucks, D.A. Water quality in drip/trickle irrigation: A review. Irrig. Sci. 1991, 12, 187–192. [Google Scholar] [CrossRef]
- Chapelle, F.H. Ground-Water Microbiology and Geochemistry; John Wiley & Sons: New York, NY, USA, 2001; p. 496. [Google Scholar]
- Hamilton, W.A. Microbially influenced corrosion as a model system for the study of metal microbe interactions: A unifying electron transfer hypothesis. Biofouling 2003, 19, 65–76. [Google Scholar] [CrossRef] [PubMed]
- Buss, S.R.; Rivett, M.O.; Morgan, P.; Bemment, C.D. Attenuation of nitrate in the subsurface environment. In Environment Agency Science Group Report; Environment Agency of England and Water Science: Bristol, UK, 2005; Report SC030155/2. [Google Scholar]
- Jacinthe, P.A.; Groffman, P.M.; Gold, A.J. Landscape and watershed processes—Dissolved organic carbon dynamics in a riparian aquifer: Effects of hydrology and nitrate enrichment. J. Environ. Qual. 2003, 32, 1365–1374. [Google Scholar] [CrossRef] [PubMed]
- Evans, C.; Futter, M.; Moldan, F.; Valinia, S.; Frogbrook, Z.; Kothawala, D. Variability in organic carbon reactivity across lake residence time and trophic gradients. Nat. Geosci. 2017, 10, 832. [Google Scholar] [CrossRef] [Green Version]
- Shen, Y.H. Sorption of natural dissolved organic matter on soil. Chemosphere 1999, 38, 1505–1515. [Google Scholar] [CrossRef]
- MacDonald, A.M.; Dochartaigh, B.E.; Smedley, P.L. Baseline Groundwater Chemistry in Scotland’s Aquifers (OR/17/030); British Geological Survey: London, UK, 2017; pp. 1–77. [Google Scholar]
- Weissmann, G.S.; Zhang, Y.; LaBolle, E.M.; Fogg, G.E. Dispersion of groundwater age in an alluvial aquifer system. Water Resour. Res. 2002, 38, 16–1116-13. [Google Scholar] [CrossRef] [Green Version]
- Lilienfein, J.; Qualls, R.G.; Uselman, S.M.; Bridgham, S.D. Adsorption of dissolved organic carbon and nitrogen in soils of a weathering chronosequence. Soil Sci. 2004, 68, 292–305. [Google Scholar] [CrossRef] [Green Version]
- Jardine, P.M.; Mayes, M.A.; Mulholland, P.J.; Hanson, P.J.; Tarver, J.R.; Luxmore, R.J.; McCarthy, J.F.; Wilson, G.V. Vadose zone flow and transport of dissolved organic carbon at multiple scales in humid regions. Vadose Zone J. 2006, 5, 140–152. [Google Scholar] [CrossRef] [Green Version]
- Lapworth, D.; Nkhuwa, D.; Okotto-Okotto, J.; Pedley, S.; Stuart, M.; Tijani, M.; Wright, J. Urban groundwater quality in sub-Saharan Africa: Current status and implications for water security and public health. Hydrogeol. J. 2017, 25, 1093–1116. [Google Scholar] [CrossRef] [Green Version]
- Lapworth, D.J.; Gooddy, D.C.; Butcher, A.S.; Morris, B.L. Tracing groundwater flow and sources of organic carbon in sandstone aquifers using fluorescence properties of dissolved organic matter (DOM). Appl. Geochem. 2008, 23, 3384–3390. [Google Scholar] [CrossRef] [Green Version]
- Utton, A.E. The development of international groundwater law. Nat. Resour. J. 1982, 22, 95–118. [Google Scholar]
- Johnson, L.; Richards, C.; Host, G.; Arthur, J. Landscape influences on water chemistry in Midwestern stream ecosystems. Freshw. Biol. 1997, 37, 193–208. [Google Scholar] [CrossRef]
- Meierdiercks, K.L.; Kolozsvary, M.B.; Rhoads, K.P.; Golden, M.; McCloskey, N.F. The role of land surface versus drainage network characteristics in controlling water quality and quantity in a small urban watershed. Hydrol. Process. 2017, 31, 4384–4397. [Google Scholar] [CrossRef]
- Lawrence, A.; Gooddy, D.; Kanatharana, P.; Meesilp, W.; Ramnarong, V.J.H.J. Groundwater evolution beneath Hat Yai, a rapidly developing city in Thailand. Hydrogeol. J. 2000, 8, 564–575. [Google Scholar]
- Chapelle, F.H. Groundwater Microbiology and Biochemistry; Wiley: New York, NY, USA, 1993. [Google Scholar]
- Anandhan, P.; Ramanathan, A.L.; Chidambaram, S.; Manivannan, R.; Ganesh, N.; Srinivasamoorthy, K. A study on the seasonal variation in the geochemistry of the groundwater in and around Neyveli region, Tamilnadu. In Proceedings of the International Conference on Hydrogeochemistry, Tamil Nadu, India; 2000. [Google Scholar]
- Noori, R.; Maghrebi, M.; Jessen, S.; Bateni, S.M.; Heggy, E.; Javadi, S.; Nouri, M.; Pistre, S.; Abolfathi, S.; AghaKouchak, A. Decline in Iran’s Groundwater Recharge—Preprint (Version 1), Research Square. 2023. Available online: https://doi.org/10.21203/rs.3.rs-2608948/v1 (accessed on 5 April 2020).
- Singaraja, C.; Chidambaram, S.; Jacob, N.; Selvam, S.; Prasanna, M.V. Tidal effects on groundwater dynamics in shallow coastal aquifers—Southeast coast of Tamilnadu, India. Arab. J. Geosci. 2016, 6, 1–19. [Google Scholar] [CrossRef]
- Salmani, H.; Javadi, S.; Eini, M.R.; Golmohammadi, G. Compilation simulation of surface water and groundwater resources using the SWAT-MODFLOW model for a karstic basin in Iran. Hydrogeol. J. 2023. [Google Scholar] [CrossRef]


| Era | Period | Transmissivity Value (m2/day) | Storage Coefficient | Specific Yield Prospects (CU.M/D) | The Depth of Tube Wells (mbgl) | Thickness of These Aquifers (m) | Groundwater Condition |
|---|---|---|---|---|---|---|---|
| Cenozoic | Quaternary | 275–770 | - | <200 | 25–50 | 5 to 34 | Unconsolidated, Unconfined |
| Tertiary | 1000–2000 | 9.58 × 10⁻⁵ and 8.9 × 10⁻⁴. | 1000–2000 | 25–350 | 20 to 245 | Unconsolidated, Mainly Confined some patches as unconfined | |
| Mesozoic | Cretaceous | 100–2000 | 2.93 × 10⁻⁵ to 1.36 × 10⁻⁴ | 700–800 | 65–400 | 38 to 92 | Unconsolidated, Mainly Confined some patches as unconfined |
| Archaean | <1–15 | 100–200 | 10–15 | Consolidated, Occur as unconfined aquifer in weathered mantle and semi confined to confined aquifer in fractures |
| Parameters | Minimum | Maximum | Average |
|---|---|---|---|
| Well Depth (m) | 13.5 | 150.00 | 57.93 |
| pH | 5.2 | 9.5 | 6.79 |
| Temp (°C) | 29.1 | 33.6 | 31.01 |
| Ca (mg/L) | 16 | 124 | 63.12 |
| Mg (mg/L) | 2.4 | 84 | 22.72 |
| Na (mg/L) | 42.7 | 394.3 | 189.33 |
| K (mg/L) | 1.7 | 247.8 | 28.02 |
| HCO3 (mg/L) | 73.2 | 597.8 | 320.49 |
| Cl (mg/L) | 68.63 | 514.03 | 249.64 |
| SO4 (mg/L) | 0.03 | 0.99 | 0.52 |
| NO3 (mg/L) | BDL * | 184.16 | 16.2 |
| PO4 (mg/L) | BDL | 17.98 | 0.79 |
| Si (mg/L) | 33 | 258 | 143.15 |
| DO (mg/L) | 1.55 | 5.21 | 3.59 |
| DOC (mg/L) | 0.49 | 28.92 | 3.29 |
| Fe (mg/L) | BDL | 5.02 | 0.36 |
| Mn (mg/L) | BDL | 0.37 | 0.06 |
Disclaimer/Publisher’s Note: The statements, opinions and data contained in all publications are solely those of the individual author(s) and contributor(s) and not of MDPI and/or the editor(s). MDPI and/or the editor(s) disclaim responsibility for any injury to people or property resulting from any ideas, methods, instructions or products referred to in the content. |
© 2023 by the authors. Licensee MDPI, Basel, Switzerland. This article is an open access article distributed under the terms and conditions of the Creative Commons Attribution (CC BY) license (https://creativecommons.org/licenses/by/4.0/).
Share and Cite
Rajendiran, T.; Sabarathinam, C.; Panda, B.; Elumalai, V. Influence of Dissolved Oxygen, Water Level and Temperature on Dissolved Organic Carbon in Coastal Groundwater. Hydrology 2023, 10, 85. https://doi.org/10.3390/hydrology10040085
Rajendiran T, Sabarathinam C, Panda B, Elumalai V. Influence of Dissolved Oxygen, Water Level and Temperature on Dissolved Organic Carbon in Coastal Groundwater. Hydrology. 2023; 10(4):85. https://doi.org/10.3390/hydrology10040085
Chicago/Turabian StyleRajendiran, Thilagavathi, Chidambaram Sabarathinam, Banajarani Panda, and Vetrimurugan Elumalai. 2023. "Influence of Dissolved Oxygen, Water Level and Temperature on Dissolved Organic Carbon in Coastal Groundwater" Hydrology 10, no. 4: 85. https://doi.org/10.3390/hydrology10040085