Article

Simulation of Surface and Subsurface Water Quality in Hyper-Arid Environments

1
Geology Department, Faculty of Science, Assiut University, Assiut 71516, Egypt
2
Geological Science Department, National Research Centre, Al-Behoos St., Dokki, Cairo 12622, Egypt
3
Department of Geology and Geophysics, College of Science, King Saud University, P.O. Box 2455, Riyadh 11451, Saudi Arabia
4
Department of Hydrogeology, Faculty of Earth Sciences and Engineering, University of Miskolc, 3515 Miskolc, Hungary
*
Authors to whom correspondence should be addressed.
Hydrology 2023, 10(4), 86; https://doi.org/10.3390/hydrology10040086
Submission received: 22 February 2023 / Revised: 31 March 2023 / Accepted: 3 April 2023 / Published: 6 April 2023
(This article belongs to the Topic Groundwater Pollution Control and Groundwater Management)

Abstract

:
Forty-eight water samples (30 groundwater and 18 surface water samples) were collected from the study region. Physical and chemical examinations were performed on the water samples to determine the values of various variables. Several graphs, sheets, and statistical measures, including the sodium solubility percentage (SSP), the sodium absorption ratio (SAR), and Piper’s diagram, were used to plot the concentration of the principal ions and the chloride mass balance (CMB). The contents of the variables were compared with the contents in other local areas and the standard allowable safe limits as recommended by the World Health Organization (WHO). Water pH values were neutral for all water samples. Electric conductivity (EC) readings revealed that water samples vacillated from slightly mineralized to excessively mineralized. Water salinities were fresh and very fresh according to the total dissolved solids (TDS) amounts. The hardness of water ranged from medium to hard in the surface water and from medium to very hard in the groundwater samples. Bicarbonate, sodium, and calcium made up the highest amounts in the surface water samples. The highest concentrations of bicarbonate, sulfate, chloride, and sodium were found in the groundwater. Diagrams show the major ion relationships as well as the type and origin of the water. According to Piper’s plots, most of the water samples under investigation were Ca-HCO3 type, Mg water types, followed by SO4.Ca-Cl water types. This highlighted the elemental preponderance of bicarbonate and alkaline earth (Ca2+ + Mg2+). This dominance is caused by evaporite and carbonate minerals dissolving in water because of anthropogenic activities and interaction processes. The groundwater recharge was estimated to be 0.89–1.6 mm/yr based on Chloride Mass Balance. The examined water samples can also be used for cattle, poultry, and irrigation. Additionally, the groundwater is of poorer quality than the surface water, although both types of water are adequate for various industries, with a range of 14 to 94 percent. With the exception of a few groundwater samples, the tested water samples are suitable for a number of applications.

1. Introduction

Currently, almost one-third of the world’s population lives in countries with a water shortage [1]. These include semi-arid regions, which are by nature sparsely populated with water resources. Due to the severe constraints that a lack of water places on both natural and human systems, these regions are potentially highly vulnerable to climate variability and potential future climate change [2].
For many aspects of life and human beings, including drinking, agriculture, industrial operations, hygiene, and reactions, water resources are extremely critical needs. The growth of villages and urban civilizations is significantly impacted by the availability of water, which can be impacted by precipitation, droughts, and aquifer depletion [3,4,5]. Since groundwater and surface water are the natural resources that are most frequently contaminated and in short supply globally, monitoring water quality is an important strategy for ensuring water security [6,7]. Anthropogenic activities and natural phenomena have an impact on water quality, degrading groundwater and surface water, and altering how they can be used for agricultural, human, animal, and industrial usage [8]. The measurement of physicochemical characteristics is required for water quality control programs to acquire data that can be used to create an overall picture of water conditions [9,10,11,12].
The Nile River is Egypt’s primary supply of water, providing 55.5 billion m3 of water annually, or around 94 percent of all of Egypt’s water resources. Egypt’s dry climate, with an average annual rainfall of 18 mm, is well-known [13,14]. Furthermore, Egypt’s population increased from 66 million in 2002 to approximately 96 million in 2018. As a result, there is considerable water scarcity in Egypt and its water supplies are under stress [15]. About 95% of Egypt’s population lives in the Nile Valley and the Delta, where they consume 80% of the country’s water supply [16]. In order to fill this gap, the administration opted to use groundwater as a substitute water source, increase agricultural areas, recover desert areas utilizing groundwater, and encourage people to dwell in these areas [14].
The Assiut area is in the middle of the Nile Valley. People from the governorate’s desert areas more commonly live on the land along the river’s two banks. Approximately 3,119,112 of the governorate’s 4,245,215 residents live in rural areas, compared to only 1,126,103 in urban areas [17]. Rural communities that live near water wells use the groundwater without primary treatment, which has a major negative impact on the health of the locals [18,19]. It is possible to categorize water, identify the major ions, and determine how water forms based on the geochemical background [9,10,11,12,20]. According to factors like electrical conductivity (EC), sodium absorption ratio (SAR), major ion content, and soluble sodium percentage (SSP), irrigation water quality reflects soil salinity, sodicity risks, water toxicity, and other effects on sensitive salt plants [8,9,21,22,23]. Numerous scientists worldwide have conducted studies on water quality indices [8,10,11,12,14,19,24,25,26,27,28,29].
Although similar studies may be carried out in other sites in Egypt, no previous studies utilizing our proposed methodology have been carried out for the current study area. Therefore, the primary goal of this research is to discuss water geochemistry and evaluate its suitability for a variety of purposes, including irrigation and industrial activities.

2. Material and Methods

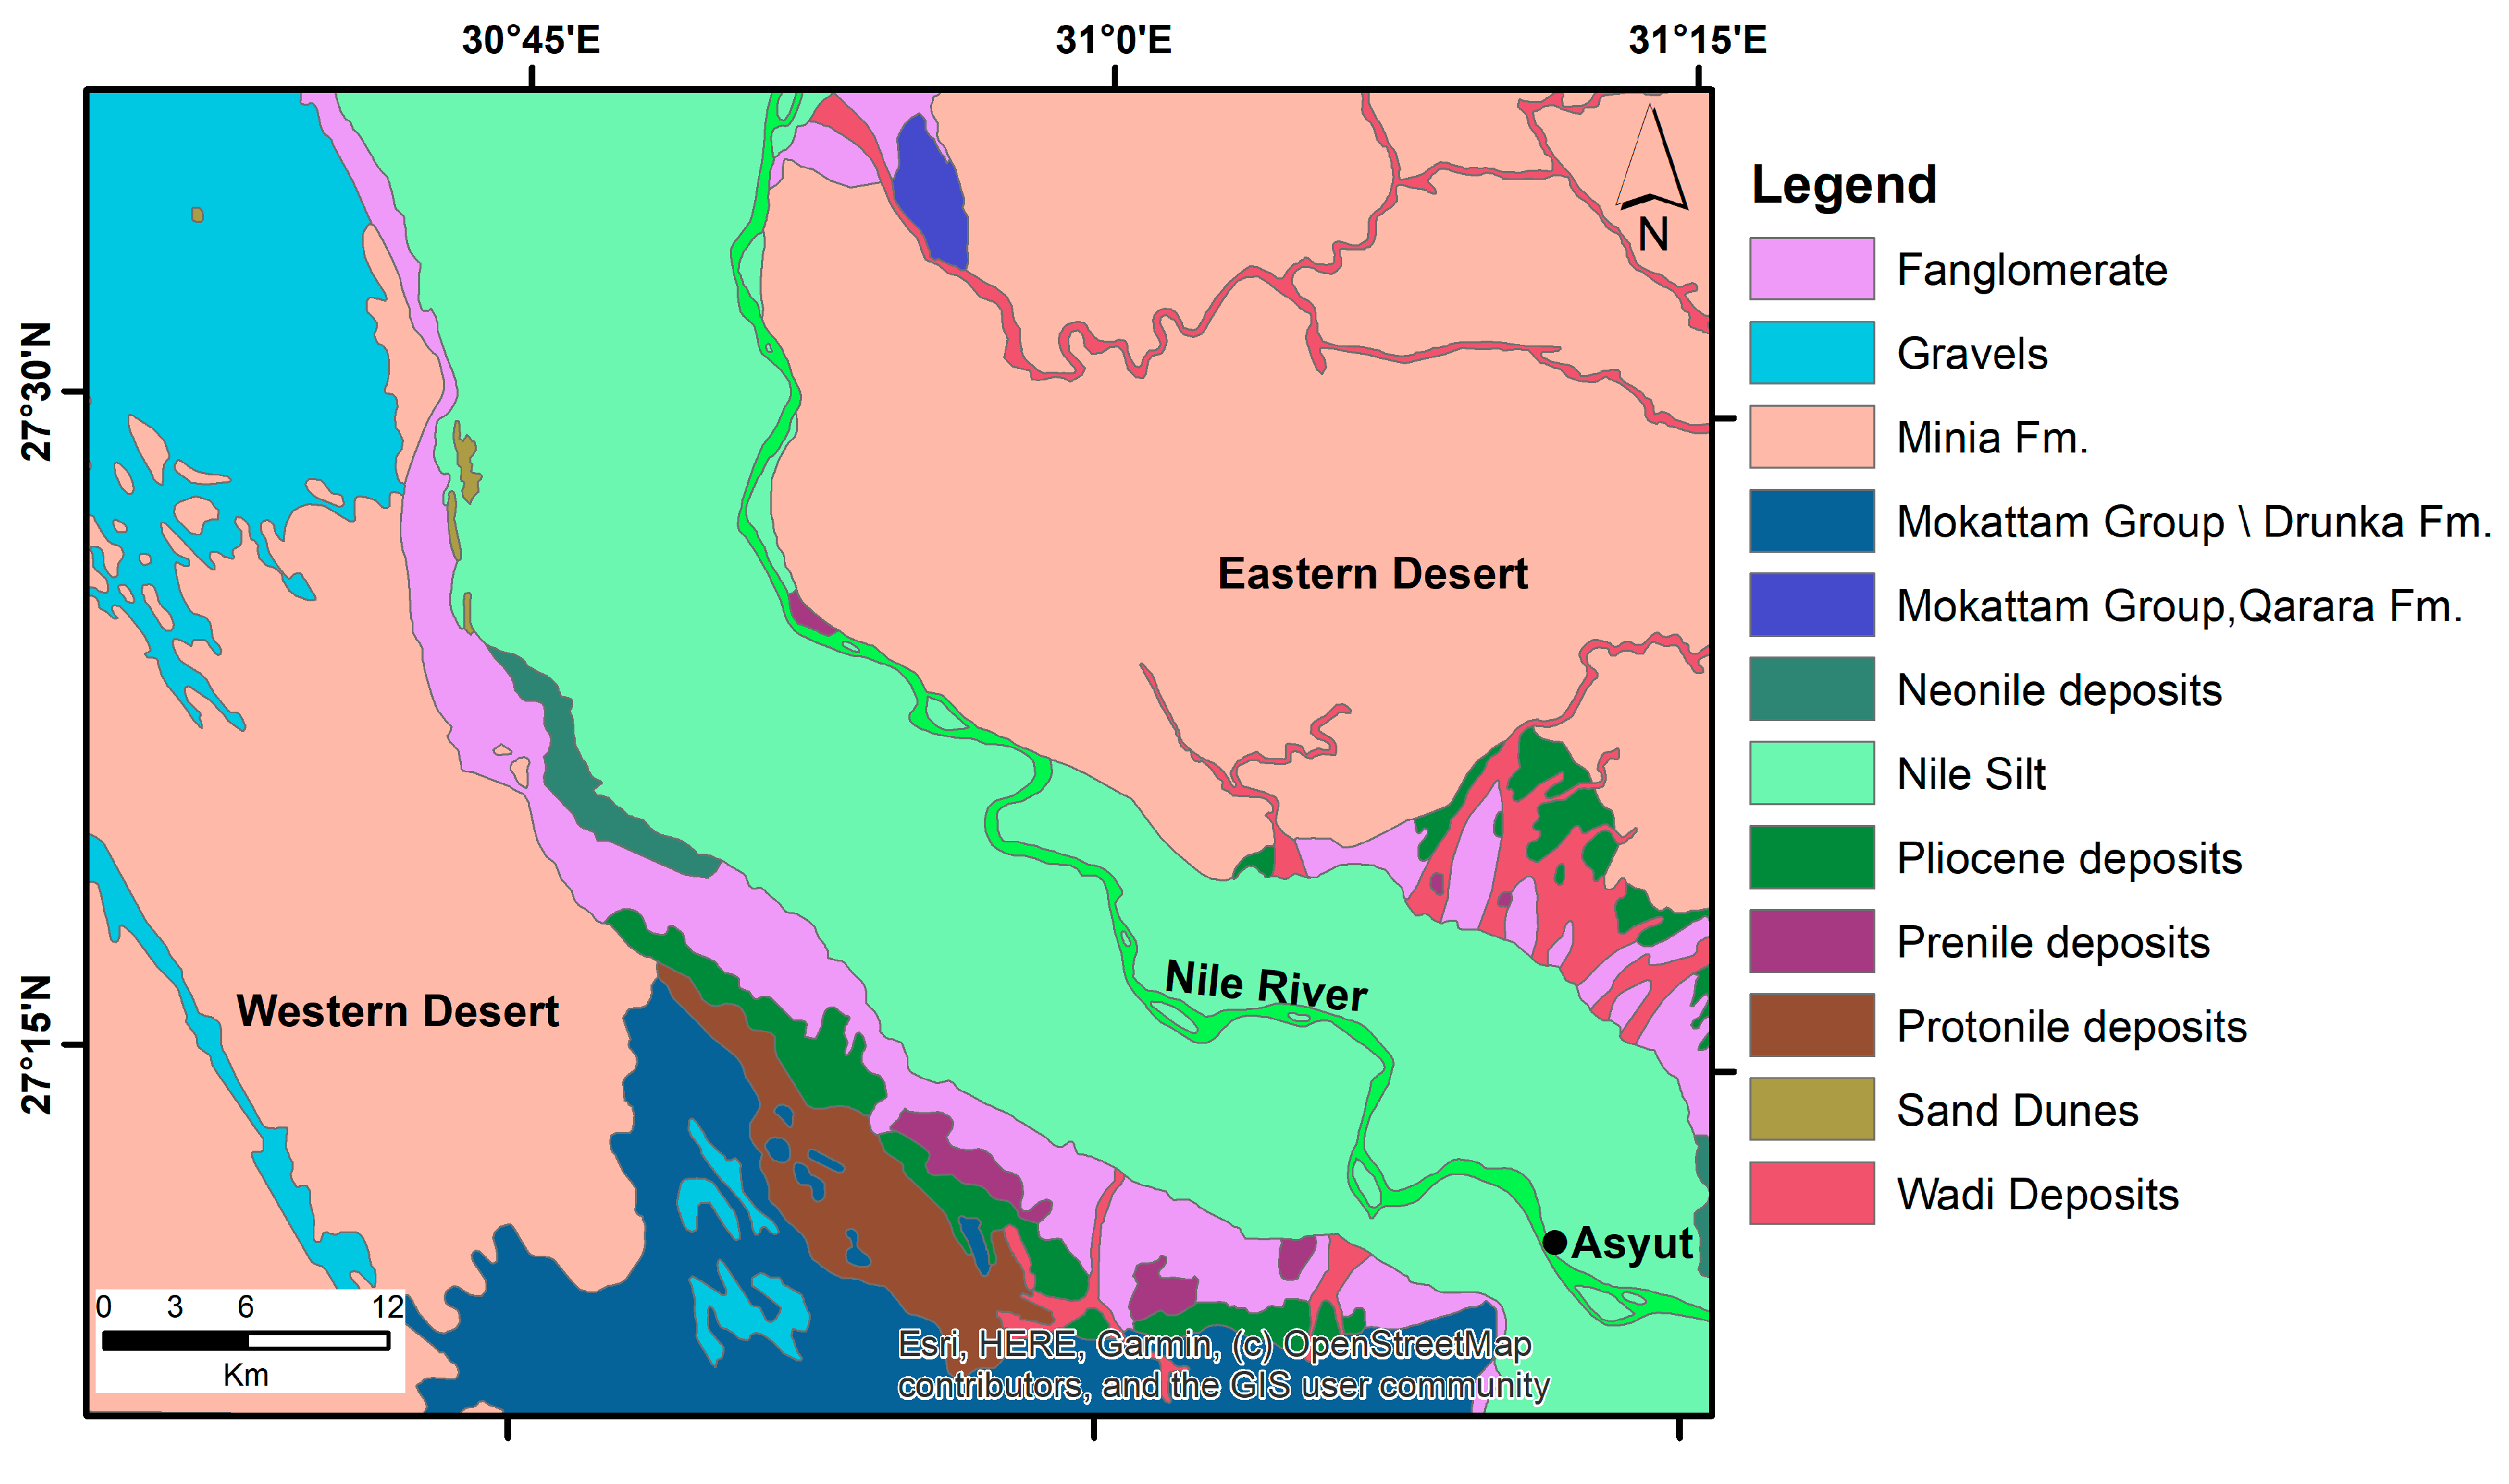
2.1. Geology and Hydrogeology

The Assiut Governorate is situated between latitudes 26°50′ and 27°40′ North and longitudes 30°40′ and 31°32′ East; the agricultural area stretches along the two banks of the Nile River. The rate of poverty in Assiut exceeds 60 percent. There are eleven cities (Dairut, El Qusiya, Manfalout, Abnob, Assiut, El Fath, Abou Teg, Sahel Selim, El Badari, Al Ghanayim and Sedfa) in the Assiut Governorate.
The research area is located in the northwestern Assiut district. It represents the low ground that is bordered to the east and west by calcareous plateaus. The two morphological units are represented by the older alluvial plain (agricultural land) and the younger alluvial plain (reclaimed land) [30] (Figure 1 and Figure 2). The Mokkatom group of Eocene rocks, Pliocene deposits, and Quaternary silt makes up the stratigraphic succession in the study region [30,31]. The main sources of water in the study region are groundwater and surface water (the Nile River, secondary canals, and drains). The Quaternary aquifer and the Eocene limestone aquifer are the two main aquifers that represent groundwater reservoirs. Middle Pleistocene (Prenile) coarse and sandy clay cobbles, gravels, and calcareous rocks make up the Quaternary aquifer [32,33]. According to [34,35], this aquifer is recharged from the surface water since the groundwater moves westward. The Quaternary aquifer replenishes the Eocene limestone aquifers [20]. Four land use classes can be identified from the analysis of Landsat 7 images over the study region (Figure 3). These classes are (1) water that is represented by the Nile River, (2) agricultural lands that include the Nile valley and the reclaimed lands, (3) urban areas, and (4) the desert regions at the eastern and western plateaus.

2.2. Climate

The Assiut Governorate is located within Egypt’s dry region, which experiences long, hot summers, cold winters, minimal precipitation, and significant evaporation rates. According to the Assiut Meteorological Station, the average daily air temperature in the area is approximately 22.7 °C. Summers are dry and quite hot, with average temperatures reaching 37 °C. December–February are the coldest months, with an average temperature of 18 °C.

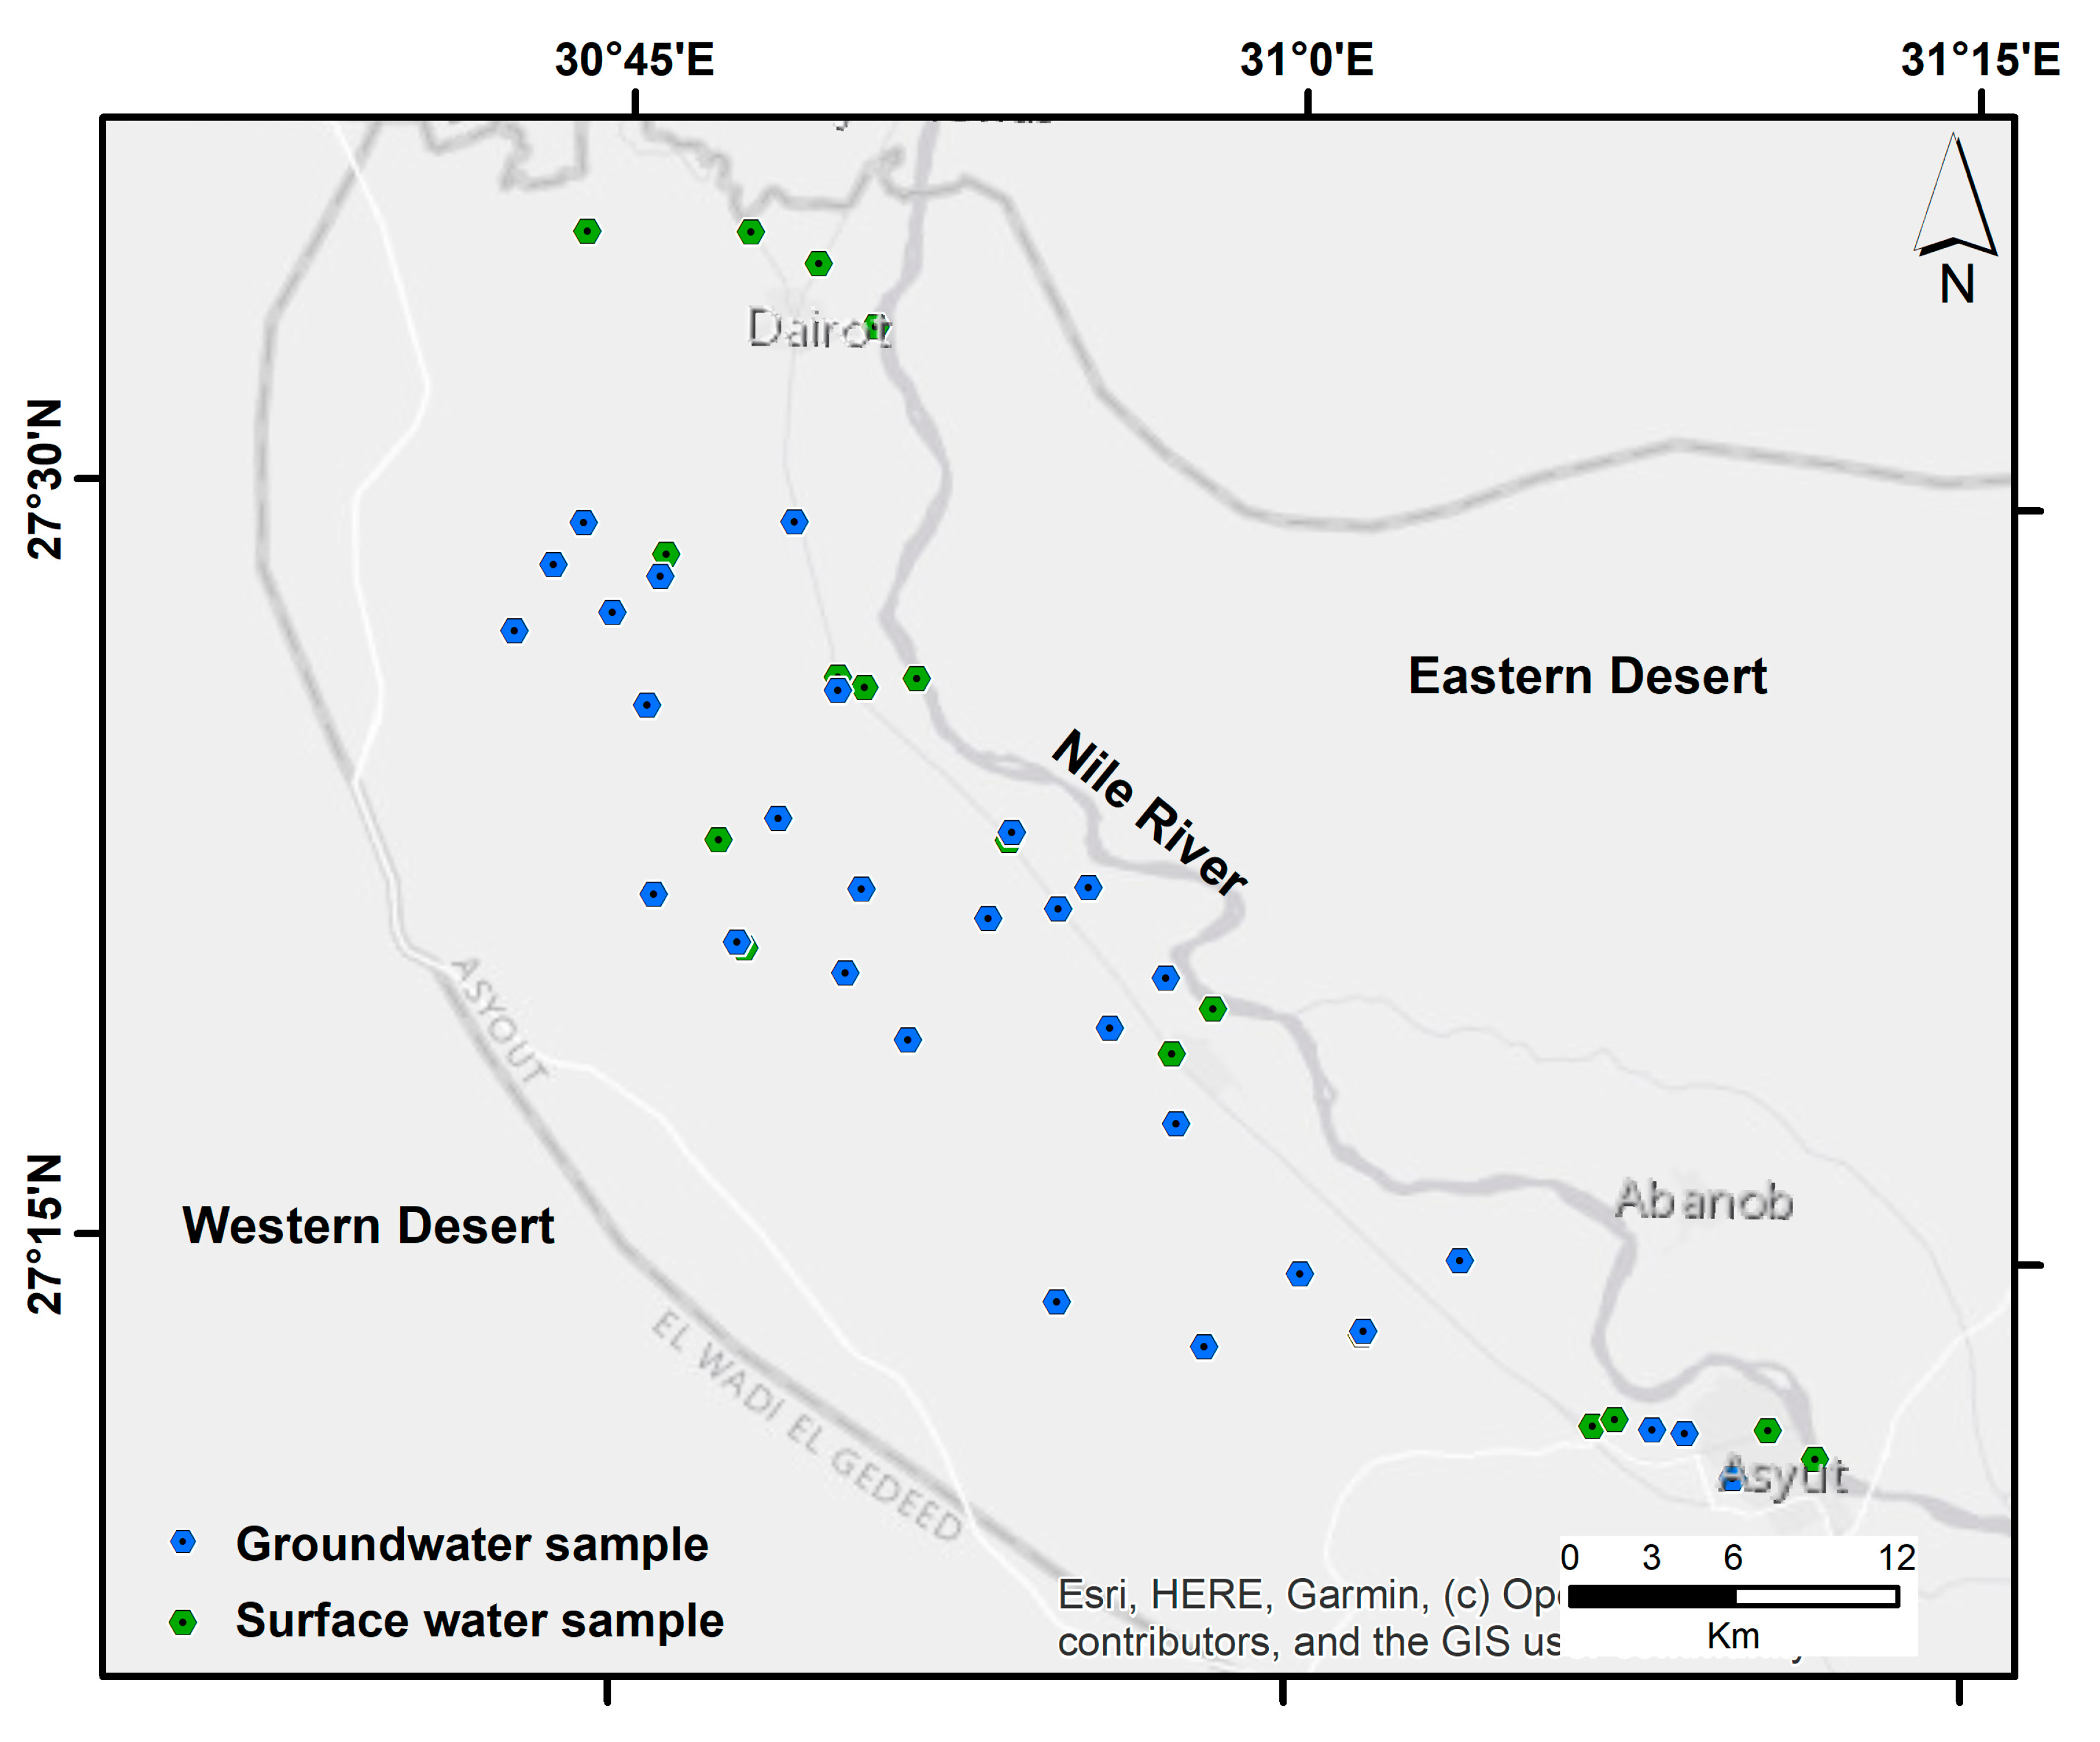
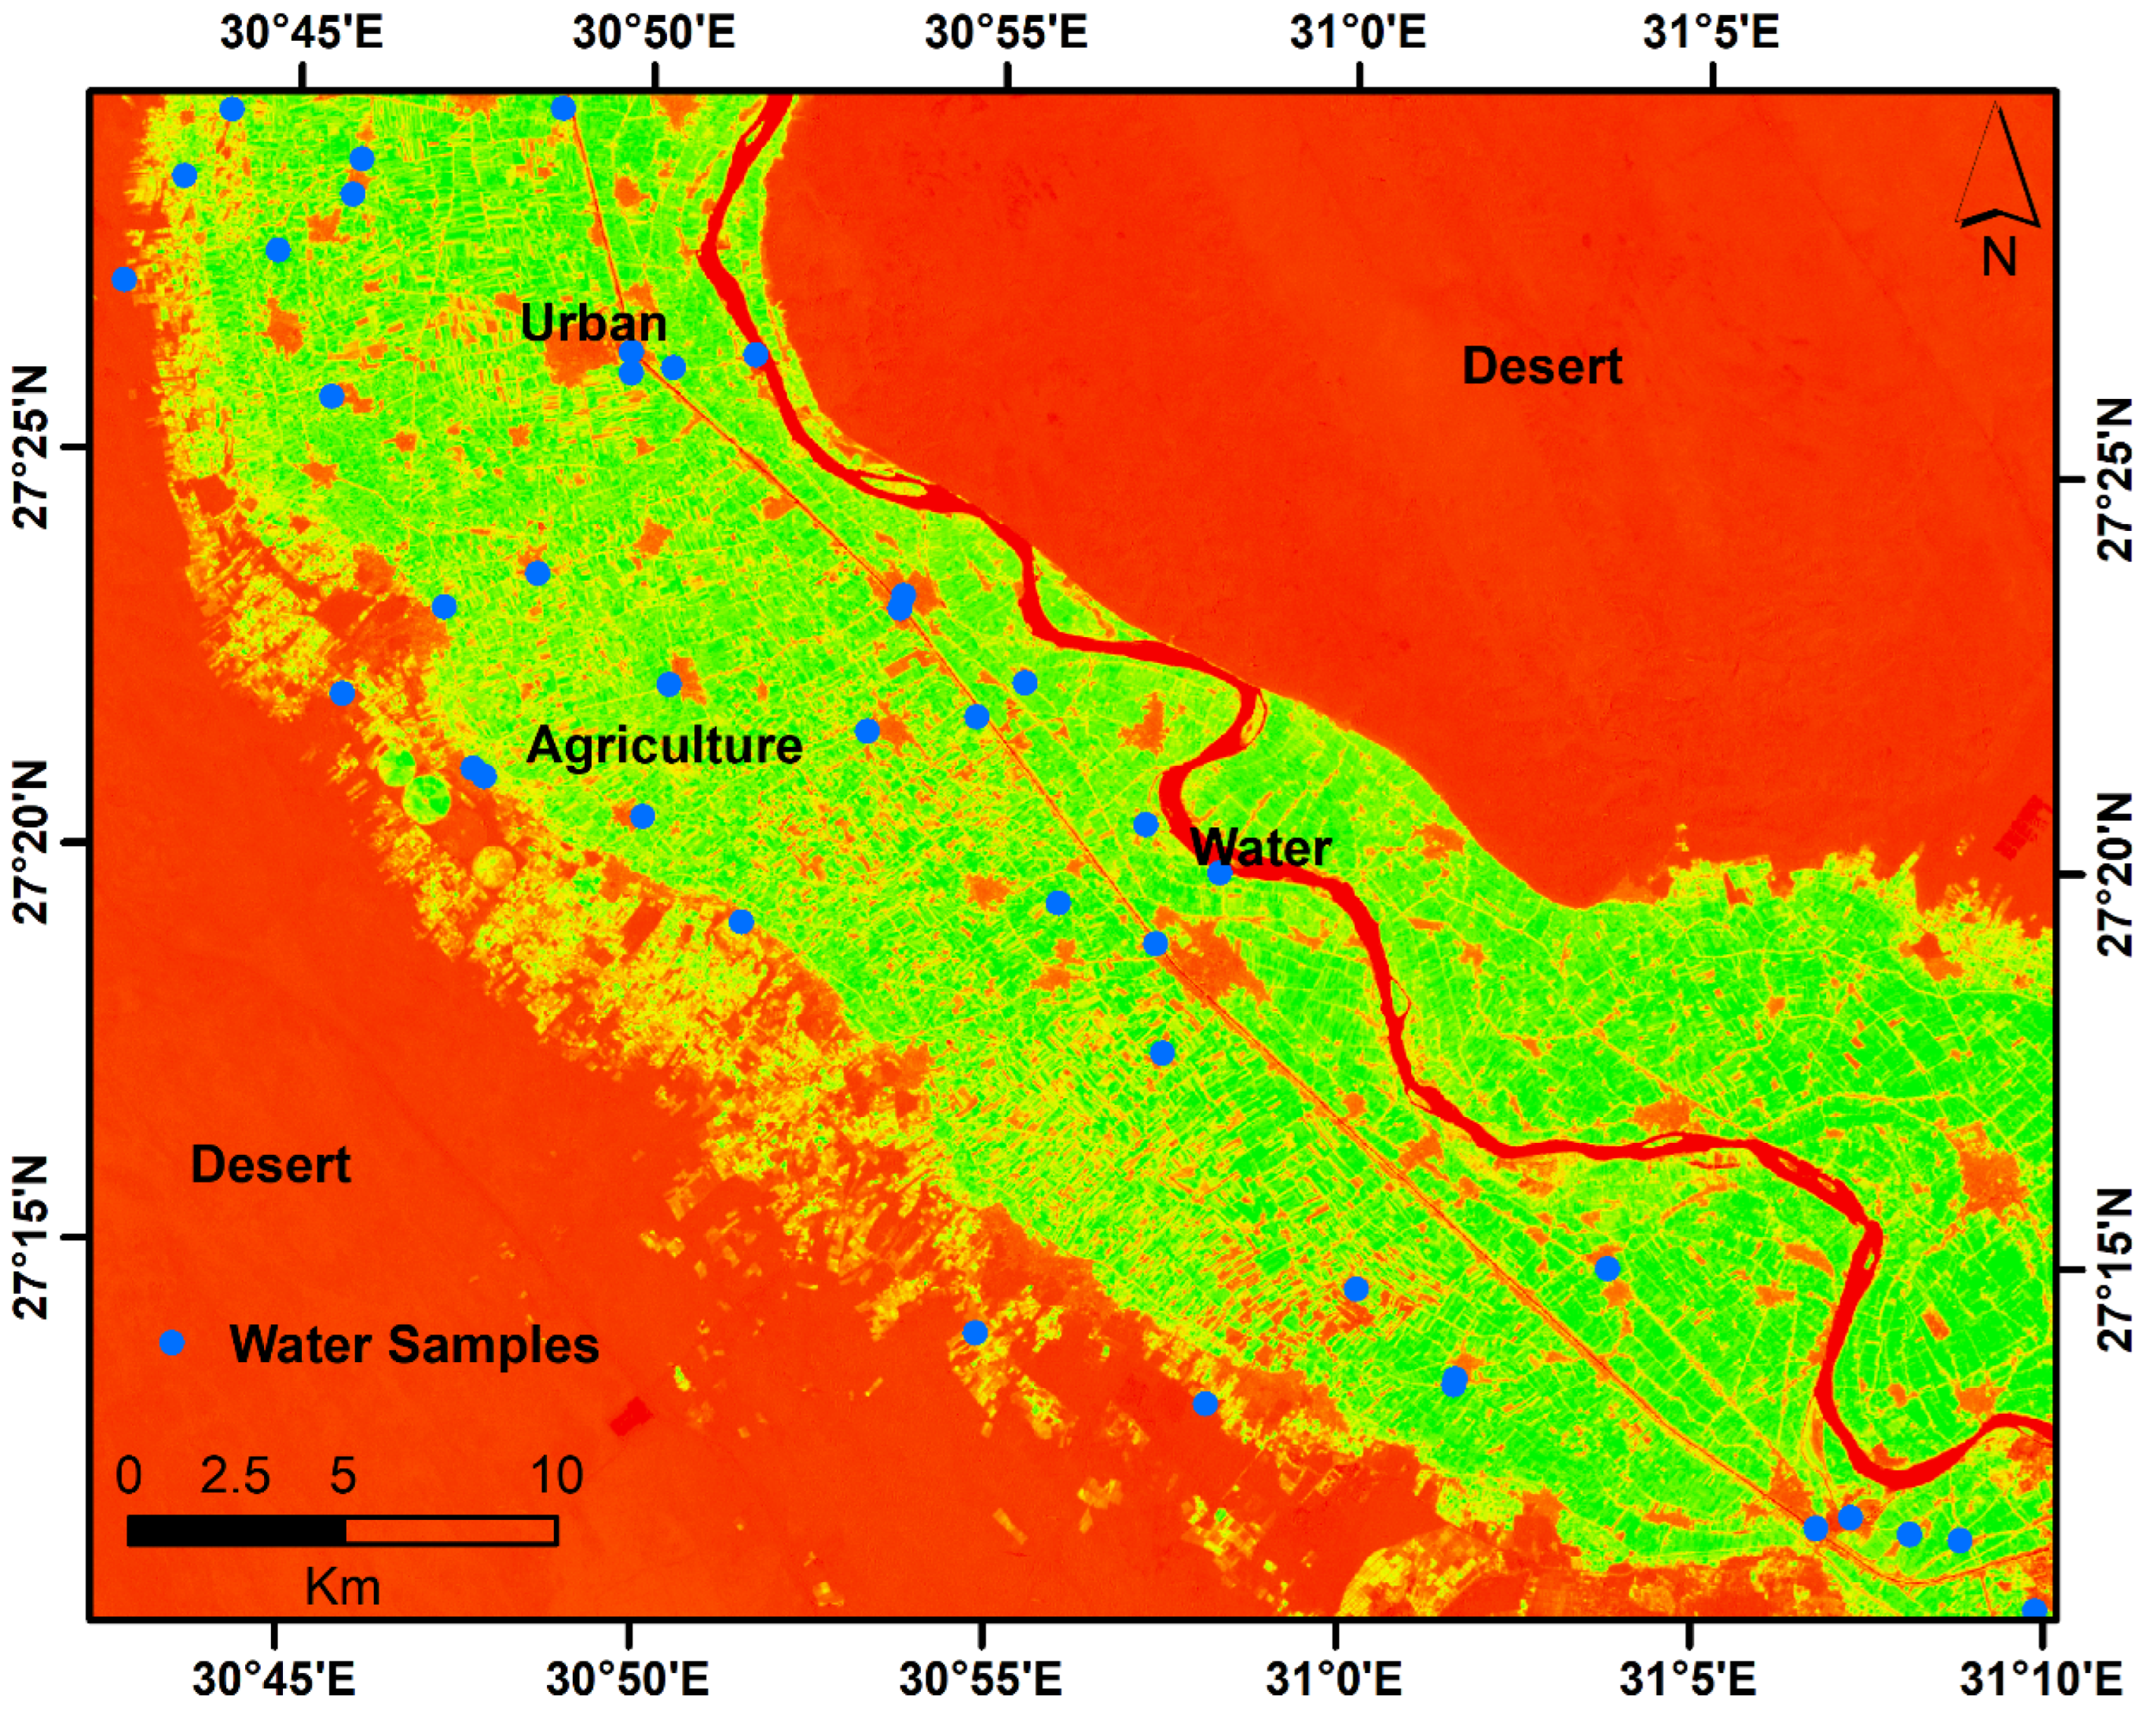
2.3. Sampling and Laboratory Methods

In the study region, forty-eight water samples were collected: thirty groundwater samples and eighteen surface water samples. The sterilized polypropylene bottles containing the water samples were sealed tightly for storage. Standard techniques were used to filter the materials and evaluate their physicochemical composition [35]. While Na+ and K+ concentrations were checked using a flame photometer, temperature, EC, TDS, and pH were all determined on-site using a pH-meter. Additionally, titration was used in the Assiut University Laboratories to determine the amounts of Ca2+, Mg2+, CO32−, HCO3, SO42−, and Cl. The ionic balances, which were below 5%, indicated the analytical accuracy of the ion readings.

2.4. Sodium Absorption Ratio (SAR)

The relative amounts of calcium, magnesium, and sodium, or SAR, show how these ions affect sodium buildup in soils. This ratio is a more accurate way to calculate the sodium percentage since it accounts for the root’s water deficit caused by high salt and low calcium contents [36]. The following equation for SAR, according to [37], is determined as:
S A R = N a   +   C a 2 + + M g 2 + 2
where the concentrations of these cations are expressed in epm (Table 1).

2.5. Soluble Sodium Percentage (SSP)

SSP is a ratio that assesses the risk from sodium, which causes soil to become less permeable when it reacts with the element Na+ [39]. The following equation is cited by [40] as an estimation of SSP:
S S P = N a + + K + × 100 ( C a 2 + + M g 2 + + N a + + K + )
where the concentrations of these cations are expressed in epm (Table 1).

2.6. Chloride Mass Balance (CMB)

Based on the amount of chloride in precipitation and groundwater, the CMB method is used to estimate the rate of groundwater recharge in dry areas. Chloride is less likely to change in a water system over time. Many researchers, including [41,42,43,44], used the CMB method to figure out the recharge rate. The authors used the following equation to figure out how much CMB there was:
R = P · Clp/Clgw
where R is the recharge rate (mm/yr); P is the average annual precipitation (mm/yr); Clp is the average of precipitation-weighted chloride content (ppm); and Clgw is the mean chloride content in groundwater.

3. Results and Discussion

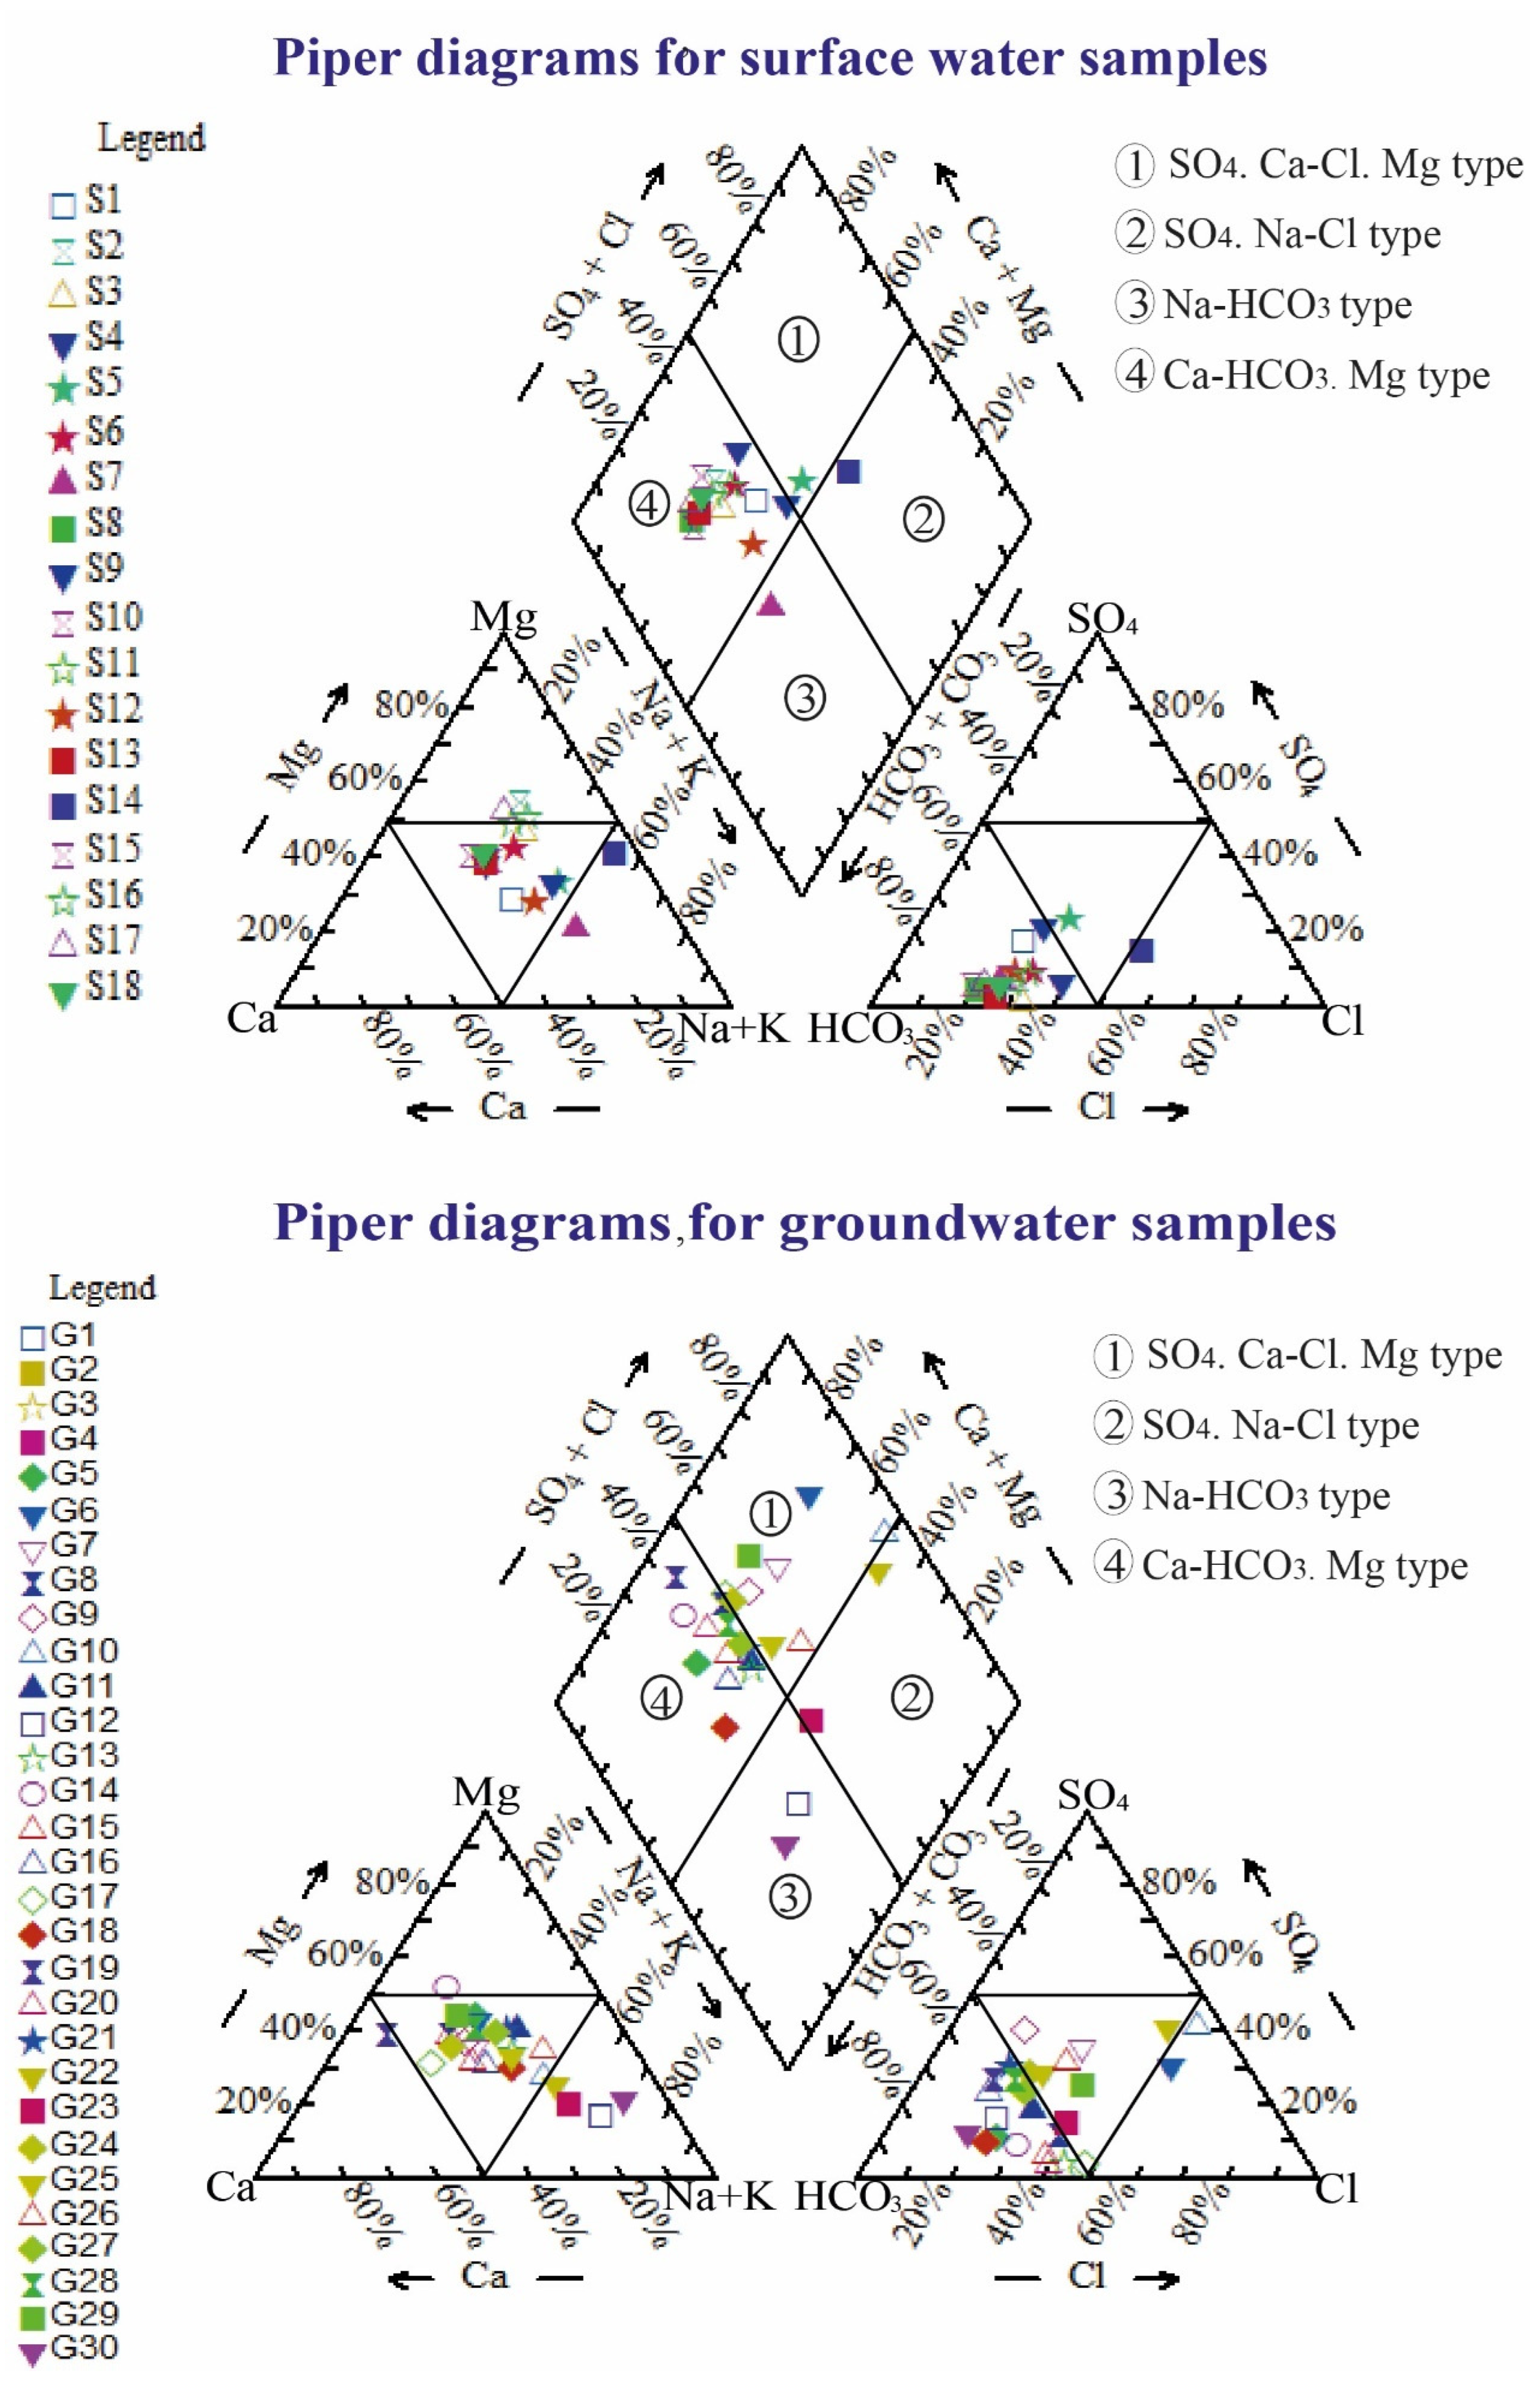
3.1. Hydrogeochemical Classification Major Ions Correlations

Water temperatures ranged from 22.6 to 26 °C in the surface water and from 23 to 32.9 °C in the groundwater samples (Table 1). The pH readings showed a neutral case which fluctuated between 6.3 and 7.5 (Table 1). EC values varied from 207 to 1452 µS/cm in the water samples to indicate slightly to excessively mineralized water (Table 1: [45]). TDS readings vacillated between 204 and 854 ppm in the surface water samples; in the groundwater samples they ranged from 156 to 1069 ppm (Table 1). TDS readings of the water samples denoted fresh and very fresh water (Table 1: [46]). Total hardness (TH) values ranged from 120 to 400 ppm in the surface water samples to represent hard and very hard water (Table 1; [47]). The groundwater samples included EC values ranging from 207 to 1452 µS/cm to express slightly to excessively mineralized water (Table 1). The values of pH, EC, TDS and TH are agreeable with the standard limits set by [43] except for the TH reading, which increased in the groundwater samples (Table 1). These findings matched with results of examined water in the El Minya Governorate of Egypt [24].
The major ions content can be arranged in descending order according to their mean in the surface water samples into: HCO3 > Cl > Na+ > Ca2+ > Mg2+ > SO42− > K+. The means are 266.8, 67.5, 53, 34.7, 33.5., 30, and 16ppm, respectively (Table 1). In the groundwater samples, those means are mapped as: HCO3 > SO42− > Cl >Na+ > Ca2+ > Mg2+ > K+, which are 431, 151.6, 148.6, 128, 85.7, 61, and 11ppm, respectively (Table 1). These contents are agreeable with their concentrations in the water in the El Minya Governorate of Egypt [17] and exceed the allowable limits for drinking water in the groundwater samples [43]. The presence of ions in natural water demonstrates the chemical makeup of water. The cation contents of the examined water samples had the highest sodium values (Table 1). In the samples under investigation, bicarbonate concentrations are greater than the chloride and sulphate levels (Table 1). For the classification of water’s chemical composition, various approaches were suggested. Some techniques primarily use anions, while others combine anions and cations to produce a clearer image of the type of water. The methods outlined in [36,48] are utilized in the study field as graphical approaches for classifying water. Two triangles and a diamond shape are separated into 4 fields in the [36] diagram. The interactions between the alkalis (K+ + Na+), alkaline earths (Ca2+ + Mg2+), the alkalinity (CO32− + HCO3), and the salinity (Cl + SO42−) are shown in Figure 4. Field No. 1 and Field No. 4 are where most of the water samples were found. The Ca-HCO3 water type represented by Field No. 4 indicates that calcium and bicarbonate ions predominated due to carbonate mineral dissolution [9,11,12,26,29]. Field No.1 functioned as a SO4.Ca-Cl water type referring to evaporite mineral dissolution [9,11,12,26,29]. Figure 5 displays the various chemical properties of the water samples as they are projected onto the Piper’s diagram’s diamond form.

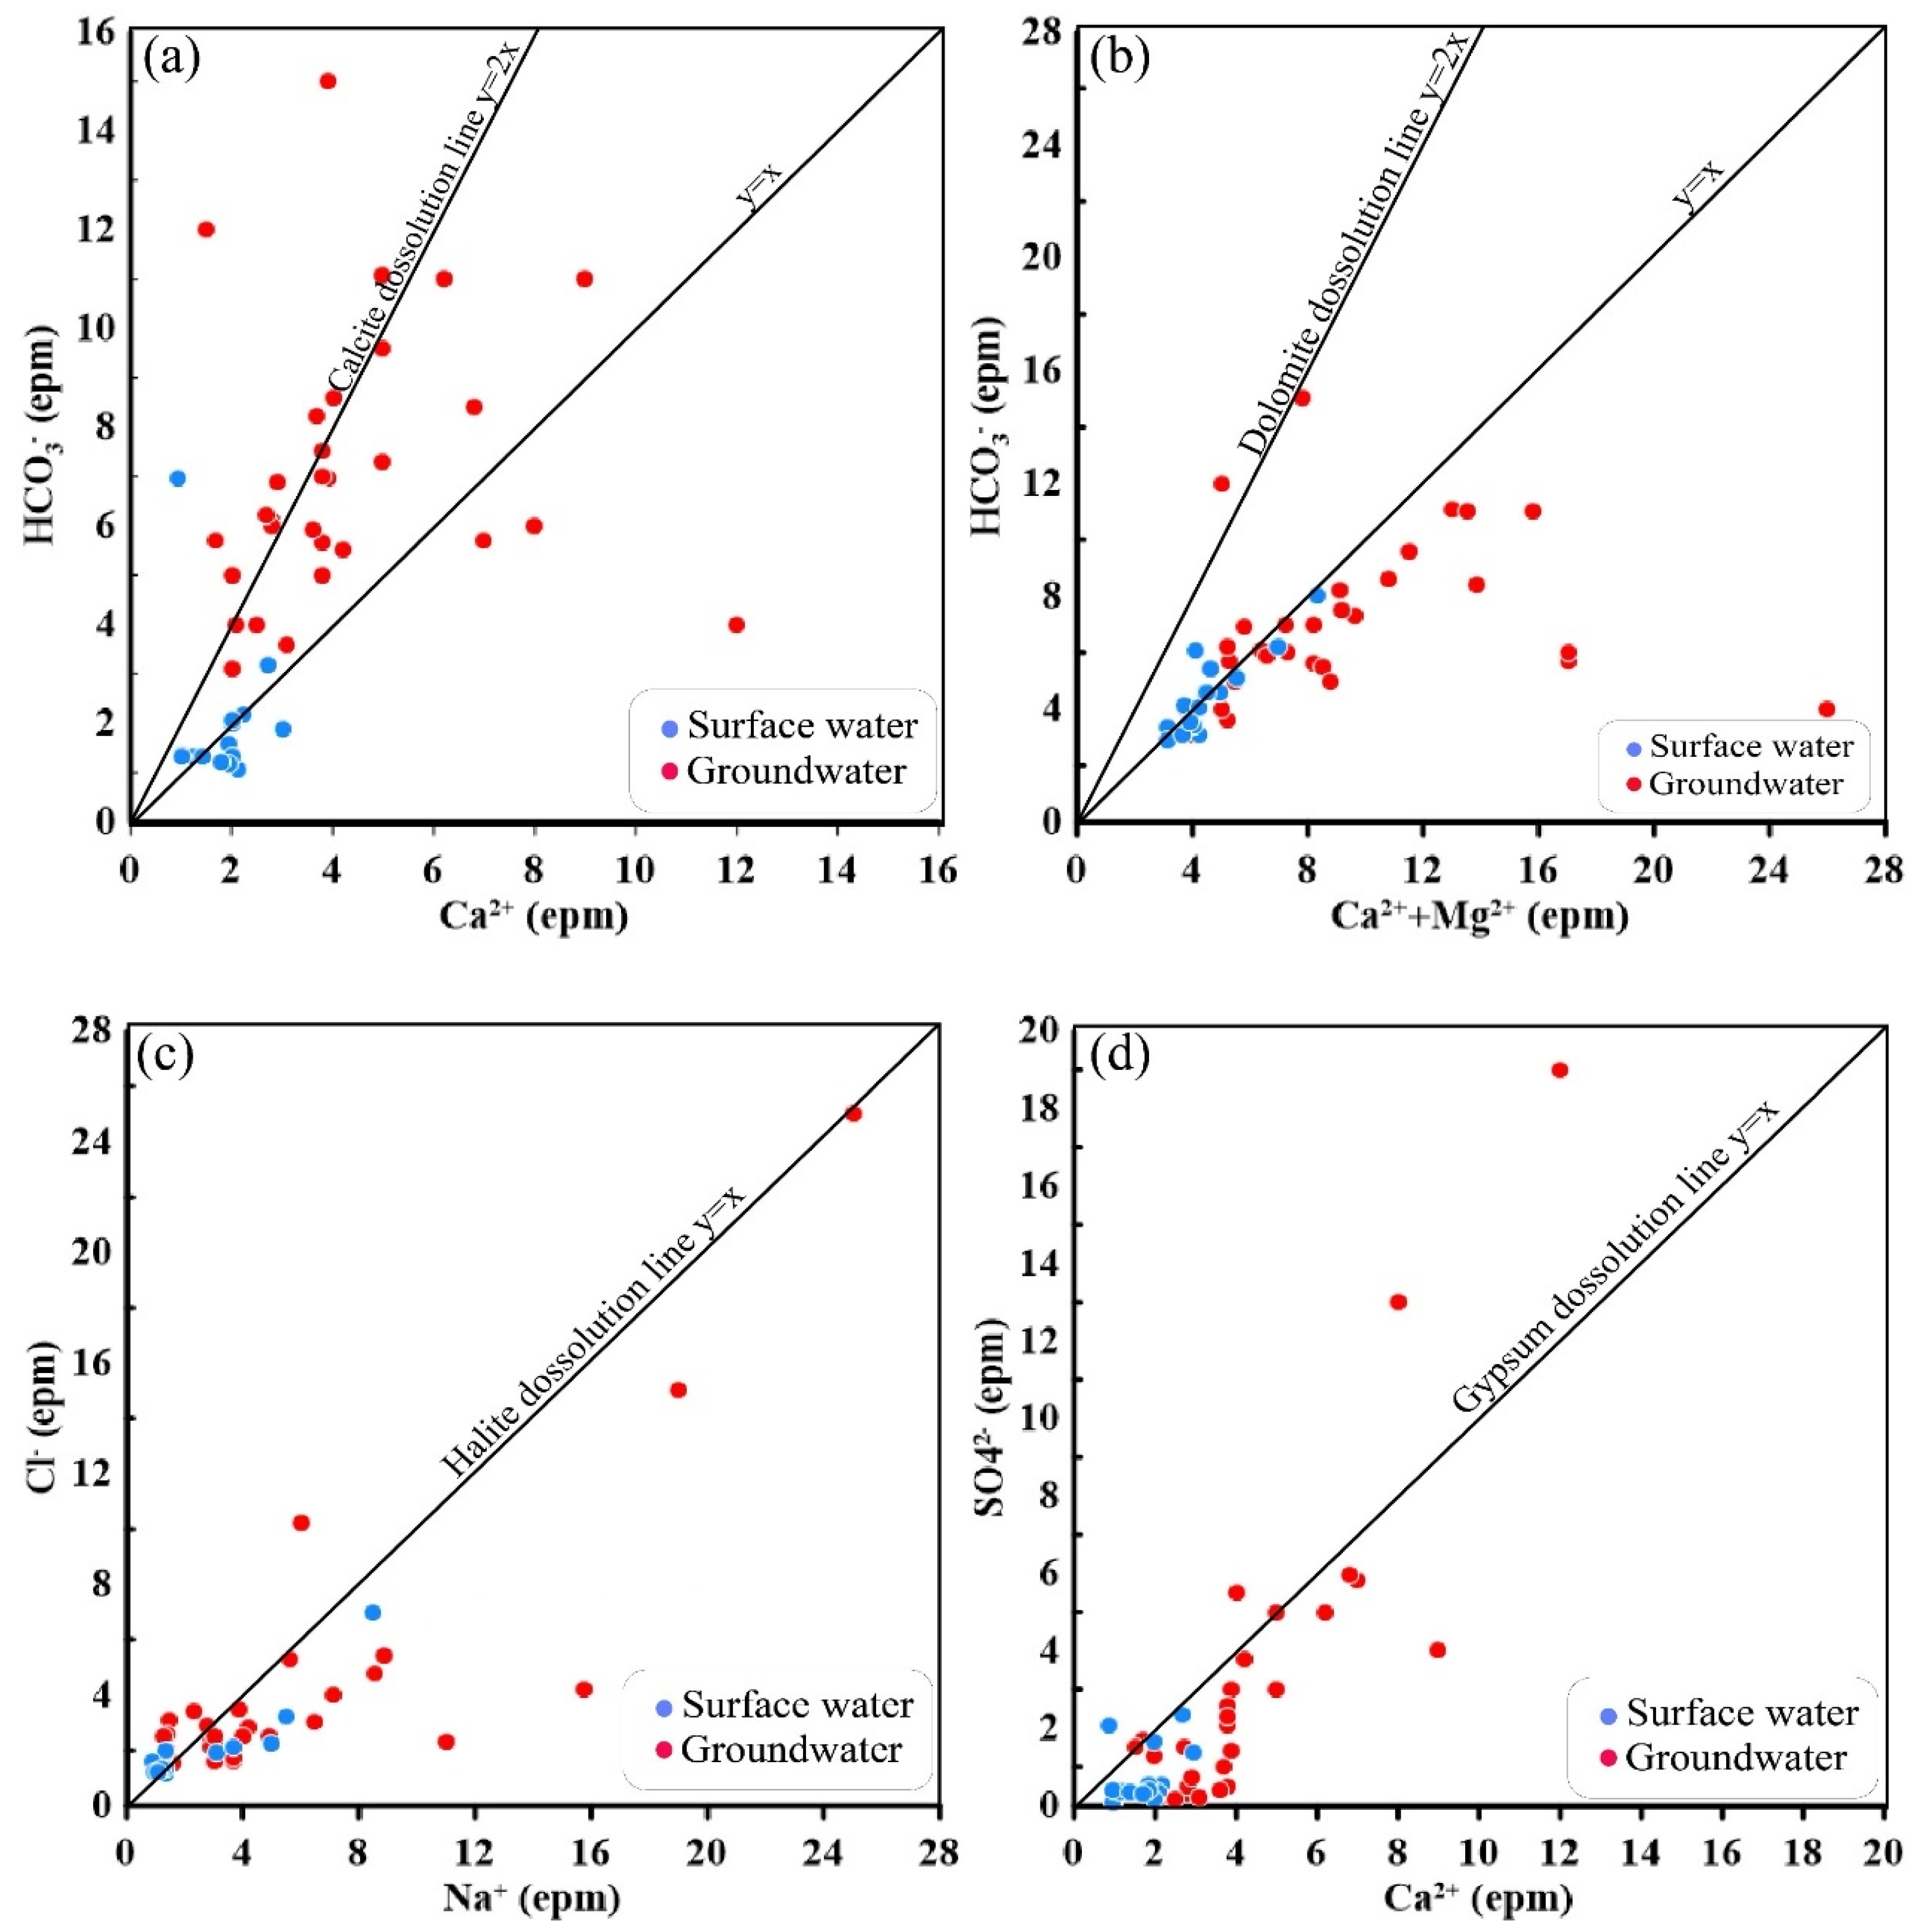
3.2. Major Ions Correlations

Ions that are soluble in water are a result of the interaction between water and rock, evaporation, and precipitation [29,49]. The authors of [29] pointed out the significance of the water–rock interaction process that results in the dissolution of carbonate minerals (Calcite and dolomite) and evaporite minerals (halite and gypsum) in water. This may be stated in the four following equations.
CaCO3 (calcite) + H2CO3 → Ca2+ + 2HCO3
CaMg(CO3)2 (dolomite) + 2H2CO3 → Ca2+ + Mg2+ + 4HCO3
NaCl (halite) ←→ Na+ + Cl
CaSO4.2H2O (gypsum) ←→ Ca2+ + SO42− + 2H2O
Consequently, the previously mentioned equations revealed that the source of excess Ca2+, Mg2+, HCO3 and Cl is the dissolution of calcite, dolomite, halite and gypsum minerals (Figure 5). Along with anthropogenic activities like agricultural water drainage, this surplus is the result of the interplay between water and rock [5,29].

3.3. Chloride Mass Balance (CMB)

The recharge rate (R) of the studied groundwater was shown by CMB to be between 0.89 and 1.6 mm/yr, with a mean of 0.83 mm/yr. The recharge rates (R%) in the study area ranged from 3% to 53%, with an average of 28% of the average annual rainfall. The rest of the rain that fell in the area fell in different ways and did not reach the aquifers as groundwater recharge [50].

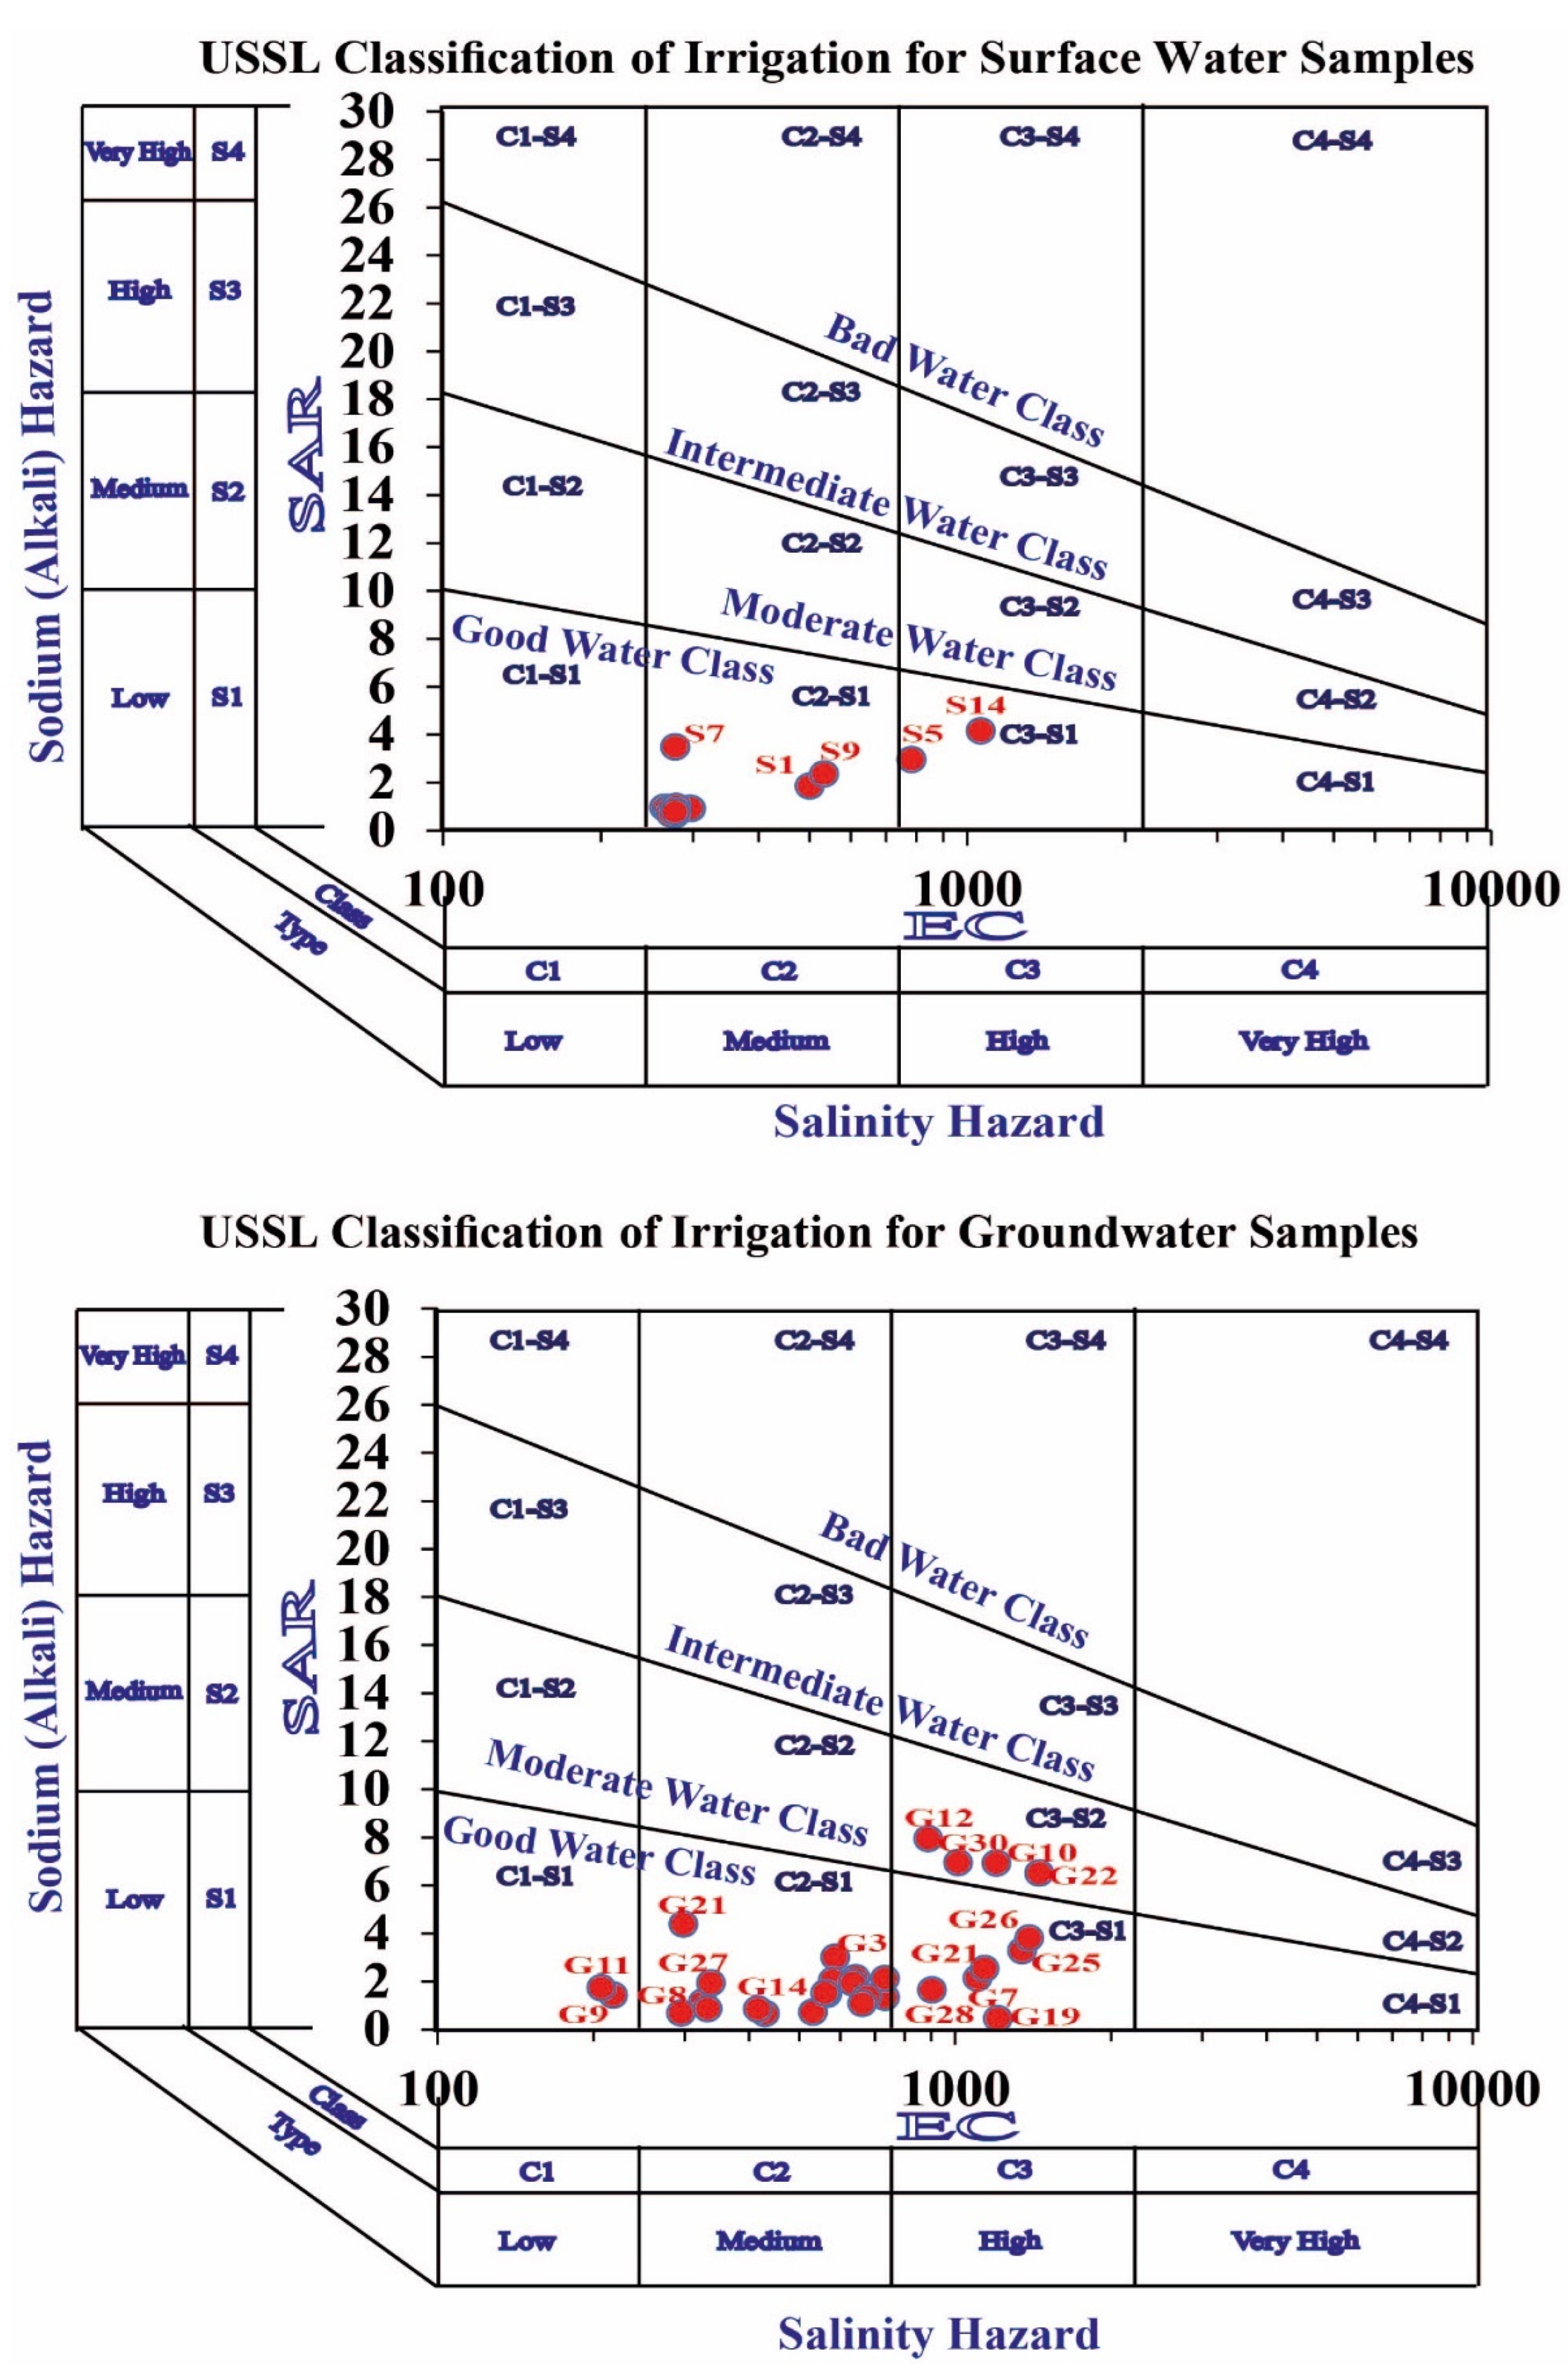
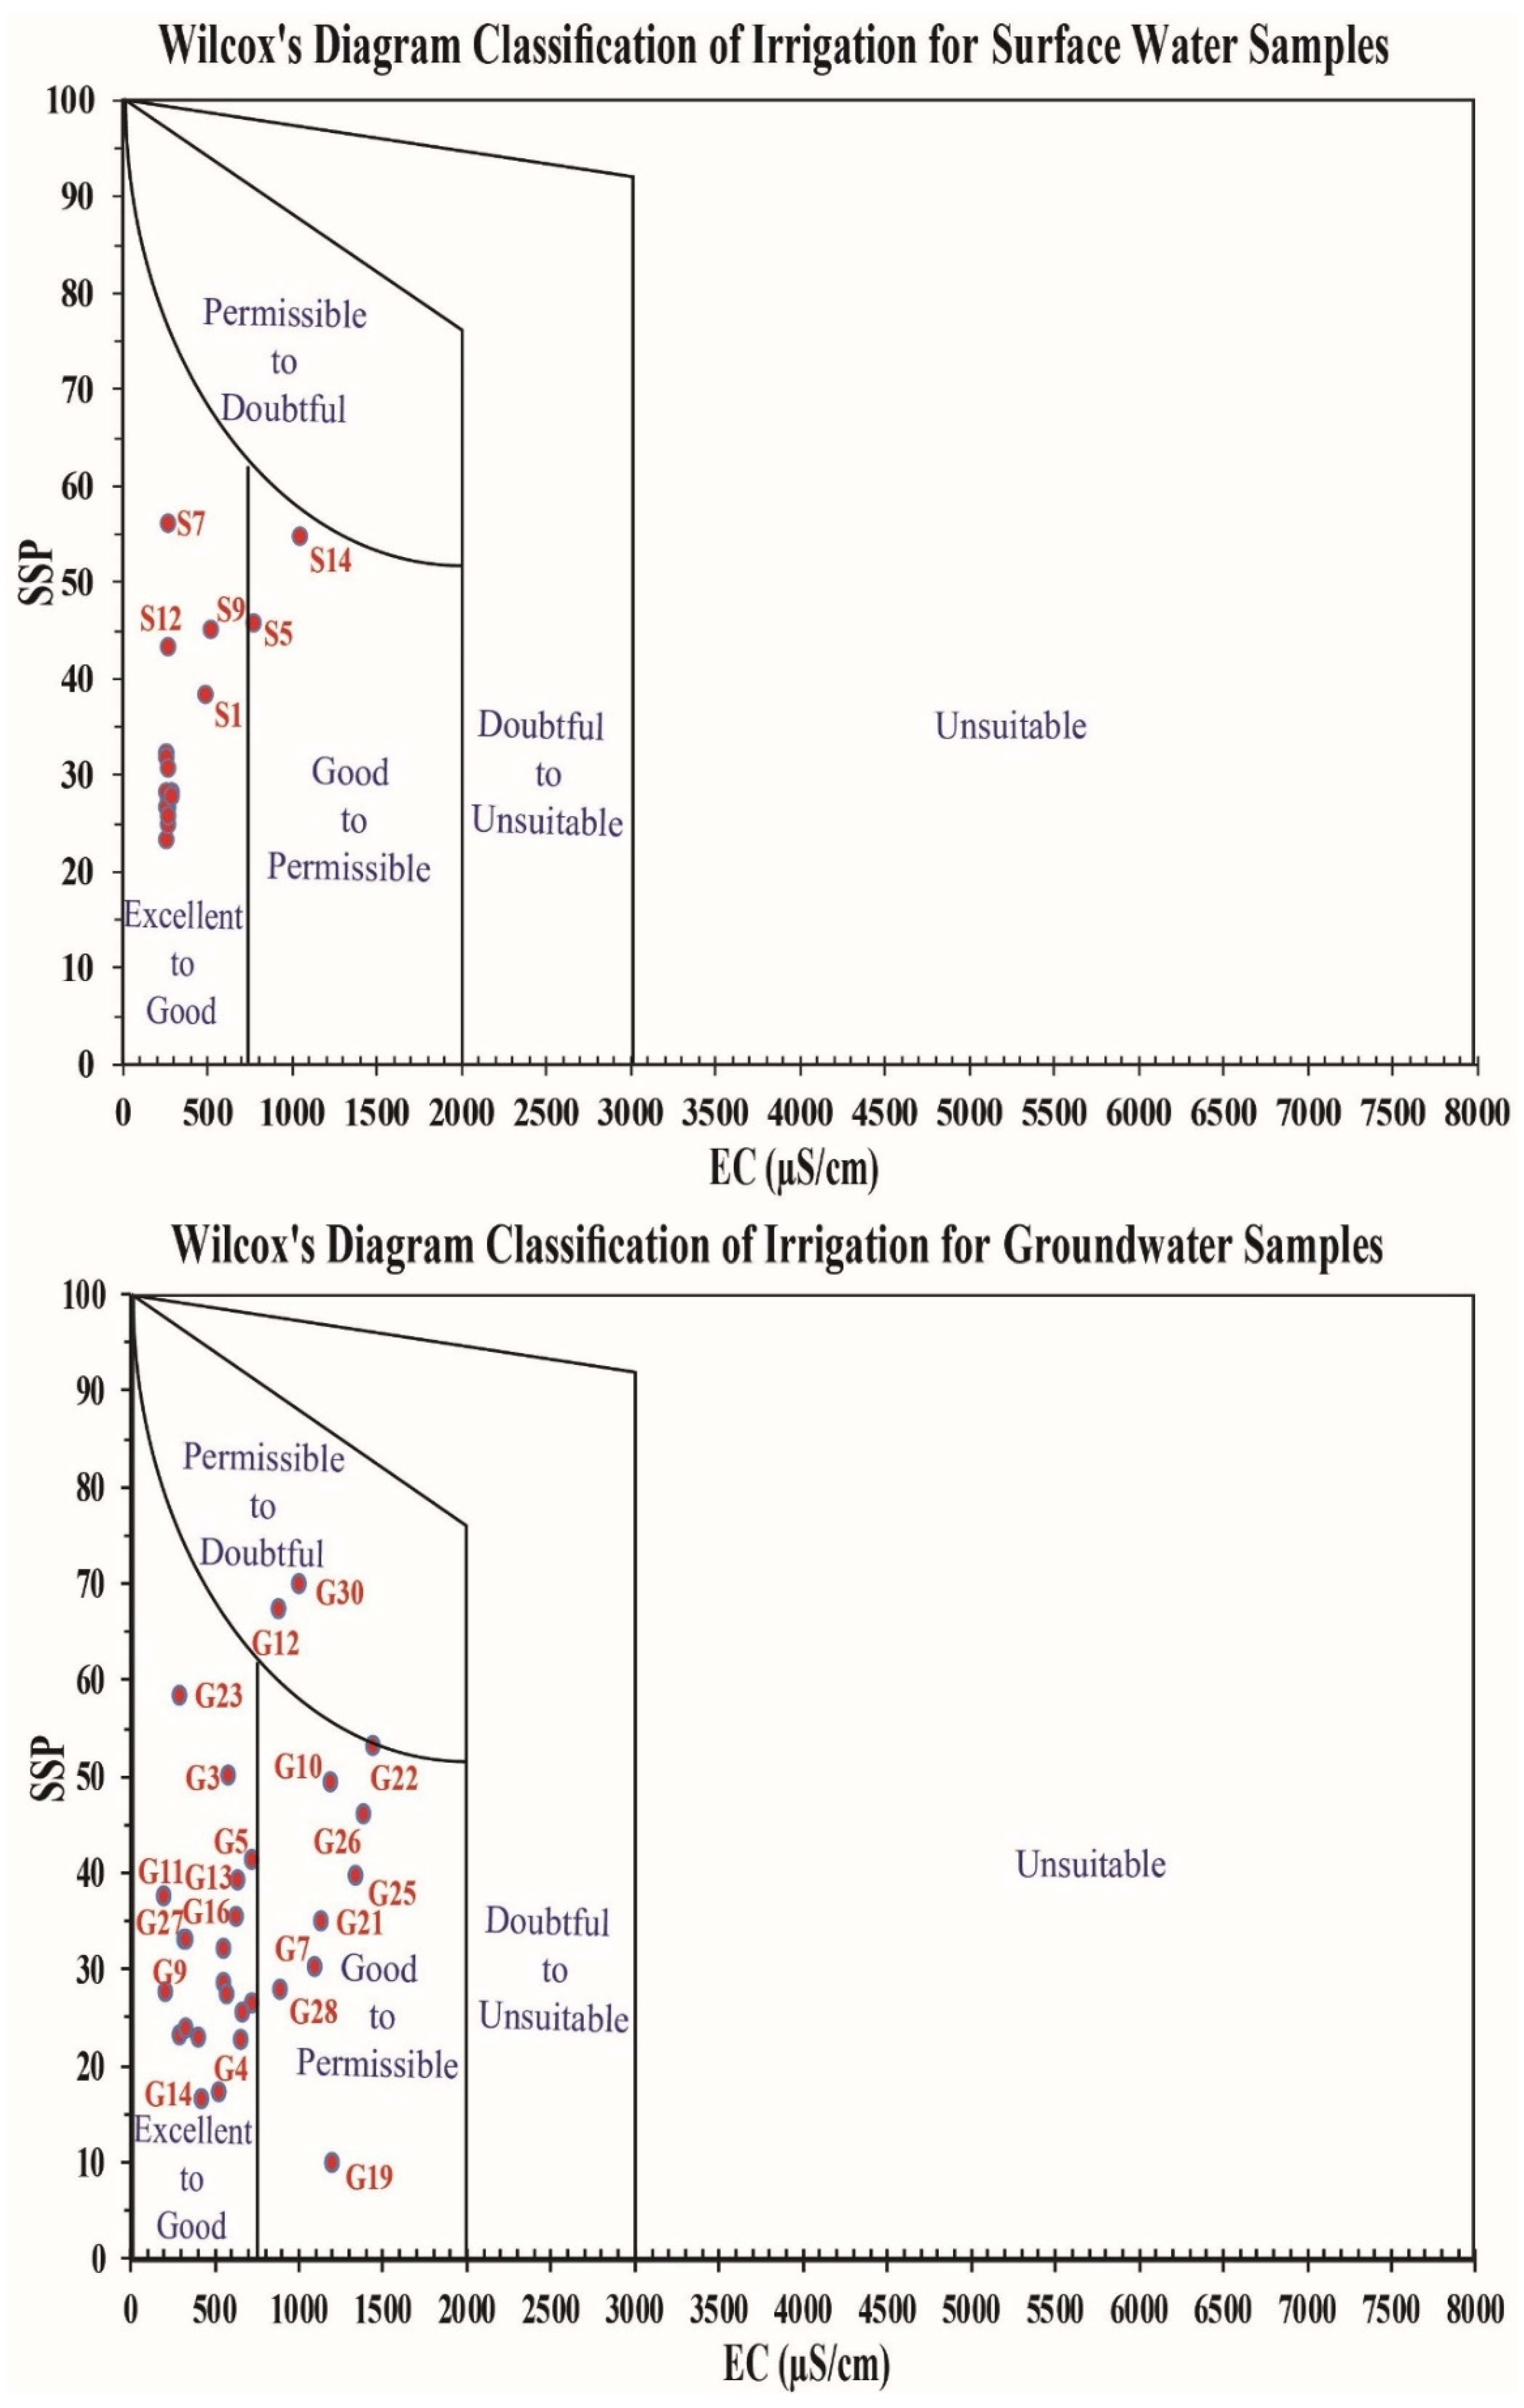
3.4. Evaluation of Water for Irrigation

When using irrigation to increase crop output, water quality is a crucial factor. Numerous metrics assess the quality of the water, such as the soluble sodium percentage (SSP) and the sodium absorption ratio (SAR). SAR calculates the salinity risks based on how much sodium the soil has absorbed [37]. The United States Salinity Laboratory staff [51] claims that one may assess the quality of irrigation water by examining the relationship between the SAR on the X-axis and the EC on the Y-axis. Figure 6 shows that, with the exception of two samples, the surface water samples were low in sodium and had medium salinity [37]. The findings of all surface water samples agree with the conclusions of [24,25] and the samples are suitable for irrigation usage. All groundwater samples range in salinity from low to high and are projected in low sodium water ([37]; Figure 6). Therefore, all of the groundwater samples are suitable for irrigation; these findings are consistent with those of [20,24,26,27].
The level of sodium concentration in the water was discovered using SSP calculations. It was hypothesized that clay particles absorb Na+ to concentrate it in soils and displace Mg2+ and Ca2+ ions, which limits soil permeability when SSP concentrations are above 60 percent [31,52]. With regard to SSP and EC, the Wilcox diagram is a plot sheet that establishes the proportionality of water for irrigation [40]. Figure 7 shows that surface water samples were rated as having good to permissible water quality for irrigation [39]. Meanwhile, the groundwater samples varied in water quality for irrigation from questionable to good, which is consistent with the USSL diagram results (Figure 6 and Figure 7). The authors of [9,20,24,25,26,27] all concurred with these findings.

3.5. Evaluation of Water for Livestock and Poultry

Water quality is greatly impacted by salinity (EC). According to [9,20,24,27] and other researchers, highly salinized water has a negative influence on livestock and poultry as well as plant and soil productivity. For the purposes of using saline water for cattle and poultry, the Food and Agriculture Organization [51] established the standard for water salinity (EC). Table 2 shows that, in accordance with [51], all examined water samples had excellent salinity levels suitable for use with cattle and poultry.

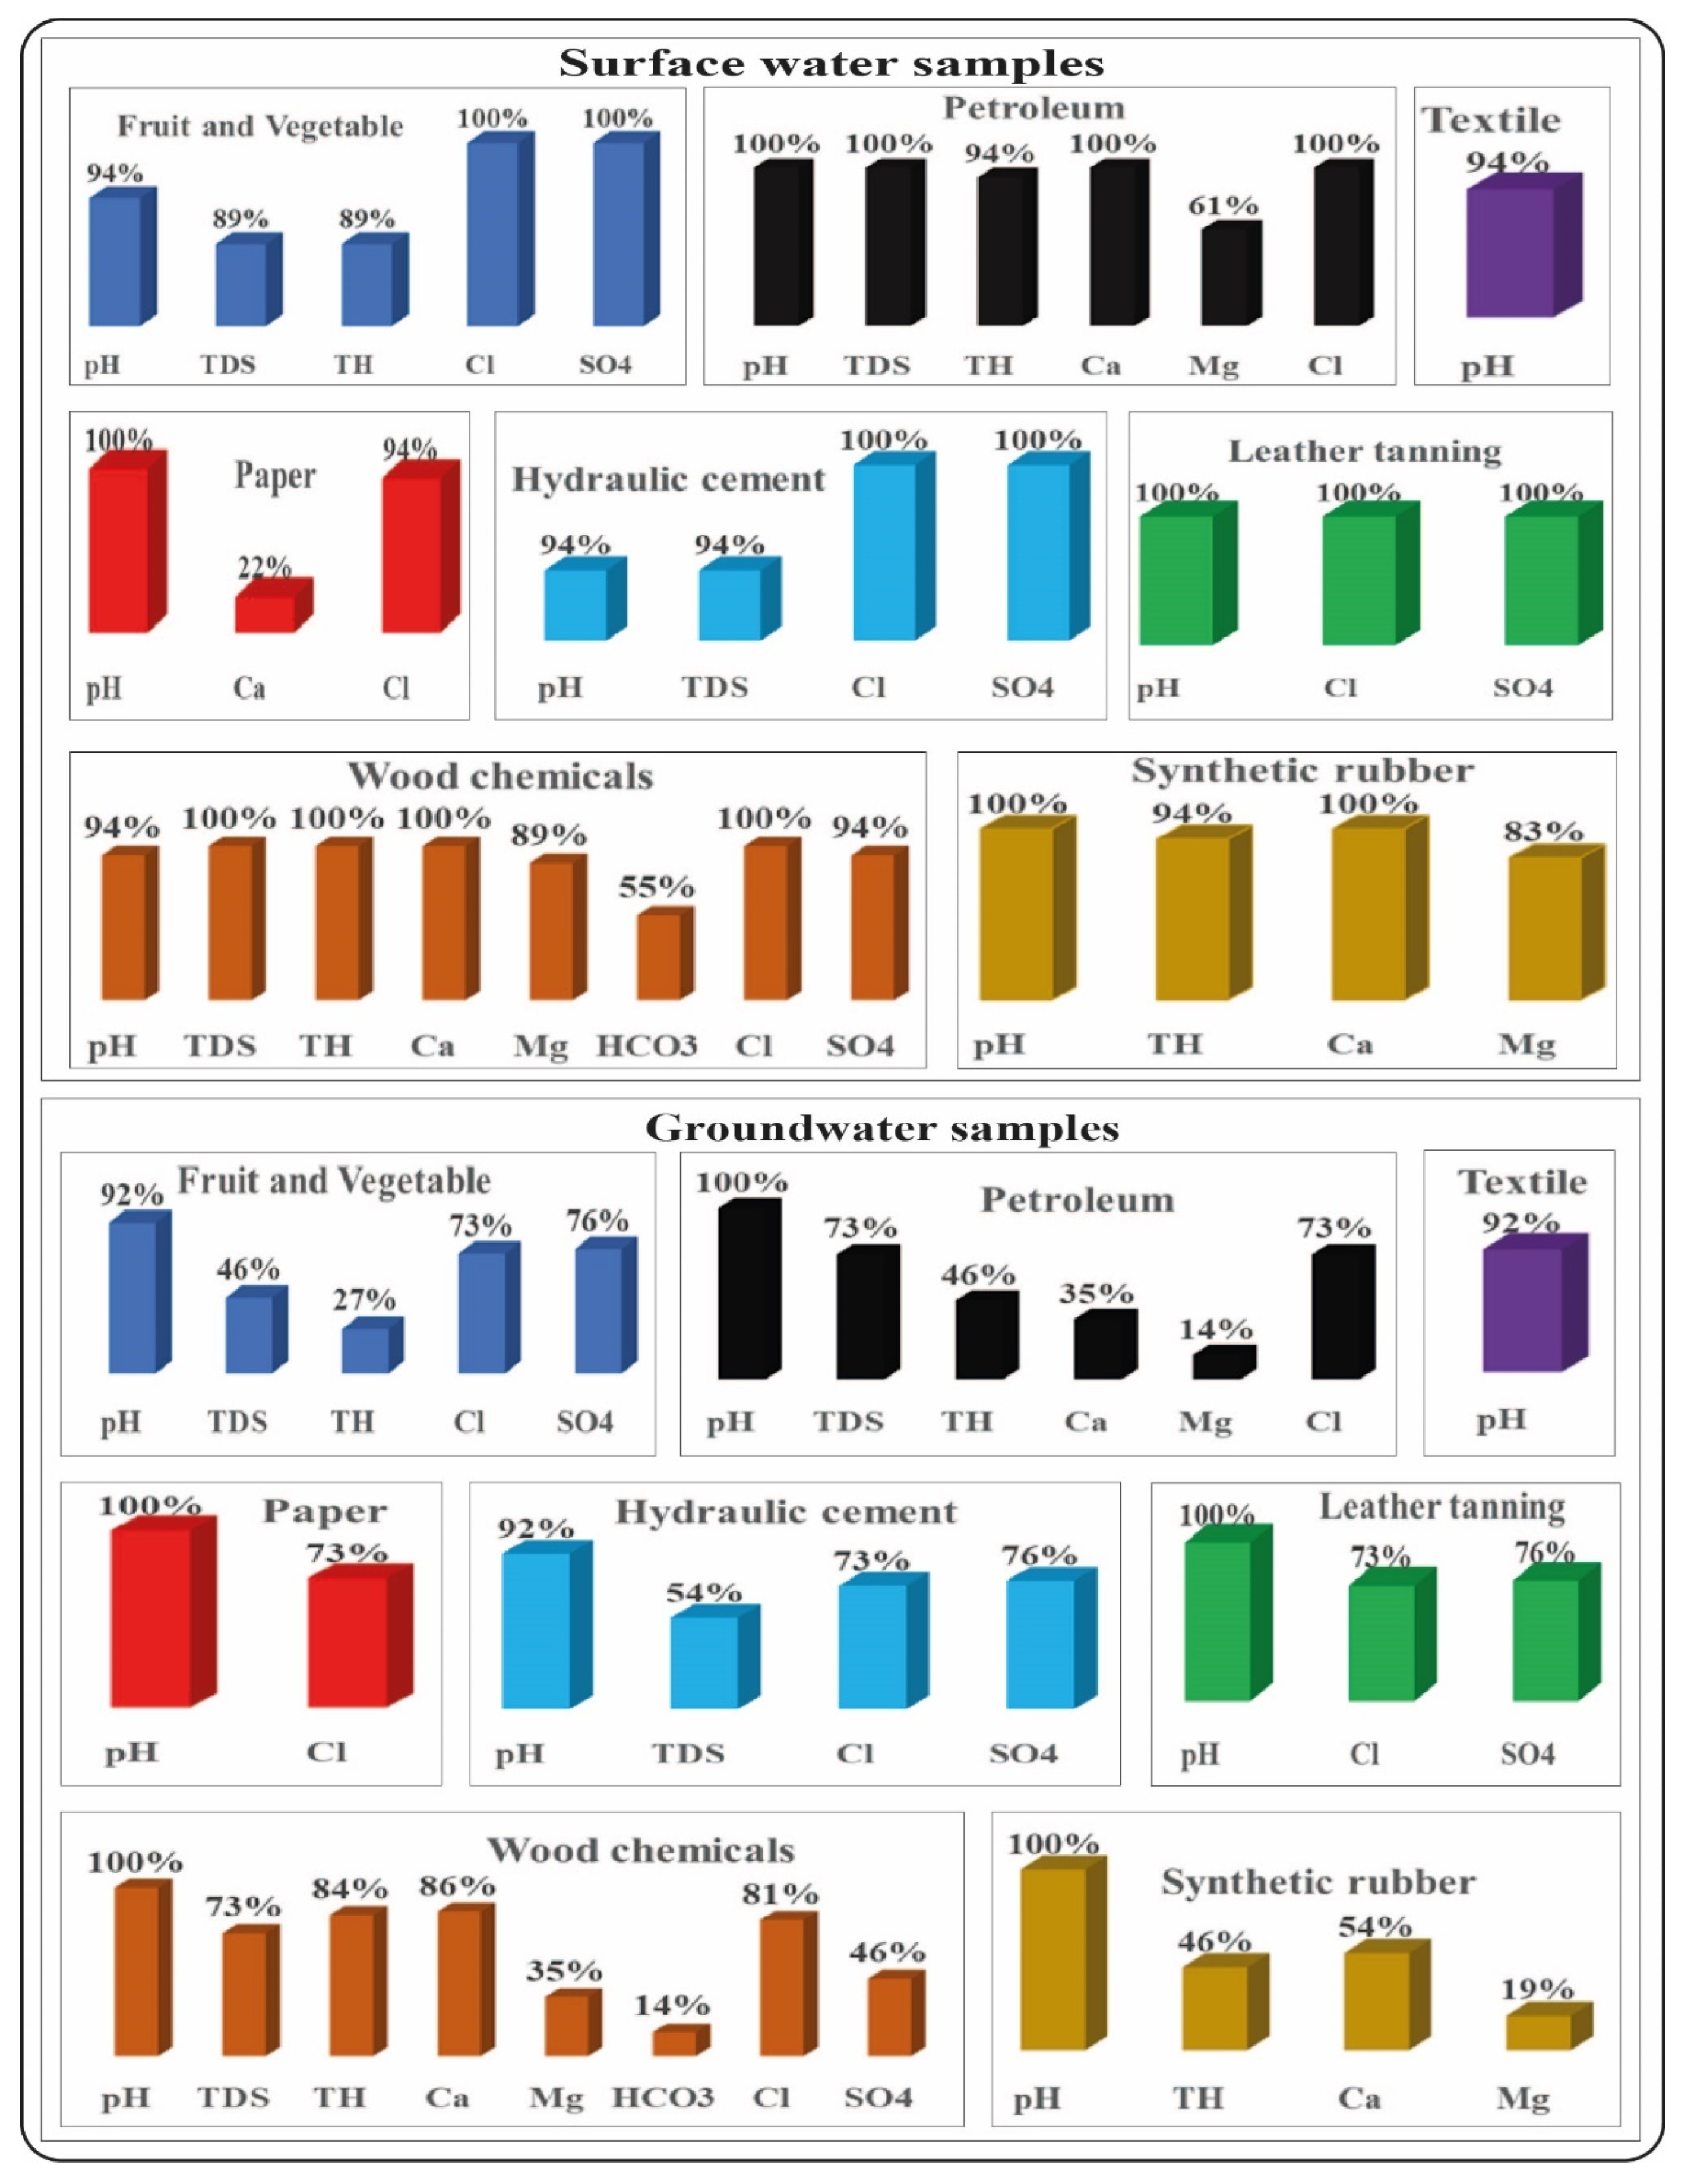
3.6. Quality Criteria for Industrial Purposes

Water requirements differ by industry [52], and some of these requirements are listed in Table 3. Considering this, the percentages of surface water samples that are suitable for the industries of fruit and vegetable (89%), paper (22%), textile (94%), petroleum (61%), wood chemicals (55%), synthetic rubber (83%), hydraulic cement (94%) and leather tanning (100%) have been calculated (Figure 8).
In addition, the percentages of groundwater samples that were suitable for use were: fruit and vegetable (27%) paper (73%) textile (92%) petroleum (14%) wood chemicals (14%) synthetic rubber (19%) hydraulic cement (54%) and leather tanning industries (73%; Figure 7). Except for the wood sector, the groundwater quality was better than the groundwater quality in El-Obour city [27].

4. Conclusions

The pH values of the water samples are neutral. EC results led to the conclusion that the studied water samples are slightly to excessively mineralized. TDS findings expressed that the tested water samples include fresh and very fresh water. The TH readings indicated that the hardness of water samples fluctuate between hard and very hard water. The averages of major ion concentrations revealed that the highest contents in the surface water samples were made up of bicarbonate, chloride, sodium and calcium, respectively. In the groundwater, the highest concentrations were made up of bicarbonate, sulphate, chloride, sodium and calcium, respectively. The bulk of water samples are characterized by the predominance of bicarbonate ions and the earth’s alkaline elements (Ca2+ and Mg2+). This was a result of the dissolving of carbonate and evaporite minerals as well as the activities of agricultural water drainage. The examined water samples are suitable for cattle, poultry, and livestock irrigation. The quality of the surface water samples for the use of industrial purposes was often higher than the groundwater samples. The examined water samples had a percentage range of 14 to 94 that made them appropriate for specific sectors. Our recommendation is that the analyzed water samples be used for irrigation, residential purposes, and drinking, except for a few samples from wells whose ion levels exceed the WHO’s permissible limits.

Author Contributions

Conceptualization, A.M., A.A. and S.S.A.; methodology, A.A., A.M., S.S.A. and M.A.A.M.; software, A.A.; A.M. and S.S.A.; validation, A.A., S.S.A., A.M. and M.A.A.M.; formal analysis, A.M. and A.A.; investigation, A.A. and S.S.A.; resources, A.M., A.A. and M.A.A.M.; data curation, A.A. and A.M.; writing—original draft preparation, A.A. and A.M.; and writing—review and editing, A.M. and A.A.; visualization, A.A. and A.M.; supervision, A.M., S.S.A. and A.A.; project administration, A.A., A.M. and M.A.A.M.; funding acquisition, S.S.A. All authors have read and agreed to the published version of the manuscript.

Funding

This research was funded by Researchers Supporting Project number (RSP2023R496), King Saud University, Riyadh, Saudi Arabia.

Data Availability Statement

The data is available upon request from the authors.

Acknowledgments

This research was supported by Researchers Supporting Project number (RSP2023R496), King Saud University, Riyadh, Saudi Arabia.

Conflicts of Interest

The authors declare no conflict of interest.

References

  1. IPCC. Climate Change 2001—Impacts, Adaptation and Vulnerability. 3rd Assessment Report of the Intergovernmental Panel on Climate Change; Cambridge University Press: Cambridge, UK, 2001. [Google Scholar]
  2. Güntner, A. Large-Scale Hydrological Modelling in the Semi-Arid North-East of Brazil. Ph.D. Thesis, Potsdam Institute for Climate Impact Research, Potsdam, Germany, 2002; p. 128. [Google Scholar]
  3. Duran-Encalada, J.A.; Paucar-Caceres, A.; Bandala, E.R.; Wright, G.H. The Impact of Global Climate Change on Water Quantity and Quality: A System Dynamics Approach to the US–Mexican Transborder Region. Eur. J. Oper. Res. 2017, 256, 567–581. [Google Scholar] [CrossRef] [Green Version]
  4. Chen, S.; Wu, D. Adapting ecological risk valuation for natural resource damage assessment in water pollution. Environ. Res. 2018, 164, 85–92. [Google Scholar] [CrossRef] [PubMed]
  5. Zhang, Y.; Xu, M.; Li, X.; Qi, J.; Zhang, Q.; Guo, J.; Yu, L.; Zhao, R. Hydrochemical Characteristics and Multivariate Statistical Analysis of Natural Water System: A Case Study in Kangding County, Southwestern China. Water 2018, 10, 80. [Google Scholar] [CrossRef] [Green Version]
  6. Wu, Z.; Guo, X.; Lv, C.; Wang, H.; Di, D. Study on the quantification method of water pollution ecological compensation standard based on emergy theory. Ecol. Indic. 2018, 92, 189–194. [Google Scholar] [CrossRef]
  7. Ling, H.; Yan, J.; Xu, H.; Guo, B.; Zhang, Q. Estimates of shifts in ecosystem service values due to changes in key factors in the Manas River basin, northwest China. Sci. Total Environ. 2019, 659, 177–187. [Google Scholar] [CrossRef]
  8. Ewaid, S.H.; Kadhum, S.A.; Abed, S.A.; Salih, R.M. Development and evaluation of irrigation water quality guide using IWQG V.1 software: A case study of Al-Gharraf Canal, Southern Iraq. Environ. Technol. Innov. 2019, 13, 224–232. [Google Scholar] [CrossRef]
  9. Jahin, H.S.; Abuzaid, A.S.; Abdellatif, A.D. Using multivariate analysis to develop irrigation water quality index for surface water in Kafr El-Sheikh Governorate, Egypt. Environ. Technol. Innov. 2020, 17, 100532. [Google Scholar] [CrossRef]
  10. Tanui, F.; Olago, D.; Dulo, S.; Ouma, G.; Kuria, Z. Hydrogeochemistry of a strategic alluvial aquifer system in a semi-arid setting and its implications for potable urban water supply: The Lodwar Alluvial Aquifer System (LAAS). Groundw. Sustain. Dev. 2020, 11, 100451. [Google Scholar] [CrossRef]
  11. Devi, G.; Goswami, L.; Kushwaha, A.; Sathe, S.S.; Sen, B.; Sarma, H.P. Fluoride distribution and groundwater hydrogeochemistry for drinking, domestic and irrigation in an area interfaced near Brahmaputra floodplain of North-Eastern India. Environ. Nanotechnol. Monit. Manag. 2021, 16, 100500. [Google Scholar] [CrossRef]
  12. Yuan, Q.-S.; Wang, P.-F.; Chen, J.; Wang, C.; Liu, S.; Wang, X. Influence of cascade reservoirs on spatiotemporal variations of hydrogeochemistry in Jinsha River. Water Sci. Eng. 2021, 14, 97–108. [Google Scholar] [CrossRef]
  13. Rayan, M.A.; Djebedjian, B. Egypt’s water demand, supply and management policies. Int. Water Demand Manag. Conf. Jordan 2004, 30, 1–24. [Google Scholar]
  14. Moghazy, N.H.; Kaluarachchi, J.J. Assessment of groundwater resources in Siwa Oasis, Western Desert, Egypt. Alex. Eng. J. 2019, 59, 149–163. [Google Scholar] [CrossRef]
  15. CAPMAS. Annual Bulletin of Statistical Crop Area and Plant Production, Cent. Agency Public Mobilization Stat, 2000–2011. 2019. Available online: https://www.capmas.gov.eg/Pages/Publications.aspx?page_id=5104&Year=23439 (accessed on 10 August 2019).
  16. Nour El-Din, M.M. Proposed Climate Change Adaptation Strategy for the Ministry of Water Resources & Irrigation in Egypt. Report of the UNESCO Cairo Office. Joint Programme for Climate Change Risk Management in Egypt, January 2013. 2017. Available online: https://www.eeaa.gov.eg/Uploads/Project/Files/20221123101650781.pdf (accessed on 10 May 2017).
  17. CAPMAS. Population Estimates by Sex and Governorate 1/1/2015. Archived (PDF) from the original on 19 October 2015.
  18. UNICEF; World Health Organization. Progress on Sanitation and Drinking Water—2015 Update and MDG Assessment; WHO: Geneva, Switzerland, 2015. [Google Scholar]
  19. Salman, S.A.; Asmoay, A.A.; El-Gohary, A.; Sabet, H. Evaluation of human risks of surface water and groundwater contaminated with Cd and Pb in the southern El-Minya Governorate, Egypt. Drink. Water Eng. Sci. 2019, 12, 23–30. [Google Scholar] [CrossRef] [Green Version]
  20. Ibrahim, R.G.M.; Korany, E.A.; Tempelc, R.N.; Gomaa, M.A. Processes of water–rock interactions and their impacts upon the groundwater composition in Assiut area, Egypt: Applications of hydrogeochemical and multivariate analysis. J. Afr. Earth Sci. 2019, 149, 72–83. [Google Scholar] [CrossRef]
  21. Qureshi, A.S.; Al-Falahi, A. Extent, characterization, and causes of soil salinity in central and southern Iraq and possible reclamation strategies. Int. J. Eng. Res. Appl. 2015, 5, 84–94. [Google Scholar]
  22. Bortolini, L.; Maucieri, C.; Borin, M. A Tool for the Evaluation of Irrigation Water Quality in the Arid and Semi-Arid Regions. Agronomy 2018, 8, 23. [Google Scholar] [CrossRef] [Green Version]
  23. Rahi, K.A.; Halihan, T. Salinity evolution of the Tigris River. Reg. Environ. Chang. 2018, 18, 2117–2127. [Google Scholar] [CrossRef]
  24. Asmoay, A.S.A. Hydrogeochemical Studies on the Water Resources and Soil Characteristics in the Western Bank of the River Nile between Abu Qurqas and Dayr Mawas, El Minya Governorate, Egypt. Ph.D. Thesis, Al-Azhar University, Cairo, Egypt, 2017. [Google Scholar]
  25. Sabet, H.; El-Gohary, A.; Salman, S.; Asmoay, A. Evaluation of Surface Water for Different Uses in the Area Between Abu Qurqas—Dyer Mawas Districts, El Minya Governorate, Egypt. IJISET Int. J. Innov. Sci. Eng. Technol. 2017, 4, 120–128. [Google Scholar]
  26. El-Gohary, A.M.; Sabet, H.S.; Salman, S.A.; Asmoay, A.S. Hydrogeochemistry of groundwater quality in the area between of Abu Qurqas—Dayer Mawas districts, El Minya Governorate, Upper Egypt. Int. J. Recent Adv. Multidiscip. Res. 2017, 4, 2493–2497. [Google Scholar]
  27. Zeid, S.A.; Seleem, E.M.; Salman, S.A.; Abdel-Hafiz, M.A. Water quality index of shallow groundwater and assessment for different usages in El-Obour city Egypt. J. Mater. Environ. Sci. 2018, 9, 1957–1968. [Google Scholar]
  28. Centers for Disease Control and Prevention; U.S. Department of Housing and Urban Development. Healthy Housing Reference Manual; U.S. Department of Health and Human Services: Atlanta, GA, USA, 2006.
  29. Mohamed, A.; Asmoay, A.; Alshehri, F.; Abdelrady, A.; Othman, A. Hydro-Geochemical Applications and Multivariate Analysis to Assess the Water–Rock Interaction in Arid Environments. Appl. Sci. 2022, 12, 6340. [Google Scholar] [CrossRef]
  30. Said, R. The Geological Evolution of the River Nile; Springer: New York, NY, USA, 1981. [Google Scholar] [CrossRef]
  31. Conoco. Egyptian general authority for petroleum. In Scale (1:500,000) between El-Minia and Sohag; Conoco: Ponca City, OK, USA, 1987. [Google Scholar]
  32. Said, R. The Geology of Egypt; Balkema Publishing Company: Rotterdam, The Netherlands; Brookfield, WI, USA, 1990; 734p. [Google Scholar]
  33. RIGW. Hydrogeological Map of Egypt, Assuit and Manfalut, Scale 1:100,000, 1st ed.; 1994.
  34. Sadek, M.A. Isotopic criteria for upward leakage in the alluvial aquifer in north El Minia district, Egypt. Ann. Geol. Surv. Egypt 2001, XXIV, 585–596. [Google Scholar]
  35. APHA. Standard Methods for the Examination of Water and Wastewater, 19th ed.; American Public Health Association: Washington, DC, USA, 1995. [Google Scholar]
  36. USSL. Diagnosis and improvement of saline and alkaline soils. In United State Science Laboratory Department, Agriculture Handbook; USDA: Washington, DC, USA, 1954; Volume 60, 147p. [Google Scholar]
  37. Todd, D.K. Groundwater Hydrology, 2nd ed.; John Wiley: New York, NY, USA, 1980; 535p. [Google Scholar]
  38. World Health Organization. Guidelines for Drinking-Water Quality: Fourth Edition Incorporating the First and Second Addenda; WHO: Geneva, Switzerland, 2022. [Google Scholar]
  39. Wilcox, L.V. Classification and Use of Irrigation Waters, USDA, Circular 969; United States Department of Agriculture: Washington, DC, USA, 1955. [Google Scholar]
  40. Miller, H.J. The amounts of nitrogen as ammonia and as nitric acid and chlorine in the rainwater collected at Rothamsted. J. Agric. Sci. 1902, 1, 280–303. [Google Scholar] [CrossRef] [Green Version]
  41. Eriksson, E. Composition of Atmospheric Precipitation. Tellus 1952, 4, 280–303. [Google Scholar] [CrossRef]
  42. Uugulu, S.; Wanke, H. Estimation of groundwater recharge in savannah aquifers along a precipitation gradient using chloride mass balance method and environmental isotopes, Namibia. Phys. Chem. Earth Parts A/B/C 2020, 116, 102844. [Google Scholar] [CrossRef]
  43. Segobaetso, T.K.; Tafesse, N.T.; Mapeo, R.; Laletsang, K. Groundwater recharge using the chloride mass balance method in the Kanye area, in southeast Botswana. J. Afr. Earth Sci. 2022, 193, 104534. [Google Scholar] [CrossRef]
  44. Boyd, C.E. Water Quality: An Introduction; Kluwer Academic Publisher: New York, NY, USA, 2000; 330p. [Google Scholar]
  45. Piper, A.M. A graphic procedure in the geochemical interpretation of water-analyses. Eos Trans. Am. Geophys. Union 1944, 25, 914–928. [Google Scholar] [CrossRef]
  46. Bai, X.; Tian, X.; Li, J.; Wang, X.; Li, Y.; Zhou, Y. Assessment of the Hydrochemical Characteristics and Formation Mechanisms of Groundwater in A Typical Alluvial-Proluvial Plain in China: An Example from Western Yongqing County. Water 2022, 14, 2395. [Google Scholar] [CrossRef]
  47. Gibbs, R.J. Mechanisms Controlling World Water Chemistry. Science 1970, 170, 1088–1090. [Google Scholar] [CrossRef]
  48. Ayers, R.S.; Westcott, D.W. Water Quality for Agriculture. Irrigation and Drainage; Paper No. 29; FAO: Rome, Italy, 1985. [Google Scholar]
  49. Fipps, G. Irrigation Water Quality Standards and Salinity Management; Texas A & M University System: College Station, TX, USA, 1998. [Google Scholar]
  50. He, Y.; DeSutter, T.; Casey, F.; Clay, D.; Franzen, D.; Steele, D. Field capacity water as influenced by Na and EC: Implications for subsurface drainage. Geoderma 2015, 245–246, 83–88. [Google Scholar] [CrossRef]
  51. FAO. Water for Animal; Report AGL/MISC/4/85; FAO: Rome, Italy, 1986. [Google Scholar]
  52. Hem, J.D. Study and Interpretation of the Chemical Characteristics of Natural Water, 3rd ed.; U.S. Geological Survey: Reston, VA, USA, 1985; 264p. [Google Scholar]
Figure 1. Location map showing the study area.
Hydrology 10 00086 g001
Figure 2. Geological map of the study area (after [31]).
Hydrology 10 00086 g002
Figure 3. Land-use classification of the study area.
Hydrology 10 00086 g003
Figure 4. Piper’s diagram showing classification of the water samples in the study area.
Hydrology 10 00086 g004
Figure 5. The relationships between the major ions show the dissolution process in the studied water samples (ad).
Hydrology 10 00086 g005
Figure 6. USSL diagram for classification of irrigation waters [36].
Hydrology 10 00086 g006
Figure 7. Classification of water irrigation based on the Wilcox diagram.
Hydrology 10 00086 g007
Figure 8. Percentages of the water parameters under investigation that are appropriate for some industries.
Hydrology 10 00086 g008
Table 1. Descriptive statistical values for the detected variables in the studied water samples.
Surface Water Samples
T (°C)pHEC (µS/cm)TDS
(ppm)
TH
(ppm)
Ca2+
(ppm)
Mg2+
(ppm)
Na+
(ppm)
K+
(ppm)
HCO3 (ppm)Cl
(ppm)
SO42−
(ppm)
safe limit [38] -6.5–8.5150010005007510025012-250250
Valid181818181818181818181818
Missing000000000000
Minimum22.6006.390264.000204.000120.00018.00021.87020.7007.038175.68038.9981.440
Maximum26.1007.5101060.000854.000400.00060.00089.910195.50074.287488.000248.171110.400
Median24.6007.115277.500213.000155.00038.00029.76730.4509.192249.49048.41716.500
Mean24.4837.116375.222290.778181.11134.72233.26453.17616.023266.87567.50630.524
Variance1.1630.08247,696.88930,576.4184610.458146.330246.2752305.191347.4196942.9592365.8381050.773
Std. Deviation1.0780.286218.396174.86167.90012.09715.69348.01218.63983.32448.64032.416
Skewness−0.090−0.8662.4192.5172.4310.3043.1131.9932.7621.2443.3801.634
Groundwater Samples
T (°C)pHEC (µS/cm)TDS
(ppm)
TH
(ppm)
Ca2+
(ppm)
Mg2+
(ppm)
Na+
(ppm)
K+ (ppm)HCO3
(ppm)
Cl
(ppm)
SO42−
(ppm)
Valid303030303030303030303030
Missing000000000000
Minimum23.0006.400207.000156.000120.00030.00020.65523.0005.474189.10049.6347.200
Maximum32.9007.0001452.0001069.0001120.000240.000170.100575.00022.677915.000886.325912.000
Median25.5006.720638.000496.500325.00076.00052.97484.55011.534375.15089.36590.900
Mean25.9736.717713.233548.500380.66785.73361.394128.17011.238431.087148.640151.669
Variance5.7070.022136,597.08278,828.25943,896.0922202.4091083.73216,521.01315.52828,793.64129,072.52537,122.799
Std. Deviation2.3890.148369.590280.764209.51446.93032.920128.5343.941169.687170.507192.673
Skewness1.544−0.3020.5480.5121.7361.6121.4732.1870.6631.0363.4252.719
Table 2. Water quality guidelines for livestock and poultry (after [51]).
Salinity
(EC μs/cm)
CharactersWater Samples
<1500ExcellentAll the studied water samples
1500–5000Very satisfactory -
5000–8000Satisfactory for livestock, unfit for poultry-
8000–11,000Limited for livestock, unfit for poultry-
11,000–16,000Very limited use -
˃16,000Not recommended-
Table 3. Water quality requirements for some industries according to [52].
ParameterIndustries
Fruit & VegetablePaperTextilePetroleumWood ChemicalsSynthetic RubberHydraulic CementLeather Tanning
pH6.5–8.56–106.5–8.56–96.5–86.2–8.36.5–8.56–8
TDS500-10010001000-600-
TH25010025350900350--
Ca2+-20-7510080--
Mg2+-12-305036--
HCO3----250---
Cl250200-300500-250250
SO42−250---100-250250
Ions expressed in ppm. Note: The absence of values in this table either indicates that the constituent has no limit or that it cannot reach objectionable amounts in water that complies with the other requirements.
Disclaimer/Publisher’s Note: The statements, opinions and data contained in all publications are solely those of the individual author(s) and contributor(s) and not of MDPI and/or the editor(s). MDPI and/or the editor(s) disclaim responsibility for any injury to people or property resulting from any ideas, methods, instructions or products referred to in the content.

