Article

Comparison between the Effects of Normal Rain and Acid Rain on Calcareous Stones under Laboratory Simulation

1
Department of Chemistry and Applied Physics, Universidad de León, c.p. 24071 León, Spain
2
Department of Mining Technology, Topography and Structures, Universidad de León, c.p. 24071 León, Spain
3
Department of Mechanical, Computer and Aerospace Engineering, Universidad de León, c.p. 24071 León, Spain
*
Authors to whom correspondence should be addressed.
Hydrology 2023, 10(4), 79; https://doi.org/10.3390/hydrology10040079
Submission received: 1 March 2023 / Revised: 25 March 2023 / Accepted: 28 March 2023 / Published: 31 March 2023

Abstract

:
Acid rain is a problem that despite efforts to reduce atmospheric pollution, continues to impact not only countries where there is a high production of pollutants, but also transboundary areas to which the pollutants are transported. In addition to its effects on human health, there are also the effects on infrastructure and the consequences that this entails. This study on the effect of rain and acid rain on calcareous materials highlights the need for protection of buildings constructed from these materials, many of which are part of the cultural heritage. The effects caused by rain and acid rain were studied using a rain simulator whose features allow the simulation of natural conditions as realistically as possible. In the same way, the effect of a coating synthesized from nanomaterials, which has been shown to serve as protection against the degradation caused by rain, was analyzed. In addition to a long-lasting protection of the stone material, this type of coating avoids the need for the replacement of elements and the recurrent cleaning of degraded parts. It also avoids the accumulation of parts on the ground, the transport of personnel, work materials and raw materials, thereby contributing to the reduction of the carbon footprint and water savings, which in turn reduces the production of pollutants that cause acid rain.

1. Introduction

The effects of the passage of time and climate on cultural heritage monuments built with stone material are well known [1]. If to this natural wear and tear the effect of acid rain produced by the increasing pollution produced in the most industrialized cities is added, the deterioration of rock surfaces progresses much faster. These anthropogenic emissions have a direct impact on the durability of the built environment, affecting historical monuments as well as modern buildings [2,3,4,5]. Many studies on the effect of climate change on historic monuments focus on the problems produced in the interior of such buildings and focus on solutions applicable indoors. Lankester and Brimplecombe (2012) [6] presents a local predictive model of temperature changes to help prevent the increase in humidity that can lead to the appearance of mold indoors; Anaf et al. (2018) introduce an application to calculate an indoor air quality index which helps to implement mitigation actions [7]; Loli and Bertolin (2018) [8] evaluate climate-induced deterioration variables and how they affect different materials, focusing on floors, roofs, windows, masonry, etc.; Coelho et al. (2020) and Muñoz González et al. (2020) [9,10] evaluate infrastructure improvements that can buffer indoor temperature variations and increased humidity from the outside and at the same time can reduce energy consumption. However, another problem, more difficult to address, is the effect of climate on the facades of such buildings since the effect of being outdoors cannot be avoided. Working with this type of building means finding solutions that do not change the aesthetics of the building. Therefore it is very difficult to find a truly effective solution evaluated with a scientific method that also contributes to the reduction of the carbon footprint [11]. Several studies explain how organic protections based on fungi with certain proteins that confer hydrophobic properties to the surface of rocks can protect building surfaces. Other papers use fluorinated acrylic copolymers or polysiloxane-nanoparticle composite coatings that exhibit superhydrophobic properties [12,13,14]. However, these solutions have complex applications at the monument scale and some of them darken the surfaces of the rocks on which they are applied. It is, therefore, essential to study the impact of any treatment on rock surfaces in the laboratory in order to minimize the deterioration of buildings without compromising their aesthetics and also to ensure that the treatment is feasible. This requires that the treatments are easy to apply, that no post-treatment is necessary and that they are not only effective against pollution but can also resist the effects of the aggressive weathering that accompanies climate change. In addition, it is essential to work with natural materials that do not generate by-products when mitigating climatic change in the cultural heritage sector [5].
The exteriors of buildings constantly suffer the effects of atmospheric agents. Through wet atmospheric deposition, contaminant particles are incorporated into small droplets and transferred to the rock surface. However, not only the particles are harmful; the water itself and its acidity can cause the pore walls to dissolve. The pH of water is usually 6–7, and any rain with a pH below 6 is considered acid rain (Figure 1). This means that normal rainwater is considered slightly acid, a trend that has been increasing since the industrial revolution [15,16]. The pollutants from air such as NOx, NH3, and H2S can mix with water molecules to form acid rain [17]. Typical pH values of acid rain due to anthropogenic emissions may be in the range of 3.5–5 [18]. This process is very important in areas where buildings and monuments remain wet for a long time and in rural areas.
Due to the unrelenting increases in pollution, there are several studies on the behavior of stones exposed to sulfurous and nitric acid atmospheres [20,21]. The effects of the pollutants depend as much on their concentration in the atmosphere, the environmental conditions and exposure levels as on the characteristics of the rock itself, i.e., composition, porosity, etc. Even rocks from the same quarry can have different geomechanical properties depending on the position of the layer from which they have been extracted and can suffer different deterioration [22,23]. In addition, among the climatic parameters critical for heritage conservation, acid rain acts on carbonate rocks generating more CO2, which in turn, generates more pollution, increasing the problem with new acid rain production [24]. Studies about carbon release sources are a key point in the study of acid rain [25].
The results of this work will demonstrate how it is possible to simulate realistic, more aggressive weather scenarios with heavy rainfall and acid rain and that a nanomaterial-based protection can decrease the deterioration of the rock in both rainfall scenarios.

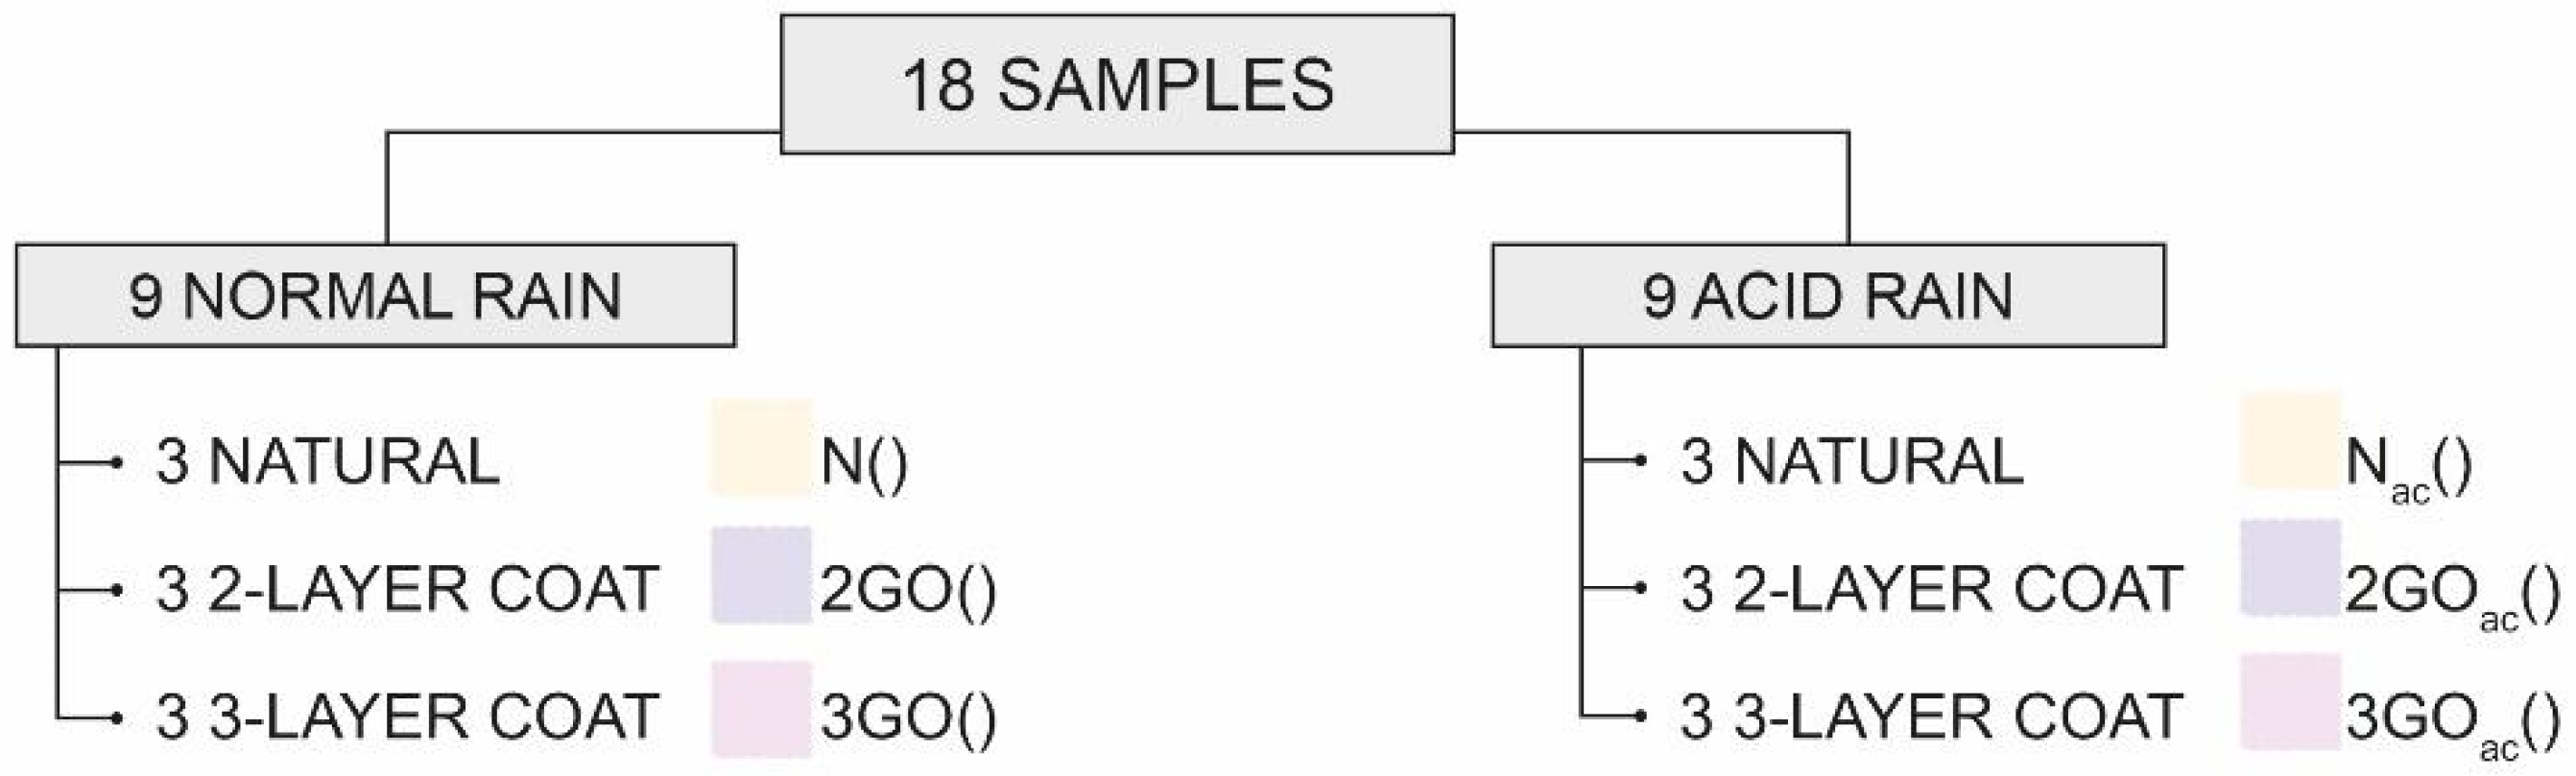
2. Materials and Methods

To carry out this study, we worked with a rainfall simulator described in Fernández-Raga et al. (2022) [26], located in a courtyard of the School of Engineering of the University of León (northwest Spain). This simulator allows the reproduction of rainfall with characteristics that are comparable to those of rainfall under natural conditions because it is located at a height of 10 m, the minimum height required to achieve the terminal velocity of natural raindrops [27,28,29]. The amount of water expelled by the simulator was compared with the total accumulated precipitation data recorded at the meteorological station of La Virgen del Camino (León) and with the data recovered by a disdrometer located on the same campus where the rainfall simulator is installed [30,31]. The accumulated annual rainfall in León is approximately 500 mm. Therefore, with a rainfall intensity of 8.75 L/m2 per minute, the approximate equivalence is that one hour of simulation is equivalent to one year of rainfall in León.
A type of dolomite, from the same geological formation but from two different members (Figure 2) was chosen for comparative tests in rain and acid rain. Even if the results only refer to this type of rock with specific properties, such as porosity, the damaging effect of acid rain can be checked and a protective measure against its effects proposed.
The rock used in this experiment is the limestone of Boñar, a fine-grained, crystalline, highly dolomitized rock. It is characterized by the presence of spastic cement filling in fissures and cavities. The average porosity of these rocks is 5%, and the bulk density is 2.78 g/m3 [32]. This type of stone has been chosen because it has been widely used in numerous buildings.
The materials tested were dolomites cut into 5 cm cubes, which were placed under the simulator and subjected to the impact of rainfall for the specified time. To avoid the effect that tap water ions could have on the carbonate rocks, the water used in the test was deionized water. The rocks were subjected to one hour of rain simulation consisting of (55 s rain + 5 s pause) × 60 cycles (the rainfall simulations are stopped for 5 s so that the water pumps do not lose effectiveness). This is equivalent to one year of total accumulated rainfall in the city of León. The samples were then subjected to cycles of thermal changes: 60 min of cold (−18 °C) + 30 min of heat (+35 °C) (Figure 3). This process was repeated until 20 h of simulation were completed.
The effects of rain and thermal changes was studied by quantifying the surface of 18 rock cubes, comparing their appearance before and after the test. The surface of all faces of each cube was scanned with a structured-light 3D scanner. The equipment used was a Breuckmann smart SCAN3D-HE scanner and OptoCat software. This technique is based on the reconstruction of objects or surfaces in three dimensions by projecting a fringe pattern (with a projection unit) and capturing points on the surface with two cameras located on both sides of the projection unit. A so-called miniaturized projection technique was used. The geometric shape of the object was triangulated with an estimated accuracy of 9 microns. The digitization of the samples was carried out with the smallest field of view (FOV 125 mm) capable of capturing the entire volume with the minimum number of scans (4) [33]. From each 3D model obtained, only the meshes representing the shape of the object were exported. Subsequently, the Geomatic Control software performed the comparison of the surfaces before and after the test. The comparison is made by aligning the two sample models and measuring the distance between homologous points (Figure 4). In this way it is possible to quantify the loss of material caused by the erosion process.
The measurements had a tolerance of ±0.0035 mm and ±0.0050 mm (for normal and acid rain, respectively). It is important to note that amounts of material lost under normal and acid rain conditions are different, so ranges with different values in each case are used to quantify this parameter (Table 1).
In addition to studying the impact of rain on natural dolomites, 2/3 of the dolomites were coated with a product synthesized from a nanomaterial [34] to test its effectiveness as a protector of the rock surface against degradation due to rain (Figure 5). The protective product used was graphene oxide (GO), which has recently attracted considerable attention for its proven effect as a protective coating [34,35]. In addition, the fact that the chosen concentration of the product does not change the aesthetic of the stone makes it of great value for the protection of historical heritage.
The same test was performed using an equivalent of acid rain, which was achieved by adding sulfuric acid to the water, lowering its pH to 4–4.5. Sulfuric acid and nitric acid are the main acids responsible for acid rainfall in natural conditions, but the addition of both these acids together to decrease the pH value was not possible because they react with each other. Therefore, sulfuric acid was chosen as it is more damaging and is intended to simulate the most unfavorable conditions [36]. The deionized water used had an average pH of 6.6, so to lower the pH to 4–4.5, 10 mL of sulfuric acid was added to each 100 L tank of deionized water.

3. Results

The results obtained are divided into four blocks according to the type of rainfall simulated (normal or acid) and according to the state of the sample (natural or with the protective hydrophobic coating). The data are represented in a color fan that indicates how much material was lost in each sample after it was subjected to a simulated amount of rainfall representing a 20-year time period.

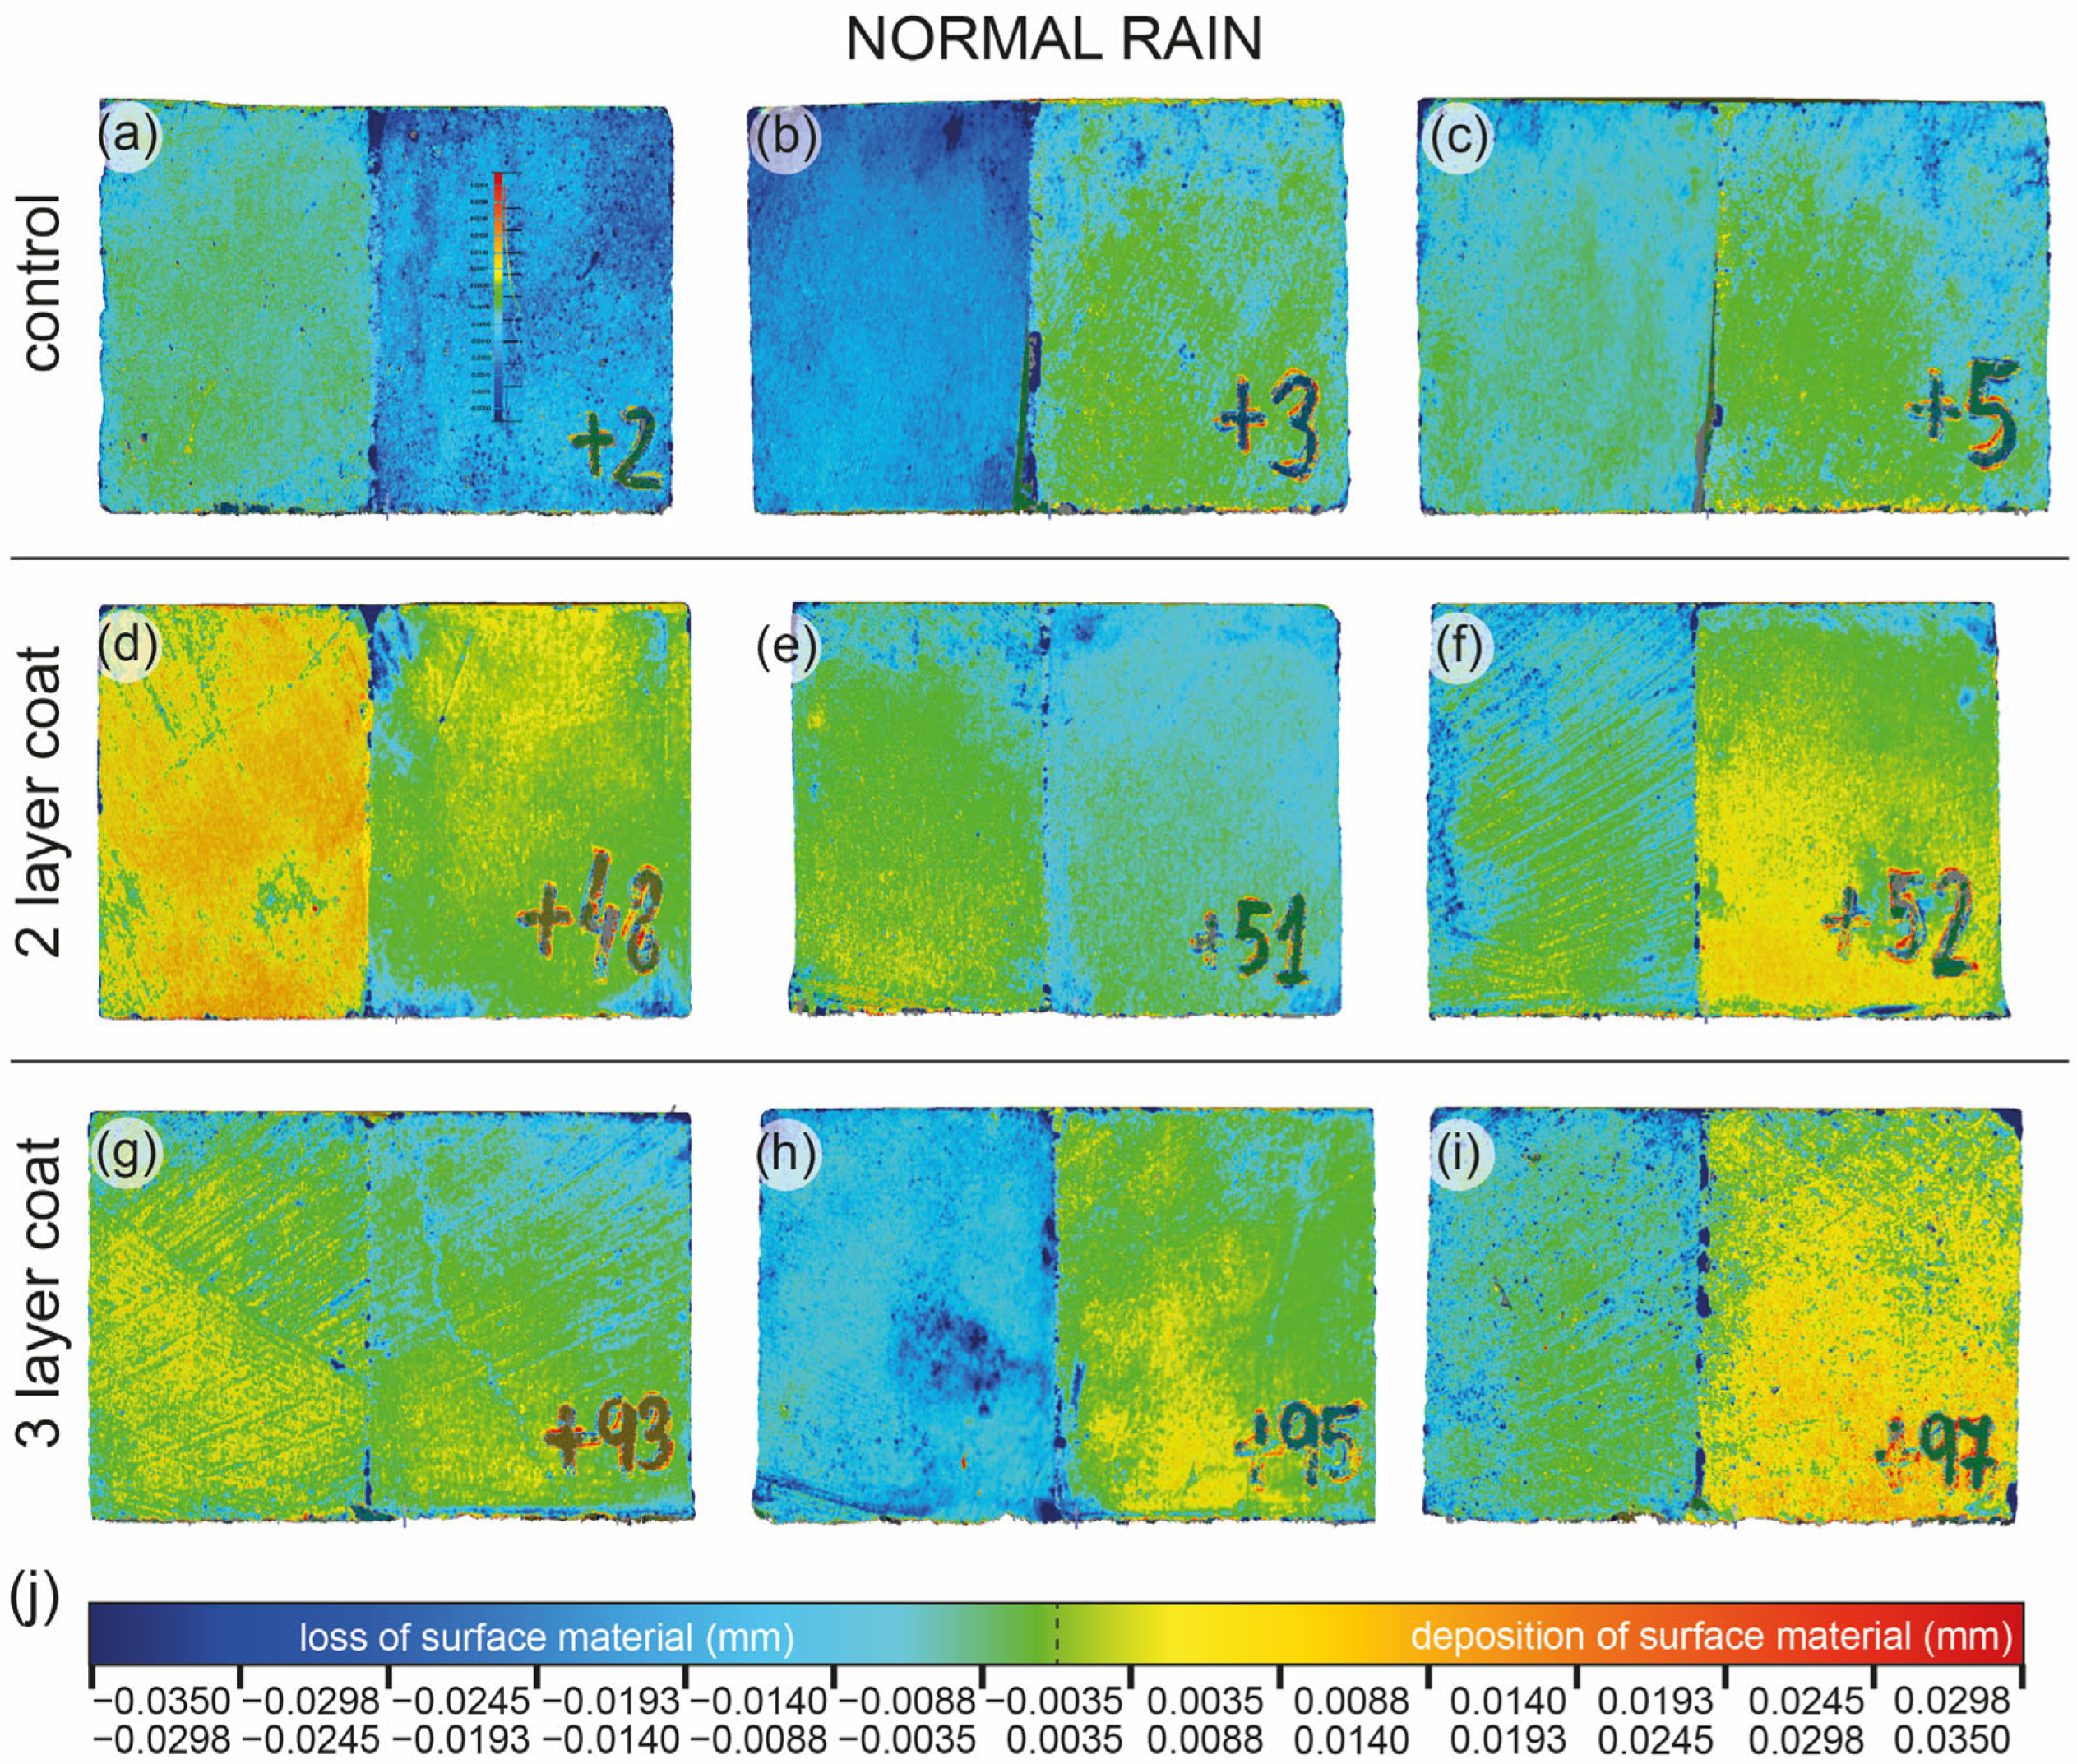
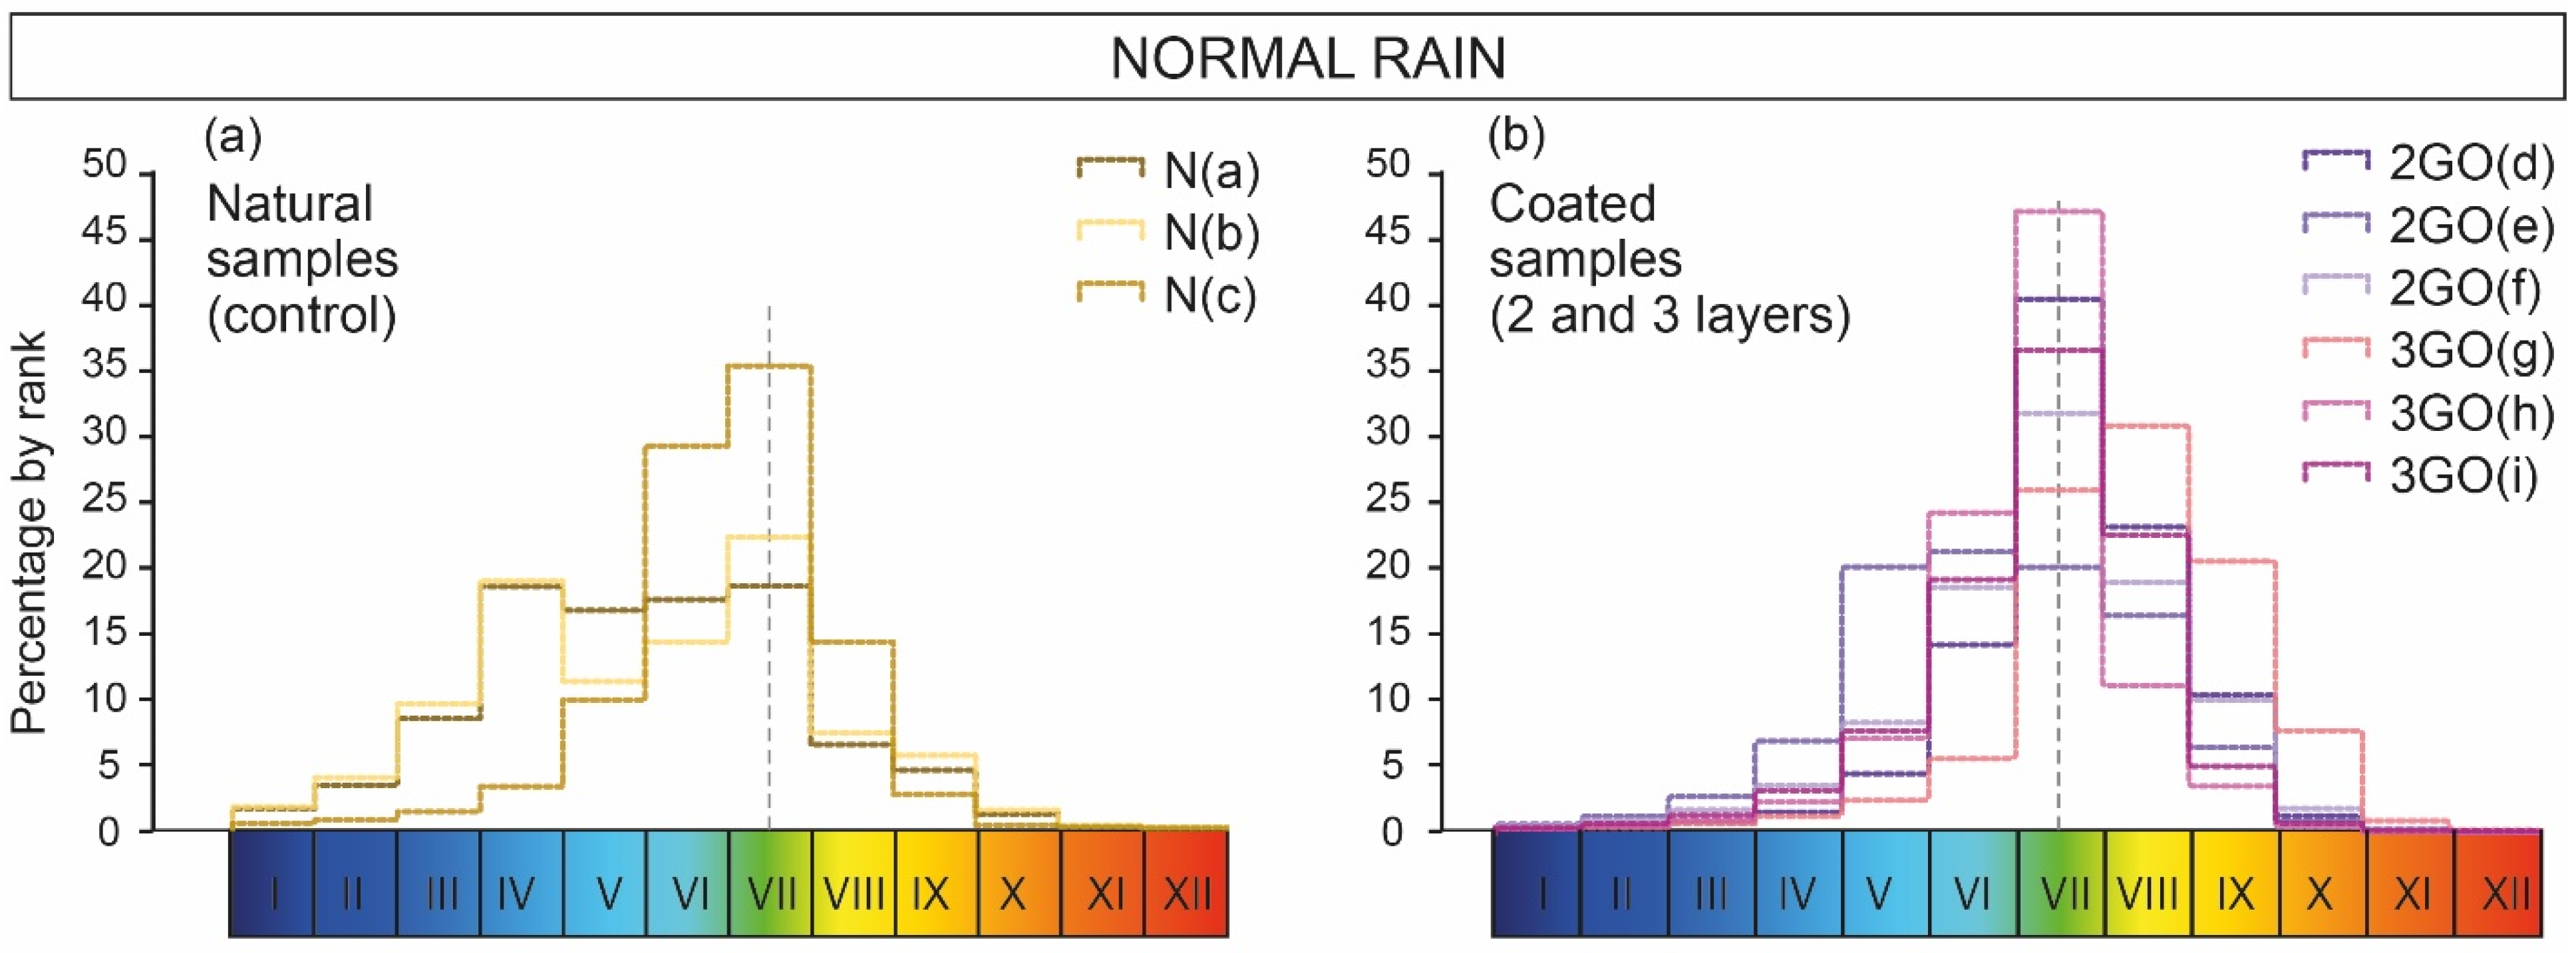
3.1. Normal Rain on Natural Samples

The results of the comparison between the surface of the cubes before and after subjecting them to an equivalent of 20 years of rain are shown in Figure 6. The samples were depending on whether they were natural samples (control) or if they were covered by two or three layers of protective coating (2-layer coat and 3-layer coat, respectively). Qualitatively, it is possible to see that either the surfaces remained stable, as represented by the green color, or there was some loss of material, as represented by the bluish colors.
The distribution of the total change in the mesh points before and after testing shows a bimodal distribution for the natural samples N(a) and N(b) and a normal distribution for sample N(c) (Figure 7a). In all three samples the surfaces remained stable or lost some material, around 0.003 mm, at many of the measurement points. However, in samples N(a) and N(b), there was also a peak loss between 0.0140 and 0.0193 mm at 17–18% of the measuring points.

3.2. Normal Rain on Coated Samples

In this case, the colors resulting from the comparison between the coated surfaces before and after the rain test are mostly green and yellow rather than blue (Figure 6d–i), although blue is also present. The yellow and orange tones represent points where there has been material gain. Blue colors appear mainly on the edges and corners, except for sample (Figure 6h), where it is on the entire left-face.
The distribution of the percentages of variation in the surfaces in the case of overlaid cubes is generally unimodal (Figure 7b). The surfaces of the samples seem to have remained stable during the rain test, except for sample 2GO (Figure 6d), which shows a slight gain in most of its points, and sample 3GO (Figure 6h) that shows an asymmetric distribution.
With respect to the number of layers, there are no significant differences between the distributions corresponding to the samples covered with two layers and those with three layers (Figure 6d–i and Figure 7b).

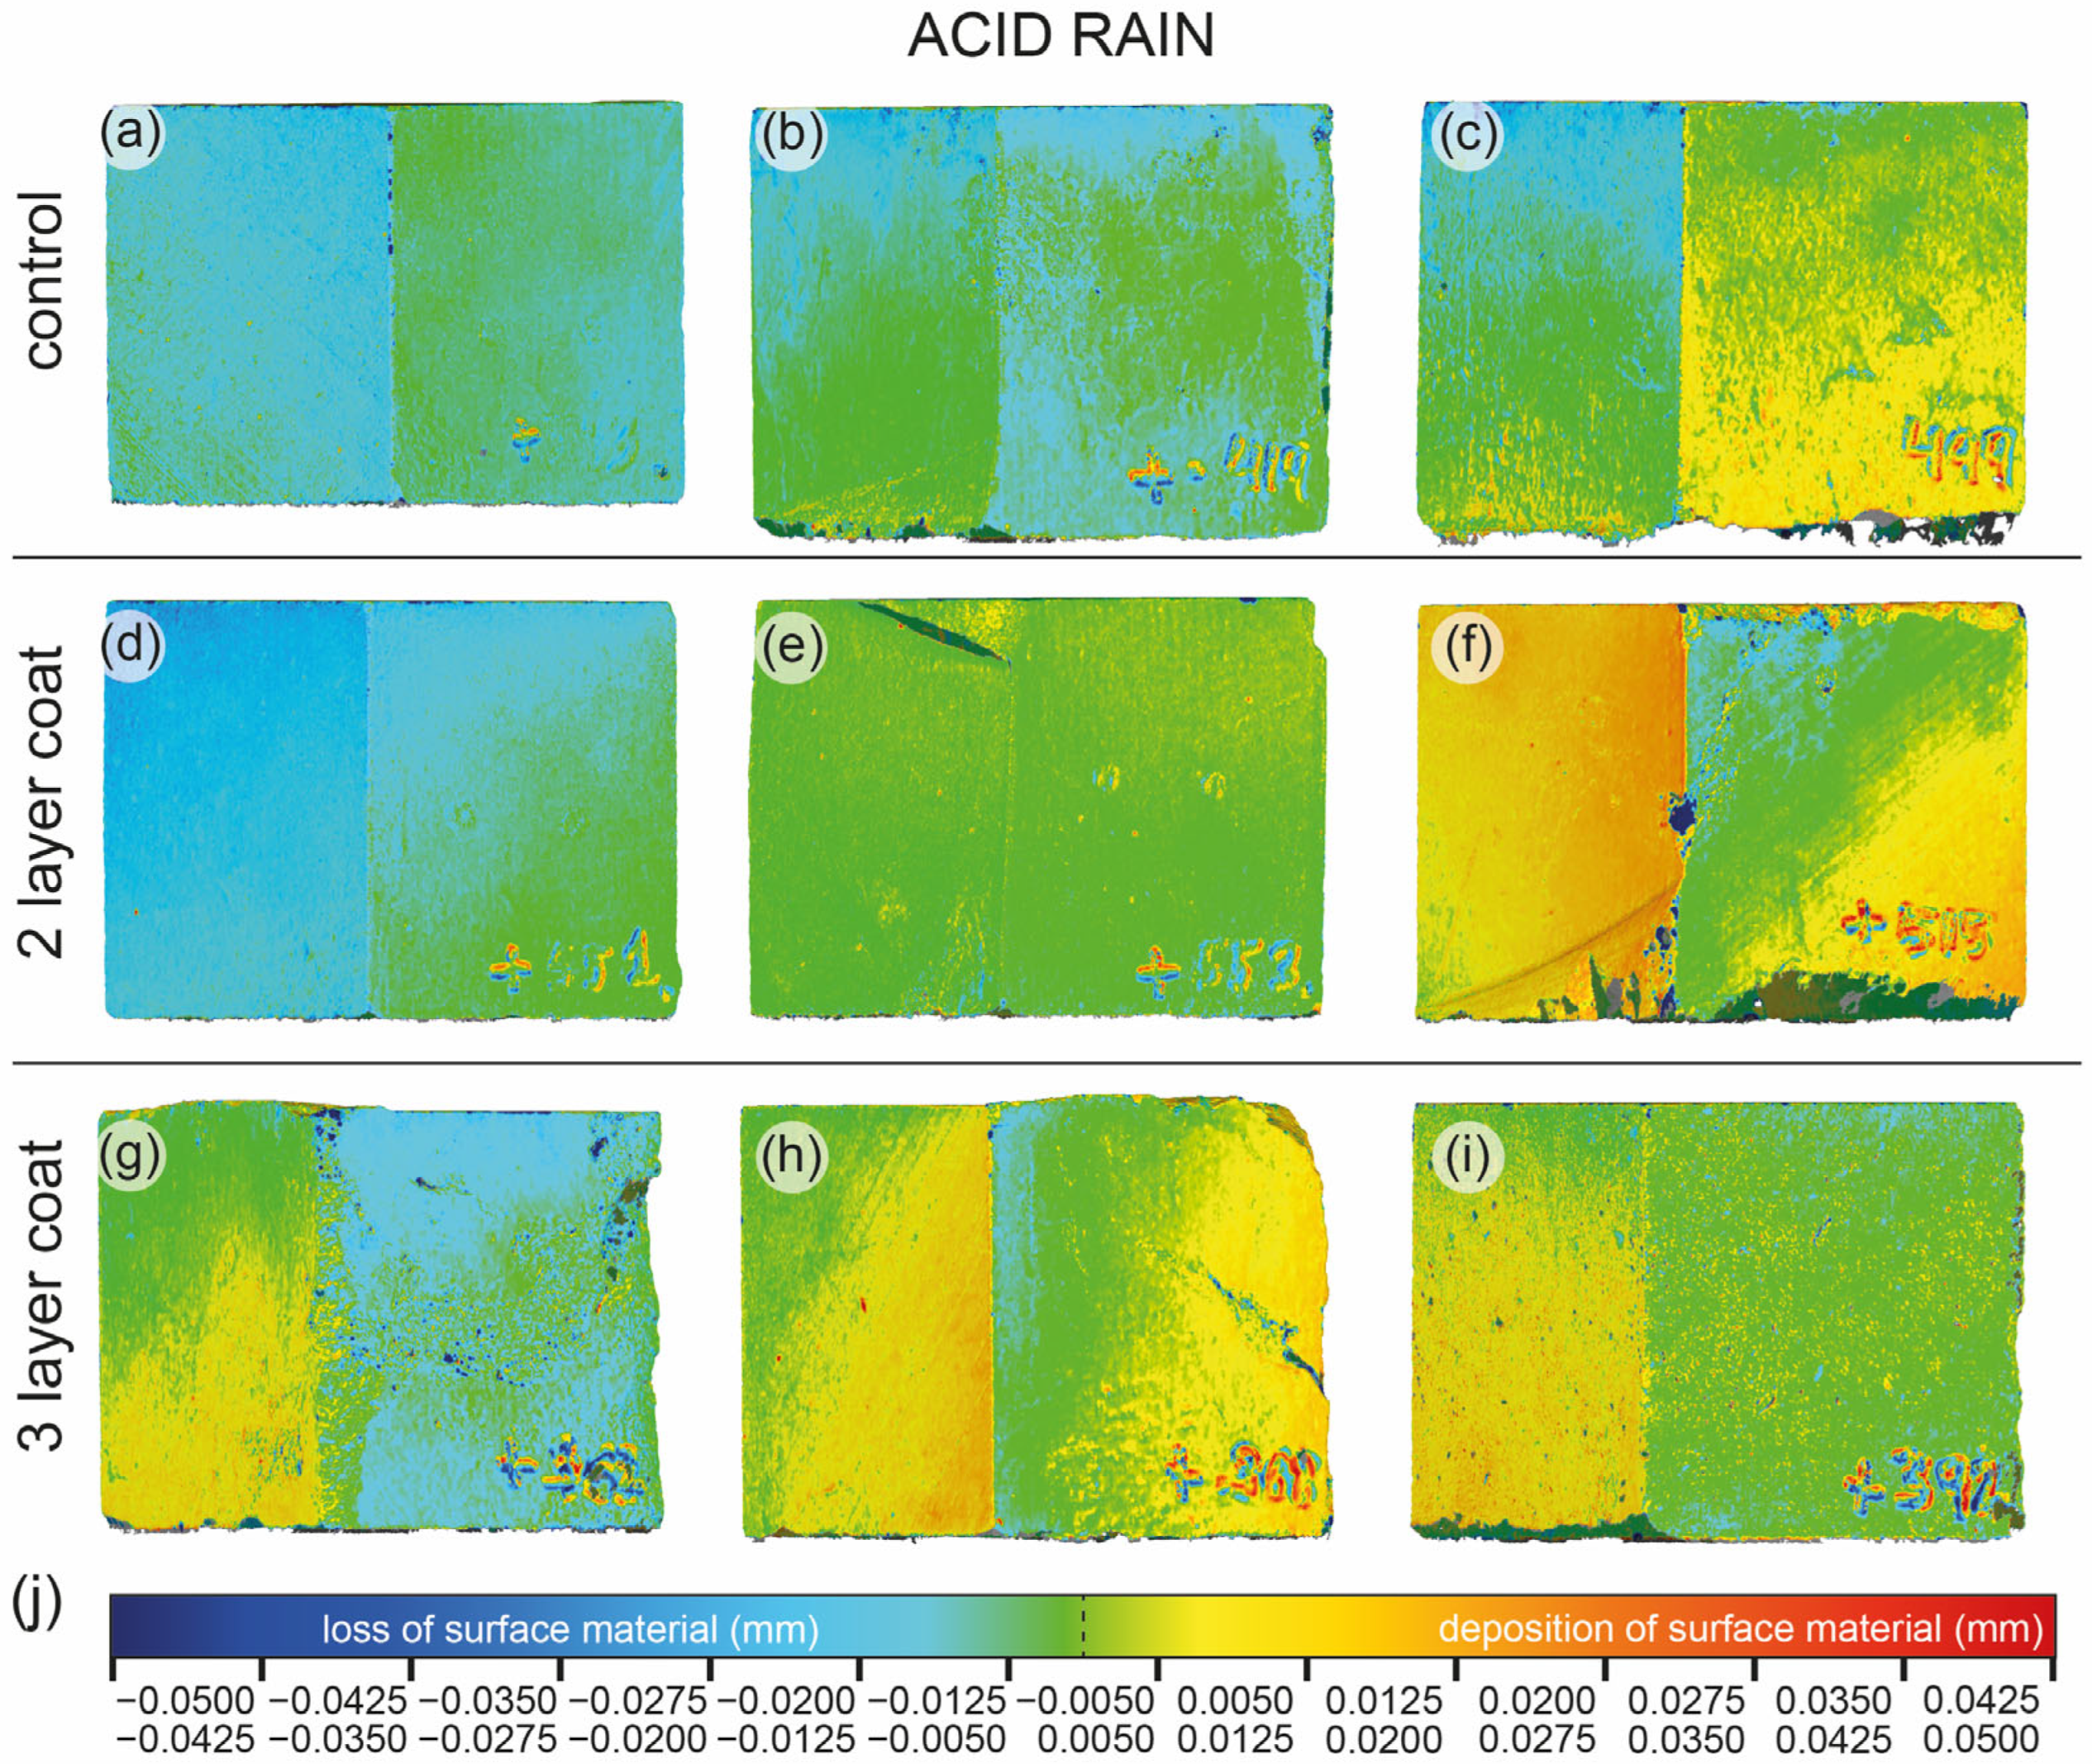
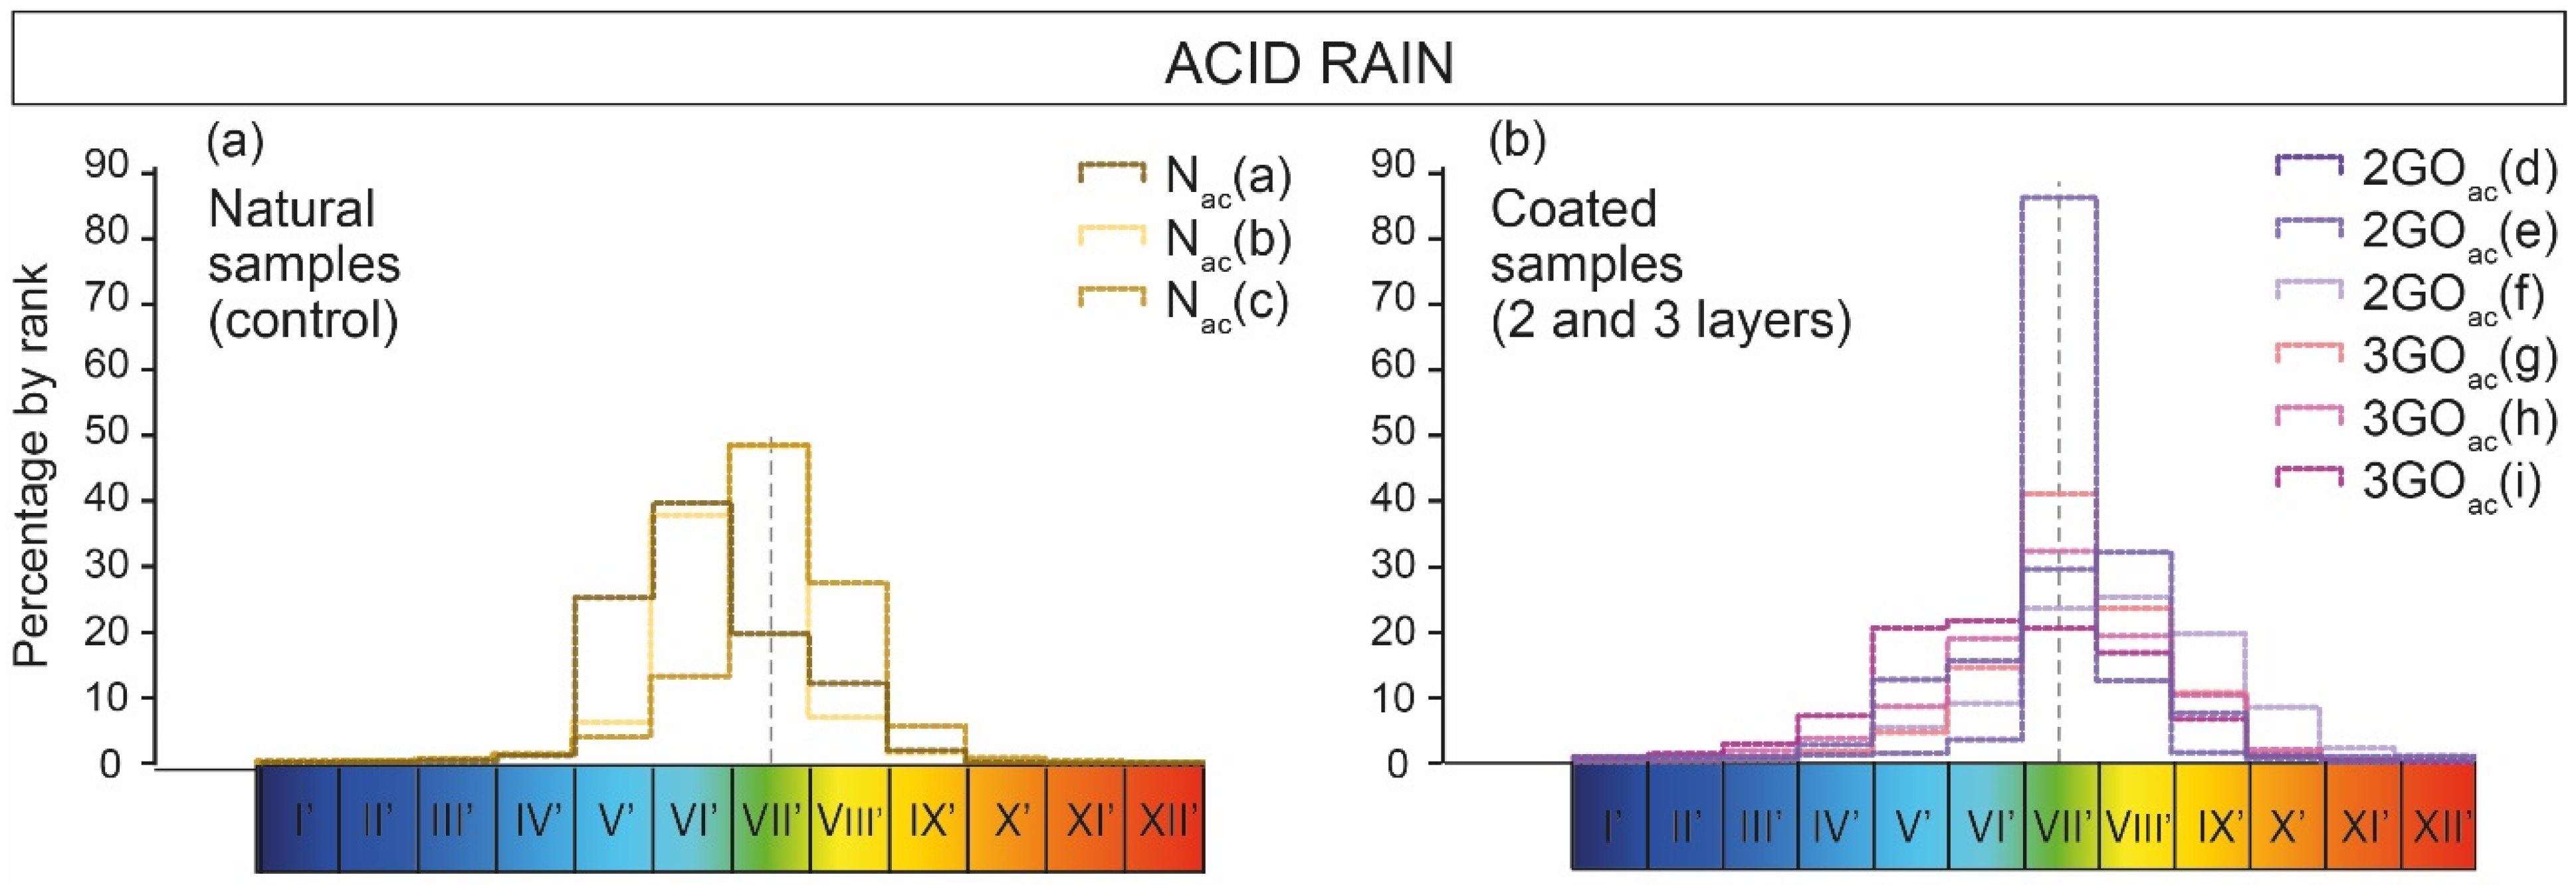
3.3. Acid Rain on Natural Samples

The results of the comparison between the surface of the cubes before and after subjecting them to an equivalent of 20 years of acid rain are shown in Figure 8a–c. Qualitatively, it is possible to see that either the surfaces remained stable, as represented by the green color, or that there was some loss of material, as represented by the bluish colors, or even there was some material gain, as represented by yellow color.
The distribution of the total change in the mesh points in natural samples before and after testing shows a normal distribution with a main peak loss (Figure 9a), which means that almost 40% of the measured points lost between 0.005 and 0.0125 mm of material.

3.4. Acid Rain on Coated Samples

In this case, the colors resulting from the comparison between the coated surfaces before and after the rainfall test are green and yellow rather than blue (Figure 8d–i), although blue is also present. The yellow and orange tones represent points where there was material gain. Blue colors appear mainly on the edges and corners, except for sample 2GOac (Figure 8d), where it is on the entire left-face, and 3GOac (Figure 8g), where there is some blue on its right-face.
The distribution of the percentages of variation in the surfaces in the case of overlaid cubes is generally unimodal (Figure 9b). Except for sample 3GOac (h) (Figure 9b), which shows a slight gain in most of its points, and sample 3GOac (i) (Figure 9b) that shows an asymmetric distribution, the surfaces of the samples seem to have remained stable during the acid rain test.
With respect to the number of layers, there are no significant differences between the distributions corresponding to the samples covered with two layers and those with three layers (Figure 8d–i).

4. Discussion

4.1. Comparison between Natural Samples and Coated Samples

After simulating 20 years of rain and thermal changes on dolomite specimens, the results obtained from the comparison of the scans of the specimens before and after the test show a bimodal distribution of material variation on the surface in the natural samples and a normal distribution of material variation of the surface in the coated samples (Figure 7). While both cases show a material loss of less than 0.003 mm, the natural samples also lose a maximum of 18% at points of sizes between 0.01 and 0.02 mm. Therefore, the coated samples have suffered less erosion due to rainfall. Material gain is also observed, probably due to the contribution of the protective product layers.
The case that specimen number N(c) shows a normal surface variation distribution similar to the protected specimens may indicate that this particular specimen was more resistant due some difference in its physical properties (Figure 10). Given the rock’s own heterogeneity, it could have a slightly different mineralogical composition, a lower percentage of porosity, or a higher degree of recrystallization, etc. The heterogeneity could also explain why other samples have a different pattern than the rest of the coated samples (Figure 9). In these cases, there were cracks running through the sample that represent clay fill, which is more easily eroded. The pattern in sample Nac (c) (Figure 9b) shows a deposition of surface material that is higher than the mean, which is in accordance with the appearance of microorganisms in its surface. In sample 3GOac (g) (Figure 9b), even though protection should have protected it from erosion, the pattern in Figure 9b shows a loss of material from its surface. This is due to the origin of that sample in the part of the quarry where the limestones of Boñar are close to their lower limit and the composition is more clayey, making the sample less resistant.
With respect to the samples coated with nanomaterials, there was no difference between those coated with two layers and those coated with three layers. Thus, two protective layers would protect the stone material. More than three layers could mean more protection, but the color of this particular dolomite changes tone with more than three layers, so a greater number of layers could not be used in heritage protection.
These results show that although the applied protective product, graphene oxide, mostly protects the rock surface from erosion caused by rain and thermal changes, there are other factors that may cause an unexpected response. The composition of the rock, with the presence of clays and soft minerals and cracks, and the resulting differences in its physical properties influence how water can affect pore-wall behavior. Not only the freeze–thaw cycles but also the sudden temperature changes generate thermal stresses in the rocks, producing a wear whose mechanism is more complex the more heterogeneous the rock is [37,38].
The surface position with respect to the rain direction was not studied since the samples were randomly placed in the temperature tests. The initial roughness of the surfaces was taken into account, although it has been shown that surface polishing can influence degradation [39].

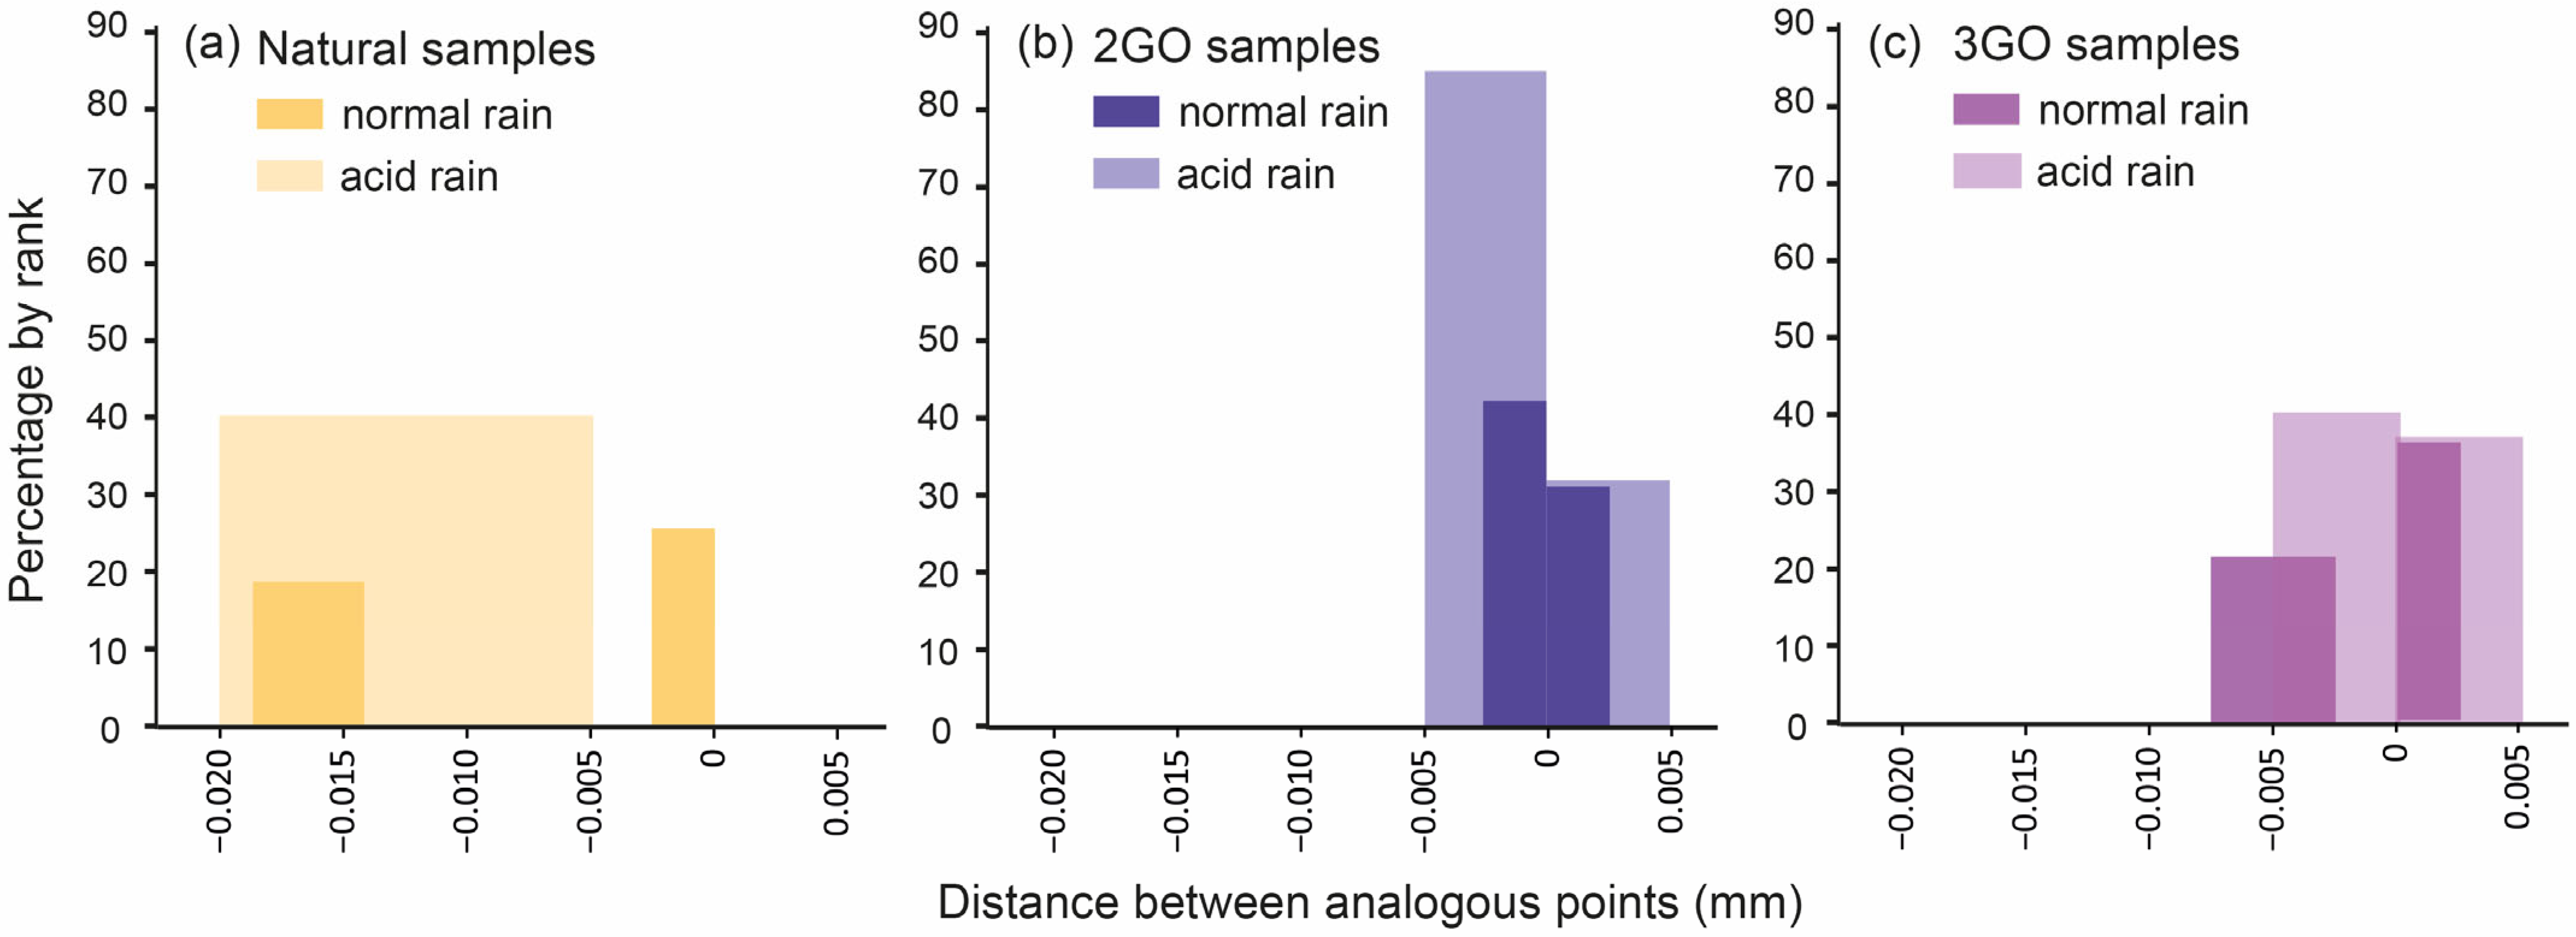
4.2. Comparison between Normal and Acid Rain

After simulating 20 years of rain and thermal changes on dolomite specimens, the results obtained from the comparison of the scans of the specimens before and after the test show a normal asymmetric distribution where 40% of points lost between 0.0050 and 0.0125 mm on the surface in the natural samples. A normal distribution of material variation of the surface was observed for the coated samples where most of the points show a gain between 0.0050 and 0.0125 mm in their surfaces (Figure 11).
The distributions of lost material on the surface of the samples are generally normal with maximums of between 18 and 39% of points, except for sample 2GOac (e), which has a maximum of 84%. In the case of the samples on which acid rain was simulated, an average material height between 0 and 0.0050 mm was lost, while normal rain caused the samples to lose an average material height in the range of 0–0.0035 mm. In both cases, more material was lost in the natural samples than in the coated samples.
Graphene oxide-based protection protects the rock surface against degradation caused by thermal changes and rain, both normal and acid. In the protected samples, a lower percentage of material was lost, especially in the smaller size ranges. The main difference between the results obtained in tests with normal rain and tests with acid rain is mainly reflected in the gain of material. Although the percentage of gain is not very different in both types of rain, in the case of acid rain, the range is greater. This may mean that even if the surface is protected against mechanical and chemical degradation, acid rain may have an effect on the size of the material gained.
The methodology used in this study is a good approximation of actual precipitation conditions as the water droplets reach terminal velocity. Both the rainfall intensity and the maximum and minimum temperatures to which the samples were subjected represent the most extreme values in data from the closest meteorological station of La Virgen del Camino (León).
However, even when simulating the most aggressive conditions, this study lacks the effect that solar radiation would produce in the simulated time frame. It is also necessary to integrate information from simulations of future climate scenarios to conduct more specific tests that can provide information on the behavior of buildings with the advance of climate change.

5. Conclusions

  • The use of a rain simulator that allows raindrops to reach terminal velocity combined with extreme thermal changes in different cycles is an excellent approach for aging tests on rock materials.
  • This study has demonstrated the protection that graphene oxide provides to calcareous rocks, both under normal rain and acid rain conditions.
  • However, the coating’s effectiveness is highly determined by the presence of clays and cracks that represent a weakness in the rock.
  • No major difference was observed in the effectiveness of two-layer and three-layer graphene oxide coatings.
  • Although the effects of roughness and exposure to ultraviolet radiation were not considered, it was shown that under extreme conditions of rain and thermal changes, graphene oxide protects the surfaces of the samples.
  • With this work we managed to reinforce a basic pillar in the mitigation of climate change in the cultural heritage sector, which is to provide scientific solutions to reduce the carbon footprint. Graphene oxide has proven to be an effective product that reduces the degradation of rocks with the passage of time, and which is further accelerated by the conditions imposed by climate change. The use of this product will reduce surface interventions and the travel involved for the application of products. In addition, avoiding the replacement of degraded parts also reduces the consumption of raw materials and their transportation. In order to have more complete information, future studies will work with other geologies and with different climatic conditions by varying the amount of simulated rainfall and thermal conditions and adding the effect of ultraviolet radiation.
  • Future projects will build scale prototypes of buildings, with samples aged before the application of graphene oxide, to examine the results that the coating would achieve on actual monuments.

Author Contributions

Conceptualization, M.F.-R., I.R. and A.O.; methodology, M.F.-R., I.R. and A.O.; software, S.G. and P.C.; formal analysis, M.F.-R., I.R. and A.O.; investigation, P.C., G.B. and A.O.; resources, I.R. and A.O.; data curation, S.G. and I.R.; writing—original draft preparation, I.R.; writing—review and editing, M.F.-R., I.R., A.O., S.G. and P.C.; supervision, M.F.-R. and A.O.; project administration, M.F.-R.; funding acquisition, M.F.-R. and A.O. All authors have read and agreed to the published version of the manuscript.

Funding

This research received funding from the Universidad de León (ULE-PoC 2018), “Fundación General de la ULE y de la Empresa (FGULEM)” under project 2019/00149/001, the “Consejería de Educación-Desafíos 2020”, the “Consejería de Turismo-PRESERVARTE project” of the Region of Castilla y León, and the granted MICINN project (PID2020-120439RA-I00).

Data Availability Statement

Not applicable.

Acknowledgments

The authors want to thank Marta Martínez Benavides and Jose Miguel González Domínguez.

Conflicts of Interest

The authors declare no conflict of interest.

References

  1. Westley, K.; Andreou, G.; Safadi, C.; Huigens, H.; Nikolaus, J.; Ortiz-Vazquez, R.; Ray, N.; Smith, A.; Tews, S.; Blue, L.; et al. Climate Change and Coastal Archaeology in the Middle East and North Africa: Assessing Past Impacts and Future Threats. J. Isl. Coast. Archaeol. 2021, 16, 1–33. [Google Scholar] [CrossRef]
  2. Cardell, C.; Delalieux, F.; Roumpopoulos, K.; Moropoulou, A.; Auger, F.; Van Grieken, R. Salt-Induced Decay in Calcareous Stone Monuments and Buildings in a Marine Environment in SW France. Constr. Build. Mater. 2003, 17, 165–179. [Google Scholar] [CrossRef]
  3. Collete, A. Climate Change and World Heritage: Report on Predicting and Managing the Impacts of Climate Change on World Heritage and Strategy to Assist States Parties to Implement Appropriate Management Responses—UNESCO Biblioteca Digital. Available online: https://unesdoc.unesco.org/ark:/48223/pf0000160019 (accessed on 21 February 2023).
  4. Gentilini, C.; Franzoni, E.; Bandini, S.; Nobile, L. Effect of Salt Crystallisation on the Shear Behaviour of Masonry Walls: An Experimental Study. Constr. Build. Mater. 2012, 37, 181–189. [Google Scholar] [CrossRef]
  5. Sesana, E.; Bertolin, C.; Gagnon, A.S.; Hughes, J.J. Mitigating Climate Change in the Cultural Built Heritage Sector. Climate 2019, 7, 90. [Google Scholar] [CrossRef] [Green Version]
  6. Lankester, P.; Brimblecombe, P. The Impact of Future Climate on Historic Interiors. Sci. Total Environ. 2012, 417–418, 248–254. [Google Scholar] [CrossRef]
  7. Anaf, W.; Leyva Pernia, D.; Schalm, O. Standardized Indoor Air Quality Assessments as a Tool to Prepare Heritage Guardians for Changing Preservation Conditions Due to Climate Change. Geosciences 2018, 8, 276. [Google Scholar] [CrossRef] [Green Version]
  8. Loli, A.; Bertolin, C. Indoor Multi-Risk Scenarios of Climate Change Effects on Building Materials in Scandinavian Countries. Geosciences 2018, 8, 347. [Google Scholar] [CrossRef] [Green Version]
  9. Coelho, G.B.A.; Silva, H.E.; Henriques, F.M.A. Impact of Climate Change in Cultural Heritage: From Energy Consumption to Artefacts’ Conservation and Building Rehabilitation. Energy Build. 2020, 224, 110250. [Google Scholar] [CrossRef]
  10. González, C.M.M.; Rodríguez, A.L.L.; Medina, R.S.; Jaramillo, J.R. Effects of Future Climate Change on the Preservation of Artworks, Thermal Comfort and Energy Consumption in Historic Buildings. Appl. Energy 2020, 276, 115483. [Google Scholar] [CrossRef]
  11. Hambrecht, G.; Rockman, M. International approaches to climate change and cultural heritage. Am. Antiq. 2017, 82, 627–641. [Google Scholar] [CrossRef] [Green Version]
  12. Winandy, L.; Schlebusch, O.; Fischer, R. Fungal Hydrophobins Render Stones Impermeable for Water but Keep Them Permeable for Vapor. Sci. Rep. 2019, 9, 6264. [Google Scholar] [CrossRef] [PubMed] [Green Version]
  13. Poli, T.; Toniolo, L.; Chiantore, O. The Protection of Different Italian Marbles with Two Partially Flourinated Acrylic Copolymers. Appl. Phys. A 2004, 79, 347–351. [Google Scholar] [CrossRef]
  14. Alessandrini, G.; Aglietto, M.; Castelvetro, V.; Ciardelli, F.; Peruzzi, R.; Toniolo, L. Comparative Evaluation of Fluorinated and Unfluorinated Acrylic Copolymers as Water-Repellent Coating Materials for Stone. J. Appl. Polym. Sci. 2000, 76, 962–977. [Google Scholar] [CrossRef]
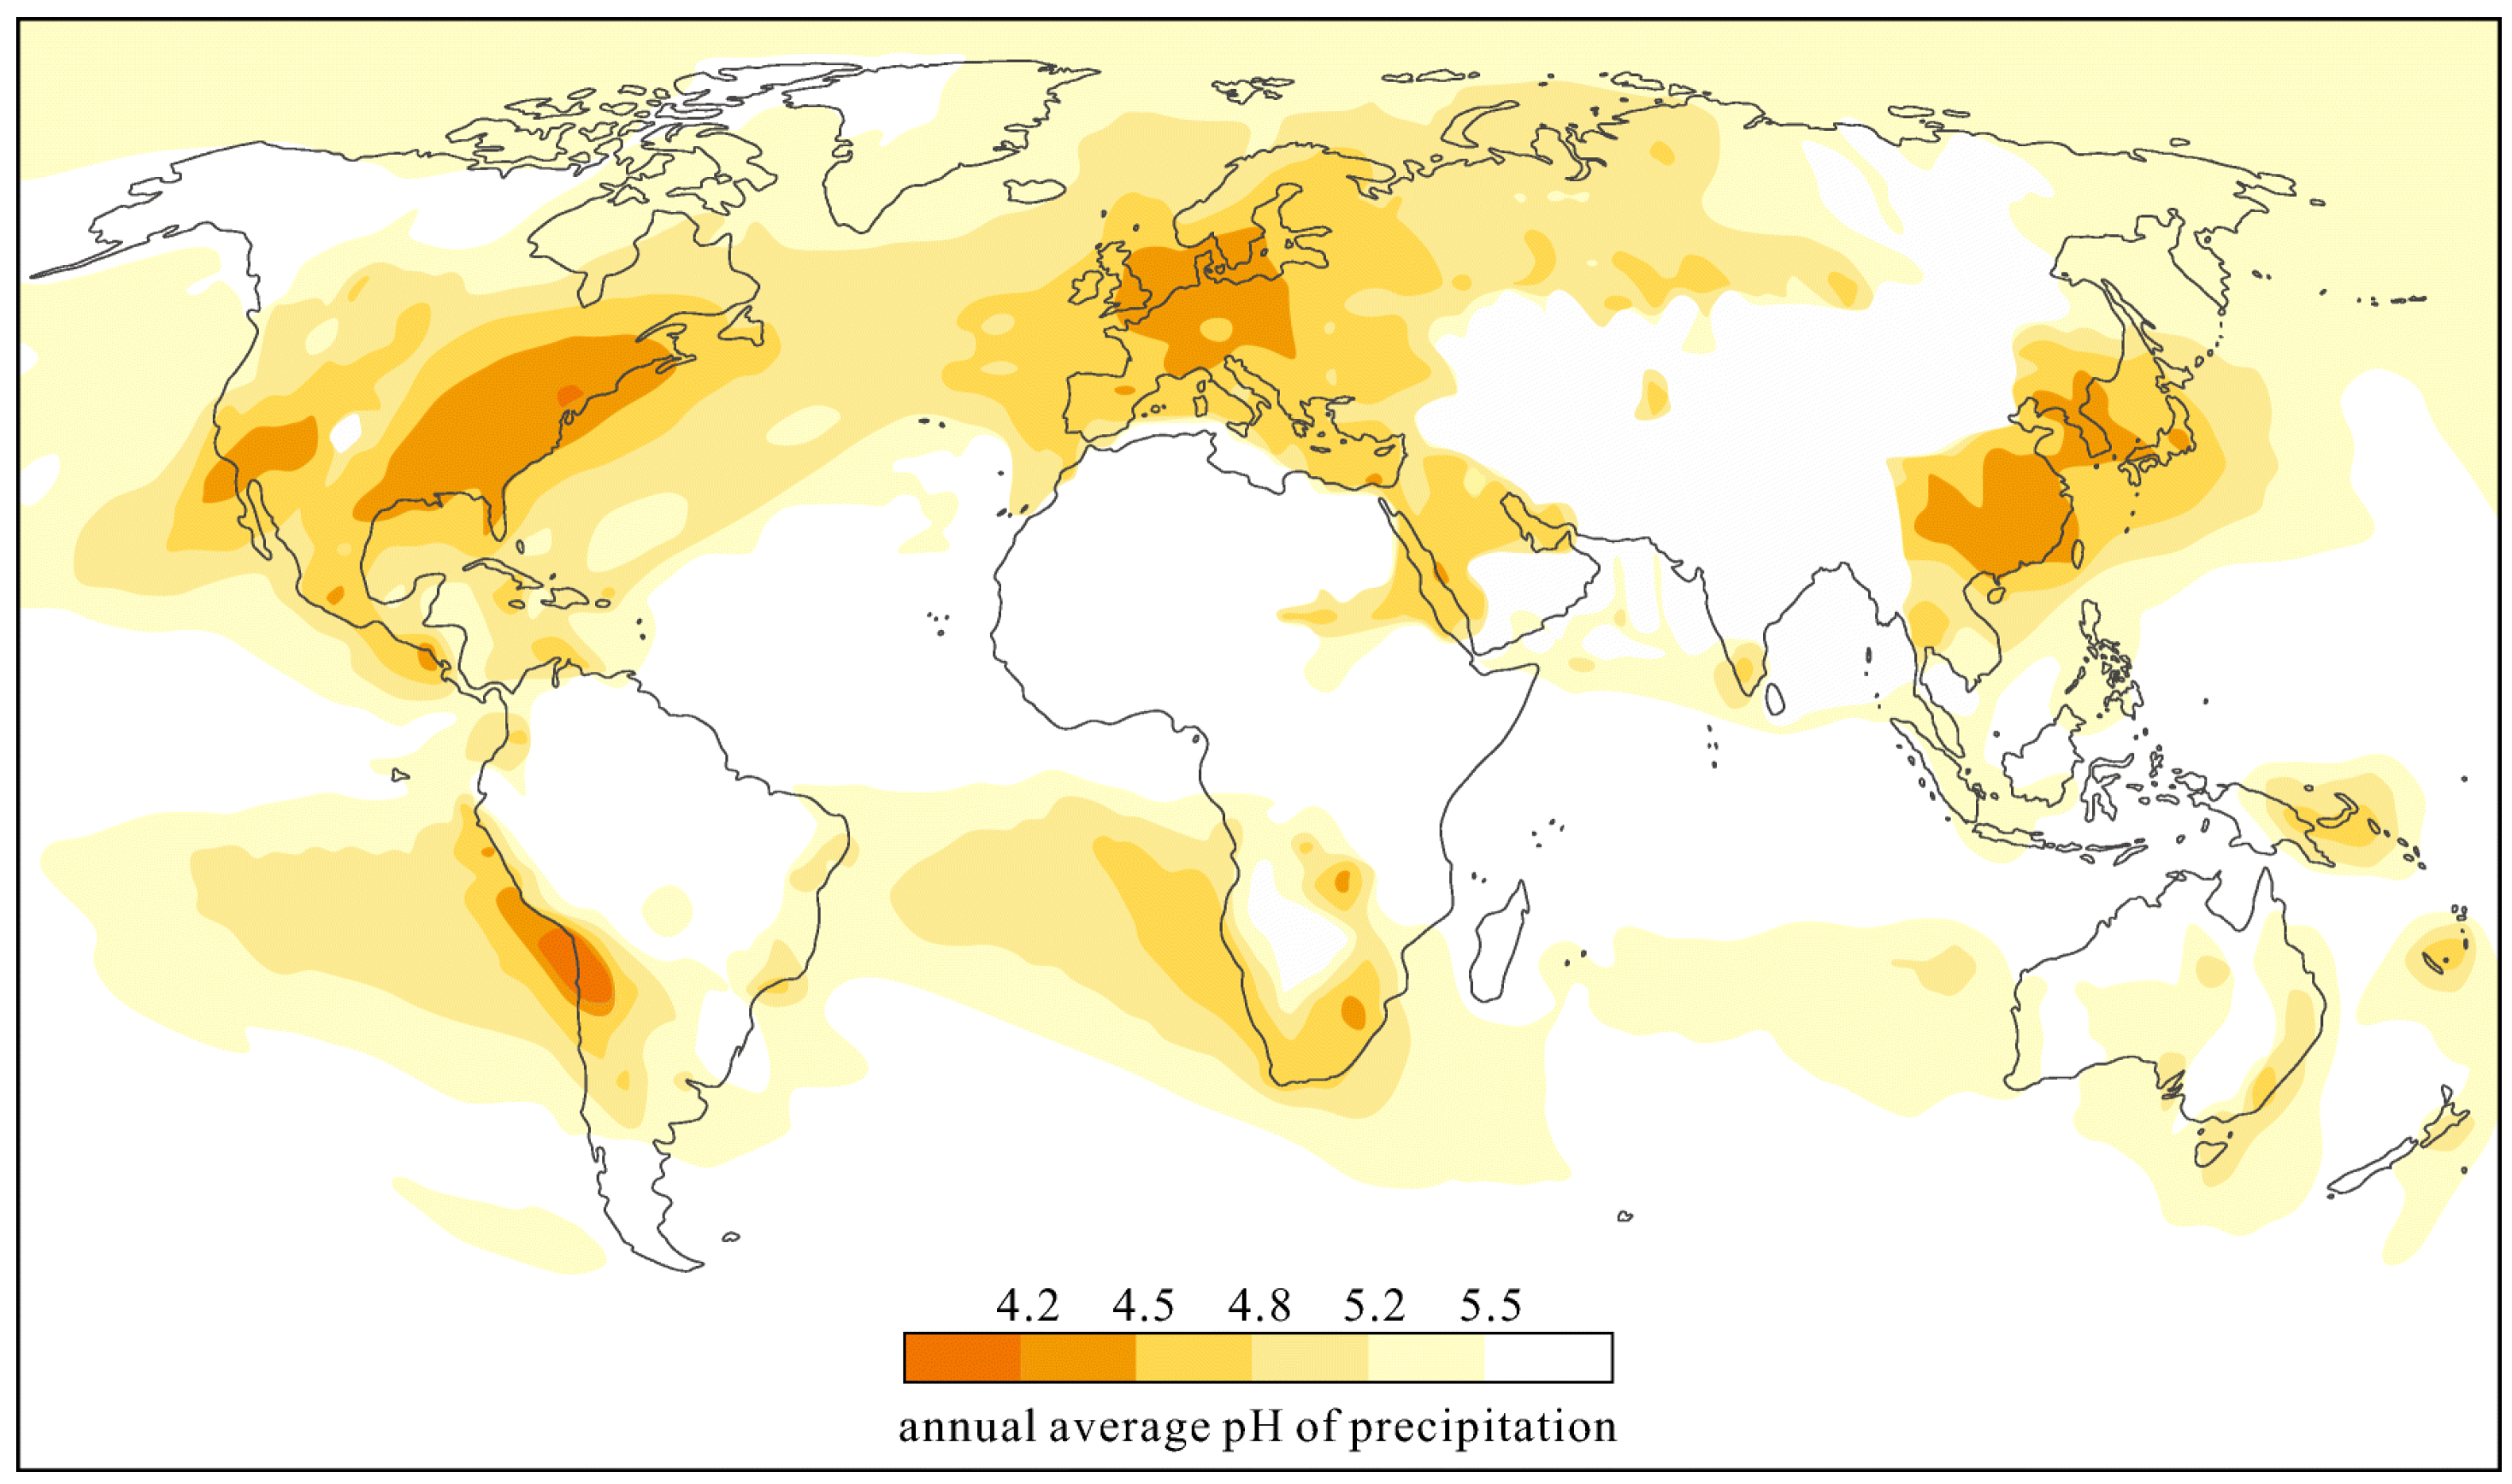
  15. Likens, G.E.; Wright, R.F.; Galloway, J.N.; Butler, T.J. Acid Rain. Sci. Am. 1979, 241, 43–51. [Google Scholar] [CrossRef]
  16. Bogan, R.; Ohde, S.; Arakaki, T.; Mori, I.; Mcleod, C. Changes in Rainwater PH Associated with Increasing Atmospheric Carbon Dioxide after the Industrial Revolution. Water Air Soil Pollut. 2009, 196, 263–271. [Google Scholar] [CrossRef]
  17. Mohajan, H. Acid Rain Is a Local Environment Pollution but Global Concern. Open Sci. J. Anal. Chem. 2019, 3, 47–55. [Google Scholar]
  18. McHale, M.R.; Ludtke, A.S.; Wetherbee, G.A.; Burns, D.A.; Nilles, M.A.; Finkelstein, J.S. Trends in Precipitation Chemistry across the U.S. 1985–2017: Quantifying the Benefits from 30 Years of Clean Air Act Amendment Regulation. Atmos. Environ. 2021, 247, 118219. [Google Scholar] [CrossRef]
  19. Xiao, D.; Zhao, X.; Li, K.; Zhao, X.; Liu, H.; Li, X.; Luo, G. Influence of Acid Rain on Slope Instability Mechanism—A Case Study in Sichuan Provincial Highway, China. Bull. Eng. Geol. Environ. 2021, 80, 3659–3673. [Google Scholar] [CrossRef]
  20. Gibeaux, S.; Thomachot-Schneider, C.; Schneider, A.; Cnudde, V.; De Kock, T.; Barbin, V.; Vazquez, P. Experimental Study of the Ageing of Building Stones Exposed to Sulfurous and Nitric Acid Atmospheres. In Science and Art: A Future for Stone: Proceedings of the 13th International Congress on the Deterioration and Conservation of Stone; University of the West of Scotland: Paisley, UK, 2016; pp. 99–106. [Google Scholar]
  21. Gibeaux, S.; Thomachot-Schneider, C.; Eyssautier-Chuine, S.; Marin, B.; Vazquez, P. Simulation of Acid Weathering on Natural and Artificial Building Stones According to the Current Atmospheric SO2/NOxrate. Environ. Earth Sci. 2018, 77, 327. [Google Scholar] [CrossRef]
  22. Vergès-Belmin, V. Towards a Definition of Common Evaluation Criteria for the Cleaning of Porous Building Materials: A Review. Sci. Technol. Cult. Herit. 1996, 5, 69–83. [Google Scholar]
  23. Topal, T.; Doyuran, V. Engineering Geological Properties and Durability Assessment of the Cappadocian Tuff. Eng. Geol. 1997, 47, 175–187. [Google Scholar] [CrossRef]
  24. Bonazza, A.; Messina, P.; Sabbioni, C.; Grossi, C.M.; Brimblecombe, P. Mapping the Impact of Climate Change on Surface Recession of Carbonate Buildings in Europe. Sci. Total Environ. 2009, 407, 2039–2050. [Google Scholar] [CrossRef] [PubMed]
  25. Yu, S.; Yang, H. Research on Carbon Source Effect of Guangxi Typical Carbonate Rock Area by Acid Rain. Appl. Mech. Mater. 2013, 295–298, 314–321. [Google Scholar] [CrossRef]
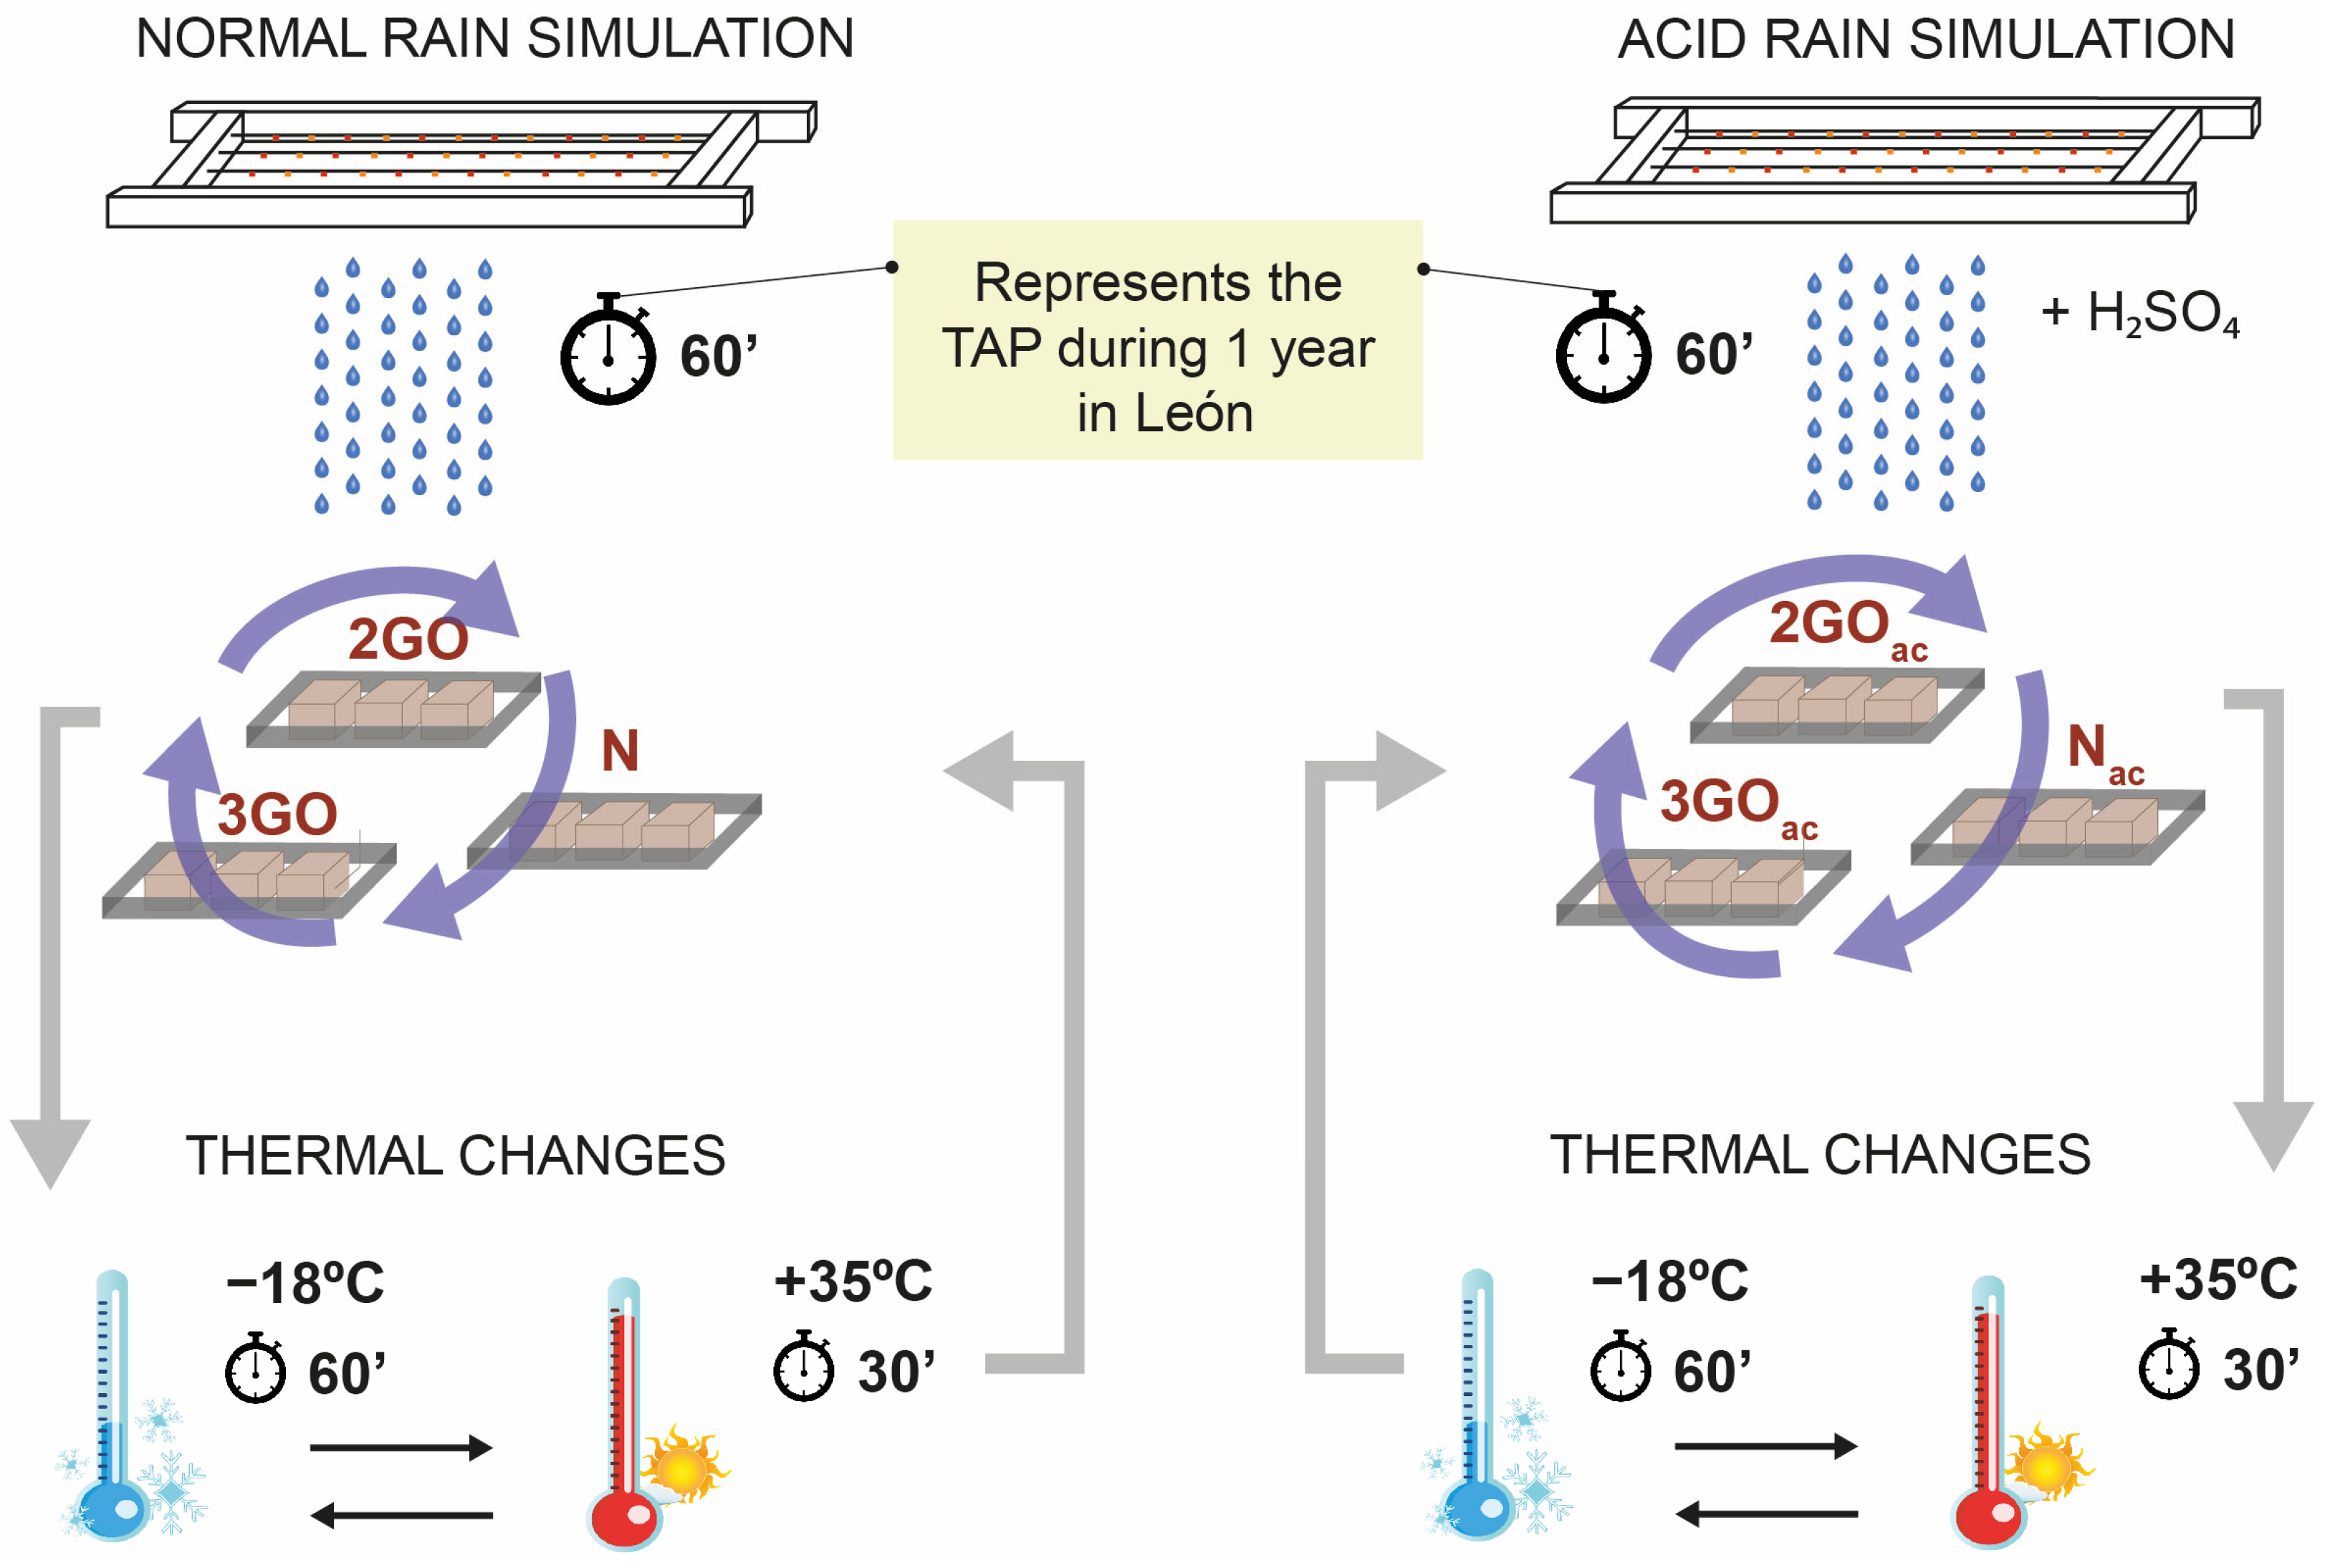
  26. Fernández-Raga, M.; Rodríguez, I.; Caldevilla, P.; Búrdalo, G.; Ortiz, A.; Martínez-García, R. Optimization of a Laboratory Rainfall Simulator to Be Representative of Natural Rainfall. Water 2022, 14, 3831. [Google Scholar] [CrossRef]
  27. Gunn, R.; Kinzer, G.D. The Terminal Velocity of Fall for Water Droplets in Stagnant Air. J. Meteorol. 1949, 8, 249–253. [Google Scholar] [CrossRef]
  28. Beard, K.V.; Prupacher, H.R. A Determination of the Terminal Velocity and Drag of Small Water Drops by Means of a Wind Tunnel. J. Atmos. Sci. 1969, 26, 1066–1072. [Google Scholar] [CrossRef]
  29. Van Boxel, J. Numerical Model for the Fall Speed of Rain Drops in a Rain Fall Simulator; Faculty of Environmental Sciences: Ghent, Belgium, 1998; pp. 77–85. [Google Scholar]
  30. Fernández-Raga, M.; Castro, A.; Palencia, C.; Calvo, A.; Fraile, R. Rain Events on 22 October 2006 in León (Spain): Drop Size Spectra. Atmos. Res. 2009, 93, 619–635. [Google Scholar] [CrossRef]
  31. Fernandez-Raga, M.; Castro, A.; Marcos, E.; Palencia, C.; Fraile, R. Weather Types and Rainfall Microstructure in Leon, Spain. Int. J. Climatol. 2017, 37, 1834–1842. [Google Scholar] [CrossRef]
  32. Laboratorio Oficial de Ensayos de Materiales de la Construcción (LOMECO) Estudio de Procesos de Envejecimiento de Monumentos de Piedra. Estudio de Materiales Para Restauración. 1991.
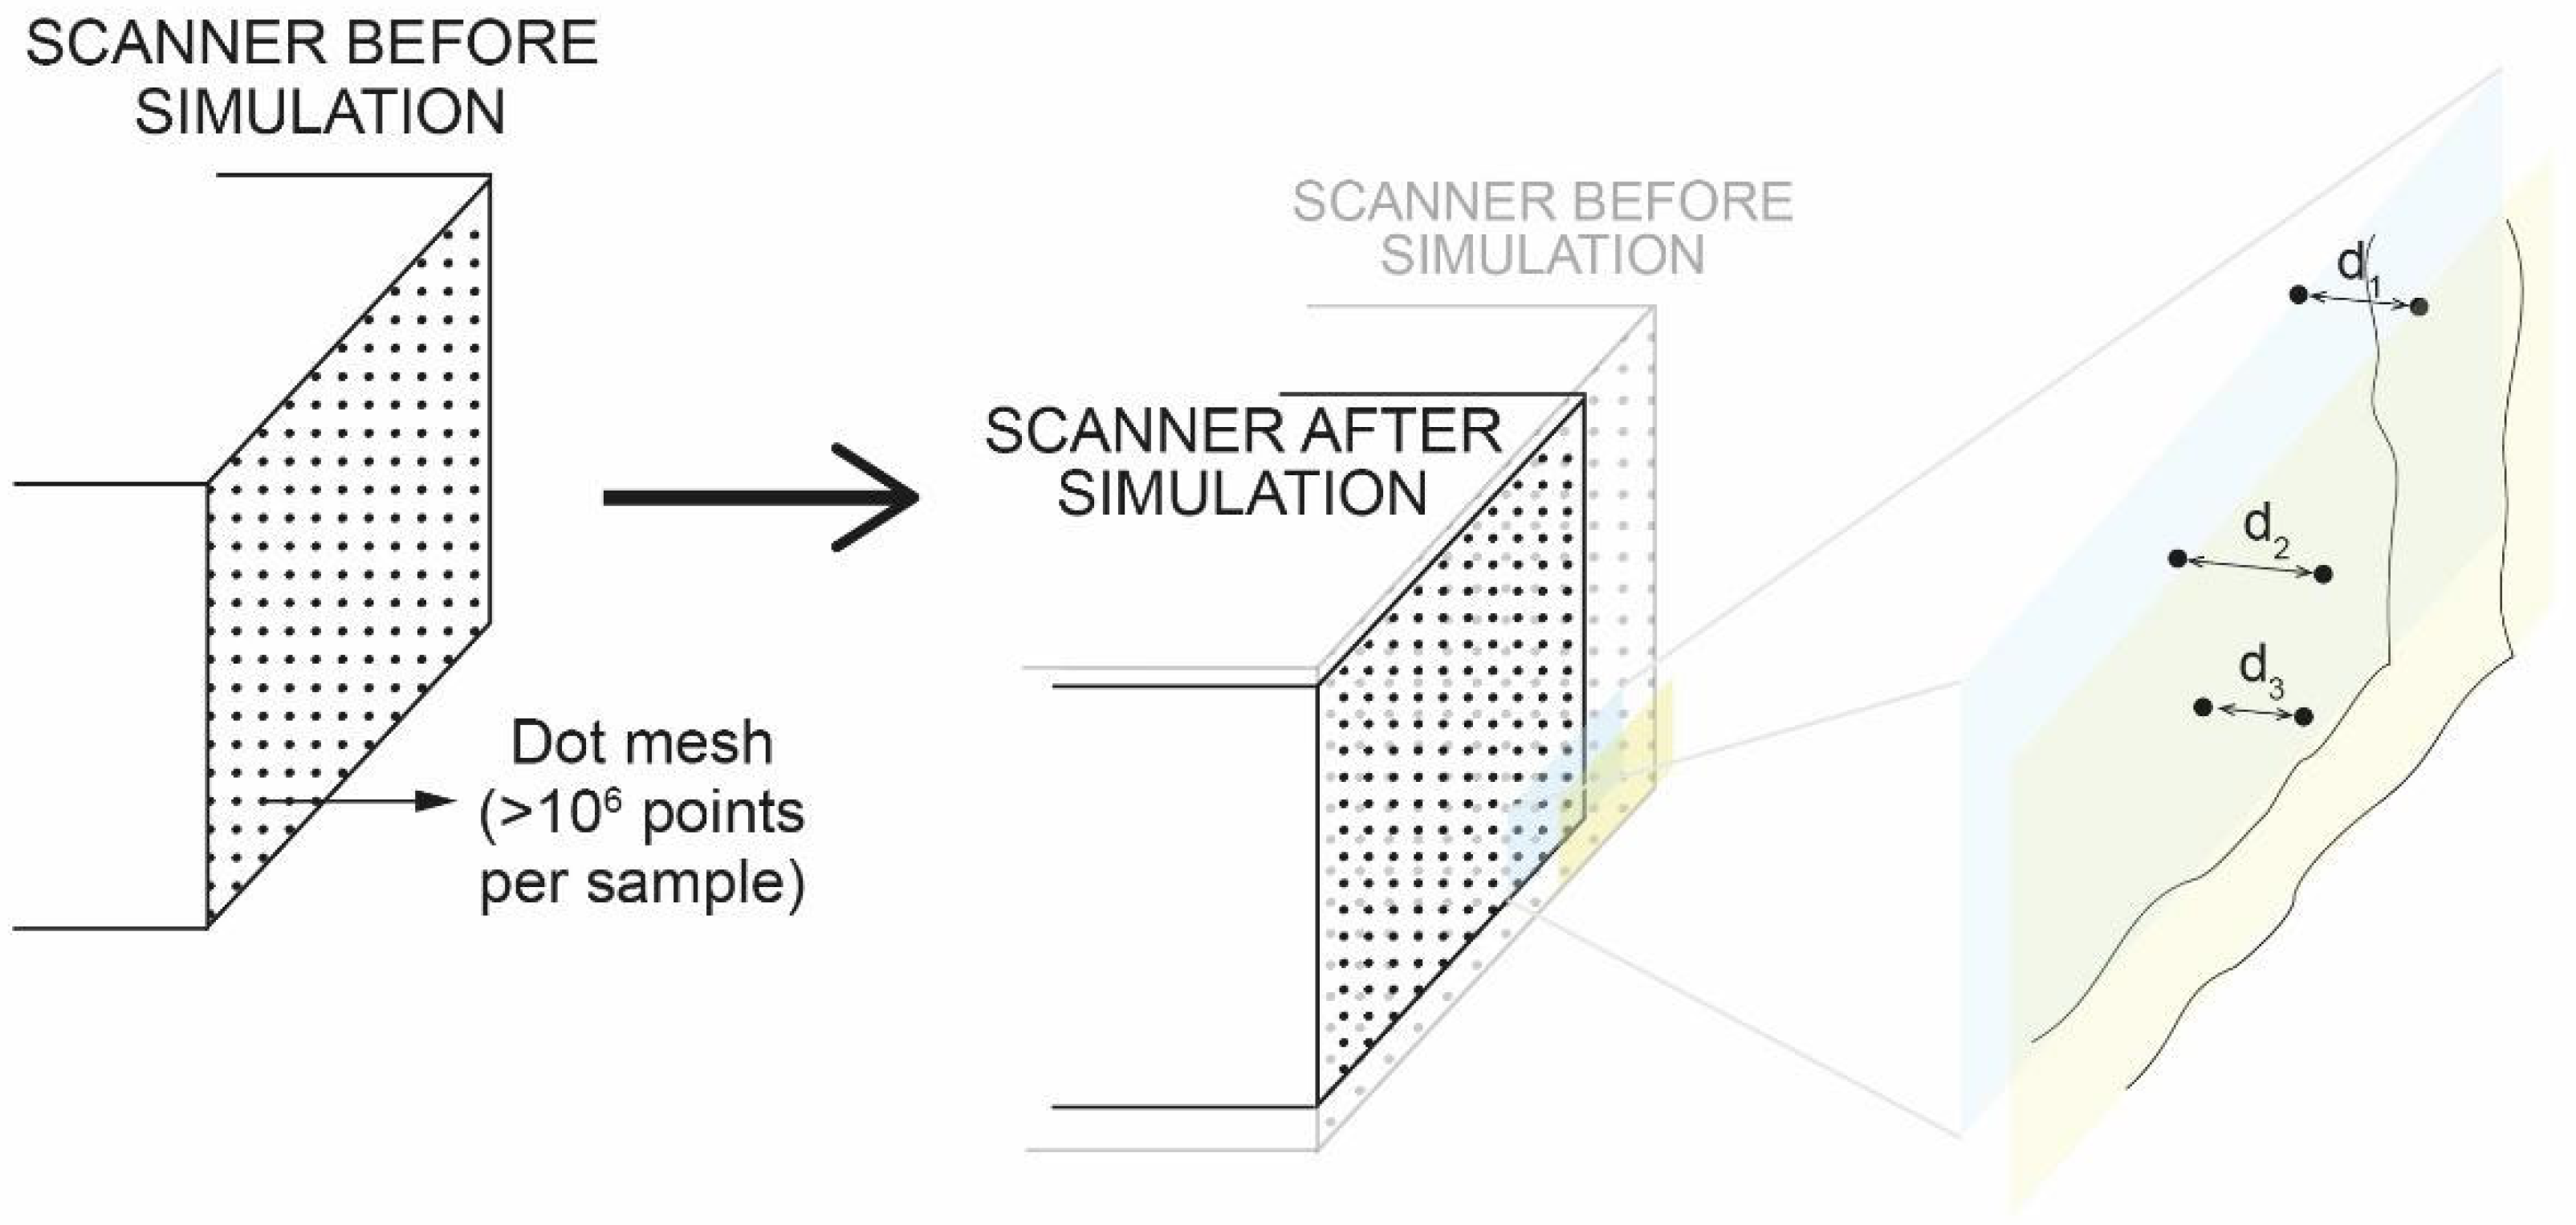
  33. Martínez-Pellitero, S.; Cuesta, E.; Giganto, S.; Barreiro, J. New Procedure for Qualification of Structured Light 3D Scanners Using an Optical Feature-Based Gauge. Opt. Lasers Eng. 2018, 110, 193–206. [Google Scholar] [CrossRef]
  34. González-Campelo, D.; Fernández-Raga, M.; Gómez-Gutiérrez, Á.; Guerra-Romero, M.I.; González-Domínguez, J.M. Extraordinary Protective Efficacy of Graphene Oxide over the Stone-Based Cultural Heritage. Adv. Mater. Interfaces 2021, 8, 2101012. [Google Scholar] [CrossRef]
  35. Antolín-Rodríguez, A.; Merino-Maldonado, D.; Rodríguez-González, Á.; Fernández-Raga, M.; González-Domínguez, J.M.; Juan-Valdés, A.; García-González, J. Statistical Study of the Effectiveness of Surface Application of Graphene Oxide as a Coating for Concrete Protection. Coatings 2023, 13, 213. [Google Scholar] [CrossRef]
  36. Oduber, F.; Calvo, A.I.; Blanco-Alegre, C.; Castro, A.; Vega-Maray, A.M.; Valencia-Barrera, R.M.; Fernández-González, D.; Fraile, R. Links between Recent Trends in Airborne Pollen Concentration, Meteorological Parameters and Air Pollutants. Agric. For. Meteorol. 2019, 264, 16–26. [Google Scholar] [CrossRef]
  37. Andriani, G.; Germinario, L. Thermal Decay of Carbonate Dimension Stones: Fabric, Physical and Mechanical Changes. Environ. Earth Sci. 2014, 72, 2523–2539. [Google Scholar] [CrossRef]
  38. Gomez-Heras, M. Procesos y Formas de Deterioro Termico En Piedra Natural Del Patrimonio Arquitectonico; Universidad Complutense de Madrid: Madrid, Spain, 2006. [Google Scholar]
  39. Sitzia, F.; Lisci, C.; Mirão, J. The Interaction between Rainwater and Polished Building Stones for Flooring and Cladding—Implications in Architecture. J. Build. Eng. 2022, 52, 104495. [Google Scholar] [CrossRef]
Figure 1. Acid rain world map, after Xiao et al. (2021) [19].
Hydrology 10 00079 g001
Figure 2. Appearance of different samples of the Boñar formation: dolomitic formation (a); and sandy clay formation (b).
Hydrology 10 00079 g002
Figure 3. Diagram of the processes to which the test samples were submitted: rainfall simulations (normal or acid), and thermal changes. TAP = total accumulated precipitation.
Hydrology 10 00079 g003
Figure 4. Measurement of sample modification after simulation. dx = distance between homologous points.
Hydrology 10 00079 g004
Figure 5. Scheme of treatment of the rocks used. N: natural samples; 2GO: samples with 2 layers of coating; 3GO: samples with 3 layers of coating; ac: samples subjected to acid rain simulation.
Hydrology 10 00079 g005
Figure 6. Samples colored according to the variation in surface material on two of their faces. From (a) to (c) are natural (control) samples; from (d) to (f) are samples with two layers of coating; and from (g) to (i) are samples with three layers of coating. The color scale in (j) shows the millimeters of separation between homologous points by size ranges; negative values (bluish colors) indicate material loss and positive values (green-yellow colors) indicate material gain.
Hydrology 10 00079 g006
Figure 7. Distribution of percentage of missing or gained surface for the samples after 20 years of simulated rain. Natural samples (N(a), N(b) and N(c)) correspond to control samples in Figure 6a–c. The 2-layer coated samples (2GO (d), 2GO (e) and 2GO (f)) and 3-layer coated samples (3GO (g), 3GO (h) and 3GO (i)) correspond to Figure 6d, Figure 6e and Figure 6f and Figure 6g, Figure 6h and Figure 6i, respectively.
Hydrology 10 00079 g007
Figure 8. Samples colored according to the variation in surface material on two of its faces. From (a) to (c) are natural (control) samples; from (d) to (f) are samples with two layers of coating; and from (g) to (i) are samples with three layers of coating Color scale in (j) shows the millimeters of separation between homologous points by size ranges; negative values indicate material loss and positive values material gain.
Hydrology 10 00079 g008
Figure 9. Distribution of percentage of missing or gained surface for the six coated samples after 20 years of simulated rain. The x-axis indicates the class to which the amount of modified material corresponds according to Table 1.
Hydrology 10 00079 g009
Figure 10. Comparison between natural samples N(a) and N(c) after the normal rain simulation where the difference in composition and porosity can be appreciated by the different colors (above). Nac (c) shows a gain of material due to the deposition of microorganisms which are not present in sample Nac (a) (above). Clay filler in cracks in coated samples 2GOac (d) and 3GO (h) and eroded sample 3GOac (g) which belongs to the most argillaceous member of the Boñar form (below).
Hydrology 10 00079 g010
Figure 11. Distribution of percentage of missing or gained surface for the five coated samples after 20 years of simulated acid rain.
Hydrology 10 00079 g011
Table 1. Homologous point variation ranges and color legend for normal rain and for acid rain.
NORMAL RAIN
ClassRANGE (mm)Color *
Min.Max.
I′−0.0350−0.0298Hydrology 10 00079 i001
II′−0.0298−0.0245
I′−0.0245−0.0193
IV′−0.0193−0.0140
V′−0.0140−0.0088
VI′−0.0088−0.0035
VII′−0.00350.0035
VIII′0.00350.0087
IX′0.00870.0140
X′0.01400.0193
XI′0.01930.0245
XII′0.02450.0298
ACID RAIN
ClassRANGE (mm)Color *
Min.Max.
I′−0.0500−0.0425Hydrology 10 00079 i002
II′−0.0425−0.0350
III′−0.0350−0.0275
IV′−0.0275−0.0200
V′−0.0200−0.0125
VI′−0.0125−0.0050
VII′−0.00500.0050
VIII′0.00500.0125
IX′0.01250.0200
X′0.02000.0275
XI′0.02750.0350
XII′0.03500.0425
* The color legend is automatically adjusted depending on the maximum and minimum values considered.
Disclaimer/Publisher’s Note: The statements, opinions and data contained in all publications are solely those of the individual author(s) and contributor(s) and not of MDPI and/or the editor(s). MDPI and/or the editor(s) disclaim responsibility for any injury to people or property resulting from any ideas, methods, instructions or products referred to in the content.

