Article

The Seasonal Variability and Environmental Factors Influencing the Transpiration of Western Juniper (Juniperus occidentalis) Saplings

by
Carlos G. Ochoa
and
Mohamed A. B. Abdallah
*
Ecohydrology Lab, College of Agricultural Sciences, Oregon State University, Corvallis, OR 97331, USA
*
Author to whom correspondence should be addressed.
Hydrology 2023, 10(12), 232; https://doi.org/10.3390/hydrology10120232
Submission received: 27 October 2023 / Revised: 29 November 2023 / Accepted: 4 December 2023 / Published: 6 December 2023

Abstract

:
There is scarce information regarding the interactions between young tree water uptake and the environment in water-limited ecosystems. This study was conducted in a semiarid rangeland ecosystem in central Oregon, Pacific Northwest Region, USA. We measured the tree transpiration of western juniper (Juniperus occidentalis) saplings using the stem heat balance (SHB) method. We analyzed the correlation between transpiration and environmental factors affecting the saplings’ water use from May to October for 2017, 2018, 2019, 2021, and 2022. The study results showed that total annual precipitation for all but one year was below the long-term (2005 to 2022) mean precipitation value of 307 mm for the study site. Significantly higher transpiration rates were observed in the wet vs. dry years. The highest monthly averaged transpiration rates (2.95 L d−1) were obtained in August during the above-average precipitation year (2017). Peak transpiration rates for the below-average precipitation years were generally reached in June or July, ranging from 0.91 to 1.65 L d−1. The seasonal response of transpiration to different environmental factors varied. For all years, vapor pressure deficit (VPD), solar radiation (SR), and air temperature (AT) showed a positive correlation with transpiration, whereas precipitation (Pr) and relative humidity (RH) indicated a negative correlation with transpiration. Soil moisture (SM) and soil temperature (ST) positively correlated with transpiration for most years. A strong association between VPD and transpiration was observed during the wettest (2017; 327 mm) and driest (2021; 198 mm) years. Results from this study add to the limited literature on sapling transpiration and can contribute to the improved management of cool-climate rangeland ecosystems through an enhanced understanding of water use by young-stage trees and its potential impacts on the water balance of restored juniper landscapes.

1. Introduction

Arid and semiarid ecosystems encompassing nearly 40% of the terrestrial land surface are susceptible to climate change [1]. Accurate evapotranspiration estimation could be essential to explaining the terrestrial water cycle under local environmental conditions in these regions [2,3]. Tree transpiration, a large contributor to evapotranspiration, is a significant physiological and hydrological process [4,5] and the major pathway for plant water loss from forest ecosystems in dryland regions [6]. Sap flow, which represents the movement of water from roots to leaves through the stem xylem, is commonly used to investigate the response of plant transpiration to environmental variables [7].
Many environmental variables, including soil moisture, soil temperature, air temperature, solar radiation, relative humidity, vapor pressure deficit, and precipitation, help explain the process of plant transpiration [8]. Different studies have indicated that soil moisture plays an important role in transpiration [9,10,11]. Other studies [8,12] have reported that tree transpiration was closely related to changes in solar radiation and vapor pressure deficit. Wullschleger and Hanson [13] and Liu et al. [14] found that precipitation was a primary driver of tree transpiration. Conversely, Han et al. [15] and Niu et al. [16] found that precipitation had a negative effect on canopy transpiration. Juice et al. [17] found that soil temperature and air temperature contributed to explaining variations in sap flow, while solar radiation, relative humidity, and vapor pressure deficit had relatively little influence.
Most tree transpiration studies have been conducted on mature-stage trees. The transpiration of saplings is less understood. The sapling stage is a critical period in the life cycle of tree species [18], where the morphological or anatomical traits during this period enhance a good adaptation to the environment and enable better growth, stability, and survival [19]. Young trees can tolerate water deficit owing to their sustained CO2 assimilation and high biomass allocation to roots [20,21]. Transpiration and environmental variables relationships in young trees have been addressed only in a few studies. Results from Wullschleger et al. [22], conducted on red maple saplings in a watershed ecosystem in Tennessee, USA, found that vapor pressure deficit and precipitation were primary factors regulating transpiration. Oberhuber et al. [23] observed that environmental variables such as vapor pressure deficit, precipitation, air temperature, and soil temperature were highly correlated with the water status of Norway spruce saplings throughout the growing season (late April through early October) in a dry inner Alpine environment in Tyrol, Austria. Compared to large trees, small sugar maple trees were found to show greater sensitivity to environmental conditions that influence transpiration rates, such as soil water deficits and increased evaporative demand [24].
Western juniper (Juniperus occidentalis) woodlands, a significant part of Oregon landscapes, provide essential ecosystem services, including biodiversity, wildlife habitat, and commercial uses such as s firewood and fencing posts [25]. However, the significant juniper expansion observed over the last two centuries, attributed to a mix of climate change and anthropogenic causes, has raised considerable concerns regarding the adverse effects on ecosystem function and ecosystem services (e.g., water provisioning) provided. High levels of juniper encroachment into sagebrush–steppe ecosystems have been associated with impaired habitat for wildlife species of interest, such as sage grouse (Centrocercus urophasianus) and mule deer (Odocoileus hemionus). Also, significant juniper encroachment has been associated with increased canopy interception of precipitation and evapotranspiration losses. Efforts to reduce juniper encroachment in the region have been carried out for decades, mainly to restore degraded sagebrush (Artemisia tridentata) communities [26] and improve the hydrology of the site [27]. In many areas, reductions in juniper stands have resulted in increased sagebrush and perennial grass cover [28,29] and augmented water levels [27] compared to untreated sites.
A significant amount of water is used by mature western juniper, with tree transpiration rates ranging from 12 to 115 L d−1 depending on seasonal water availability [30]. Western juniper saplings are also sensitive to variations in seasonal precipitation and soil moisture availability [30,31]. Several studies in Oregon have reported a significant number of western juniper saplings emerging 10 to 25 years following mature juniper removal (e.g., [28,29]). The ongoing reestablishment of juniper in the treated landscapes has prompted an interest in knowing its potential effects on water use and ecosystem health overall. The objectives of this study were to (1) determine the amount of water uptake by western juniper saplings and (2) assess the relationship between juniper sapling transpiration and several environmental variables of interest (e.g., precipitation, vapor pressure deficit, soil moisture, air temperature).

2. Materials and Methods
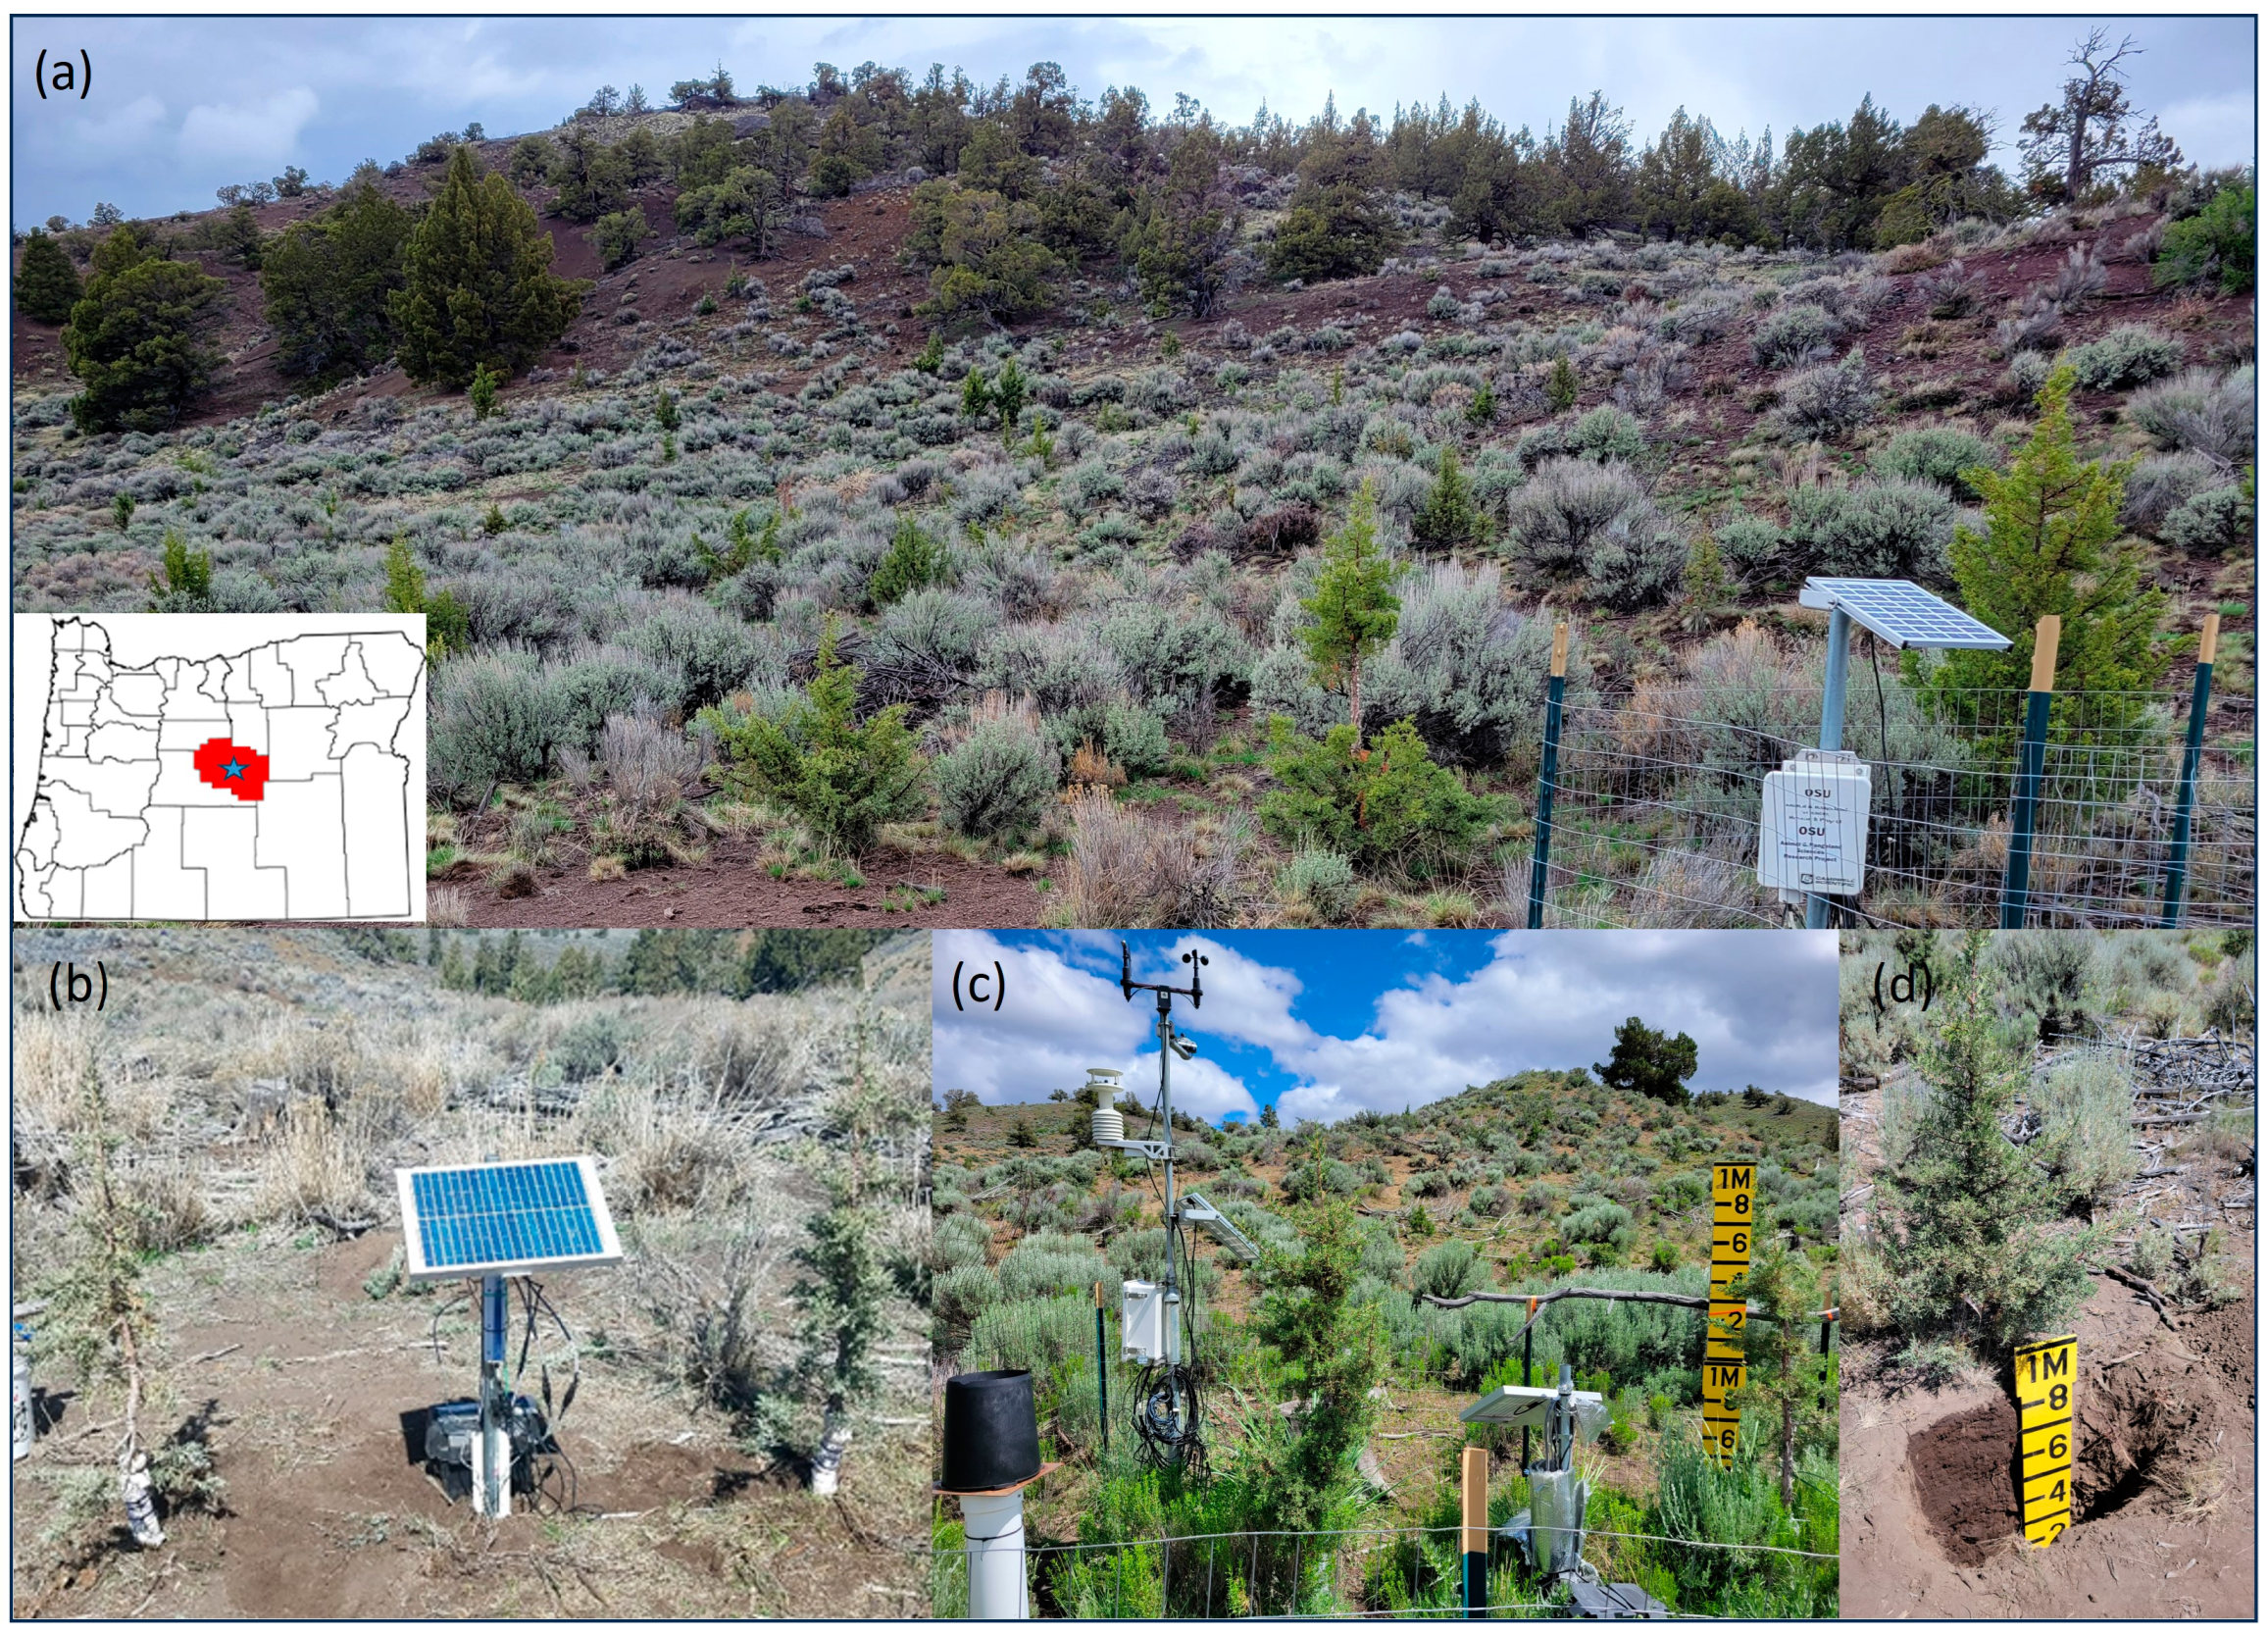
2.1. Study Site

This study was conducted at the Camp Creek Paired Watershed Study (CCPWS) site (43.96° lat.; −120.34° long.), established in 1994 to evaluate the ecohydrological response following juniper removal [27]. The CCPWS is located in the semiarid rangelands of central Oregon, USA, and encompasses 500 ha, including a 116-ha watershed where nearly 90% of mature juniper trees were cut using chain saws in 2005 and the boles removed. Since then, a significant number of saplings have grown to where the juniper re-occupying of the landscape is noticeable (Figure 1).
Data collected in 2018 from forty-one transects (3 m by 30 m) established across the treated (juniper removed) watershed, showed juniper sapling density was 313 trees ha−1 [32]. A different study by Abdallah et al. [33], using twenty 20 m by 20 m plots distributed throughout the watershed, showed that juniper sapling density was 210 trees ha−1. Juniper canopy was estimated to cover <1% of the total area of the watershed [28,32]. Before juniper removal from the site, juniper cover occupied 27% [34]. Overall, juniper saplings at the study site grow at a rate of 0.1 m year−1 [32], and their root system extends to at least 0.8 m (see Figure 1), which makes them very competitive for soil moisture uptake. The dominant overstory vegetation following juniper removal in 2005 is big sagebrush (see Figure 1). Understory vegetation includes perennial grass species such as Idaho fescue (Festuca idahoensis), bluebunch wheatgrass (Pseudoroegneria spicata), and Sandberg bluegrass (Poa secunda), which are typical forage species in rangeland ecosystems in the Pacific Northwest Region.
Much of the precipitation at the site occurs as a mix of rain and snow between October and March, with some rainfall events in spring and summer. Meteorological data recorded (2005 to 2022) by onsite instrumentation showed that the long-term mean annual precipitation was 307 mm. This study was conducted from 2017 to 2022. In all years but 2017, annual precipitation was below the long-term mean value, with deficits ranging from −35.5% to −9.4% (Table 1).

2.2. Sap Flow Measurements and Estimation of Transpiration

Sap flow data were collected from four juniper saplings in most years during the May to October season. To measure sap flow, two saplings at two locations (Mays-East and Mays-West) were instrumented using the stem heat balance (SHB) technique. For the Mays-East location, a branch in each sapling was equipped with an SHB sap flow gauge (models SGB16 and SGB19, Dynamax Inc., Houston, TX, USA). To scale sap flow rates from individual branches to stand level, we adopted the scaling approach proposed by Kirmse and Norton [35] in their study of shrubby species. Two saplings were equipped with an SHB gauge (Model SGB25, Dynamax Inc., Houston, TX, USA) installed at the sapling’s main stem for the Mays-West location. The distance between saplings was close to 4 m at Mays-East and 3 m at Mays-West. The height of the saplings at the time of sensor installation in 2017 and 2018 ranged from 1.30 to 1.55 m (Table 2), reaching 2 m by the summer of 2023. Based on results reported in [32], the age of the saplings at the beginning of this study in 2017 was estimated to be between 12 to 14 years. Sap flow data were recorded every 15 min using a SapIP datalogger (Dynamax Inc., Houston, TX, USA) at each location. Sap flow outputs were then calculated daily (L d−1). Sap flow calculations to estimate sapling transpiration are described in detail in Abdallah et al. [30].

2.3. Environmental Variable Measurements

Data from onsite weather instrumentation (Campbell Scientific, Inc., Logan, UT, USA) were used to obtain seasonal (May to October) information on precipitation (Pr), relative humidity (RH), air temperature (AT), solar radiation (SR), soil moisture (SM), and soil temperature (ST) at one monitoring location (Mays-West) in the valley near the outlet of the watershed. An additional SM and ST station (Mays-East) was installed nearby at a distance of 77 m. At each monitoring station, three sensors (Model CS655, Campbell Scientific, Inc., Logan, UT, USA) that measured SM and ST were installed at 0.2, 0.5, and 0.8 m depths. All data were collected hourly and then used to obtain daily average values. The values of SM and ST across soil depths (0.2, 0.5, and 0.8 m) were used to obtain an average SM and ST (SMtot and STtot) for each monitoring station’s 0 to 0.8 m soil profile. Vapor pressure deficit (VPD) was calculated based on daily averaged AT and RH using the following formula:
V P D = 0.611 × E x p ( 17.27 × A T / A T + 237.3 ) × ( 1 R H / 100 )

2.4. Data Analysis

A one-way analysis of variance (ANOVA) was used to determine inter-annual variability of the environmental variables of interest (i.e., Pr, SR, AT, ST, SM, RH, and VPD). A correlation analysis was also conducted to evaluate the degree of association among all environmental variables. A Spearman rank order correlation test was conducted to evaluate the relationships between sapling transpiration and the various environmental variables. All statistical analyses were performed using SigmaPlot® version 15.0 (Systat Software, Inc., San Jose, CA, USA).

3. Results

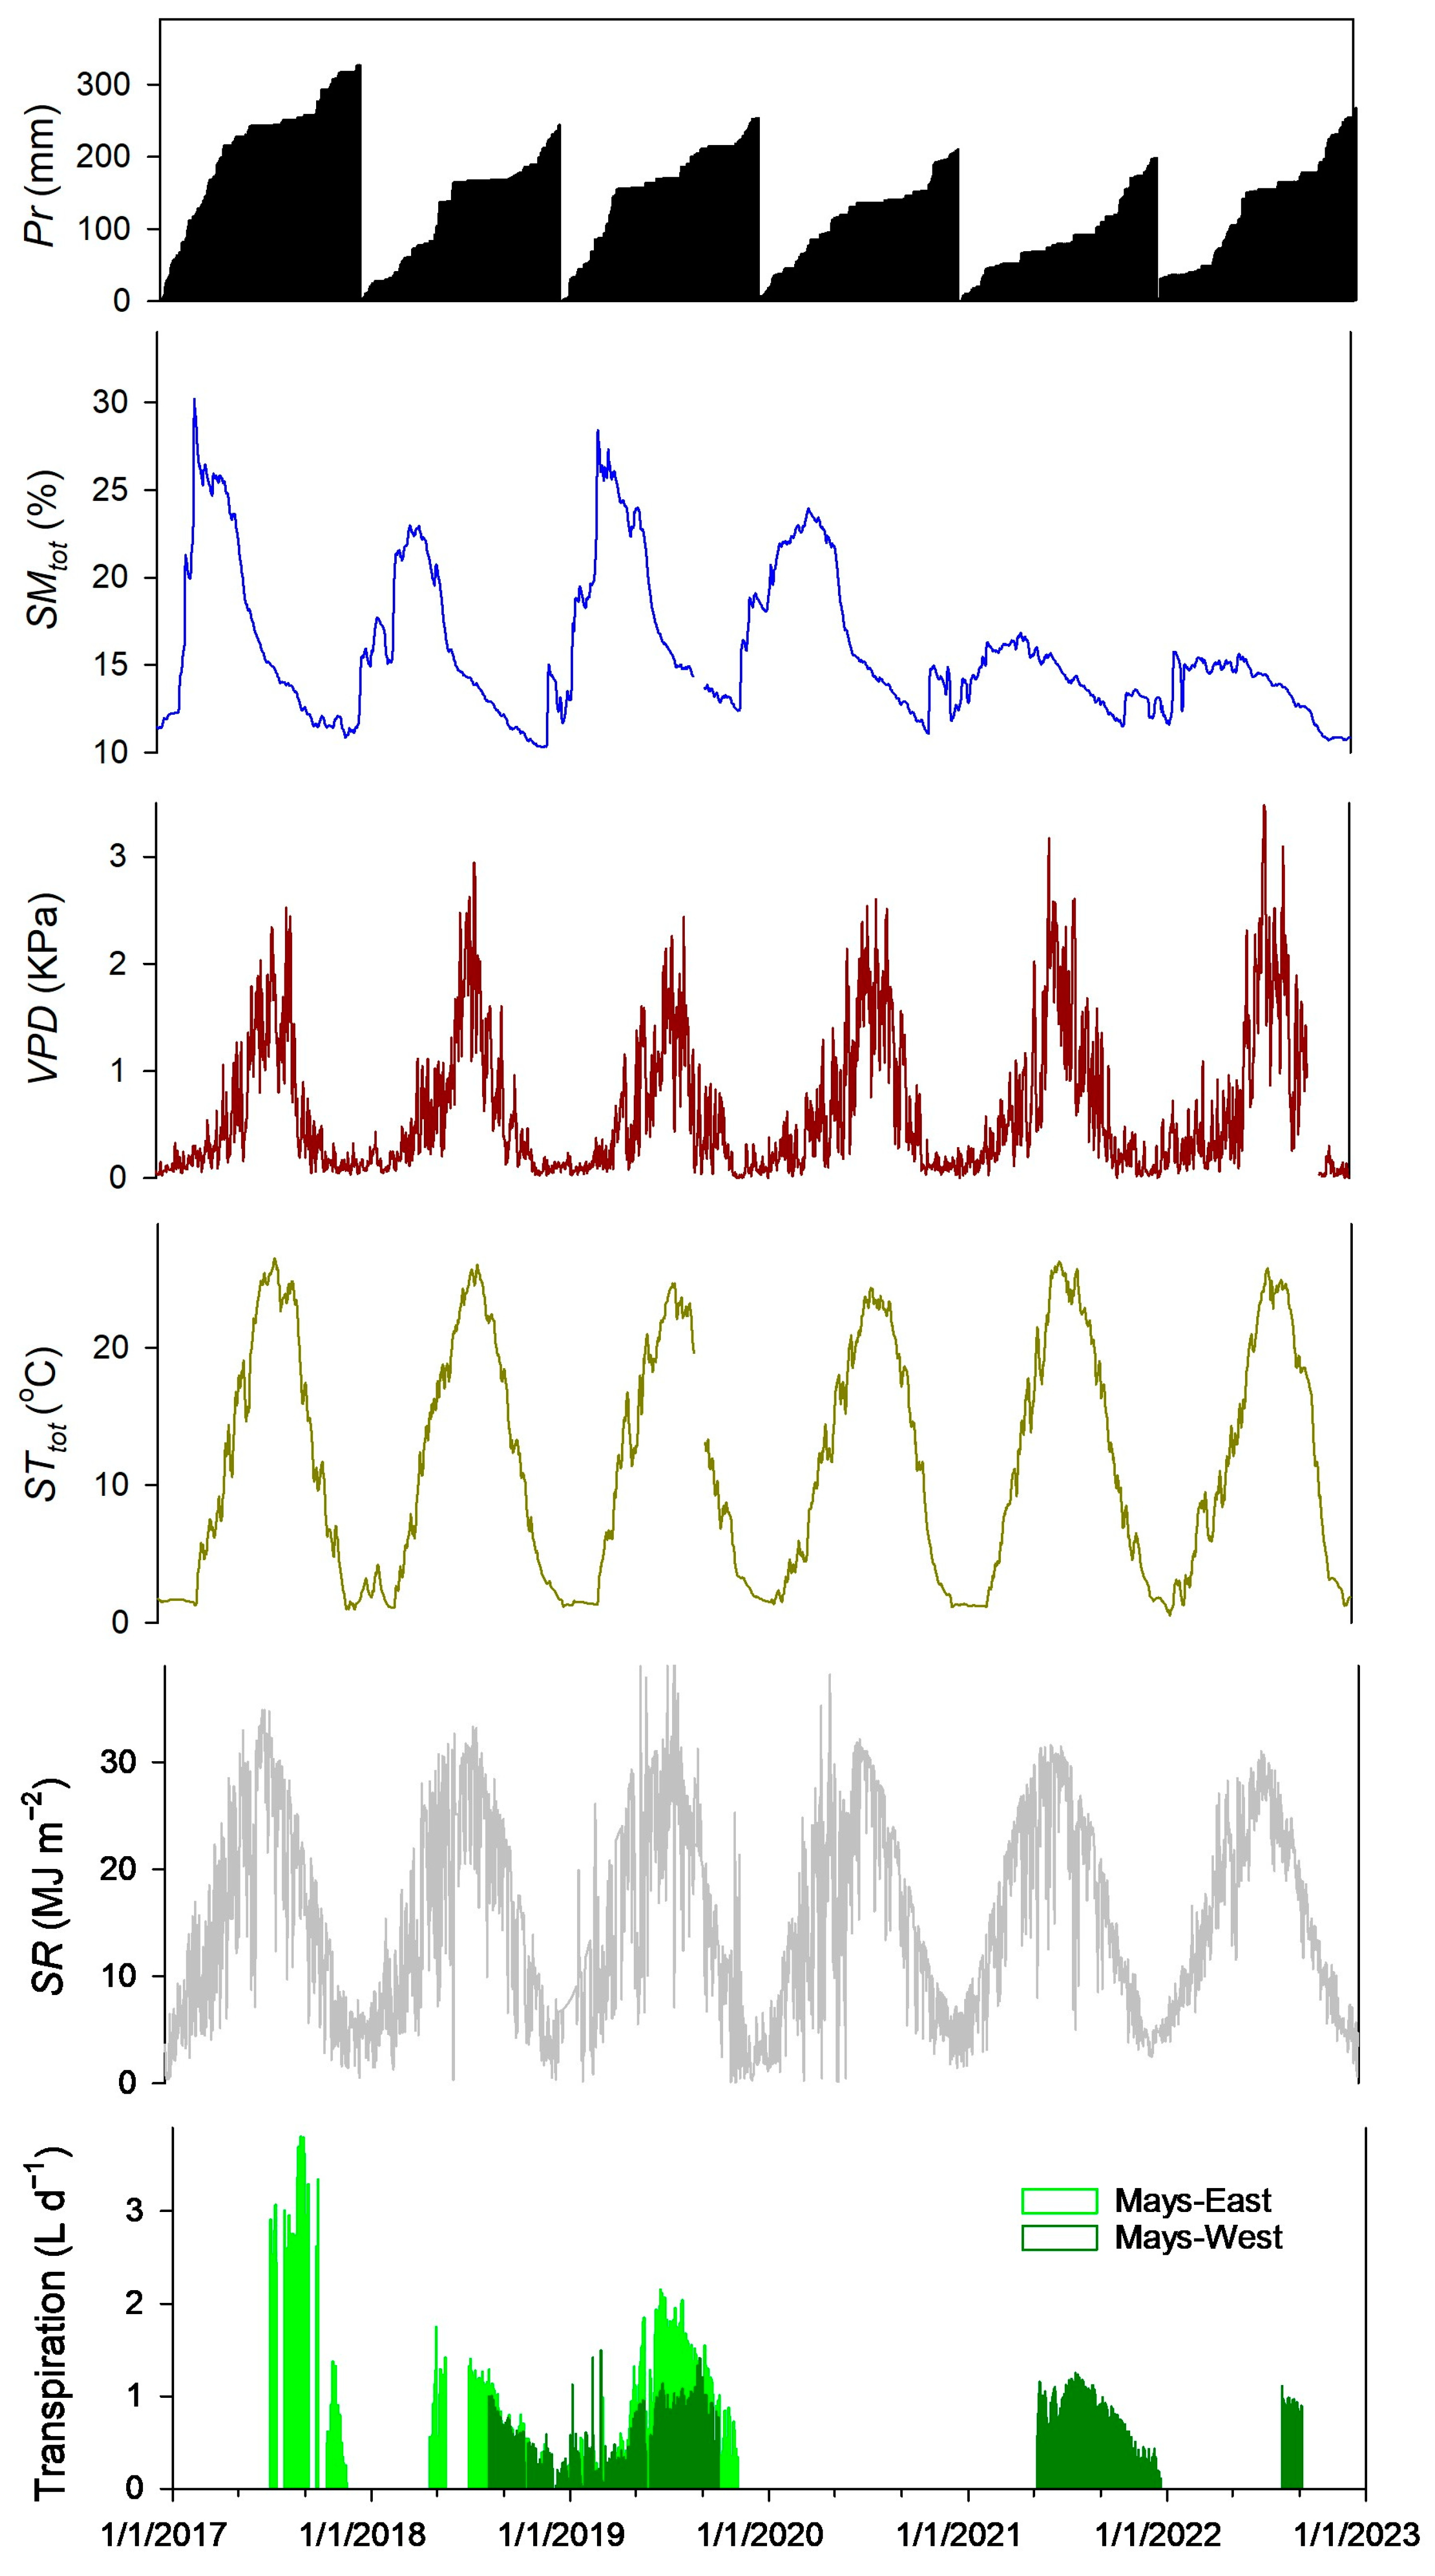
3.1. Environmental Conditions

The seasonal response of all environmental variables but SR was highly variable for the different years observed (Table 3). With mean values ranging from 20.7 to 21.5 MJ m−2, no significant (p > 0.05) inter-annual differences in seasonal (May to October) SR were observed. The highest mean seasonal VPD value was obtained during 2022, which was the year with the highest seasonal Pr records. Conversely, the lowest mean seasonal VPD value (0.88 kPa) was noted during the driest Pr season 2019. The VPD was not different (p > 0.05) for 2018, 2020, and 2021. Seasonal AT differed among most years, with the highest mean seasonal value (16.5 °C) observed in 2022, while 2019 had the lowest (13.7 °C). The highest mean seasonal RH (51.7%) was noted in 2019, whereas the lowest value of 43.8% was observed in both 2020 and 2022. For Mays-East, higher levels of SM were observed for all years at SM0.5 than at SM0.2 and SM0.8. For Mays-West, higher levels of moisture were generally observed at SM0.2. In general, ST was higher at the ST0.2 depth for both locations. The installation of the sensors at Mays-West in September 2018 influenced the response of SM and ST observed for that year (Table 3).
Results from the correlation analysis show that SR had a strong positive association with AT, VPD, and ST0.2, and a strong negative association with RH. In addition to SR, AT also shows strong positive correlations with ST at all depths (0.2, 0.5, and 0.8 m). The RH variable shows strong negative correlations with VPD and ST at all depths. As expected, VPD was strongly correlated to AT (+) and RH (−). Very weak to weak associations between SM at all depths and all the other variables were observed (Table 4).

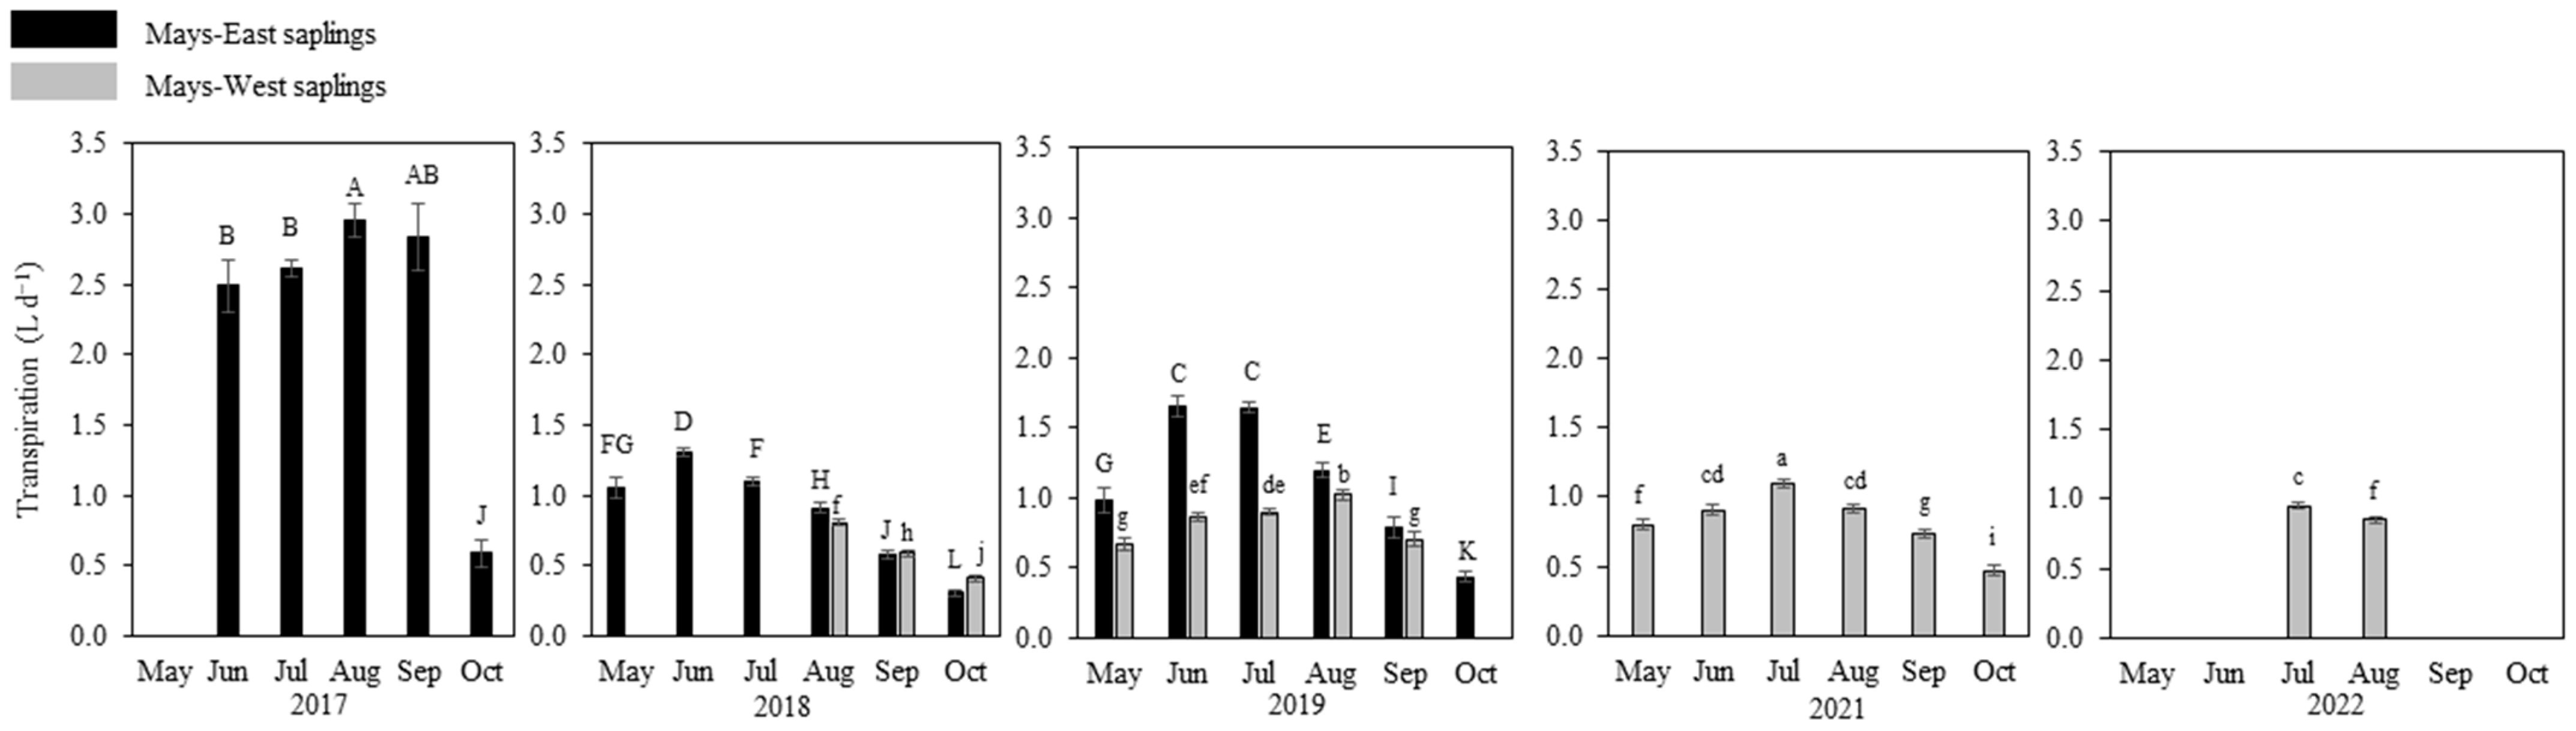
3.2. Seasonal Variation of Juniper Saplings’ Transpiration in Different Years

For the Mays-East location, transpiration (L d−1) data were obtained from June 2017 to October 2019 (Figure 2). The monthly average transpiration in different years was significantly different, and sapling transpiration for the wet 2017 year was significantly higher than that in 2018 and 2019 (Figure 2). The highest mean transpiration values (2.89 L d−1) obtained in August and September were 118% and 98% higher than the corresponding months for 2018 and 2019, respectively. The lowest transpiration values of 0.59, 0.43, and 0.31 L d−1 for Mays-East trees were observed in October 2017, 2019, and 2018, respectively. For the Mays-West location, transpiration data were obtained from October 2018 through August 2022. Similar to those observed in the Mays-East location, the monthly transpiration rates of Mays-West trees were significantly different between years (Figure 2). The highest transpiration value of 1.09 L d−1 was observed in July 2021, followed by 1.02 L d−1 in August 2019, while the lowest transpiration value of 0.41 L d−1 was obtained in October 2018. In the 2019 year, which has more complete transpiration data for both locations, Mays-East trees tended to transpire significantly more than Mays-West trees (Figure 2).
ANOVA results show that the 2019 seasonal SMtot and STtot were 1.2 and 1.3 times greater at Mays-East than at Mays-West. The values of SM and ST for all soil depths were generally higher at Mays-East across all years (see Table 3). The highest significant difference (p ≤ 0.05) value in transpiration in the 2019 year between the two locations was recorded in June (47.9% difference) and July (45.1% difference). In contrast, the smallest difference (p > 0.05) was recorded in September (10.3% difference). The higher June and July transpiration levels in the Mays-East site than in the Mays-West site for the year 2019 may be attributed to the greater SMtot values recorded in the spring season (April to June) for the Mays-East site compared to the Mays-West (paired t-test, t = 2.30, df = 79, p < 0.01).

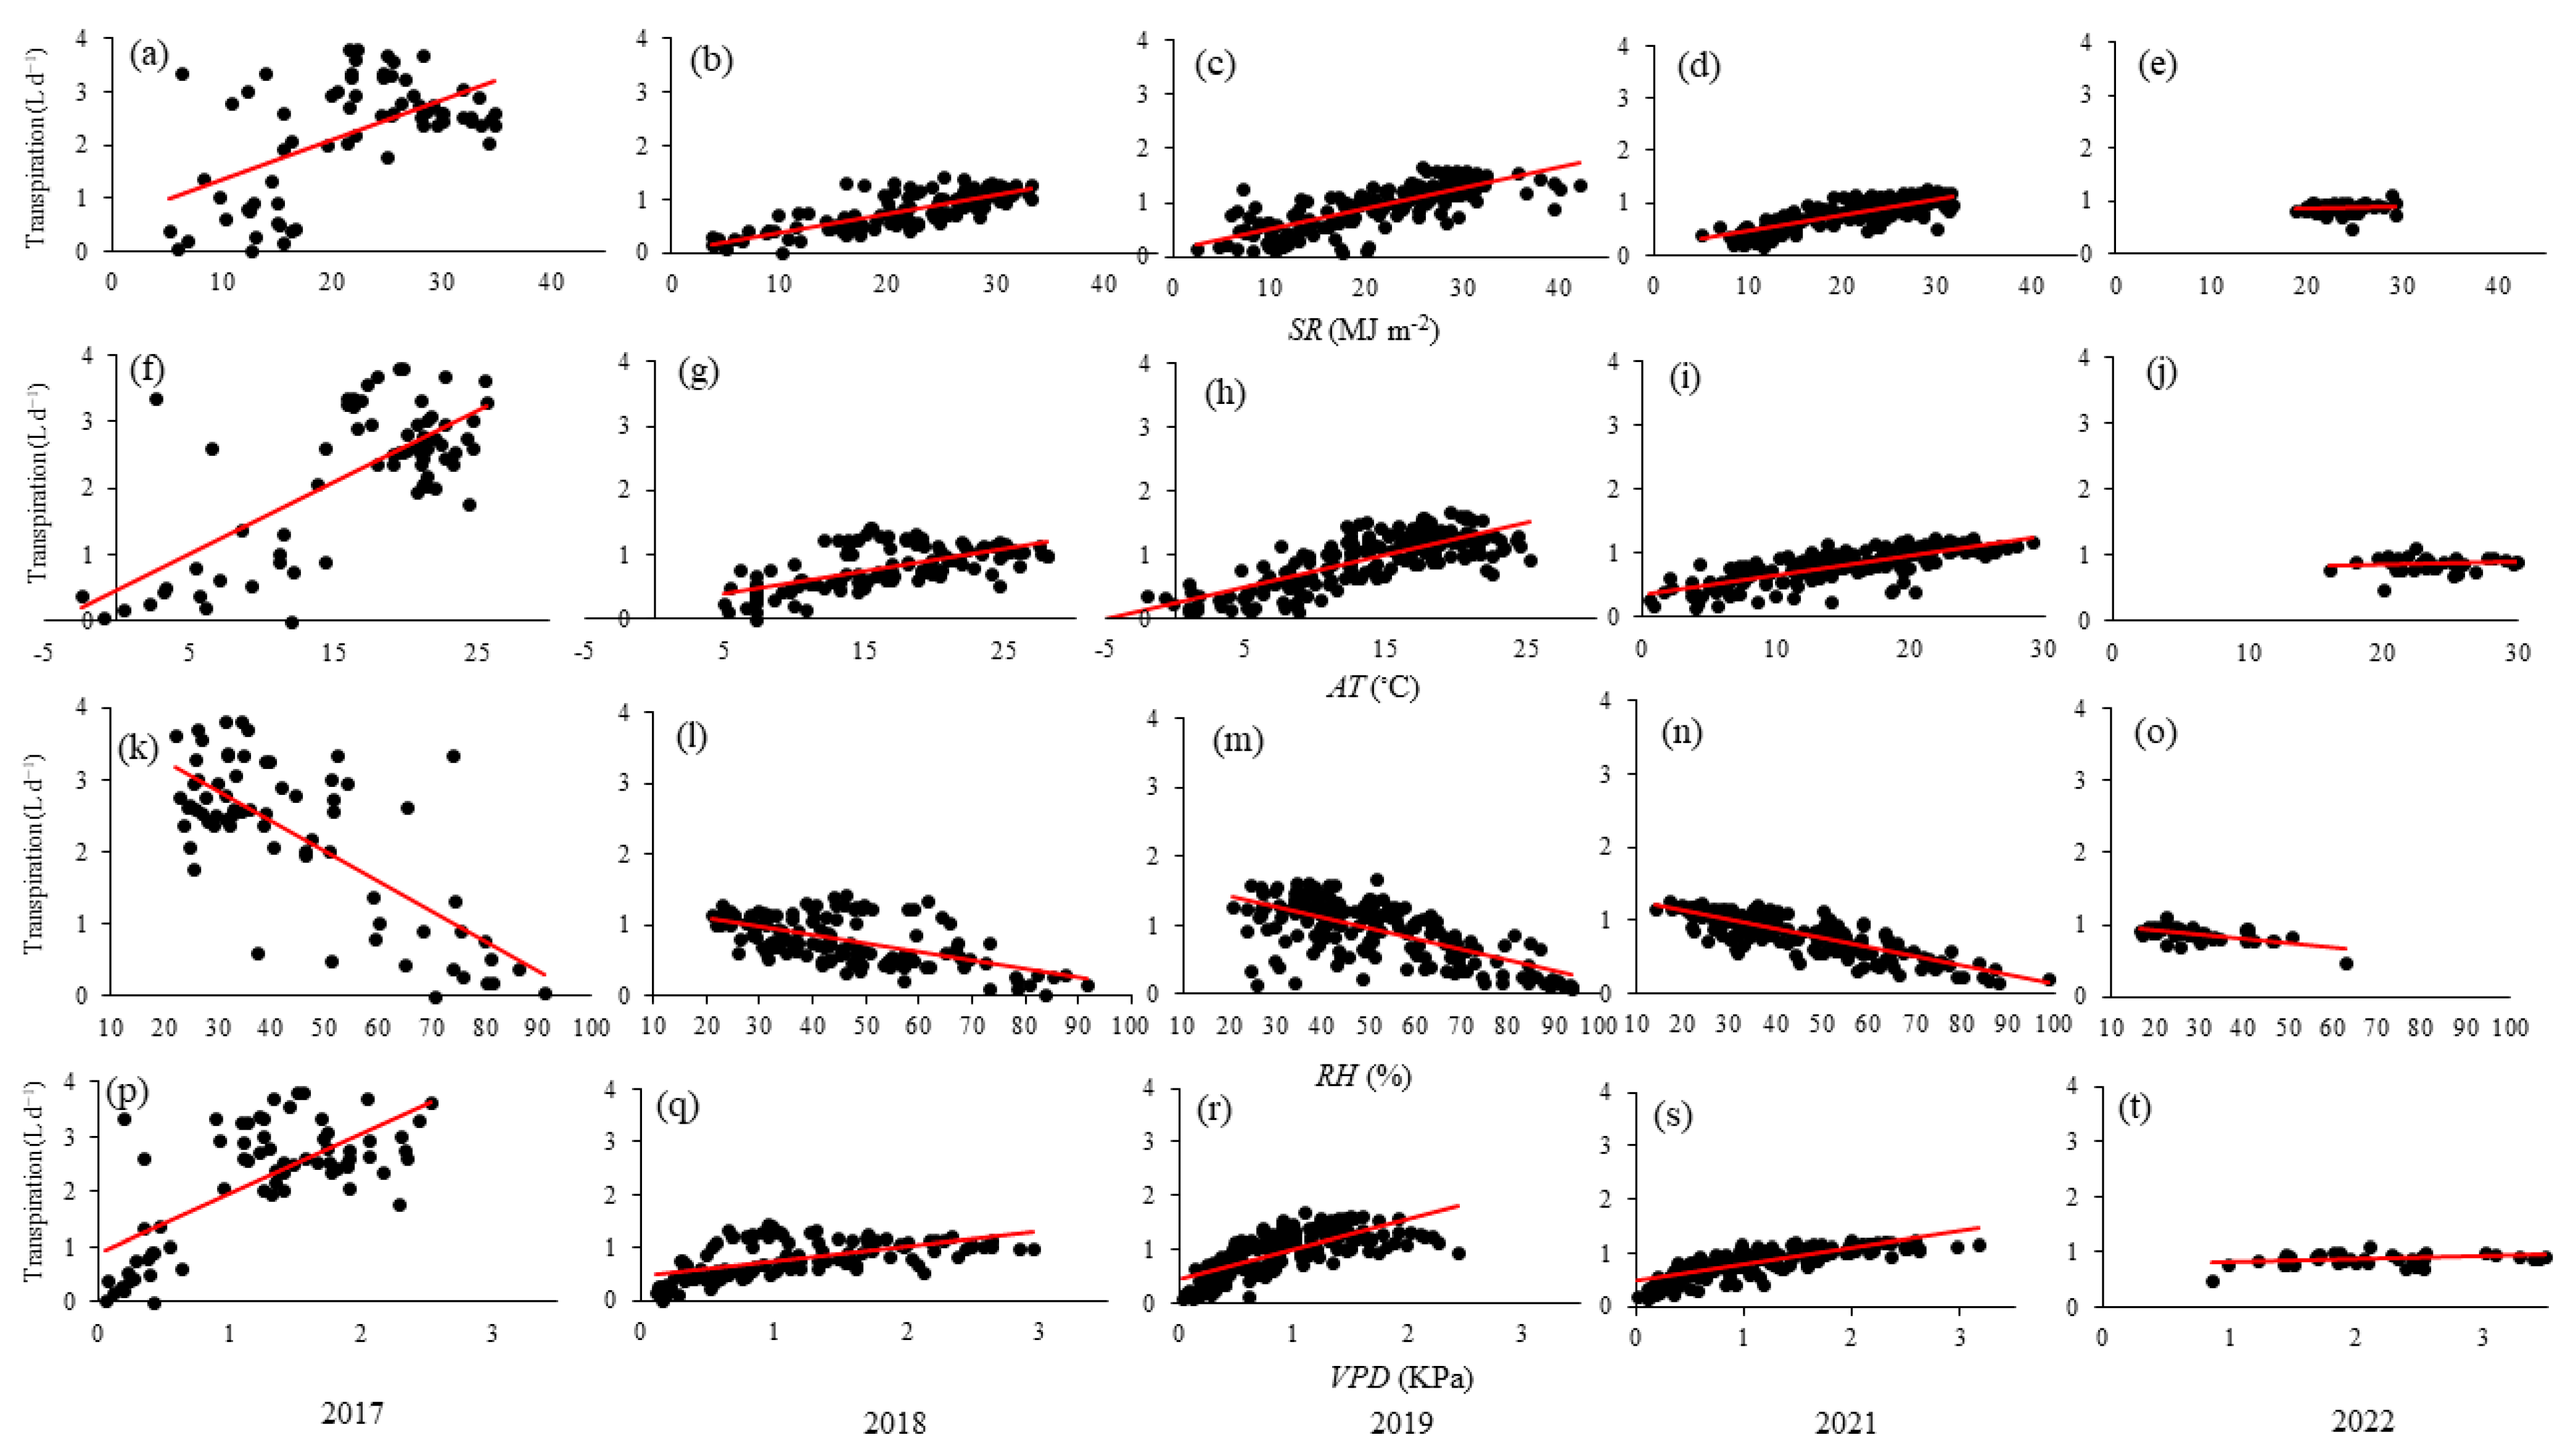
3.3. Environmental Controls on Transpiration

The seasonal variability of environmental factors influencing juniper sapling transpiration is shown in Figure 3. The distribution of cumulative daily Pr was highly variable over the years. A mix of snow and rain occurred during winter and fall in 2017 and toward the end of 2022. For the rest of the years, Pr was mainly rain during the fall and winter. A steady rise in cumulative Pr through the winter and spring seasons, which then plateau in the summer to start again in the fall, was observed in the wettest year, 2017.Conversely, the distribution of cumulative Pr during the driest year, 2021, showed a marginal response.
A seasonal SMtot response to winter precipitation inputs was observed. Overall, SMtot peaked in March or April, then steadily declined to baseline levels in October or November. The SMtot levels were the highest in 2017, peaking in early March. The lowest seasonal SMtot and highest VPD levels were obtained in 2021 and 2022. The VPD levels peaked in mid-to-late August, except for 2021 and 2022 when it reached its highest levels in early to mid-July. The seasonal variability of ST and SR was relatively uniform for all years, peaking in August for ST and July for SR. The exception was in 2020 when SR peaked in May. Across years and sites, transpiration mainly peaked in summer when SMtot dropped. The highest daily transpiration rates were recorded in August when VPD was close to the daily maximum and SMtot content was below 15% (Figure 3).
The Spearman rank order correlation test shows that Pr negatively correlated with transpiration during the active transpiration season from 2017 to 2021, with an average ρ of −0.39 (Table 5). Soil moisture at all depths shows great explanatory power for transpiration variability in the Mays-East station in 2018, with a stronger effect recorded for SM0.2 (ρ = 0.84, p < 0.001, n = 108). Transpiration was weakly correlated with SMtot (ρ = 0.37, p < 0.01, n = 69) in 2017, very strongly correlated (ρ = 0.83, p < 0.001, n = 108) in the Mays-East site, or moderately correlated (ρ = 0.49, p < 0.05, n = 108) in the Mays-West in 2018, and moderately correlated (ρ = 0.46, p < 0.001, n = 160) in 2019. However, the influence of SMtot on transpiration was significantly negative in the Mays-West site for the 2019 and 2021 years. Soil temperature and transpiration relationships were positively correlated at all depths and all 2017 to 2021 years (ρ = 0.27–0.72, p < 0.05), except that no correlations were found between transpiration and ST0.8 in Mays-East site, and transpiration and ST0.2 and ST0.5 in Mays-West site in the 2018 year. ST0.2 exhibited stronger correlations with transpiration than ST0.5 and ST0.8 in all years except for the wet 2017 year. A significant correlation between transpiration and STtot was observed in all years, with a stronger relationship recorded in the 2021 year (ρ = 0.59, p < 0.001, n = 183). In 2022, except for the relationship between transpiration and SM0.2 (ρ = 0.34, p < 0.05, n = 38), the dependence of transpiration on SM, ST, and Pr became either negative or not detectable. This was attributed to the correlations being tested only for July and August when transpiration data was collected that year.
The relationships between the juniper saplings’ transpiration and four environmental variables of interest, namely, SR, AT, RH, and VPD, are scatter-plotted in Figure 4. When evaluating the strength and direction of the monotonic association between transpiration and the various environmental variables, the Spearman rank order correlation test showed that the change in SR had positive effects on transpiration, with the correlation ranging from very strong (ρ = 0.81, p < 0.001, n = 178) in 2019 to weak (ρ = 0.38, p < 0.01, n = 69) in 2017. Additionally, a positive association between transpiration and AT was recorded from 2017 to 2021 (average ρ = 0.67, p < 0.001). Transpiration and VPD were moderately correlated in 2017 (ρ = 0.52, p < 0.001, n = 69), strongly correlated in 2018 (ρ = 0.64, p < 0.001, n = 128) and 2019 (ρ = 0.78, p < 0.001, n = 182), and very strongly correlated in 2021 (ρ = 0.86, p < 0.001, n = 183). The correlation between transpiration and RH was negative (average ρ = −0.62, p < 0.001) from 2017 to 2021. In 2022, the association between transpiration and the variables SR, AT, RH, and VPD were very weak for AT (ρ = 0.02, p > 0.05, n = 38), weak for SR (ρ = 0.21, p > 0.05, n = 38) and VPD (ρ = 0.25, p > 0.05, n = 38) and moderately negative for RH (ρ = −0.53, p < 0.001, n = 38) (Figure 4).

4. Discussion

This study evaluated the interannual variability of transpiration of western juniper saplings and its correlation with several environmental variables of interest (i.e., SM, ST, Pr, SR, AT, RH, and VPD). Plant transpiration rates are affected by water availability and weather variables [10,36,37,38]. Study results showed that juniper sapling transpiration in both the Mays-East and Mays-West sites followed a similar pattern, conforming to the effects of seasonal precipitation on soil moisture availability in cool-climate rangeland ecosystems of semiarid central Oregon, USA. A noticeable change in transpiration was detected, which increased from May to July/August across the years and then gradually decreased as ST, SR, AT, and VPD declined toward the fall season months. Similar patterns of seasonal transpiration, with higher levels in warm months and lower levels in cold months, were reported in other studies [39,40,41].
The western United States is undergoing an increase in Pr variability, with important implications for essential ecological services [42]. Precipitation in our study site revealed variability over the six years, with the wettest year, 2017, and the driest year, 2021, as remarkable hydroclimatic extremes during the observation period. The highest transpiration rates obtained in 2017 were attributed to the highest Pr amount and timing early in the season. Also, the greater antecedent soil moisture levels resulting from winter precipitation and snowmelt runoff for that year, as reported in [27], likely contributed to the higher transpiration rates obtained. The relatively higher Pr registered in January to April of 2017 and 2019 may have contributed to the recharge of the soil profile, particularly for the 0 to 0.5 m depth, resulting in a higher transpiration rate maintained during mid-to-late summer for those years. Similar results were noticed by Hayat et al. [43], where wetter conditions appeared to increase soil water availability, causing transpiration to be higher. Study results showing a negative correlation between seasonal Pr and transpiration are similar to those reported in [15]. Our observations of maximum transpiration rates in June and July in the below-average Pr years (2018, 2019, 2021, and 2022) are supported by data from sap flux measurements made on other sapling trees [22]. The peak transpiration rates recorded in August of the wettest year (2017) are consistent with Dawson [24], who determined total daily transpiration for small trees from scaled-up leaf-level and sap flow measurements.
The increasing transpiration rates by the juniper saplings noted early in the spring were attributed to the stimuli from the rise in ST. Similar relationships between ST and transpiration have been reported in other studies (e.g., [39,44,45]). Conversely, the low transpiration rates observed during the colder months were attributed to decreased ST. As described in Miller and Shultz [46], transpiration in juniper woodlands is restricted by low ST. When the ST is low in cold months, the water transport rate from the soil to plant roots is reduced, and the viscosity coefficient of soil water is increased; thus, the water absorption rate through roots decreases [47]. Under low-ST stress, impairment of root growth is also likely, leading to a reduction in water uptake by roots [48,49].
Western juniper sapling transpiration during the wettest (2017) and the driest (2021) years was strongly associated with VPD. Subsurface moisture storage is an important water source for plants in seasonally dry environments [50,51]. Under the relatively higher soil moisture conditions observed in 2017, VPD was the major environmental factor driving the juniper saplings’ transpiration. Significant daily increases in VPD with relatively small decreases in soil moisture sustained and even increased transpiration throughout the most active transpiration season in the wet year, 2017. Several studies have shown that high VPD and low soil water availability can limit plant water uptake [52,53,54]. While a high VPD can increase tree transpiration [55], other effects, such as the co-occurrence of elevated VPD and low soil moisture levels induced by the reduced total Pr in 2021, likely led to an earlier decline in transpiration rates compared to the wet year. Also, the observed strong association between VPD and AT indicates that any decrease in transpiration at increased VPD could be linked or co-linked to a temperature inhibition effect.
Like AT and VPD, transpiration sensitivity to the SR explanatory parameter was positive in all years but more evident in 2019. Several studies have shown that SR and VPD are critical driving variables for transpiration in numerous ecosystems (e.g., [56,57,58]). Stomatal conductance, a primary mechanism of plant transpiration, is commonly influenced by SR, VPD, and soil water status [59]. During the 2019 season, the enhanced sensitivity of transpiration to SR corresponded with higher SM levels, causing transpiration to increase gradually. This finding is consistent with that reported by Hayat et al. [43], where the variations in transpiration were triggered by high water availability and SR. The negative correlation between transpiration and RH observed for all years in this study is consistent with the findings of several other studies (e.g., [60,61,62]).
Among the limitations affecting this study are that efforts to collect data right at the beginning of the transpiration season (late March or early April) were unsuccessful because of sensor malfunctioning and inaccessible road conditions due to snow and cold weather. Also, data collected from the saplings in the two monitoring locations (Mays-East and Mays-West) overlapped only in 2018 and 2019, not during the wettest (2017) and driest (2021) years. Therefore, a direct comparison by monitoring location was not possible during these years.
Results from this study add to the limited literature on sapling transpiration and can contribute to the improved management of cool-climate rangeland ecosystems through an enhanced understanding of water use by young-stage trees and its potential impacts on the water balance of restored juniper landscapes. This project’s findings add critical information to western juniper control by shedding light on the expected interannual variability of environmental factors driving sapling transpiration. Similar woody vegetation encroachment issues and efforts to control its expansion can be found throughout the Pacific Northwest Region of the USA and many arid and semiarid ecosystems worldwide. Future research involves studying water uptake dynamics from other rangeland vegetation species, such as sagebrush, and expanding individual plant transpiration results to the larger landscape scale.

Author Contributions

C.G.O. and M.A.B.A. developed the study design, conducted field data collection and analyses, and contributed to the writing of the manuscript. All authors have read and agreed to the published version of the manuscript.

Funding

This research was partially funded by the Oregon Watershed Enhancement Board (Grant #223-4030-23034).

Data Availability Statement

Most of the data presented in this study are available in the article. Additional information is available upon request.

Acknowledgments

The authors gratefully acknowledge the continuous support of the Hatfield Hyde Land Trust, the U.S. Department of Interior Bureau of Land Management—Prineville Office, and the OSU’s Extension Service. We also want to thank the multiple students and volunteers from Oregon State University who participated in various field data collection activities related to this research. Our thanks go to Tim Deboodt, Michael Fisher, and John Buckhouse, who pioneered the establishment of the long-term CCPWS site in 1993.

Conflicts of Interest

The authors declare no conflict of interest.

References

  1. Feng, S.; Fu, Q. Expansion of global drylands under a warming climate. Atmos. Chem. Phys. 2013, 13, 10081–10094. [Google Scholar] [CrossRef]
  2. Yin, L.; Tao, F.; Chen, Y.; Liu, F.; Hu, J. Improving terrestrial evapotranspiration estimation across China during 2000–2018 with machine learning methods. J. Hydrol. 2021, 600, 126538. [Google Scholar] [CrossRef]
  3. Yu, L.; Qiu, G.Y.; Yan, C.; Zhao, W.; Zou, Z.; Ding, J.; Qin, L.; Xiong, Y. A global terrestrial evapotranspiration product based on the three-temperature model with fewer input parameters and no calibration requirement. Earth Syst. Sci. Data. 2022, 14, 3673–3693. [Google Scholar] [CrossRef]
  4. Li, Y.; Chen, Q.; He, K.; Wang, Z. The accuracy improvement of sap flow prediction in Picea crassifolia Kom. based on the back-propagation neural network model. Hydrol. Process. 2022, 36, e14490. [Google Scholar] [CrossRef]
  5. Yang, J.; He, Z.; Lin, P.; Du, J.; Tian, Q.; Feng, J.; Liu, Y.; Guo, L.; Wang, G.; Yan, J.; et al. Variability in Minimal-Damage Sap Flow Observations and Whole-Tree Transpiration Estimates in a Coniferous Forest. Water 2022, 14, 2551. [Google Scholar] [CrossRef]
  6. Bosch, D.D.; Marshall, L.K.; Teskey, R. Forest transpiration from sap fux density measurements in a Southeastern Coastal Plain riparian bufer system. Agric. For. Meteorol. 2014, 187, 72–82. [Google Scholar] [CrossRef]
  7. Lyu, J.; He, Q.Y.; Yang, J.; Chen, Q.W.; Cheng, R.R.; Yan, M.J.; Yamanaka, N.; Du, S. Sap flow characteristics in growing and non-growing seasons in three tree species in the semiarid Loess Plateau region of China. Trees 2020, 34, 943–955. [Google Scholar] [CrossRef]
  8. Xu, S.; Yu, Z. Environmental control on transpiration: A case study of a desert ecosystem in northwest China. Water 2020, 12, 1211. [Google Scholar] [CrossRef]
  9. Liu, H.; Li, L.; Wang, S.; Yang, Q.; Zhao, W. Soil-moisture dynamics and tree-water status in a Picea crassifolia forest, Qilian Mountains, China. Sci. Cold Arid. Reg. 2020, 12, 34–46. [Google Scholar]
  10. Yu, S.; Guo, J.; Liu, Z.; Wang, Y.; Ma, J.; Li, J.; Liu, F. Assessing the impact of soil moisture on canopy transpiration using a modified Jarvis-Stewart model. Water 2021, 13, 2720. [Google Scholar] [CrossRef]
  11. Chen, S.; Chen, Z.; Xu, H.; Kong, Z.; Xu, Z.; Liu, Q.; Liu, P. Zhang, Z. Biophysical regulations of transpiration and water use strategy in a mature Chinese pine (Pinus tabulaeformis) forest in a semiarid urban environment. Hydrol. Process. 2022, 36, e14485. [Google Scholar] [CrossRef]
  12. Shen, Q.; Gao, G.; Fu, B.; Lü, Y. Sap flow and water use sources of shelter-belt trees in an arid inland river basin of Northwest China. Ecohydrology 2015, 8, 1446–1458. [Google Scholar] [CrossRef]
  13. Wullschleger, S.D.; Hanson, P.J. Sensitivity of canopy transpiration to altered precipitation in an upland oak forest: Evidence from a long-term field manipulation study. Glob. Chang. Biol. 2006, 12, 97–109. [Google Scholar] [CrossRef]
  14. Liu, J.; Cheng, F.; Munger, W.; Jiang, P.; Whitby, T.G.; Chen, S.; Ji, W.; Man, X. Precipitation extremes influence patterns and partitioning of evapotranspiration and transpiration in a deciduous boreal larch forest. Agric. For. Meteorol. 2020, 287, 107936. [Google Scholar] [CrossRef]
  15. Han, C.; Chen, N.; Zhang, C.; Liu, Y.; Khan, S.; Lu, K.; Li, Y.; Dong, X.; Zhao, C. Sap flow and responses to meteorological about the Larix principis-rupprechtii plantation in Gansu Xinlong mountain, northwestern China. For. Ecol. Manag. 2019, 451, 117519. [Google Scholar] [CrossRef]
  16. Niu, Z.; He, H.; Zhu, G.; Ren, X.; Zhang, L.; Zhang, K.; Yu, G.; Ge, R.; Li, P.; Zeng, N.; et al. An increasing trend in the ratio of transpiration to total terrestrial evapotranspiration in China from 1982 to 2015 caused by greening and warming. Agric. For. Meteorol. 2019, 279, 107701. [Google Scholar] [CrossRef]
  17. Juice, S.M.; Templer, P.H.; Phillips, N.G.; Ellison, A.M.; Pelini, S.L. Ecosystem warming increases sap flow rates of northern red oak trees. Ecosphere 2016, 7, e01221. [Google Scholar] [CrossRef]
  18. Angulo, M.A.; Ninot, J.M.; Peñuelas, J.; Cornelissen, J.H.; Grau, O. Tree sapling responses to 10 years of experimental manipulation of temperature, nutrient availability, and Shrub cover at the Pyrenean treeline. Front. Plant Sci. 2019, 9, 1871. [Google Scholar] [CrossRef]
  19. Keles, S.O. How anatomical and morphological characteristics affect the flexural properties of two angiosperm species at the sapling stage. BioResources 2020, 15, 5843–5858. [Google Scholar] [CrossRef]
  20. Zafar, Z.; Rasheed, F.; Abdullah, M.; Salam, M.M.A.; Mohsin, M. Effects of water deficit on growth and physiology of Young Conocarpus erectus L. and Ficus benjamina L. saplings. Bangladesh J. Bot. 2019, 48, 1215–1221. [Google Scholar] [CrossRef]
  21. Sabir, M.A.; Rasheed, F.; Zafar, Z.; Khan, I.; Nawaz, M.F.; ul Haq, I.; Bilal, M. A consistent CO2 assimilation rate and an enhanced root development drives the tolerance mechanism in Ziziphus jujuba under soil water deficit. Arid. Land. Res. Manag. 2020, 34, 392–404. [Google Scholar] [CrossRef]
  22. Wullschleger, S.D.; Hanson, P.J.; Tschaplinski, T.J. Whole-plant water flux in understory red maple exposed to altered precipitation regimes. Tree Physiol. 1998, 18, 71–79. [Google Scholar] [CrossRef] [PubMed]
  23. Oberhuber, W.; Hammerle, A.; Kofler, W. Tree water status and growth of saplings and mature Norway spruce (Picea abies) at a dry distribution limit. Front. Plant Sci. 2015, 6, 703. [Google Scholar] [CrossRef] [PubMed]
  24. Dawson, T.E. Determining water use by trees and forests from isotopic, energy balance and transpiration analyses: The roles of tree size and hydraulic lift. Tree Physiol. 1996, 16, 263–272. [Google Scholar] [CrossRef] [PubMed]
  25. Miller, R.F.; Bates, J.D.; Svejcar, T.J.; Pierson, F.B.; Eddleman, L.E. Biology, Ecology, and Management of Western Juniper (Juniperus occidentalis); Oregon State University: Corvallis, OR, USA, 2005. [Google Scholar]
  26. Davies, K.W.; Bates, J.D. Restoring big sagebrush after controlling encroaching western juniper with fire: Aspect and subspecies effects. Restor. Ecol. 2017, 25, 33–41. [Google Scholar] [CrossRef]
  27. Ochoa, C.G.; Caruso, P.; Ray, G.; Deboodt, T.; Jarvis, W.T.; Guldan, S.J. Ecohydrologic connections in semiarid watershed systems of central Oregon USA. Water 2018, 10, 181. [Google Scholar] [CrossRef]
  28. Ray, G.; Ochoa, C.G.; Deboodt, T.; Mata-Gonzalez, R. Overstory–understory vegetation cover and soil water content observations in western juniper woodlands: A paired watershed study in Central Oregon, USA. Forests 2019, 10, 151. [Google Scholar] [CrossRef]
  29. Bates, J.D.; Svejcar, T.; Miller, R.; Davies, K.W. Plant community dynamics 25 years after juniper control. Rangel. Ecol. Manag. 2017, 70, 356–362. [Google Scholar] [CrossRef]
  30. Abdallah, M.A.; Durfee, N.; Mata-Gonzalez, R.; Ochoa, C.G.; Noller, J.S. Water use and soil moisture relationships on western juniper trees at different growth stages. Water 2020, 12, 1596. [Google Scholar] [CrossRef]
  31. Mata-González, R.; Abdallah, M.A.; Ochoa, C.G. Water use by mature and sapling western juniper (Juniperus occidentalis) trees. Rangel. Ecol. Manag. 2021, 74, 110–113. [Google Scholar] [CrossRef]
  32. Durfee, N.; Ochoa, C.G.; Mata-Gonzalez, R. The use of low-altitude UAV imagery to assess western juniper density and canopy cover in treated and untreated stands. Forests 2019, 10, 296. [Google Scholar] [CrossRef]
  33. Abdallah, M.A.; Mata-González, R.; Noller, J.S.; Ochoa, C.G. Ecosystem carbon in relation to woody plant encroachment and control: Juniper systems in Oregon, USA. Agric. Ecosyst. Environ. 2020, 290, 106762. [Google Scholar] [CrossRef]
  34. Fisher, M. Analysis of Hydrology and Erosion in Small, Paired Watersheds in a Juniper-Sagebrush Area of Central Oregon. Ph.D. Thesis, Oregon State University, Corvallis, OR, USA, September 2004. [Google Scholar]
  35. Kirmse, R.D.; Norton, B.E. Comparison of the reference unit method and dimensional analysis methods for two large shrubby species in the Caatinga woodlands. J. Range Manag. 1985, 38, 425–428. [Google Scholar] [CrossRef]
  36. Chang, X.X.; Zhao, W.Z.; He, Z.B. Radial pattern of sap flow and response to microclimate and soil moisture in Qinghai spruce (Picea crassifolia) in the upper Heihe River Basin of arid northwestern China. Agric. For. Meteorol. 2014, 187, 14–21. [Google Scholar] [CrossRef]
  37. Rahman, M.A.; Moser, A.; Rötzer, T.; Pauleit, S. Microclimatic differences and their influence on transpirational cooling of Tilia cordata in two contrasting street canyons in Munich, Germany. Agric. For. Meteorol. 2017, 232, 443–456. [Google Scholar] [CrossRef]
  38. Hayat, M.; Zha, T.; Jia, X.; Iqbal, S.; Qian, D.; Bourque, C.P.A.; Khan, A.; Tian, Y.; Bai, Y.; Liu, P.; et al. A multiple-temporal scale analysis of biophysical control of sap flow in Salix psammophila growing in a semiarid shrubland ecosystem of northwest China. Agric. For. Meteorol. 2020, 288, 107985. [Google Scholar] [CrossRef]
  39. Liu, X.; Nie, Y.; Luo, T.; Yu, J.; Shen, W.; Zhang, L. Seasonal shift in climatic limiting factors on tree transpiration: Evidence from sap flow observations at alpine treelines in southeast Tibet. Front. Plant Sci. 2016, 7, 1018. [Google Scholar] [CrossRef] [PubMed]
  40. Liu, X.; Zhang, B.; Zhuang, J.Y.; Han, C.; Zhai, L.; Zhao, W.R.; Zhang, J.C. The relationship between sap flow density and environmental factors in the Yangtze River delta region of China. Forests 2017, 8, 74. [Google Scholar] [CrossRef]
  41. Liu, X.; Biondi, F. Transpiration drivers of high-elevation five-needle pines (Pinus longaeva and Pinus flexilis) in sky-island ecosystems of the North American Great Basin. Sci. Total Environ. 2020, 739, 139861. [Google Scholar] [CrossRef]
  42. Zhang, F.; Biederman, J.A.; Dannenberg, M.P.; Yan, D.; Reed, S.C.; Smith, W.K. Five decades of observed daily precipitation reveal longer and more variable drought events across much of the western United States. Geophys. Res. Lett. 2021, 48, e2020GL092293. [Google Scholar] [CrossRef]
  43. Hayat, M.; Xiang, J.; Yan, C.; Xiong, B.; Wang, B.; Qin, L.; Saeed, S.; Hussain, A.; Zou, Z.; Qiu, G.Y. Environmental control on transpiration and its cooling effect of Ficus concinna in a subtropical city Shenzhen, southern China. Agric. For. Meteorol. 2022, 312, 108715. [Google Scholar] [CrossRef]
  44. Wu, S.H.; Jansson, P.E.; Kolari, P. The role of air and soil temperature in the seasonality of photosynthesis and transpiration in a boreal Scots pine ecosystem. Agric. For. Meteorol. 2012, 156, 85–103. [Google Scholar] [CrossRef]
  45. Wieser, G.; Grams, T.E.E.; Matyssek, R.; Oberhuber, W.; Gruber, A. Soil warming increased whole-tree water use of Pinus cembra at the treeline in the Central Tyrolean Alps. Tree Physiol. 2015, 35, 279–288. [Google Scholar] [CrossRef] [PubMed]
  46. Miller, R.F.; Shultz, L.M. Water relations and leaf morphology of Juniperus occidentalis in the northern Great Basin. For. Sci. 1987, 33, 690–706. [Google Scholar]
  47. Zhu, S.; Chen, H.; Dai, Y.; Lu, X.; Shangguan, W.; Yuan, H.; Wei, N. Evaluation of the effect of low soil temperature stress on the land surface energy fluxes simulation in the site and global offline experiments. J. Adv. Model. Earth Syst. 2021, 13, e2020MS002403. [Google Scholar] [CrossRef]
  48. Nagasuga, K.; Murai-Hatano, M.; Kuwagata, T. Effects of low root temperature on dry matter production and root water uptake in rice plants. Plant Prod. Sci. 2011, 14, 22–29. [Google Scholar] [CrossRef]
  49. Ni, J.; Cheng, Y.; Wang, Q.; Ng, C.W.W.; Garg, A. Effects of vegetation on soil temperature and water content: Field monitoring and numerical modelling. J. Hydrol. 2019, 571, 494–502. [Google Scholar] [CrossRef]
  50. McCormick, E.L.; Dralle, D.N.; Hahm, W.J.; Tune, A.K.; Schmidt, L.M.; Chadwick, K.D.; Rempe, D.M. Widespread woody plant use of water stored in bedrock. Nature 2021, 597, 225–229. [Google Scholar] [CrossRef]
  51. Jarecke, K.M.; Hawkins, L.R.; Bladon, K.D.; Wondzell, S.M. Carbon uptake by Douglas-fir is more sensitive to increased temperature and vapor pressure deficit than reduced rainfall in the western Cascade Mountains, Oregon, USA. Agric. For. Meteorol. 2023, 329, 109267. [Google Scholar] [CrossRef]
  52. Sulman, B.N.; Roman, D.T.; Yi, K.; Wang, L.; Phillips, R.P.; Novick, K.A. High atmospheric demand for water can limit forest carbon uptake and transpiration as severely as dry soil. Geophys. Res. Lett. 2016, 43, 9686–9695. [Google Scholar] [CrossRef]
  53. Grossiord, C.; Sevanto, S.; Borrego, I.; Chan, A.M.; Collins, A.D.; Dickman, L.T.; Hudson, P.J.; McBranch, N.; Michaletz, S.T.; Pockman, W.T.; et al. Tree water dynamics in a drying and warming world. Plant Cell Environ. 2017, 40, 1861–1873. [Google Scholar] [CrossRef] [PubMed]
  54. Chen, S.; Wei, W.; Tong, B.; Chen, L. Effects of soil moisture and vapor pressure deficit on canopy transpiration for two coniferous forests in the Loess Plateau of China. Agric. For. Meteorol. 2023, 339, 109581. [Google Scholar] [CrossRef]
  55. Du, J.; Dai, X.; Huo, Z.; Wang, X.; Wang, S.; Wang, C.; Zhang, C.; Huang, G. Stand transpiration and canopy conductance dynamics of Populus popularis under varying water availability in an arid area. Sci. Total Environ. 2023, 892, 164397. [Google Scholar] [CrossRef]
  56. Wang, H.; Tetzlaff, D.; Dick, J.J.; Soulsby, C. Assessing the environmental controls on Scots pine transpiration and the implications for water partitioning in a boreal headwater catchment. Agric. For. Meteorol. 2017, 240–241, 58–66. [Google Scholar] [CrossRef]
  57. Oogathoo, S.; Houle, D.; Duchesne, L.; Kneeshaw, D. Vapour pressure deficit and solar radiation are the major drivers of transpiration of balsam fir and black spruce tree species in humid boreal regions, even during a short-term drought. Agric. For. Meteorol. 2020, 291, 108063. [Google Scholar] [CrossRef]
  58. Ghimire, C.P.; van Meerveld, H.I.; Zwartendijk, B.W.; Bruijnzeel, A.L.; Ravelona, M.; Lahitiana, J.; Lubczynski, M.W. Vapour pressure deficit and solar radiation are the major drivers of transpiration in montane tropical secondary forests in eastern Madagascar. Agric. For. Meteorol. 2022, 326, 109159. [Google Scholar] [CrossRef]
  59. Beegum, S.; Timlin, D.; Reddy, K.R.; Reddy, V.; Sun, W.; Wang, Z.; Fleisher, D.; Ray, C. Improving the cotton simulation model, GOSSYM, for soil, photosynthesis, and transpiration processes. Sci. Rep. 2023, 13, 7314. [Google Scholar] [CrossRef]
  60. Vesala, T.; Sevanto, S.; Grönholm, T.; Salmon, Y.; Nikinmaa, E.; Hari, P.; Hölttä, T. Effect of leaf water potential on internal humidity and CO2 dissolution: Reverse transpiration and improved water use efficiency under negative pressure. Front. Plant Sci. 2017, 8, 54. [Google Scholar] [CrossRef]
  61. Tian, Q.; He, Z.; Xiao, S.; Du, J.; Peng, X.; Chen, L.; Lin, P.; Zhu, X.; Ding, A. Growing season stem water status assessment of Qinghai Spruce through the sap flow and stem radial variations in the Qilian Mountains of China. Forests 2018, 9, 2. [Google Scholar] [CrossRef]
  62. Chia, S.Y.; Lim, M.W. A critical review on the influence of humidity for plant growth forecasting. IOP Conf. Ser. Mater. Sci. Eng. 2022, 1257, 012001. [Google Scholar] [CrossRef]
Figure 1. Map shows the location of the study site in central Oregon, USA, and (a) the image illustrates western juniper saplings re-occupying the landscape where mature juniper trees were removed in 2005. It also shows the mature juniper trees left in the ridgetop. The location of the study site in Crook County, central Oregon, is indicated in the outline map of the state of Oregon, USA. (b) Shows saplings at Mays-West at the time of sensor installation in the fall of 2018. (c) Indicates the weather station installed next to the juniper saplings at Mays-West and the growth of the saplings, as in the summer of 2023. (d) Shows the depth of the root zone for a 1.4 m tall juniper sapling at the study site.
Hydrology 10 00232 g001
Figure 2. Mean value ± standard error of mean monthly transpiration of juniper saplings in the Mays-East and Mays-West locations during the May to October season in 2017, 2018, 2019, 2021, and 2022. Upper case letters indicate the difference in the transpiration of Mays-East juniper saplings in different years. Lowercase letters denote the difference in the transpiration of Mays-West juniper saplings in different years—no data are available for transpiration in the year 2020.
Hydrology 10 00232 g002
Figure 3. Seasonal fluctuation of several environmental variables and western juniper sapling transpiration rates measured at Mays-East and Mays-West locations from 2017 to 2022. Environmental variables are cumulative precipitation, Pr; soil moisture averaged over the upper 0.8 m soil profile SMtot; vapor pressure deficit, VPD; soil temperature averaged over the upper 0.8 m soil profile STtot; and solar radiation, SR. The STtot and SMtot values represent the Mays-East location only.
Hydrology 10 00232 g003
Figure 4. Relationships between transpiration and solar radiation, SR (ae); air temperature, AT (fj); relative humidity, RH (ko); and vapor pressure deficit, VPD (pt) during the whole active transpiration season in the years 2017, 2018, 2019, 2021, and 2022. For the year 2017, the relationships are from June to October. For 2022, the relationships are for July and August only.
Hydrology 10 00232 g004
Table 1. Total annual precipitation and percentage difference from the long-term mean value (307 mm) for 2005 to 2022.
YearAnnual Precipitation (mm)Difference (%)
2017327+6.5
2018244−20.5
2019253−17.6
2020211−31.3
2021198−35.5
2022278−9.4
Table 2. Summary of biometric parameters for instrumented trees measured in 2017 (Mays-East) and 2018 (Mays-West).
Site(Mays-East)(Mays-West)
Tree No.1234
Height (m)1.551.301.501.40
Maximum Width (m)0.701.050.800.52
Equipped Stem/Branch Diameter (mm)15212828
Equipped Stem/Branch Area (mm2)177346615615
Table 3. Environmental data for the measured juniper transpiration period from May to October in 2017 to 2022.
(Mays-East) Location(Mays-West) Location
YearsSR
(MJ m−2)
AT
(°C)
RH
(%)
VPD
(KPa)
Pr
(mm)
SM0.2
(%)
SM0.5
(%)
SM0.8
(%)
ST0.2
(°C)
ST0.5
(°C)
ST0.8
(°C)
SM0.2
(%)
SM0.5
(%)
SM0.8
(%)
ST0.2
(°C)
ST0.5
(°C)
ST0.8
(°C)
201721.4 A14.1 CD50.0 AB0.96 CD7714.5 B20.1 A14.2 A20.6 AB18.9 B17.5 BCN/AN/AN/AN/AN/AN/A
201821.2 A15.5 B49.2 B1.03 BC10614.4 B17.7 C13.1 B20.6 AB19.1 AB17.7 AB6.0 D7.3 D8.1 C10.7 D12.1 D12.6 D
201921.1 A13.7 D51.7 A0.88 D5817.8 A20.6 A13.4 B19.6 C17.8 C16.4 D17.9 A12.6 A15.8 A15.5 C14.0 C13.3 C
202020.7 A14.7 BC43.8 C1.10 B5914.5 B18.6 B14.6 A20.2 BC18.5 BC17.1 C10.1 C8.6 B9.2 B16.5 B14.8 B13.9 B
202121.5 A14.8 BC45.0 C1.10 B7913.1 C16.8 D13.2 B21.3 A19.6 A18.2 A11.4 B8.2 C9.1 B18.7 A16.2 A14.9 A
202221.2 A16.5 A43.8 C1.27 A11113.3 C15.7 E12.7 C20.3 BC18.5 BC17.0 CN/AN/AN/AN/AN/AN/A
Signs********* *********ns*********************
SR = mean daily solar radiation; AT = mean daily air temperature; RH = mean daily relative humidity; VPD = mean daily vapor pressure deficit; Pr = total daily precipitation; SM0.2 = mean daily soil moisture at 0.2 m depth; SM0.5 = mean daily soil moisture at 0.5 m depth; SM0.8 = mean daily soil moisture at 0.8 m depth; ST0.2 = mean daily soil temperature at 0.2 m depth; ST0.5 = mean daily soil temperature at 0.5 m depth; ST0.8 = mean daily soil temperature at 0.8 m depth. Different upper-case letters (A–E) along the columns indicate significant differences among years for a given environmental variable. *** = p < 0.001; ** = p < 0.01; * = p ≤ 0.05; ns = not significant; N/A = data not available.
Table 4. Correlations among environmental variables during the monitored transpiration season (May to October) for the years 2017 to 2022.
SRATRHVPDPrSM0.2SM0.5SM0.8ST0.2ST0.5ST0.8
SR1.00
AT0.711.00
RH−0.63−0.921.00
VPD0.650.97−0.961.00
Pr−0.15−0.290.41−0.331.00
SM0.20.34−0.190.30−0.270.171.00
SM0.50.44−0.080.20−0.170.150.971.00
SM0.80.37−0.130.24−0.210.170.970.981.00
ST0.20.760.96−0.870.92−0.27−0.15−0.02−0.071.00
ST0.50.570.91−0.860.90−0.29−0.43−0.31−0.350.951.00
ST0.80.360.81−0.800.82−0.29−0.65−0.54−0.560.830.961.00
Table 5. Spearman’s rank correlation coefficients between the juniper saplings’ transpiration and Pr, SM, and ST at different soil depths, SMtot, and STtot from May to October in 2017, 2018, 2019, 2021, and 2022. For the year 2017, the correlations are from June to October. For 2018, the correlations are for September and October only in the Mays-West station. For 2019, the correlations are from May to September in the Mays-West station. For 2022, the correlations are for July and August only.
YearsPrStationSM0.2SM0.5SM0.8SMtotST0.2ST0.5ST0.8STtot
2017−0.41 ***Mays-East0.37 **0.36 **0.35 **0.37 **0.42 ***0.44 ***0.46 ***0.45 ***
2018−0.56 ***Mays-East0.84 ***0.80 ***0.70 ***0.83 ***0.54 ***0.36 ***0.19 ns0.41 ***
Mays-West0.25 ns0.27 ns0.41 *0.49 *0.39 ns0.38 ns0.44 *0.49 *
2019−0.13 nsMays-East0.43 ***0.46 ***0.42 ***0.46 ***0.60 ***0.47 ***0.34 ***0.50 ***
Mays-West−0.36 ***−0.07 ns−0.07 ns−0.28 **0.55 ***0.44 ***0.40 ***0.48 ***
2021−0.45 ***Mays-West0.12 ns−0.23 **−0.17 *−0.33 ***0.72 ***0.50 ***0.27 ***0.59 ***
2022−0.28 nsMays-West0.34 *−0.13 ns−0.35 *−0.02 ns0.02 ns−0.42 **−0.58 ***−0.30 ns
*** = p < 0.001; ** = p < 0.01; * = p ≤ 0.05; ns = not significant.
Disclaimer/Publisher’s Note: The statements, opinions and data contained in all publications are solely those of the individual author(s) and contributor(s) and not of MDPI and/or the editor(s). MDPI and/or the editor(s) disclaim responsibility for any injury to people or property resulting from any ideas, methods, instructions or products referred to in the content.

