Review

Multivariate Statistical Analysis for Water Quality Assessment: A Review of Research Published between 2001 and 2020

by
Daphne H. F. Muniz
* and
Eduardo C. Oliveira-Filho
Brazilian Agricultural Research Corporation, Embrapa Cerrados, Planaltina 73310-970, DF, Brazil
*
Author to whom correspondence should be addressed.
Hydrology 2023, 10(10), 196; https://doi.org/10.3390/hydrology10100196
Submission received: 27 July 2023 / Revised: 12 September 2023 / Accepted: 26 September 2023 / Published: 5 October 2023
(This article belongs to the Topic Hydrology and Water Resources Management)

Abstract

:
Research on water quality is a fundamental step in supporting the maintenance of environmental and human health. The elements involved in water quality analysis are multidimensional, because numerous characteristics can be measured simultaneously. This multidimensional character encourages researchers to statistically examine the data generated through multivariate statistical analysis (MSA). The objective of this review was to explore the research on water quality through MSA between the years 2001 and 2020, present in the Web of Science (WoS) database. Annual results, WoS subject categories, conventional journals, most cited publications, keywords, water sample types analyzed, country or territory where the study was conducted and most used multivariate statistical analyses were topics covered. The results demonstrate a considerable increase in research using MSA in water quality studies in the last twenty years, especially in developing countries. River, groundwater and lake were the most studied water sample types. In descending order, principal component analysis (PCA), hierarchical cluster analysis (HCA), factor analysis (FA) and discriminant analysis (DA) were the most used techniques. This review presents relevant information for researchers in choosing the most appropriate methods to analyze water quality data.

1. Introduction

The topic of water has received high visibility and attention on the global sustainability agenda. This is due to increasing pressure from factors such as economic development models, climate change, population growth and public health [1,2]. Sustainable development objective number 6 (SDG6) of the United Nations 2030 Agenda for Sustainable Development is entirely dedicated to water and, in addition to addressing major challenges of universal access to sanitation and water in desirable quantity and quality, presents issues related to water resources management [3].
The analysis, assessment and monitoring of water quality are important tools for water resource management, providing a comprehensive understanding of the state of water [4,5]. Although water quality data at the global level remain sparse, mainly due to the lack of monitoring in less developed countries, there has been a tendency for the generation of these data to increase, via studies that analyze water quality [1,6].
Water quality can be understood as a measure of the suitability of water in relation to natural quality, pollution effects or specific use based on physical, chemical and biological attributes [7]. This measure provides objective evidence that is needed in decision making in water resource management, in the use of water quality monitoring programs [8], in alerting people to ongoing and emerging problems (including chemical and microbial contamination, eutrophication, emerging contaminants, issues related to climate change, among others), in determining compliance with legal standards, in protecting the beneficial uses of water, in the assessment of environmental status, in temporal trends in water quality [9] and in the assessment of the effects on aquatic ecosystems [10].
The elements involved in water quality measurement are naturally multidimensional, because many aspects must be considered. Furthermore, the presence of anthropic, geological, meteorological and hydrological external factors contributes to the spatial and temporal variation in water quality [11]. This multidimensional nature encourages researchers to statistically examine the data generated. Selecting the most appropriate statistical methods is critical when seeking to obtain meaningful results, especially when evaluating complex datasets.
Among the different approaches to exploring the variables analyzed in water quality, multivariate statistical analysis (MSA) stands out [12,13]. MSA is applied in many fields of study and its use has become very common, due in large part to the increasingly complex nature of research projects and questions. It aims to explain or predict the relationships between many independent and/or dependent variables that are correlated with each other. The greater the number of variables, the more difficult it is to analyze via common methods. MSA can provide both a descriptive (patterns in the data) and an inferential (testing hypotheses about patterns of interest) approach [14,15].
MSA is a set of data analytical techniques that is under constant development. Highlights among the most established multivariate analyses include principal component analysis and factor analysis, multiple regression and multiple correlation, multiple discriminant analysis, multivariate analysis of variance and covariance, canonical correlation analysis, cluster analysis, and multidimensional scaling and analysis correspondence [16,17,18]. These techniques are valuable tools in scientific studies that assess water resources, and understanding how they have been applied is essential for the improvement of water quality research and management.
In this sense, scientometrics has emerged as a useful tool in mapping scientific literature and has been used in different areas of research, such as public health [19] and the social [20] and environmental sciences [21]. Scientometric analysis can increase the performance of research findings, identifying the characteristics of publications [22] and providing scientific and relevant results in the study of specific subjects [23].
In the area of water resources, it has been used, for example, in mapping research on drinking water [24], groundwater [25], the assessment and simulation of river water quality [26] and integrated water assessment and modeling [27].
This study presents a review of publications (2001–2020) that used MSA for water quality data analysis. Understanding the evolution of scientific research and how MSA has been applied is an important step for the water quality research process. The topics of review cover quantitative descriptive aspects of the publications, such as publication type, annual results, conventional journals, Web of Science subject categories, most cited publications, keywords, as well as the water sample type analyzed, country or territory where the study was conducted, and the MSAs most commonly used in studies involving water quality analysis.

2. Methodology

Data were obtained from Clarivate Analytics’ expanded Web of Science (WoS) database, the world’s most widely used and trusted database of research publications and citations [28,29]. According to the 2021 Journal Citation Reports™ (JCR), WoS indexed 20,942 journals in 254 search categories, with authorship from 113 countries represented [30]. An advanced search was performed with the terms TS (topic) = (water quality AND multivariate) within the limitation of the year of publication from 2001 to 2020.
In total, 5006 publications met the search criteria. Records related to publication type, authors, title, journal name, language, keywords, abstract, year of publication, WoS subject categories and number of citations were downloaded from the database.
Documents in languages other than English, experimental or laboratory studies, reviews, retractions and any that did not comply with specific criteria—water as an analysis matrix and studies that did not apply MSA in the evaluation of data (univariate analyses, indexes, models)—were excluded. The final database contained 2889 publications.
Manual coding was performed for country/territory (where the water samples were sampled), water sample type, MSA used in the studies, the h-index of 15 countries with the highest number of publications and journal impact factor (JIF) of the 10 most productive journals, the latter of which was taken from the JCR published in 2020. Keyword search was performed using VOSViewer™ software, version 1.6.18 (Leiden, The Netherlands) in order to identify the frequency of co-occurrence of keywords—in our case, the authors’ keywords—to identify possible clusters of most used terms.
The water sample types were classified into 12 different categories, taking into account sources or uses of water. Analogous or synonymous terms have been compiled to be included in the following categories: river, groundwater, lake, drinking water, seawater, wastewater, reservoir/dam, swamp, rainwater, aquaculture pond, meltwater and navigation channel. Figure 1 presents a flowchart of the steps of the scientometric review.

3. Results

3.1. Publications Outputs and WoS Subject Categories

“Journal article” ranked first in publication type with 93.53% (2702), followed by “Articles published in annals of events” with 6.47% (187) of publications. The number of publications related to the use of MSA in the water quality research increased from 32 in 2001 to 350 in 2020, a significant growth in the last 20 years, with 2020 being the year with the highest number of publications (Figure 2).
This increase in the number of studies that used MSA in water quality research is directly linked to the fact that there was an increase in scientific publications as a whole. In the last decade alone, there has been an increase of approximately 4% per year in global research output, including peer-reviewed scientific articles and conference papers, in the most diverse areas, including water research [31].
Scientific production was divided into four distinct periods. The first period (2001–2005) consists of 197 publications, representing 6.82% of the total publications, with 2002 being the year with the fewest publications in the period (31 publications). Among the five most cited publications (according to the WoS database) of the period, there are studies that used MSA in the analysis of complex matrices to assess water quality in rivers [32,33,34,35] and groundwater [36].
The second period (2006–2010), composed of 460 publications, represents 15.92% of the total publications. It is in this period that the most cited publication on the subject is found, where MSA was used as a tool in the temporal and spatial evaluation of an extensive matrix of data from a river [37]. The other four most cited publications from the period used MSA to aid research in groundwater [38,39], lakes [40] and rivers [41].
The third period (2011–2015) consists of 866 publications, which corresponds to 29.98% of the total. For this period analyzed, the most cited publications applied MSA to an analysis of the influence of natural and anthropogenic factors on the quality of surface (river) and groundwater in urban and rural areas [42]; in the analysis of fluoride, arsenic and physical-chemicals in groundwater [43]; in the evaluation of heavy metals in the water-sediment compartment of a river [44]; and in the identification of sources of contamination of groundwater in an aquifer system [45].
The fourth and last analyzed period (2016–2020) represents almost half of the total publications (20 years) with 47.28% or 1366 publications. This considerable increase is mainly due to the global growth of scientific publications in the last 10 years, driven by the economic growth of emerging countries, increased international collaboration in research and improved access to technology [31,46].
Of the five most cited articles in the fourth period, four of them applied MSA in groundwater quality research: for health risk assessment [47], for analyzing trace element contamination [48], for evaluating hydrogeochemical processes and evaluation of the quality of water for domestic use and irrigation [49] and in the evaluation of arsenic and heavy metals [50].
Studies related to the topic returned a total of 77 WoS subject categories. Of the 2889 publications, 1484 were classified in 1 WoS subject category, 727 in 2 categories, 552 in 3 categories, 108 in 4 categories and only 6 publications were classified in 5 subject categories. Figure 3 shows the 15 categories that appeared the most in the studies, with “Environmental Sciences” comprising a total of 1590 publications, followed by the categories “Water Resources” (852), “Multidisciplinary Geosciences” (418), “Marine and Freshwater Biology” (329) and “Environmental Engineering” (280 publications).
Figure 4 presents the time trend of the five main WoS subject categories between 2001 and 2020. The category “Environmental Sciences” is at the top of publications for each year of the analyzed period, with the exception of the year 2006, in which “Marine and Freshwater Biology” surpassed it. The “Water Resources” category showed growth from 2007 onwards, while the “Marine and Freshwater Biology” category showed an inverse behavior from the same year. As of 2012, the “Multidisciplinary Geosciences” category surpassed the “Marine and Freshwater Biology” category, remaining in third place until 2019.
According to the scope of the WoS subject categories, “Environmental Sciences” covers several areas of the environment, such as monitoring, technology, management, environmental contamination, toxicology, environmental health, geology, soil science and conservation, water resources research and engineering, climate change, biodiversity conservation and even regional natural resources. As it includes several interrelated disciplines, this category was included in more than half of the publications.

3.2. Key Journals and Most Cited Publications

A total of 604 journals published studies related to the water quality analysis and the use of MSA in the period between 2001 and 2020. Among these, 498 (82.45%) contained less than 10 publications. The 10 journals that published the most on the use of MSA in water quality research, the impact factor of these journals (with and without self-citation) and the percentage in relation to the total number of publications analyzed (n = 2889) are shown in Table 1. Water Research (JIF 11.263), Science of the Total Environment (JIF 7.963) and Marine Pollution Bulletin (JIF 5.553) were the journals with highest impact factor. Environmental Monitoring and Assessment was the journal with the most publications on the topic, with 8.10% of the total publications, followed by Environmental Earth Science (4.91%), Environmental Science and Pollution Research (3.08%), Science of the Total Environment (2.56%) and Water (2.32%).
Water Research is ranked as the second most published journal in the “Water Resources” WoS subject category [51]. It is one of the leading and most comprehensive journals focusing on various aspects such as the anthropogenic water cycle, water quality and water management, thus reflecting advances in water science, technology and policy [52]. Water Research was also the most productive journal in the scientometric study of drinking water treatment technologies [53] and the second most productive journal in scientometric study on quantitative microbial risk assessment in water quality analysis [54].
The journal Environmental Monitoring and Assessment (JIFA 2.513) was the most productive in the scientometric analysis of water quality research in India [55] and in scientific mapping of published literature on water quality indices (WQI) [56].
Table 2 presents the 15 most cited publications in water quality research using MSA, according to the WoS database.
As shown in Table 2, the 15 most cited studies in water quality research using MSA were published between 2002 and 2010. The water sample type classified as “River” was analyzed in 9 of the 15 publications, “Groundwater” in 6 publications, and “Lake” and “Seawater” analyzed in 1 publication each.
Of these 15 publications, 5 were published in the Water Research journal and all of them were published in an open-access system. Studies have shown that open-access articles have more citations than the media of non-open-access journals and benefit from such things as greater chances of disclosure and a broader increase in research confidence [62,63].
The most frequently cited publication, with 1207 citations, was “Assessment of surface water quality using multivariate statistical techniques: A case study of the Fuji river basin, Japan” [37]. In this article, the authors temporally and spatially evaluated a large matrix of water quality data from an important river in the region using MSA, such as cluster analysis, principal component analysis, factor analysis and discriminant analysis.
The second most cited publication, “Multivariate statistical techniques for the evaluation of spatial and temporal variations in water quality of Gomti River (India)—a case study” [32], with 975 citations, evaluated the water quality of the largest tributary of the River Ganga, India. The authors analyzed an extensive data matrix with 17,790 observations, using four different types of MSA.

3.3. Countries/Territories and Water Sample Types

The worldwide geographic distribution of water quality research using MSA between 2001 and 2020 is shown in Figure 5.
The scientific research studies that used MSA in the analysis of water quality data were conducted in 134 different countries or territories. Of this total, 87 countries had less than 10 studies on the subject. China was the country with the highest number of studies that used MSA for water quality research, with a total of 441 publications, followed by India with 371 publications and the USA with 229 publications.
In a scientometric study carried out in 2017, it was shown that these three countries together were responsible for 38% of global research related to water. Of a total of 224,000 publications, China was responsible for 19% of publications, followed by the USA (14%) and India (5%) [1]. The fact that China, India and the USA lead the number of publications reflects the general trend for these countries to have the largest number of all scientific publications in the world [64]. Table 3 shows the 15 countries with the highest number of publications that used MSA in water quality research.
China’s freshwater bodies account for nearly 7% of the world’s total freshwater bodies, ranking sixth globally in terms of volume and with approximately one-third of lakes and rivers polluted to a level that renders their use inappropriate for human consumption. With approximately 18.5% of the world’s population, China has faced an unprecedented water crisis in terms of quantity and quality [65,66]. Since 2001, great efforts have been made to assess water pollution in the country. Such efforts can be evidenced by the increase in the number of scientific publications related to water in recent years in China, which has the highest number in terms of research impact [1,67]. These studies are mainly focused on optimizing water allocation, on advanced technologies for saving and protecting water resources, on restoring aquatic ecosystems and on exploiting unconventional water sources [68].
India, the country with the second most publications on water quality research and MSA, has approximately 17.7% of the world’s population and approximately 4% of its fresh water. The country’s rapid population and economic growth has put enormous pressure on its water resources [69]. More than 80% of freshwater resources are consumed by agriculture in the country, and the advent of new technologies has led to an increase in agricultural productivity and a consequent increase in the degradation of water bodies. Therefore, there has been an increase in research on water quality and its qualitative estimation in recent years. South Asian countries, mainly India and China, have experienced rapid change in land use and land cover. Accelerated economic development has led to disorderly urbanization in these countries, which has affected the quantity and quality of their water resources [55,56].
The h-index aims to quantify the productivity and impact of scientists based on their most cited articles. The highest h-index described in Table 3 is correlated with the highest production of research and citation in a country or territory. The USA has the highest h-index, corresponding to its high potential to conduct research [54]. China, which was the most productive country, shows a lower h-index than other countries such as Canada and Australia. This can be explained by the higher level of cooperation in research between these countries, while China shows more reserved cooperation tendencies [70].
Table 4 presents the water sample types most commonly found in publications and their analogous or synonymous terms.
The water sample classified as “River” was most evaluated in the studies, with 1231 publications (41%). “Groundwater” ranked second with 806 publications (27%), followed by the “Lake” category with 300 publications (10%). The three categories together accounted for 78% of the total publications (n = 2889). “Rainwater”, “Meltwater” and “Navigation Channel” were the categories with the fewest publications, with 15, 3 and 1 publications, respectively. Figure 6 presents the water resource categories found in the publications.
“River”, “Groundwater” and “Lake” were the most studied water sample types, as they are very useful freshwater sources and are important in maintaining freshwater aquatic life and the hydrological cycle [71]. The most recurrent category, rivers are the main inland water resources and provide a variety of services to humans, being widely used for domestic and irrigation purposes [72]. River water is subject to great stress and, as it is used in various human activities, it can be easily contaminated. Thus, studies of surface water pollution have increased and focused mainly on rivers, where most of the scientific tools developed by regulatory and protection agencies are applied to protect water quality in this segment of surface freshwater [73].
As shown in Figure 7, China, India and the USA are the countries that published the most studies in which researchers evaluated the quality of river water through MSA. These three countries share in common the fact that they have large watercourses, used for various purposes, such as the Mississippi River in the USA, and which have been facing serious pollution problems, such as the Yellow River in China and the Ganges River in India [74,75]. In addition, these countries rank 3rd (China), 4th (USA) and 7th (India) in terms of the size of their territories and together have approximately 40% of the planet’s water-resource-dependent population [76,77].
Groundwater, the category with the second-highest number of studies, is an important water resource for irrigated agriculture and especially for domestic drinking water supply in several countries. It is a vulnerable resource that actively composes the hydrological cycle [78]. Groundwater research has increased in recent years, mainly due to the drastic decrease in aquifer water levels and general deterioration in water quality [25]. India, Iran and Pakistan are the countries where the number of publications that evaluated groundwater was higher than the publications that evaluated river water quality (Figure 7).
India is the largest consumer of groundwater in the world, with an annual extraction of 243 km3. Approximately 85% of rural areas use groundwater for supply, 62% for irrigation and more than 50% of the country’s urban consumption comes from aquifers. Currently, the number of wells used for irrigation in the country is estimated at more than 25 million [79].
Iran is also among the largest consumers of groundwater in the world and with the majority of the population living in areas heavily dependent on groundwater for irrigation and supply. Groundwater provides approximately 60% of the total water supply, and agriculture accounts for over 90% of groundwater withdrawals. Since the 1960s, the number of irrigation wells and the amount of water pumped has increased, leading to a decrease in the groundwater level in many aquifers across the country [80,81], in addition, agricultural, agro-industrial and domestic human activities have contributed to the pollution of groundwater resources in some regions in the country [82,83].
Pakistan is the third largest user of groundwater for irrigation in the world, where 73% of all irrigation comes directly or indirectly from groundwater resources. Total groundwater extraction is estimated to be approximately 60 billion m3, with 1.2 million private tube wells operating in the country [84].
The third most commonly found category in this review, lakes, represents approximately 49.8% of the Earth’s total surface freshwater. Lakes are important ecosystems that share many ecological and biogeochemical processes, with multiple uses ranging from supply, through irrigation, fishing and recreation. Population growth and urbanization have increased lake contamination problems. Furthermore, lakes are confined bodies of water with no strong self-cleaning flow and are therefore more prone to pollutant accumulation [85,86].
China, the USA and Canada were the countries that most published studies related to the analysis of lake water quality through MSA (Figure 7). In China, lakes play a less important role compared with other bodies of water. However, they provide a wide range of services to Chinese ecological and social systems. Most of the country’s freshwater lakes are used for multiple uses, including drinking water, industrial and agricultural production, as well as aquaculture. Chinese lakes have undergone intense changes in the last three decades, mainly due to climate change, human activities and population density [87,88].
The United States has approximately 250 freshwater lakes that together add up to a surface area of approximately 35,000 km2 [89]. Although many of these lakes are in good condition, a considerable proportion are in altered condition for nutrients, with 40% of the lakes containing excessive concentrations of total phosphorus and 35% having excessive concentrations of nitrogen [90,91]. In Canada, this resource is of great importance to the country. Canada has more than two million lakes, 900,000 of them measuring up to 0.1 km2 and 560 measuring more than 100 km2, together representing 37% of the total lake area in the world. The United States and Canada share the Great Lakes, which together contain 18% of the world’s fresh water [92,93].

3.4. Keywords Co-Occurrence

Keyword co-occurrence analysis is used to identify the main themes in a field of research or a domain of knowledge. It is based on the assumption that when two items appear in the same context, they are related to some degree [94,95].
In this scientometric review, a total of 5550 keywords were listed by the authors. With the application of the criterion of minimum occurrence—where a term must appear in at least 20 publications—and filtering of synonymous words and similar terms, 67 keywords were selected, divided into 4 groups with 1107 links.
As shown in Figure 8, the size of each circle is proportional to the occurrence of the keyword. Red group 1 (n = 27) grouped terms with high occurrence in publications, such as “water quality” (714), “analysis” (354), “river” (330) and “multivariate statistical analysis” (299), with terms related to water quality monitoring, biomonitoring and assessment, such as: “monitoring”, “pollution”, “biomonitoring”, “bioassessment”, “bioindicator”, “eutrophication”, “phosphorus”, “nutrient”, “phytoplankton”, “chlorophyll”, “fish” and “diatom”.
The keywords “water quality” and “multivariate statistical analysis” were two of the most commonly found terms in the publications, as they were included as a search term, in the topic field (title, keywords and abstract) of the WoS database. The high occurrence of the keyword “river” can be explained by the fact that it was the most common water sample type to be analyzed in the publications (Figure 6).
In green group 2 (n = 26), the most frequent keywords “groundwater” (370) and “statistical analysis” (267) were grouped with terms frequently used in the analysis of groundwater quality such as “heavy metal”, “water quality index” (WQI), “hydrogeochemistry”, “hydrochemistry”, “geochemistry”, “drinking water”, “risk assessment”, “health risk”, “salinity”, “fluoride”, and “arsenic”, among others. The keyword “groundwater”, with the highest occurrence in group 2, was the second most analyzed water sample type in the publications. Its connection with terms such as “heavy metals”, “WQI”, “drinking water”, “fluoride”, and “arsenic”, demonstrates a tendency of these publications toward the evaluation of groundwater for human supply purposes.
Blue group 3 (n = 7) grouped the terms with high frequency related to MSA, such as “principal component analysis” (450), “cluster analysis” (327), “factor analysis” (233) and “discriminant analysis” (87) with terms such as “correlation analysis”, “physicochemical parameters” and “water pollution”. The high frequency of these keywords suggests that these MSAs are those used most frequently in water quality research. The connection between these terms further suggests that these MSAs are being used together in the studies. The purple cluster 4 (n = 6) gathered the keywords with less occurrence such as “anthropogenic activity” (25), “water quality assessment” (3), “seasonal variation” (36), “source apportionment” (38), “spatial variation” (41) and “temporal variation” (43). The keywords with the highest occurrence among the four groups (water quality, groundwater and principal component analysis) had a total of 62, 53 and 61 links with other terms, respectively.

3.5. Multivariate Statistical Analysis (MSA) for Water Quality Assessment

MSA aims to analyze multiple variables in a single relationship or set of relationships [17]. It has been considered one of the most effective and widely used tools in assessing the water quality of a given water body [13,37]. Of the 2889 publications analyzed, 43.7% (1262) used only one MSA as a tool for assessing water quality. Another 45.0% (1300) used two analyses, 9.4% (272) applied three methods, and 1.9% of the publications (55) applied four or more MSA. Table 5 summarizes the main MSA that were applied in water quality research studies between 2001 and 2020.
As shown in Table 5, principal component analysis (PCA) was the most used MSA in the studies (1405 publications), followed by hierarchical cluster analysis (HCA) used in 1275 studies, factor analysis (FA) used in 248 publications and discriminant analysis (DA) used in 246 publications. The frequency of these MSA is directly linked to the clustering and high occurrence of these keywords in publications, as shown in Figure 8. A brief summary of the main MSA applied and their relationship to water quality research studies is shown below.
Factor analysis refers to a class of MSA whose main purpose is to define the underlying structure in a data matrix. It analyzes the structure of correlations between a large dataset by defining a set of common latent dimensions called factors. There are basically two types of factor analysis, exploratory, the most frequently used analysis that aims to identify the nature of factors that influence a set of responses, and confirmatory, which tests whether a specified set of factors is influencing responses in a predicted way [17,96].
PCA is an exploratory statistical method for the graphical description of information present in large datasets. It is one of the best known and most used MSA in several scientific disciplines [97,98]. The central idea of the analysis is to reduce the dimensionality of a dataset where there are a large number of interrelated variables, keeping as much of the variation present in the dataset as possible [99]. The analysis is designed to transform the original variables into new uncorrelated variables (axes), called principal components (PC), which are linear combinations of the original variables.
The PC provides information on the most significant variables, which represent a matrix with data reduction and minimal loss of original information [100]. The first PC gives the largest eigenvalue and maximum total variance in the dataset. The second PC (orthogonal) is not correlated with the first, has a lower eigenvalue and is responsible for the maximum residual variance [101].
The use of EFA after PCA aims to reduce the contribution of less significant variables and further simplify the data structure taken from PCA [37]. PCA-generated PCs are sometimes not readily interpreted. This purpose can be achieved by rotating the axis defined in the PCA, according to well-established rules, and building new variables (varifactors). As a result, large loads become larger and small loads become smaller, thus generating a small number of factors accounting for approximately the same amount of information as the larger set of original observations [102,103]. In summary, the EFA should be used in order to make observations about the factors that are responsible for a set of observed responses. PCA can be used simply for data reduction [104].
In water quality research, EFA and PCA are tools used primarily to find parameters that describe the processes that govern water chemistry and extract important information using only the most significant variables [105]. Principal component or factor loads are commonly used to explain the relative contribution of variables to overall water quality.
PCA, in particular, has been widely used as a tool in the analysis of river water quality [32,37,106,107], groundwater [38,43,45,108], lakes [109,110,111,112], reservoirs [113,114,115,116] and drinking water [117,118,119,120]. As shown in Table 2, of the 15 most cited publications, 7 used PCA as a statistical method of multivariate analysis. Four of them used PCA together with EFA and two publications used EFA only.
Cluster analysis is the formal study of methods and algorithms in order to group objects according to measured or perceived intrinsic characteristics, or similarity [121]. In general, the objective of cluster analysis is to identify groups, or clusters, of similar objects, where elements in a cluster are more similar to each other than elements in different clusters [122].
In cluster analysis, a large number of methods are available by which to classify objects based on their similarities. The main types of cluster analysis are the hierarchical methods, partitioning methods, and methods that allow overlapping clusters. Within each type of method, there is a variety of specific techniques and algorithms [123].
In water quality research, HCA has often been used with the main objective of grouping similar sampling sites (spatial variability) [32,37,124]. The analysis can also extract useful information from complex datasets and provide a reasonable and efficient approach to studying the chemical characteristics of water [125]. Of the 15 publications most cited in this review, 9 used HCA as a multivariate statistical tool to assess water quality (Table 2).
Discriminant analysis is an MSA that analyzes whether the classification of data is adequate in relation to the survey data. It is used in situations where the groups are known, classifying an observation, or several observations, in these known groups [126,127]. It aims to predict and explain a categorical variable representing different groups using various range variables as predictors [128].
In studies that analyzes water quality, DA is used to differentiate a given classification variable using numerous characteristics. This variable classification can refer to land use types or sources of pollution, flow events and seasonal factors. In most cases, the DA approach is limited to the accuracy of the spatial classification, which is based on selected influential variables [129,130].
Among the most cited works (Table 2), the two first publications applied DA to each data matrix to assess spatial and temporal variation in water quality in rivers in the basin. Location (spatial) and season (temporal) were the grouping variables (dependent), while all analysis parameters constituted the independent variables. Discriminant analysis gave the best results for spatial and temporal analysis. This allowed a reduction in the dimensionality of the large dataset, outlining some indicator parameters responsible for large variations in water quality [32,37].

3.6. MSA Limitations

Multivariate statistical analysis has been used to reduce variables, grouping and classification in water quality studies and, despite its extensive application, it has some limitations. This is because these methods have the merit of computational simplicity and provide a geometrically intuitive interpretation. In addition, water quality assessment and monitoring programs can last for decades, increasing the likelihood of changes in a sampling method, frequency, location, and analytical accuracy, which in turn can limit the use of statistical analysis [11,131].
In the case of PCA and EFA, the two methods often provide descriptive rather than inferential information and are commonly used in exploratory data analysis in conjunction with other techniques. In the case of EFA, the level of subjectivity arising from the many methodological decisions a researcher must make to complete a single analysis accurately depends largely on the quality of those decisions. Some problems, such as low correlations, outliers and missing data, poorly distributed data, small sample numbers and lack of linearity, are factors responsible for limiting the use of the methods [18,132,133].
In HCA, the various clustering methods often give very different results. This is due to the criteria for merging clusters (including cases). As clustering algorithms involve many parameters, generally operate in high dimension and spaces, and have to deal with noisy, incomplete and sampled data, their performance can vary substantially for different applications and data types. In practice, it becomes a difficult effort, given a dataset or problem, to choose a suitable cluster [134]. In DA, which is typically used to predict membership in naturally occurring groups rather than groups formed by random assignment, questions such as why we can reliably predict group membership or what causes differential membership are often not asked [18].

4. Conclusions

Water quality analysis is an essential tool for the integrated management of water resources. Due to the multidimensional properties involved in water quality assessment, many researchers have been encouraged to use statistical techniques as a way of interpreting the generated data. Among these tools, the MSA has stood out. Therefore, this review proposed a mapping of the scientific literature published on the topic in a 20 year citation window. A total of 2889 publications, available between 2001 and 2020, in the main Web of Science database were considered for review. The following main observations were recorded:
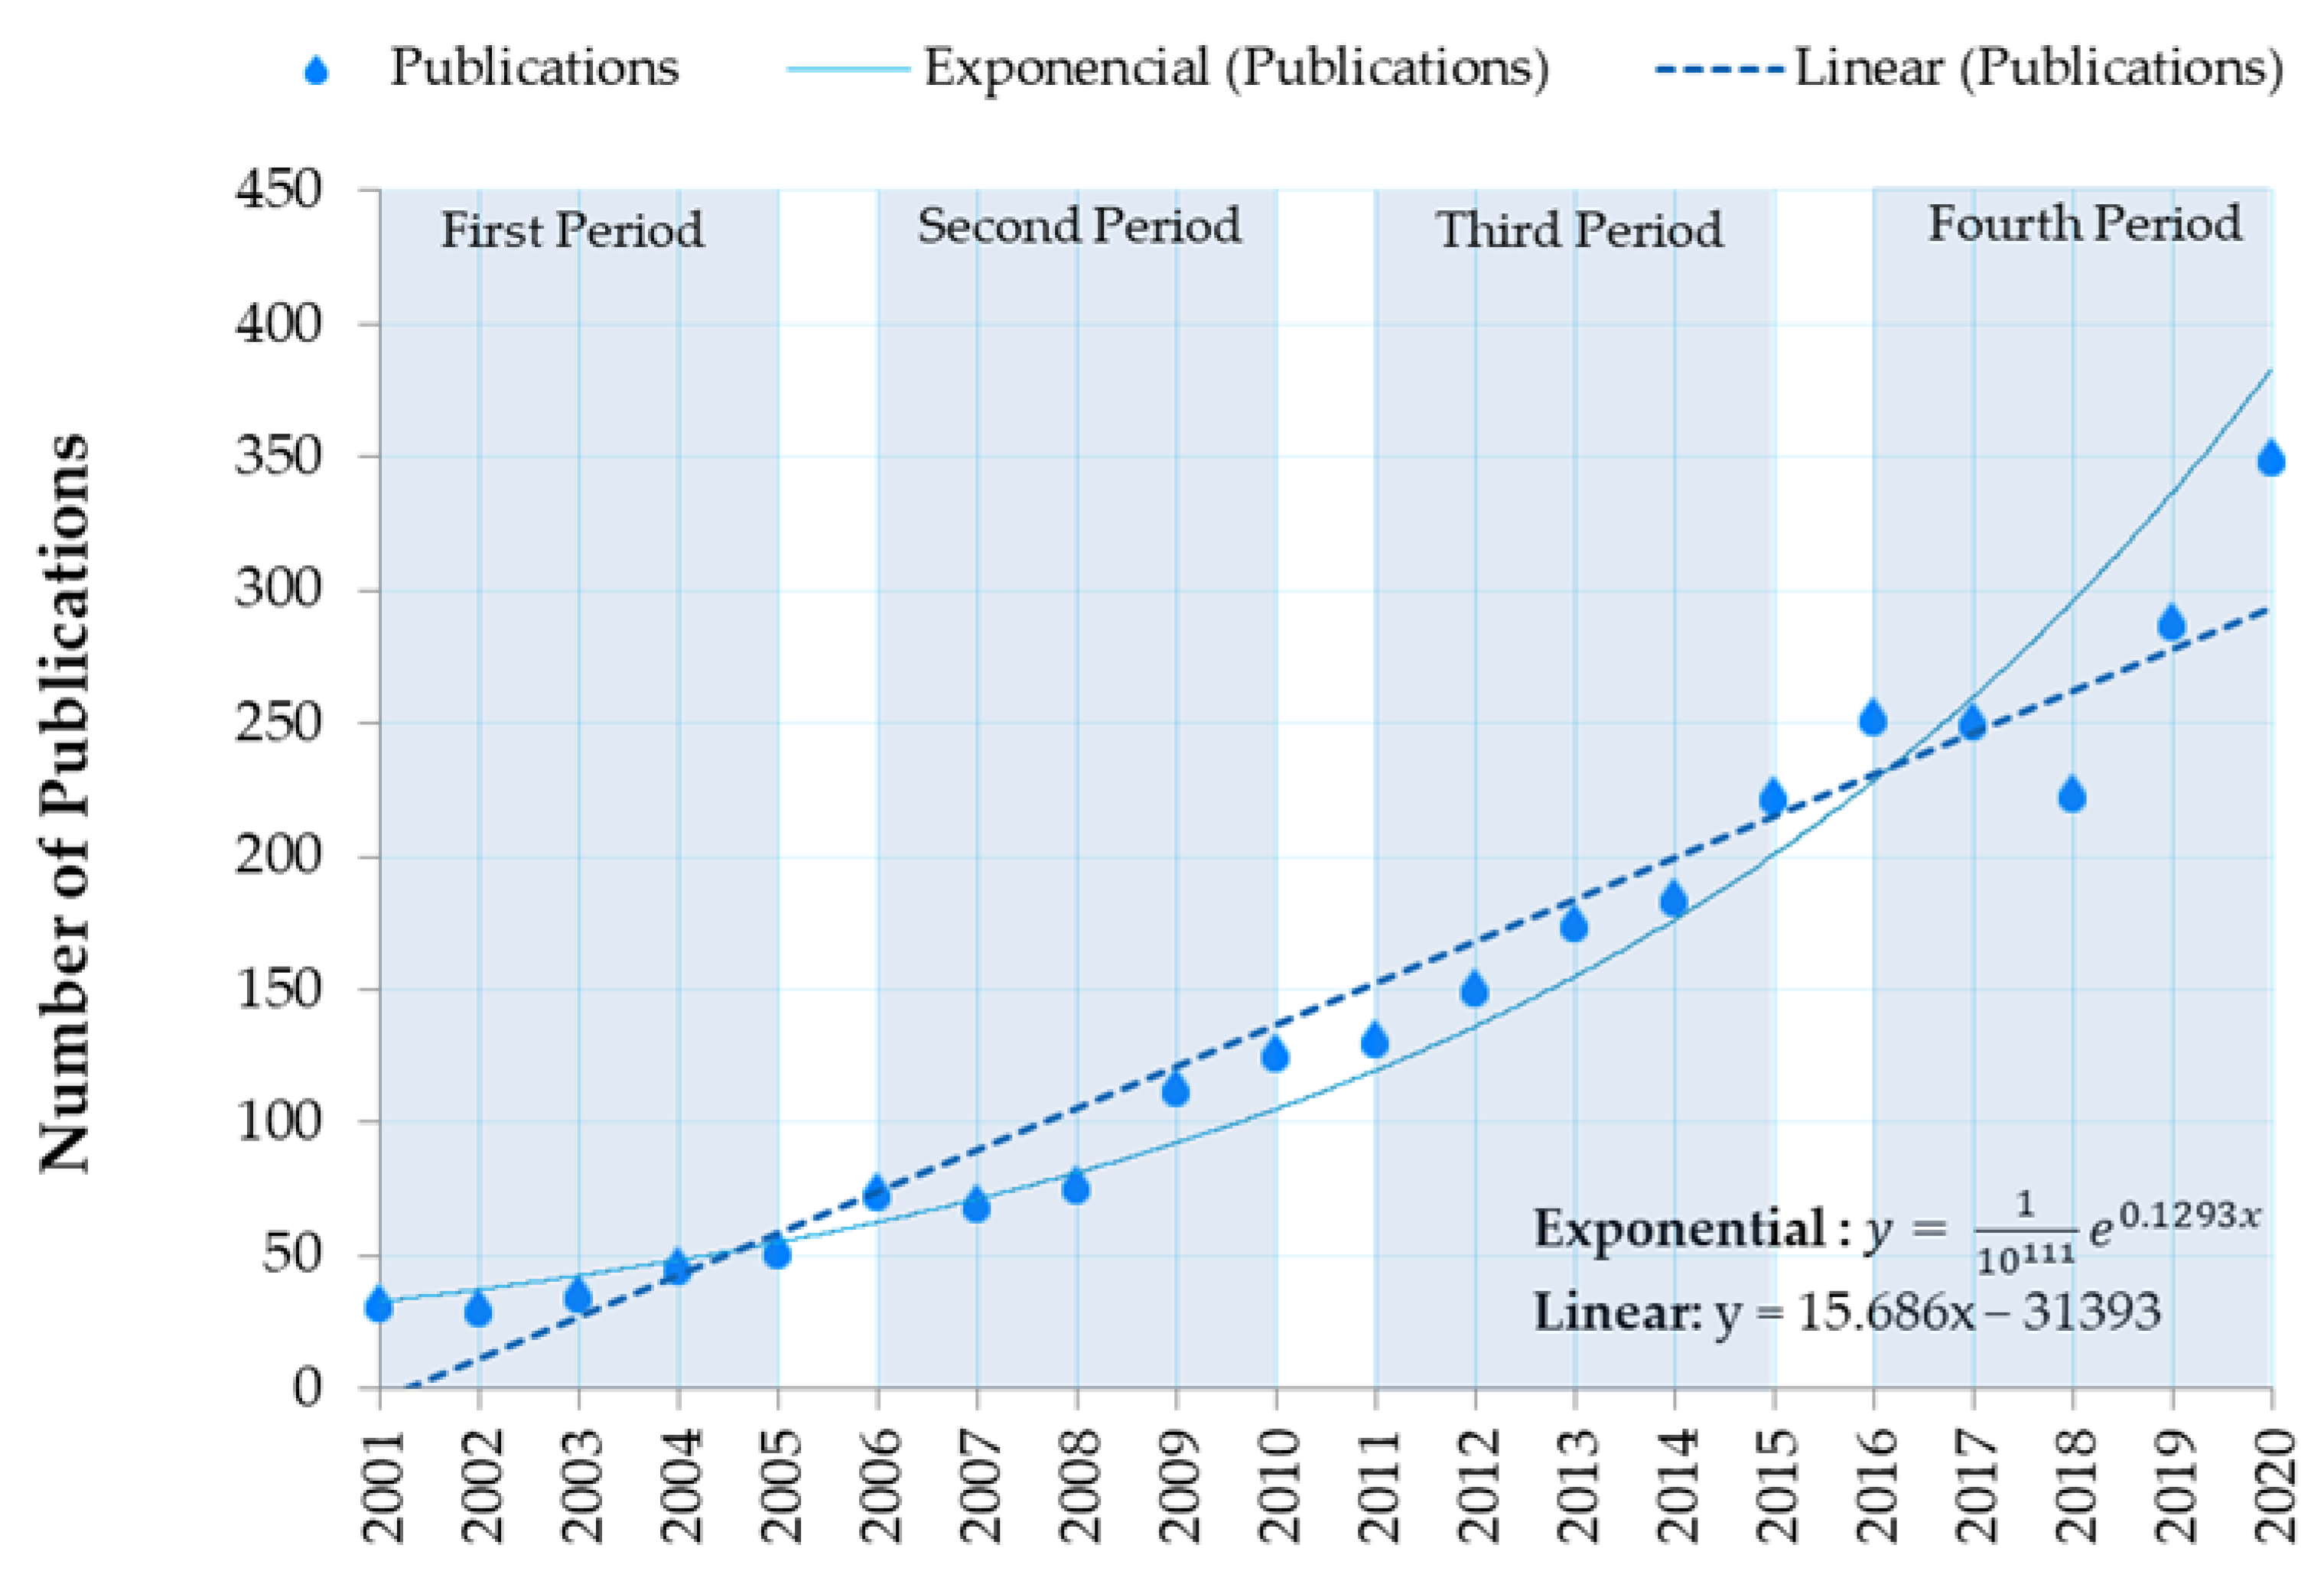
  • The number of publications has increased considerably in the last 20 years, confirming a growing application of MSA in water quality studies. In the last of four analyzed periods (2016–2020), more than half of the studies were published.
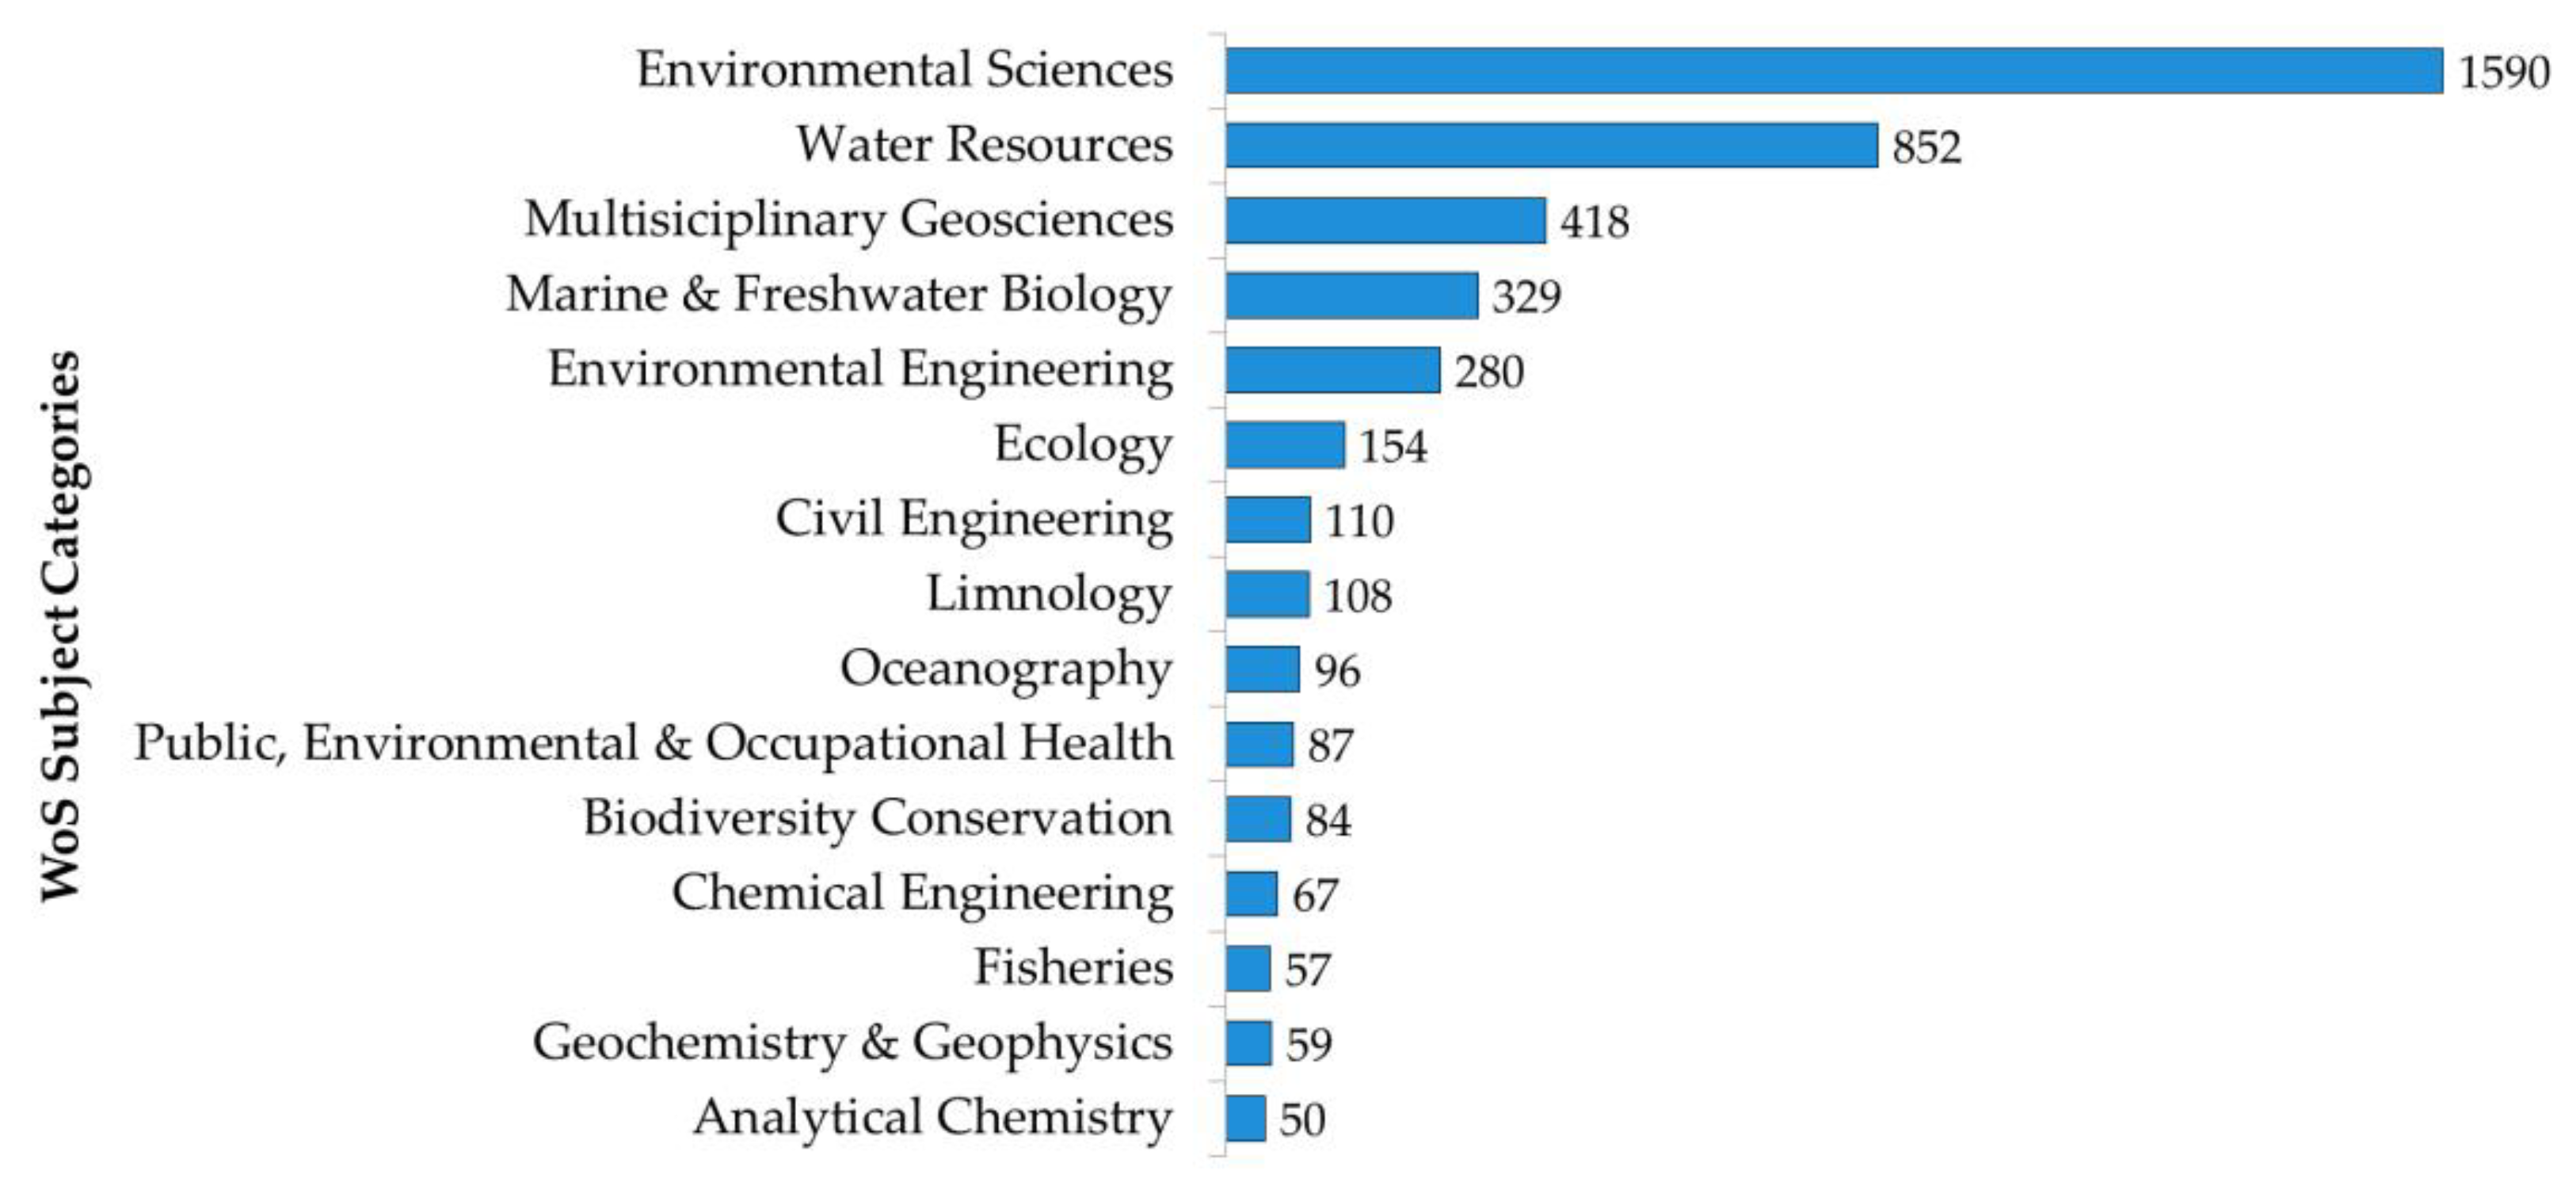
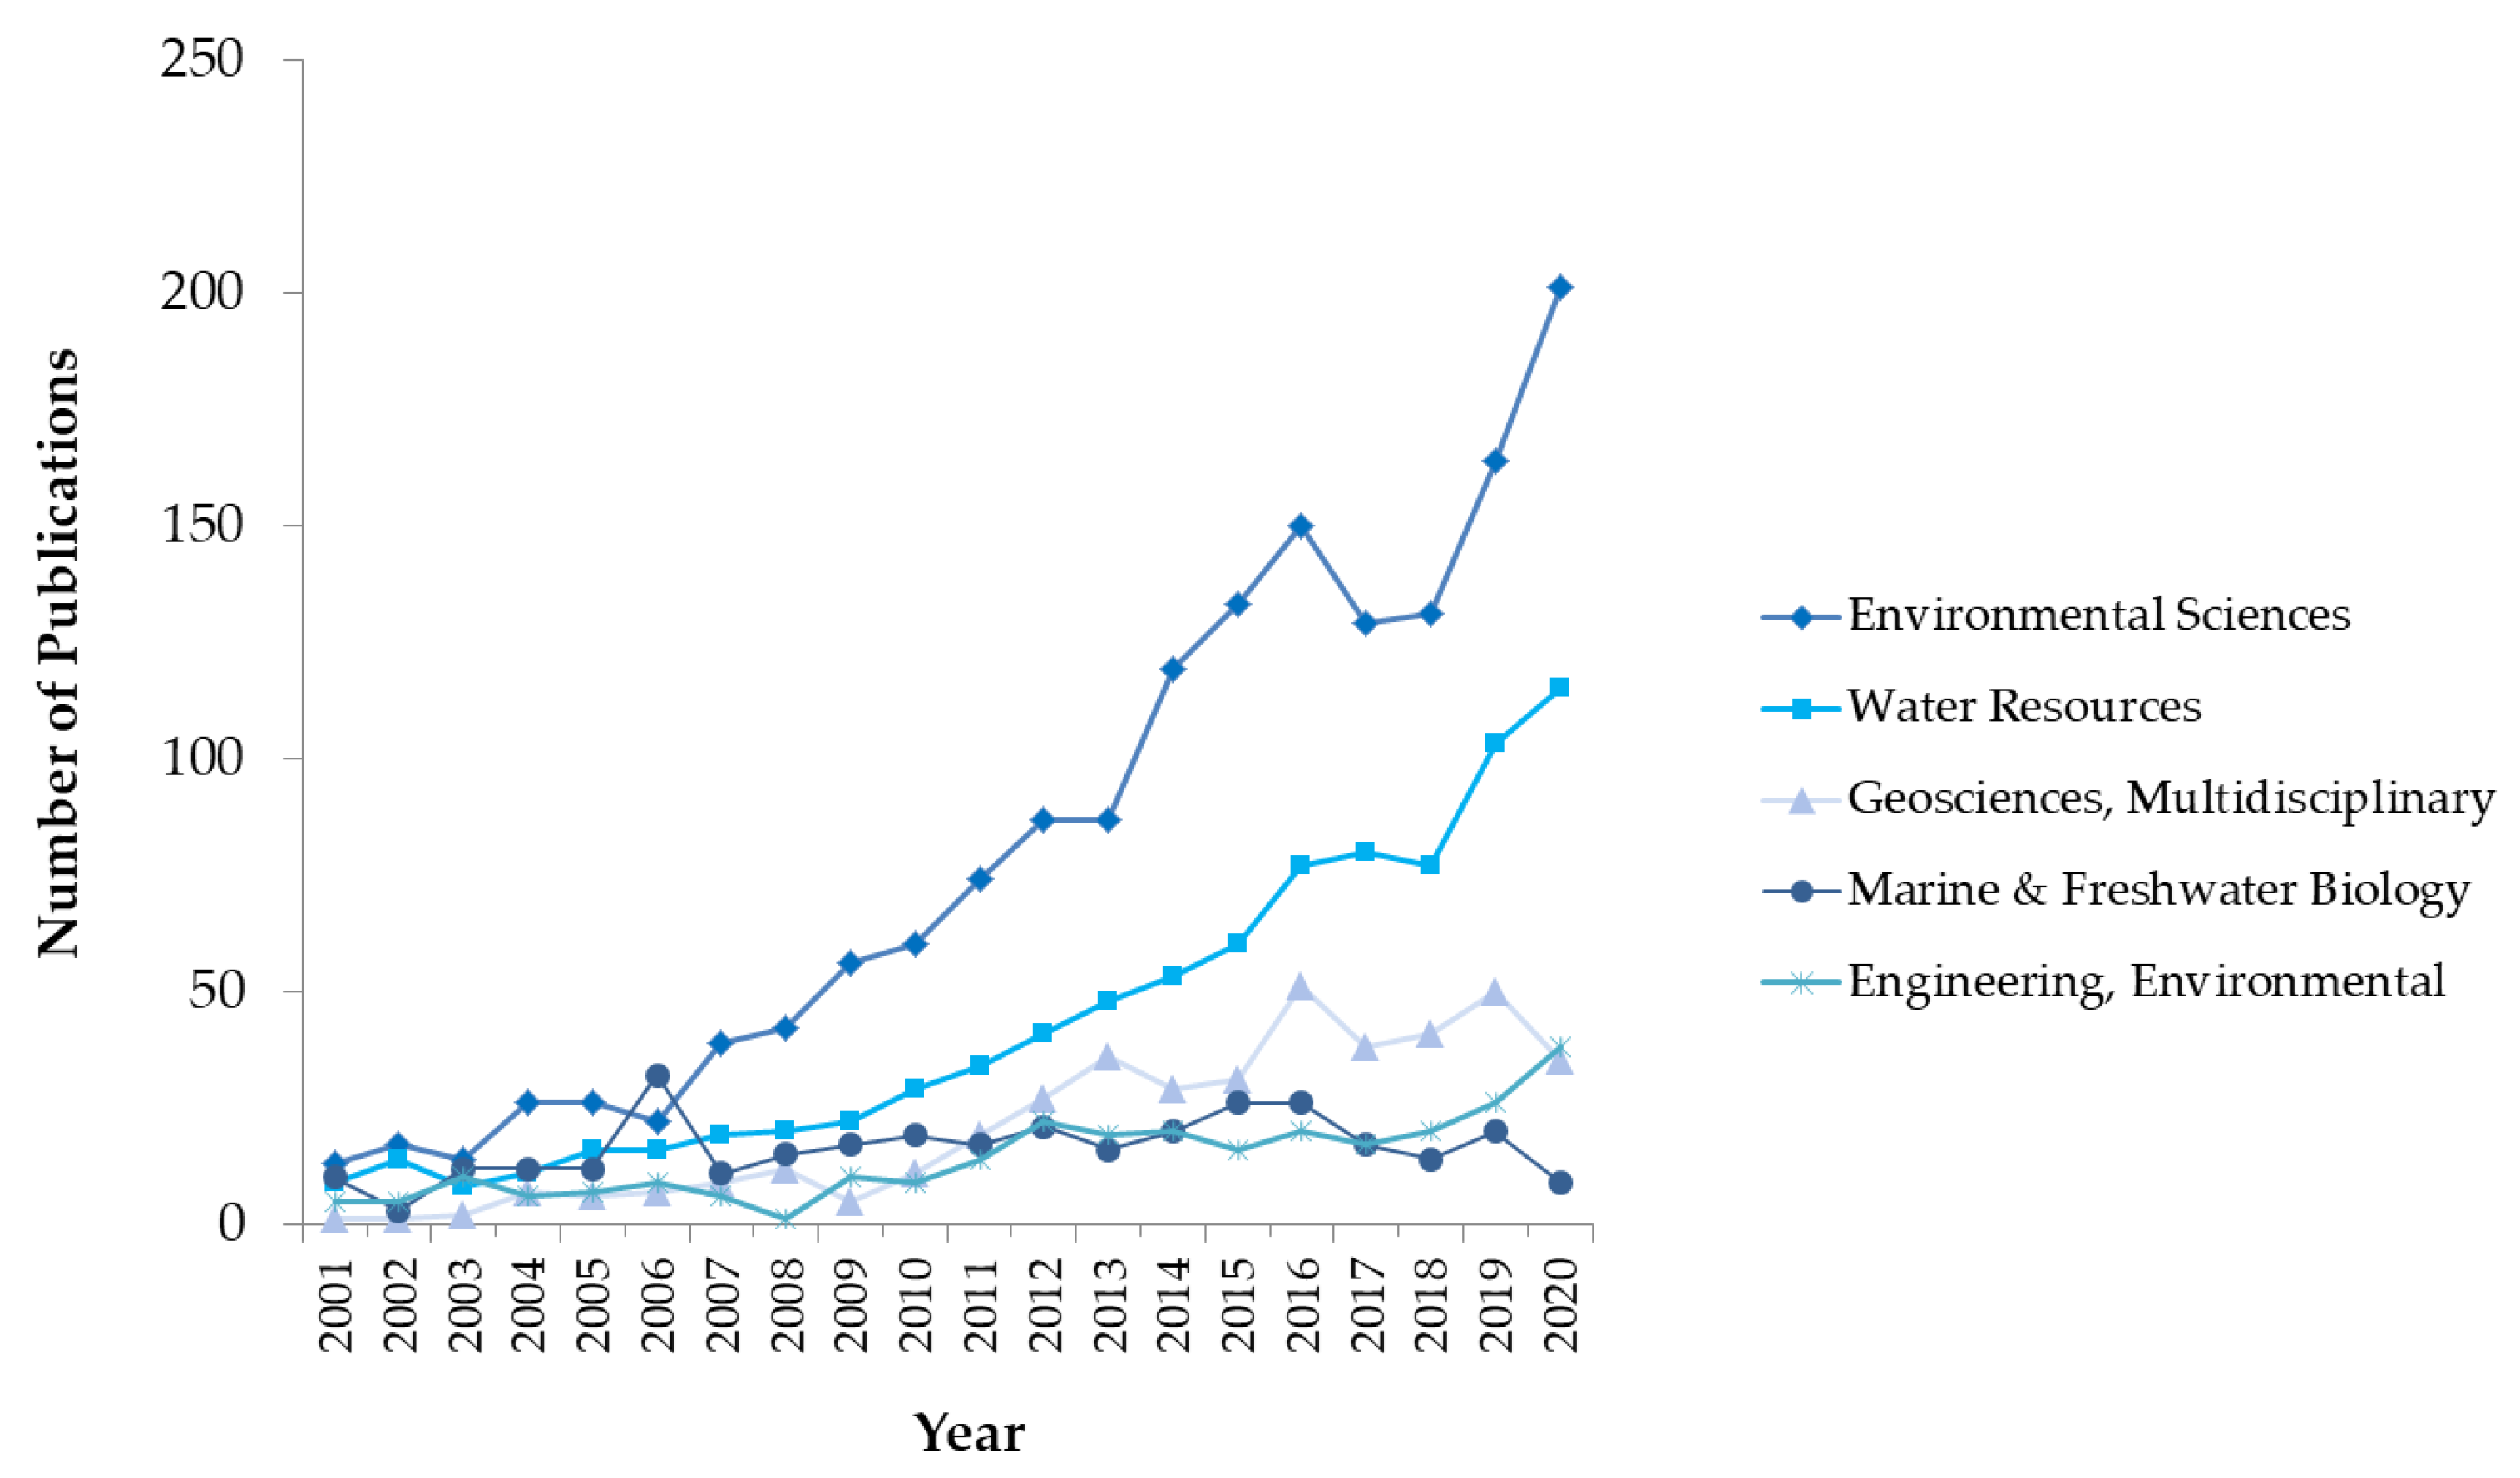
  • The three WoS subject categories in which the studies most fit were “Environmental Sciences”, “Water Resources” and “Multidisciplinary Geosciences”. The “Environmental Sciences” subject category covers several areas of the environment, and therefore included in 1590 of 2889 analyzed publications.
  • A total of 604 journals published studies related to water quality research and the use of MSA in the analyzed period. The five most influential journals, in descending order of JIF, that published papers on the topic were: Water Research, Science of the Total Environment, Marine Pollution Bulletin, Ecological Indicators and Environmental Science and Pollution Research.
  • All 15 most cited publications are open access and 9 of them were published in Water Research. The two most cited publications used four types of MSA to analyze large datasets.
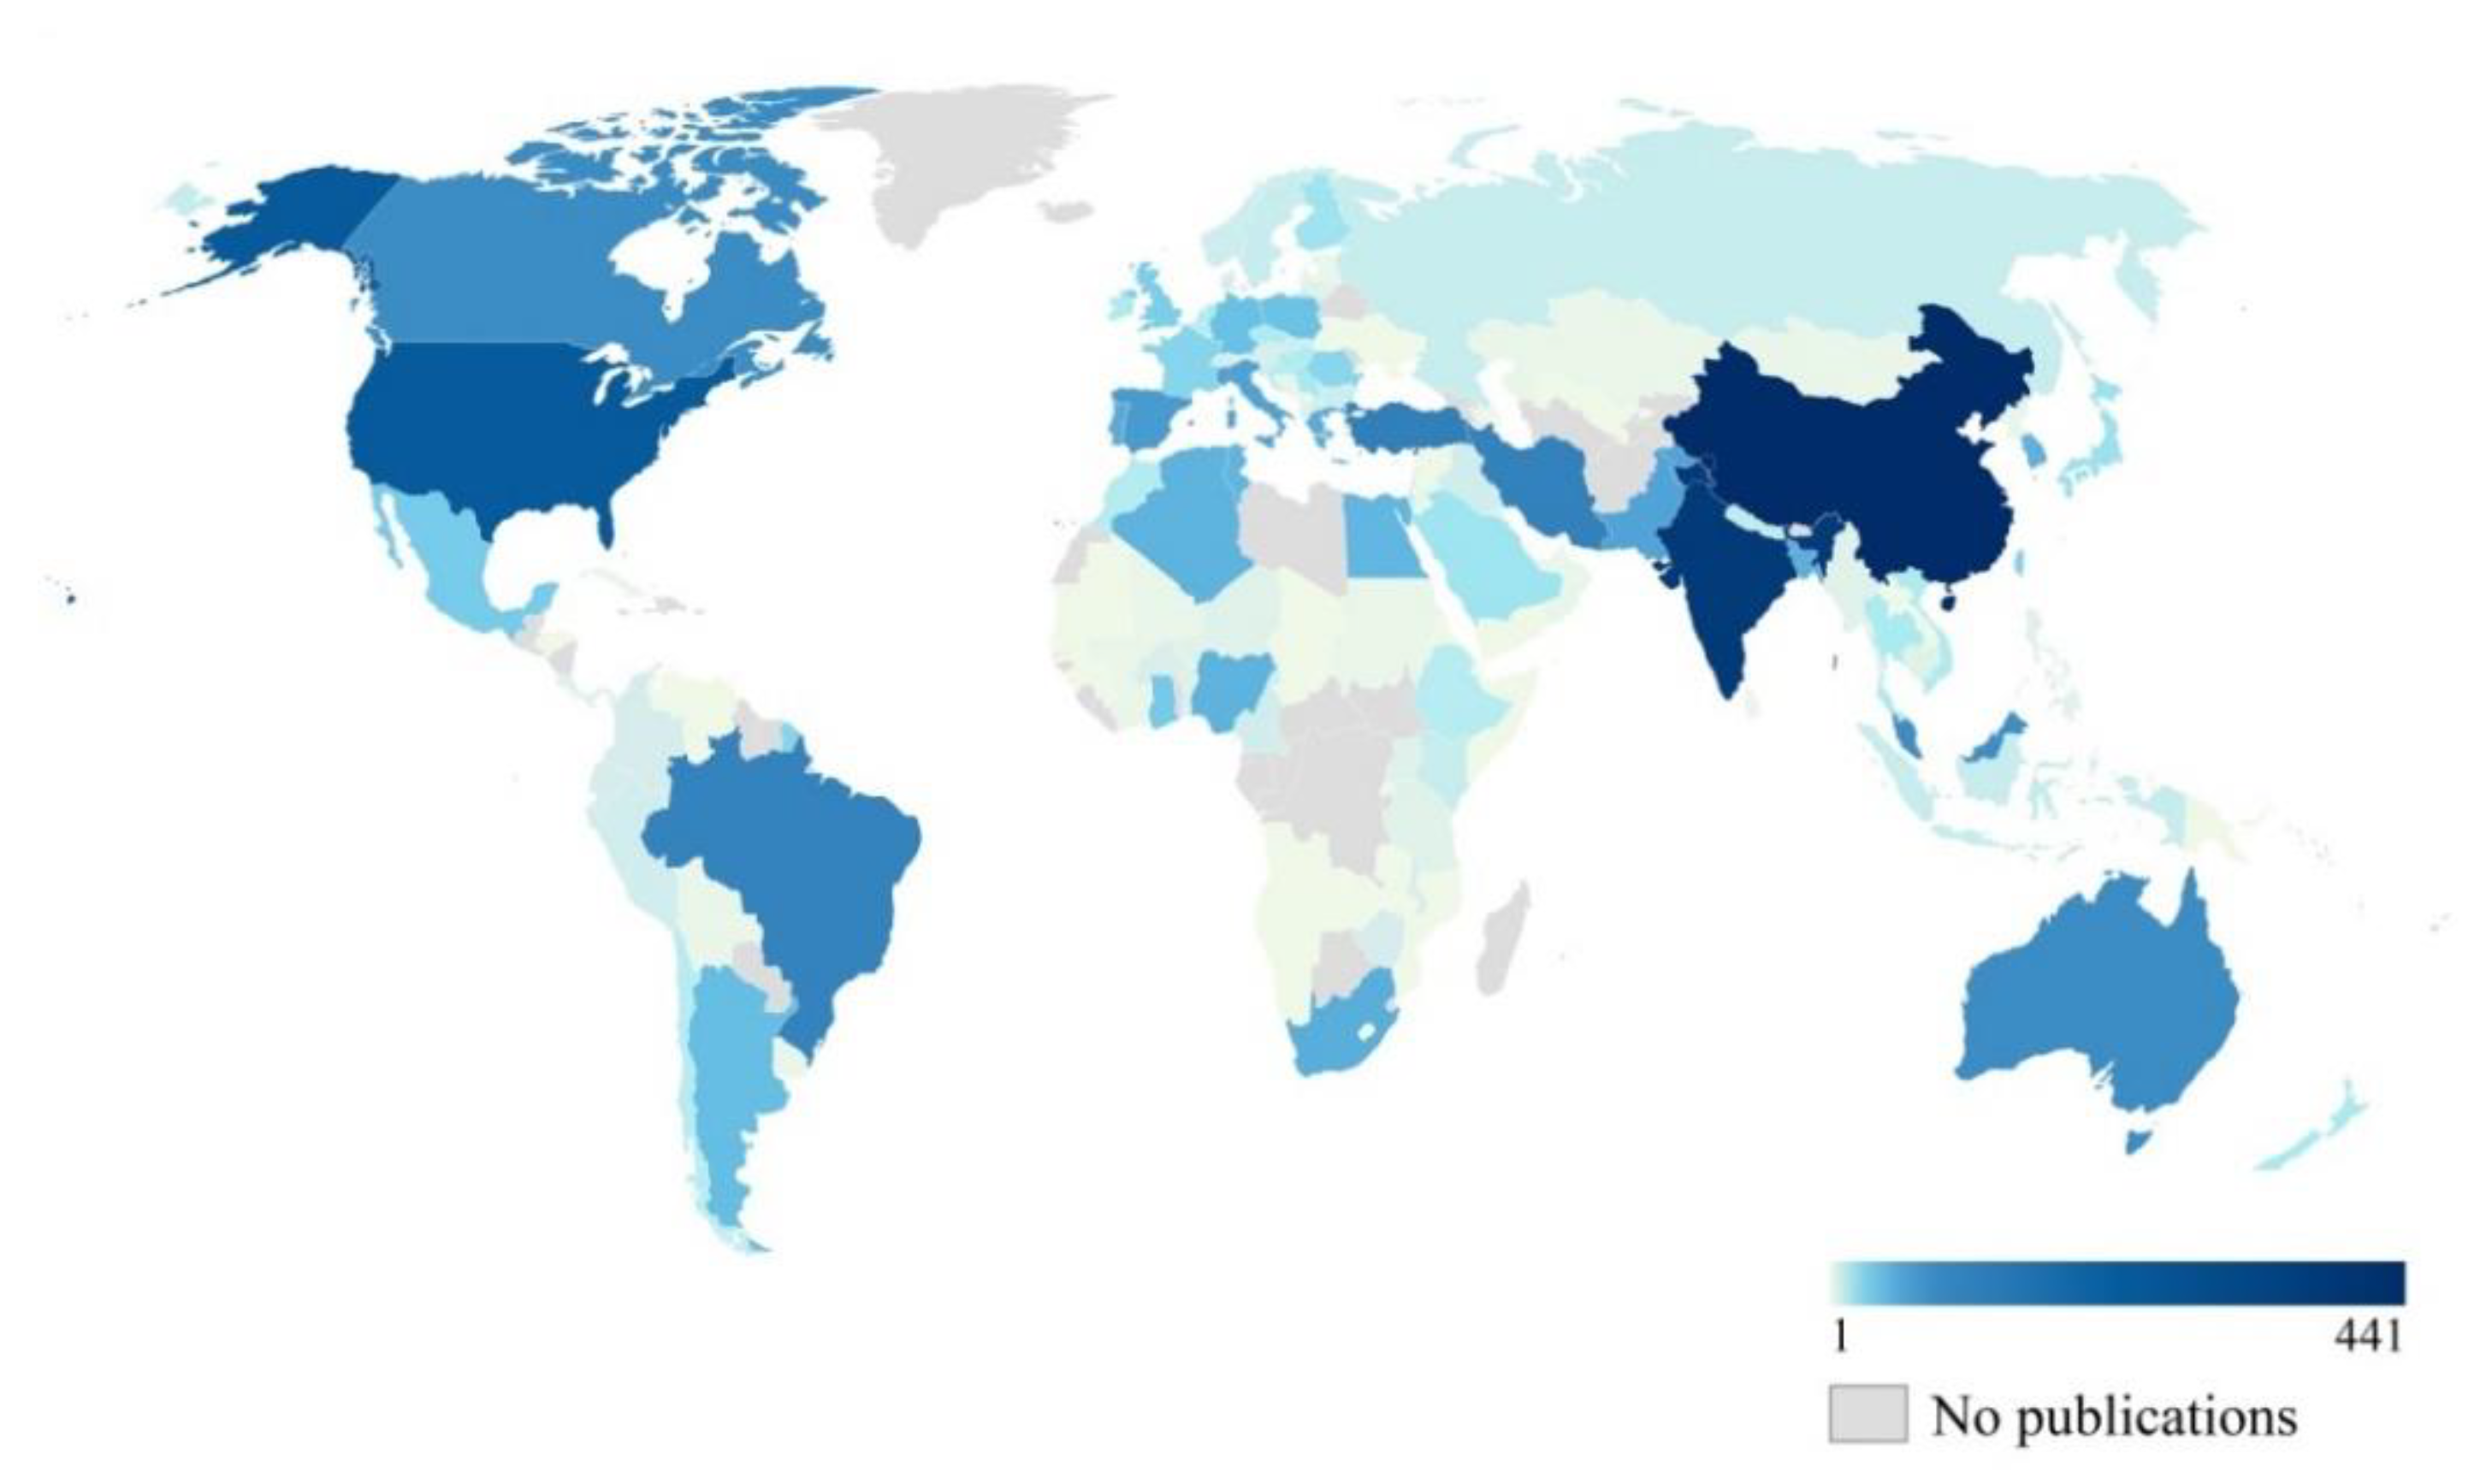
  • The studies were carried out on water samples from 134 different countries or territories, and the most active countries in the research domain were discussed in the review. The review showed that developing countries have carried out more studies using MSA in water quality research.
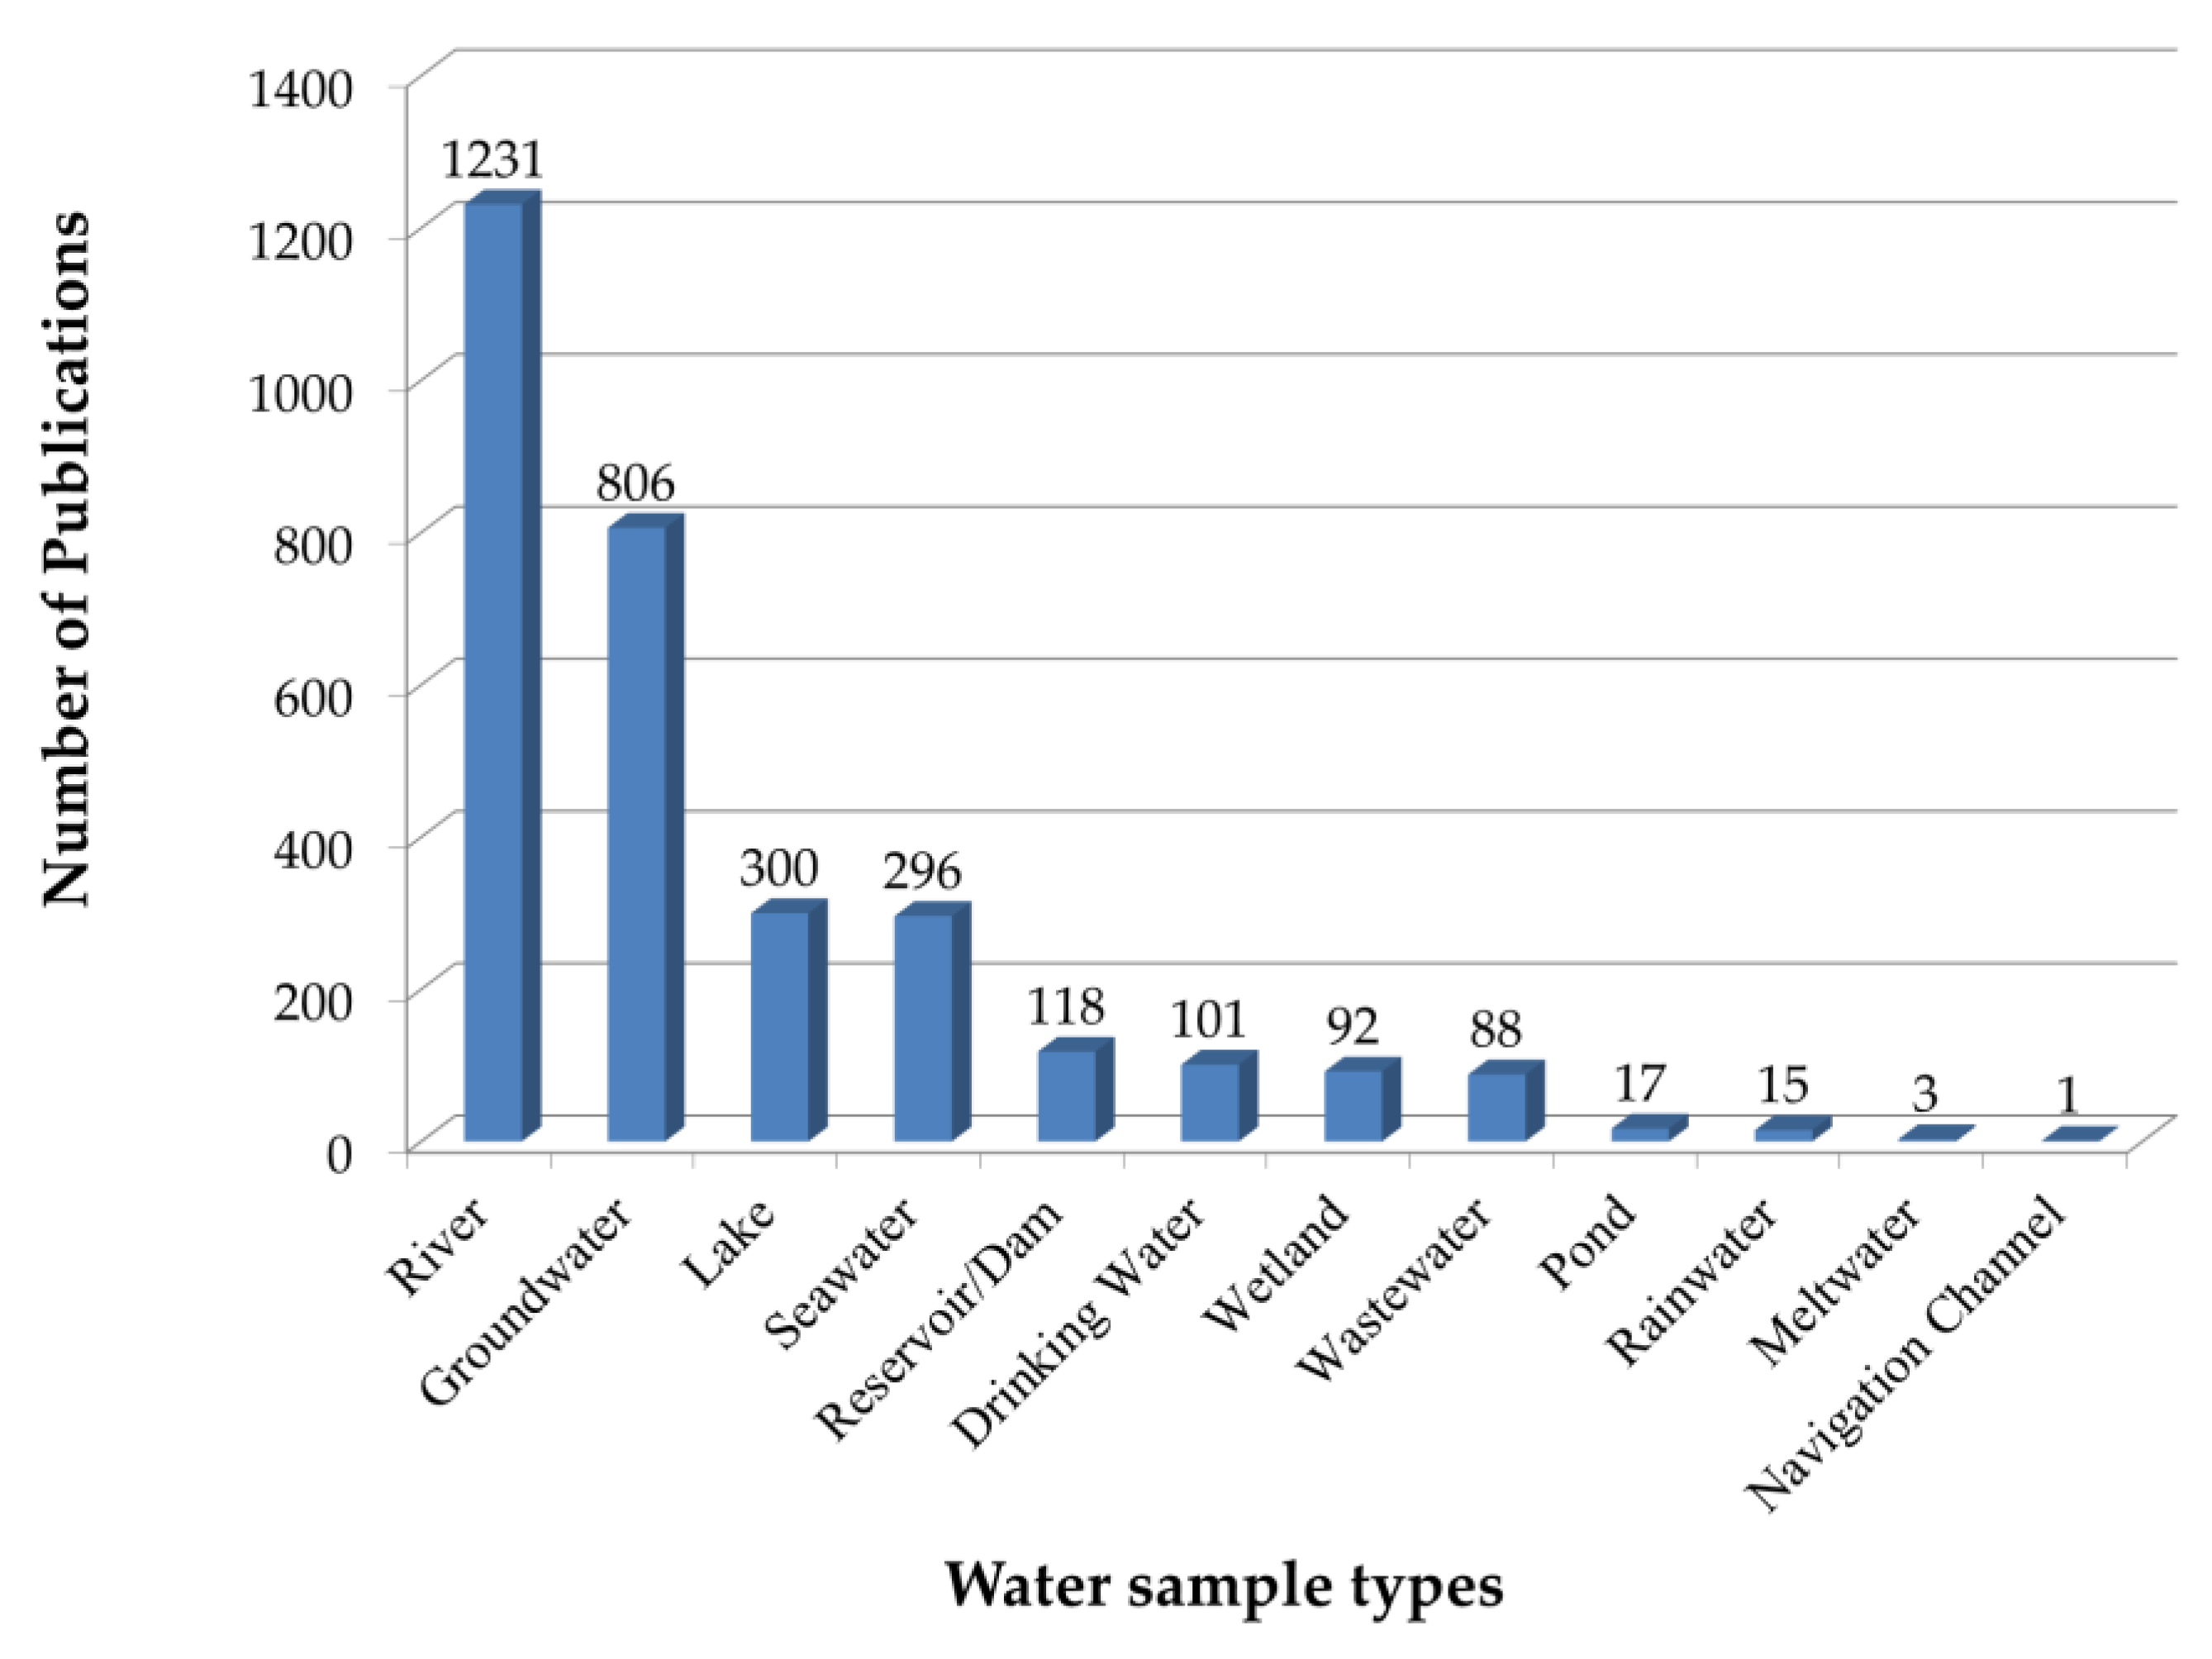
  • River, groundwater and lake were the water sample types most evaluated in the studies. Only one study analyzed the water quality in a navigation channel.
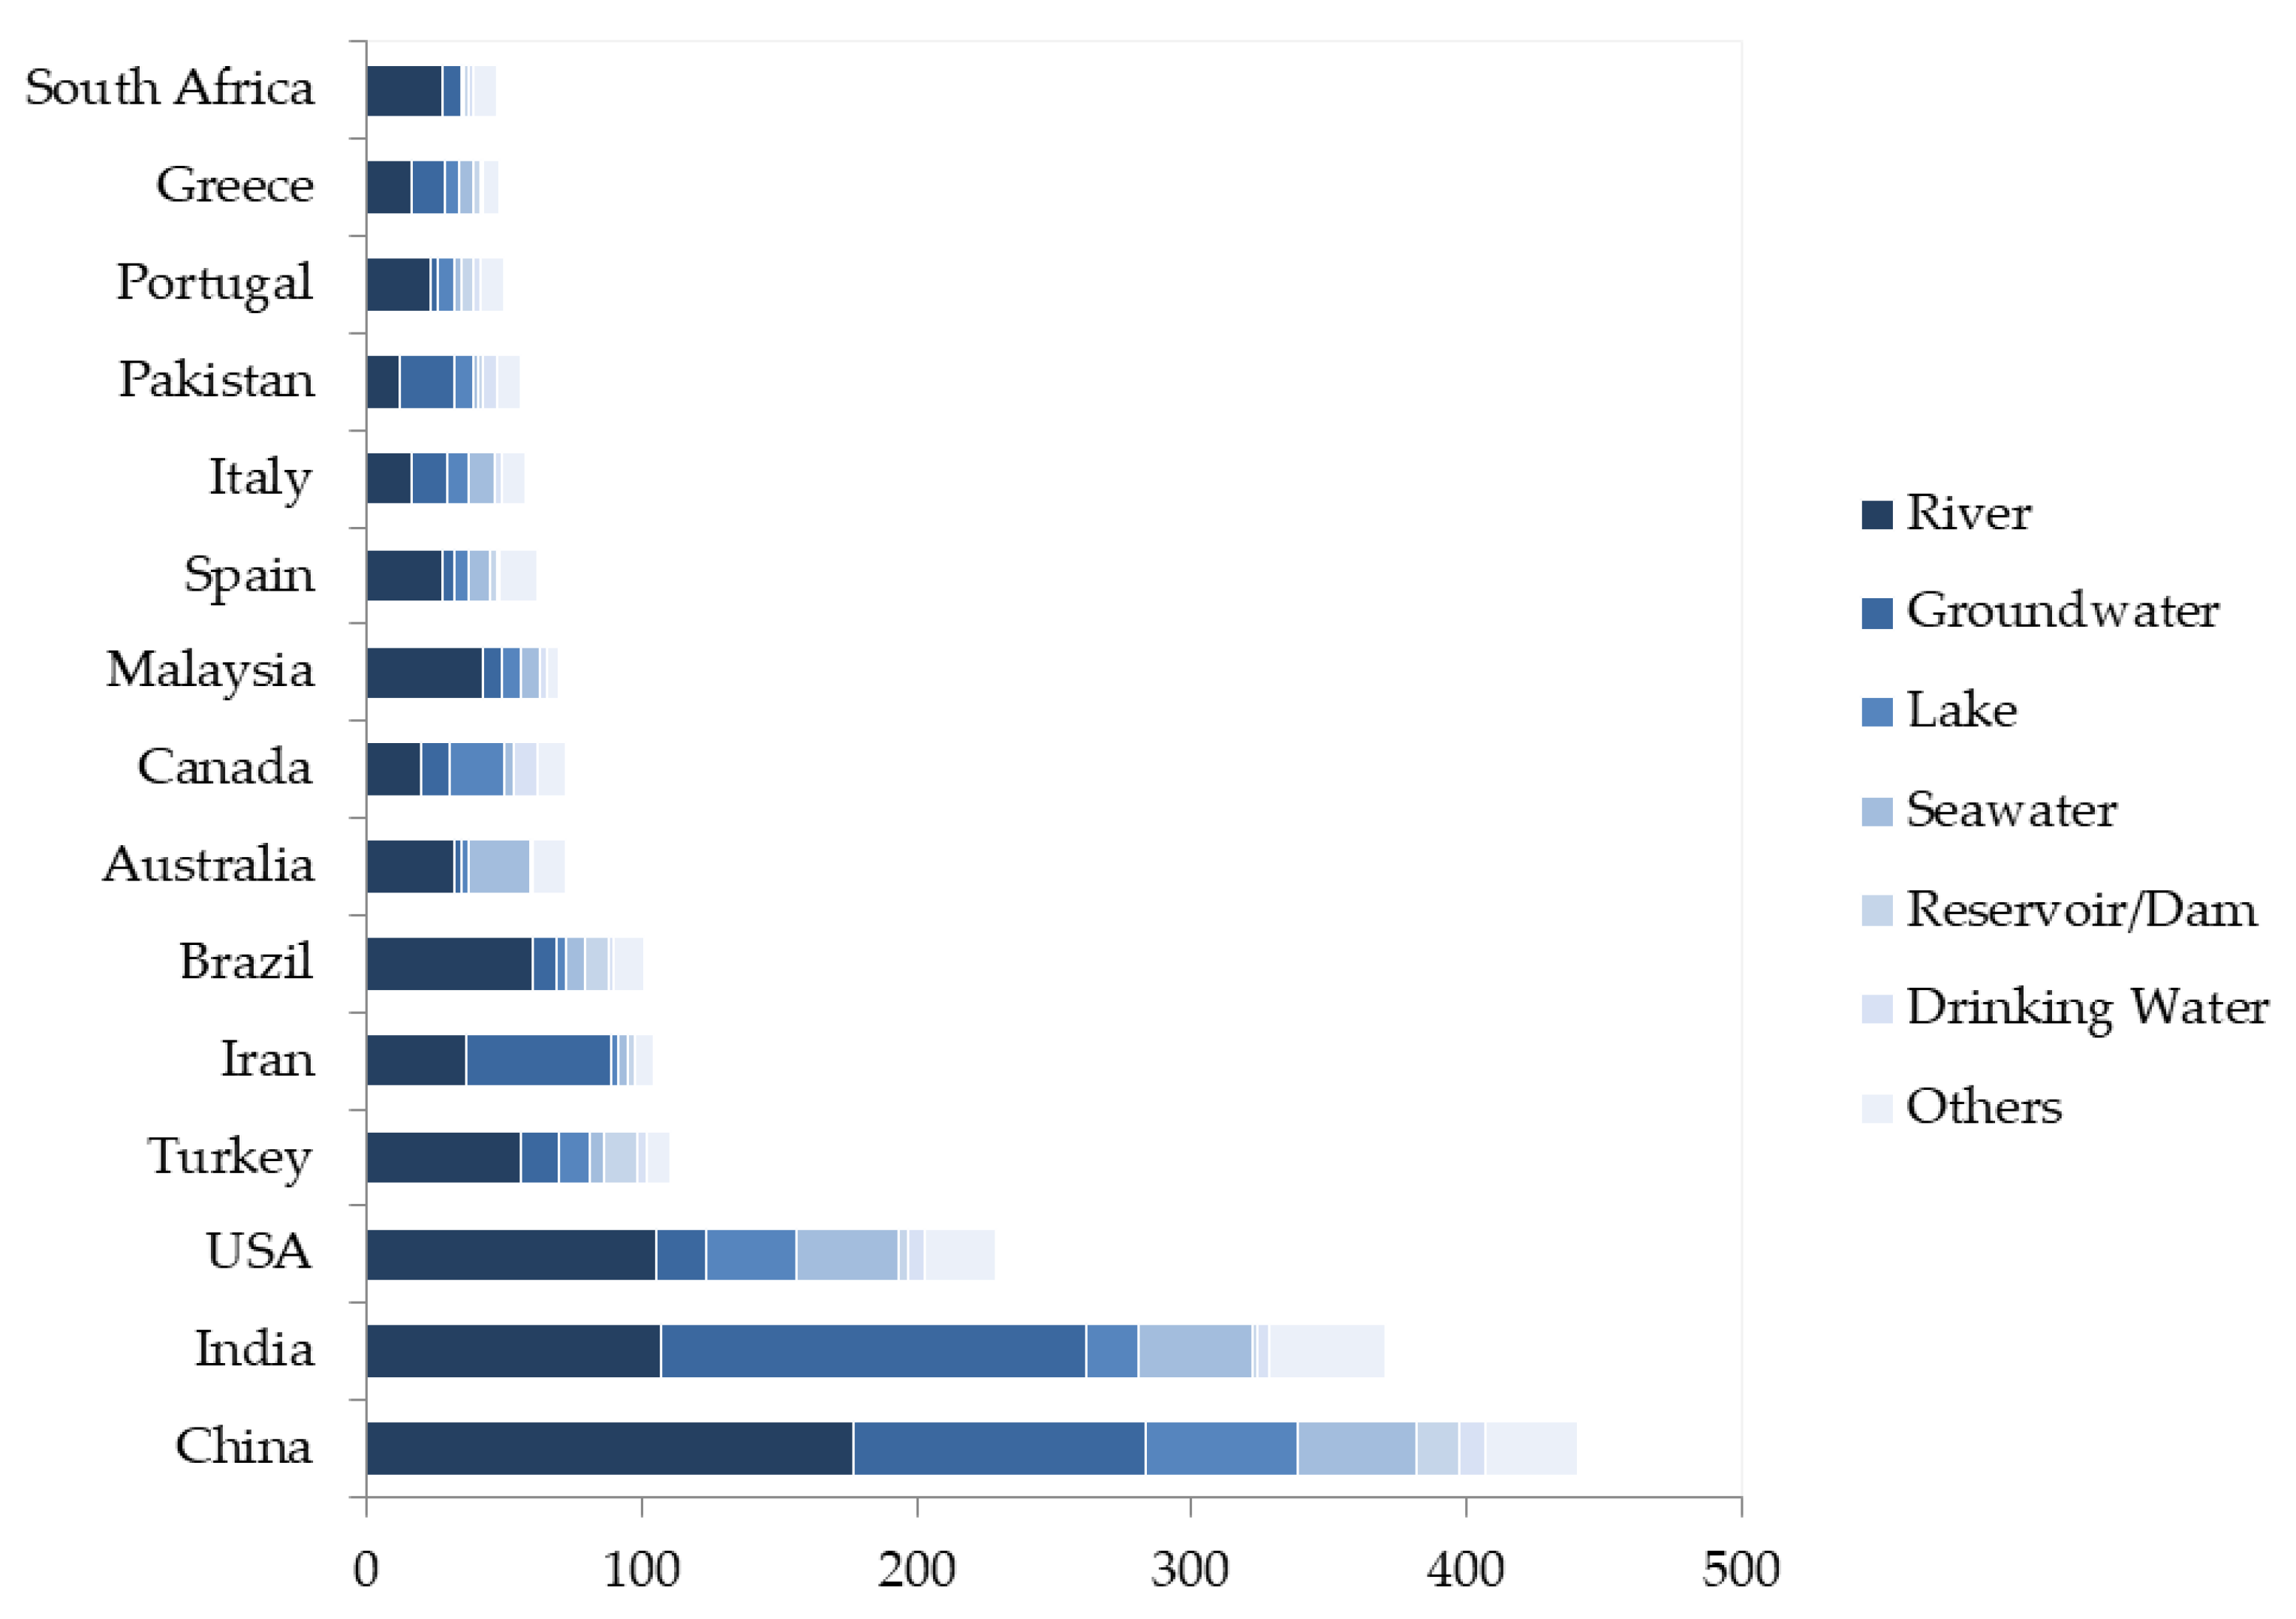
  • China, India and the USA were the countries that most used MSA in river water quality research. India, Iran and Pakistan had the highest number of groundwater studies.
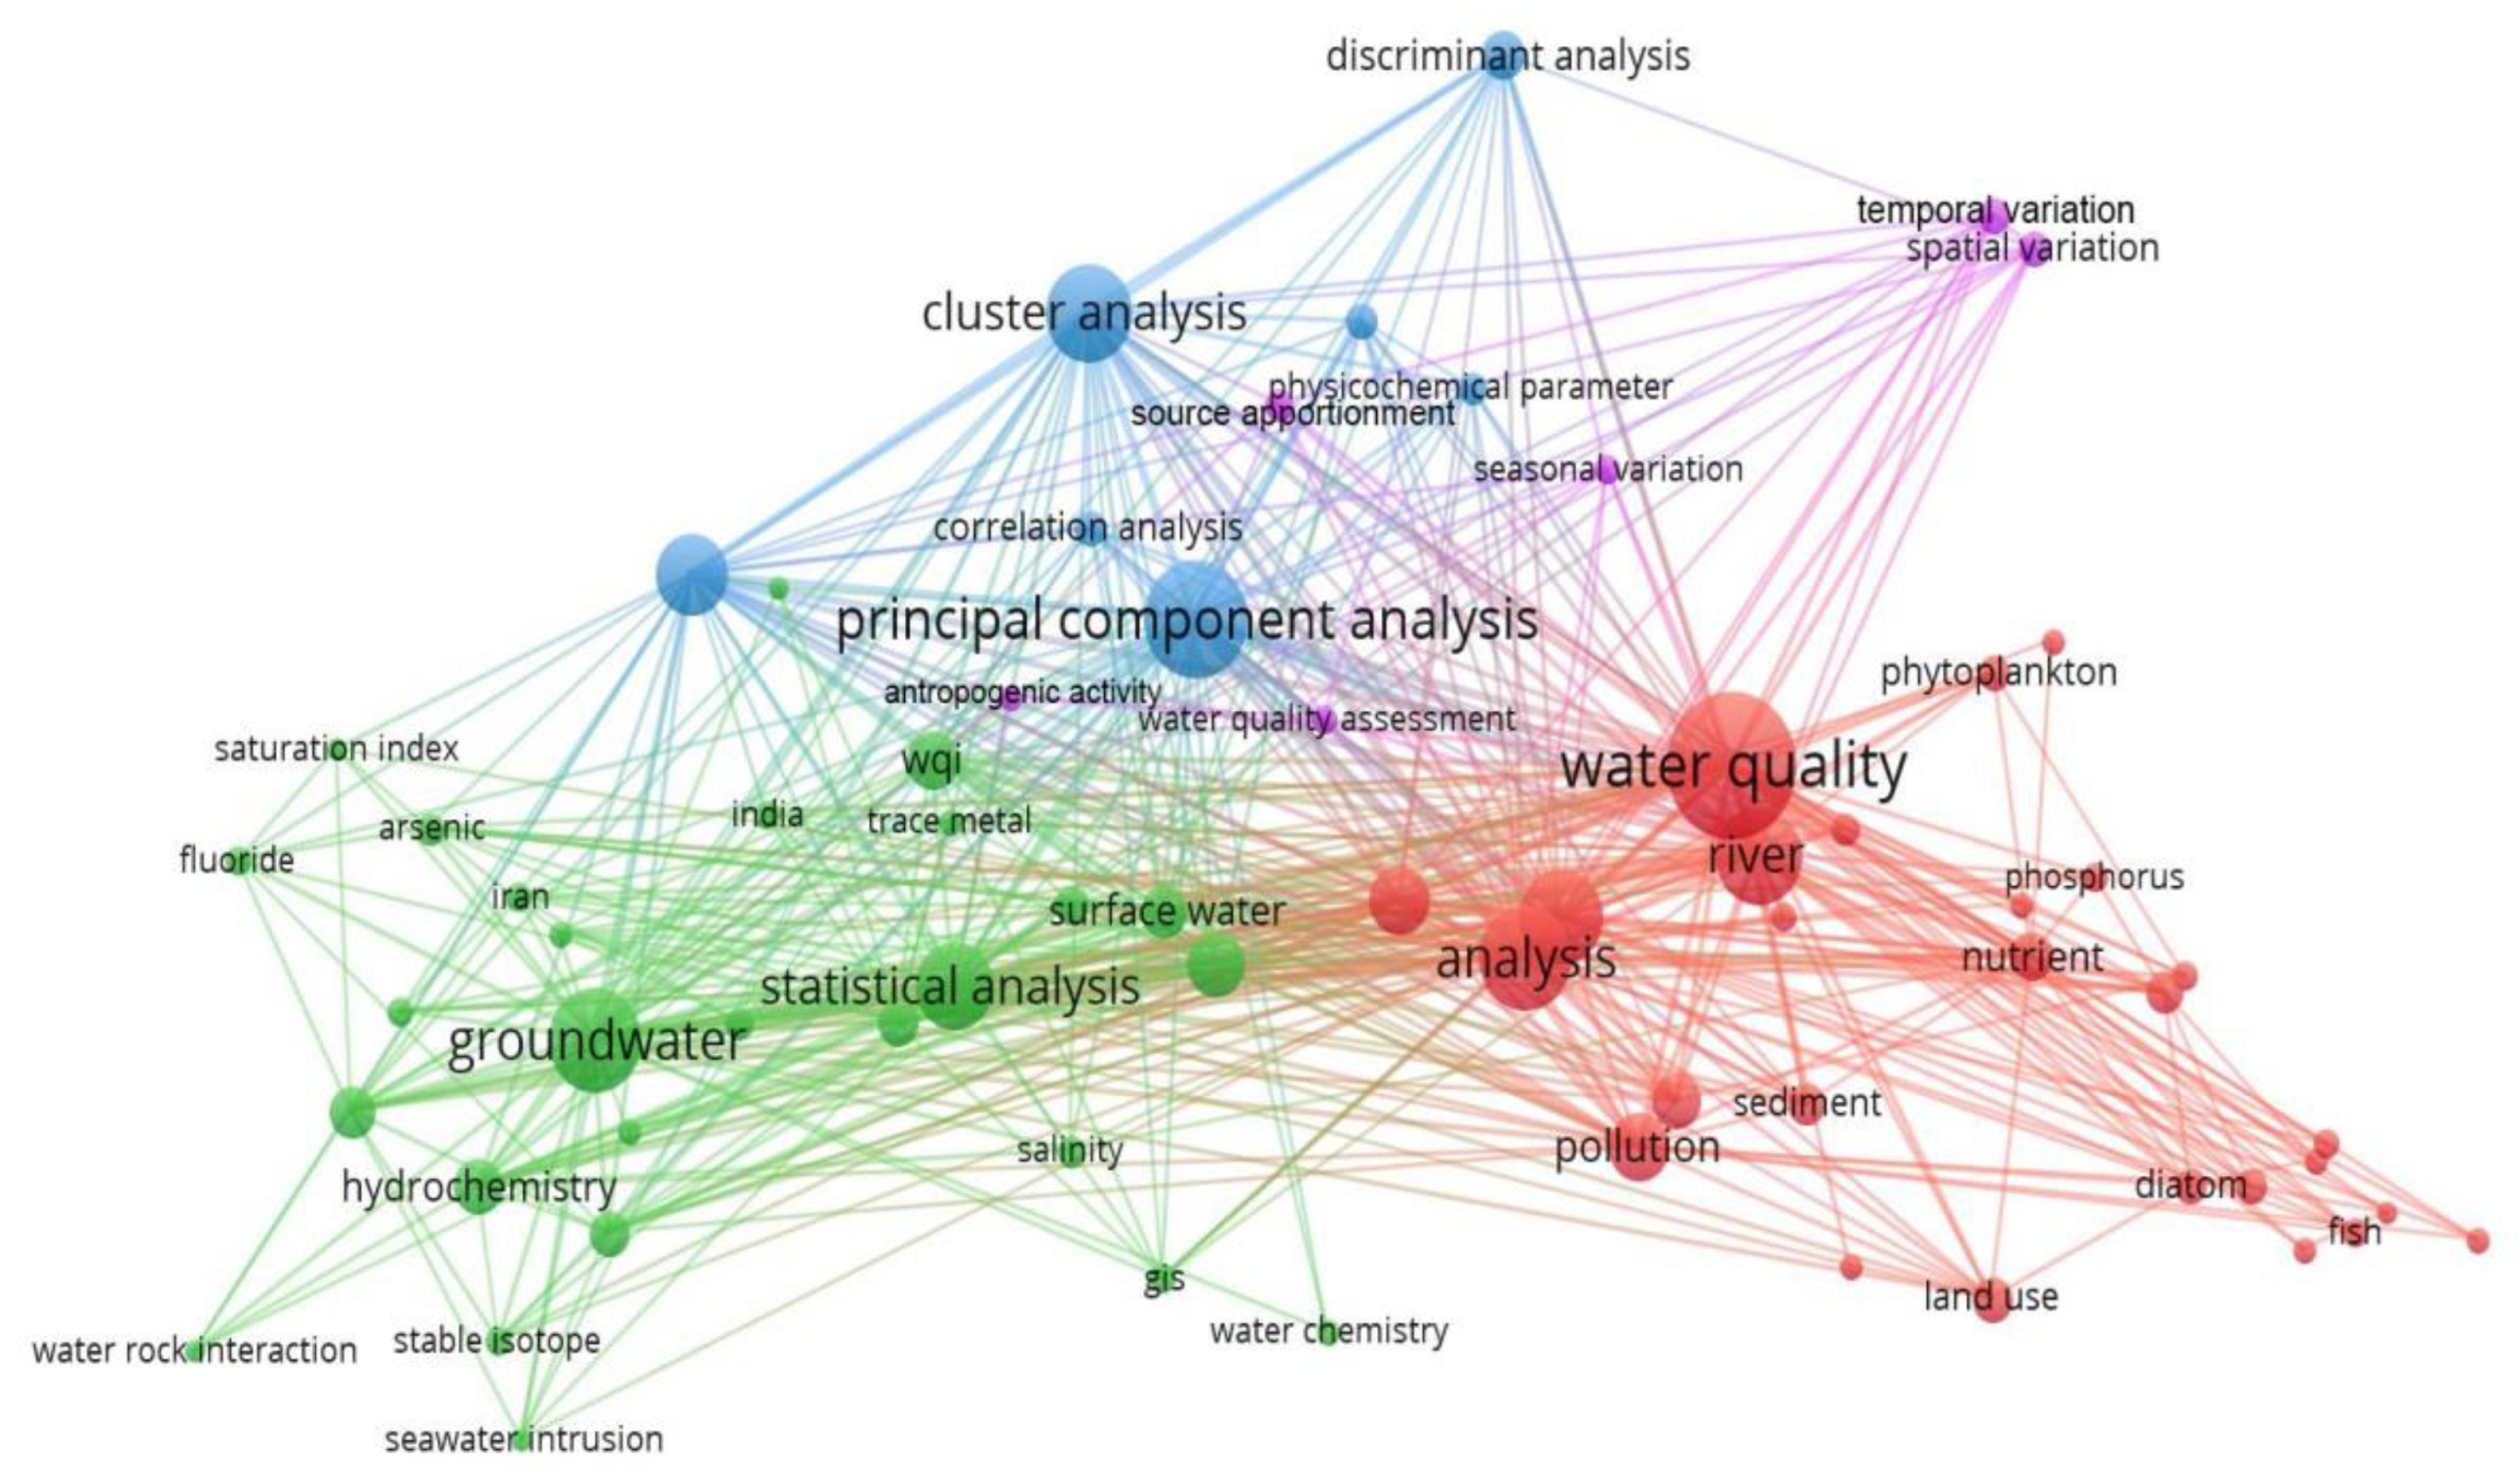
  • More than 5000 keywords were listed, with the terms water quality, groundwater and principal component analysis having the highest occurrences.
  • The most used MSAs were principal component analysis, hierarchical cluster analysis, factor analysis and discriminant analysis.
Multivariate statistical analysis has been widely used in the most diverse areas, especially in environmental sciences, including water quality analysis. The methods and techniques of MSA are applied for different purposes in the water quality research as discussed in this review. This study provides a practical reference and useful information for future research into the application of MSA in water quality studies.

Author Contributions

Conceptualization, D.H.F.M. and E.C.O.-F.; methodology, D.H.F.M.; formal analysis, D.H.F.M. and E.C.O.-F.; data curation, D.H.F.M. and E.C.O.-F.; writing—original draft preparation, D.H.F.M. and E.C.O.-F.; writing—review and editing, D.H.F.M. and E.C.O.-F.; supervision, E.C.O.-F.; funding acquisition, D.H.F.M. and E.C.O.-F. All authors have read and agreed to the published version of the manuscript.

Funding

This study was supported by Federal District Research Support Foundation (FAP-DF grant numbers: 0193.001354/2016).

Informed Consent Statement

Not applicable.

Data Availability Statement

Not applicable.

Conflicts of Interest

The authors declare no conflict of interest.

References

  1. Mehmood, H. Bibliometrics of Water Research: A Global Snapshot; UNU-INWEH Report Series, Issue 06; United Nations University Institute for Water, Environment and Health: Hamilton, ON, Canada, 2019; p. 24. [Google Scholar]
  2. Levallois, P.; Villanueva, C.M. Drinking Water Quality and Human Health: An Editorial. Int. J. Environ. Res. Public Health 2019, 16, 631. [Google Scholar] [CrossRef] [PubMed]
  3. UN-Water. Water and Sanitation Interlinkages across the 2030 Agenda for Sustainable Development, Geneva. 2016. Available online: http://www.unwater.org/publications/water-sanitation-interlinkages-across-2030-agenda-sustainable-development.pdf/ (accessed on 12 May 2021).
  4. Moriarty, P.; Batchelor, C.; Laban, P.; Fahmy, H. INWRDAM—The EMPOWERS Approach to Water Governance: Background and Key Concepts; Inter-Islamic Network on Water Resources Development and Management (INWRDAM): Amman, Jordan, 2007. [Google Scholar]
  5. Cosgrove, W.J.; Loucks, D.P. Water management: Current and future challenges and research directions. Water Resour. Res. 2015, 51, 4823–4839. [Google Scholar] [CrossRef]
  6. Connor, R.; Coates, D. The State of Water Resources. In The United Nations World Water Development Report 2021: Valuing Water; UNESCO: Paris, France, 2021; pp. 11–16. [Google Scholar]
  7. Meybeck, M.; Kimstach, V.; Helmer, R. Strategies for water quality assessment. In Water Quality Assessments—A Guide to Use of Biota, Sediments and Water in Environmental Monitoring, 2nd ed.; Chapman, D., Ed.; CRC Press: Cleveland, OH, USA, 1996; p. 609. [Google Scholar]
  8. Behmel, S.; Damour, M.; Ludwig, R.; Rodriguez, M.J. Water quality monitoring strategies—A review and future perspectives. Sci. Total Environ. 2016, 571, 1312–1329. [Google Scholar] [CrossRef] [PubMed]
  9. Haener, P. The Handbook on Water Information Systems Administration, Processing and Exploitation of Water-Related Data; UNESCO: Paris, France, 2018; p. 116. [Google Scholar]
  10. Dallas, H.F.; Day, J.A. The Effect of Water Quality Variables on Aquatic Ecosystems: A Review; Water Research Commission: Pretoria, South Africa, 2004; p. 224. [Google Scholar]
  11. He, J. Probabilistic Evaluation of Causal Relationship between Variables for Water Quality Management. J. Environ. Inform. 2016, 28, 110–119. [Google Scholar] [CrossRef]
  12. Chahouki, M.A.Z. Multivariate Analysis Techniques in Environmental Science. In Earth and Environmental Sciences; Imran, D., Mithas, D., Eds.; IntechOpen: London, UK, 2011; pp. 539–564. [Google Scholar]
  13. Fu, L.; Wang, Y.G. Statistical Tools for Analyzing Water Quality Data. In Water Quality Monitoring and Assessment; Voudouris, K., Voutsa, D., Eds.; IntechOpen: London, UK, 2012; pp. 144–168. [Google Scholar]
  14. Rencher, A.C.; Christensen, W.F. Methods of Multivariate Analysis, 3rd ed.; John Wiley & Sons Inc.: Hoboken, NJ, USA, 2012; p. 758. [Google Scholar]
  15. Mertler, C.A.; Reinhart, R.V. Advanced and Multivariate Statistical Methods: Practical Application and Interpretation, 6th ed.; Routledge Taylor & Francis Group: New York, NY, USA, 2017; p. 390. [Google Scholar]
  16. Noori, R.; Sabahi, M.S.; Karbassi, A.R.; Baghvand, A.; Zadeh, H.T. Multivariate statistical analysis of surface water quality based on correlations and variations in the data set. Desalination 2010, 260, 129–136. [Google Scholar] [CrossRef]
  17. Hair, J.F.K.; Black, W.C.; Babin, B.J.; Anderson, R.E. Multivariate Data Analysis, 7th ed.; Pearson Prentice Hall: Hoboken, NJ, USA, 2014; p. 785. [Google Scholar]
  18. Tabachnick, B.G.; Fidell, L.S. Using Multivariate Statistics, 7th ed.; Pearson Prentice Hall: Hoboken, NJ, USA, 2018; p. 983. [Google Scholar]
  19. Wang, M.; Liu, P.; Zhang, R.; Li, Z.; Li, X. A Scientometric Analysis of Global Health Research. Int. J. Environ. Res. Public Health 2020, 17, 2963. [Google Scholar] [CrossRef]
  20. Missen, M.M.S.; Qureshi, S.; Salamat, N.; Akhtar, N.; Asmat, H.; Coustaty, M.; Prasath, V.B.S. Scientometric analysis of social science and science disciplines in a developing nation: A case study of Pakistan in the last decade. Scientometrics 2020, 123, 113–142. [Google Scholar] [CrossRef]
  21. Fernandes, I.O.; Gomes, L.F.; Monteiro, L.C.; Dórea, J.G.; Bernardi, J.V.E. A Scientometric Analysis of Research on World Mercury (Hg) in Soil (1991–2020). Water Air Soil Pollut. 2021, 132, 254. [Google Scholar] [CrossRef]
  22. Bornmann, L.; Leydesdorff, L. Scientometrics in a changing research landscape: Bibliometrics has become an integral part of research quality evaluation and has been changing the practice of research. EMBO Rep. 2020, 15, 1228–1232. [Google Scholar] [CrossRef]
  23. Zhang, D.; Fu, H.Z.; Ho, Y.S. Characteristics and trends on global environmental monitoring research: A bibliometric analysis based on Science Citation Index Expanded. Environ. Sci. Pollut. Res. 2017, 24, 26079–26091. [Google Scholar] [CrossRef]
  24. Fu, H.Z.; Wang, M.H.; Ho, Y.S. Mapping of drinking water research: A bibliometric analysis of research output during 1992–2011. Sci. Total Environ. 2013, 443, 757–765. [Google Scholar] [CrossRef] [PubMed]
  25. Niu, B.; Loáiciga, H.A.; Wang, Z.; Zhan, F.B.; Hong, S. Twenty years of global groundwater research: A Science Citation Index Expanded-based bibliometric survey (1993–2012). J. Hydrol. 2014, 519, 966–975. [Google Scholar] [CrossRef]
  26. Wang, Y.; Xiang, C.; Zhao, P.; Mao, G.; Du, H. A bibliometric analysis for the research on river water quality assessment and simulation during 2000–2014. Scientometrics 2016, 108, 1333–1346. [Google Scholar] [CrossRef]
  27. Zare, F.; Elsawah, S.; Iwanaga, T.; Jakeman, A.J.; Pierce, S.A. Integrated water assessment and modelling: A bibliometric analysis of trends in the water resource sector. J. Hydrol. 2017, 552, 765–778. [Google Scholar] [CrossRef]
  28. Li, K.; Rollins, J.; Yan, E. Web of Science use in published research and review papers 1997–2017: A selective, dynamic, cross-domain, content-based analysis. Scientometrics 2018, 115, 1–20. [Google Scholar] [CrossRef]
  29. Birkle, C.; Pendlebury, D.A.; Schnell, J.; Adams, J. Web of Science as a data source for research on scientific and scholarly activity. Quan. Sci. Stud. 2020, 1, 363–376. [Google Scholar] [CrossRef]
  30. Clarivate. Journal Citation Reports 2021. 2022. Available online: https://clarivate.com/webofsciencegroup/web-of-science-journal-citation-reports-2021-infographic/ (accessed on 3 April 2022).
  31. Bornmann, L.; Haunschild, R.; Mutz, R. Growth rates of modern science: A latent piecewise growth curve approach to model publication numbers from established and new literature databases. Humanit. Soc. Sci. Commun. 2021, 8, 224. [Google Scholar] [CrossRef]
  32. Singh, K.P.; Malik, A.; Mohan, D.; Sinha, S. Multivariate Statistical Techniques for the Evaluation of Spatial and Temporal Variations in Water Quality of Gomti River (India)—A Case Study. Water Res. 2004, 38, 3980–3992. [Google Scholar] [CrossRef]
  33. Simeonov, V.; Stratis, J.A.; Samara, C.; Zachariadis, G.; Voutsa, D.; Anthemidis, A.; Sofoniou, M.; Kouimtzis, T. Assessment of the surface water quality in Northern Greece. Water Res. 2003, 37, 4119–4124. [Google Scholar] [CrossRef]
  34. Singh, K.P.; Malik, A.; Sinha, S. Water quality assessment and apportionment of pollution sources of Gomti river (India) using multivariate statistical techniques—A case study. Anal. Chim. Acta 2005, 538, 355–374. [Google Scholar] [CrossRef]
  35. Güler, C.; Thyne, G.D.; McCray, J.E.; Turner, K.A. Evaluation of graphical and multivariate statistical methods for classification of water chemistry data. Hydrogeol. J. 2002, 10, 455–474. [Google Scholar] [CrossRef]
  36. Reghunath, R.; Murthy, T.R.S.; Raghavan, B.R. The utility of multivariate statistical techniques in hydrogeochemical studies: An example from Karnataka, India. Water Res. 2002, 36, 2437–2442. [Google Scholar] [CrossRef] [PubMed]
  37. Shrestha, S.; Kazama, F. Assessment of surface water quality using multivariate statistical techniques: A case study of the Fuji river basin, Japan. Environ. Model. Softw. 2007, 22, 464–475. [Google Scholar] [CrossRef]
  38. Cloutier, V.; Lefebvre, R.; Therrien, R.; Savard, M.M. Multivariate statistical analysis of geochemical data as indicative of the hydrogeochemical evolution of groundwater in a sedimentary rock aquifer system. J. Hydrol. 2008, 353, 294–313. [Google Scholar] [CrossRef]
  39. Kumar, M.; Ramanathan, A.; Rao, M.S.; Kumar, B. Identification and evaluation of hydrogeochemical processes in the groundwater environment of Delhi, India. Environ. Geol. 2006, 50, 1025–1039. [Google Scholar] [CrossRef]
  40. Kazi, T.G.; Arain, M.B.; Jamali, M.K.; Jalbani, N.; Afridi, H.I.; Sarfraz, R.A.; Baig, J.A.; Shah, A.Q. Assessment of water quality of polluted lake using multivariate statistical techniques: A case study. Ecotoxicol. Environ. Saf. 2008, 72, 301–309. [Google Scholar] [CrossRef]
  41. Li, S.; Zhang, Q. Risk assessment and seasonal variations of dissolved trace elements and heavy metals in the Upper Han River, China. J. Hazard. Mater. 2010, 181, 1051–1058. [Google Scholar] [CrossRef]
  42. Khatri, N.; Tyagi, S. Influences of natural and anthropogenic factors on surface and groundwater quality in rural and urban areas. Front. Life Sci. 2014, 8, 23–29. [Google Scholar] [CrossRef]
  43. Brahman, K.D.; Kazi, T.G.; Afridi, H.I.; Naseem, S.; Arain, S.S.; Ullah, N. Evaluation of high levels of fluoride, arsenic species and other physicochemical parameters in underground water of two sub districts of Tharparkar, Pakistan: A multivariate study. Water Res. 2013, 47, 1005–1020. [Google Scholar] [CrossRef]
  44. Fu, J.; Zhao, C.; Luo, Y.; Liu, C.; Kyzas, G.Z.; Luo, Y.; Zhao, D.; An, S.; Zhu, H. Heavy metals in surface sediments of the Jialu River, China: Their relations to environmental factors. J. Hazard. Mater. 2014, 270, 102–109. [Google Scholar] [CrossRef]
  45. Machiwal, D.; Jha, M.K. Identifying sources of groundwater contamination in a hard-rock aquifer system using multivariate statistical analyses and GIS-based geostatistical modeling techniques. J. Hydrol. Reg. Stud. 2015, 4, 80–110. [Google Scholar] [CrossRef]
  46. National Science Board, National Science Foundation. Publication Output: US Trends and International Comparisons. Science and Engineering Indicators 2020. NSB-2020-6. Alexandria, VA, USA. Available online: https://ncses.nsf.gov/pubs/nsb20206/ (accessed on 7 June 2022).
  47. Chabukdhara, M.; Gupta, S.K.; Kotecha, Y.; Nema, A.K. Groundwater quality in Ghaziabad district, Uttar Pradesh, India: Multivariate and health risk assessment. Chemosphere 2017, 179, 167–178. [Google Scholar] [CrossRef]
  48. Kumar, M.; Ramanathan, A.L.; Tripathi, R.; Farswan, S.; Kumar, D.; Bhattacharya, P. A study of trace element contamination using multivariate statistical techniques and health risk assessment in groundwater of Chhaprola Industrial Area, Gautam Buddha Nagar, Uttar Pradesh, India. Chemosphere 2017, 166, 135–145. [Google Scholar] [CrossRef] [PubMed]
  49. Li, P.; Tian, R.; Liu, R. Solute Geochemistry and Multivariate Analysis of Water Quality in the Guohua Phosphorite Mine, Guizhou Province, China. Expo. Health 2019, 11, 81–94. [Google Scholar] [CrossRef]
  50. Rasool, A.; Xiao, T.; Farooqi, A.; Shafeeque, M.; Masood, S.; Ali, S.; Fahad, S.; Nasim, W. Arsenic and heavy metal contaminations in the tube well water of Punjab, Pakistan and risk assessment: A case study. Ecol. Eng. 2016, 95, 90–100. [Google Scholar] [CrossRef]
  51. Elsevier. Home—Journals—Water Research. Available online: https://www.journals.elsevier.com/water-research (accessed on 8 June 2022).
  52. Chen, X.; Chen, H.; Yang, L.; Wei, W.; Ni, B.-J. A comprehensive analysis of evolution and underlying connections of water research themes in the 21st century. Sci. Total Environ. 2022, 835, 155411. [Google Scholar] [CrossRef]
  53. Gonzales, L.G.V.; Ávila, F.F.G.; Torres, R.J.C.; Oliveira, C.A.C.; Paredes, E.A.A. Scientometric study of drinking water treatments technologies: Present and future challenges. Cogent Eng. 2021, 8, 1929046. [Google Scholar] [CrossRef]
  54. Nyika, J.; Dinka, M. A scientometric study on quantitative microbial risk assessment in water quality analysis across 6 years (2016–2021). J. Water Health 2022, 20, 329–343. [Google Scholar] [CrossRef]
  55. Nishy, P.; Saroja, R. A scientometric examination of the water quality research in India. Environ. Monit. Assess. 2018, 190, 225. [Google Scholar] [CrossRef]
  56. Dash, S.; Kalamdhad, A.S. Science mapping approach to critical reviewing of published literature on water quality indexing. Ecol. Indic. 2021, 128, 1–18. [Google Scholar] [CrossRef]
  57. Borsuk, M.E.; Stow, C.A.; Reckhow, K.H. A Bayesian network of eutrophication models for synthesis, prediction, and uncertainty analysis. Ecol. Modell 2004, 173, 219–239. [Google Scholar] [CrossRef]
  58. Potapova, M.G.; Charles, D.F. Benthic diatoms in USA rivers: Distributions along spatial and environmental gradients. J. Biogeogr. 2002, 29, 167–187. [Google Scholar] [CrossRef]
  59. Hildebrandt, A.; Guillamón, M.; Lacorte, S.; Tauler, R.; Barceló, D. Impact of pesticides used in agriculture and vineyards to surface and groundwater quality (North Spain). Water Res. 2008, 42, 3315–3326. [Google Scholar] [CrossRef]
  60. Kowalkowski, T.; Zbytniewski, R.; Szpejna, J.; Buszewski, B. Application of chemometrics in river water classification. Water Res. 2006, 40, 744–752. [Google Scholar] [CrossRef] [PubMed]
  61. Krishna, A.K.; Satyanarayanan, M.; Govil, P.K. Assessment of heavy metal pollution in water using multivariate statistical techniques in an industrial area: A case study from Patancheru, Medak District, Andhra Pradesh, India. J. Hazard. Mater. 2009, 167, 366–373. [Google Scholar] [CrossRef]
  62. Piwowar, H.; Priem, J.; Larivière, V.; Alperin, J.P.; Matthias, L.; Norlander, B.; Farley, A.; West, J.; Haustein, S. The state of OA: A large-scale analysis of the prevalence and impact of Open Access articles. PeerJ 2018, 6, e4375. [Google Scholar] [CrossRef] [PubMed]
  63. Langham-Putrow, A.; Bakker, C.; Riegelman, A. Is the open access citation advantage real? A systematic review of the citation of open access and subscription-based articles. PLoS ONE 2021, 16, e0253129. [Google Scholar] [CrossRef]
  64. World Bank. The World Bank Data. Scientific and Technical Journal Articles. 2018. Available online: https://data.worldbank.org/indicator/IP.JRN.ARTC.SC?most_recent_value_desc=true&view=map&year_low_desc=true (accessed on 20 May 2021).
  65. Udimal, T.B.; Jincai, Z.; Ayamba, E.M.; Owusu, S.M. China’s water situation; the supply of water and the pattern of its usage. Int. J. Sustain. Built Environ. 2017, 6, 491–500. [Google Scholar] [CrossRef]
  66. Li, X.; Shan, Y.; Zhang, Z.; Yang, L.; Meng, J.; Guan, D. Quantity and quality of China’s water from demand perspectives. Environ. Res. Lett. 2019, 14, 124004. [Google Scholar] [CrossRef]
  67. Ma, T.; Zhao, N.; Ni, Y.; Yi, J.; Wilson, J.P.; He, L.; Du, Y.; Pei, T.; Zhou, C.; Song, C.; et al. China’s improving inland surface water quality since 2003. Sci. Adv. 2020, 6, eaau3798. [Google Scholar] [CrossRef]
  68. Global Water Partership. China’s Water Resources Management Challenge: The ‘Three Red Lines’. Technical Focus Paper. GWP, Sweden. 2015. Available online: https://www.gwp.org/globalassets/global/toolbox/publications/technical-focus-papers/tfpchina_2015.pdf (accessed on 6 June 2021).
  69. Jain, S.K. Water resources management in India—Challenges and the way forward. Curr. Sci. 2017, 117, 569–576. [Google Scholar] [CrossRef]
  70. Shi, J.; Gao, Y.; Ming, L.; Yang, K.; Sun, Y.; Chen, J.; Shi, S.; Geng, J.; Li, L.; Wu, J.; et al. A bibliometric analysis of global research output on network meta-analysis. BMC Med. Inf. Decis. Mak. 2021, 21, 144. [Google Scholar] [CrossRef] [PubMed]
  71. Abbott, B.W.; Bishop, K.; Zarnetske, J.P.; Minaudo, C.; Chapin, F.S.; Krause, S.; Hannah, D.M.; Conner, L.; Ellison, D.; Godsey, S.E.; et al. Human domination of the global water cycle absent from depictions and perceptions. Nat. Geosci. 2019, 12, 533–540. [Google Scholar] [CrossRef]
  72. Nguyen, T.H.; Helm, B.; Hettiarachchi, H.; Caucci, S.; Krebs, P. The selection of design methods for river water quality monitoring networks: A review. Environ. Earth Sci. 2019, 78, 96. [Google Scholar] [CrossRef]
  73. Walker, D.B.; Baumgartner, D.J.; Gerba, C.P.; Fitzsimmons, K. Surface Water Pollution. In Environmental Pollution Science, 3rd ed.; Brusseau, M.L., Pepper, I.L., Gerba, C.P., Eds.; Academic Press: Cambridge, MA, USA; Elsevier: Amsterdam, The Netherlands, 2019; pp. 261–292. [Google Scholar]
  74. Araral, E.; Ratra, S. Water governance in India and China: Comparison of water law, policy and administration. Water Policy 2016, 18, 14–31. [Google Scholar] [CrossRef]
  75. Secchi, S.; Mcdonald, M. The state of water quality strategies in the Mississippi River Basin: Is cooperative federalism working? Sci. Total Environ. 2019, 677, 241–249. [Google Scholar] [CrossRef]
  76. Wang, Y.; Mukherjee, M.; Wu, D.; Wu, X. Combating river pollution in China and India: Policy measures and governance challenges. Water Policy 2016, 18, 122–137. [Google Scholar] [CrossRef]
  77. United Nations, Department of Economic and Social Affairs, Population Division. World Population Prospects 2019: Highlights; ST/ESA/SER.A/423. 2019. Available online: https://population.un.org/wpp/publications/files/wpp2019_highlights.pdf.research (accessed on 12 July 2021).
  78. Zhang, S.; Mao, G.; Crittenden, J.; Liu, X.; Du, H. Groundwater remediation from the past to the future: A bibliometric analysis. Water Res. 2017, 119, 114–125. [Google Scholar] [CrossRef]
  79. Saha, D.; Marwaha, S.; Mukherjee, A. Groundwater Resources and Sustainable Management Issues in India. In Clean and Sustainable Groundwater in India; Saha, D., Marwaha, S., Mukherjee, A., Eds.; Springer: Berlin/Heidelberg, Germany, 2018; pp. 1–11. [Google Scholar]
  80. Nabavi, E. Failed Policies, Falling Aquifers: Unpacking Groundwater Overabstraction in Iran. Water Altern. 2018, 11, 699–724. [Google Scholar]
  81. Noori, R.; Maghrebi, M.; Mirchi, A.; Tang, Q.; Bhattarai, R.; Sadegh, M.; Noury, M.; Torabi Haghighi, A.; Kløve, B.; Madani, K. Anthropogenic depletion of Iran’s aquifers. Proc. Natl. Acad. Sci. USA 2021, 118, e2024221118. [Google Scholar] [CrossRef]
  82. Noori, R.; Karbassi, A.; Khakpour, A.; Shahbazbegian, M.; Badam, H.M.K.; Vesali Naseh, M.R. Chemometric Analysis of Surface Water Quality Data: Case Study of the Gorganrud River Basin, Iran. Environ. Model. Assess. 2012, 17, 411–420. [Google Scholar] [CrossRef]
  83. Vesali Naseh, M.R.; Noori, R.; Berndtsson, R.; Adamowski, J.; Sadatipour, E. Groundwater Pollution Sources Apportionment in the Ghaen Plain, Iran. Int. J. Environ. Res. Public Health 2018, 15, 172. [Google Scholar] [CrossRef] [PubMed]
  84. Qureshi, A. Groundwater governance in Pakistan: From colossal development to neglected management. Water 2020, 12, 3017. [Google Scholar] [CrossRef]
  85. Bhateria, R.; Jain, D. Water quality assessment of lake water: A review. Sustain. Water Resour. Manag. 2016, 2, 161–173. [Google Scholar] [CrossRef]
  86. Vasistha, P.; Ganguly, R. Water quality assessment of natural lakes and its importance: An overview. Mater. Today Proc. 2020, 32, 544–552. [Google Scholar] [CrossRef]
  87. Zhang, L.T.; Yang, X. Chinese Lakes. In Encyclopedia of Lakes and Reservoirs; Encyclopedia of Earth Sciences Series; Bengtsson, L., Herschy, R.W., Fairbridge, R.W., Eds.; Springer: Dordrecht, The Netherlands, 2012. [Google Scholar]
  88. Tao, S.; Fang, J.; Ma, S.; Cai, Q.; Xiong, X.; Tian, D.; Zhao, X.; Fang, L.; Zhang, H.; Zhu, J.; et al. Changes in China’s lakes: Climate and human impacts. Nat. Sci. Rev. 2020, 7, 132–140. [Google Scholar] [CrossRef]
  89. Herschy, R. United States: Principal Freshwater Lakes. In Encyclopedia of Lakes and Reservoirs; Encyclopedia of Earth Sciences Series; Bengtsson, L., Herschy, R.W., Fairbridge, R.W., Eds.; Springer: Dordrecht, The Netherlands, 2012. [Google Scholar]
  90. US Environemntal Protection Agency. National Lakes Assessment 2012: A Collaborative Survey of Lakes in the United States; EPA 841-R-16-113; US Environmental Protection Agency: Washington, DC, USA, 2016. Available online: https://nationallakesassessment.epa.gov/ (accessed on 10 August 2021).
  91. Topp, S.N.; Pavelsky, T.M.; Stanley, E.H.; Yang, X.; Griffin, C.G.; Ross, M.R. Multi-decadal improvement in US Lake water clarity. Environ. Res. Lett. 2021, 16, 055025. [Google Scholar] [CrossRef]
  92. Minns, C.K.; Moore, J.E.; Shuter, B.J.; Mandrak, N.E. A preliminary national analysis of some key characteristics of Canadian lakes. Can. J. Fish. Aquat. Sci. 2008, 65, 1763–1778. [Google Scholar] [CrossRef]
  93. Monk, W.A.; Baird, D.J. Biodiversity in Canadian lakes and rivers. In Canadian Biodiversity: Ecosystem Status and Trends 2010; Technical Thematic Report No. 19; Canadian Councils of Resource Ministers: Ottawa, ON, Canada, 2014; Available online: http://www.biodivcanada.ca/default.asp?lang=En&n=137E1147-1 (accessed on 10 August 2021).
  94. Su, H.N.; Lee, P.C. Mapping knowledge structure by keyword co-occurrence: A first look at journal papers in Technology Foresight. Scientometrics 2010, 85, 65–79. [Google Scholar] [CrossRef]
  95. Lee, P.C.; Sun, H.N. Investigating the structure of regional innovation system research through keyword co-occurrence and social network analysis. Innovation 2010, 12, 26–40. [Google Scholar] [CrossRef]
  96. DiStefano, C.; Zhu, M.; Mindrila, D. Understanding and using factor scores: Considerations for the applied researcher. Pract. Assess. Res. Eval. 2009, 14, 2. [Google Scholar]
  97. Saporta, G.; Keita, N.N. Principal Component Analysis: Application to Statistical Process Control. In Data Analysis; Govaert, G., Ed.; ISTE: Eugene, OR, USA, 2009; pp. 1–23. [Google Scholar]
  98. Abdi, H.; Williams, L.J. Principal component analysis. WIREs Comp. Stat. 2010, 2, 433–459. [Google Scholar] [CrossRef]
  99. Jolliffe, I.T.; Cadima, J. Principal component analysis: A review and recent developments. Phil. Trans. R. Soc. 2016, 374, 20150202. [Google Scholar] [CrossRef] [PubMed]
  100. Holland, S.M. Principal Components Analysis (PCA). Department of Geology, University of Georgia, Athens, Greece. 2019. Available online: http://strata.uga.edu/8370/handouts/pcaTutorial.pdf (accessed on 25 September 2021).
  101. Subba Rao, N.; Sunitha, B.; Adimalla, N.; Chaudhary, M. Quality criteria for groundwater use from a rural part of Wanaparthy District, Telangana State, India, through ionic spatial distribution (ISD), entropy water quality index (EWQI) and principal component analysis (PCA). Environ. Geochem. Health 2020, 42, 579–599. [Google Scholar] [CrossRef] [PubMed]
  102. Azid, A.; Juahir, H.; Toriman, M.E.; Kamarudin, M.K.A.; Saudi, A.S.M.; Hasnam, C.N.C.; Aziz, N.A.A.; Azaman, F.; Latif, M.T.; Zainuddin, S.F.M.; et al. Prediction of the Level of Air Pollution Using Principal Component Analysis and Artificial Neural Network Techniques: A Case Study in Malaysia. Water Air Soil Pollut. 2014, 225, 2063. [Google Scholar] [CrossRef]
  103. Howard, M.C. A Review of Exploratory Factor Analysis Decisions and Overview of Current Practices: What We Are Doing and How Can We Improve? Int. J. Hum. Comput. Interact. 2016, 32, 51–62. [Google Scholar] [CrossRef]
  104. DeCoster, J. Overview of Factor Analysis. 1998. Available online: http://www.stat-help.com/factor.pdf (accessed on 18 September 2021).
  105. Barbulescu, A.; Yousef, N.; Fares, H. Assessing the Groundwater Quality in the Liwa Area, the United Arab Emirates. Water 2020, 12, 2816. [Google Scholar] [CrossRef]
  106. Wang, Y.; Wang, P.; Bai, Y.; Tian, Z.; Li, J.; Shao, X.; Mustavich, L.F.; Li, B.L. Assessment of surface water quality via multivariate statistical techniques: A case study of the Songhua River Harbin region, China. J. Hydro Environ. Res. 2013, 7, 30–40. [Google Scholar] [CrossRef]
  107. Jung, K.Y.; Lee, K.L.; Im, T.H.; Lee, I.J.; Kim, S.; Han, K.Y.; Ahn, J.M. Evaluation of water quality for the Nakdong River watershed using multivariate analysis. Environ. Technol. Innov. 2016, 5, 67–82. [Google Scholar] [CrossRef]
  108. Khalid, S. An assessment of groundwater quality for irrigation and drinking purposes around brick kilns in three districts of Balochistan province, Pakistan, through water quality index and multivariate statistical approaches. J. Geochem. Explor. 2019, 197, 14–26. [Google Scholar]
  109. Iscen, C.F.; Emiroglu, Ö.; Ilhan, S.; Arslan, N.; Yilmaz, V.; Ahiska, S. Application of multivariate statistical techniques in the assessment of surface water quality in Uluabat Lake, Turkey. Environ. Monit. Assess. 2008, 144, 269–276. [Google Scholar] [CrossRef] [PubMed]
  110. Najar, I.A.; Khan, A.B. Assessment of water quality and identification of pollution sources of three lakes in Kashmir, India, using multivariate analysis. Environ. Earth Sci. 2012, 66, 2367–2378. [Google Scholar] [CrossRef]
  111. Iqbal, J.; Shah, M.H. Health Risk Assessment of Metals in Surface Water from Freshwater Source Lakes, Pakistan. Hum. Ecol. Risk Assess. Int. J. 2013, 19, 1530–1543. [Google Scholar] [CrossRef]
  112. Han, Q.; Tong, R.; Sun, W.; Zhao, Y.; Yu, J.; Wang, G.; Shrestha, S.; Jin, Y. Anthropogenic influences on the water quality of the Baiyangdian Lake in North China over the last decade. Sci. Total Environ. 2020, 701, 134929. [Google Scholar] [CrossRef] [PubMed]
  113. Palma, P.; Alvarenga, P.; Palma, V.L. Assessment of anthropogenic sources of water pollution using multivariate statistical techniques: A case study of the Alqueva’s reservoir, Portugal. Environ. Monit. Assess. 2010, 165, 539–552. [Google Scholar] [CrossRef]
  114. Siepak, M.; Sojka, M. Application of multivariate statistical approach to identify trace elements sources in surface waters: A case study of Kowalskie and Stare Miasto reservoirs, Poland. Environ. Monit. Assess. 2017, 189, 364. [Google Scholar] [CrossRef]
  115. Varol, M. Arsenic and trace metals in a large reservoir: Seasonal and spatial variations, source identification and risk assessment for both residential and recreational users. Chemosphere 2019, 228, 1–8. [Google Scholar] [CrossRef]
  116. Varol, M. Spatio-temporal changes in surface water quality and sediment phosphorus content of a large reservoir in Turkey. Environ. Pollut. 2020, 259, 113860. [Google Scholar] [CrossRef]
  117. Güler, C. Characterization of Turkish bottled waters using pattern recognition methods. Chemom. Intell. Lab. Syst. 2007, 86, 86–94. [Google Scholar] [CrossRef]
  118. Chowdhury, S.; Champagne, P.; McLellan, P.J. Factors Influencing Formation of Trihalomethanes in Drinking Water: Results from Multivariate Statistical Investigation of the Ontario Drinking Water Surveillance Program Database. Water Qual. Res. J. 2008, 43, 189–199. [Google Scholar] [CrossRef]
  119. Birke, M.; Rauch, U.; Harazim, B.; Lorenz, H.; Glatte, W. Major and trace elements in German bottled water, their regional distribution, and accordance with national and international standards. J. Geochem. Explor. 2010, 107, 245–271. [Google Scholar] [CrossRef]
  120. Sun, R.; An, D.; Lu, W.; Shi, Y.; Wang, L.; Zhang, C.; Zhang, P.; Qi, H.; Wang, Q. Impacts of a flash flood on drinking water quality: Case study of areas most affected by the 2012 Beijing flood. Heliyon 2016, 2, e00071. [Google Scholar] [CrossRef]
  121. Jain, A.K. Data clustering: 50 years beyond K-means. Pattern Recognit. Lett. 2010, 31, 651–666. [Google Scholar] [CrossRef]
  122. Govender, P.; Sivakumar, V. Application of k-means and hierarchical clustering techniques for analysis of air pollution: A review (1980–2019). Atmos. Pollut. Res. 2020, 11, 40–56. [Google Scholar] [CrossRef]
  123. Bergman, L.R.; Magnusson, D. Person-centered Research. Int. Encycl. Soc. Behav. Sci. 2001, 2001, 11333–11339. [Google Scholar]
  124. Sheykhi, V.; Samani, N. Assessment of water quality compartments in Kor River, IRAN. Environ. Monit. Assess. 2020, 192, 532. [Google Scholar] [CrossRef]
  125. Bu, J.; Liu, W.; Pan, Z.; Ling, K. Comparative Study of Hydrochemical Classification Based on Different Hierarchical Cluster Analysis Methods. Int. J. Environ. Res. Public Health 2020, 17, 9515. [Google Scholar] [CrossRef]
  126. Härdle, W.K.; Simar, L. Discriminant Analysis. In Applied Multivariate Statistical Analysis; Springer: Berlin/Heidelberg, Germany, 2012; pp. 351–366. [Google Scholar]
  127. Ye, J.; Ji, S. Discriminant Analysis for Dimensionality Reduction: An Overview of Recent Developments. In Biometrics: Theory, Methods, and Applications; John Wiley & Sons, Inc.: Hoboken, NJ, USA, 2009; pp. 1–19. [Google Scholar]
  128. Link, E.; Emde, K. Discriminant Analysis. In The International Encyclopedia of Communication Research Methods; John Wiley & Sons Inc.: Hoboken, NJ, USA, 2017; pp. 1–10. [Google Scholar]
  129. Boyacıoğlu, H.; Boyacıoğlu, H. Detection of seasonal variations in surface water quality using discriminant analysis. Environ. Monit. Assess. 2010, 162, 15–20. [Google Scholar] [CrossRef]
  130. Ali, Z.M.; Ibrahim, N.A.; Mengersen, K.; Shitan, M.; Juahir, H. Discriminant analysis of water quality data in Langat River. In Proceedings of the International Conference on Environmental Forensics, Putrajaya, Malaysia, 11–14 November 2013; pp. 597–601. [Google Scholar]
  131. Helsel, D.; Hirsch, R.M.; Ryberg, K.; Archfield, S.; Gilroy, E. Statistical Methods in Water Resources; USGS Publications: Reston, VI, USA, 2020; p. 484. [Google Scholar]
  132. Beavers, A.S.; Lounsbury, J.W.; Richards, J.K.; Huck, S.W.; Skolits, G.J.; Esquivel, S.L. Practical Considerations for Using Exploratory Factor Analysis in Educational Research. Pract. Assess. Res. Eval. 2013, 18, 6. [Google Scholar]
  133. Schreiber, S.G.; Schreiber, S.; Tanna, R.N.; Roberts, D.R.; Arciszewski, T.J. Statistical tools for water quality assessment and monitoring in river ecosystems—A scoping review and recommendations for data analysis. Water Qual. Res. J. 2022, 51, 40–57. [Google Scholar] [CrossRef]
  134. Rodriguez, M.Z.; Comin, C.H.; Casanova, D.; Bruno, O.M.; Amancio, D.R.; Costa, L.D.F.; Rodrigues, F.A. Clustering algorithms: A comparative approach. PLoS ONE 2019, 14, e0210236. [Google Scholar] [CrossRef] [PubMed]
Figure 1. Flowchart of the stages of the scientometric review of publications that used MSA in water quality assessment research between 2001 and 2020.
Hydrology 10 00196 g001
Figure 2. Relationship between the number of publications and the year.
Hydrology 10 00196 g002
Figure 3. The fifteen most encountered WoS subject categories.
Hydrology 10 00196 g003
Figure 4. Time trend of the top five WoS subject categories between 2001 and 2020.
Hydrology 10 00196 g004
Figure 5. Worldwide geographic distribution of water quality research using MSA between 2001 and 2020.
Hydrology 10 00196 g005
Figure 6. The twelve categories of water sample types found in the publications.
Hydrology 10 00196 g006
Figure 7. Water resource categories of the 15 countries that most published on the topic.
Hydrology 10 00196 g007
Figure 8. Networks of associations between keywords most commonly found in publications that used MSA in water quality studies between 2001 and 2020.
Hydrology 10 00196 g008
Table 1. Impact factors and total publications percentage in relation to the total of the 10 most productive journals in the use of MSA for water quality research.
JournalJIFAJIFBTP (%)
Water Research11.26310.17744 (1.52)
Science of the Total Environment7.9636.93874 (2.56)
Marine Pollution Bulletin5.5534.56849 (1.70)
Ecological Indicators4.9584.42461 (2.11)
Environmental Science and Pollution Research4.2233.50989 (3.08)
Water3.1032.39067 (2.32)
Environmental Earth Sciences2.7842.660142 (4.91)
Hydrobiologia2.6942.41452 (1.80)
Environmental Monitoring and Assessment2.5132.346234 (8.10)
Arabian Journal of Geosciences1.8271.56351 (1.71)
JIFA = journal impact factor in 2021, JIFB = journal impact factor without self-citation in 2021, TP = total publications.
Table 2. The 15 most cited publications in water quality research using MSA, according to the WoS database.
AuthorsTitleYearCitations *JournalOpen AccessMSAWater
Sample Type
Shrestha and Kazama [37] Assessment of surface water quality using multivariate statistical techniques: A case study of the Fuji river basin, Japan20071129Environmental Modelling & SoftwareYesHCA/PCA-FA/DARiver
Singh et al. [32]Multivariate statistical techniques for the evaluation of spatial and temporal variations in water quality of Gomti River (India)—a case study20041078Water ResearchYesHCA/PCA-FA/DARiver
Simeonov et al. [33]Assessment of the surface water quality in Northern Greece2003870Water ResearchYesHCA/PCARiver
Güler et al. [35]Evaluation of graphical and multivariate statistical methods for classification of water chemistry data2002682Hydrogeology JournalYesHCA/NHCA/PCARiver and Groundwater
Singh et al. [34]Water quality assessment and apportionment of pollution sources of Gomti river (India) using multivariate statistical techniques—a case study2005658Analytica Chimica ActaYesHCA/PCARiver
Cloutier et al. [38]Multivariate statistical analysis of geochemical data as indicative of the hydrogeochemical evolution of groundwater in a sedimentary rock aquifer system2008489Journal of HydrologyYesHCA/PCAGroundwater
Kazi et al. [40]Assessment of water quality of polluted lake using multivariate statistical techniques: A case study2008423Ecotoxicology and Environmental SafetyYesHCA/PCALake
Borsuk et al. [57]A Bayesian network of eutrophication models for synthesis, prediction, and uncertainty analysis2004349Ecological ModellingYesMRSeawater
Reghunath et al. [36]The utility of multivariate statistical techniques in hydrogeochemical studies: an example from Karnataka, India2002349Water ResearchYesHCA/FAGroundwater
Kumar et al. [39]Identification and evaluation of hydrogeochemical processes in the groundwater environment of Delhi, India2006304Environmental GeologyYesFAGroundwater
Li and Zhang [41]Risk assessment and seasonal variations of dissolved trace elements and heavy metals in the Upper Han River, China2010301Journal of Hazardous MaterialsYesPCA/FARiver
Potapova and Charles [58]Benthic diatoms in USA rivers: distributions along spatial and environmental gradients2002280Journal of BiogeographyYesCCA/DCARiver
Hildebrant et al. [59]Impact of pesticides used in agriculture and vineyards to surface and groundwater quality (North Spain)2008259Water ResearchYesPCAGroundwater
Kowalkowski et al. [60]Application of chemometrics in river water classification2006257Water ResearchYesHCA/PCARiver
Krishna et al. [61]Assessment of heavy metal pollution in water using multivariate statistical techniques in an industrial area: A case study from Patancheru, Medak District, Andhra Pradesh, India2009254Journal of Hazardous MaterialsYesPCA-FARiver and Groundwater
* Number of citations until submission date. MSA = multivariate statistical analysis; HCA = hierarchical cluster analysis; PCA = principal component analysis; FA = factor analysis; DA = discriminant analysis; NHCA = non-hierachical cluster analysis (k-means); MR = multivariate regression; CCA = canonical correspondence analysis; DCA = detrended canonical correspondence analysis.
Table 3. The 15 countries with the highest number of publications that used MSA in water quality research and their h-index.
Country/TerritoryTotal
Publications (%)
h-Index
China441 (15.3)1112
India371 (12.8)745
USA229 (7.9)2711
Turkey110 (3.8)535
Iran104 (3.6)416
Brazil101 (3.5)690
Australia73 (2.5)1193
Canada72 (2.5)1381
Malaysia70 (2.4)415
Spain62 (2.1)1073
Italy58 (2.0)1189
Pakistan56 (1.9)353
Portugal50 (1.7)599
Greece48 (1.7)610
South Africa47 (1.6)567
Table 4. Water sample types and analogous or synonymous terms.
Water Sample TypesAnalogous or Synonymous Terms
RiverRiver, stream, creek, headwater, spring, watercourse, running water, waterbody, rivulet, streamflow
GroundwaterGroundwater, well, aquifer, mine, geothermal spring, artesian well, underground water, borehole, tubewells
LakeLake, lagoon, swamp, bog, lowland, boreal lake
SeawaterSeawater, marine, estuary, bay, reef, sea, estuarine water, coastal water, shore, coastal lagoon, coastal lake, coastal wetland, ballast water
Reservoir/DamReservoir, dam, barrage, dike, penstock, weir, dyke, embankment, catchment
Drinking waterDrinking water, water supply, tap water, bottled water, drinking water purification plant, water treatment plant, water treatment system, water systems, consumption water
WetlandWetland, swamp, marsh, riverine
WastewaterWastewater, drainage water, reuse water, mine drainage, agricultural effluents, produced water
PondPond, aquaculture lake, fish tank
RainwaterRainwater, precipitation, stormwater, rainfall
MeltwaterMeltwater, snow water
Navigation canalNavigation canal
Table 5. Multivariate statistical analyses most used in publications.
Analysis TypeMultivariate Statistical
Analysis
InitialsNumber of
Publications
Principal component analysis and factor analysisPrincipal component analysisPCA1405
Factor analysisFA248
Parallel factor analysisPARAFAC9
Cluster analysisHierarchical cluster analysis HCA1275
Nonhierarchical cluster analysis (k-means)NHCA37
Multiple regression and multiple correlation analysisMultiple linear regressionMLR121
Partial least squares regression PLS46
Multivariate regressionMR36
Multiple discriminant analysisDiscriminant analysisDA246
Canonical discriminant analysisCDA14
Multivariate analysis of variance and covariancePermutational multivariate Analysis of variancePERMANOVA62
Multivariate analysis of variance MANOVA19
Multivariate analysis of covarianceMANCOVA3
Canonical correlation analysisRedundancy analysisRDA82
Distance-based redundancy analysisDBRDA6
Canonical correlation analysisCCorA
Correspondence analysisCanonical correspondence analysisCCA207
Detrended correspondence analysisDCA55
Correspondence analysisCA26
Detrended canonical correspondence analysisDCCA8
Multidimensional scalingNonmetric multidimensional scalingNMDS151
Multidimensional scaling (principal coordinate analysis)MDS (PCoA)43
Multiple analysisPrincipal component analysis–factor analysisPCA–FA244
Absolute principal component scores–multiple linear regression APCS–MLR22
Other multivariate statistical analyses302
Disclaimer/Publisher’s Note: The statements, opinions and data contained in all publications are solely those of the individual author(s) and contributor(s) and not of MDPI and/or the editor(s). MDPI and/or the editor(s) disclaim responsibility for any injury to people or property resulting from any ideas, methods, instructions or products referred to in the content.

