Article

Evaluation of Jet Flooding in Distillation Column Olefins Plant on Naphtha to LPG Feed Substitution

Department of Chemical Engineering, Gadjah Mada University, Yogyakarta 55281, Indonesia
*
Author to whom correspondence should be addressed.
ChemEngineering 2023, 7(4), 63; https://doi.org/10.3390/chemengineering7040063
Submission received: 28 April 2023 / Revised: 18 June 2023 / Accepted: 25 June 2023 / Published: 20 July 2023
(This article belongs to the Special Issue Process Intensification for Chemical Engineering and Processing)

Abstract

:
The naphtha cracking process is the most commonly used technology for the production of ethylene, propylene, mixed C4s (including 1,3-butadiene and other C4 components), and pygas (pyrolysis gasoline, a mixture of benzene, toluene, and xylene), all of which are olefins. The cracking furnace and distillation columns are the primary operational units. The raw material is cracked and undergoes reactions in the cracking furnaces, while the distillation columns are responsible for separating the products. Raw material costs account for 80% of production costs. There is also the possibility of using LPG as a less expensive alternative to some of the naphtha. However, changing the raw material would affect the operability of the distillation columns and influence the yield on the cracking side. To determine the optimal naphtha substitution for LPG without causing hydraulic problems (such as jet flooding) in the distillation columns, analysis using simulation tools must be conducted. A reliability model is being developed to simulate the substitution of naphtha with other feed stocks by comparing simulation results with data from the actual plant. The LPG flow is a variable that is freely adjusted to substitute for naphtha. Simulation tools can be used to assess the effects of economically advantageous naphtha substitution for LPG without compromising plant operability. The optimum naphtha substitution rate is 21.14% from the base case, resulting in jet flooding occurring at Propylene Fractionator No. 2. By implementing this substitution, the benefits that can be obtained amount to USD 22,772.02 per hour.

1. Introduction

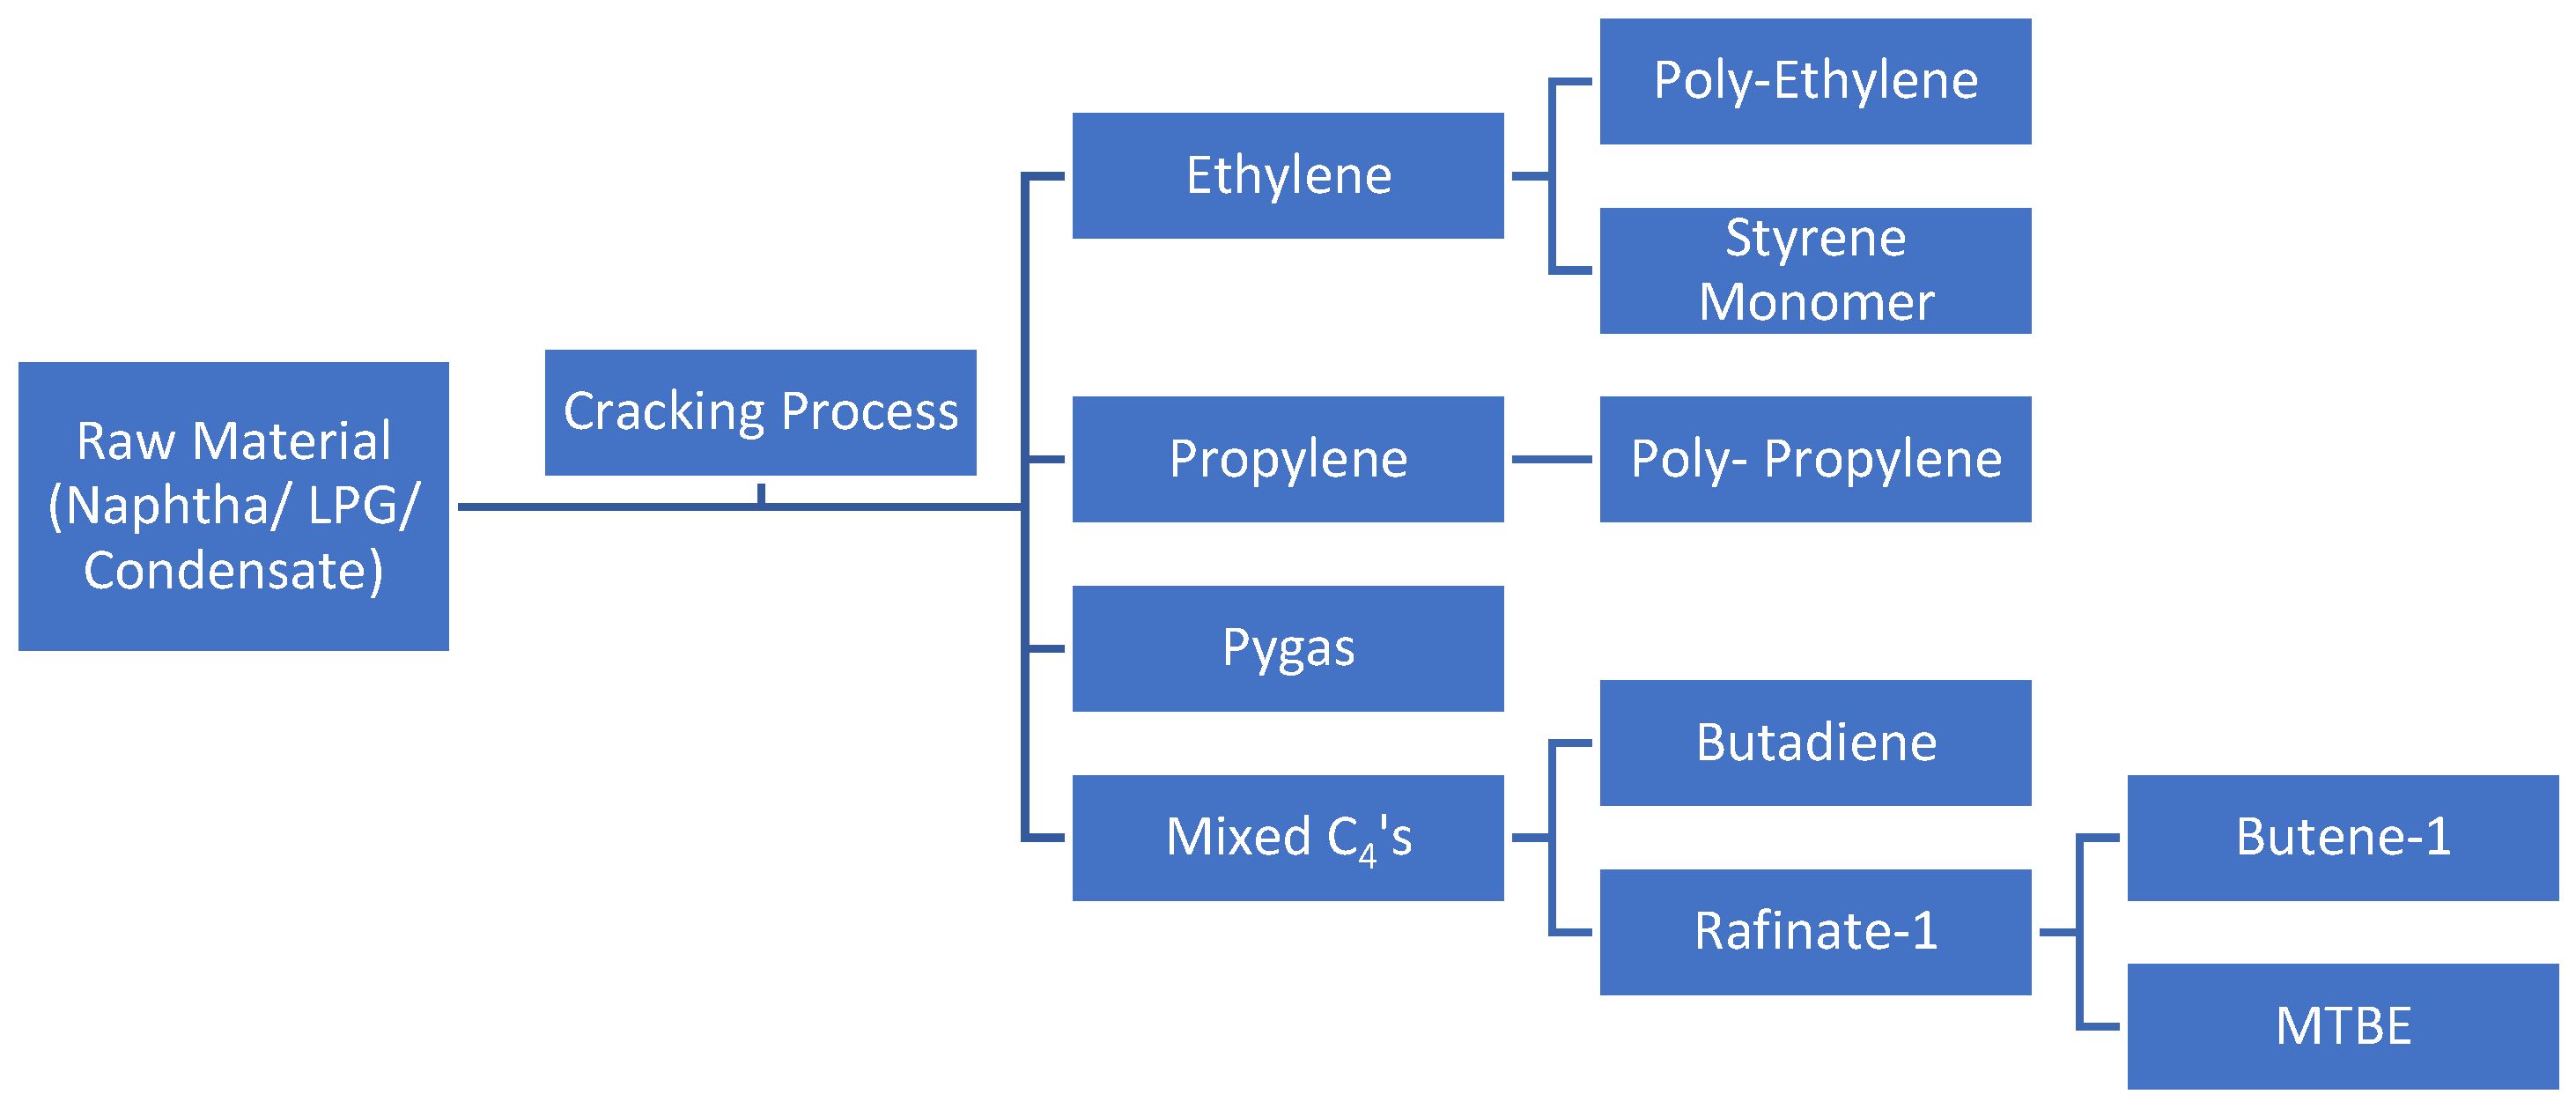
Ethylene, propylene, crude C4 (1,3-butadiene), and pygas (benzene, toluene, xylene) are the fundamental building blocks of the petrochemical industry. Naphtha cracking is the process that produces olefins most frequently (Kirk, 1988) [1]. Up to 80% of the operational capacity of olefin plants is contributed by naphtha price. Olefins plants around the world offer the potential to replace naphtha feed into LPG due to ample LPG thanks to the shale oil production trend, LPG price decline, and LPG plenty. (Argus, 2018) [2,3].
However, switching from naphtha to LPG feed carries certain risks. The cracking furnace, where the feed undergoes steam cracking reactions, is a critical unit in olefin plants (Schaschke, 2014) [4]. The cracking gas is then separated into ethylene, propylene, mixed C4 (including butadiene and other C4 compounds), and pygas (a mixture of benzene, toluene, and xylene streams), which are all pure olefins, in the distillation column. The process flow diagram is shown in Figure 1.
Olefins plants utilizing LPG feed are expected to experience an increase in propylene and propane production (Argus, 2018) [2]. As naphtha is commonly assumed to be the primary feed for most olefin plants, including the plant discussed in this article, it is crucial to consider the effects of LPG cracking on column hydraulics (Fakhroleslam, 2020) [6].
According to Kister (1992) [7], there are six key hydraulic parameters that significantly impact the operability of distillation columns:
  • Jet flooding: This occurs when a distillation column is operated with a high vapor load, causing liquid to be transported over the trays.
  • Down comer back flood: when a distillation column is run with a substantial liquid and vapor load, liquid accumulates in the top half of the column.
  • Down comer choke flood: excessive vapor flow results in liquid buildup in the trays’ down comers.
  • Weeping: low vapor load results in liquid draining from the tray channel.
  • Excessive pressure drops: the pressure drop across each tray should not exceed the design limit.
  • Turndown ratio: it is essential to feed the distillation column within its operational capacity to maintain acceptable efficiency.
The olefins plant under investigation consists of nine distillation columns, with the following configurations (Lummus, 2012) [8]:
  • Demethanizer: This nine-bed distillation column operates at a pressure of 5.8 kg/cm2 and extracts heavier C2 compounds from methane. The top product is methane, with gauge and bottom side temperatures of −53 °C and −131 °C, respectively.
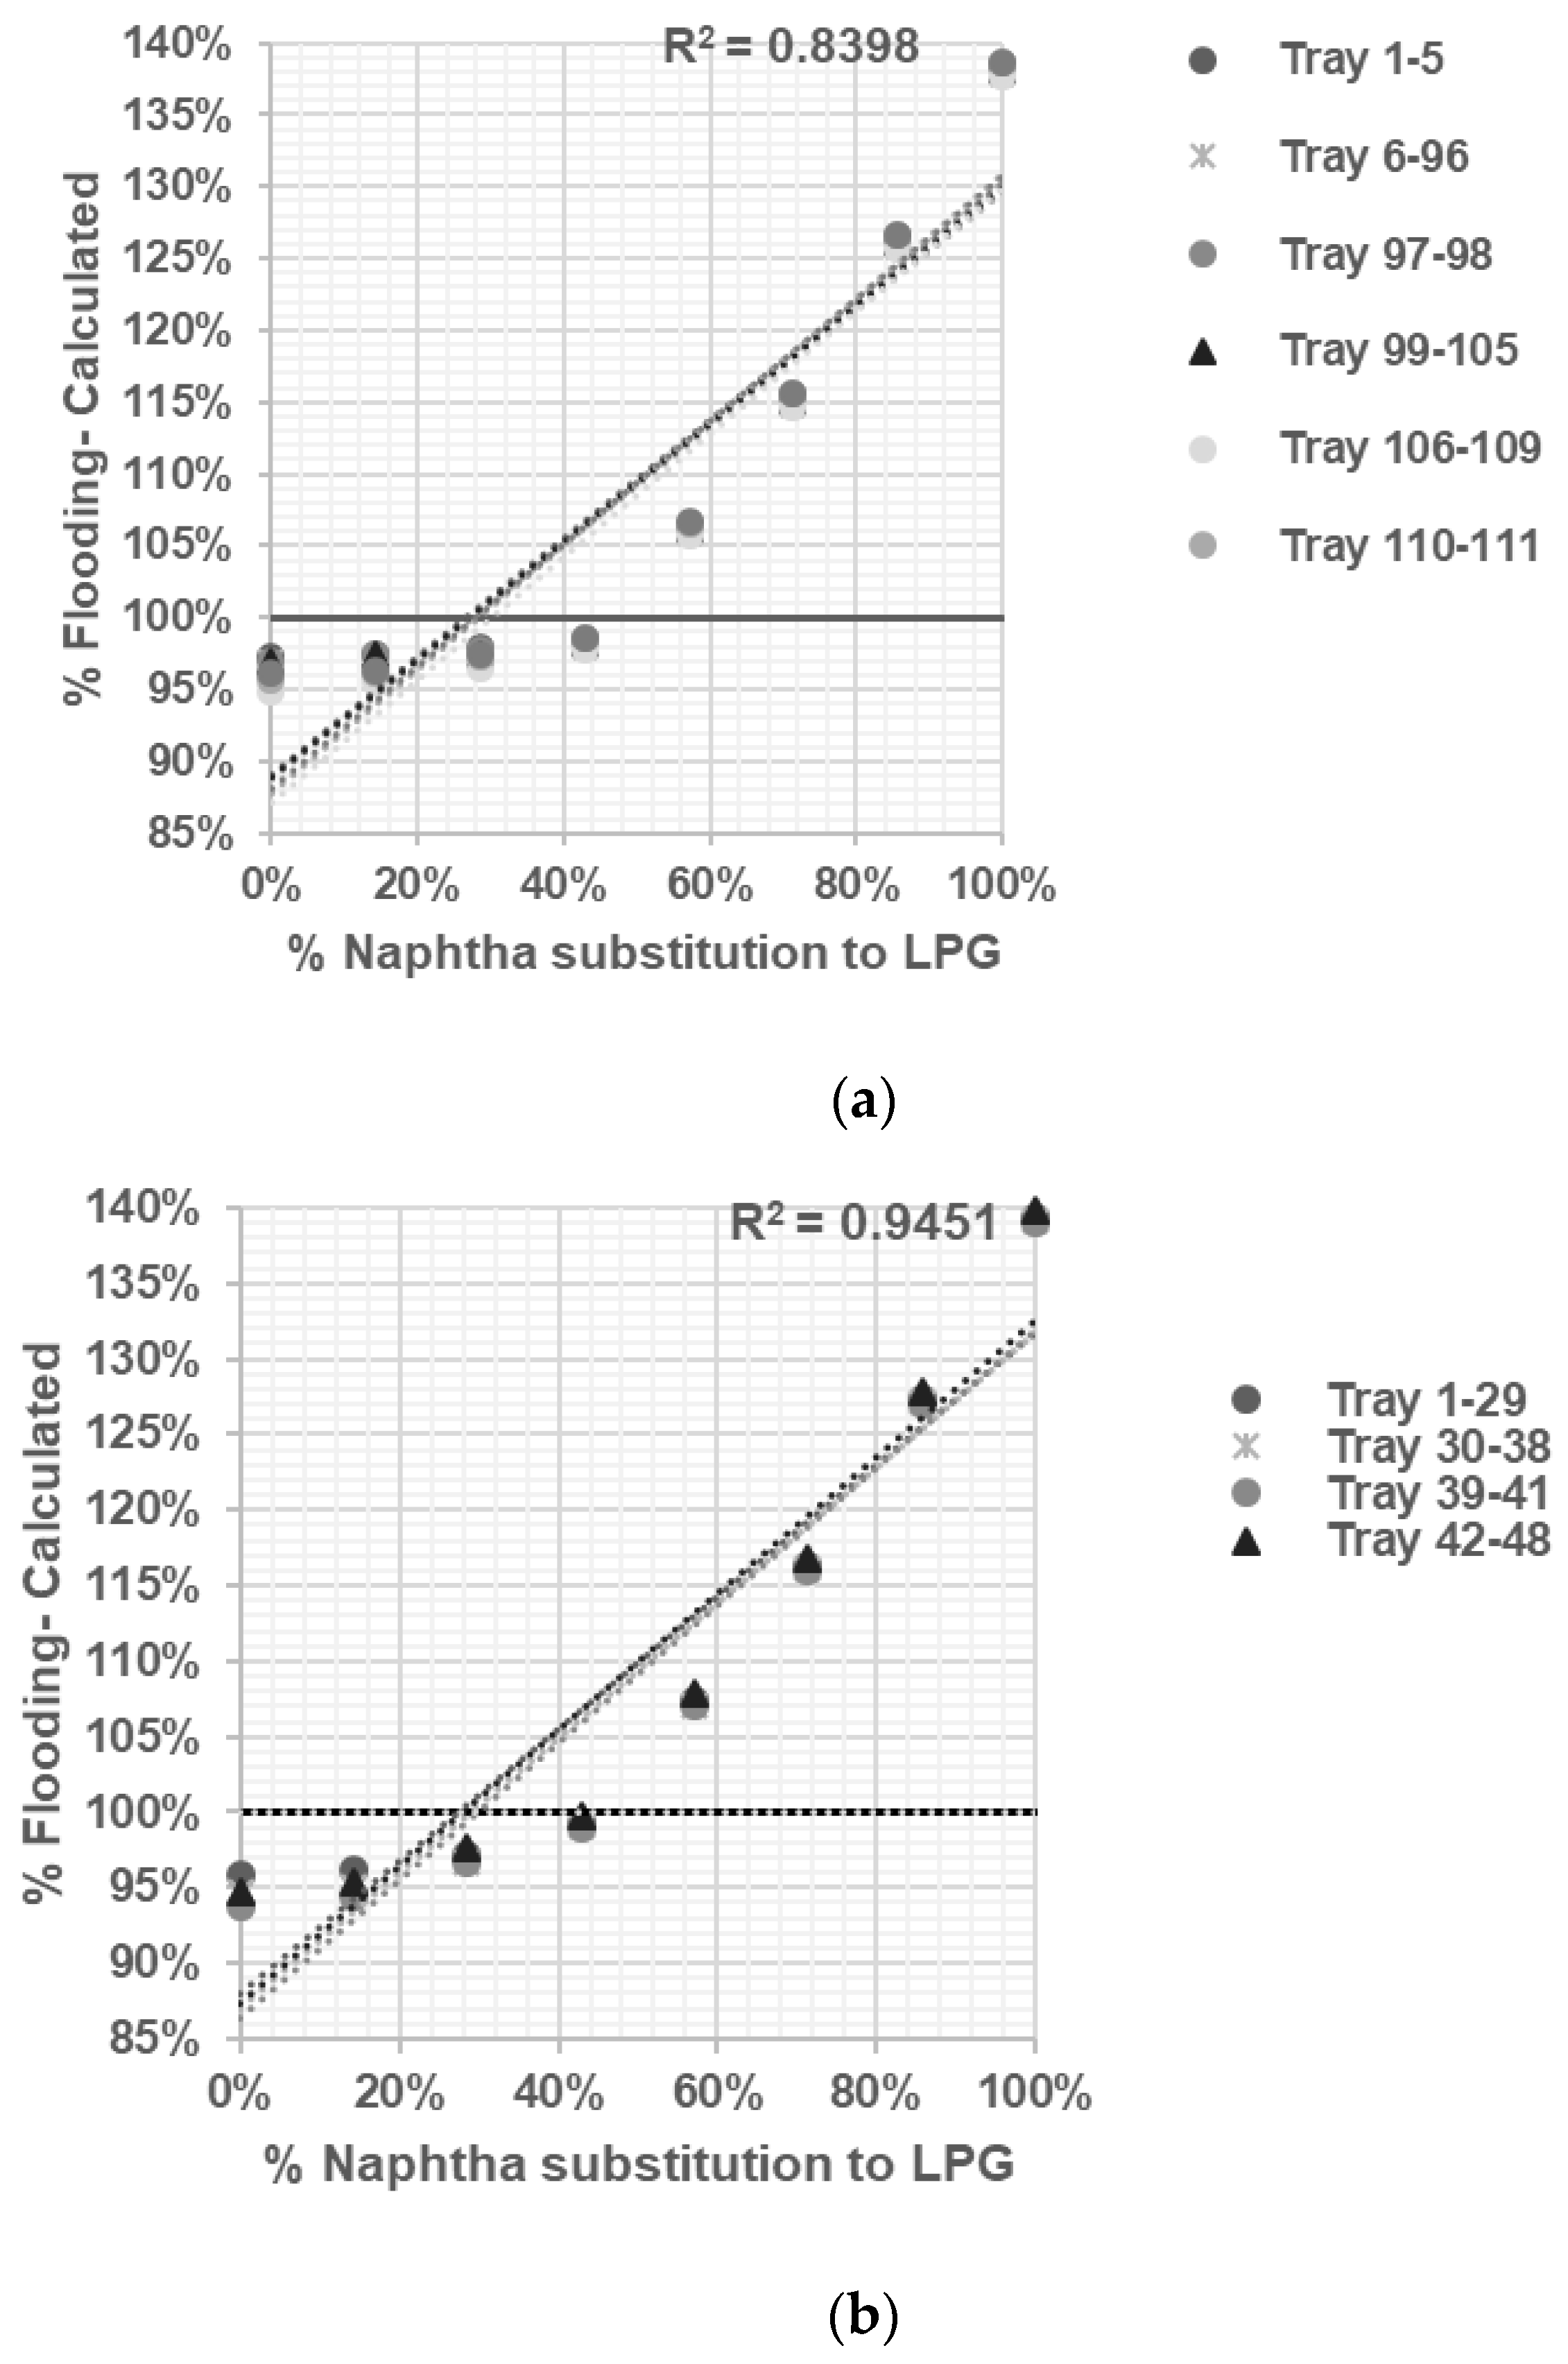
  • Deethanizer: A distillation column with 177 sieve trays is used to separate C2 compounds (the top product) from C3 compounds and heavier substances (the bottom product). It operates at a pressure of 21.3 kg/cm2, with top side and bottom side temperatures of −23 °C and 66 °C, respectively.
  • Ethylene Fractionator: With 137 sieve trays, this distillation column separates ethylene and ethane. It operates at pressures of 16.48 kg/cm2, with top side and bottom side temperatures of −35 °C and −12 °C, respectively.
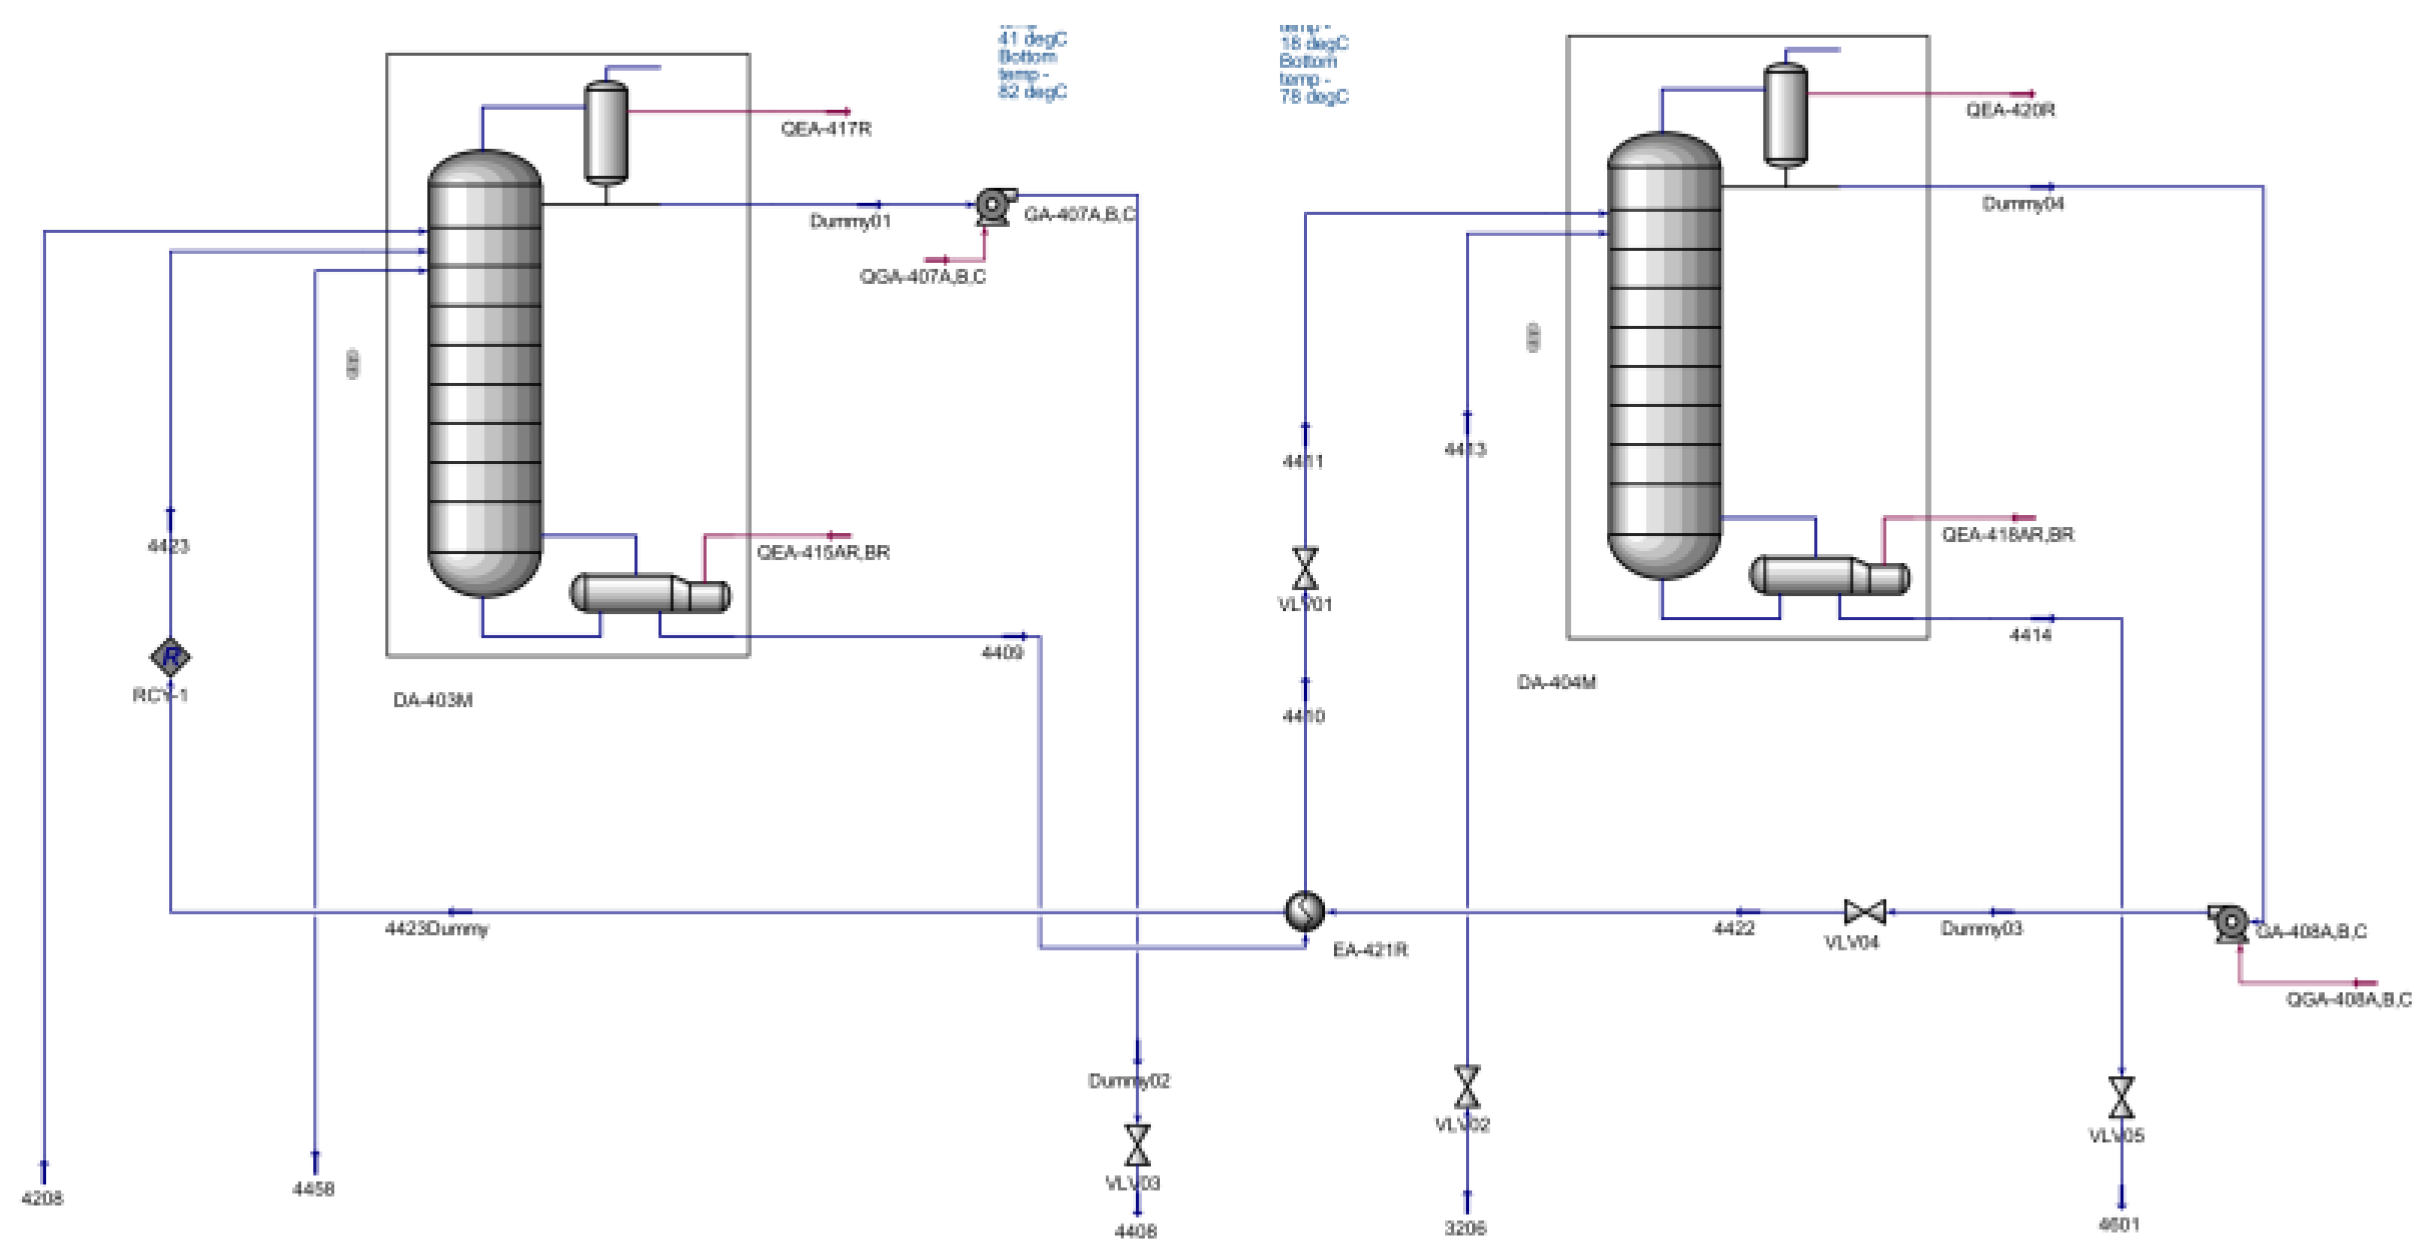
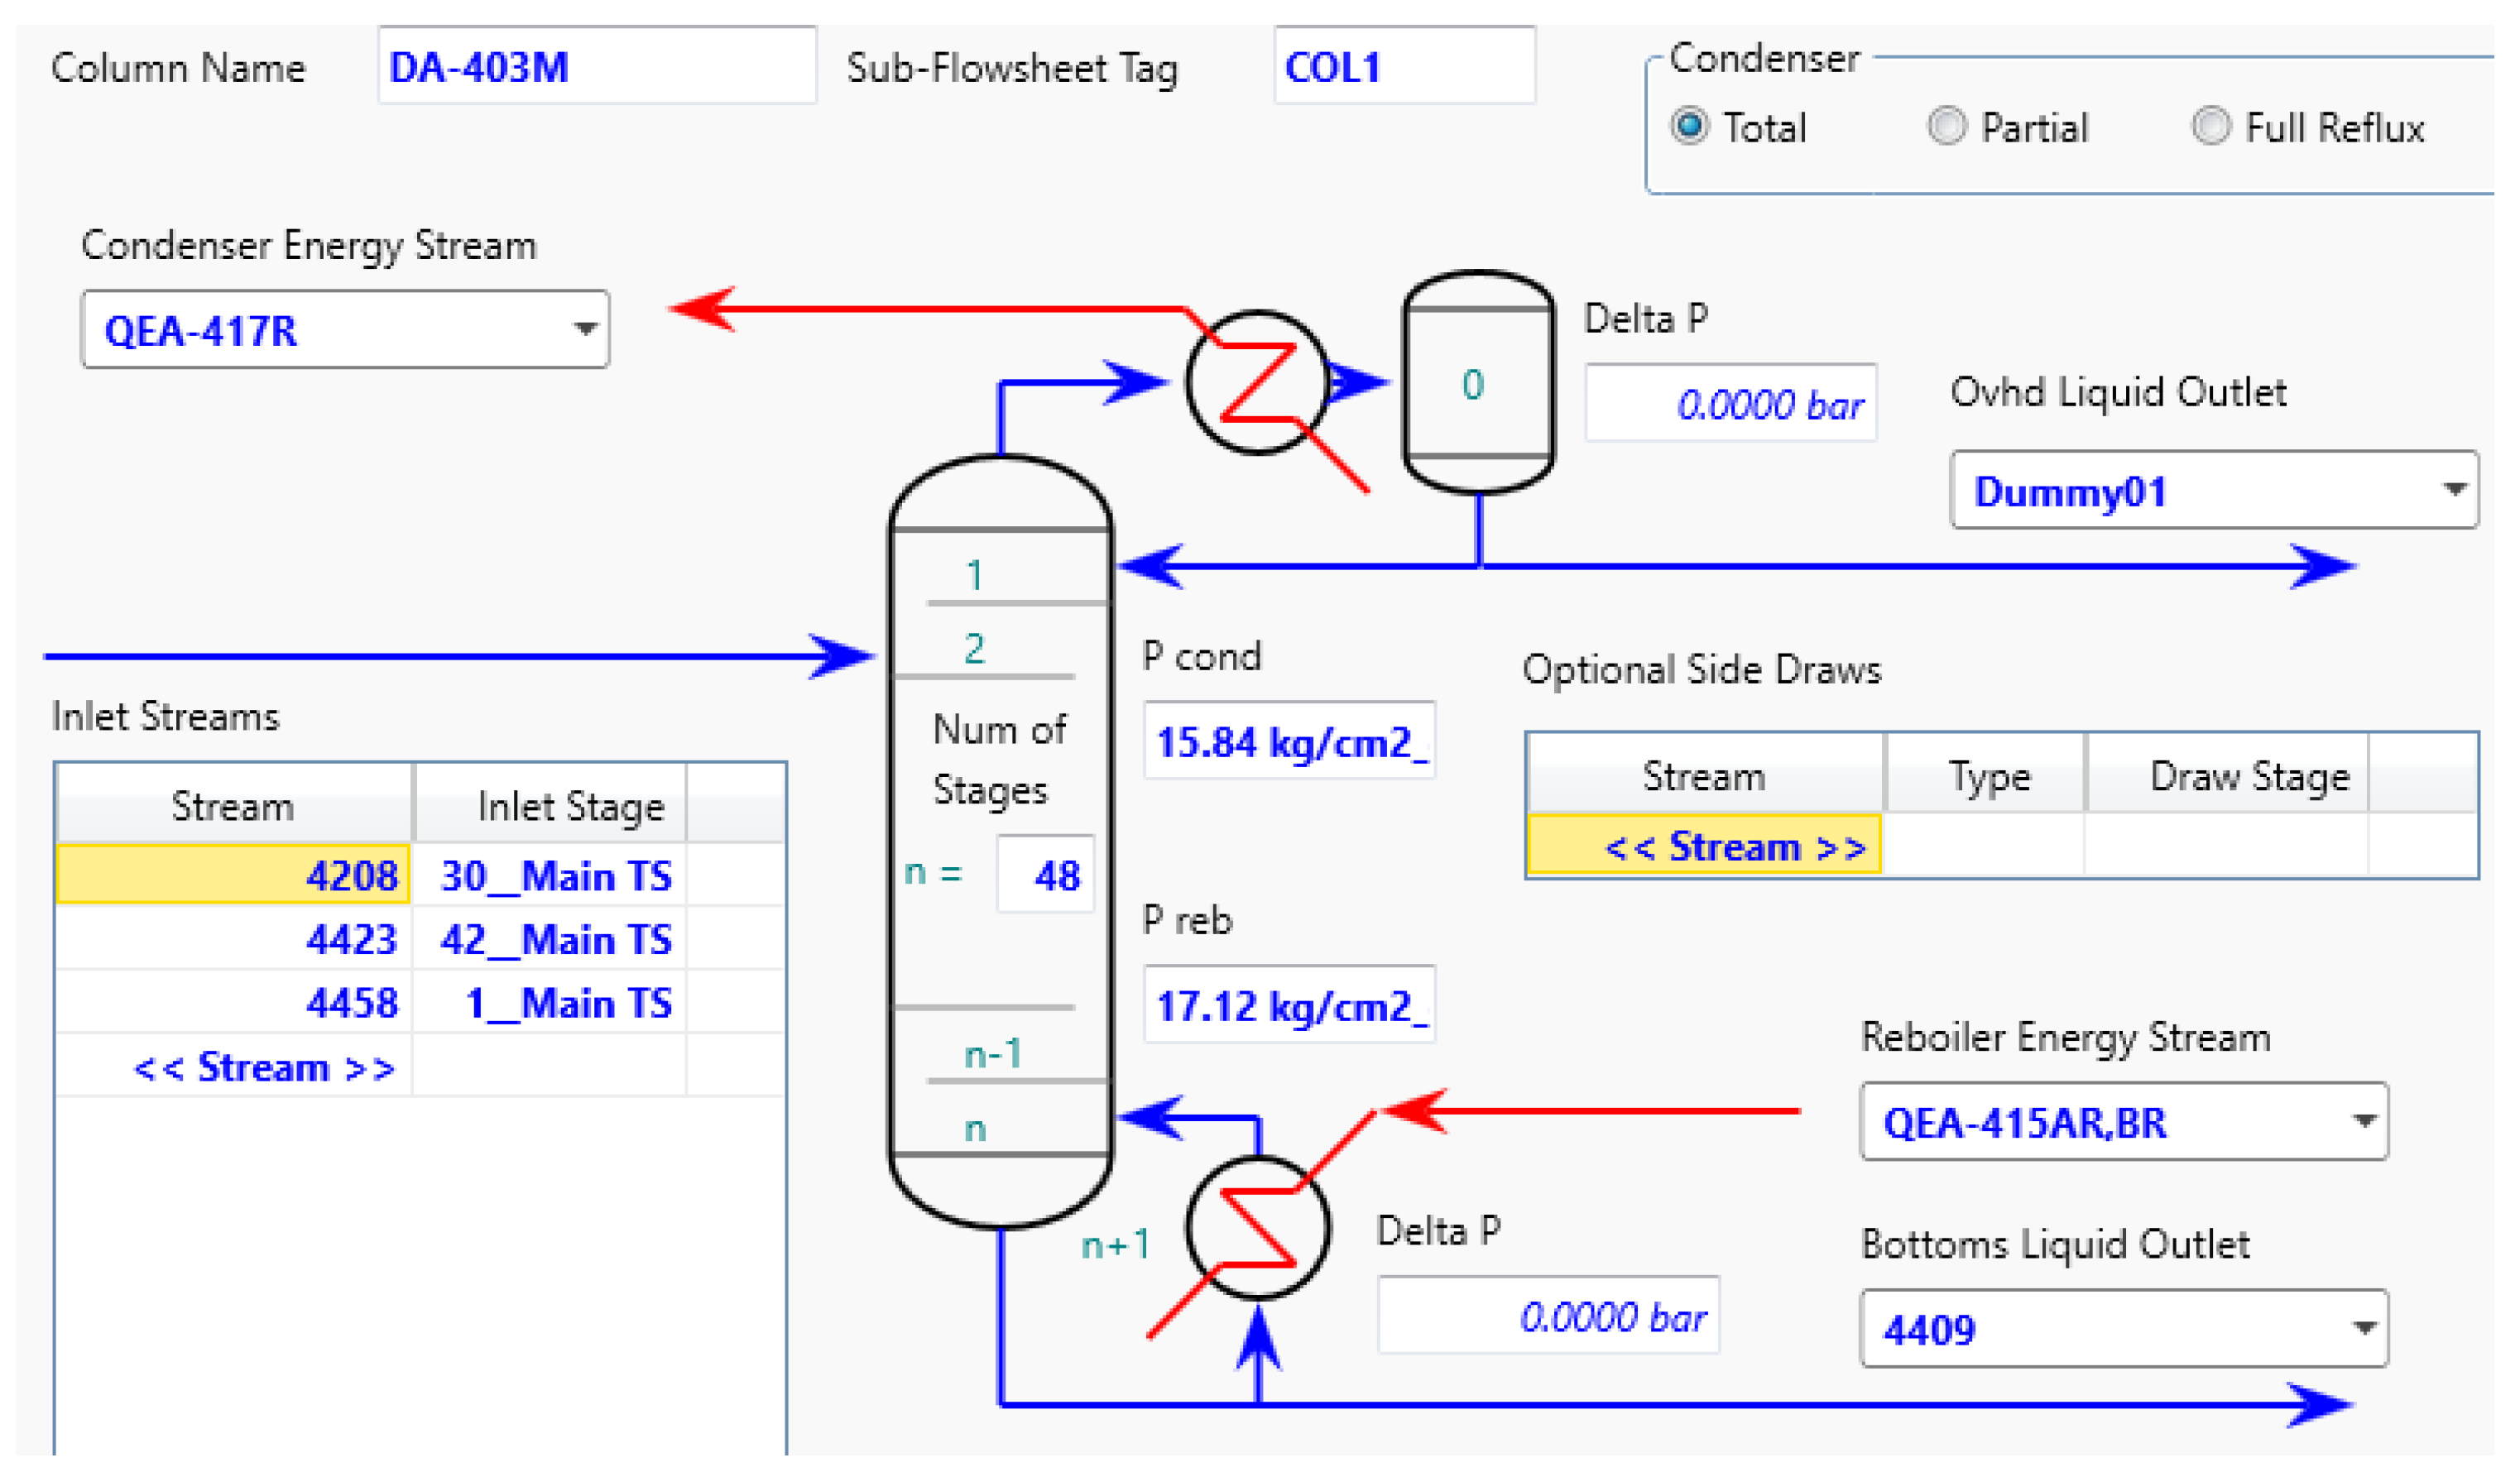
  • Depropanizer No. 1: This distillation column, equipped with 48 sieve trays, separates C3 compounds (the top product) from heavier C4 compounds (the bottom product). It operates at a pressure of 16.7 kg/cm2, with a top side temperature of 44 °C and a bottom side temperature of 82 °C.
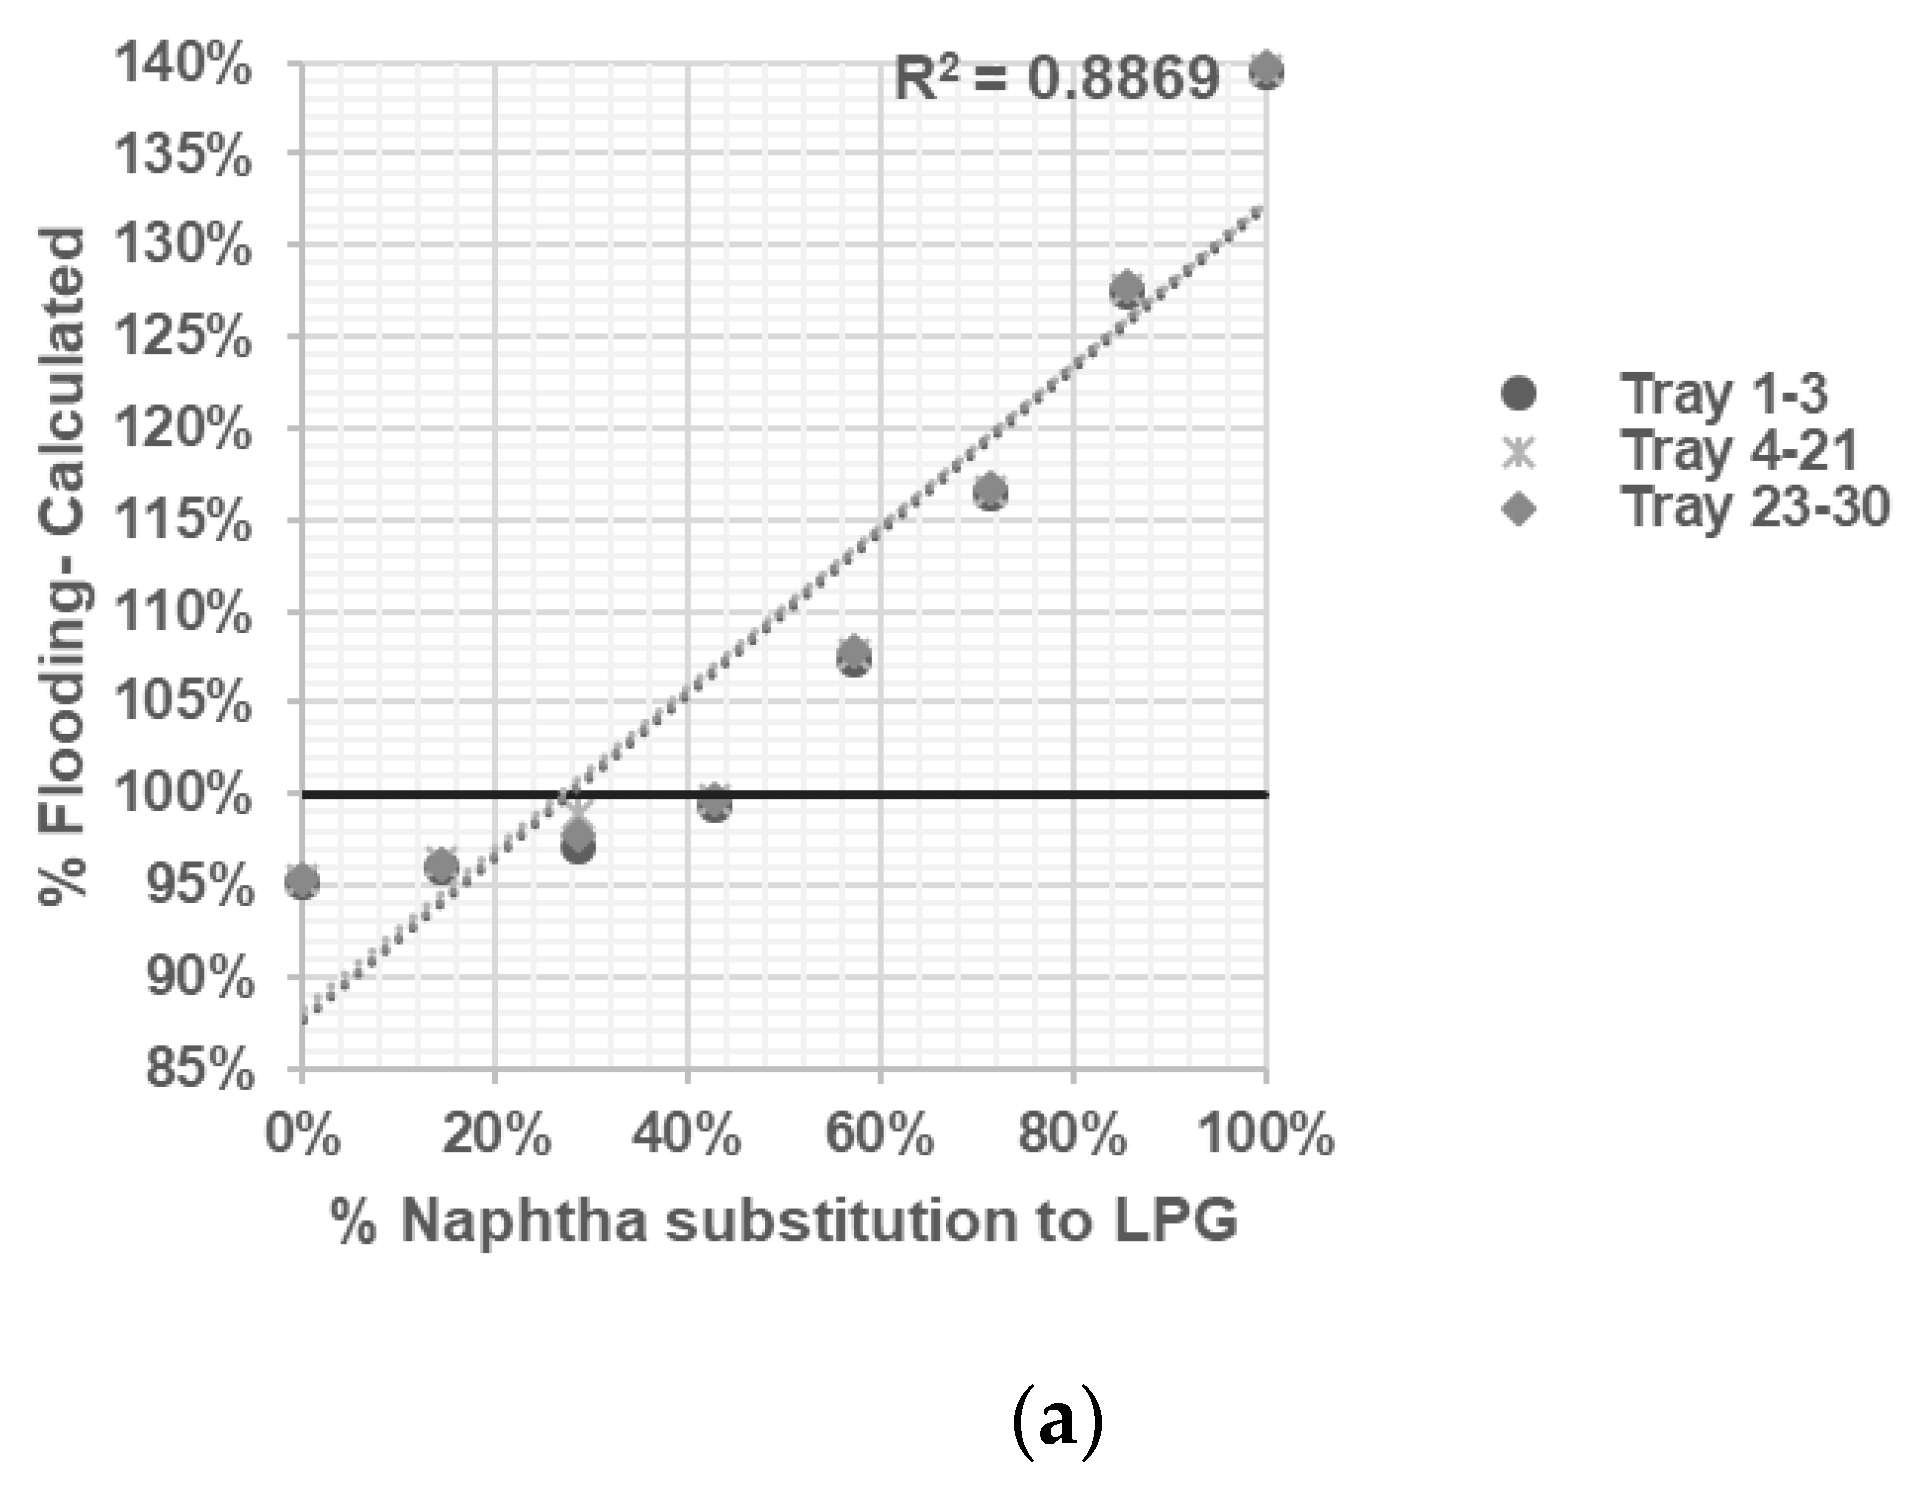
  • Depropanizer No. 2: Using 30 sieve trays, this distillation column separates C3 compounds (the top product) from heavier C4 compounds (the bottom product). It operates at a pressure of 6.1 kg/cm2, with top side and bottom side temperatures of 38.2 °C and 82 °C, respectively.
  • Propylene Fractionator No. 1: With 55 valve trays, this distillation column separates C3 compounds from propane. It operates at a pressure of 19.7 kg/cm2, with top side and bottom side temperatures of 50 °C and 58 °C, respectively.
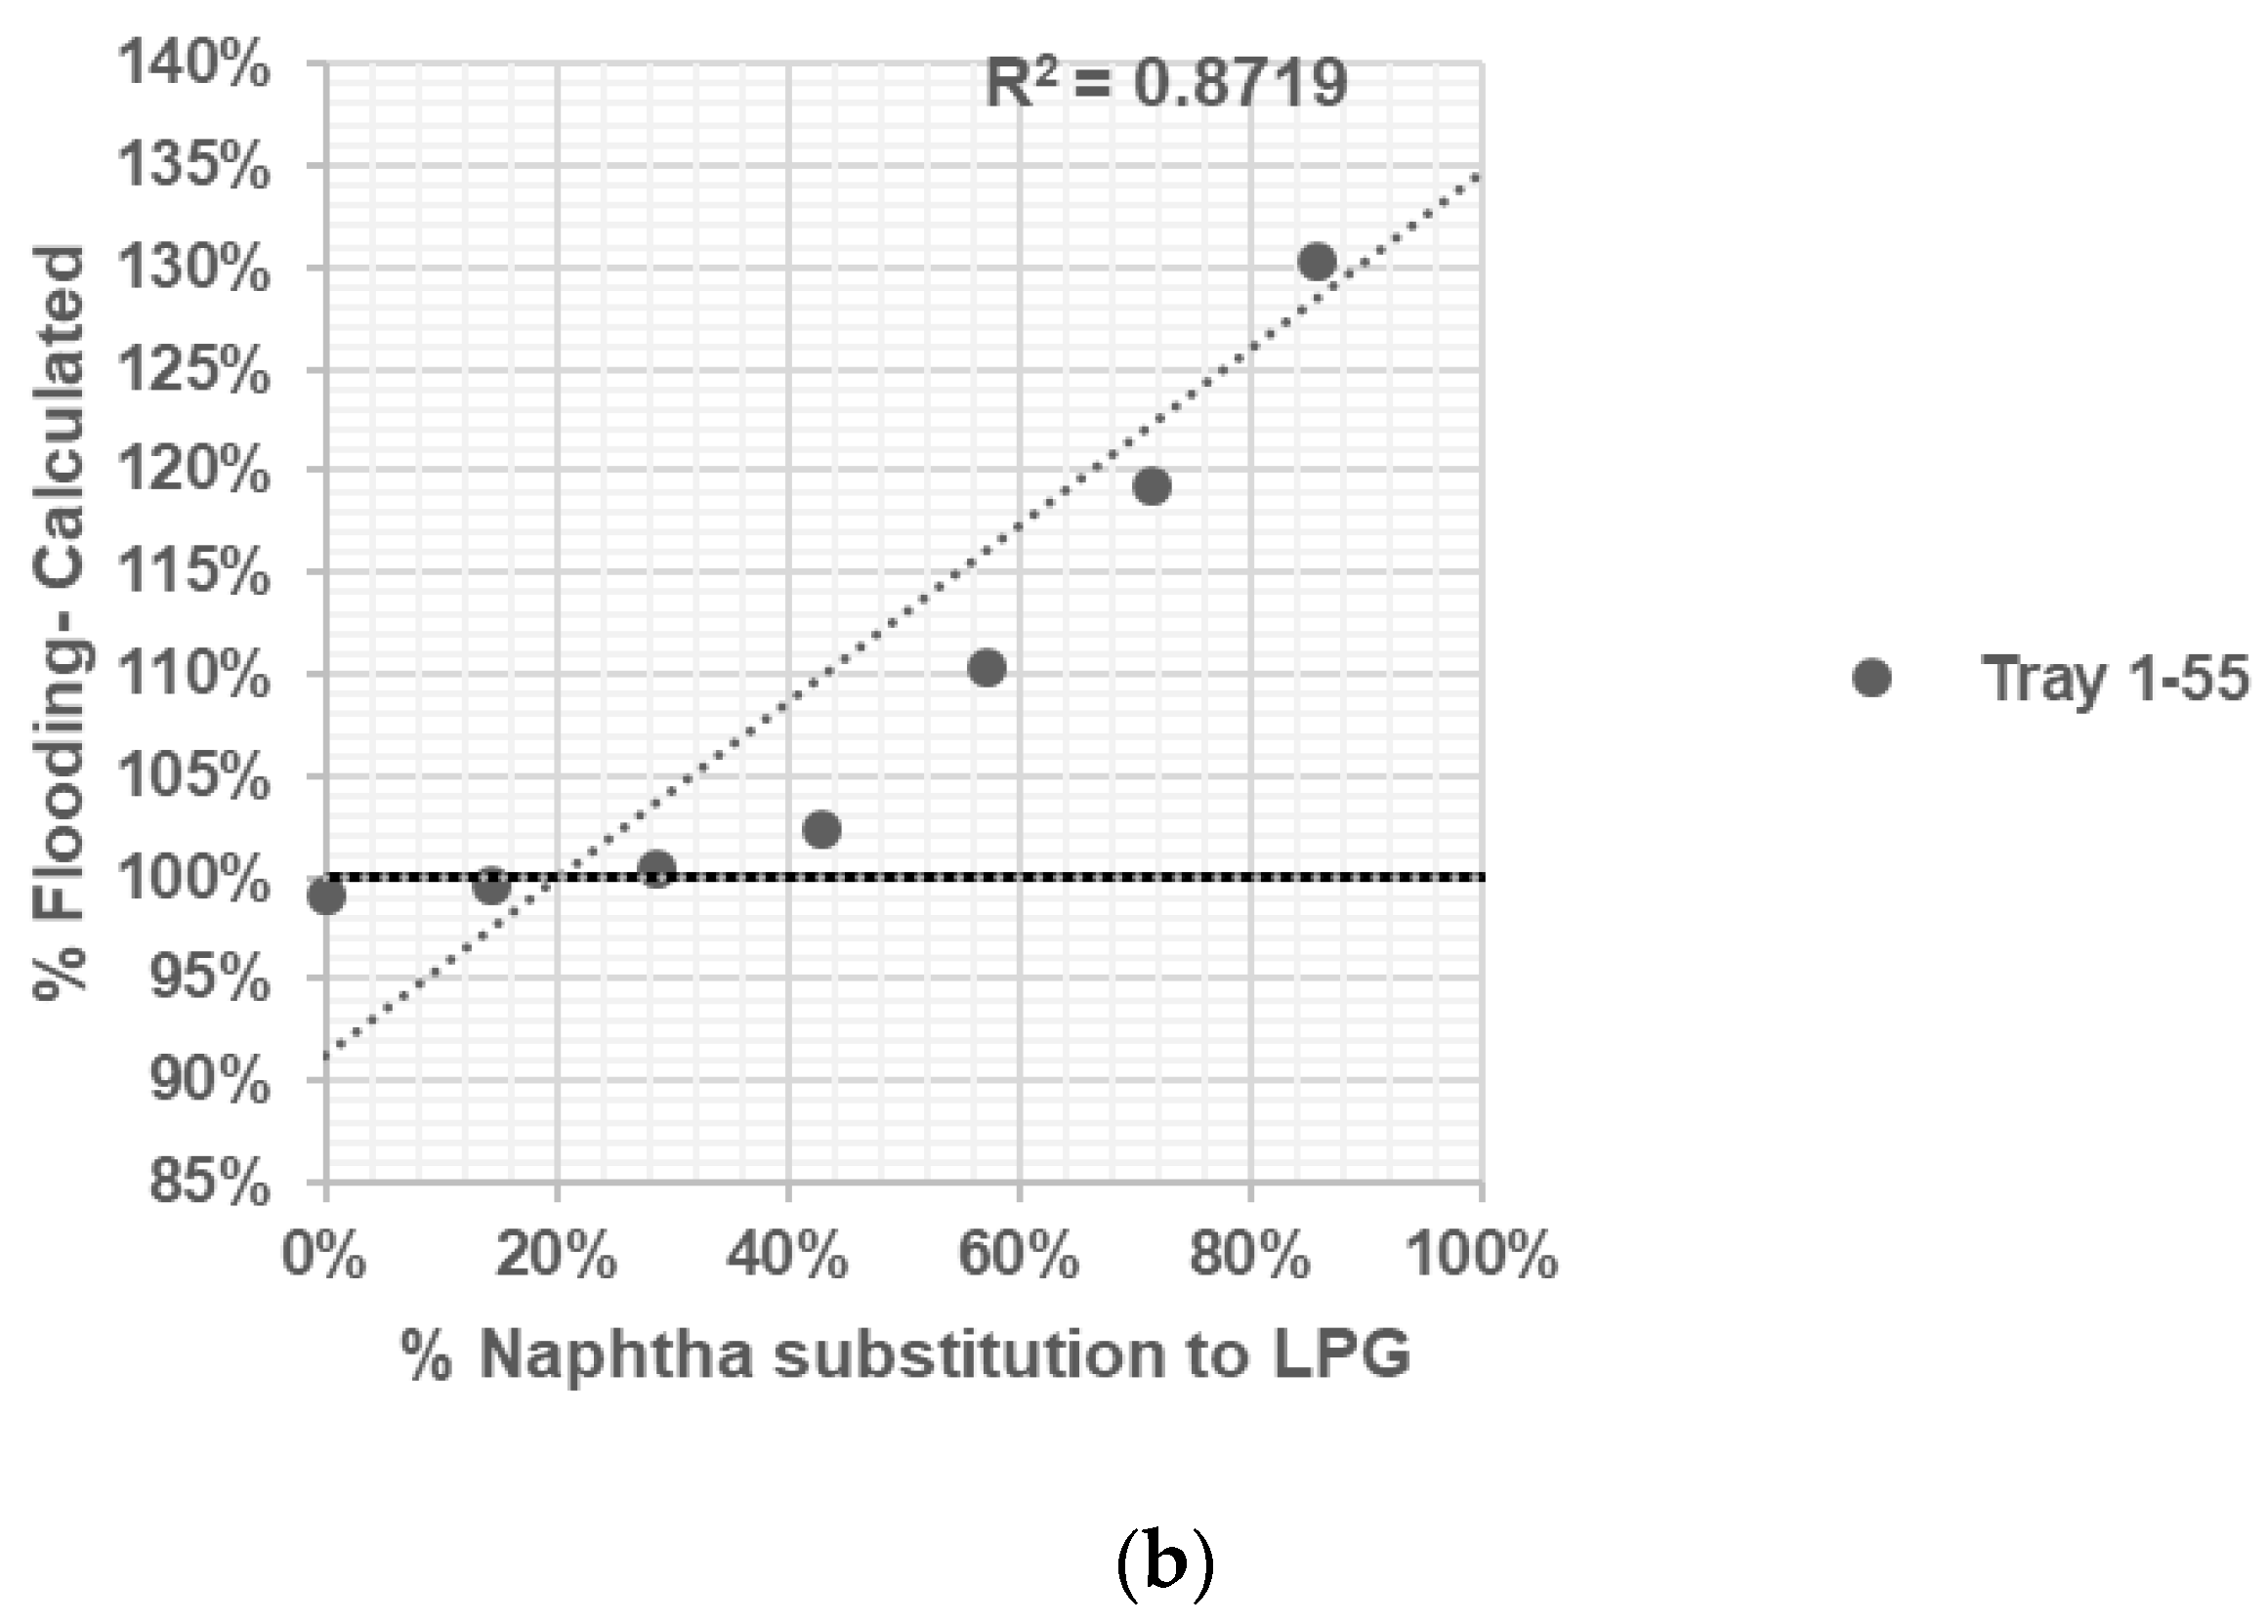
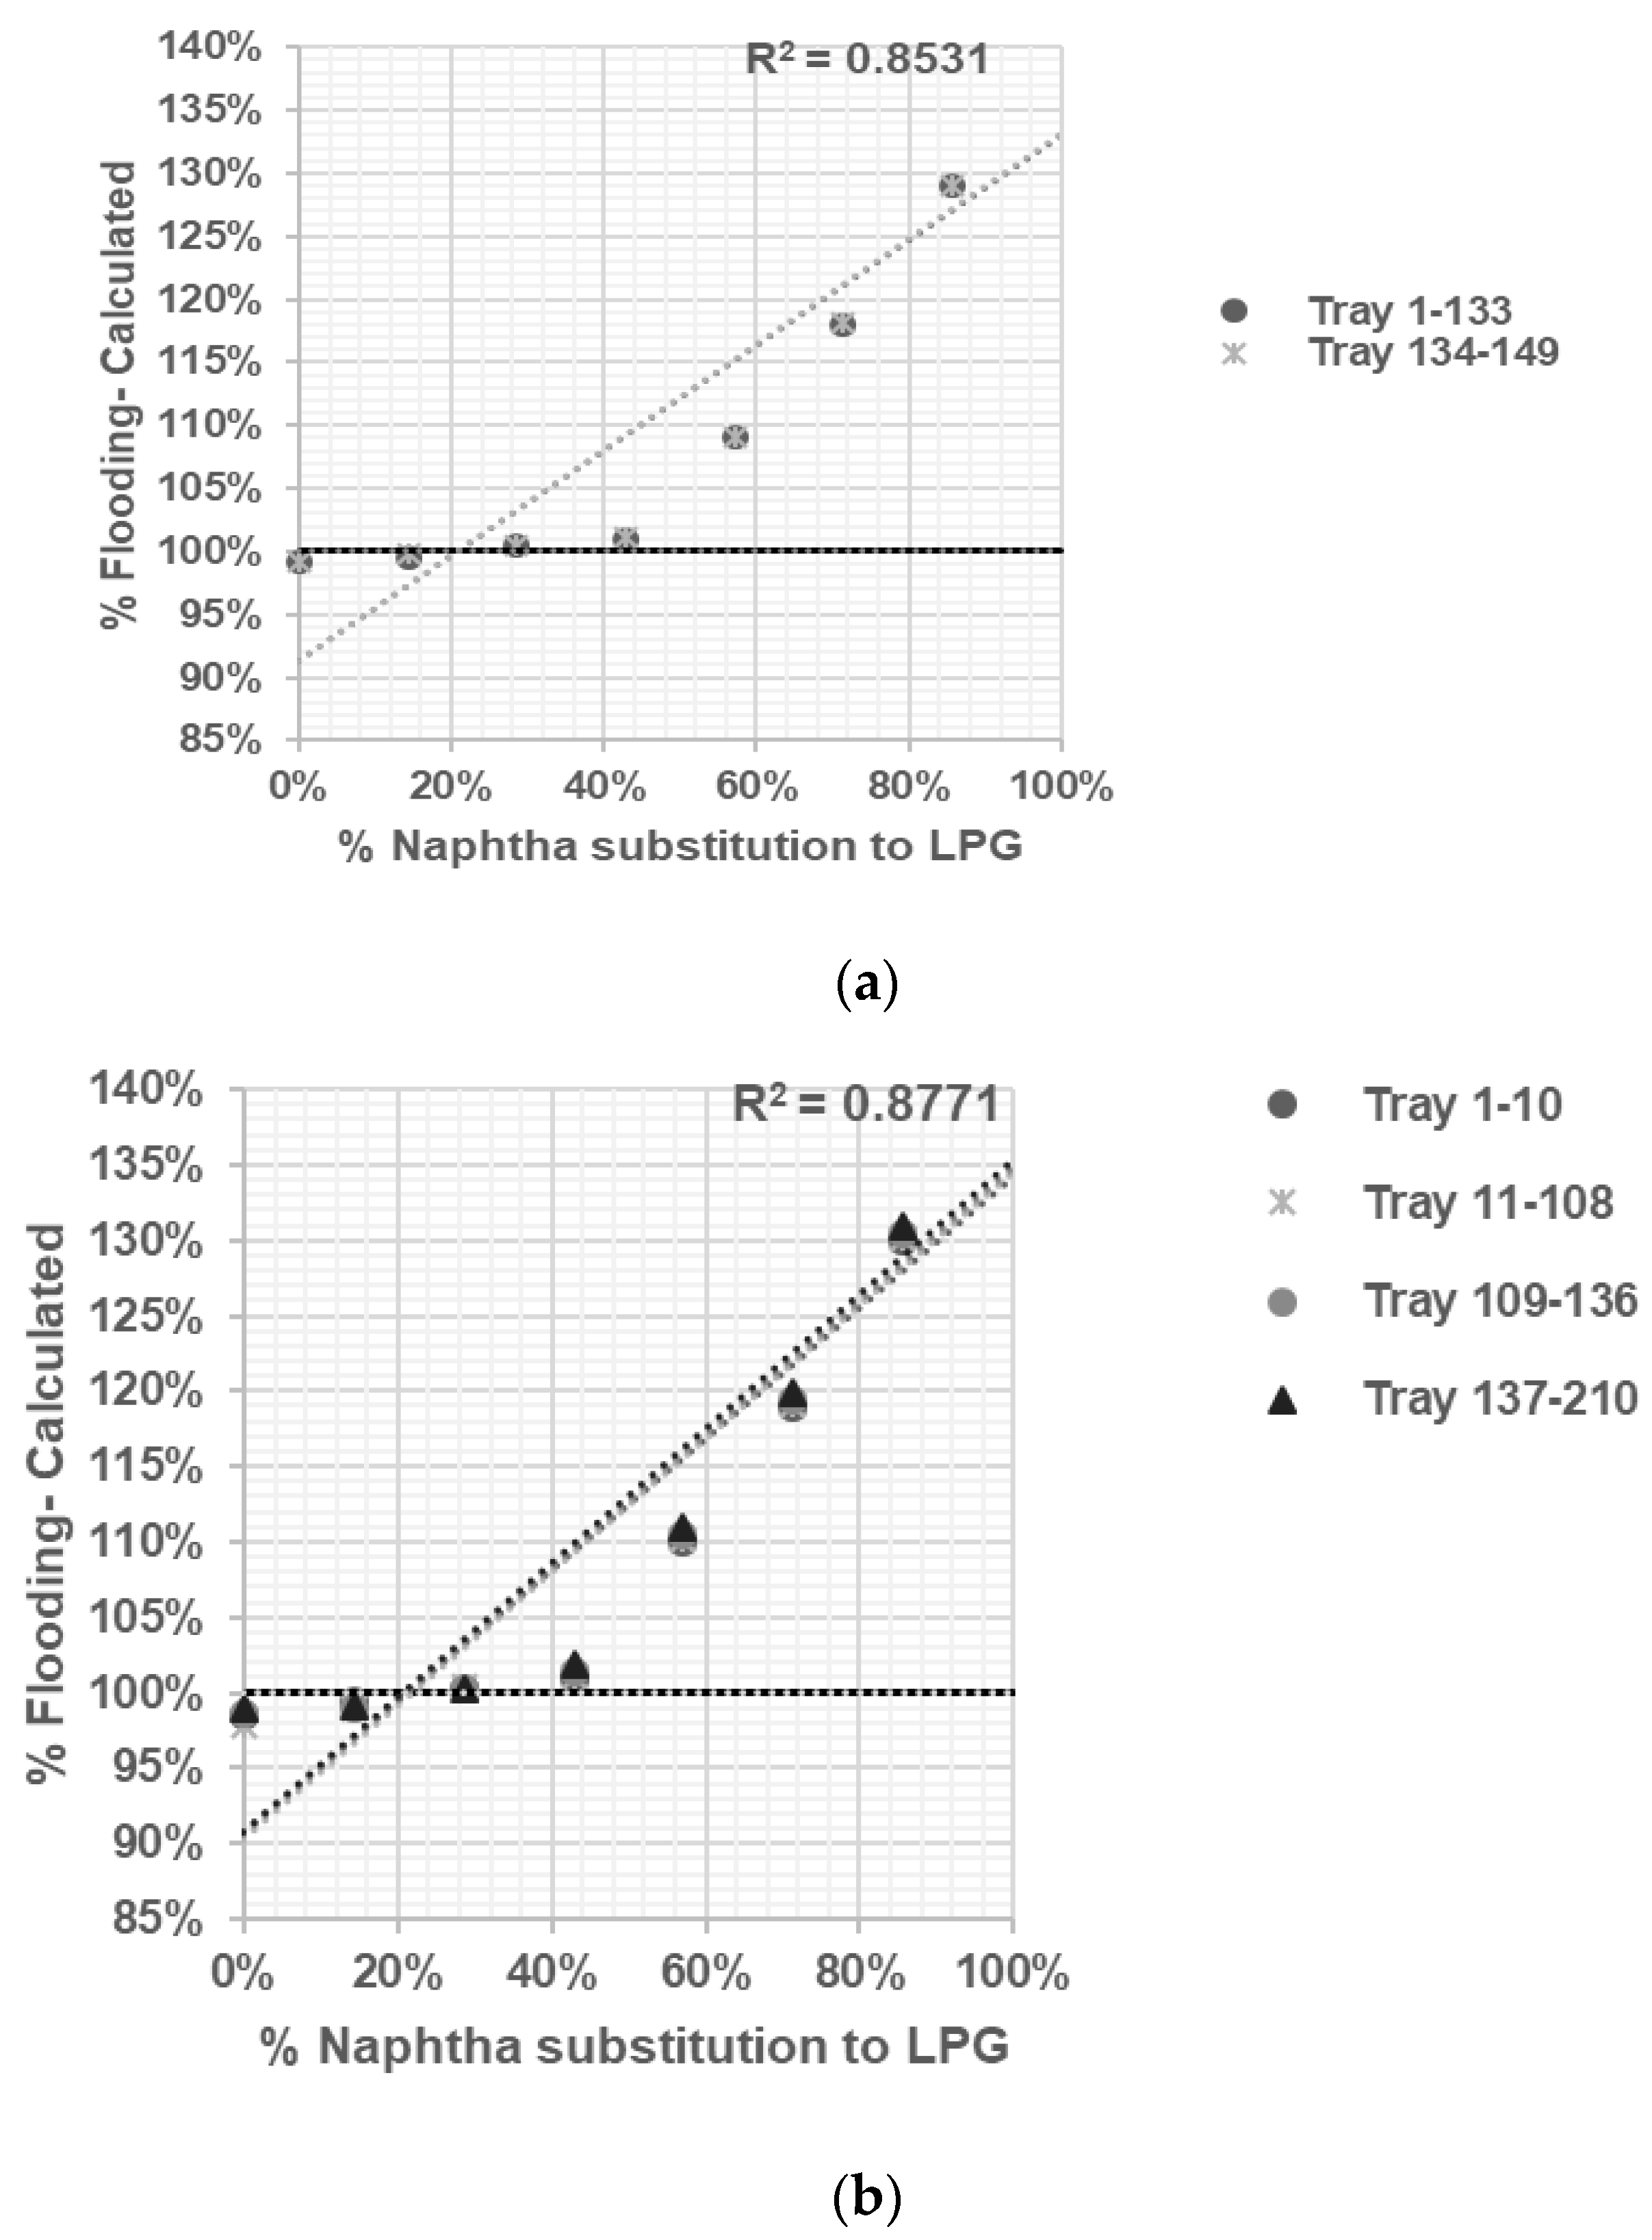
  • Propylene Fractionator No. 2: Propylene and propane are separated using 149 sieve trays in this distillation column, which operates at pressures of 19.2 kg/cm2 and temperatures of 46 °C (top side) and 50 °C (bottom side).
  • Propylene Fractionator No. 3: Propylene and propane are separated using 210 sieve trays in this distillation column, which operates at pressures of 18.3 kg/cm2 and temperatures of 46 °C (top side) and 58 °C (bottom side). This column can be interchanged with Propylene Fractionator No. 1 and No. 2.
  • Debutanizer: This distillation column, equipped with 34 valve trays, separates C4 compounds (the top product) from C5 compounds and heavier substances (the bottom product). It operates at a pressure of 4.34 kg/cm2, with top side and bottom side temperatures of 47 °C and 116 °C, respectively.
A model will be constructed for each distillation column based on actual data and simulated effects on column hydraulics. The objective is to determine the optimal substitution of naphtha with LPG without causing any adverse effects on the distillation column.
When evaluating the performance of distillation columns, the American Institute of Chemical Engineers (AIChE) Equipment Testing Procedures Committee considers the following parameters: ensuring that column performance meets vendor guarantees, identifying capacity bottlenecks, troubleshooting performance issues, determining the operating range of the column, defining optimum operating conditions, developing basic data and correlations for new designs, and calibrating computer simulations for use in optimization, bottleneck analysis, and design studies (CEP AIChE, 2013) [9].
Kister (1992) [3,6,10] explained that flooding can occur due to various mechanisms, including spray entrainment flooding, froth entrainment flooding, downcomer malfunctions, and defects in large diameter columns. Further details on these mechanisms can be found in the cited literature. For sieve trays, the entrainment flooding point can be predicted using the method developed by Kister and Haas [3,6,10], shown in Equation (1). This method has been shown to accurately reproduce a large database of measured flood points within a 15 percent margin.
C SB , flood = 0.0277 ( d h 2   σ ρ L ) 0.125 ρ G ρ G 0.1   T S h c t 0.5  
where, dh = hole diameter, mm; σ = surface tension, mN/m (dyn/cm); ρ G , ρ L = vapor and liquid densities, kg/m3; TS = tray spacing, mm; hct = clear liquid height at froth to spray transition, mm; hct is obtained from the Equation (2):
h c t = h c t ,   H 2 O 996 ρ G L 0.5 1 n
h c t , H2O derived from Equation (3)
h c t ,   H 2 O = 0.497 A f 0.791 d h 0.833 1 + 0.013 Q L 0.59 A f 1.79
n = 0.0091 d h A f
In Equations (3) and (4), Q L   = m3 liquid down flow/(h,m weir length) and A f = fractional hole based on active bubbling area; for example, derived from Equation (5).
A f = A h A a
The simulation tool used in this study is ASPEN HYSYS V.12, which is capable of simulating the thermodynamic characteristics and equilibrium of distillation column separations (Hanley, 2016) [11]. The selection of properties for ASPEN HYSYS simulation is crucial to obtain reliable results (Luyben, 2014) [12]. In this investigation, a fluid program was utilized to replicate the thermodynamic model, with guidance from (Yadav, 2020) [13]. Here, the user must select the method based on the component type or process type. If one does not have an idea of selecting the appropriate method, there is an option called method assistant on the page. Method assistant gives the suitable method based on the component properties or specific area of application.
When developing a robust model, it is important to carefully choose the dependent and independent variables (Shinskey, 1991) [14]. In this study, the independent variable is the LPG feed flow, while the dependent variables are the naphtha composition and LPG composition. The simulation model should be evaluated by adjusting tray efficiency to minimize the percentage error, and plant data should be used to validate the simulation against actual conditions (Loshchev, 2010) [15].

2. Data Input and Methods

2.1. Data Input

The simulation is based on the following data:
  • Distillation column data sheets, which provide information about the geometry of each column.
  • Actual operating conditions of each distillation column, including pressure, temperature, flow rate, and composition. These operating conditions are derived from actual plant data.
  • Naphtha composition, which serves as the basis for the study.
The naphtha feed composition used in the study is presented in Table 1.
Table 1 shows the component composition in the naphtha feed based on lab sampling results. The components are categorized based on the number of carbons present in each compound. The composition is given in weight percentages (% wt).
d.
Naphtha flow rate basis for study.
To produce 100 t/h of ethylene product, the naphtha flow rate used as the basis for the study, according to actual plant conditions, is 252 t/h. This flow rate is achieved by operating 7 furnaces with naphtha feed.
e.
Feed composition of LPG feed for substitute naphtha use for study.
The LPG feed composition used in the study is presented in Table 2.
Table 2 shows the corresponding chemical compounds and their respective composition in the LPG feed, based on laboratory sampling results.
f.
LPG flow rate basis for study.
The LPG flow rate basis for the study, depending on the number of furnaces run with LPG feed as a substitution for naphtha feed, is shown in Table 3. The process plant under investigation comprises seven furnaces, each with a maximum capacity of 36 t/h. The percentage substitution of LPG furnaces for naphtha furnaces can be calculated using Equation (6):
%   Substitution   of   LPG   to   naphtha = flowrate   of   LPG   cracking   t / h 36   × 7   t / h × 100 %
Table 3 shows the flow rates of naphtha and LPG feed based on the number of furnaces running with LPG feed as a substitution for naphtha feed. The flow rates are given in tons per hour (t/h). The last column represents the percentage of LPG substitution to naphtha.

2.2. Methods

2.2.1. Theory

The Kister and Haas method, along with the Fair’s correlation method, are used to estimate the flood capacity of the distillation column. These methods take into account various factors such as column geometry, fluid properties, and operating conditions to predict the flood point. The net area of the column is considered in the flood calculation.
Kister and Haas gave a correlation which is said to reproduce a large database of measured flood points to within ±15 percent. CSB, flood is based on the net area.
By using Equation (2) and obtaining the necessary parameters, such as the net area and hydrostatic head Equation (5), hct was subsequently obtained from Equation (3) and can be applied to calculate the percentage flood for each distillation column. This percentage indicates the extent to which the column is operating at or near its flood capacity, as calculated in Equation (7). It is important to note that the accuracy of these predictions may vary, and it is recommended to validate the results against actual plant data to ensure reliability.
%   flood = 100   ×   C S B C S B d e r a t e d

2.2.2. Fluid Package Selection

The selection of a suitable fluid package in ASPEN HYSYS plays a crucial role in accurately simulating the thermodynamic behavior and equilibrium of the system under investigation. The fluid package, or thermodynamic model, serves as the foundation for calculating properties such as phase behavior, heat capacity, enthalpy, and vapor-liquid equilibrium.
In the context of this journal publication, the fluid package selection process was of particular importance. It involved replicating the thermodynamic model using a fluid program, guided by the work of Yadav (2020) [13]. The choice of fluid package depends on the specific requirements of the components involved in the separation process or the particular application area.
To assist users in selecting an appropriate fluid package, ASPEN HYSYS provides a method assistant tool. This tool aids users in identifying the most suitable method based on component properties or the specific application area. By utilizing the method assistant, users without prior knowledge or expertise in fluid package selection can make informed choices to ensure reliable and accurate simulation results.
By addressing the significance of fluid package selection and highlighting the availability of the method assistant tool, this journal publication emphasizes the importance of choosing the appropriate thermodynamic model to enhance the reliability and accuracy of the simulation results in the context of the distillation cascade model being studied. A summary of fluid package selection from the method assistant tool for each distillation column under study is shown in Table 4.
The selection of the Fluid Package in ASPEN HYSYS for each column was based on the fluid properties outlined in Table 4 and the guidelines provided by Hysys [11].

2.2.3. Model Development

Based on the provided assumptions, the model development for the distillation cascade in the olefins plant aims to achieve the separation of components to obtain pure products. Here is a summary of the assumptions [16,17]:
(a)
Ideal solution: Both vapor and liquid phases are assumed to be ideal solutions, and constant average relative volatilities are considered. This assumption simplifies the thermodynamic calculations involved in the separation process.
(b)
Condenser and operating conditions: The column top temperature is estimated based on the assumed condenser operating pressure. The feed and reflux streams are assumed to be at their dew point and bubble point, respectively. A total condenser is assumed for the reflux condenser.
(c)
Constant molal overflow: The assumption of constant molal overflow simplifies the calculation of liquid and vapor flows in the column.
(d)
Stage efficiency: The stages in the column are initially assumed to be 100% efficient with respect to mass transfer. However, adjustments may be made to match the simulation results with actual plant conditions.
(e)
Pressure drop and reboiler temperature: The pressure drop through the tower is calculated based on the sieve tray characteristics. The temperature of the reboiler is estimated based on the tower bottom pressure.
(f)
Stream configuration: The distillation column is assumed to have only the feed, distillate, and bottoms streams, without any other side streams.
(g)
Uniform composition: The liquid hold-up in the reboiler, reflux drum, and on each tray of the column is assumed to be well-mixed with uniform composition.
(h)
Negligible dynamics: The dynamics of the piping, reboiler, and condenser are considered negligible, implying that there are no significant time lags in the system. Vapor phase dynamics are neglected as they are much faster compared to the liquid phase.
(i)
Constant liquid hold-ups: The liquid hold-ups are assumed to be constant on each tray, as well as in the reboiler and reflux drums.
(j)
Adiabatic column: The column is assumed to be adiabatic, neglecting any heat release from components. Decay heat is also neglected in this case.
(k)
Actual feed composition: The feed composition to the column is obtained from actual plant operation data, ensuring that the model reflects the real-world conditions.
(l)
The equations for the non-equilibrium state describe liquid and heat accumulation. The equilibrium conditions are only valid at bubble point temperature. Once the bubble point temperature is reached, the equations are switched to the equilibrium state. We assumed that all the vapor entering the stage is condensed until the temperature on each stage reaches the equilibrium state.
Overall, the objective of the distillation cascade model is to accurately simulate the separation process in the olefins plant, allowing for the production of pure products by effectively separating the components. [18] The simulation block under study is depicted in Figure 2, illustrating the configuration of the distillation column in ASPEN HYSYS could be accessed in Supplementary Materials.
The data input stages for the simulation block are illustrated in Figure 3.

2.2.4. Model Validation

The simulation of distillation columns using the rate-based approach involves solving a large and highly non-linear system of algebraic equations [19]. In this research work, the equations are implemented in the ASPEN HYSYS simulation software, which is a process simulator tool. One advantage of using ASPEN HYSYS is the availability of the ASPEN Properties Database, which provides reliable thermodynamic properties for the calculations.
To solve the complex system of equations, good starting values are required. In this work, these values are generated through simulations using a model with lower complexity, specifically the equilibrium stage model. The column can be divided into segments, and different correlations for the process hydraulics are implemented in each segment based on the column internal modeling approach derived from the plant data sheet.
To ensure the simulation results match the actual plant results, calculated parameters for the composition of the top and bottom components are compared. The comparison is performed using the Absolute Percent Error (% error) calculation, as shown in Equation (8). The tray efficiency in the ASPEN HYSYS simulator software is adjusted iteratively to minimize the Absolute Percent Error (AAPE, %).
Absolute   Percent   Error   ( AAPE ,   % ) = 100   ×   | Value Simulation Value Actual | Value Actual
By iteratively adjusting the tray efficiency and minimizing the Absolute Percent Error, the simulation results can be improved to better match the actual plant results, thereby enhancing the accuracy and reliability of the simulation model.

2.2.5. Sensitivity Analysis Substitution of Naphtha to LPG into % Flooding

To determine the maximum percentage of naphtha substitution with LPG without exceeding 100% flooding, a trial-and-error approach can be employed using the simulation model. The simulation model can be run for different percentages of LPG substitution in incremental steps, and the corresponding flooding percentages can be calculated. Table 3 can be used to guide the trial process by specifying the number of furnaces run with LPG feed and the corresponding flow rates of naphtha and LPG. The simulation model will calculate the flooding percentage for each case.
It is important to note that the simulation should be limited to ensure that the flooding percentage does not exceed 100%. Flooding occurs when the liquid flow rate in the column exceeds its capacity to separate the components effectively, resulting in reduced separation efficiency and potential operational issues. Exceeding 100% flooding can lead to severe flooding conditions and loss of column performance.
Therefore, during the trial process, the LPG substitution percentage should be monitored to ensure it does not exceed the maximum allowable value that would result in 100% flooding. By carefully selecting the substitution percentages and evaluating the corresponding flooding percentages, an optimal point can be determined where the desired naphtha substitution is achieved without exceeding the flooding limit [6,8].

2.2.6. Economic Calculation

To calculate the benefit of feed substitution from naphtha to LPG, the Equation (9) can be used. The benefit is determined by considering the product flow rate, product prices, feed flow rates, feed prices, and utilities cost.
Here’s how the calculation can be performed using the provided data from Table 4.

Determine the Relevant Flow Rates

Product flow rate: This is the flow rate of the desired product (e.g., ethylene, propylene, mixed C4, or pygas) obtained from the simulation model.
Naphtha flow rate: This is the initial flow rate of naphtha before substitution, which can be obtained from the plant data or the simulation model.
LPG Flow rate: This is the flow rate of LPG obtained from the simulation model.

Determine the Relevant Prices

Product price: This is the price per ton of the desired product (e.g., ethylene, propylene, mixed C4, or pygas) obtained from the cost reference in Table 4.
Naphtha price: This is the price per ton of naphtha obtained from the cost reference in Table 5.
LPG Price: This is the price per ton of LPG obtained from the cost reference in Table 5.

Determine the Utilities Cost

Utilities Cost: This is the cost per ton of product for utilities (e.g., energy, water, etc.) required for the operation of the distillation column, obtained from the cost reference in Table 5.
Benefit = (Product Flow Rate × Product Price) − [(Naphtha Flow Rate × Naphtha Price) + (LPG Flow Rate × LPG Price)] − Utilities Cost
By plugging in the corresponding values into Equation (8), the benefit of feed substitution from naphtha to LPG can be calculated. The result will represent the economic advantage or savings achieved by substituting naphtha with LPG as the feed in the distillation column.

3. Results and Discussion

3.1. Simulation Matching with Actual Plant Data

Table 5 provides a summary of the assessment of simulation results in ASPEN HYSYS compared to actual plant data, including the efficiencies achieved in each distillation tower. The fluid package used in ASPEN HYSYS was selected based on the guidelines for properties specific to each column under study. The column efficiency was determined through trial and error, following the rule of thumb for distillation column operation. The average absolute percent error (AAPE) was calculated to evaluate the goodness of fit between the simulation and plant data.
Analyzing the efficiencies obtained in each distillation tower (as shown in Table 6), it is evident that they vary across the columns under study. The Demethanizer column achieved an efficiency of 72.87%, while the Deethanizer column had an efficiency of 74.31%. Similarly, the Ethylene Fractionator exhibited an efficiency of 71.92%. It is important to note that the efficiencies were determined through a trial-and-error process, taking into account the specific operational characteristics of each column in order to achieve a minimum error percentage in the simulated column compared with the actual data. These efficiency values highlight the effectiveness of the separation process within the distillation cascade.
In terms of validation, the AAPE values provide an assessment of the agreement between the simulation results and the actual plant data. In this study, the AAPE values for all columns were found to be less than 2%, indicating a good fit between the simulation results and the experimental data. This suggests that the simulation model accurately predicts the behavior of the distillation columns and provides reliable results for the study [20,21].
It is crucial to consider the level of validation achievable through the experimental data, taking into account the obtained error. The AAPE values below 2% indicate a high level of agreement between the simulation and plant data. However, it is important to acknowledge the limitations and uncertainties associated with experimental measurements. Factors such as measurement accuracy, instrumentation, and process variations may contribute to the observed error. Nevertheless, the small magnitude of the AAPE values suggests a favorable level of validation for the simulation results [21].
By discussing the different efficiencies achieved in each distillation tower and considering the level of validation achievable through the experimental data, this journal publication provides a comprehensive evaluation of the simulation results and highlights the reliability of the findings.
Based on the calculation result shown in Table 6, it can be concluded that the model gave a satisfactory result due to AAPE (%) ≤ 2% [6,9].

3.2. Sensitivity Anaysis

After the reliable model was developed and tested, sensitivity analysis was conducted to determine the correlation between % flooding based on Equations (1)–(6) with % naphtha substitution to LPG in Table 3.
In the sensitivity analysis, certain variables were held constant while others were subject to variation. The fixed variables include the operational parameters such as column dimensions, feed composition, and operating conditions. The variable of interest is the % of naphtha substitution to LPG, which was systematically varied in order to observe its impact on % flooding.
The R-squared value or root-mean-square values (RMS) measures how close the data are to the fitted regression line. An R-squared value of 1 is an ideal approximation, and 0 indicates that the model explains none of the data points [22].
Based on the calculation results shown in Figure 4, Figure 5, Figure 6 and Figure 7, all graphs have R-squared values greater than 0.7, indicating satisfactory correlation [10,11]. The assessment result of the limitation of % naphtha substitution in each distillation column under study is presented in Table 7.
Figure 4, Figure 5, Figure 6 and Figure 7 illustrate the correlation between the percentage of naphtha substitution to LPG (X-axis) and the calculated % flooding (Y-axis) to determine the maximum limit of naphtha substitution percentage that results in 100% jet flooding, acting as a limitation for each column under study. The maximum percentage of naphtha substitution to LPG and the RMS for each column are presented in Table 7. Figure 4, Figure 5, Figure 6 and Figure 7 could be accessed in Supplementary Materials.
Based on the summary in Table 7, jet flooding limitation in distillation columns under study occurred in Propylene Fractionator No. 2, with maximum naphtha substitution 21.14%. This value, correlated with the norm in the cracking of LPG, will cause a higher yield of propylene [2,3,5] which mainly adds load in Propylene Fractionator No. 2.
The sensitivity analysis allows us to observe how changes in % naphtha substitution to LPG influence the occurrence of flooding in each distillation column. By systematically varying the % naphtha substitution while keeping other variables constant, we can determine the impact and limitations of naphtha substitution on the distillation process.

3.3. Economical Evaluation

Economical evaluation being conducted following Equation (8) with data as per Table 4 and Table 8.
The calculated optimum economic benefit, considering limitation on % flooding from Equations (1)–(6) and Table 8, and using the cost reference from Table 4 by applied calculation based on Equation (8), the resulting optimum benefit is USD 22,771.02 per hour from the reference basis of 100% naphtha feed consumption.

4. Summary and Conclusions

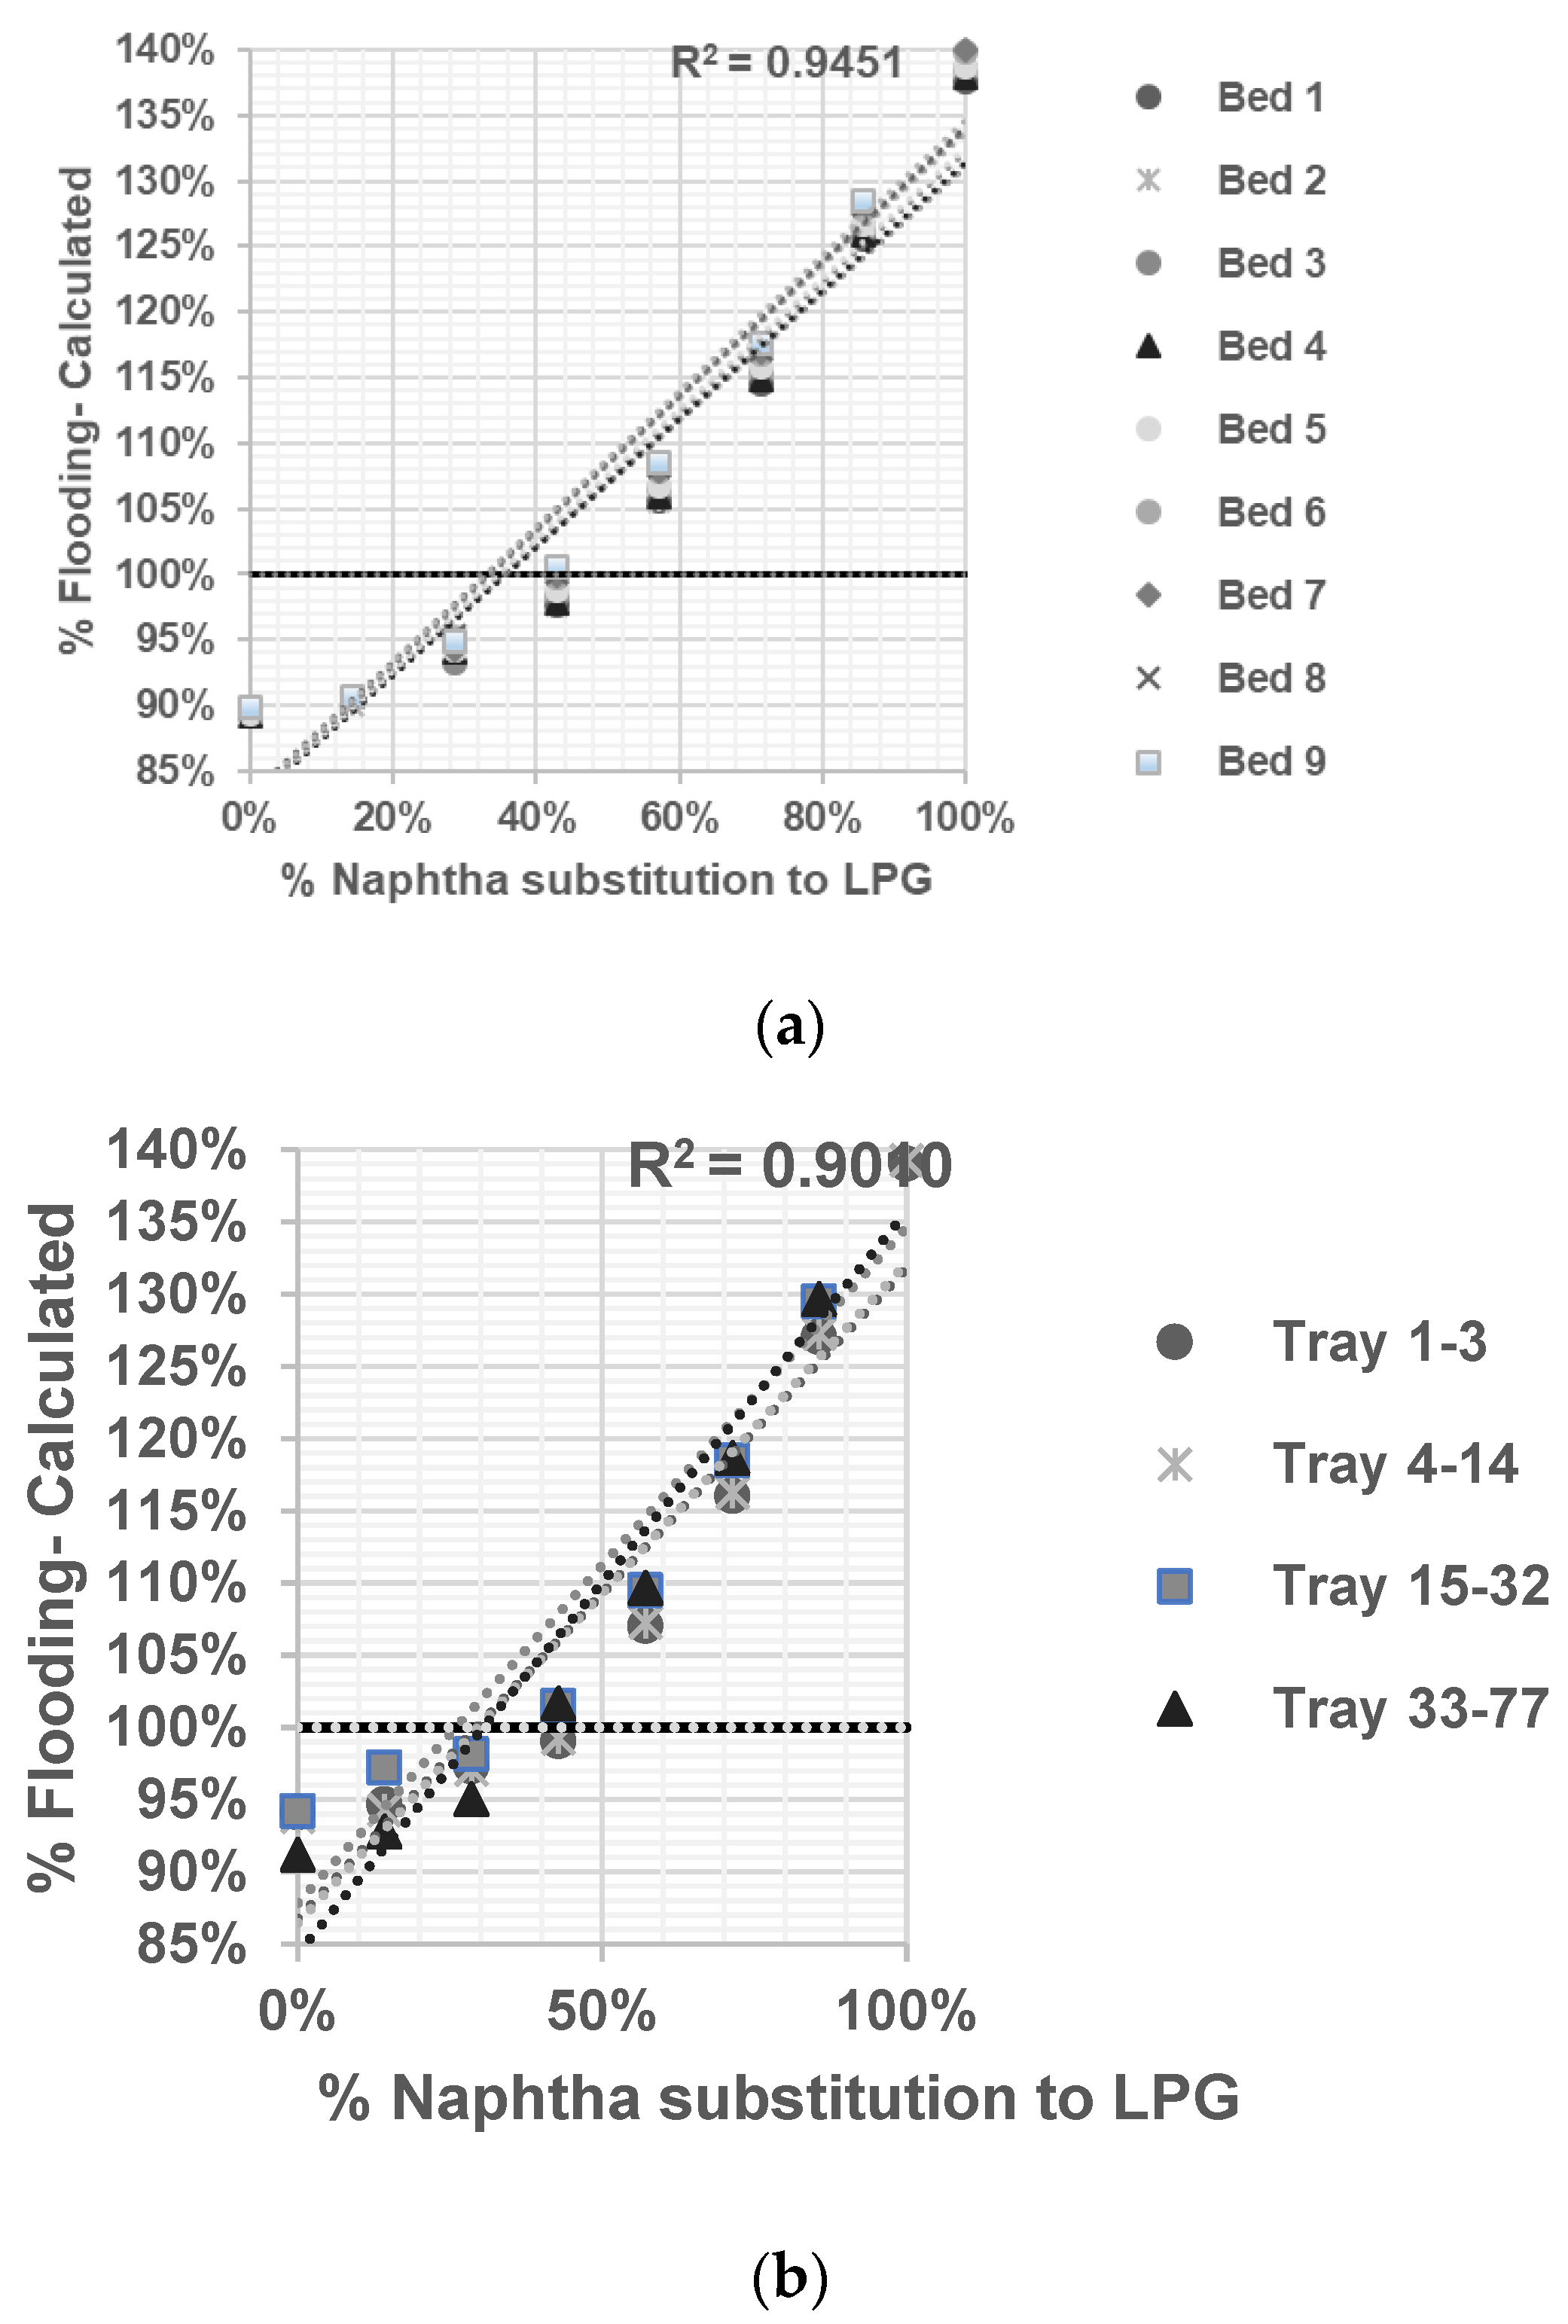
In the present study, ASPEN HYSYS was utilized to conduct sensitivity analysis and assess the ability of the validated model in predicting the flooding phenomenon in distillation columns when substituting naphtha feed with LPG. ASPEN HYSYS is a simulation-based tool that incorporates thermodynamic properties’ packages, allowing for the selection of appropriate packages based on the system’s physical conditions.
By employing modeling, optimization, and prediction techniques within ASPEN HYSYS, the operating conditions and limitations of distillation columns—particularly regarding jet flooding—could be predicted without risking the actual plant conditions. This approach provides a safe and efficient way to explore different scenarios and evaluate the impact of modifications on column internals.
To further enhance the accuracy of the model and ensure its alignment with actual plant conditions, future efforts will be directed towards improving the model’s performance, and conducting thorough assessments of the modification effects on column internals. These ongoing developments will contribute to advancing the understanding and optimization of distillation column operations.

Supplementary Materials

The following supporting information can be downloaded at: https://www.mdpi.com/article/10.3390/chemengineering7040063/s1.

Author Contributions

Conceptualization, A.W. and M.H.; data curation, M.H.; formal analysis, A.W.; funding acquisition, M.H.; methodology, A.W., M.H. and S.S.; project administration, A.W.; software, A.W.; supervision, M.H.; validation, M.H. and S.S.; visualization, A.W.; writing—original draft, A.W.; writing—review and editing, A.W., M.H. and S.S. All authors have read and agreed to the published version of the manuscript.

Funding

This research received no external funding.

Data Availability Statement

The reference pure component properties were sourced from Yaws Handbook of Thermodynamic and Physical Properties of Chemical Compounds [23]. The compiled reference data and ASPEN HYSYS parameters are provided in the Supporting Information accompanying the electronic version of this manuscript. We additionally provided the HYSYS simulation model.

Conflicts of Interest

The authors declare no conflict of interest.

Nomenclature

Greek Symbols
σsurface tension, mN/m (dyn/cm)
ρ vapor and liquid densities, kg/m3
Latin Symbols
QLliquid down flow, m3/h
Affractional hole based on active bubbling area, m2
dhhole diameter, mm
CsbKister and Haas correlation for jet flooding
AAPEAbsolute Percent Error, %
RMSR-squared value or root-squared-mean values

References

  1. Kirk, R.E.; Othmer, D.F.; Mann, C.A. Encyclopedia of Chemical Technology, 4th ed.; John Willey and Sons: New York, NY, USA, 2007; pp. 416–418. [Google Scholar]
  2. Morse, P.M. Business Trends: Asia and Europe Join the Feedstock Evolution with Steam Crackers, Hydrocarbon Processing; Gulf Publishing Company: Houston, TX, USA, 2018; Available online: http://www.hydrocarbonprocessing.com (accessed on 12 March 2021).
  3. Liu, Z.-Y.; Jobson, M. Retrofit Design for Increasing the Processing Capacity of Distillation Columns. Chem. Eng. Res. Des. 2004, 82, 3–9. [Google Scholar] [CrossRef]
  4. Schaschke, C. A Dictionary of Chemical Engineering; Oxford University Press: Oxford, UK, 2014; pp. 816–819. [Google Scholar]
  5. PT Chandra Asri Petrochemical TbK, Production Flow PT Chandra Asri Petrochemical TbK. Available online: https://www.chandra-asri.com/our-business/production-flow (accessed on 12 March 2021).
  6. Fakhroleslam, M.; Sadrameli, S.M. Thermal Cracking of Hydrocarbons for the Production of Light Olefins; A Review on Optimal Process Design, Operation, and Control. Ind. Eng. Chem. Res. 2020, 59, 88–103. [Google Scholar] [CrossRef]
  7. Kister, H.Z. Distillation Design. In Brown and Root Braun; McGraw-Hill Education: New York, NY, USA, 1992. [Google Scholar]
  8. Lummus Technology and CB&I Company. Basic Engineering Package for Chandra Asri Petrochemical ECC Expansion Project. 2012. Available online: https://www.lummustechnology.com/process-technologies/petrochemicals/ethylene-production (accessed on 6 November 2022).
  9. CEP. Evaluating Distillation Column Performance; AIChE Publication: New York, NY, USA, 2013; p. 27. [Google Scholar]
  10. Kessler, D.P.; Wankat, P.C. Correlations for Column Parameters. Chem. Eng. 1988, 71, 71–84. [Google Scholar]
  11. Hanley, B.; Lew, M.; Maniscalco, A.; Mantrala, V.; Dyment, J. Column Analysis in Aspen Plus and Aspen HYSYS: Validation with Experimental and Plant Data; ASPEN Technology Inc.: Bedford, MA, USA, 2016. [Google Scholar]
  12. Luyben, W.L. Distillation Design and Control Using Aspen Simulation; John Wiley & Sons: New York, NY, USA, 2013. [Google Scholar]
  13. Yadav, E.S.; Indiran, T.; Nayak, D.; Kumar, C.A.; Selvakumar, M. Simulation study of distillation column using Aspen plus. Mater. Today Proc. 2020, 48, 330–337. [Google Scholar] [CrossRef]
  14. Shinskey, F.G. Process Control Systems: Application, Design and Tuning; McGraw-Hill, Inc.: New York, NY, USA, 1991. [Google Scholar]
  15. Loshchev, A.G.; Cardona, C.A.; Pisarenko, Y.A. Degrees of freedom analysis for a distillation column. Theor. Found. Chem. Eng. 2010, 44, 686–697. [Google Scholar] [CrossRef]
  16. Qestha, H.J.; Abuyahya, S.; Pal, P.; Banat, F. Sweetening Liquified Petroleum Gas (LPG): Parametric Sensitivity Analysis using Aspen HYSYS. J. Nat. Gas Sci. Eng. 2015, 26, 1011–1017. [Google Scholar] [CrossRef]
  17. Huang, D.; Luo, X.-L. Process Transition Based on Dynamic Optimization with the Case of a Throughput-Fluctuating Ethylene Column. Ind. Eng. Chem. Res. 2018, 57, 6292–6302. [Google Scholar] [CrossRef]
  18. Wood MacKenzie. Ethylene Global Supply Demand Analytics Service. 2019. Available online: https://www.woodmac.com/news/editorial/ethylene-global-supply-demandanalytics-service/ (accessed on 12 March 2021).
  19. Kenig, E.Y.; Górak, A.; Pyhälahti, A.; Jakobsson, K.; Aittamaa, J.; Sundmacher, K. Advanced rate-based simulation tool for reactive distillation. AIChE J. 2004, 50, 322–342. [Google Scholar] [CrossRef] [Green Version]
  20. Masoumi, M.; Shahrokhi, M.; Sadrameli, M.; Towfighi, J. Modeling and Control of a Naphtha Thermal Cracking Pilot Plant. Ind. Eng. Chem. Res. 2006, 45, 3574–3582. [Google Scholar] [CrossRef]
  21. Bruns, B.; Fasel, H.; Grünewald, M.; Riese, J. Development of a Dynamic Modeling Approach to Simulate a Segmented Distillation Column for Flexible Operation. Chemengineering 2021, 5, 66. [Google Scholar] [CrossRef]
  22. “What Is R-Squared?”, Investopedia. Available online: https://www.investopedia.com/terms/r/r-squared.asp (accessed on 6 November 2022).
  23. Yaws, C.L. Yaws’ Handbook of Thermodynamic and Physical Properties of Chemical Compounds; Knovel: New York, NY, USA, 2003; ISBN 978-1-59124-444-8. [Google Scholar]
Figure 1. Olefins plant (PT Chandra Asri, 2021), as indicated in the block diagram product portfolio of olefins plant under study [5].
Chemengineering 07 00063 g001
Figure 2. Simulation block of distillation column under study in ASPEN HYSYS.
Chemengineering 07 00063 g002
Figure 3. Input stages for simulation block under study in ASPEN HYSYS.
Chemengineering 07 00063 g003
Figure 4. Parity plot of % flooding based on Equations (1)–(6) for (a) Demethanizer, and (b) Deethanizer column with % naphtha substitution to LPG in Table 3. The solid line correspondence to regression result and R-squared value is shown in the graph.
Chemengineering 07 00063 g004
Figure 5. Parity Plot of % flooding based on Equations (1)–(6) for (a) Ethylene Fractionator, and (b) Depropanizer No. 1 column with % naphtha substitution to LPG in Table 3. The solid line correspondence to regression result and R-squared value is shown in the graph.
Chemengineering 07 00063 g005
Figure 6. Parity plot of % flooding based on Equations (1)–(6) for (a) Depropanizer No. 2, and (b) Propylene Fractionator No. 1 column with % naphtha substitution to LPG in Table 3. The solid line correspondence to regression result and R-squared value is shown in the graph.
Chemengineering 07 00063 g006aChemengineering 07 00063 g006b
Figure 7. Parity plot of % flooding based on Equations (1)–(6) for (a) Propylene Fractionator No. 2, (b) Propylene Fractionator No. 3, and (c) Debutanizer with % naphtha substitution to LPG in Table 3. The solid line correspondence to regression result and R-squared value is shown in the graph.
Chemengineering 07 00063 g007aChemengineering 07 00063 g007b
Table 1. Feed composition of LPG feed component correspondence for chemical compound in naphtha feed, based on lab sampling results.
Number of CarbonsComposition (% wt)
n-ParaffinsIso-ParaffinsNaphthaleneAromatics
40.222.64
525.2217.944.19
614.8823.412.822.0
71.673.27 0.97
8 0.57
Total41.9947.837.013.17
Table 2. Feed composition of LPG feed component correspondence for chemical compound in LPG feed, based on lab sampling results.
ComponentUnitSpecification
Propane% w.t<1
N-butane% w.t>73
Iso-butane% w.t<23
Table 3. Flow rate LPG feed as naphtha feed substitution based on furnace arrangement.
Number of Furnaces Run with Naphtha FeedNumber of Furnaces Run with LPG FeedFlow Rate of Naphtha (t/h)Flow Rate of LPG (t/h)% Substitution of LPG to Naphtha
7025200.00
612163614.28
521807228.57
4314410842.84
3410814457.12
257218071.40
163621685.68
070252100.00
Table 4. Summary of column under study, Fluid Package in ASPEN HYSYS selected based on guideline of properties in each column under study [11].
ColumnFluid Package in ASPEN HYSYS
DemethanizerUNIQUAC
DeethanizerPeng-Robinson
Ethylene FractionatorPeng-Robinson
Depropanizer No. 1Peng-Robinson
Depropanizer No. 2Peng-Robinson
Propylene Fractionator No. 1SRK-Twu (Soave-Redlich-Kwong)
Propylene Fractionator No. 2SRK-Twu (Soave-Redlich-Kwong)
Propylene Fractionator No. 3SRK-Twu (Soave-Redlich-Kwong)
DebutanizerPeng-Robinson
Table 5. Cost reference for economic calculation, data taken from plant data year 2022 [4].
DescriptionUnitPrice
Naphtha$/ton835
LPG$/ton750
Ethylene$/ton1230
Propylene$/ton1310
Mixed C4$/ton560
Pygas$/ton621
Utilities Cost$/ton product8.9
Table 6. Summary of assessment simulation result in ASPEN HYSYS compare with actual plant data, Fluid Package in ASPEN HYSYS selected based on guideline of properties in each column under study [11], column efficiency as trial result by following rule of thumb in distillation column operating [13], and the average absolute percent error (AAPE) to assess the goodness of fit.
ColumnFluid Package in ASPEN HYSYSColumn Efficiency (%)AAPE (%)
DemethanizerUNIQUAC72.870.81
DeethanizerPeng-Robinson74.310.92
Ethylene FractionatorPeng-Robinson71.920.77
Depropanizer No. 1Peng-Robinson73.140.84
Depropanizer No. 2Peng-Robinson73.190.95
Propylene Fractionator No. 1SRK-Twu (Soave-Redlich-Kwong) 74.150.88
Propylene Fractionator No. 2SRK-Twu (Soave-Redlich-Kwong) 74.921.12
Propylene Fractionator No. 3SRK-Twu (Soave-Redlich-Kwong) 74.081.13
DebutanizerPeng-Robinson73.121.15
Table 7. Summary of the goodness of fit using the correlation (Equations (1)–(6)) for % flooding as compared to % naphtha substitution with LPG. The goodness of fit is quantified using root-mean-squared error (RMS). In each distillation column under study, the maximum amount of % naphtha substitution with LPG when % flooding hit 100% is also presented.
ColumnMaximum Percentage Naphtha Substitution to LPG (%)RMS
Demethanizer38.470.94
Deethanizer31.140.90
Ethylene Fractionator29.730.84
Depropanizer No. 127.140.89
Depropanizer No. 231.250.89
Propylene Fractionator No. 123.970.87
Propylene Fractionator No. 221.140.85
Propylene Fractionator No. 322.730.88
Debutanizer26.870.87
Table 8. Data input for economic evaluation as required for calculating Equation (8); data calculated from validated model with limitation feed flow rate % LPG from naphtha based on minimization result of Table 7.
DataUnitValue
% LPG from Naphtha Max. for Substitution%21.14
Flow Rate NaphthaTon/hour198.07
Flow Rate LPG Ton/hour53.93
Flow Rate Ethylene ProductTon/hour100.03
Flow Rate Propylene ProductTon/hour55.18
Flow Rate Mixed C4′s ProductTon/hour34.98
Flow Rate Pygas ProductTon/hour25.14
Disclaimer/Publisher’s Note: The statements, opinions and data contained in all publications are solely those of the individual author(s) and contributor(s) and not of MDPI and/or the editor(s). MDPI and/or the editor(s) disclaim responsibility for any injury to people or property resulting from any ideas, methods, instructions or products referred to in the content.

