1. Introduction
Distillation processes are based on energy input in the form of heat. In order to operate the column in the most efficient way, the heat losses have to be reduced to a minimum. However, usually heat losses occur due to imperfect insulation or thermal bridges at the flanges or sensors. Energy loss can affect the separation efficiency of the column [
1,
2] and might need to be compensated for by an additional energy input at the evaporator [
3]. Despite the reduction of the thermal efficiency, heat losses cause an undesired partial condensation of vapor inside the column, which affects the internal fluid dynamics [
4]. In large industrial columns with large diameters, this effect is rather small, as the column surface is small compared to the internal volume flow of the vapor. However, columns with smaller diameters in pilot- or laboratory-scale studies have a significantly higher surface-to-volume ratio, which makes the impact of heat losses and the resulting undesired condensation more pronounced [
5]. In the case of laboratory-scale dividing wall columns, which are usually built of parallel segments rather than from one shell with physical dividing walls [
6,
7], the surface that potentially loses heat is even larger. Correspondingly, to maintain the thermal efficiency of these columns, the energy losses should be minimized to an acceptably low level [
8]. There are several commonly applied approaches to reduce the heat losses of small distillation or rectification columns. All approaches lead to a reduction of the overall heat transfer coefficient and heat radiation. To reduce the heat transfer coefficient, first, materials with low heat conductivity should be used; so, glass is superior to metal [
9]. Then, the surface is covered with additional materials with low-level heat conductivity like common insulating materials (e.g., mineral wool [
1], rock wool [
10], foam glass insulation [
11]), double walls filled with air [
1,
2] or vacuum double walls [
1,
2,
9,
10,
12]. Further, heat radiation is reduced by a silver layer on top of glass surfaces [
1,
9,
10,
12]. To additionally reduce the temperature difference between the inner column and the surrounding, electrical heating can be used at the column surface or between the insulation layers [
4,
9,
13].
Nevertheless, the occurrence of heat losses from small-scale distillation columns cannot be totally avoided. Quantifying the exact amount of these losses can help us to understand the process. The following first two points are valid for distillation in general, while the third one is especially important for dividing wall columns:
Knowledge about the vapor split ratio in a dividing wall column is highly important in order to understand the behavior of these columns, especially if they have more than one dividing wall. The vapor split ratio has a strong effect on the energy demand of the separation, and for a given energy input, it thus has an effect on the achievable product purities [
16,
17]. Additionally, as mentioned above, the separation efficiency of the packing is dependent on the vapor load. If there is a different gas load on different sides of the dividing wall(s), the resulting separation efficiencies in the segments might be different.
A few publications present the quantification of heat losses in small-scale dividing wall columns. Niggemann et al. [
18] present results from an approximately 12 m high dividing wall column with an inner diameter of 68 mm and four segments with an 980 mm packing height, where the two middle segments are divided by a physical wall into four semi-cylindrical ones. The column was built out of stainless steel and is insulated with mineral wool. A mixture consisting of
n-hexanol,
n-octanol and
n-decanol was separated. During separation, the temperature profile at the column surface was measured (between 90 and 150 °C), and in combination with the heat transfer coefficient, the heat loss throughout the column height is determined to be around 250 W. This corresponds to 20% of the energy input provided and a heat transfer coefficient of
kA = 5.5 WK
−1. Ehlers et al. [
19] present results from the same column; however, the parallel segments were reconstructed as separate, cylindrical ones with an inner diameter of 54 mm that are connected to the top and bottom segments by y-pieces. They measured higher heat losses of 295 W throughout the column height (with a comparable temperature range), which was most likely caused by the higher surface area of the parallel segments.
Strandberg [
12] reports on a Kaibel laboratory column with an inner diameter of 50 mm and parallel segments built out of silvered glass vacuum jackets. Even though no exact numbers for heat losses are given, they are described to be considerable. As the main reason for losses, flanges, connections and the liquid splitter were identified with a thermal imaging camera. However, additional insulation could also not reduce the losses to a satisfying level.
Roach [
11] and Donahue [
20] report on a bigger dividing wall column with a diameter of 150 mm and a physical dividing wall. The column shell was built out of stainless steel and insulated with 50 mm foam glass insulation. Based on the difference between the reboiler and condenser duties, the heat loss was calculated. At this point, the authors would like to point out that this approach may not be correct, as the energy flow of the side draw stream leaving the column was neglected in the energy balance. For two different mixtures and several different operation points, the following heat losses were given: The first mixture contained
n-hexanol,
n-octanol and
n-decanol and was distilled at 62 mbar. At the resulting temperature range between 90 and 150 °C, heat losses of 48–65% were observed (reboiler duty from 17 to 20 kW), and for the second mixture of
n-pentane, cyclohexane and
n-heptane (36–100 °C), 21–58% of the energy input (reboiler duty 9.5 to 12 kW) was lost.
Last, Nguyen [
21] presents results from a dividing wall column with a height of 5.5 m, which also uses parallel sections instead of a physical dividing wall. Above and below the dividing wall, the diameter was 80 mm, while the parallel segments had a diameter of 50 mm. The shell was made out of glass covered with a jacket, which is not described in more detail, but based on pictures of the plant, it appears to be Armaflex insulation. Heat losses were not directly derived, but for a mixture of methanol, n-propanol and n-butanol (boiling points from 65 to 118 °C), simulations were performed assuming no heat losses and were compared with experimental data. Thus, here, it is assumed that deviations between the expected condenser duty based on the simulations and the experimentally measured duty represents the heat losses of the column. Based on this, between 0.29 and 1.8 kW heat were lost (deviations simulation—experiment 11 to 80%).
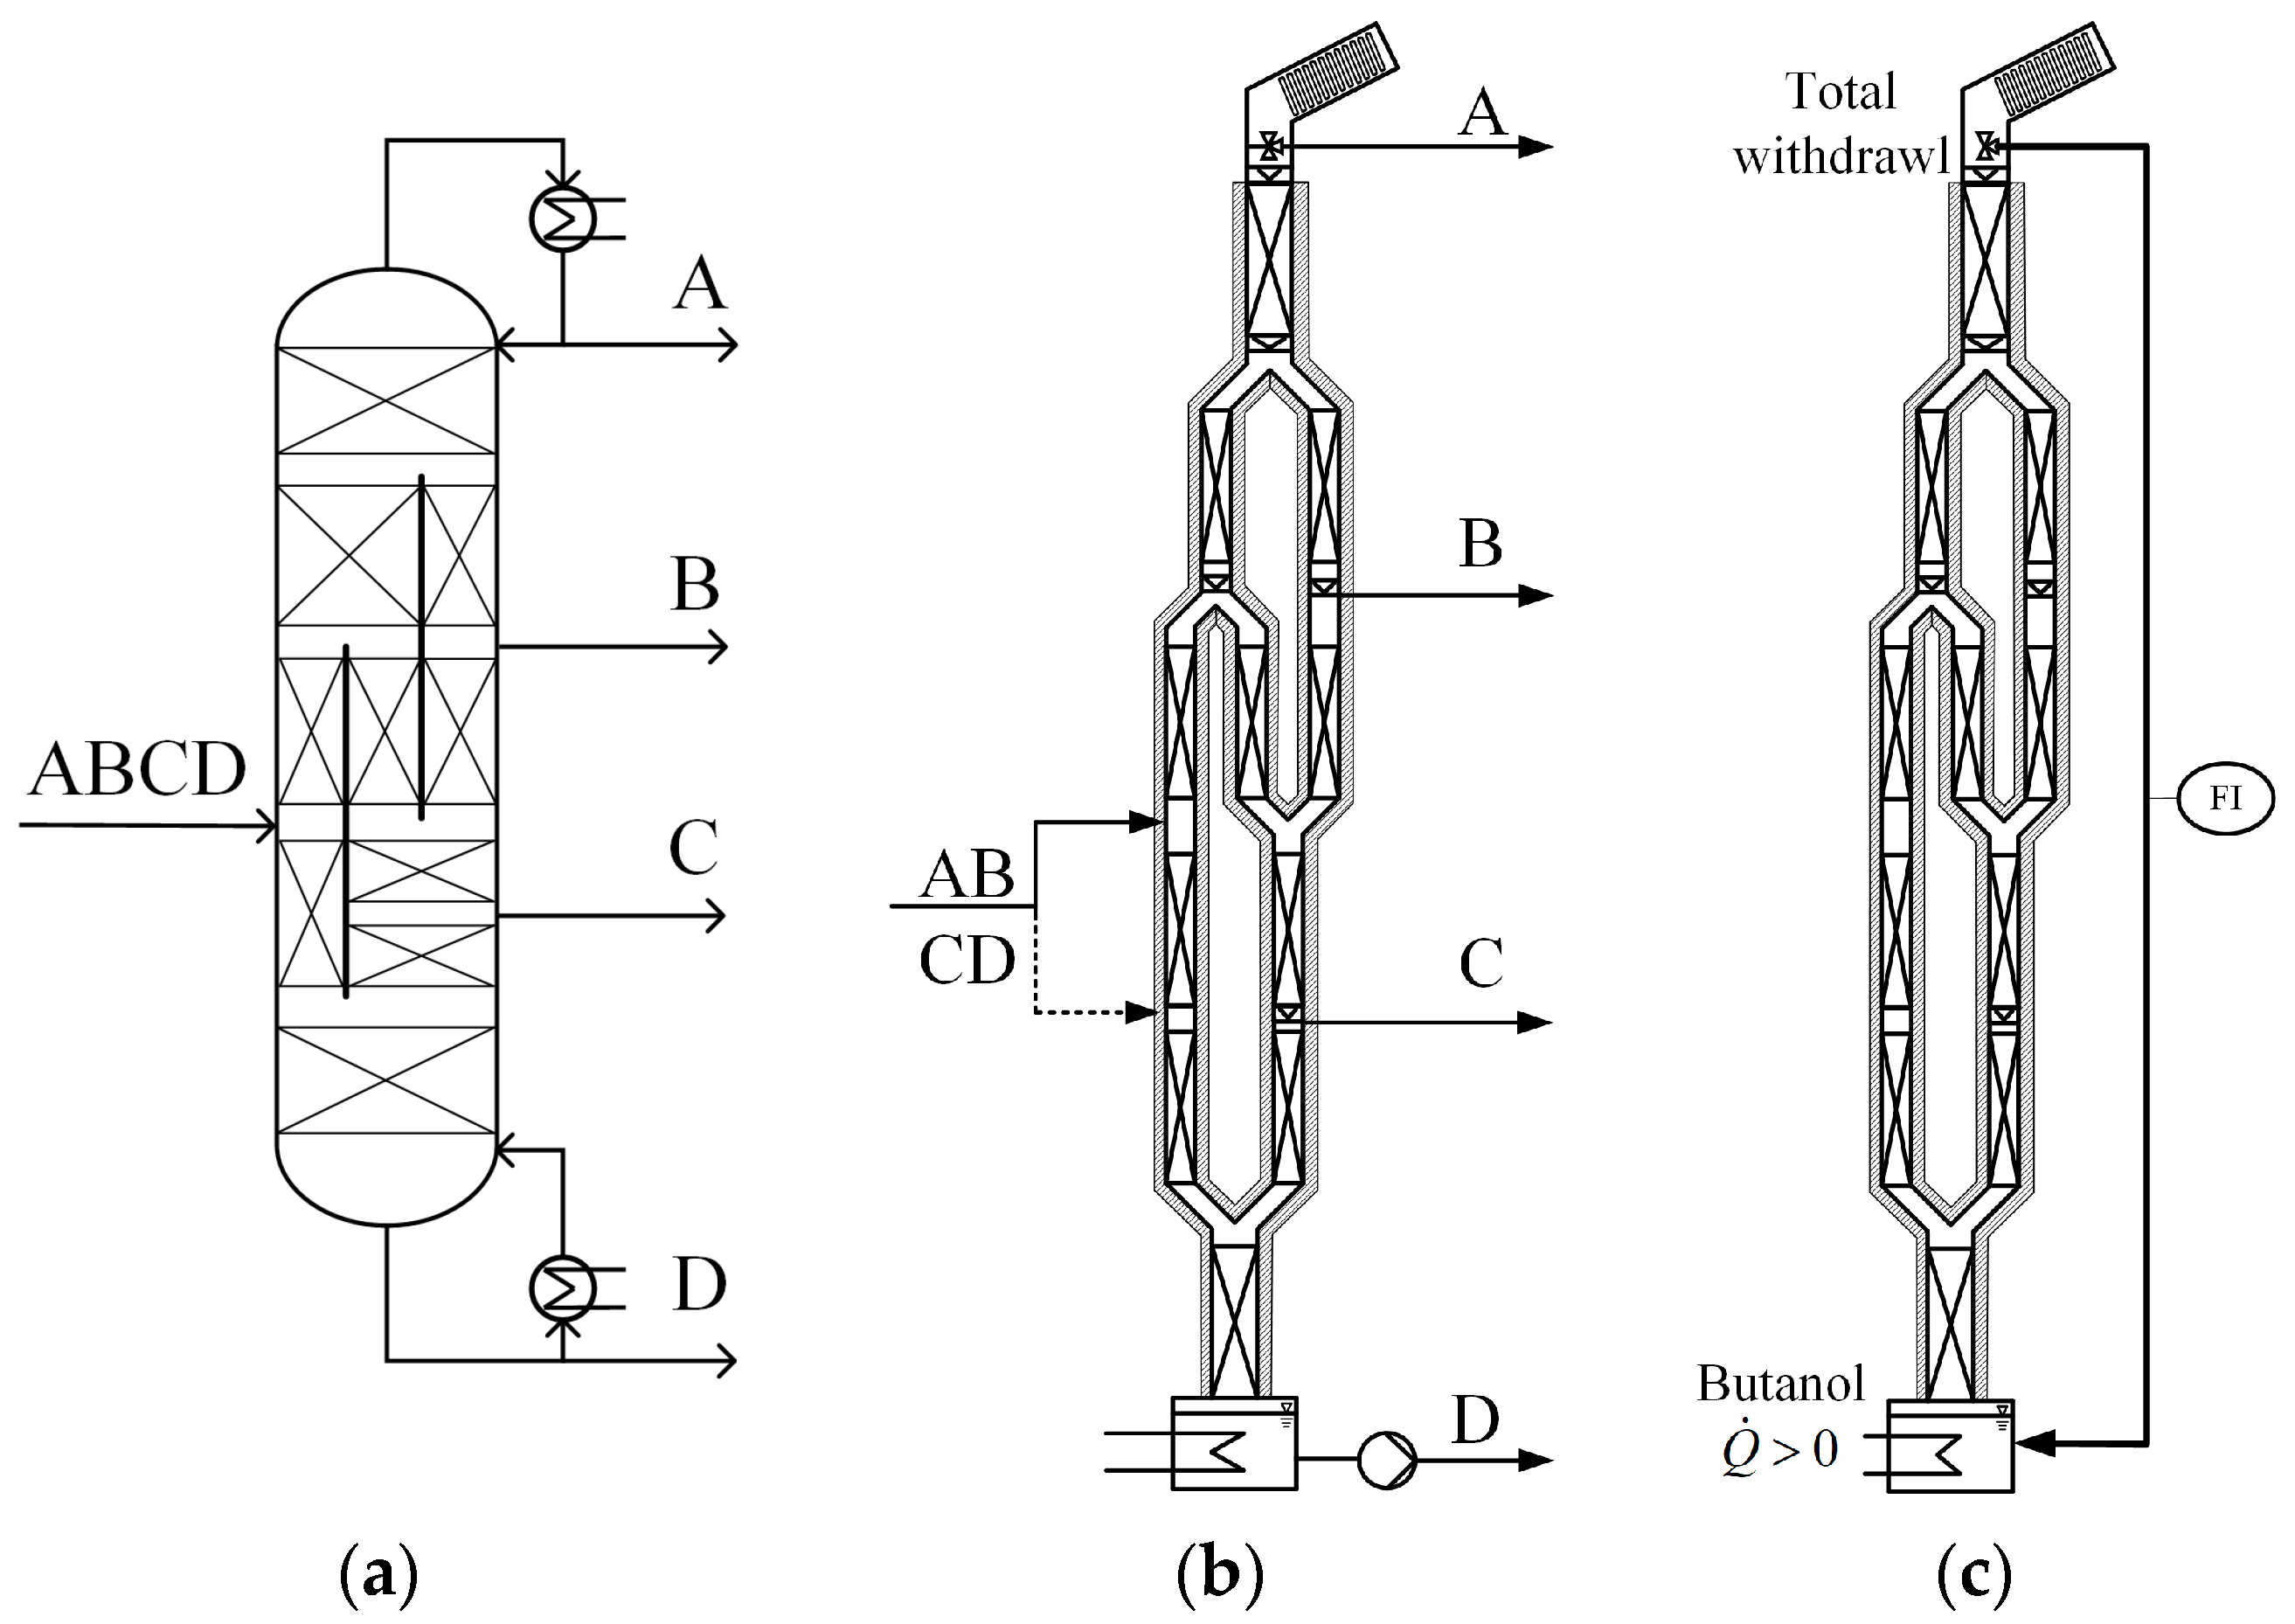
In this work, the experimental procedure and determination of heat losses in a 9.6 m high dividing wall pilot column with two dividing walls is presented. In contrast to the above-mentioned literature, the determination of heat losses is not treated as a side topic and can thus be described in more detail. A schematic flowsheet of the used pilot column can be seen in
Figure 1a. This column can separate a quaternary mixture into pure product flows in only one apparatus. The theory predicts that up to 55% energy can be saved compared to the demand of the conventional column sequence [
22]. The main reason for this is that the energetically disadvantageous back-mixing of middle boiling components is avoided. However, this has not yet been tested in practice. In order to change this, the pilot plant used for the investigation in this work is built. Further details about the column specifications can be found in
Section 2.1.
In a subsequent step (not part of this work), the obtained results will be used to improve the fit between simulation and experiment, and thus, the quality of the prediction of the separation performance of the plant. Also, it is required in order to estimate the liquid load in the parallel column segments, which is used in combination with the experimentally measured pressure drop to calculate the vapor split ratios at the dividing walls. Although these results are specific to the pilot plant, the approach itself can be readily applied to other distillation columns. In addition, it can be generally assessed whether there are heat losses and how large the identified heat losses are despite the proper insulation of the column in combination with external wall heating (see
Section 2.1).
2. Materials and Methods
This section first describes the pilot plant used in this work (see
Section 2.1). Then, the approach applied to determine the overall heat losses in the setup is presented, for which, a three-step approach is used. First, the actual energy input provided by the heating rods at temperatures close to the ambient one was determined (
Section 2.2). Second, the energy actually available for heating of the liquid was determined at elevated temperatures in the evaporator (
Section 2.2). Third, at specific energy inputs, known amounts of butanol were evaporated, and the distillate flow arriving at the top of the column was measured (
Section 2.3). In order to double-check the results and identify possible sources for the heat losses, additionally thermal images were taken with an FLUKE Ti10.
2.1. Pilot Plant
Figure 1b shows how the dividing wall column was implemented [
23]. All relevant column specifications are summarized in
Table 1 and are briefly described in the following paragraph. As mentioned above, the column is 9.6 m high and is packed with Sulzer DX laboratory packing. The upper and lower segments have a diameter of 80 mm, making the actual insertion of partitioning walls difficult. Correspondingly, the usual setup for small-scale dividing wall columns is implemented using parallel arms (50 mm diameter), which are coupled to y-pieces. Without energy losses, this setup is thermodynamically equivalent to the column scheme in
Figure 1a. The distillate–reflux split at the top of the column was achieved using a relatively simple on–off valve, which either returns the condensate to the column as reflux or discharges it as distillate. Correspondingly, the reflux flow into the column cannot be measured. During operation, the liquid flow needs to be distributed on both sides of the y-pieces. For this purpose, liquid collecting trays are used that lead the liquid to a shaking funnel, which in turn swivels between both sides in user-defined time intervals according to the desired split ratio. Similar shaking funnels are used for the side draw streams. The vapor splits are not manipulated, and thus, the flow separates according to the pressure drop on both sides of the dividing wall. The column is equipped with several sensors, of which, in this work, only mass flow sensors and temperature sensors were used (see
Table 1 for model).
The column walls are made of double-walled, evacuated and mirrored glass parts, while the y-pieces are only made of normal glass. All column walls are surrounded by custom-made, glass silk, insulated and controllable heating sleeves (see
Table 1 for model), whose temperature setpoint can be separately defined for each segment. The objective of the sleeves was to decrease the temperature difference to the surrounding area, and thus, reduce the heat losses through the walls, which is a recommended approach for lab columns [
4]. The authors are aware of the fact that operating heating jackets also needs an energy input; so, using these to compensate for the energy losses does not reduce the overall energy consumption needed for the process. However, it should be kept in mind that the column is used for detailed research about the experimental behavior of multiple dividing wall columns. This also includes the fit between the simulation and the experiment, which again works better without unwanted condensation due to heat losses. In bigger column this additional heating is not required due to a significantly lower surface-to-volume ratio.
For evaporation, electrical flange heating rods with maximum 10 kW power made of stainless steel were used. The power input of the heating rods can be controlled continuously, and according to the manufacturers details, a power setting of
P = 100% equals
. For safety reasons, the heating rods were not inserted into a glass shell, but into one made out of stainless steel (1.4571). A picture of the evaporator can be seen in Figure 6a, and its dimensions are summarized in
Table 1. The heating rods were inserted into the evaporator from the back. In order to reduce heat losses via the wall’s heat-conducting metal surface, the evaporator shell was insulated with a 16 mm Armaflex-similar insulation material. The maximum filling volume of the evaporator, including the displaced volume of the heating rods, is approximately 38 L. However, during the operation, a totally filled evaporator leads to the flooding of the lowest column segment, and thus, usually, less liquid is used. To measure the exact filling of the evaporator, a liquid level sensor was used (see
Table 1 for model).
2.2. Measurement of Energy Input of Heating Rods and Heat Losses of the Evaporator
The energy input of the heating rods during the heating up of the liquid in the reboiler can be calculated according to Equation (1) [
25,
26,
27].
It includes the mass of steel
msteel and liquid
mliq, their corresponding heat capacities
cp and the temperature
T increase in a certain time
t interval. The mass of the steel shell and the heating rods was assumed to be 28 kg, and the mass of the liquid in the evaporator was determined with the liquid level sensor in the evaporator and the geometry of the shell. The temperature dependent specific heat capacities were calculated as described in
Appendix A. The error was determined by error propagation, considering the uncertainties of the masses of the evaporator itself and of the liquid (see
Table 1 for values).
Additionally, heat losses from the evaporator due to heat transfer through the walls need to be considered. Theoretically observable heat losses can be described in Equation (2) [
28].
where
k is the heat transfer coefficient and
A the surface area. For simple geometries, the value of
kA can be estimated with knowledge about the thermal conductivity of the materials
λi, their thickness and the heat transfer coefficients
αi. Further,
Tenv is the environmental temperature, and
Tevap,m is the average temperature inside the evaporator according to Equation (3).
For the determination of the actual energy input of the heating rods, a known mass of butanol was filled into the evaporator, and the rods were turned on with a specific percentage of their total power. Then, the resulting temperature increase was logged over time, and the time needed to increase the temperature from 20 to 30 °C or 30 to 40 °C was inserted into Equation (1). These low temperature ranges were chosen in order to keep the impact of the heat losses according to Equation (2) on the measured temperature profile as low as possible. Based on this procedure, the actual energy input of the evaporator was calculated.
To determine the heat losses at the evaporator, Equation (2) can be used. As mentioned above, for this,
kA could be determined with the help of material properties. However, the evaporators geometry is rather complex as several flanges, in- and outlets are connected to the surface, and thus, an exact calculation of
kA is rather complex and error prone. Consequently, an alternative approach was used, also applying Equation (1), but this time, we evaluated the increase in the elevated inner temperatures. Then, the experimentally observed heat losses can be determined using Equation (4).
If the experimentally determined heat losses from Equation (4) are then inserted into Equation (2) as theoretical heat losses , a value for kA can be derived. This procedure was performed at different power inputs and different temperature levels to determine the heat losses at the evaporator.
Additionally, an experiment was carried out to find the power setting at which all the energy provided is released to the environment close to the boiling temperature of butanol. Again, the amount of provided energy should be determined from a change in the temperature inside the evaporator. However, as soon as the liquid evaporates, a change in reboiler duty would not result in a change in the temperature anymore, and it would only affect the amount of evaporated liquid. Thus, the boiling point itself cannot be used here. To still make the results applicable at boiling conditions, a temperature slightly below the boiling point of butanol was chosen. The power setting of the heating rods was set to one value, and we observed if the temperature inside the evaporator increased or decreased. Depending on the observation, the power setting was adjusted until the point was found at which the temperature is constant. Here, the provided heat is lost totally to the environment.
2.3. Measurement of Heat Losses throughout Column Height
To determine the heat losses throughout the column height, the plant was reconstructed as shown in
Figure 1c. Again, a known mass of butanol was filled into the evaporator, and the heating rods were turned on. The mass flow of evaporated butanol can be calculated with Equation (5) [
29,
30].
The actual power input used for evaporation is the heat input of the heating rods
minus the heat losses at the evaporator
, which are derived as described in
Section 2.2. Additionally, the heat of vaporization Δ
hv of the evaporated component butanol is required, for which 586.1 J/g (at boiling conditions) was used in this work [
24]. At the top of the column, the vapor was condensed and totally withdrawn. Its flow was measured with a mass flow meter (see
Table 1) before it flowed back into the evaporator. This procedure was chosen instead of total reflux, as the reflux flow cannot be measured in the column setup due to the missing distillate cycle. The distillate stream cools down the liquid inside the evaporator slightly; however, compared to the overall mass of the boiling liquid, the distillate flow is rather small. The difference between the evaporated mass flow according to Equation (5) and the measured distillate flow was condensed inside the column due to heat losses. Thus, the heat loss throughout the column can be determined using Equation (6).
3. Results and Discussion
In this chapter, the results from the heat loss measurements are presented and interpreted, starting with the actual energy input of the heating rods in
Section 3.1, followed by the evaluation of heat losses at the evaporator shell in
Section 3.2 and ending with the quantification of heat losses throughout the column height in
Section 3.3.
3.1. Actual Energy Input of Heating Rods
The actual energy input of the heating rods was determined as described in
Section 2.2.
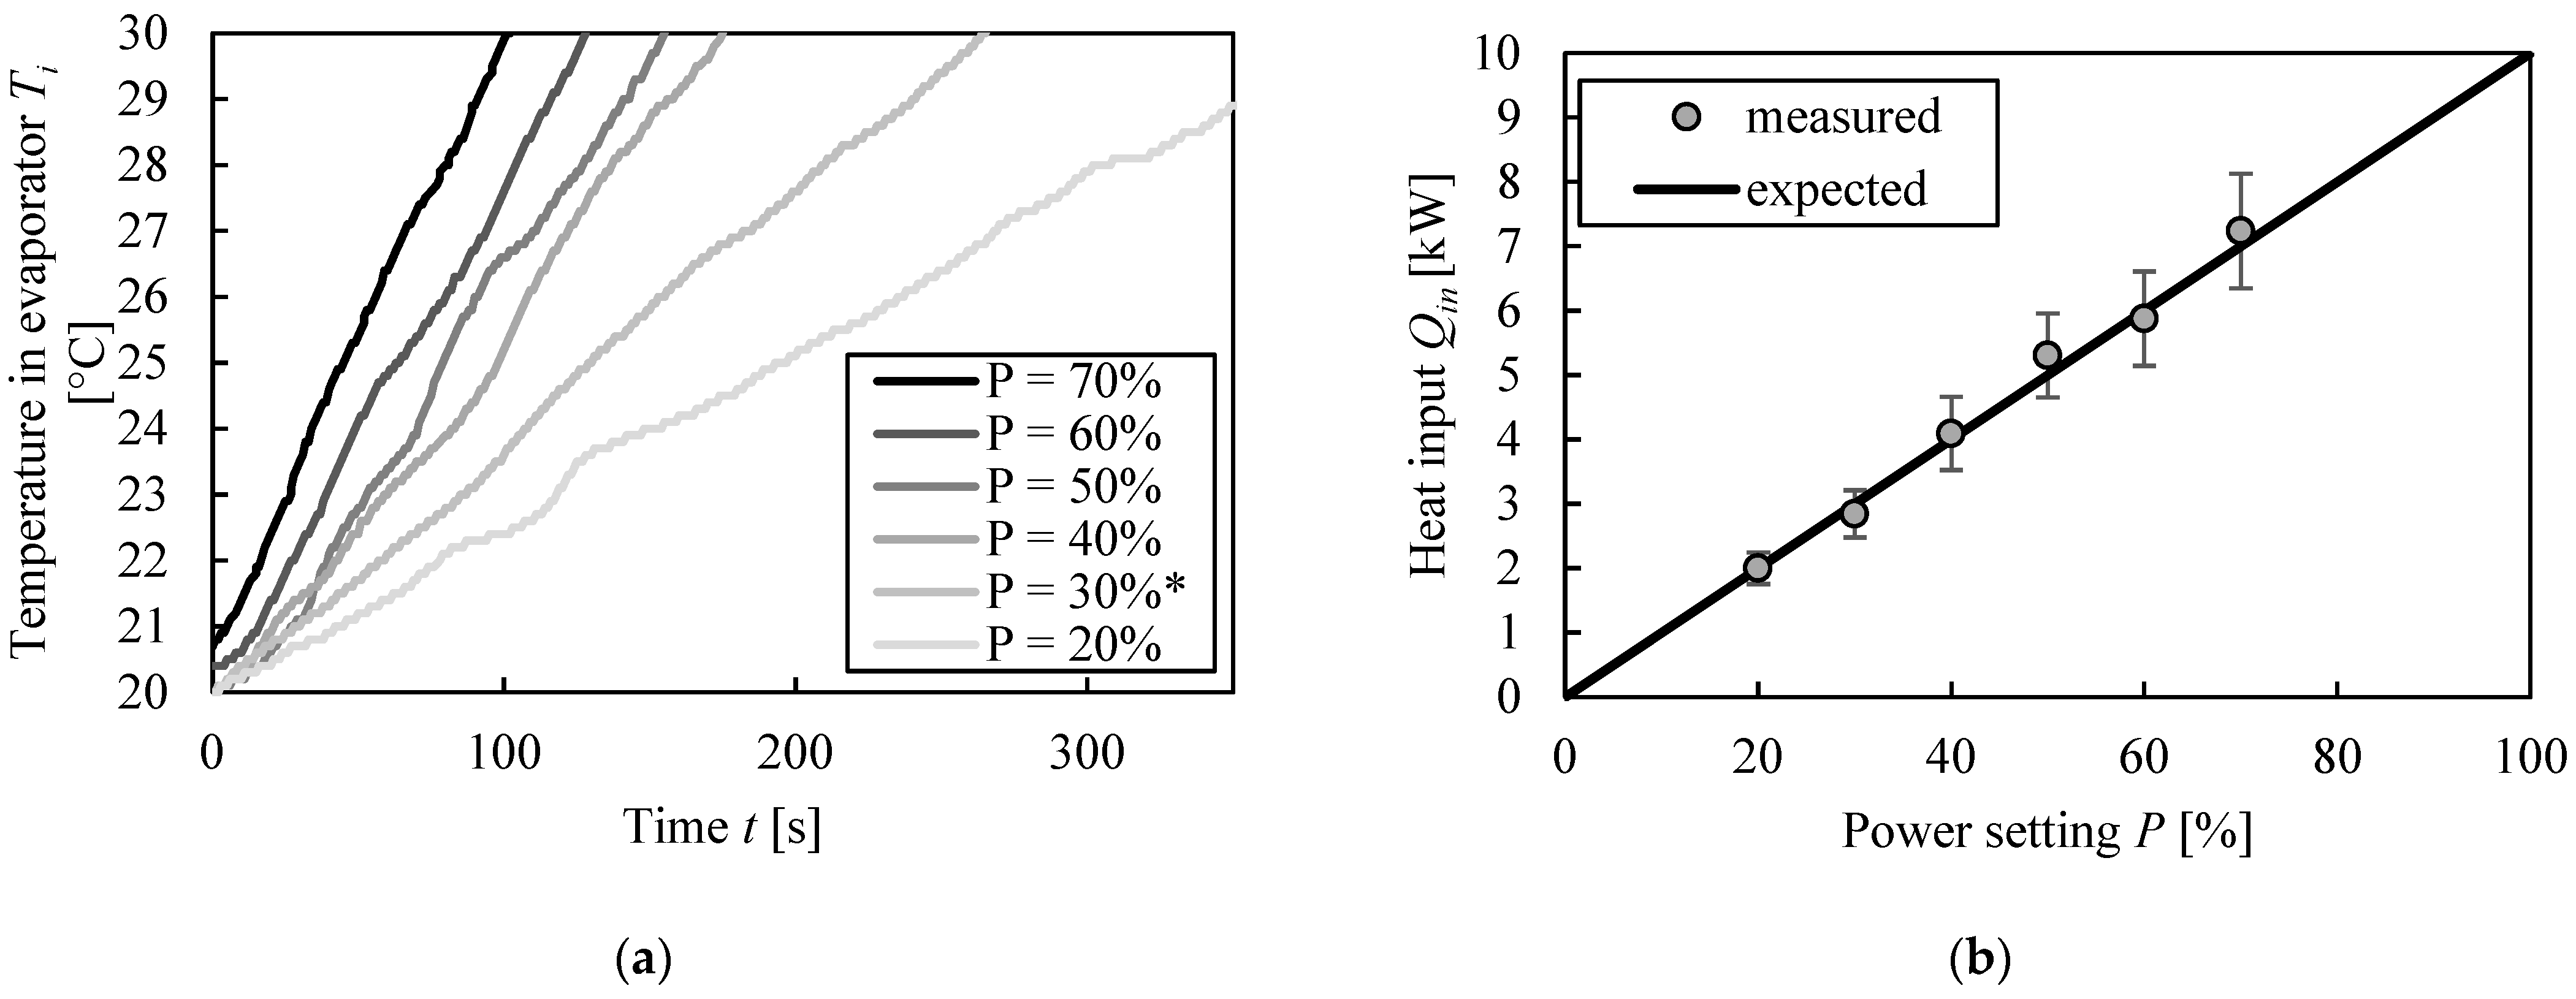
Figure 2a shows the temperature increase of butanol in the evaporator from 20 to 30 °C for different power settings, the experimental data can also be found in the supporting information. Note that the run at 30% was performed between 30 and 40 °C, and the temperature evolution shifted from 20 to 30 °C for better comparability with the other runs. The mass of butanol for these experiments was between 24.3 and 26.7 kg. With the slope (linear regression of the curves) of the temperature increase, the actual energy input results were calculated with Equation (1), as shown in
Figure 2b. The exact calculation steps can also be found in the supporting material.
The resulting energy input matches the expectations based on the manufacturer’s data. At low temperatures, the heating rods provide 1 kW per 10% power setting.
3.2. Heat Losses of the Evaporator
Heat losses at the evaporator were determined as described in
Section 2.2.
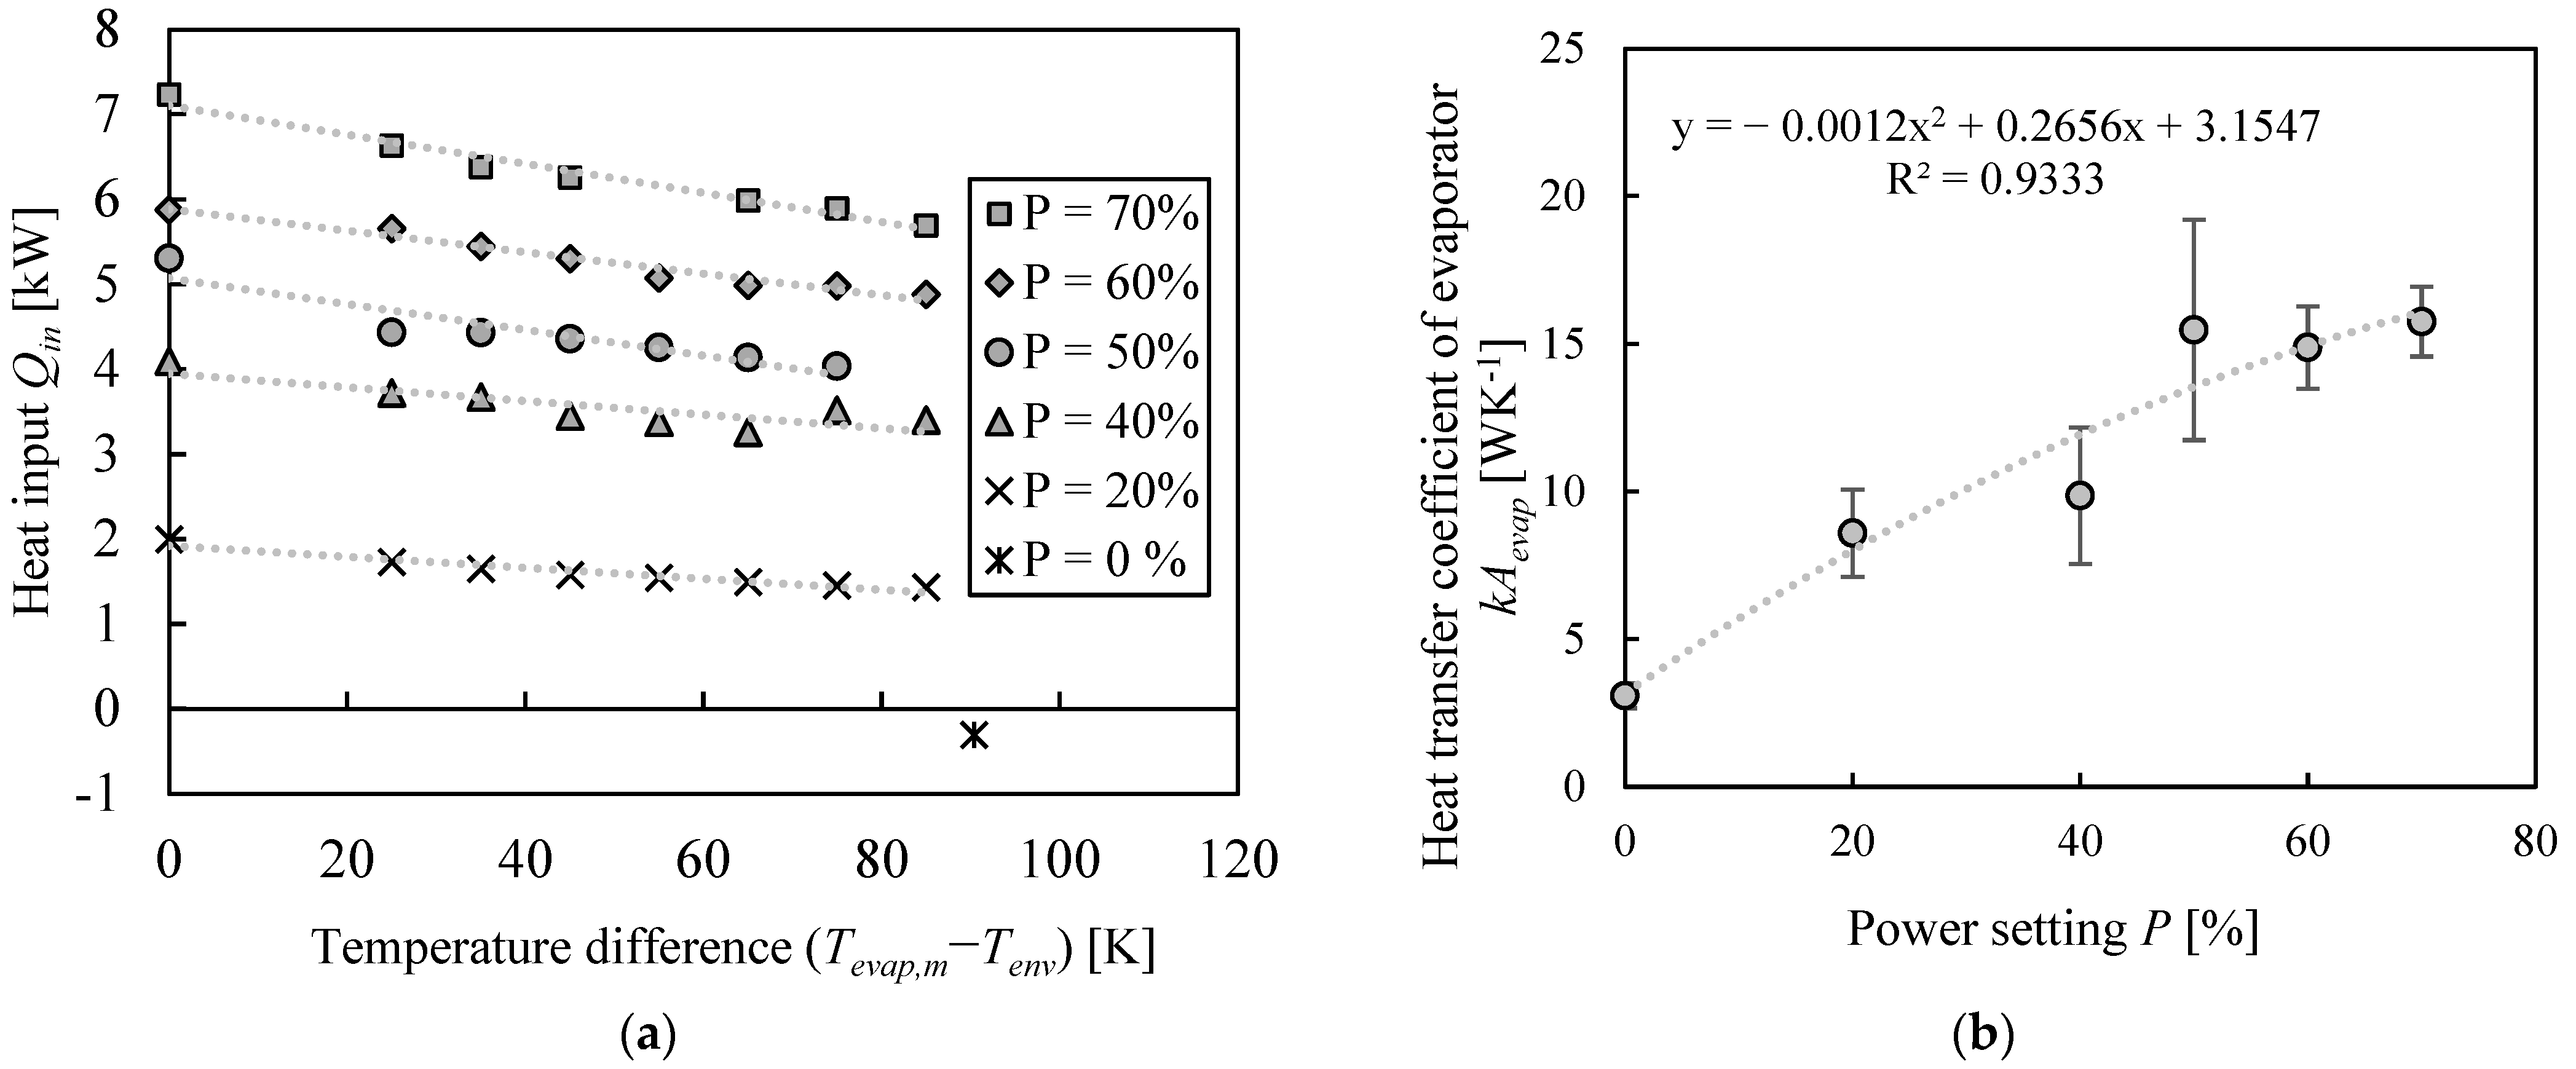
Figure 3a shows the observed energy input calculated from the temperature increase in the evaporator for different temperature differences between the evaporator and the environment. Additionally, heat loss is given at a power of 0%. This value is derived from the temperature decrease in the evaporator after turning the heating rods off with butanol at boiling conditions. As expected, the heat losses become more pronounced at elevated temperatures; thus, the observed heat input used for heating up the liquid decreases. Also, the decrease in heat input seems to become slightly stronger for higher power settings.
For each datum point from
Figure 3a, Equations (2) and (4) were used to determine the heat transfer coefficient
kA, which was then averaged for each power setting. The resulting values, including their standard deviations, are shown in
Figure 3b. The exact calculation steps can be found in the supporting material. First, the value of
kA at a power setting of 0% is similar to one already described in the literature for heat losses of an evaporator for a dividing wall column [
18]. However, if the power setting of the evaporator is increased, the observed
kA value increases as well. Most likely, this results from different fluid dynamics inside the evaporator, which favors heat transfer between the liquid and the heating rods at higher powers. The course of
kA is approximately described with a quadratic function, which is also shown in the diagram. The coefficient of determination is sufficiently high, and the course of the regression lies within the error range of all measurement points.
Based on the obtained data, the actual heat input of the heating rods at boiling conditions can be calculated. The heat transfer coefficient was determined with the equation from
Figure 3b, and then inserted into Equation (2) to derive the heat losses at a given power setting. This heat loss can then be subtracted from the actual heat input without heat losses from
Figure 2b.
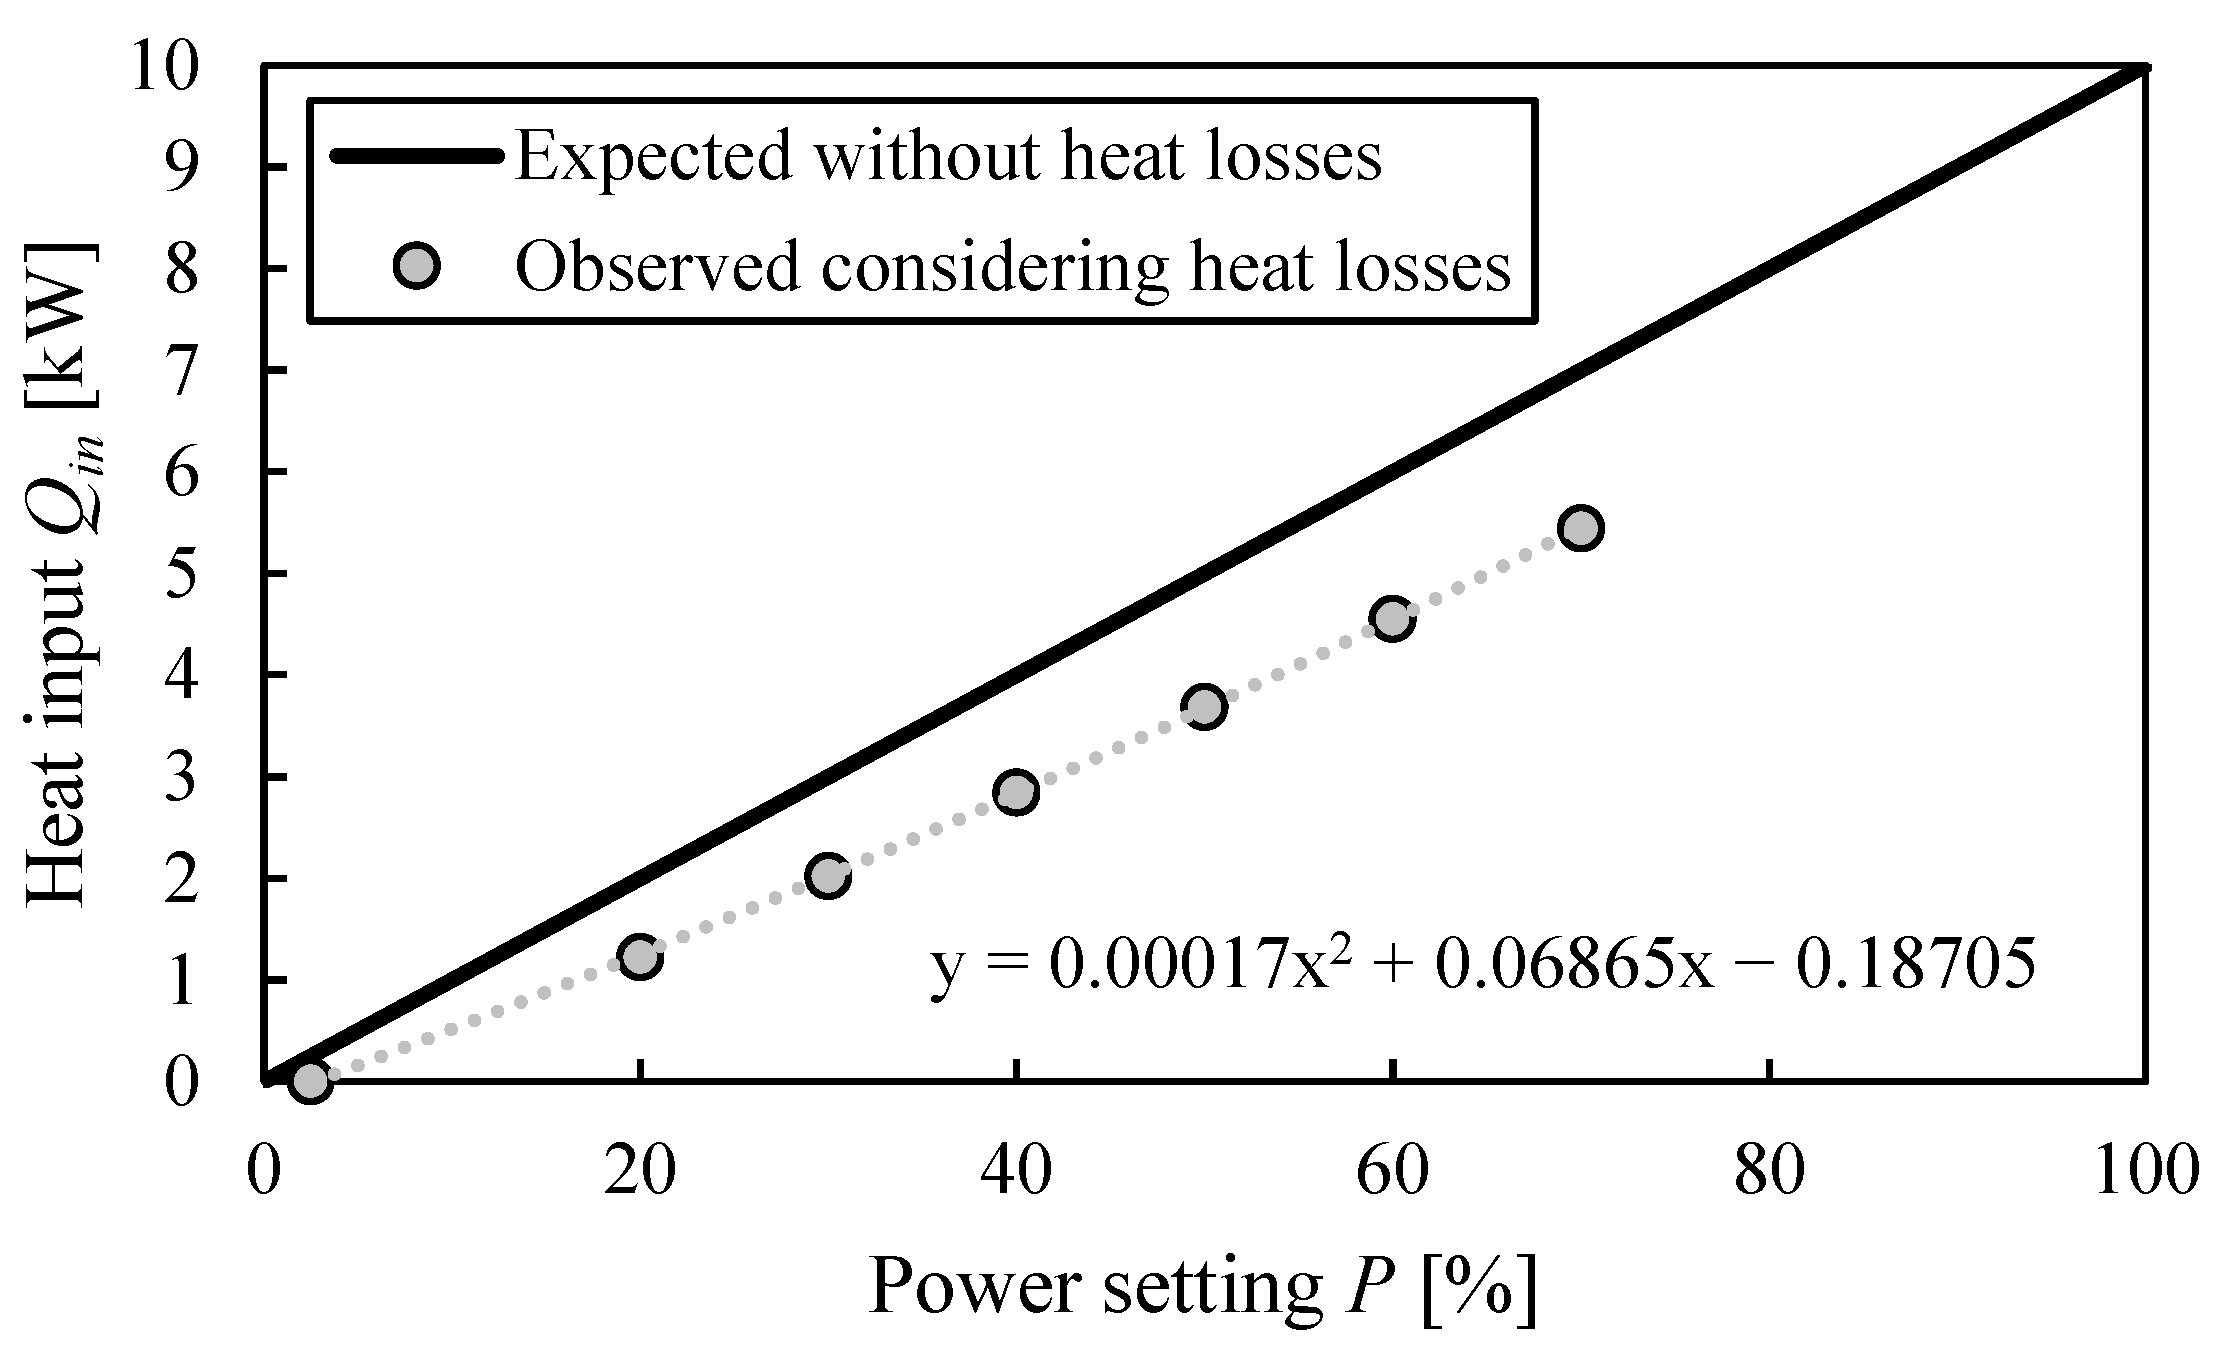
Figure 4 shows the resulting actual energy input of the heating rods that is provided for evaporation of the liquid. Additionally, one datum point is given at which the heat input is 0, which was derived as described at the end of
Section 2.2. The exact calculation steps can be found in the supporting material.
The heat losses at the evaporator significantly reduce the available heat input, and this effect is more pronounced at higher power settings. A total of 100% of the energy is lost at 2.5% power, and this value reduces down to 20% loss at 70% of the total power.
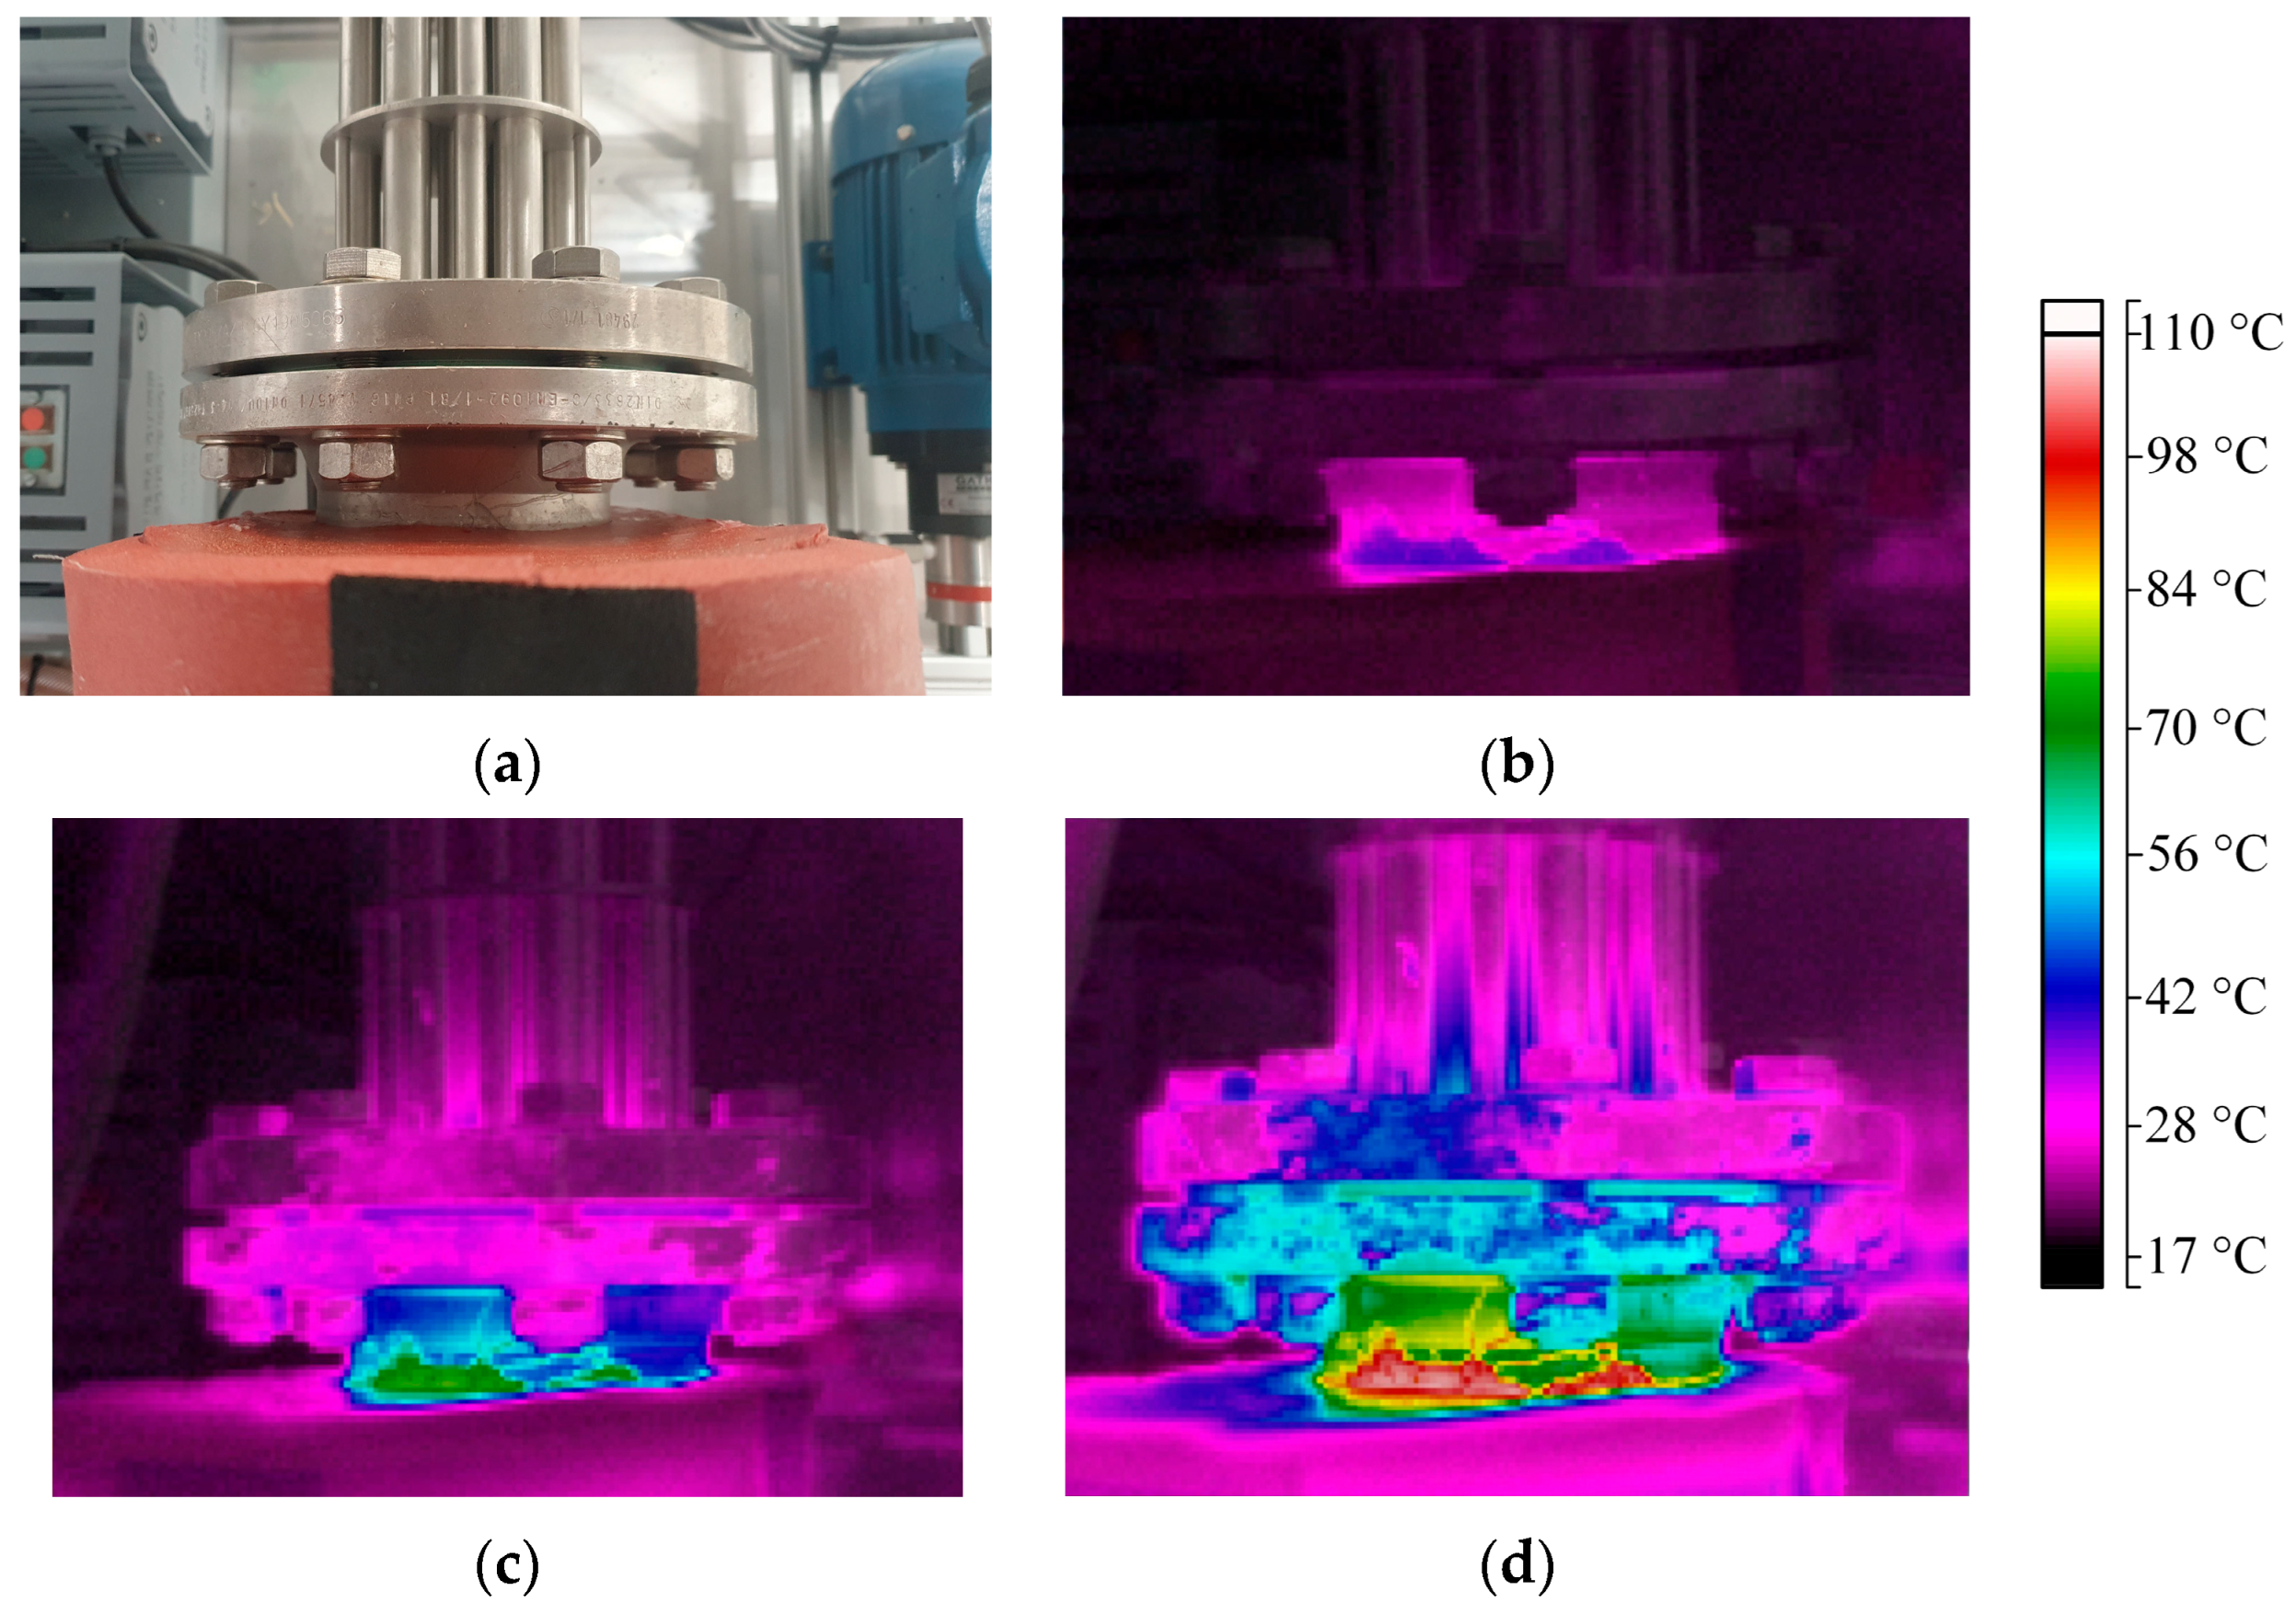
In order to investigate in more detail where exactly the heat losses occur, a thermal imaging camera was used.
Figure 5a shows pictures of the flange of the heating rods at the outer surface of the evaporator shell, from which thermal images were taken at different operation times, and thus, at different temperatures inside the evaporator. The image in
Figure 5b was taken after 5 min of operation, with an inner temperature of 40 °C, the image in
Figure 5c was taken after 15 min at 80 °C and the image in
Figure 5d was taken after 30 min at 113 °C in the inside. The colors indicate the temperature of the components, and the legend relating the colors to the values is shown on the right side of the pictures. The flange and metal parts heated up quickly during operation. As the maximum temperature close to the shell is always close to the inner temperature, it becomes apparent that the heating rods simply conduct the heat out of the shell, which is then lost to the surrounding.
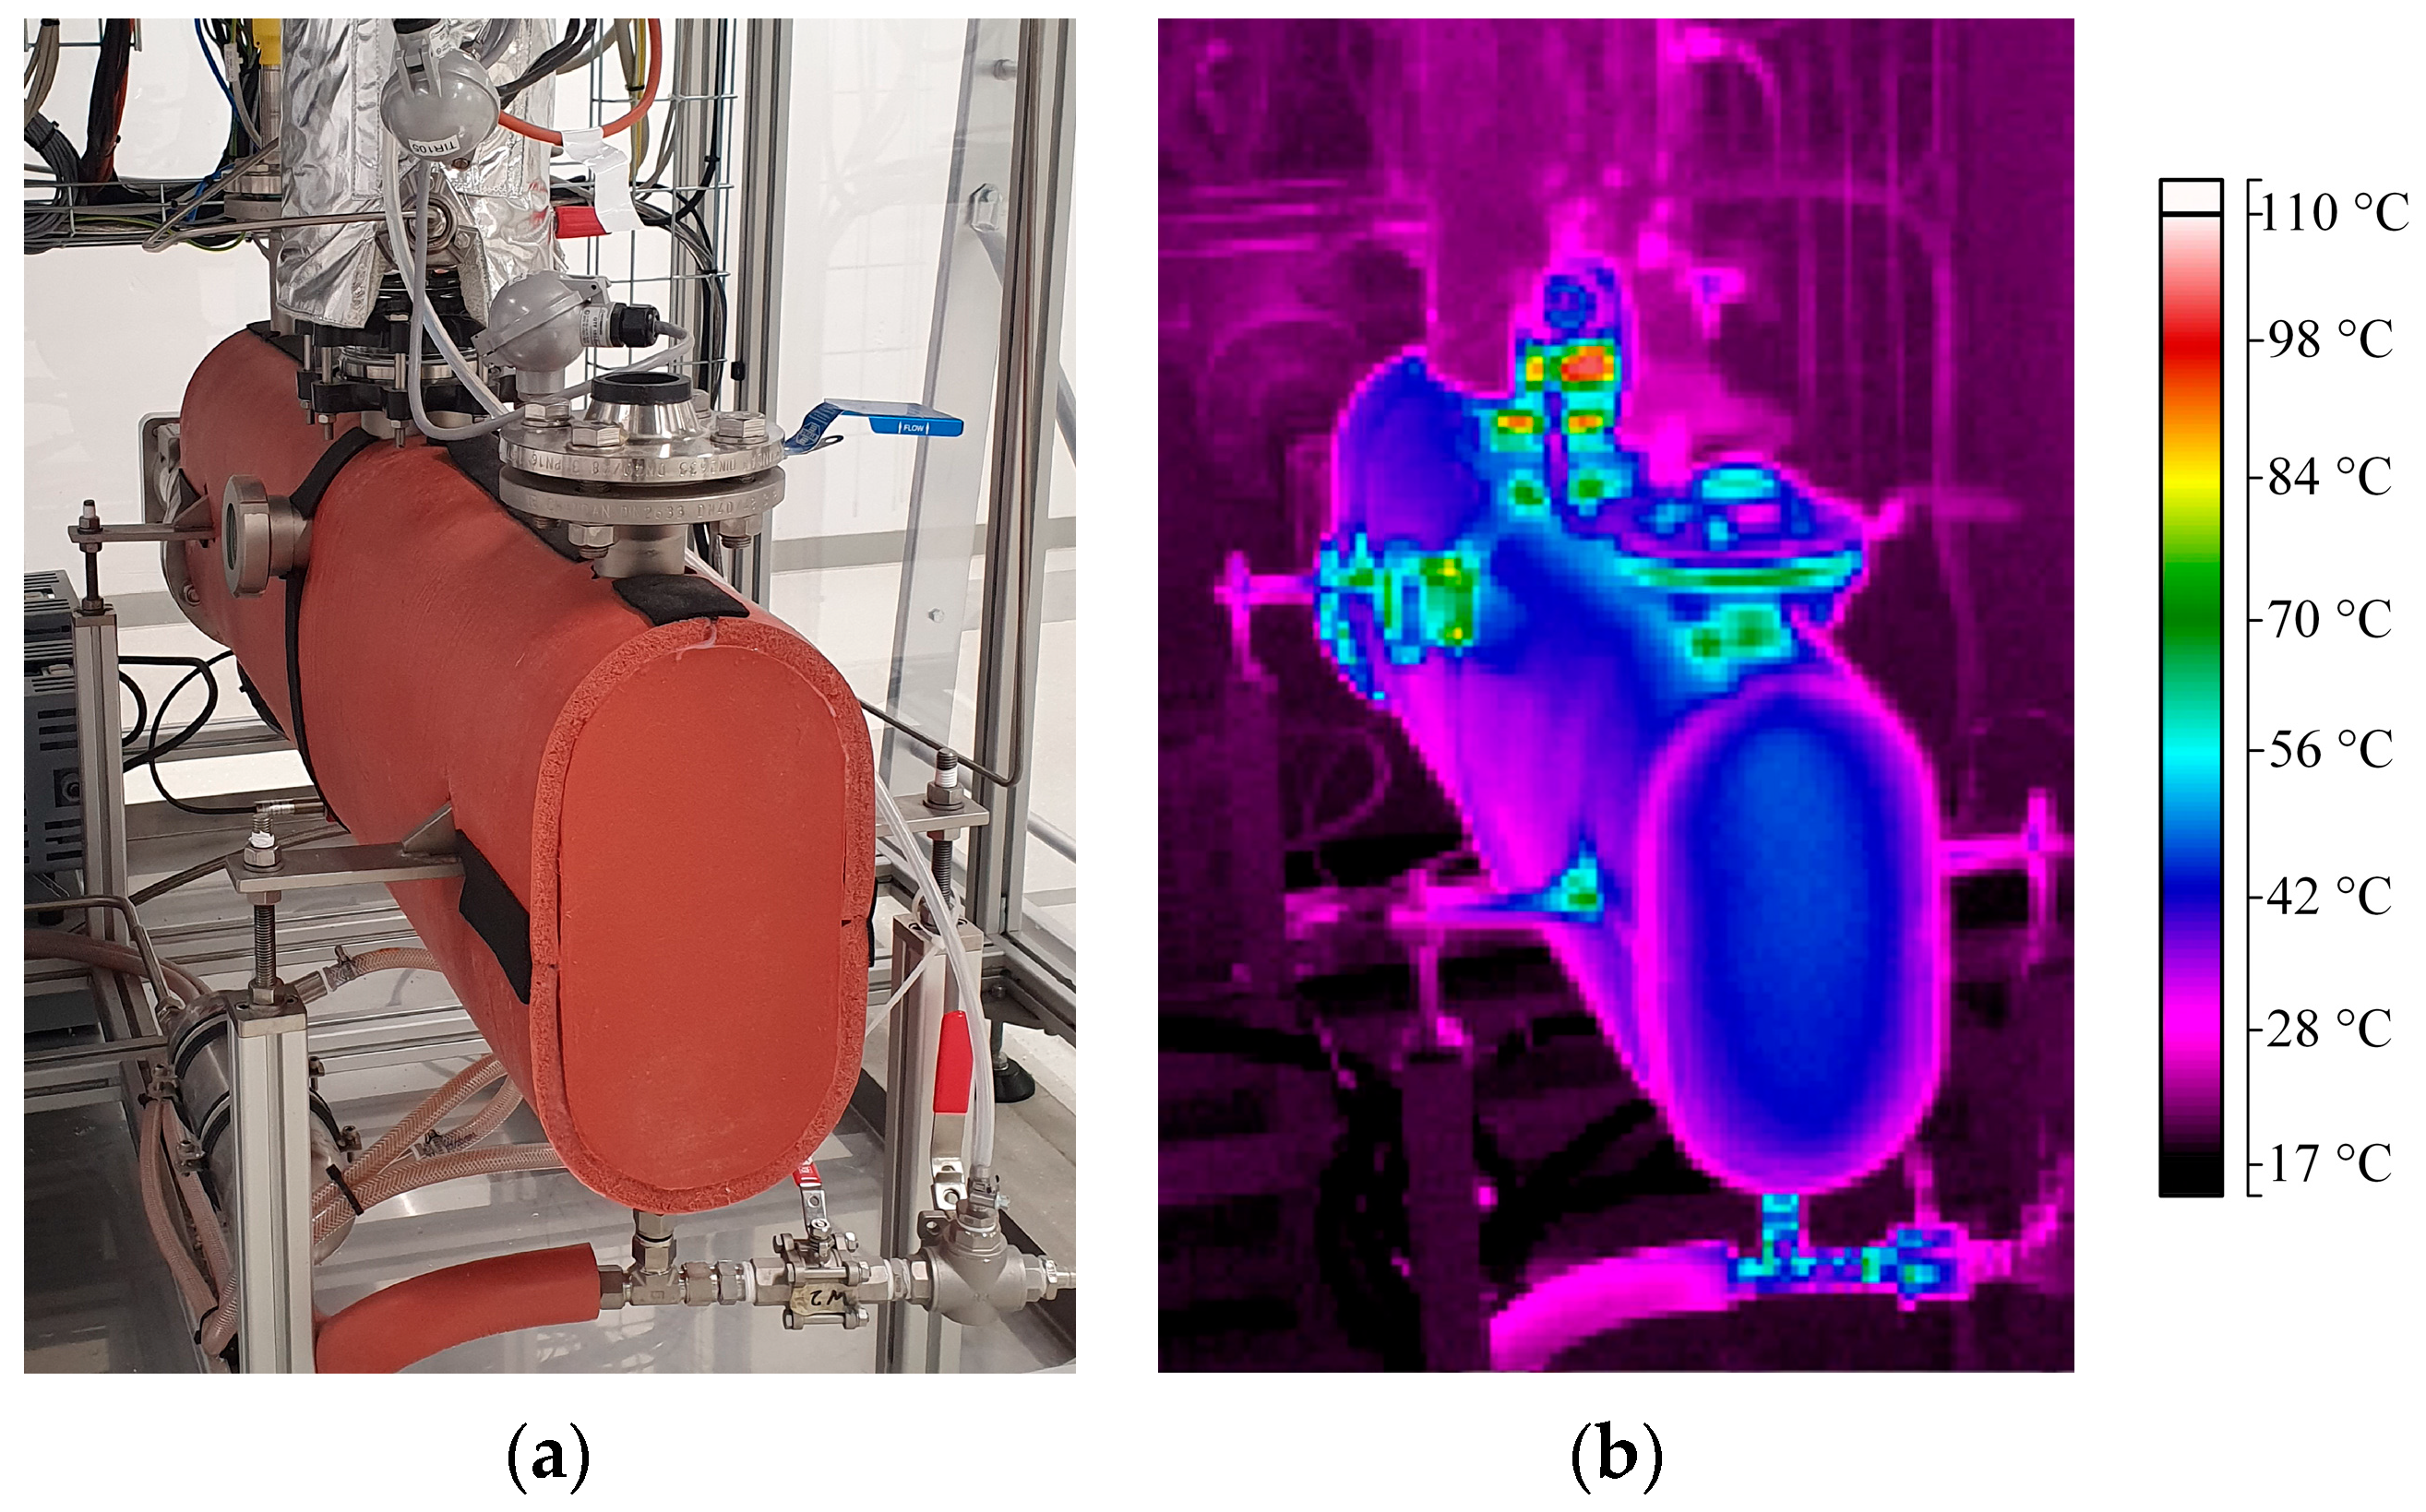
Additionally, a thermal image of the whole evaporator was taken after 140 min of operation, which is shown in
Figure 6b in comparison to a normal picture of the evaporator in
Figure 6a. Again, the color coding can be found on the right side of the picture. Note that the heating rods from
Figure 5 are not visible here as they are located on the back of the evaporator shell. The surface of the shell insulation has a temperature of around 50 °C. Thus, significant amounts of heat are lost here as well. Additionally, the flanges and metal parts used to hold the evaporator and connect the column to it are warmer, and thus, are also responsible for some additional heat losses.
Based on the results presented in this section, it can be concluded that already significant amounts of heat are lost at the evaporator itself. With the help of the thermal images, the main causes of the heat losses could be identified to be at the heating rod flange; however, some heat is lost over the shell surface and other connections. Accordingly, materials with lower thermal conductivity than that of metal, such as glass, should be used to achieve lower heat losses [
9]. If this is not possible, proper insulation is highly important to increase the thermal efficiency of the evaporator.
3.3. Heat Losses throughout Column Height
To quantify the heat losses throughout the column height, the procedure described in
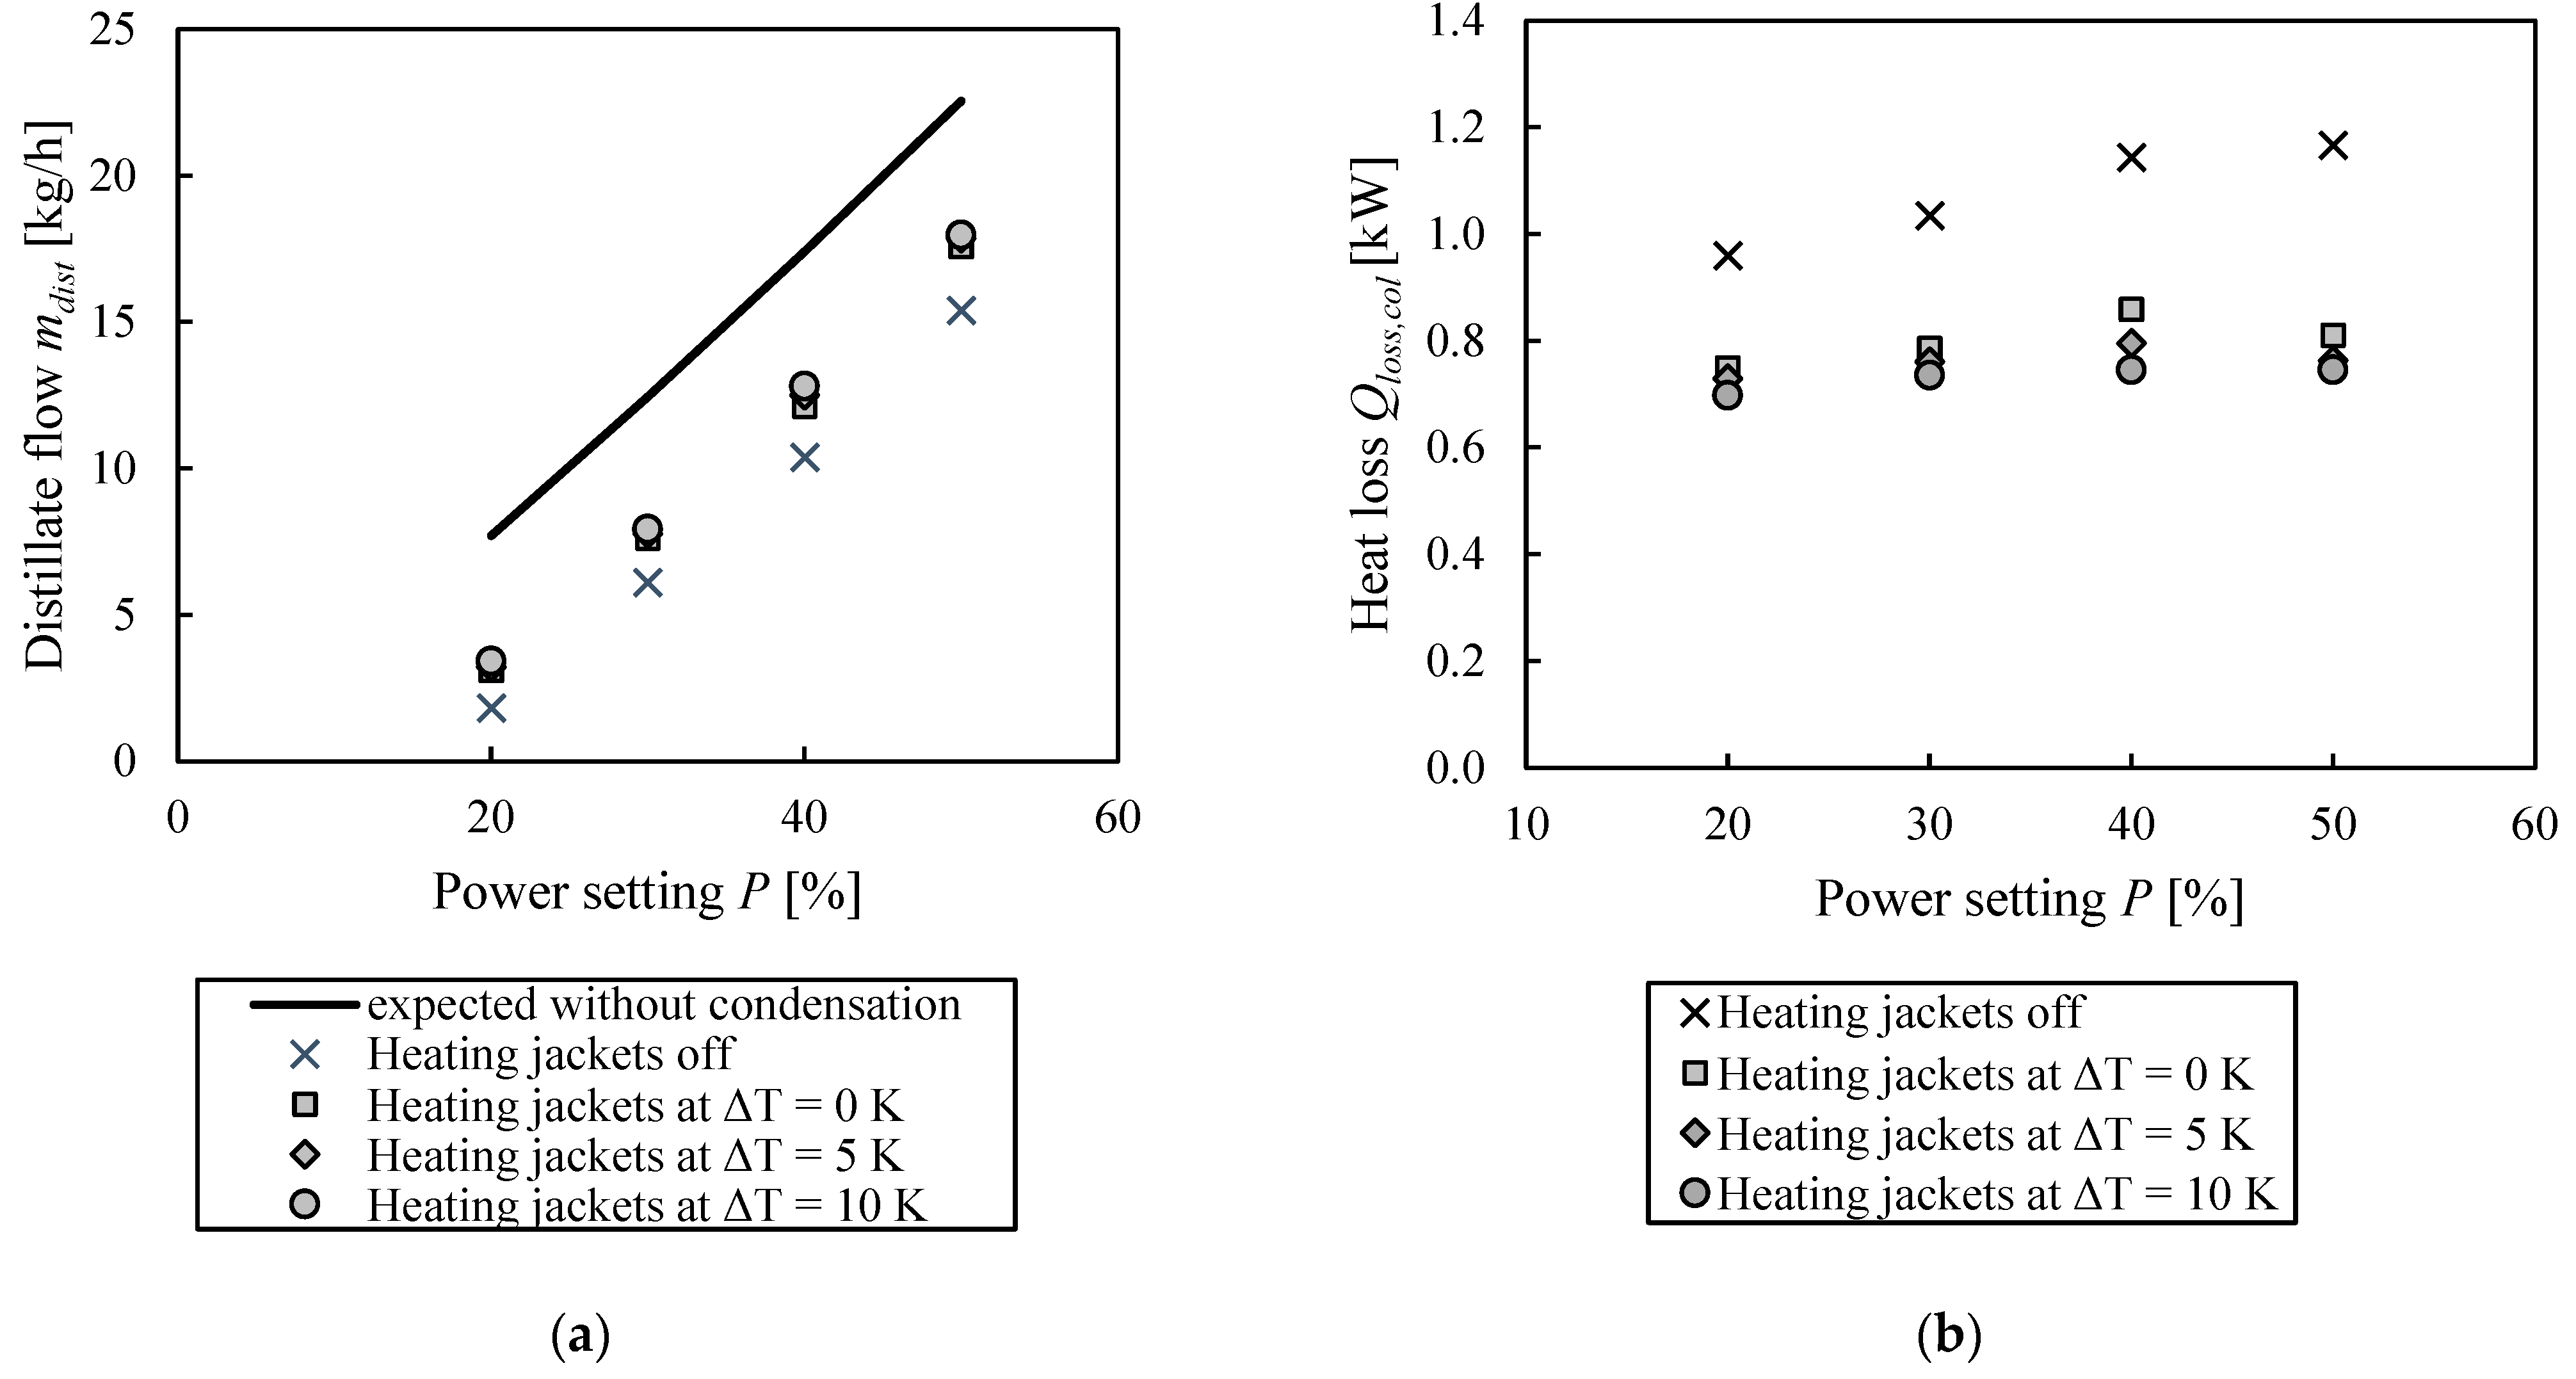
Section 2.3 was performed at different power settings of the evaporator and different settings for the heating jackets. In one case, they were turned off, and in three other ones, they were controlled according to the inner temperature of the column. Then, the temperature of the heating jacket was set to be 0, 5 and 10 K higher than the inner column temperature. The resulting values for the measured distillate mass flows in comparison to the expected flows without heat loss are shown in
Figure 7a. The original experimental data is also given in the supporting information. In all cases, the measured distillate flows are notably below the expected flow, considering that there is no condensation. If the heating jackets are turned on, the distillate flow increases. However, it cannot be concluded for sure if this is due to there being less heat loss from the wall because of a lower temperature gradient or if the additional heat input causes the undesired evaporation of the liquid. Also, a very slight impact of the set temperature difference of the heating jackets is visible. For the same power setting, a higher temperature difference between the heating jackets and the inner column temperature results in a slightly higher distillate mass flow. However, the effect is smaller than expected, and there is still a significant difference with the expected distillate flow without condensation.
Based on the measured distillate flows, the heat losses were calculated according to
Section 2.3, and the results are shown in
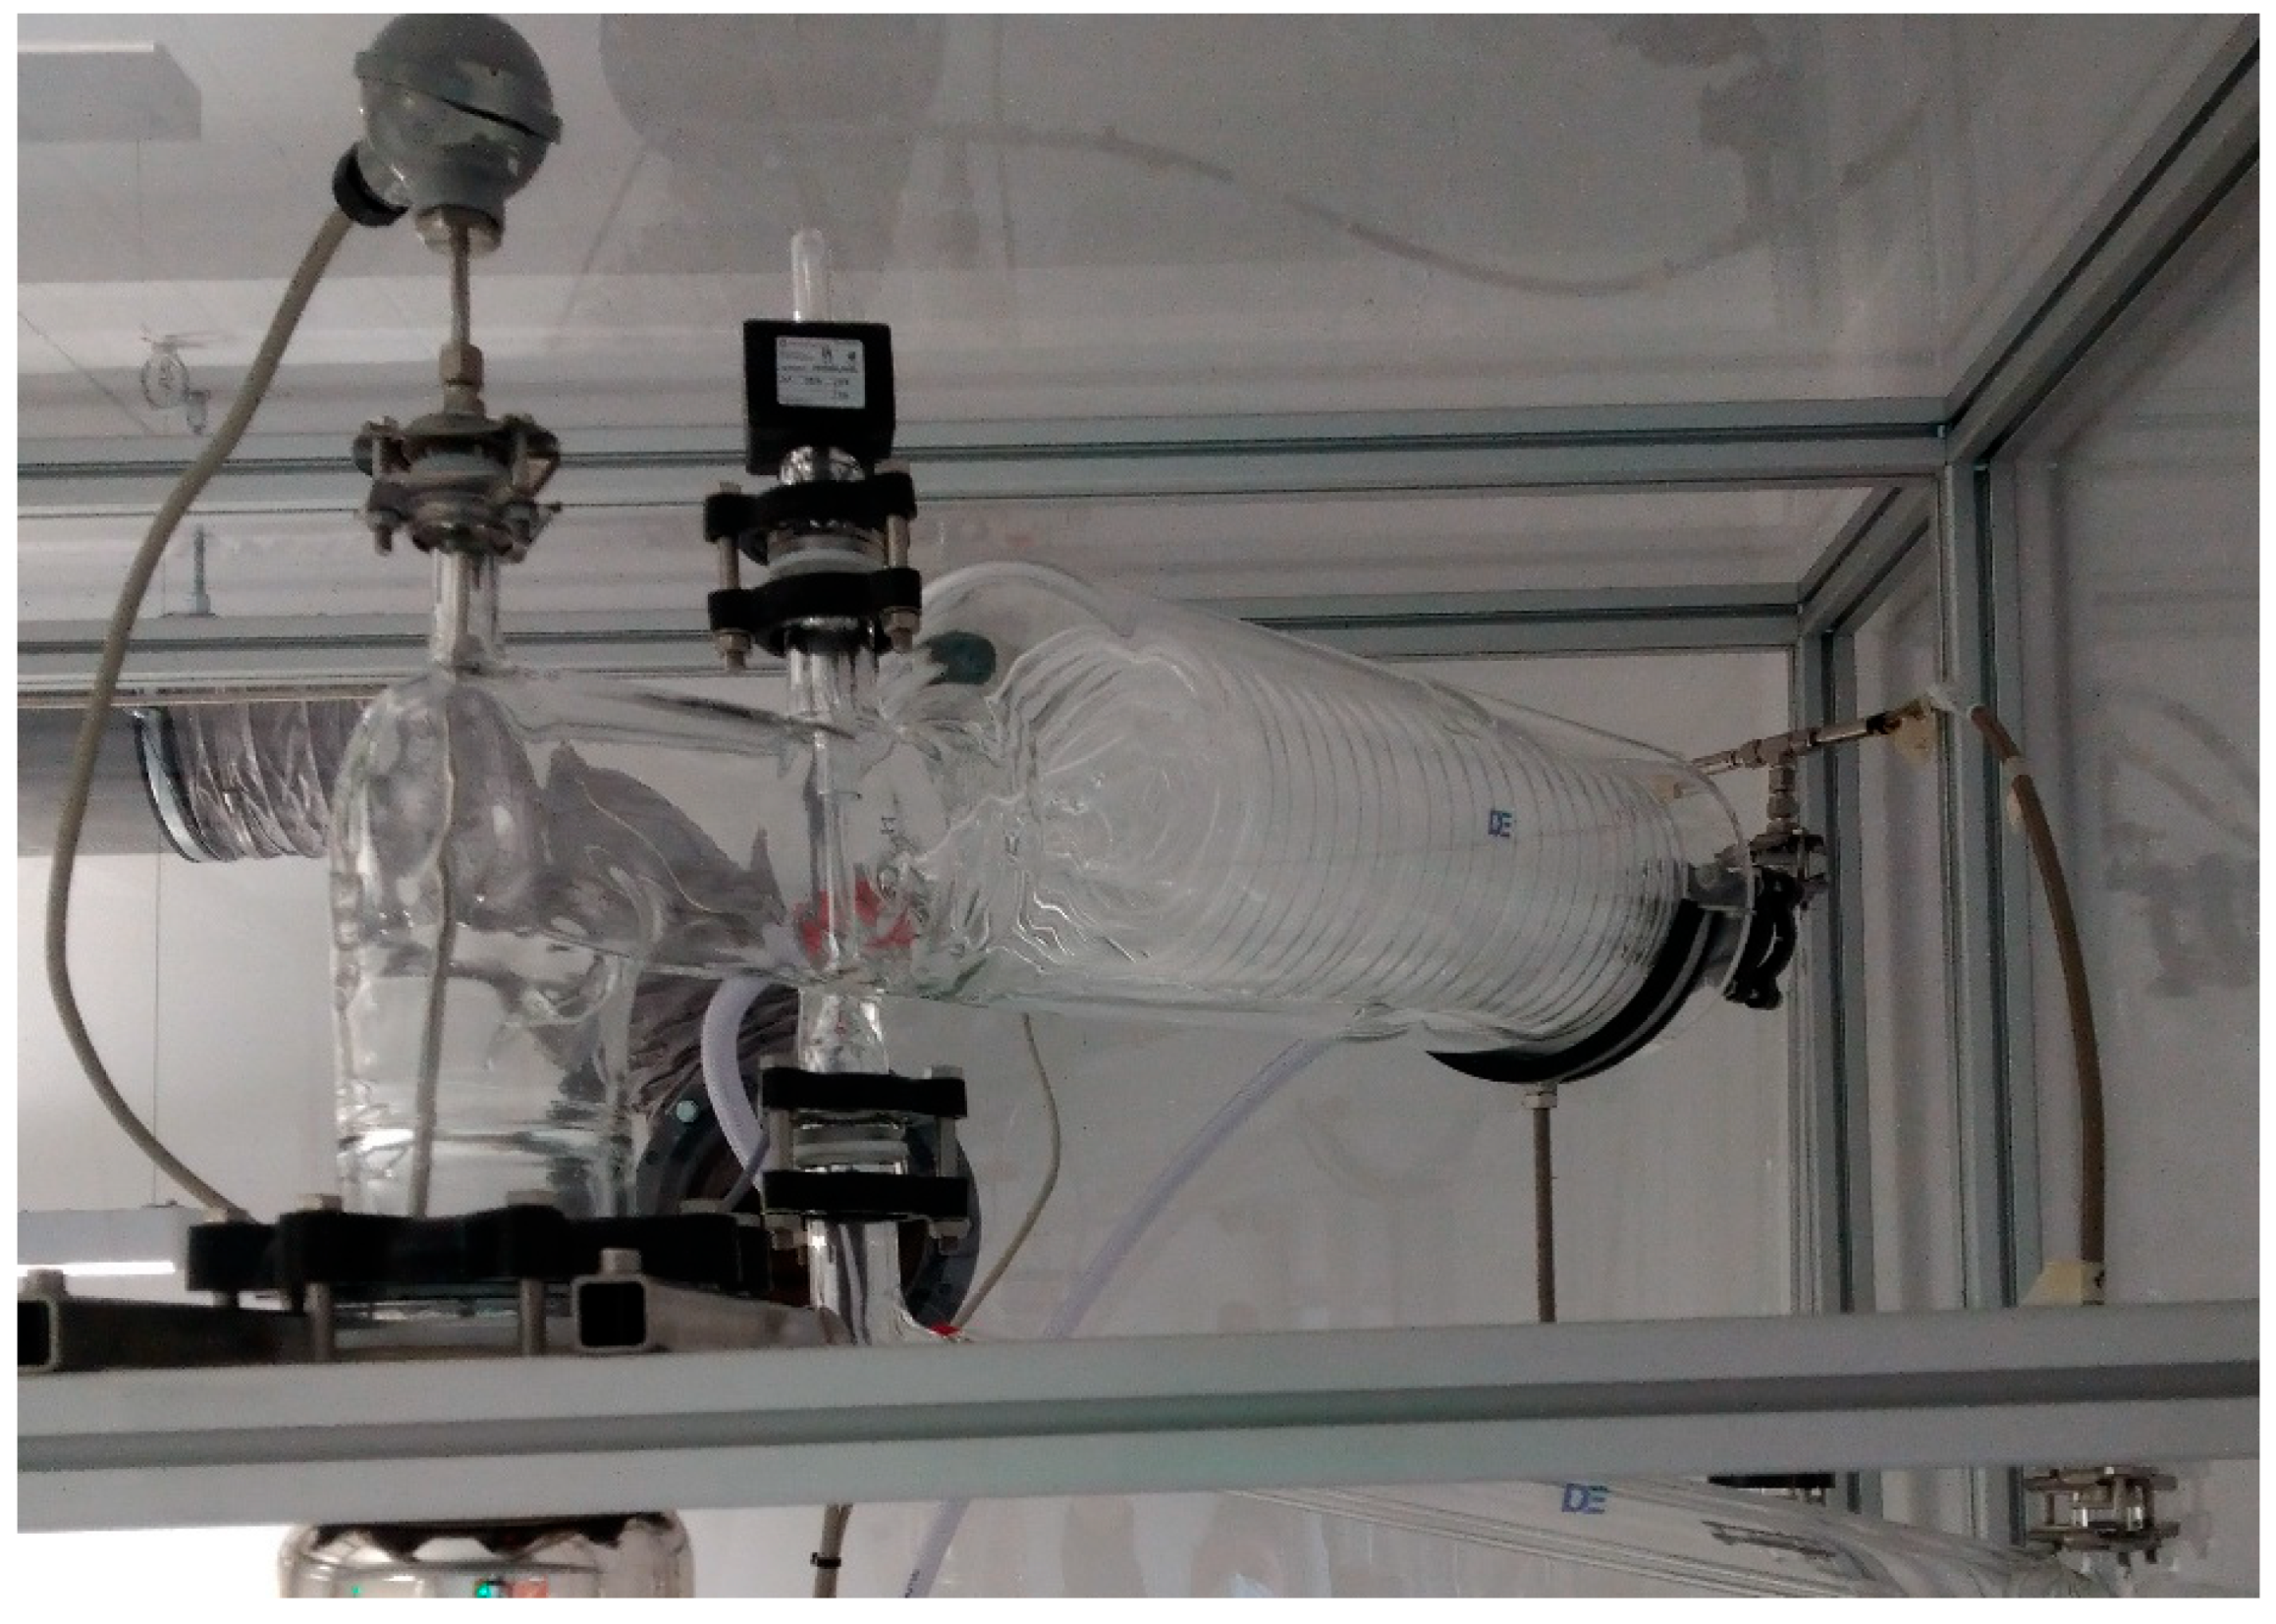
Figure 7b. The exact calculation steps can be found in the supporting material. First of all, it can be observed that the heat losses throughout the column height are in the range from 0.7 to 1.2 kW and that they increase slightly with increasing power. This could also be caused by different fluid dynamics at the column walls with different liquid and vapor loads. Nevertheless, the effect becomes rather negligible when we compare the results at 40 and 50% power levels. Also, the influence of the heating jackets setting is apparent. If they are turned off, they only function as an additional insulation layer, and the heat losses are significantly higher compared to those of the runs where they are turned on. Also, a higher temperature difference between the jackets than that in the inner column is beneficial, even though the impact is rather small. However, with additional external heating, still, significant heat flows are lost. One reason for this might be in the condenser itself, as it has a rather big uninsulated area made out of simple glass, as visible in
Appendix B in
Figure A1. In the literature, it is stated that the glass part before the reflux splitter is usually responsible for significant heat losses [
9]. Nevertheless, the total amount of heat lost throughout the column height is reasonable compared to in the literature data. As mentioned before, other authors reported heat losses of 250 W throughout the column height [
18], where the surface of the packed column parts from the reference is approximately 2.5 times smaller than the column used in this work. If the heat input is scaled up proportionally with the surface area of the plant, the resulting heat loss is 600 W, which is relatively similar to the presented results. Compared to the cited paper, the present column also has more sensors per segment, and thus, more flanges.
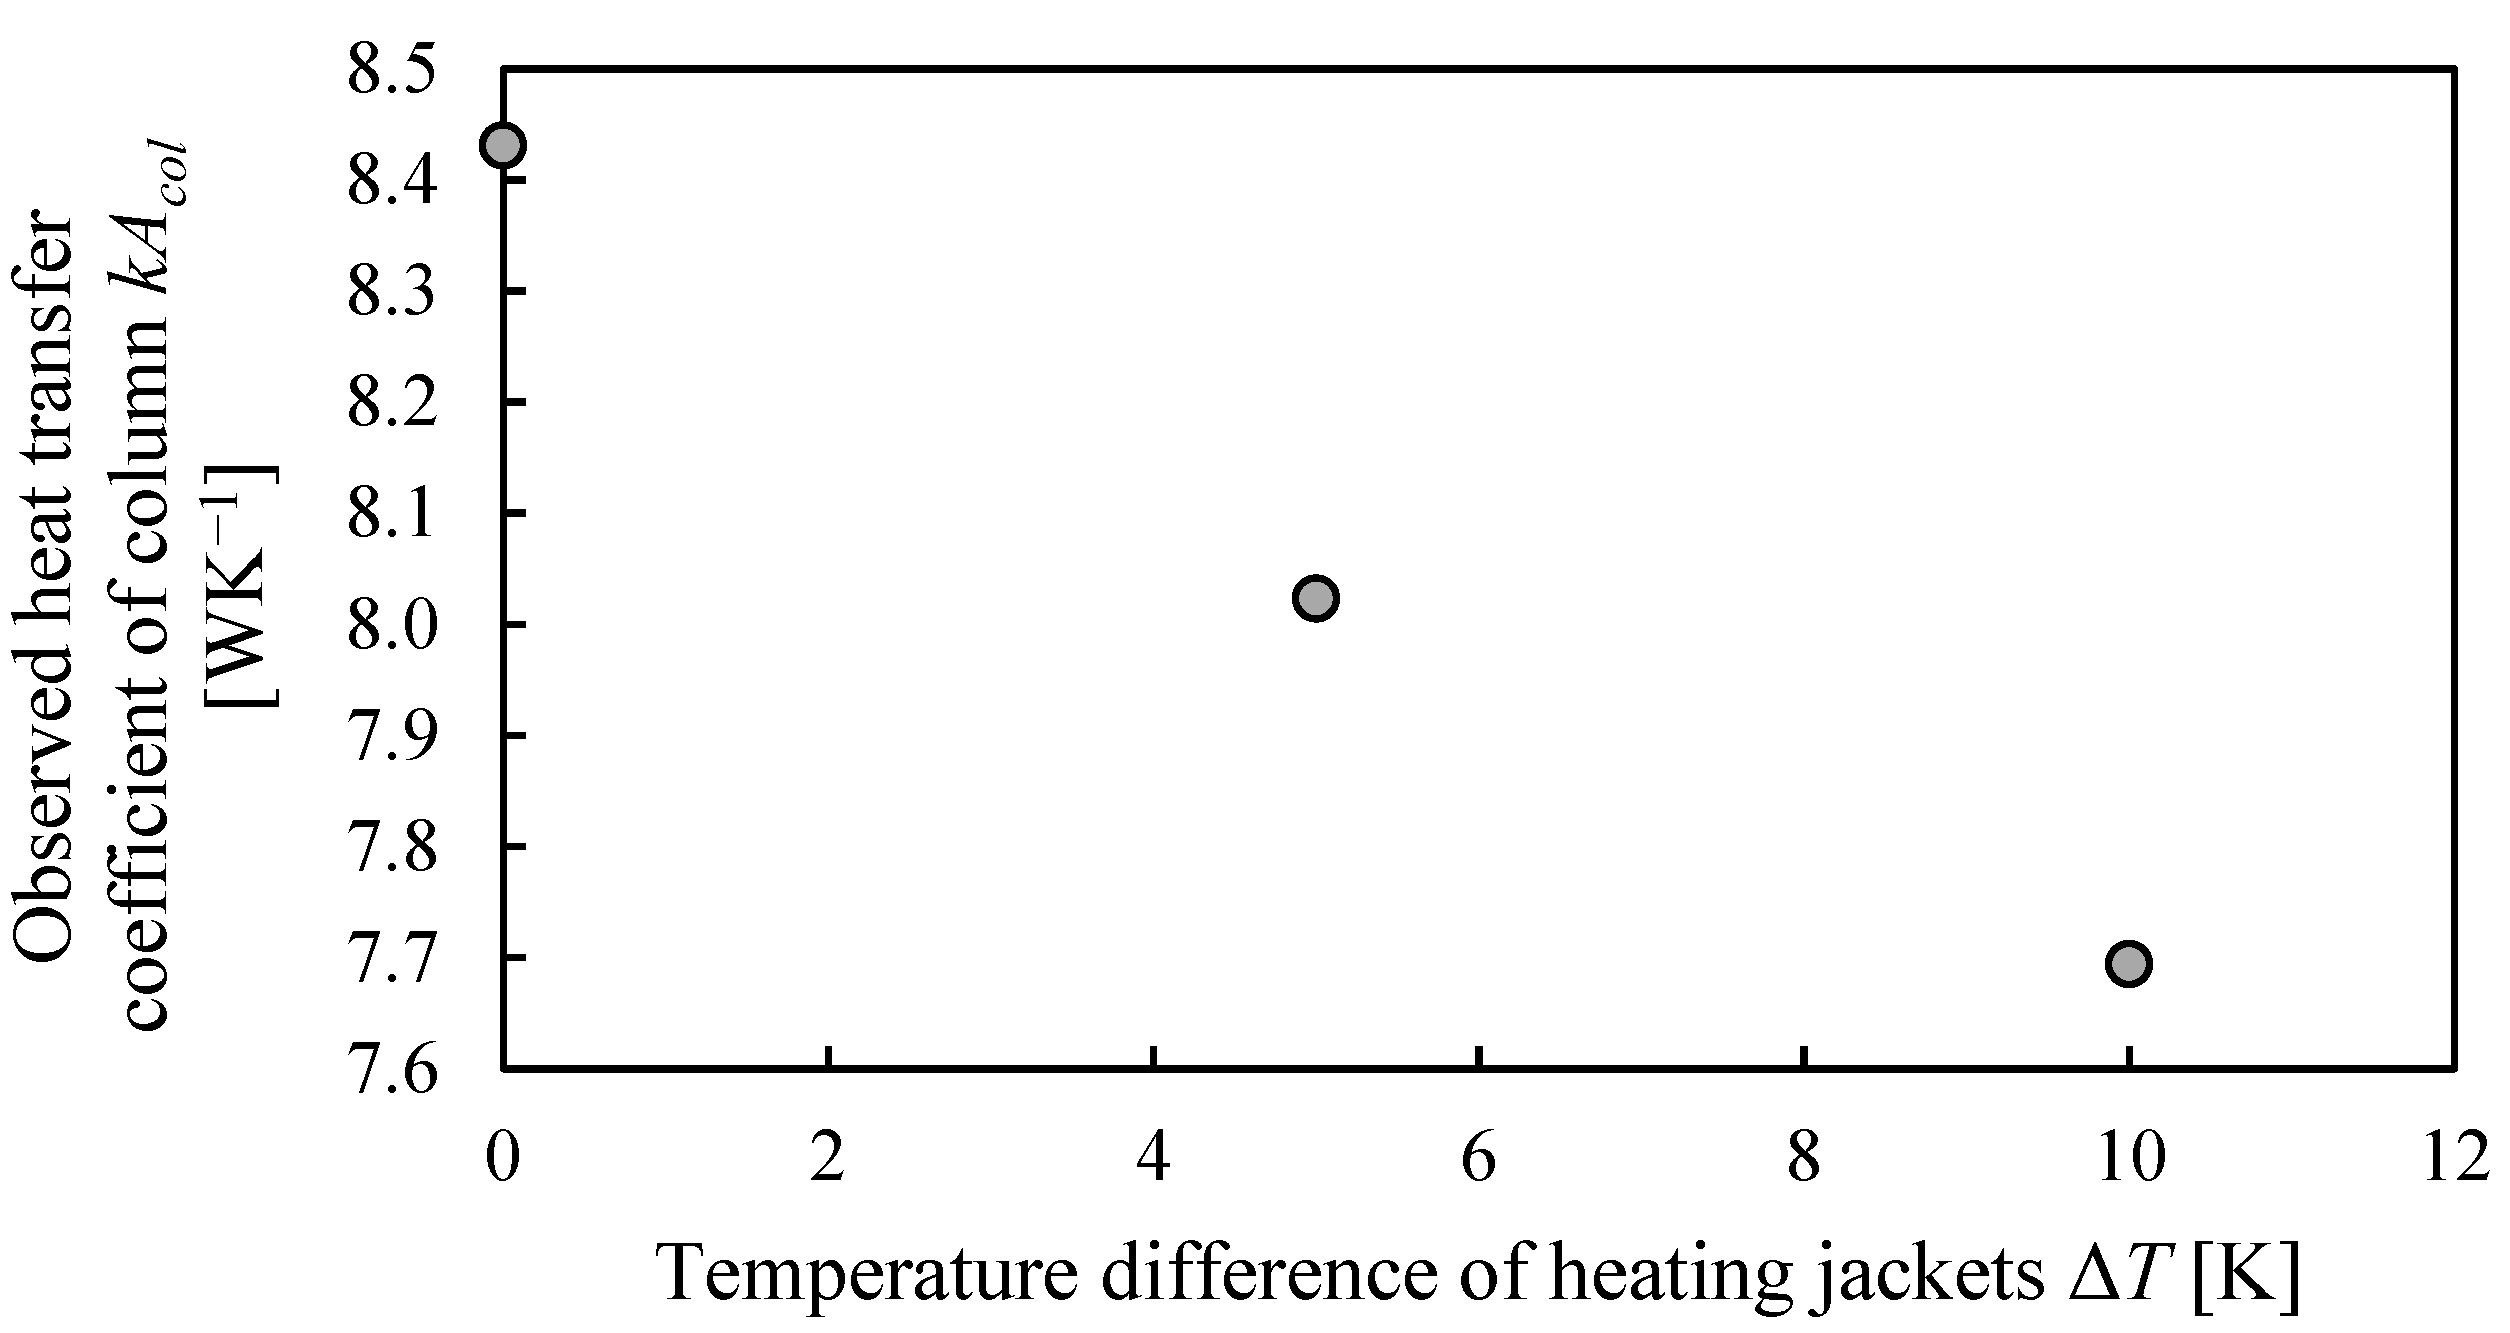
Based on Equation (2) the observed heat transfer coefficient multiplied with the area can be derived, which is shown in
Figure 8, again the calculation steps can also be found in the supporting information.
As expected, the heat transfer coefficient becomes lower for higher temperature differences. The derived value of kA can then be used to estimate heat losses from the column wall during normal column operation, where a temperature profile was obtained in the column instead of a constant temperature, as in the performed experiments in this work.
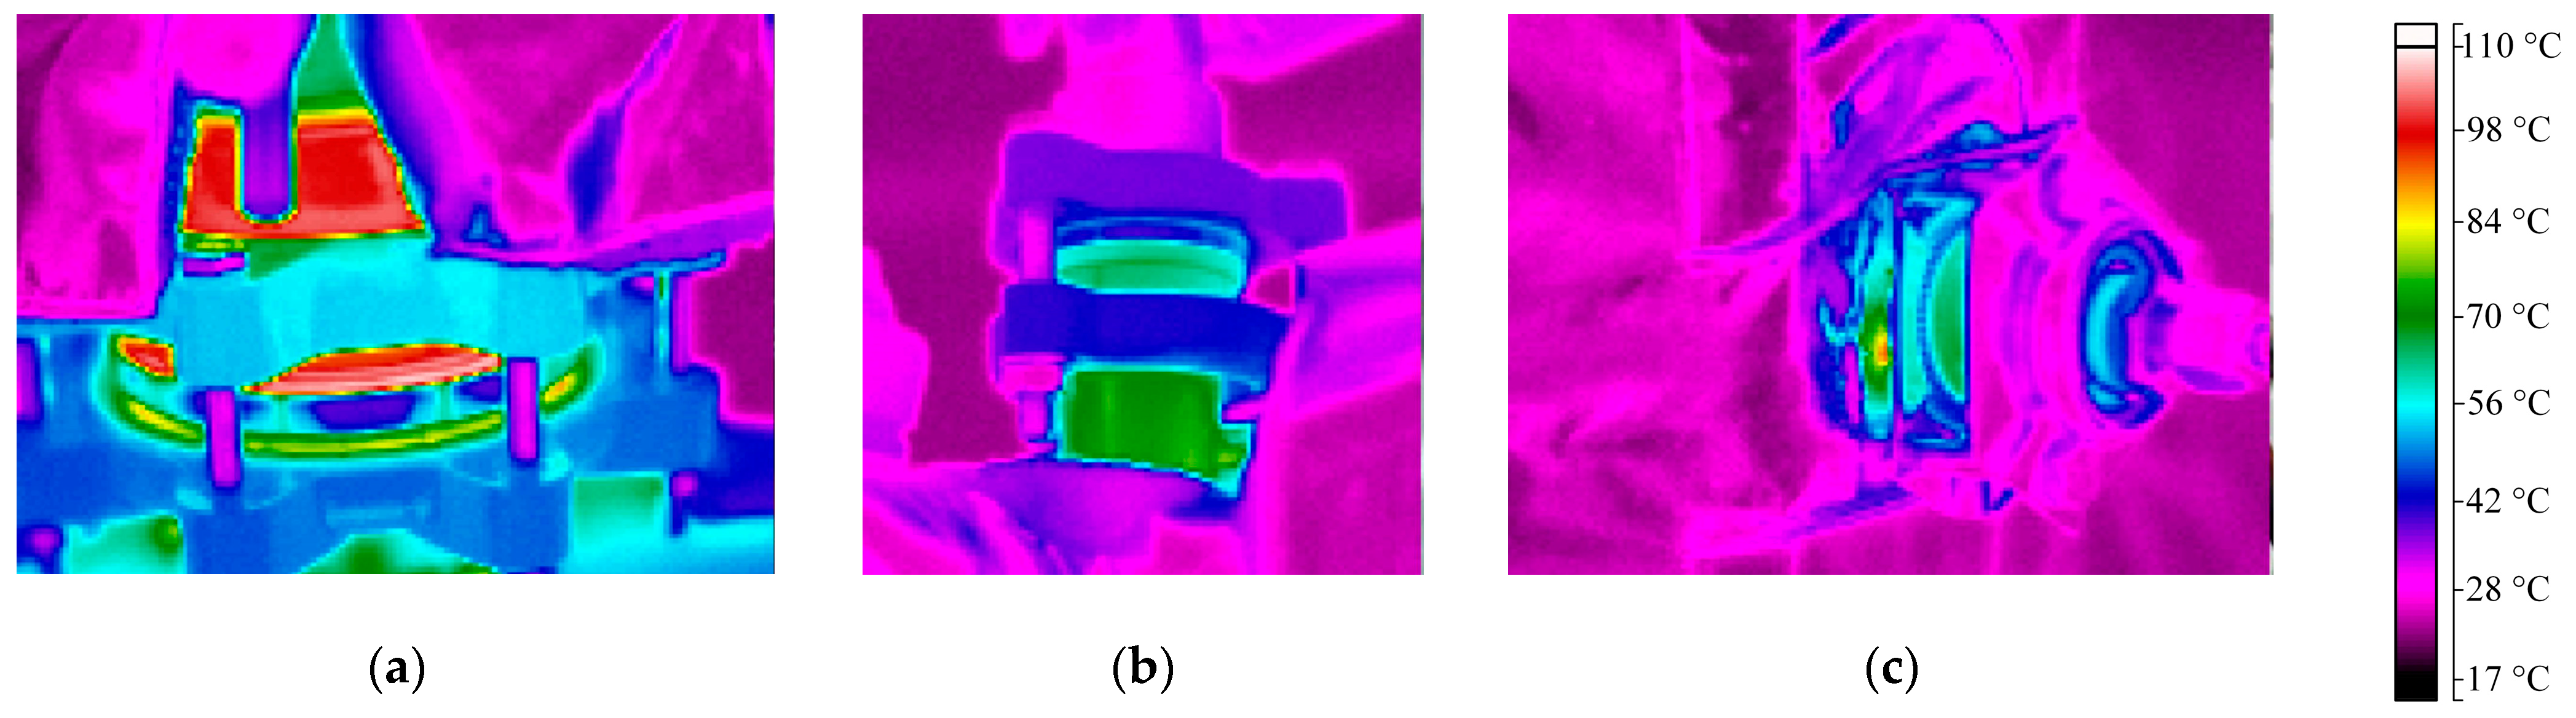
Similar as for the evaporator, thermal images were used to identify additional sources for the heat losses throughout the column height, and these can be found in
Figure 9. The pictures were taken in an experiment where the heating jackets were turned off; so, an increased temperature was not caused by the jackets, but by heat conduction through the column walls. Again, the flanges between different segments and the sensors show rather high temperatures and are thus a significant source of heat loss. Since the heating jackets have recesses in these areas, these heat losses cannot be completely avoided.
All in all, around 0.8 kW of heat was lost through the column walls, even with running heating jackets. Increasing their heating temperature does reduce the problem slightly; however, some thermal bridges at the flanges will always cause some heat loss. Additionally, the heat input of the jackets should not be too high, as this then could cause the opposite effect to that which is desired: the evaporation of liquid.
4. Summary and Conclusions
In this work, experimentally measured heat losses from a multiple dividing wall distillation column in a pilot-scale study are presented and discussed. The methodology itself was found to be suitable, and the obtained results are in reasonable accordance with the literature data. The approach and main findings are shortly summarized here and followed by the main conclusions.
First, the manufacturer’s statement regarding the heating rods power was double-checked via the observation of the temperature increase in the reboiler from 20 to 30 °C at different power settings and found to be correct. Then, heat losses from the evaporator were determined as the temperature increase at elevated inner temperatures and different power settings. It was found that already significant amounts of energy are lost at the evaporator itself. The main cause for this was identified with a thermal imaging camera to be the flange connecting the heating rods with the evaporator shell; however, at other connections, some energy is also lost. It could also be seen that the insulation of the shell itself avoids significant heat losses as its surface temperature is significantly lower than the inner temperature of the evaporator. Based on the obtained data, the actual heat input available for the evaporation of liquid in the evaporator was calculated, which was again used to estimate the evaporated vapor mass flow at given power settings of the heating rods. In a last step, the heat losses from the column itself were determined. For this, several experiments were performed in which butanol was evaporated, and the vapor mass flow arriving at the top of the column was measured. The observed mass flow was then subtracted from the expected one based on the energy input at the evaporator resulting in the condensed vapor. Then, with the heat of vaporization of butanol the heat loss throughout the column height can be determined. It was found that around 1–1.2 kW is lost throughout the column height if the heating jackets are turned off. This value can be reduced to 0.7–0.8 kW if the heating jackets are running. However, no strong impact of their set temperature value was found; so, some of the heat might be lost in non-covered areas like the flanges or the front part of the condenser.
From the presented results, it can be concluded that additional external heating throughout the column height is useful for small-scale distillation columns in order to avoid undesired condensation due to heat losses. Additionally, the number of flanges should be kept as small as possible, and the present ones should be insulated properly. In order to increase the thermal efficiency of the column, the evaporator itself is important as it has the highest temperature in the plant. The proper insulation of the shell is thus absolutely required. This applies, in particular, to evaporators out of materials with a high-level thermal conductivity.
The authors would like to emphasize that heat losses cannot be avoided totally, and even with a proper insulation system, energy is still lost to the environment. Especially for small-scale distillation columns, these heat losses can strongly affect the vapor and liquid loads inside the column, and thus, also its separation efficiency. In the literature, it is often stated that these heat losses are neglected; however, this can significantly reduce the predictive power of simulations. Overall, the authors recommend that researchers quantify the heat losses from these small-scale columns using a similar approach.


