Article

An Integrated Approach to the Hydrothermal Carbonization of Sewage Sludge: Simulation, Modeling, and Life Cycle Assessment

by
Riccardo Bacci di Capaci
1,
Andrea Luca Tasca
1,
Riccardo Gori
2,
Sandra Vitolo
1,
Monica Puccini
1,* and
Gabriele Pannocchia
1
1
Department of Civil and Industrial Engineering, University of Pisa, 56122 Pisa, Italy
2
Department of Civil and Environmental Engineering, University of Firenze, 50139 Firenze, Italy
*
Author to whom correspondence should be addressed.
ChemEngineering 2023, 7(3), 44; https://doi.org/10.3390/chemengineering7030044
Submission received: 19 January 2023 / Revised: 21 March 2023 / Accepted: 21 April 2023 / Published: 4 May 2023

Abstract

:
Sewage sludge management at wastewater treatment plants is becoming a more and more challenging task. Here, an innovative integrated modeling approach is developed to investigate the optimization of a municipal wastewater treatment plant (MWWTP) by the inclusion of hydrothermal carbonization (HTC). To this aim, two alternative plant layouts have been considered: (i) a conventional activated sludge-based treatment plant, i.e., based on thickening, stabilization, conditioning, and dewatering; (ii) additional hydrothermal carbonization and integrated treatment of the spent liquor in the sludge line. An Italian MWWTP has been selected as a case study, and three different scenarios have been implemented in the process simulation software World Wide Engine for Simulation Training and Automation (WEST) by considering the effect of the different digestion times in the aerobic reactor. Then, according to the Design of Experiment (DoE) methodology applied both on simulated and experimental data, and by the use of a Python code, the desired models have been developed and compared. Finally, a Life Cycle Assessment (LCA) study has been carried out to estimate the impacts on human health, ecosystems, and resources. The integration of HTC corresponds to the generation of a valuable product (the hydrochar), whereas the conventional layout is associated with high disposal costs of the sewage sludge. According to LCA results, a sludge age of 40 days is recommended due to the lowest impacts estimated, both with and without a HTC section. This has been ascribed mainly to the electricity demand of the sludge line, which increases with the excess sludge flow rate, i.e., as the sludge age decreases.

1. Introduction

Conventional municipal wastewater treatment plants (MWWTPs) include pretreatments, such as bar screening and degassing, followed by primary and secondary treatments, i.e., air flotation, primary sedimentation, a biofilm process/activated sludge process, and secondary sedimentation. To further improve the effluent quality, tertiary treatments (e.g., membrane filtration, advanced oxidation) can be carried out [1]. The raising of the population, together with ever more demanding regulations, result in an increased production of sewage sludge, which is the main by-product of wastewater treatment plants [2]. Sewage sludge is a solid/liquid heterogeneous suspension with an initial solid content of 1–4% by weight. Regardless of the primary source and the MWWTP layout, it generally comprises a nontoxic organic fraction, nutrients, and a hazardous fraction (pathogenic microorganisms, organic contaminants and heavy metals).
Among the wide range of technologies available for treatment and disposal, resource recovery, and power generation, hydrothermal carbonization (HTC) is emerging as a promising technique able to meet all of these process objectives [3]. Indeed, HTC does not require preliminary drying, as it operates with sub-critical water and autogenous pressure, converting the feedstock into a solid carbonaceous fraction, named hydrochar, and a water-soluble organic fraction, the spent liquor [4,5]. The main transformations occurring during the process are the hydrolysis and dehydration of cellulose, hemicellulose, and lignin to monosaccharides and disaccharides, which are then dehydrated, hydrolyzed, and decarboxylated to intermediate fragments, which are finally re-condensate into the hydrochar matrix.
While the conventional process layout implies high disposal costs of sewage sludge, the integration of HTC with a traditional wastewater plant corresponds to the generation of a valuable product [6,7]. As a matter of fact, hydrochar can be employed in several fields [8]: in industry, as a combustible from a renewable source [9,10,11]; agriculture, as fertilizer [12]; wastewater treatment itself, as an adsorbent material [13]; and soil remediation [14,15].
Several studies have applied different models into wastewater management, by involving different process technology including HTC [16]. In [17], the role of process simulation in designing, evaluating, and optimizing wastewater treatment facilities was discussed. In particular, alternatives for controlling VOC emissions from plants and removing dissolved solids from clarified effluent streams were evaluated. Later, an artificial neural network to model the activated sludge process of two different MWWTPs was developed by [18]. More recently, in [19], a hybrid model of a MWWTP was designed, which is meant to improve the quality of effluent prediction, by combining mechanistic, i.e., an activated sludge model, and data-driven models. In [20], the influence of solid loading on characteristics of hydrochar, process water, and plant energetics was investigated. In detail, by modeling an experimental facility with Aspen Plus, the authors showed that the integration of anaerobic digestion with HTC provides a significant positive energy balance when process water and hydrochar are considered as fuel sources for cogeneration. Finally, in [21], HTC was evaluated as a possible treatment for sewage sludge, by including phosphorus recycling. In particular, Aspen Plus modeling was used to show the positive impact of implementing HTC in a WWTP: the mechanical dewaterability of sewage sludge increases, enabling energy savings by means of subsequent thermal drying. A phenomenological-based semi-physical model (PBSM) was developed by [22] to predict and describe the dynamic behavior of the oxygen transfer in a diffused aeration process of a WWTP by means of a formal modeling methodology. The authors of [23] showed how sewage systems can be modeled and controlled within the framework of model predictive control (MPC). Several MPC-based strategies were proposed, accounting for the inherently complex dynamics and the multi-objective nature of the control required. Finally, in [24], different structures and configurations of artificial neural networks were used for the prediction of influent biological oxygen demand and WWTP performance.
Life Cycle Assessment (LCA) is a well-established technique to quantify the impacts associated with a product, service, or process by using a cradle-to-grave perspective. LCA was first applied in the 1990s in the field of wastewater treatment [25], and it nowadays proves to be a key tool to estimate impacts of design and operation decisions, as demonstrated by the many works available in the literature [26,27,28]. LCA has been also applied to investigate hydrothermal carbonization processes. In [29], the case of HTC from olive mill waste was investigated, while in [30] the general scenario of food wastes was considered. In [31], a process simulation model in Aspen Plus was developed to obtain the main data for the required input-output inventories to perform both techno-economic and life cycle assessment study. In addition, in [32], the processes of HTC were investigated with and without sewage sludge digestion as well as energetic and agricultural utilization, examining twelve different valorization concepts of sewage sludge on the basis of empirical and literature data. More recently, in [33], a LCA analysis of hydrothermal carbonization of sewage sludge from an Italian plant and its produced valorization pathways was presented; while in [34], a study was conducted on urban organic solid waste in comparison with a gasification process in southern Chile.
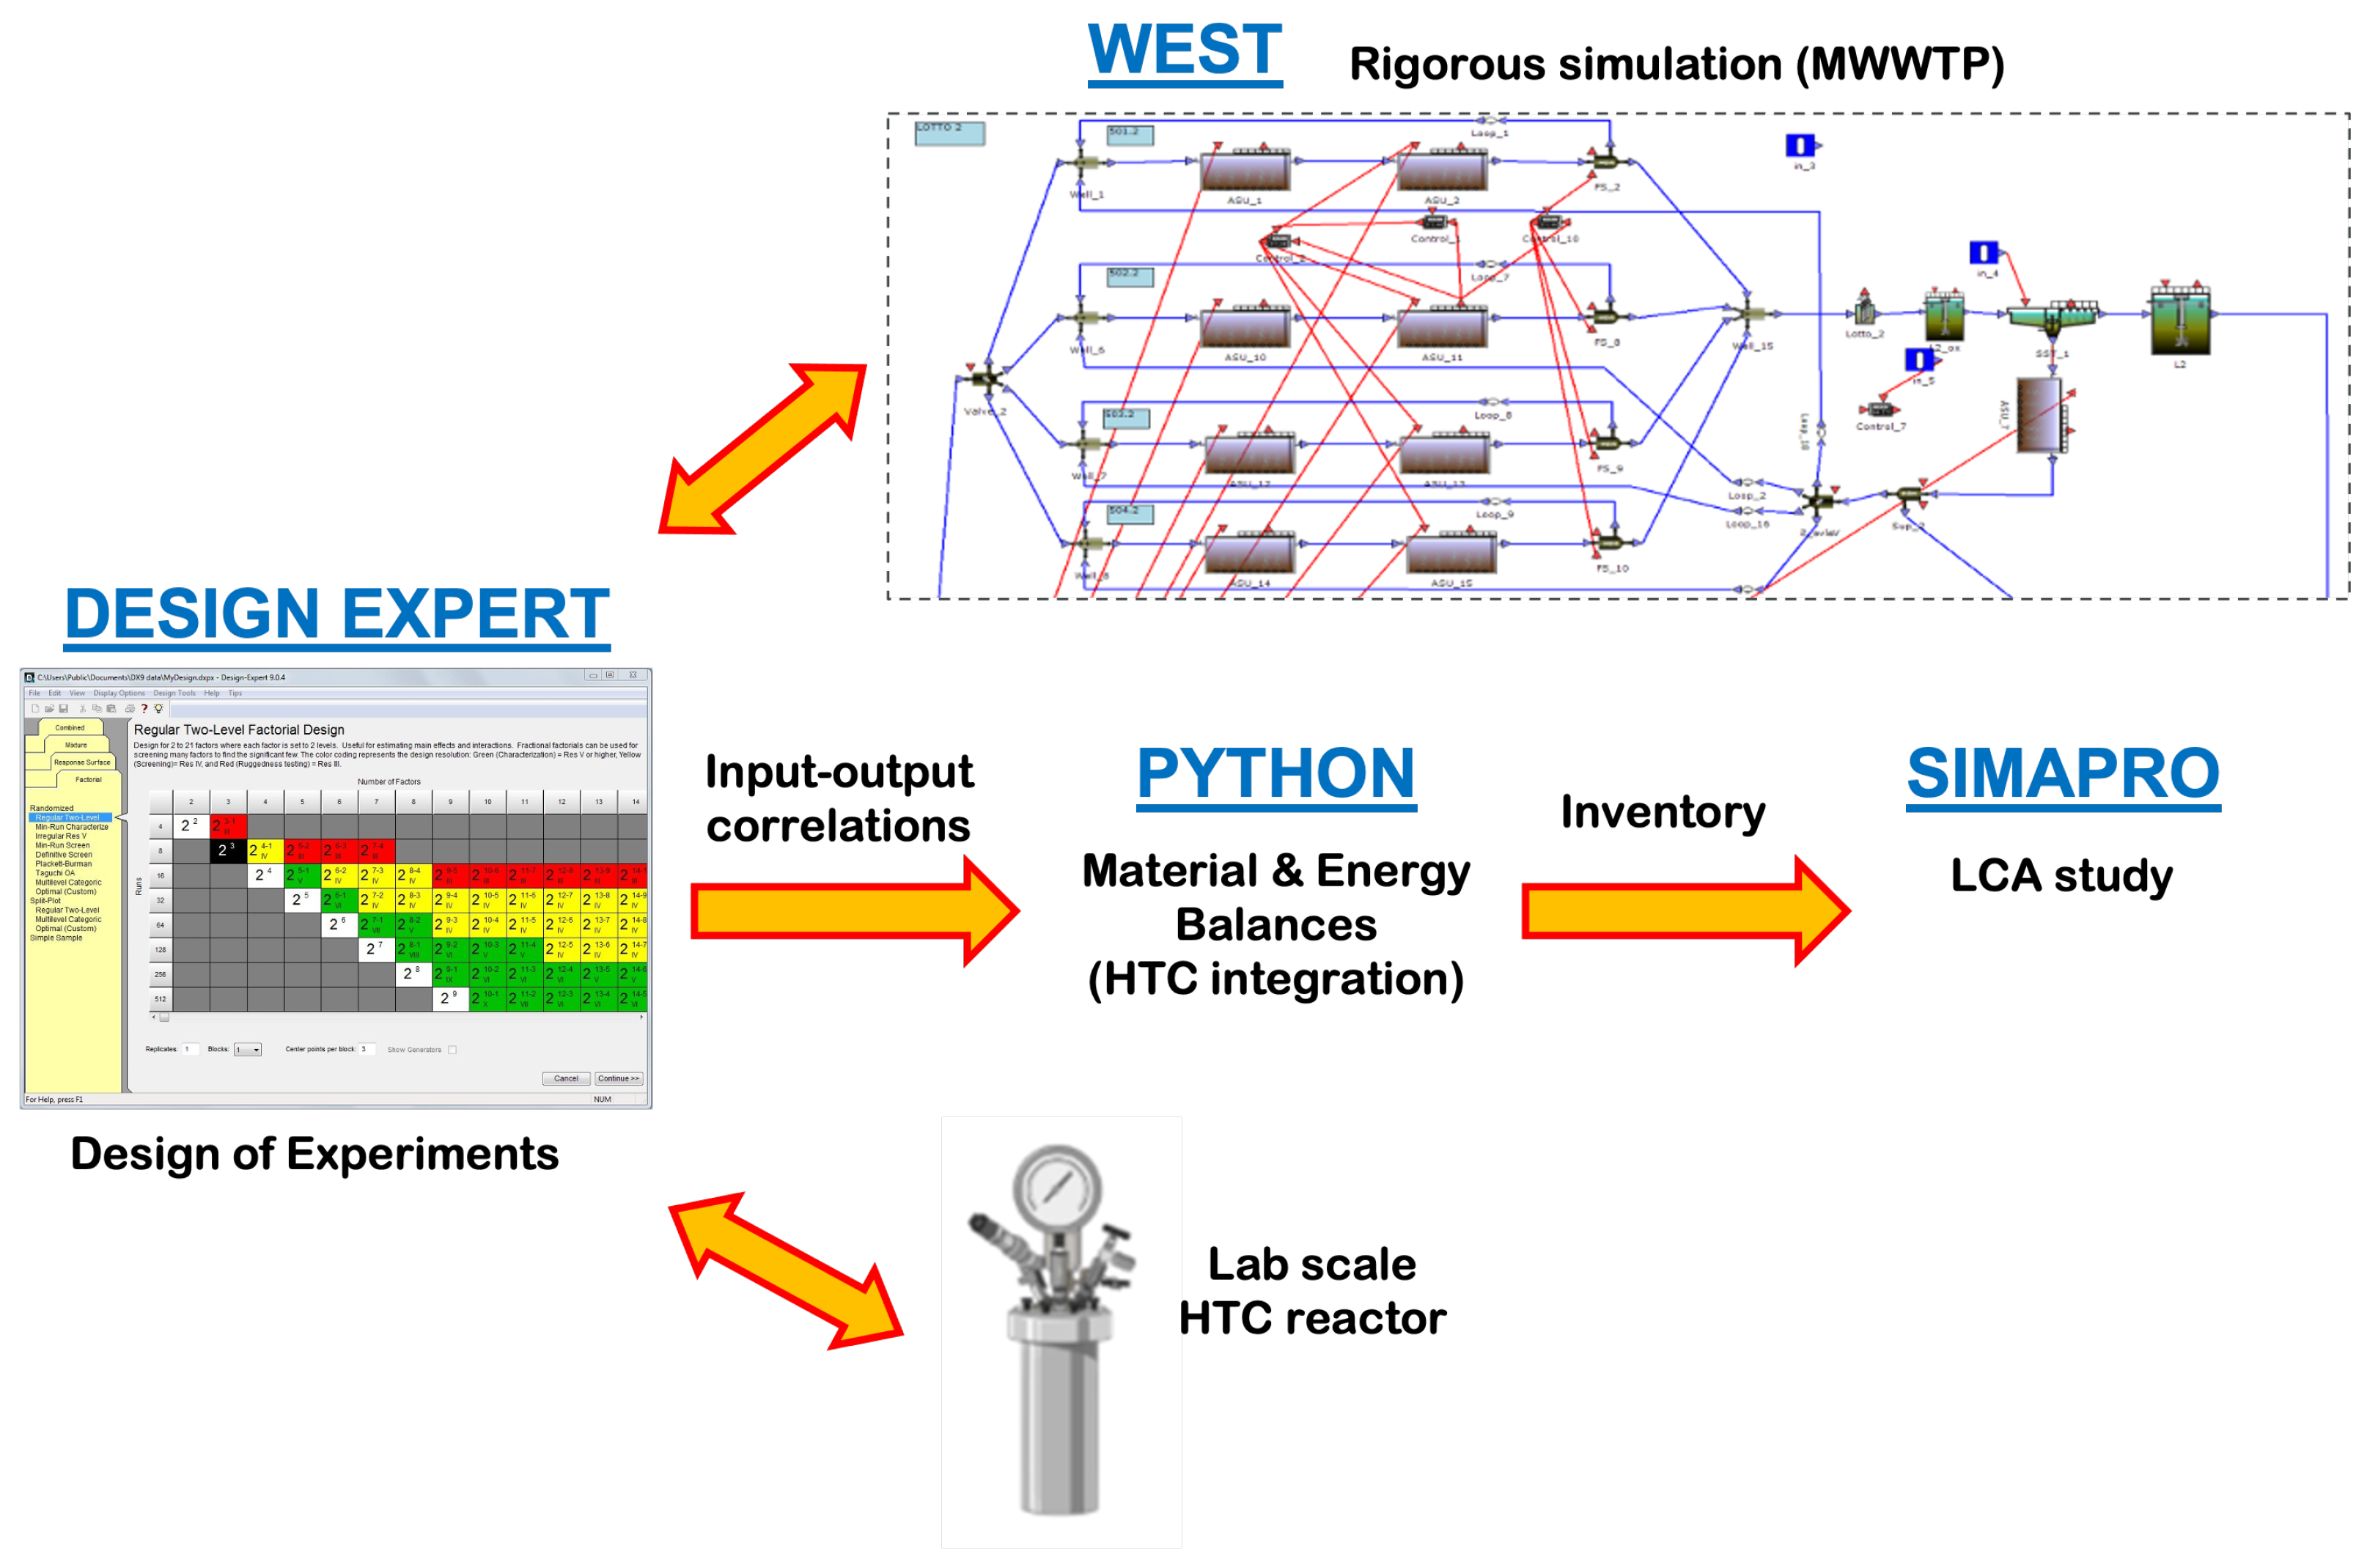
Based on all these premises, the aim of the present study is the integration of a HTC section into the layout of a conventional MWWTP, evaluating the feasibility and the efficiency of the proposed solutions. Firstly, process data were obtained from a set of experiments performed on a WEST rigorous simulator. Then, according to the DoE methodology, these data were used to obtain input-output correlation models in Design Expert software for the wastewater and sludge line of the analyzed processes (Figure 1). These relations were then integrated with mass and energy balances written for the HTC section, and other input-output correlation models were obtained for an HTC reactor from lab scale experimental data, and hence solved altogether within a Python software code. The resulting highly integrated models were employed to evaluate the efficiency of different operating scenarios. Finally, a LCA was carried out on SimaPro to estimate the expected impacts on human health, ecosystems, and resources. Note that an Italian MWWTP was adopted as a case study: the historical plant data were previously used as a reference to test and validate the WEST models, while a set of actual effluent sludge were here employed for laboratory tests for the HTC section. Note that the proposed modeling approach is highly integrated both in terms of software and in terms of data type, which gives novelty to the work and flexibility to the methodology.
The reminder of the paper is as follows: Section 2 describes the case study used to apply the proposed approach; the methodology is illustrated in detail in Section 3, showing how the different software and the various data types are highly integrated. The results are then presented in Section 4, where different plant layouts and process scenarios are compared. Finally, conclusions are given in Section 5.

2. Case Study

The studied MWWTP is the urban plant of San Colombano, near Florence (Italy). The plant has a potential of 600,000 Population Equivalent (PE), i.e., 250,000 m 3 /d, and it is divided into three units operating in parallel of 200,000 PE each. Table 1 summarizes the main characteristics of inlet and outlet streams.
Each of the three units consists of two main sections: (a) the wastewater treatment line and (b) the sludge treatment line, equipped with an anaerobic digester for the production of biogas. The wastewater line consists of: (i) pretreatments: coarse and very fine screening, sand removal, and oil removal; (ii) primary sedimentation, carried out by biological treatment with activated sludge with both anoxic and aerobic section; (iii) secondary sedimentation; (iv) disinfection. The aerators of the aerobic reactors are of the fine bubble type, with micro-perforated PIK300 discs and EPDM membranes. Totally, 1305 diffusers are installed; the number of discs decreases along the flow direction.
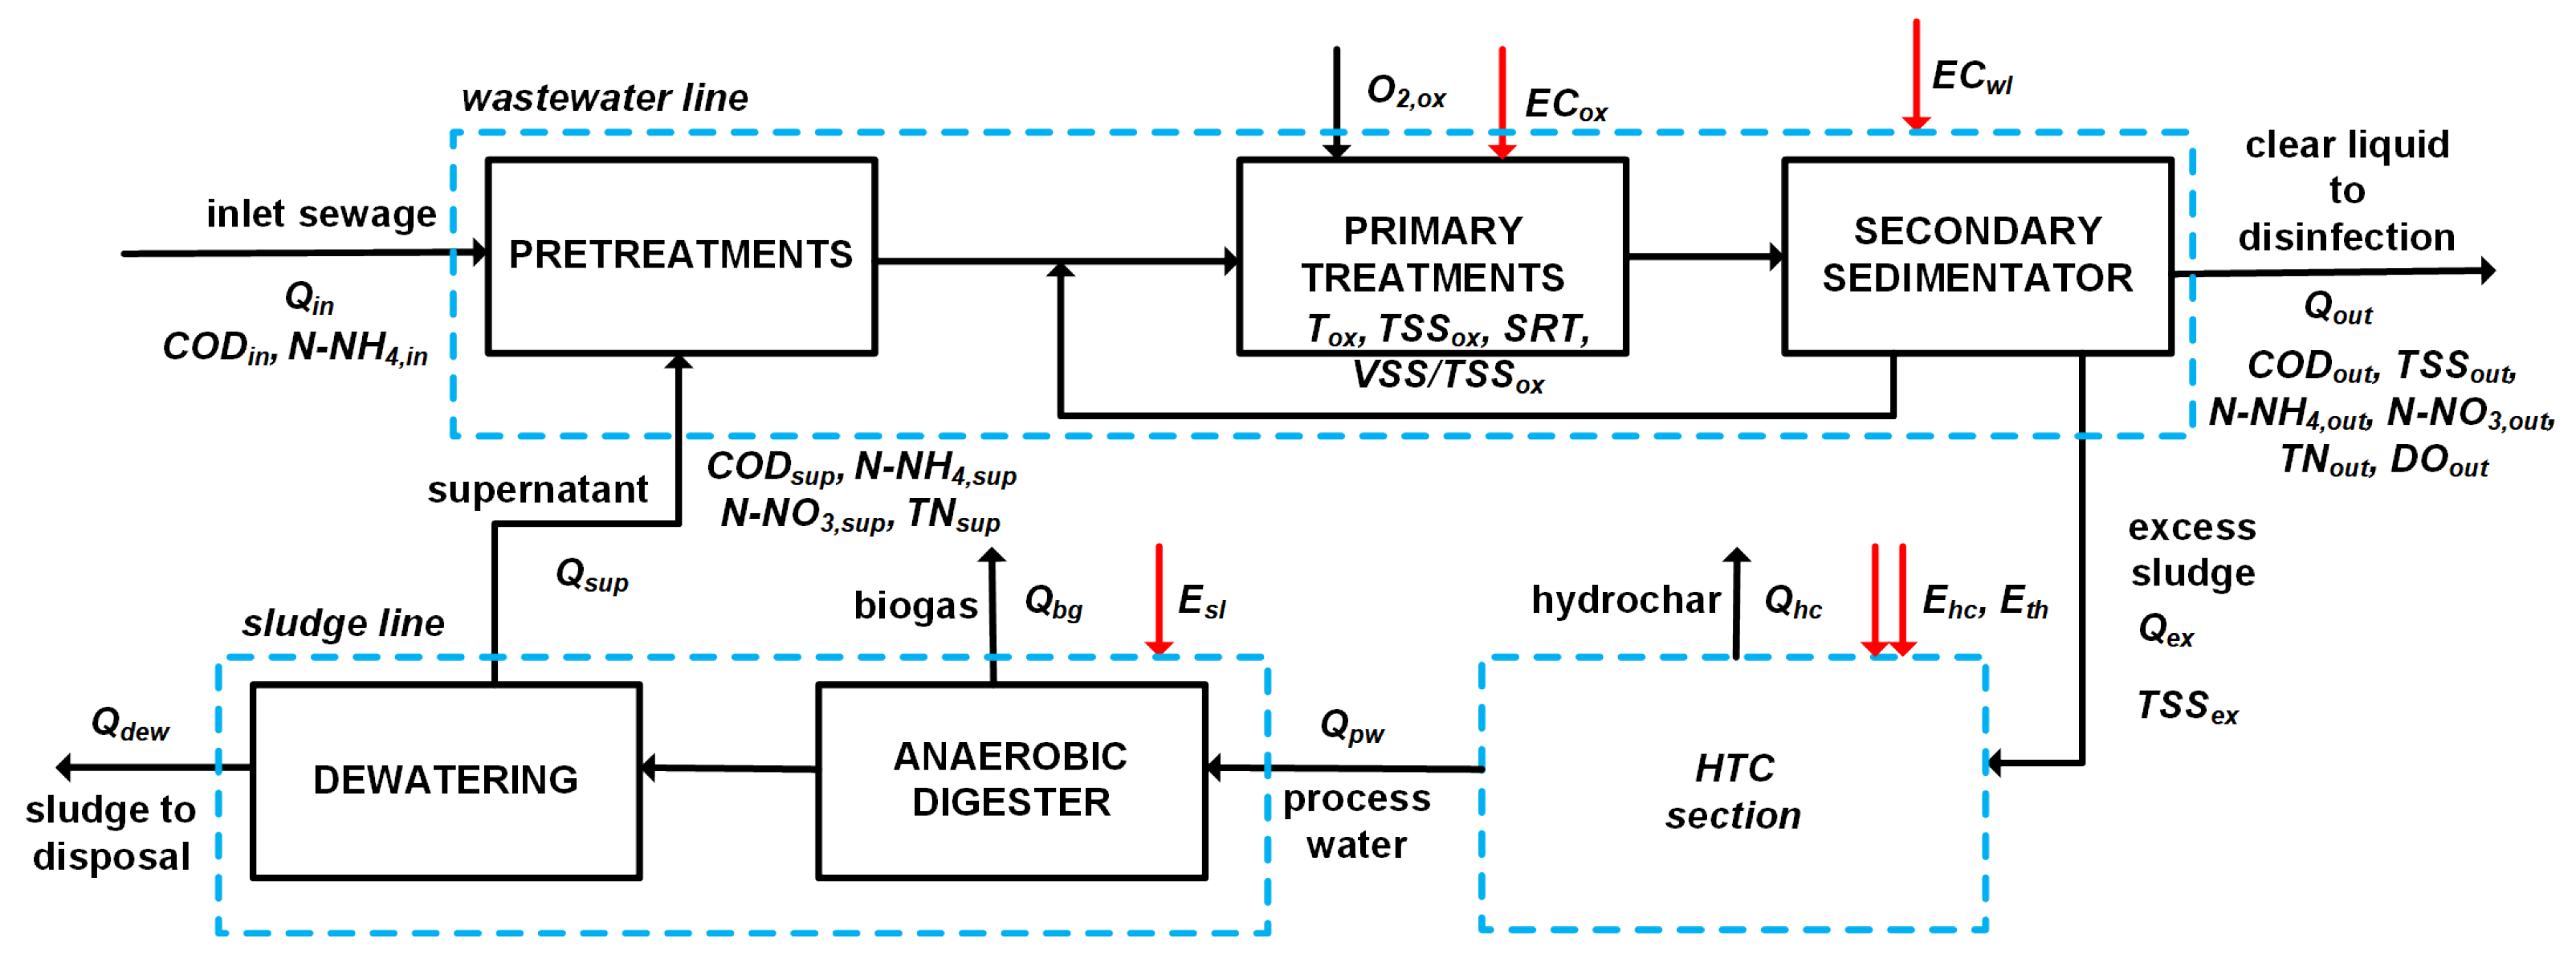
As a result of the HTC implementation, the layout of the considered MWWTP would appear as represented in the simplified flow diagram of Figure 2. The unit operations modeled in this work are shown as different blocks and material and energy streams, and the main process variables are also represented.

3. Methodology

As said, both existing sections—wastewater line and sludge line—were modeled using the WEST platform, then analyzed by the DoE approach to build regression correlation models, which were finally implemented in Python for quantitative assessments.

3.1. Modeling in WEST

The WEST software is a sophisticated tool released by MIKE DHI [35], generally used for modeling and simulating various chemical-physical processes as wastewater purification, river pollution phenomena, and degradation processes occurring in sewers. Nevertheless, it can be easily extended to any system described by algebraic and differential equations. Here, the Activated Sludge Model No.3 (ASM3) of WEST was chosen as a rigorous model for the wastewater line, as extensively tested and discussed by [36]. The HTC section was instead modeled both by mass and energy balances based on the process flow scheme directly in Python and by a DoE study obtained from experimental data on the actual sludge, including the yield of the carbonization reactor, in order to find optimal operating conditions. The HTC treatment was assumed to take place at 220 °C, with a residence time of 4 h and an inlet solid/liquid ratio of 1/15 by weight.
Overall, six different scenarios have been investigated, three based on the conventional layout (named WWTP-i) and three with the integration of a HTC section (WWTP-i/HTC), by considering three different Solids Retention Times (SRTs) in the oxidation tank of primary treatments; i.e., sludge age ‘i’ of 40, 20 and 10 days, respectively. It is worth noting that a SRT of 40 days is not conventionally applied in MWWTPs, which may result in high concentration of suspended solids and induce problems in pollutant removal and sludge sedimentation. Nevertheless, the treatment plant of San Colombano considered in this study actually operates with a very long retention time, around 40 days, since the inlet wastewater is very diluted (compare the values of Table 2). Therefore, to get a processable sludge leaving the secondary sedimentation tank, the corresponding SRT has to be particularly high.
Overall, the modeled scenarios are comprehensive of: (i) wastewater line, with fine and very fine screening, sand and oil removal, Modified Ludzak-Ettinger (MLE) biological treatments, and secondary sedimentation; (ii) eventual hydrothermal treatment, comprising mechanical thickening by centrifugation, hydrothermal carbonization (HTC), mechanical dewatering by filter press, and drying; (iii) sludge line, with mechanical thickening by centrifugation, anaerobic digestion, pumping via a sludge pipeline to a delocalized treatment section, and mechanical dewatering by centrifugation. The simulation of the current state of the real plant was extended to a one-year period (from June to May) to allow suitable calibration and validation of the WEST models.

3.2. Test Plans with DoE

The software Design Expert, released by Stat-Ease Inc., is here used for the application of the Design of Experiments (DoE) methodology [37]. Design Expert is a statistical analysis and modeling tool useful for planning, running and analyzing experiments, and building input-output correlation models. It also allows comparative testing, screening, characterization, optimization, robust parameter design, and combined designs. The statistical significance of the input factors is established by the analysis of variance (ANOVA). A Response Surface Model (RSM) can be used to map a design space, providing an immediate visualization of the effects of the variation of the input factors on the responses of interest.
For the three conventional scenarios, that is, layouts without the HTC section, named WWTP-10, WWTP-20, and WWTP-40, five input factors were considered for the wastewater treatment line (Table 2). A low and high level was chosen for each factor, identified on the basis of an extensive set of real process data. The excess sludge flow rate ( Q e x ) separated from the secondary sedimentation and pumped back to the oxidation tank was chosen according to the different scenarios obtained by modeling in WEST the recirculation of the sludge. The overall inlet flow rate includes both the fresh inlet ( Q i n ) and the supernatant liquid, recirculating from the sludge line ( Q s u p ).
A total of 18 responses were evaluated as output variables, listed in Table 3. The first 12 variables are strictly related to the wastewater line, while the last 6 are related to the sludge line. A Full-Factorial plan was chosen for the DoE methodology, with 5 factors, 2 levels (high/low), 1 replication each, and 1 single central point, for a total of 2 5 + 1 = 33 trials. Hence, 33 different simulation scenarios were performed by the WEST platform.
DoE was performed with a single central point, thus favoring linear relationships between input and output variables. The choice of a single central point is also motivated by the fact that responses are actually originated from the WEST simulation model and not from experimental laboratory tests or from real plant data; i.e., repetitions of the central point would give the same result.
Concerning the responses of Table 3, the Design Expert software returns, by the analysis of variance (ANOVA), a set of parametric linear equations, related to the five input factors listed in Table 2 and, eventually, their linear interactions. For instance, the solids retention time, energy consumption of oxidation tank, and flow rate of supernatant liquid were modeled, respectively, as follows:
1 / S R T = 0.000659 + 3.61 × 10 9 Q i n + 1.52 × 10 5 Q e x + 1.089 × 10 12 Q i n · Q e x
l n ( E C o x ) = 6.5917 + 4.163 × 10 6 Q i n + 0.0057 C O D i n + 0.045940 N - NH 4 , i n + + 0.0074 T o x 0.000026 Q e x 0.00011 C O D i n · N - NH 4 , i n + 4.745 × 10 8 C O D i n · Q e x + 3.59869 × 10 7 N - NH 4 , i n · Q e x
Q s u p = 4.28585 + 0.000031 Q i n + 0.009340 C O D i n + 1.00072 Q e x + 1.86558 × 10 6 Q i n · C O D i n 5.396712 × 10 9 Q i n · Q e x
It is worth noting that, in order to decrease residuals in the data, the software suggests adopting inverse and logarithmic transformation for the correlation of S R T and E C o x , respectively. The correlations for the other outputs are not reported for the sake of brevity.
With regard to the three integrated scenarios (WWTP-i/HTC), a different experimental plan was established. The wastewater line was modeled as for three WWTP-i scenarios, with the five factors listed in Table 2 as inputs, and the first 12 variables of Table 3 as outputs.
The three specific input factors of Table 4 and the five responses of Table 5 were instead considered for the HTC section. Note that the yield in hydrochar ( η h c ) was defined as the percentage ratio between the mass of the dry hydrochar and the mass of dry sludge, while the yield in Carbon ( η C ) as the percentage ratio between the carbon content of dry hydrochar and of dry sludge.
A rotatable Central-Composite plan of RSM type was chosen as the DoE, with 3 factors, 2 levels (high/low) and 1 replication each, 6 repetitions of the central point, and 6 axial points, resulting in 2 3 + 6 + 6 = 20 
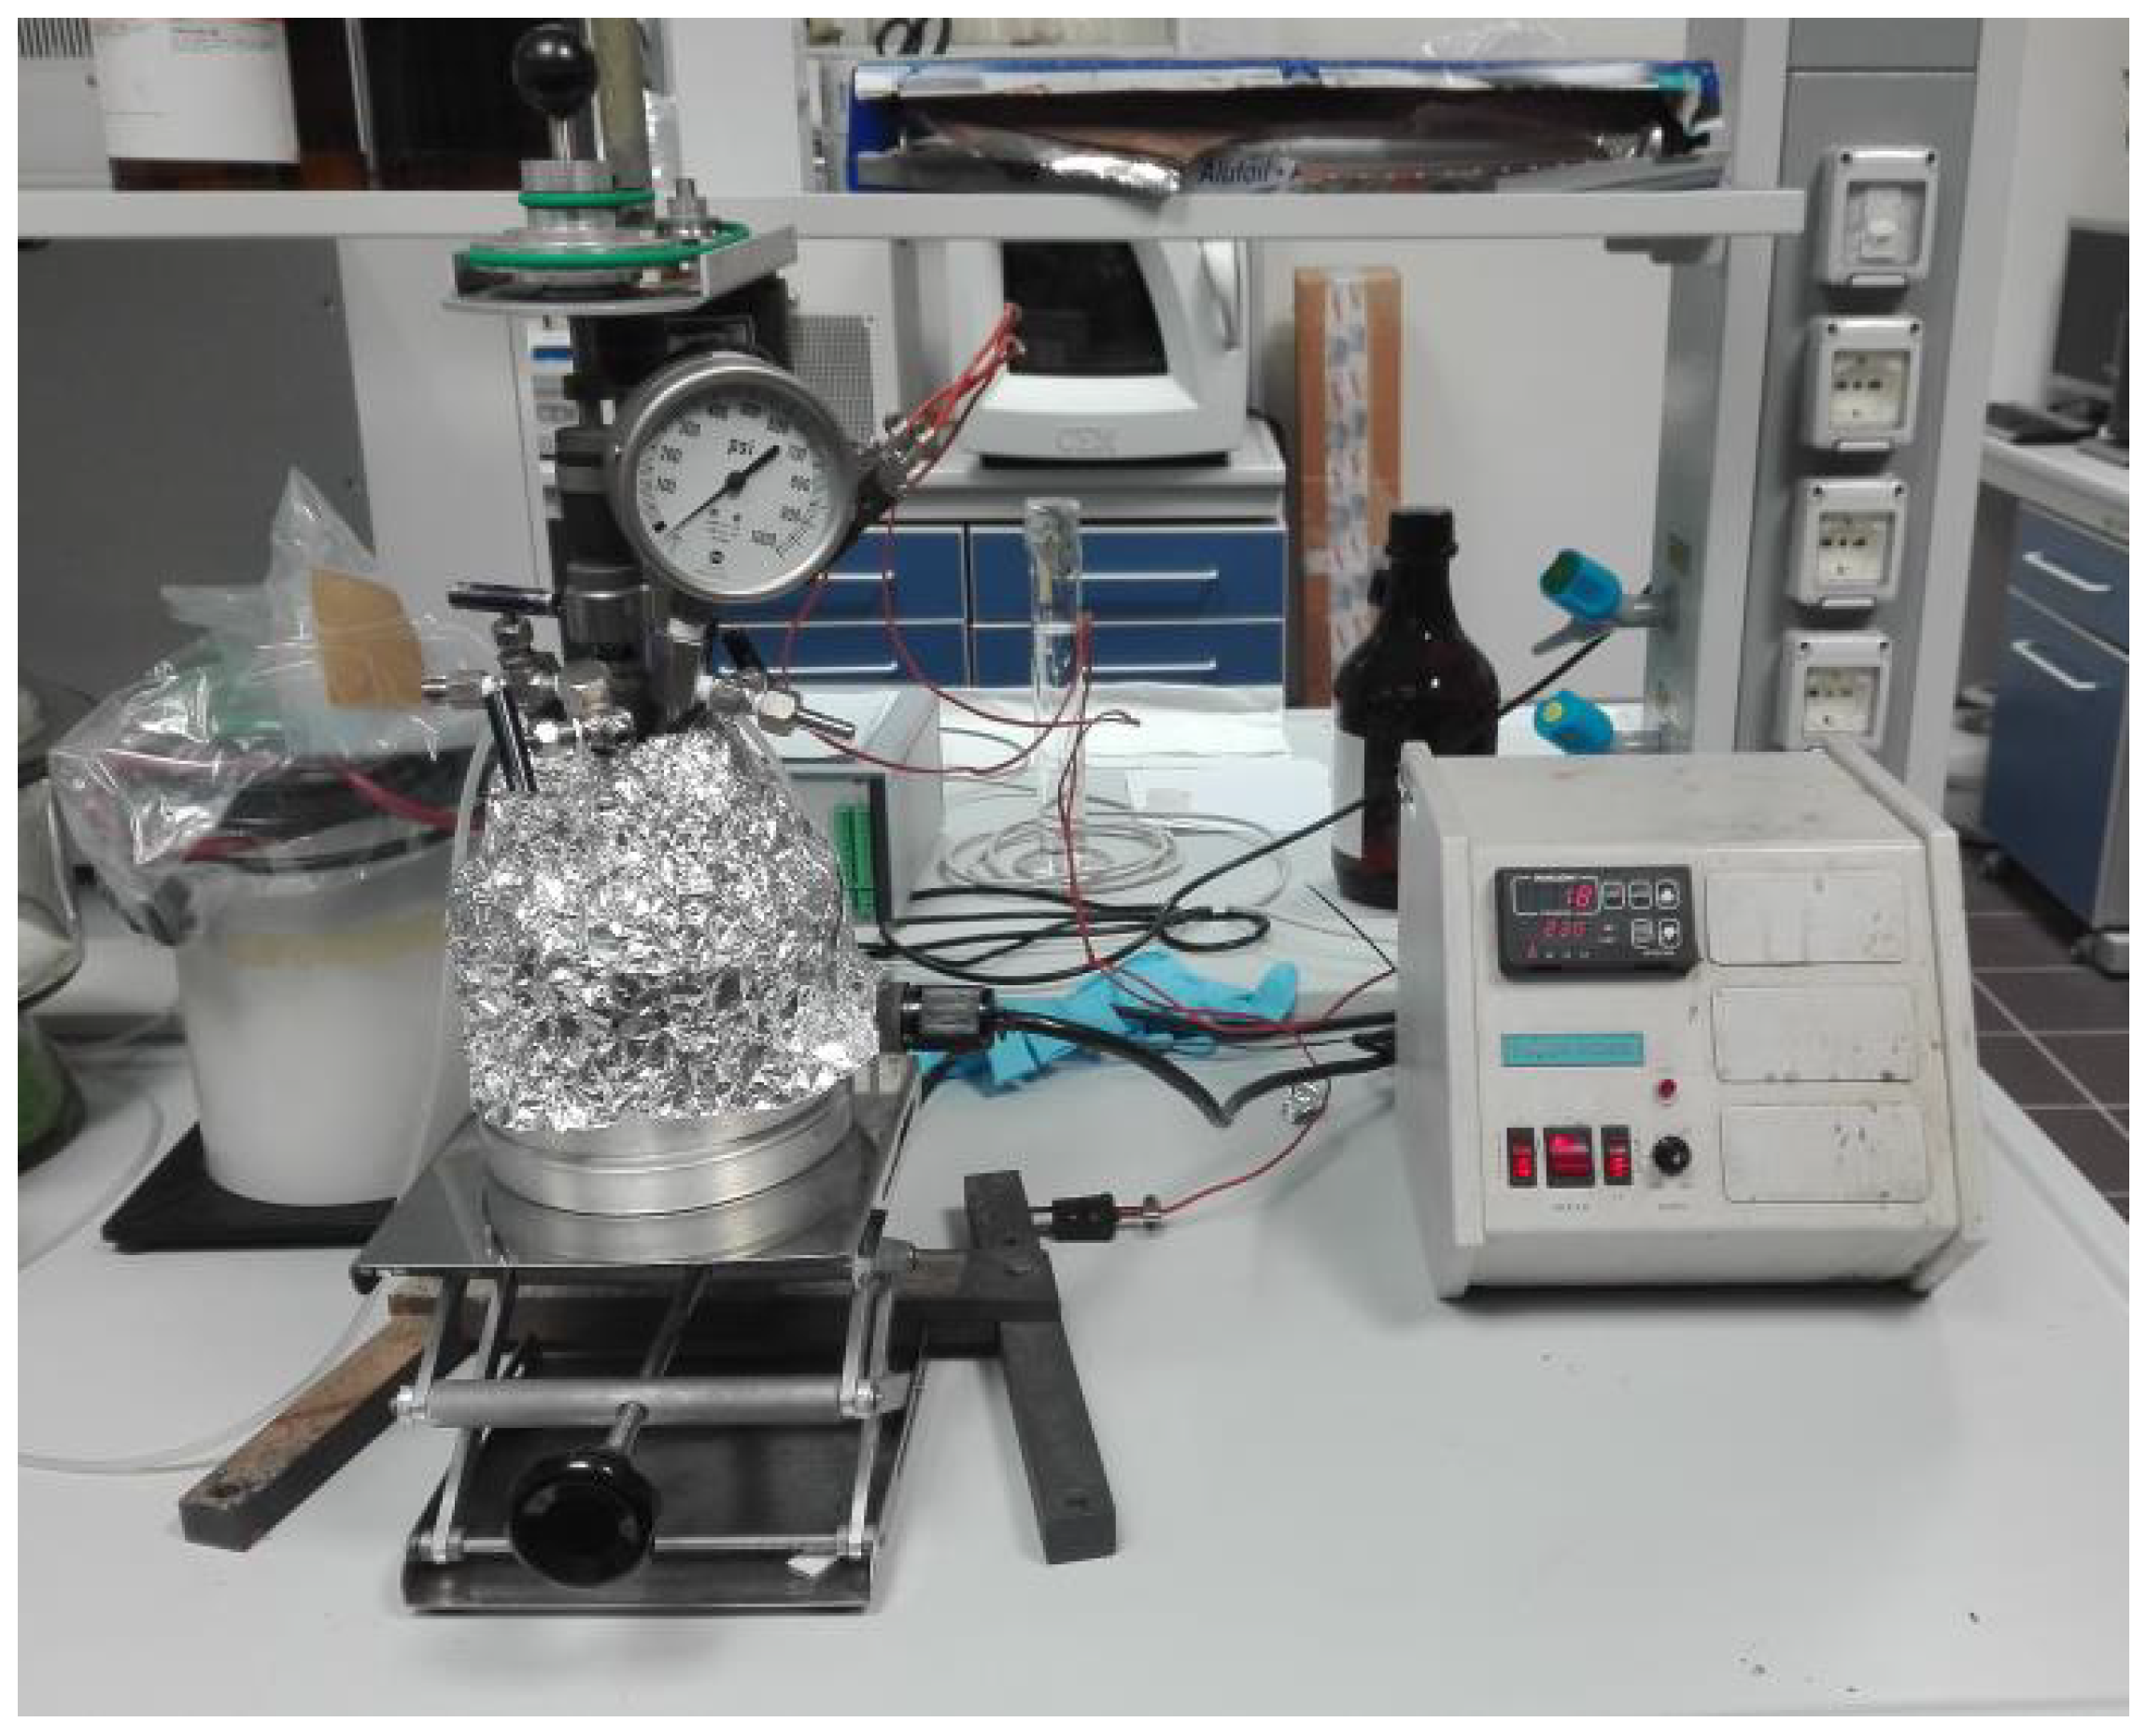
trials. As said, trials involving the HTC section were not simulated in the WEST platform, but carried out on a lab scale; therefore, the repetitions of the central point were set to take into account measurement errors in the experiments. In detail, laboratory trials were carried out with an AISI 316 stainless steel autoclave, with a volume of 300 mL, equipped with a conventional electric heating system (thermomanthus). The autoclave head was equipped with mechanical stirring, a thermocouple for temperature control and a pressure gauge with a full scale of 1000 psi for pressure control. The temperature control (220 °C) inside the reactor was carried out with a manual controller (PARR 4842) and the sludge was introduced directly into the autoclave, filled to about 2/3 [38], so that a coupled temperature and pressure hydrothermal treatment was performed (Figure 3). Nevertheless, note that the decoupled temperature and pressure treatment of [39] provides a novel promising method to produce sustainable carbon materials from cellulose with a carbon-negative effect; as a matter of fact, by using a different carbonization mechanism, even lower temperatures (200 °C) can be achieved [40].
Hydrochar yield and the high heating value have been modeled as follows:
η h c = 74.28 0.099 T r 0.015 τ r + 0.978 S C t s
H H V h c = 8.972 + 0.137 S C t s
Again, the other correlations are omitted for the sake of brevity.
Selected responses from the HTC model were then used as input factors for the sludge treatment line. Through simulation in Python, it was indeed possible to identify the suitable input levels for the DoE plan to be finally implemented into the WEST platform. To this aim, three input factors were employed, as shown in Table 6.
Five responses were established as outputs, which correspond to the last five variables considered for the three WWTP-i scenarios listed in Table 3, that is, Q e x , t h was excluded. A simple Full-Factorial plan was chosen as the DoE, with 3 factors, 2 levels (high/low) and 1 replication each, and 4 repetitions of the central point, corresponding to 2 3 + 4 = 12 trials. For the sake of brevity, only two correlations are reported below; the outlet flow rate of biogas and dewatered sludge were modeled as follows:
Q b g = 7.79518 + 0.000307 C O D p w 9.44372 × 10 16 Q p w + 0.000239 C O D p w · Q p w
Q d e w = 0.041613 1.63787 × 10 6 C O D p w 0.000739 Q p w + 1.114202 × 10 7 C O D p w · Q p w

3.3. Integration in Python

In order to assess and quantify the six different scenarios under study, additional material and energy balances have been implemented and solved in Python along with the parametric correlations obtained by DoE methodology. Table 7 lists the major input data used for the six considered scenarios. Note that the excess sludge flow rate ( Q e x ) varies according to the established Solids Retention Time in the aerobic digester.
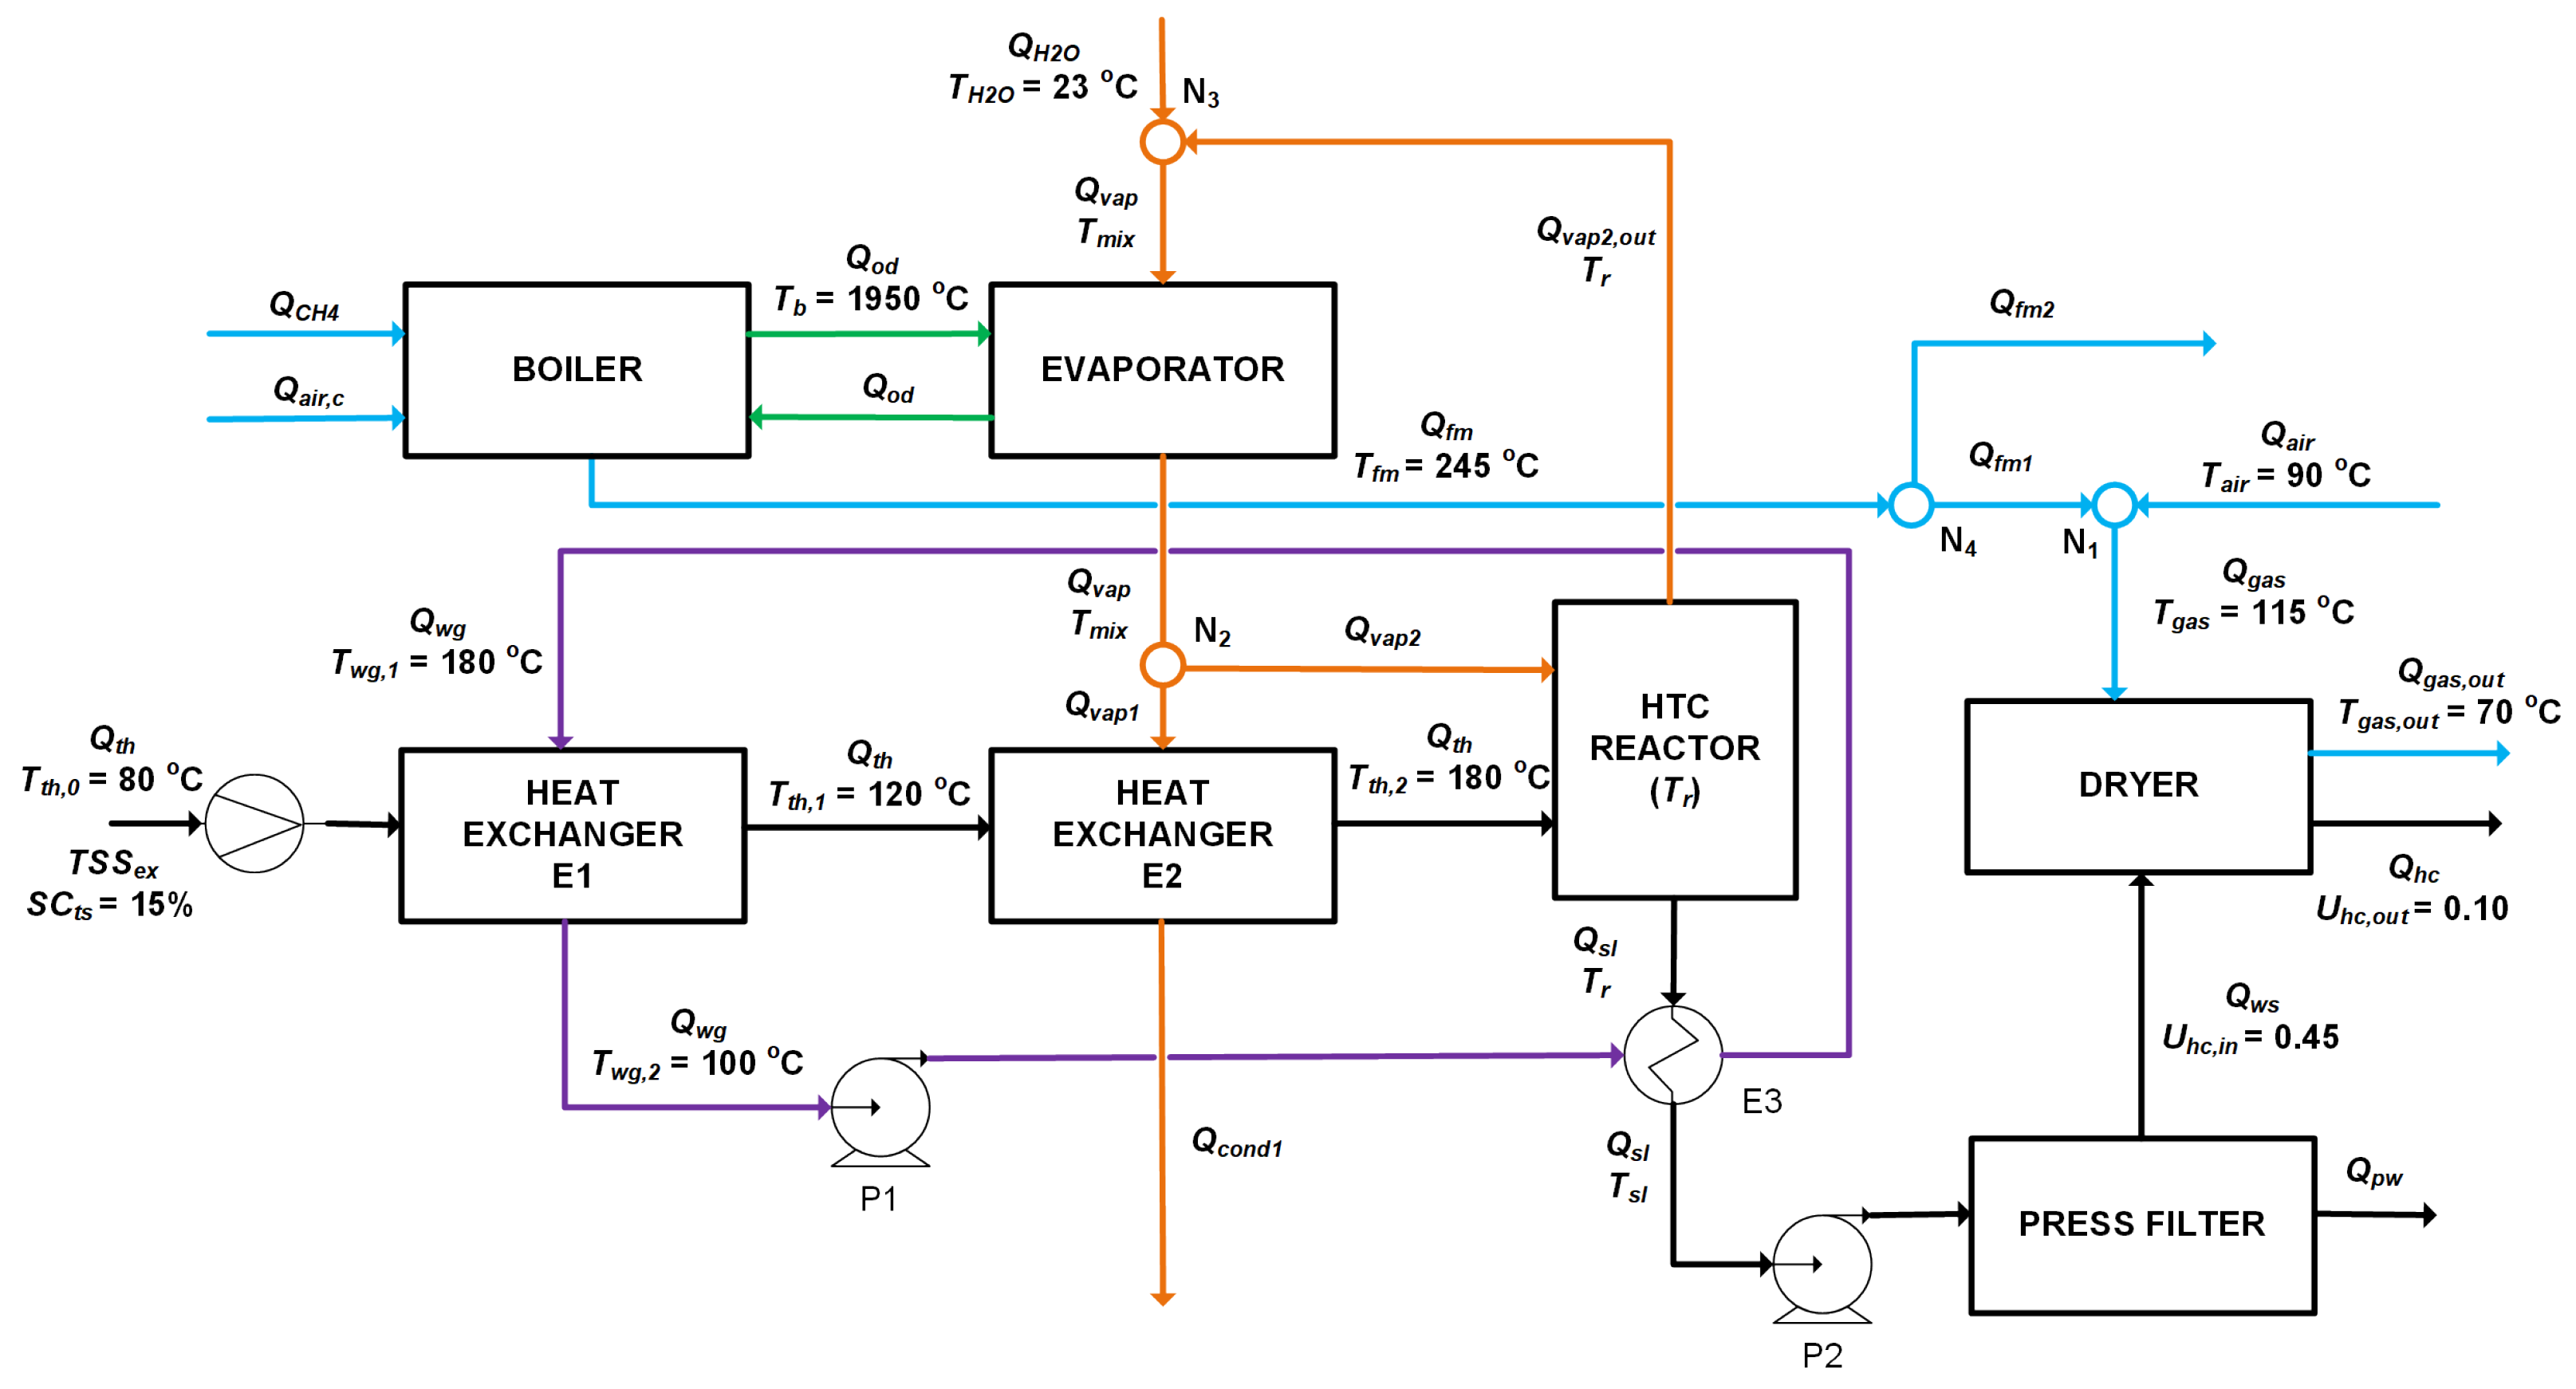
Figure 4 shows the block diagram of the additional HTC section adopted for the integrated WWTP-i/HTC scenarios with material and energy streams.
Table 8 and Table 9 list all the other variables used for the material and energy balances related to the HTC section and the corresponding utilities, respectively. Note that variables are separated in fixed parameters and unknowns. The material and energy balances implemented in Python are reported below in detail.
Concerning the HTC section, the following set of equations (S 1 ) was defined:
  • Evaluation of flow rate of thickened sludge Q t h (in kg/d) from the WEST model ASM3 by using T S S e x (in t/y):
    Q t h = 100 ( T S S e x 1000 365 ) S C t s
  • Hydrochar yield in HTC section:
    ( 1 U h c , o u t ) Q h c = η h c 100 S C t s Q t h
    where η h c is expressed by Equation (4).
  • Material balance of the dryer:
    ( 1 U h c , i n ) Q w s = ( 1 U h c , o u t ) Q h c
  • Material balance of the filter press:
    Q s l = Q w s + Q p w
  • Material balance of the HTC reactor:
    Q t h + Δ v a p = Q s l
  • Energy balance of the reactor:
    Δ v a p λ H 2 O = Q t h c p t h ( T r T t h , 2 )
Concerning the utilities, the following second set of equations (S 2 ) is defined:
  • Material balance of gas at node (N 1 ) at dryer inlet:
    Q a i r + Q f m 1 = Q g a s
  • Energy balance at the evaporator:
    Q f m c p f ( T b T f m ) = Q v a p ( c p H 2 O ( T r T m i x ) + λ H 2 O )
  • Material balance of the vapor at node (N 2 ):
    Q v a p = Q v a p 1 + Q v a p 2
  • Effective air for combustion in the boiler:
    Q a i r , c = R r a , t a R t a , f Q C H 4
  • Material balance at the boiler:
    Q f m = Q C H 4 + Q a i r , c
  • Material balance of water at system composed of evaporator and HTC reactor
    Q H 2 O = Q v a p 1 + Δ v a p
  • Energy balance of water at node (N 3 ) at evaporator inlet:
    Q H 2 O c p H 2 O T H 2 O + ( Q v a p 2 Δ v a p ) c p H 2 O T r = Q v a p c p H 2 O T m i x
  • Energy balance of water-glycol at pre-heater E1:
    Q w g c p w g ( T w g , 1 T w g , 2 ) = Q t h c p t h ( T t h , 1 T t h , 0 )
  • Energy balance of pre-heater E2:
    Q v a p 1 λ H 2 O = Q t h c p t h ( T t h , 2 T t h , 1 )
  • Energy balance at the HTC reactor outlet heat exchanger (E3):
    Q w g c p w g ( T w g , 1 T w g , 2 ) = Q s l c p s l ( T r T s l )
  • Energy balance of gas at node (N 1 ) at dryer inlet:
    Q g a s c p g a s T g a s = Q a i r c p a i r T a i r + Q f m 1 c p f T f m
  • Mass balance at node (N 4 ) on fumes line:
    Q f m = Q f m 1 + Q f m 2
  • Constraint on the steam ( Q v a p 2 ) sent to the HTC reactor:
    Q v a p 2 = 1.5 Δ v a p
  • Energy balance at the dryer (approximated):
    ( Q w s U h c , i n Q h c U h c , o u t ) λ H 2 O = Q g a s c p g a s ( T g a s T g a s , o u t )
The resolution of these two nonlinear systems (S 1 , S 2 ) was performed through the fsolve function in Python. In addition to material and energy balance equations, direct equations were considered to establish the main features of the output products, including carbon yield, high heating value, and the ash content of the produced hydrochar, all previously obtained by the DoE model of the HTC reactor.

3.4. Life Cycle Assessment

Finally, the models obtained from the integrated approach WEST-DoE-Python have been analyzed by the LCA methodology. The study followed the guidelines of the UNI EN ISO 14040 and 14044 standards. The analysis was indeed carried out according to the conventional four-stage structure: (i) scope definition, (ii) inventory analysis, (iii) impact assessment, and (iv) interpretation of the results. As a functional unit, 1 m 3 of wastewater entering the plant was set.
The process boundaries included: (a) the wastewater line, (b) the sludge line, and (c) the HTC section. All the sludge ages (40, 20, and 10 days) were considered. In addition, the production process of defecation gypsum, one of the possible options for the sludge disposal processes, was also modeled. The estimation of the impacts on the environment and on human health was carried out according to the ReCiPe 2016 midpoint (H) Europe method with 18 different categories and then implemented in the software SimaPro 9.2.

4. Results and Discussion

The implementation of the parametric equations in Python allowed one to define and quantify the material and energy streams used for the inventory phase of the LCA analysis. The six different scenarios with three different sludge ages, such as Solids Retention Time (SRT) in the oxidation tank, are here compared. In detail, the following key performance indicators are examined: (i) energy consumption; (ii) operating conditions; (iii) effluent quality; (iv) impact on greenhouse gas (GHG) emissions.
Table 10 summarizes the various results of modeling in Python obtained from three WWTP-i scenarios.
Moreover, the results obtained for three integrated WWTP-i/HTC scenarios are reported in Table 11 and Table 12.
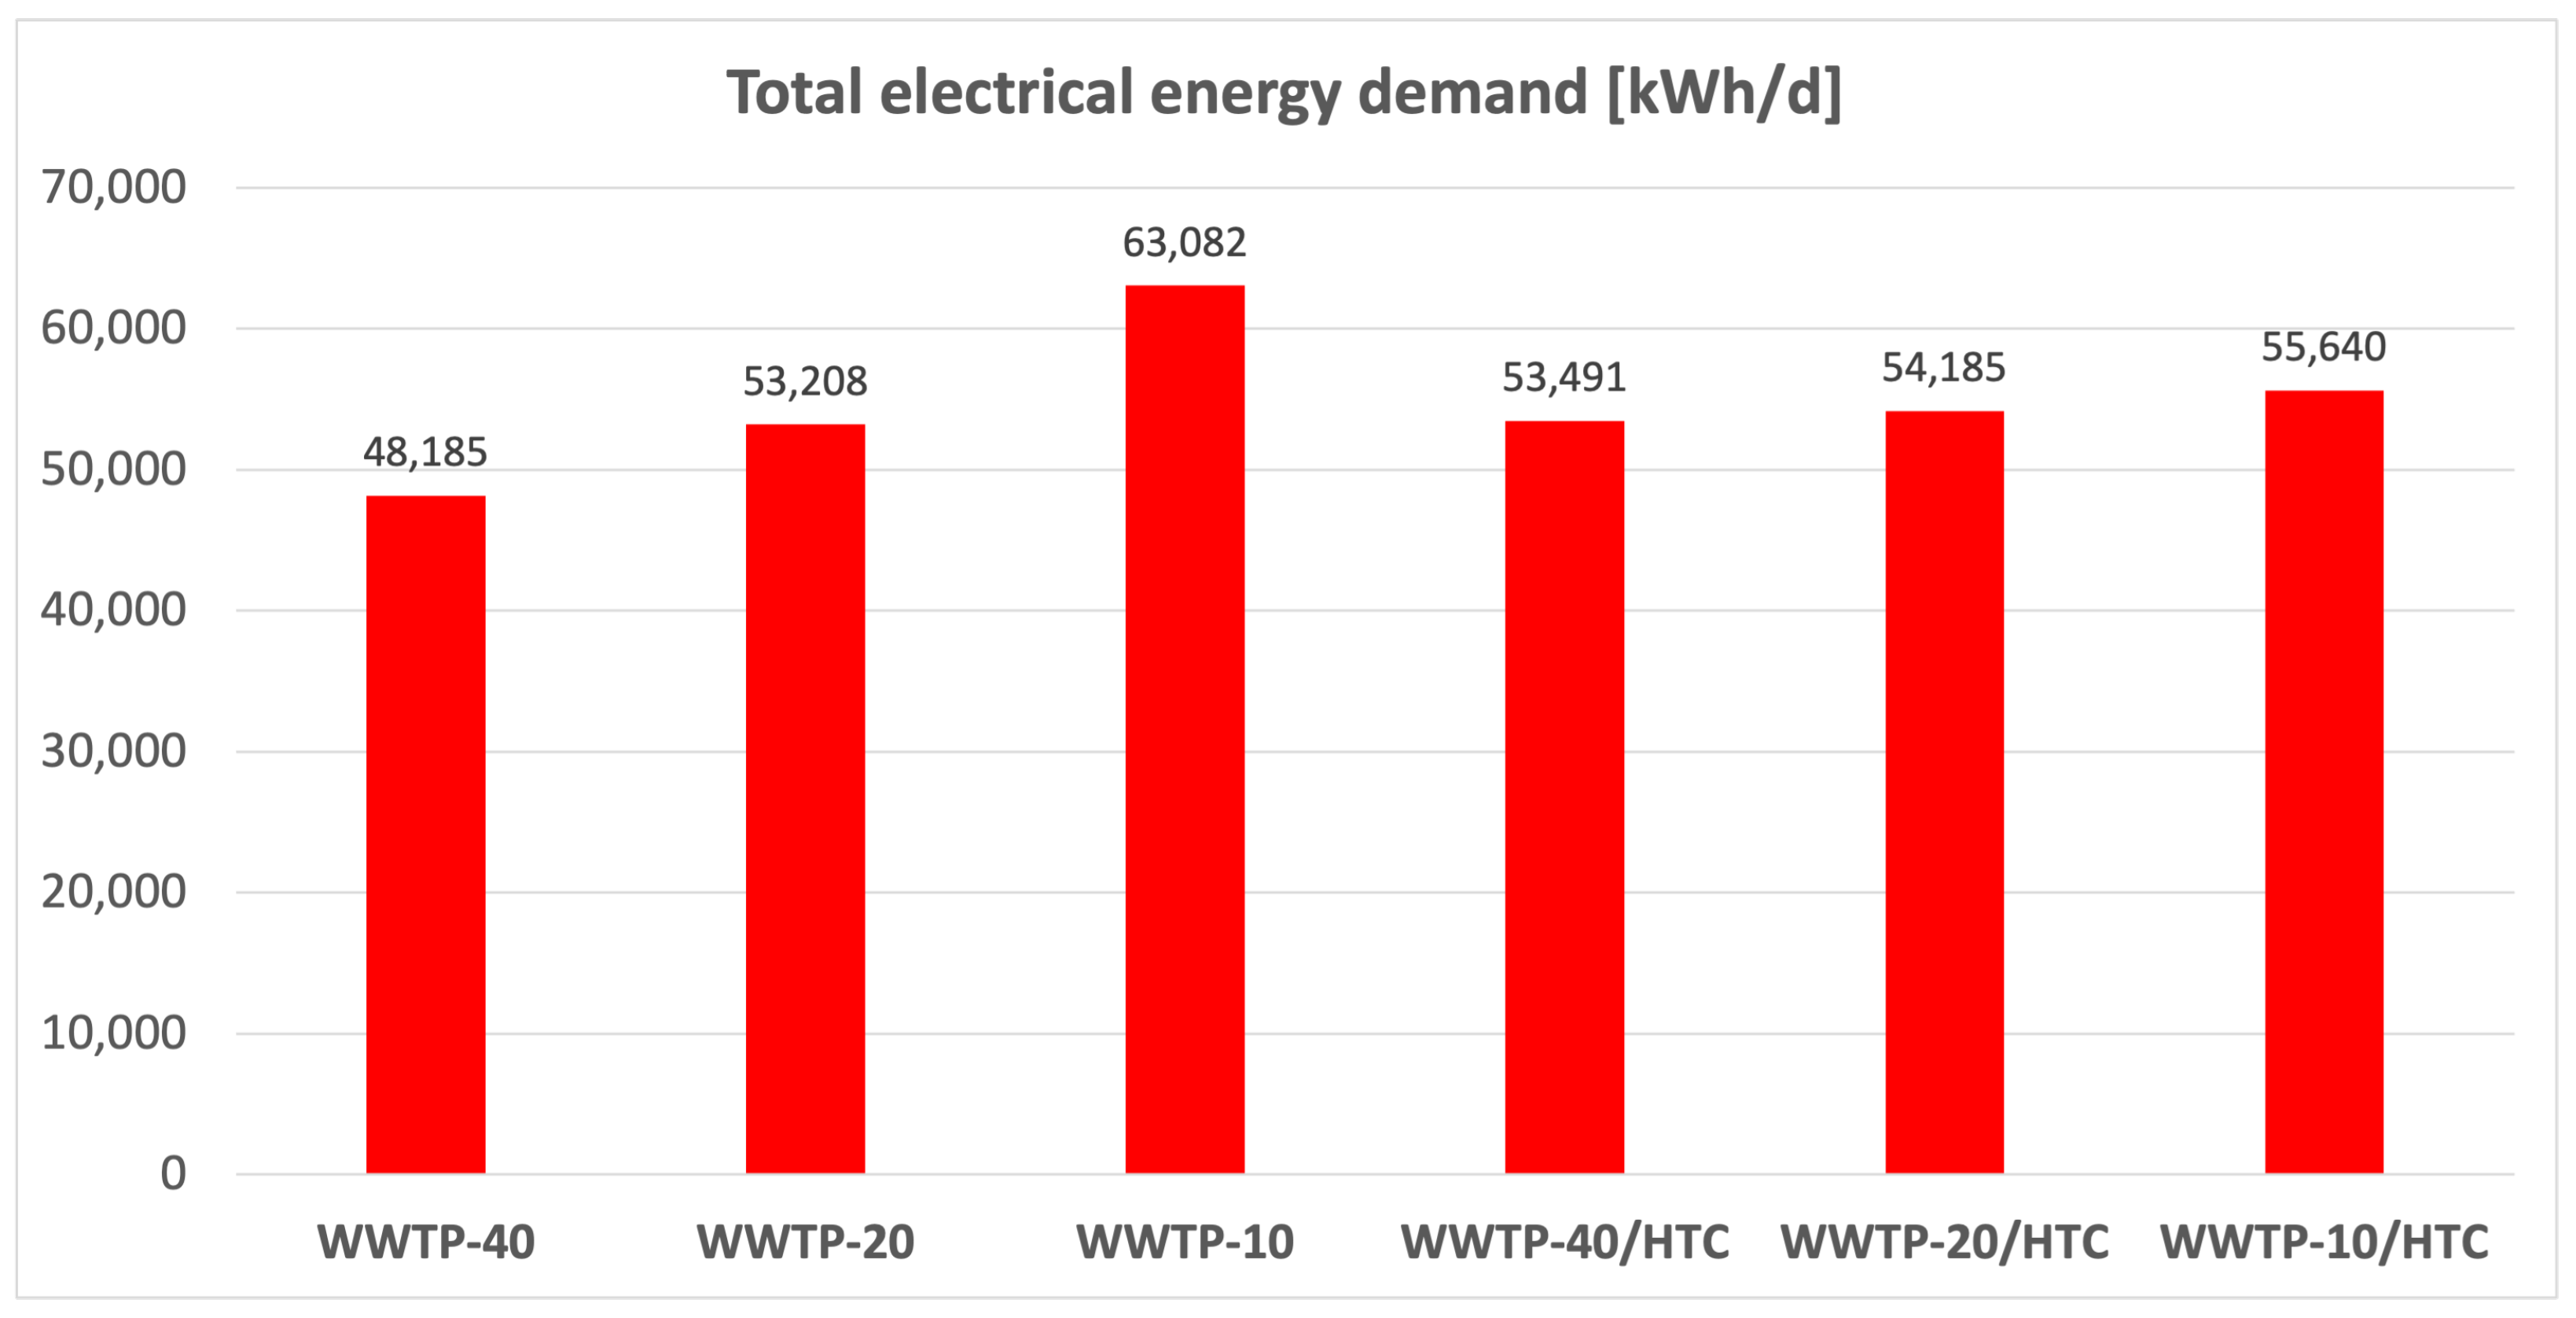
In particular, energy consumption is evaluated by the total electrical energy demand (TEED), considered as sum of energy for oxidation tank ( E C o x ), energy for the other units of wastewater treatment line ( E C w l ), energy for hydrothermal carbonization (only for WWTP-i/HTC scenarios, composed of HTC term E C h c and thickening term E C t h ), and energy for sludge treatment line ( E C s l ) . The results for the different scenarios are summarized in Figure 5.
Note that the integrated WWTP-i/HTC scenarios are demonstrated to be almost independent from the Solids Retention Time of the aerobic digester. In detail, a linear correlation can be fitted with a proportionality constant one order of magnitude smaller than the one obtained for the simple WWTP configurations, that is, 65 vs. 460 . Moreover, a significant reduction in the energy demand of the integrated layout with respect to the corresponding traditional plant seems feasible only for a low sludge age ( S R T = 10 d).
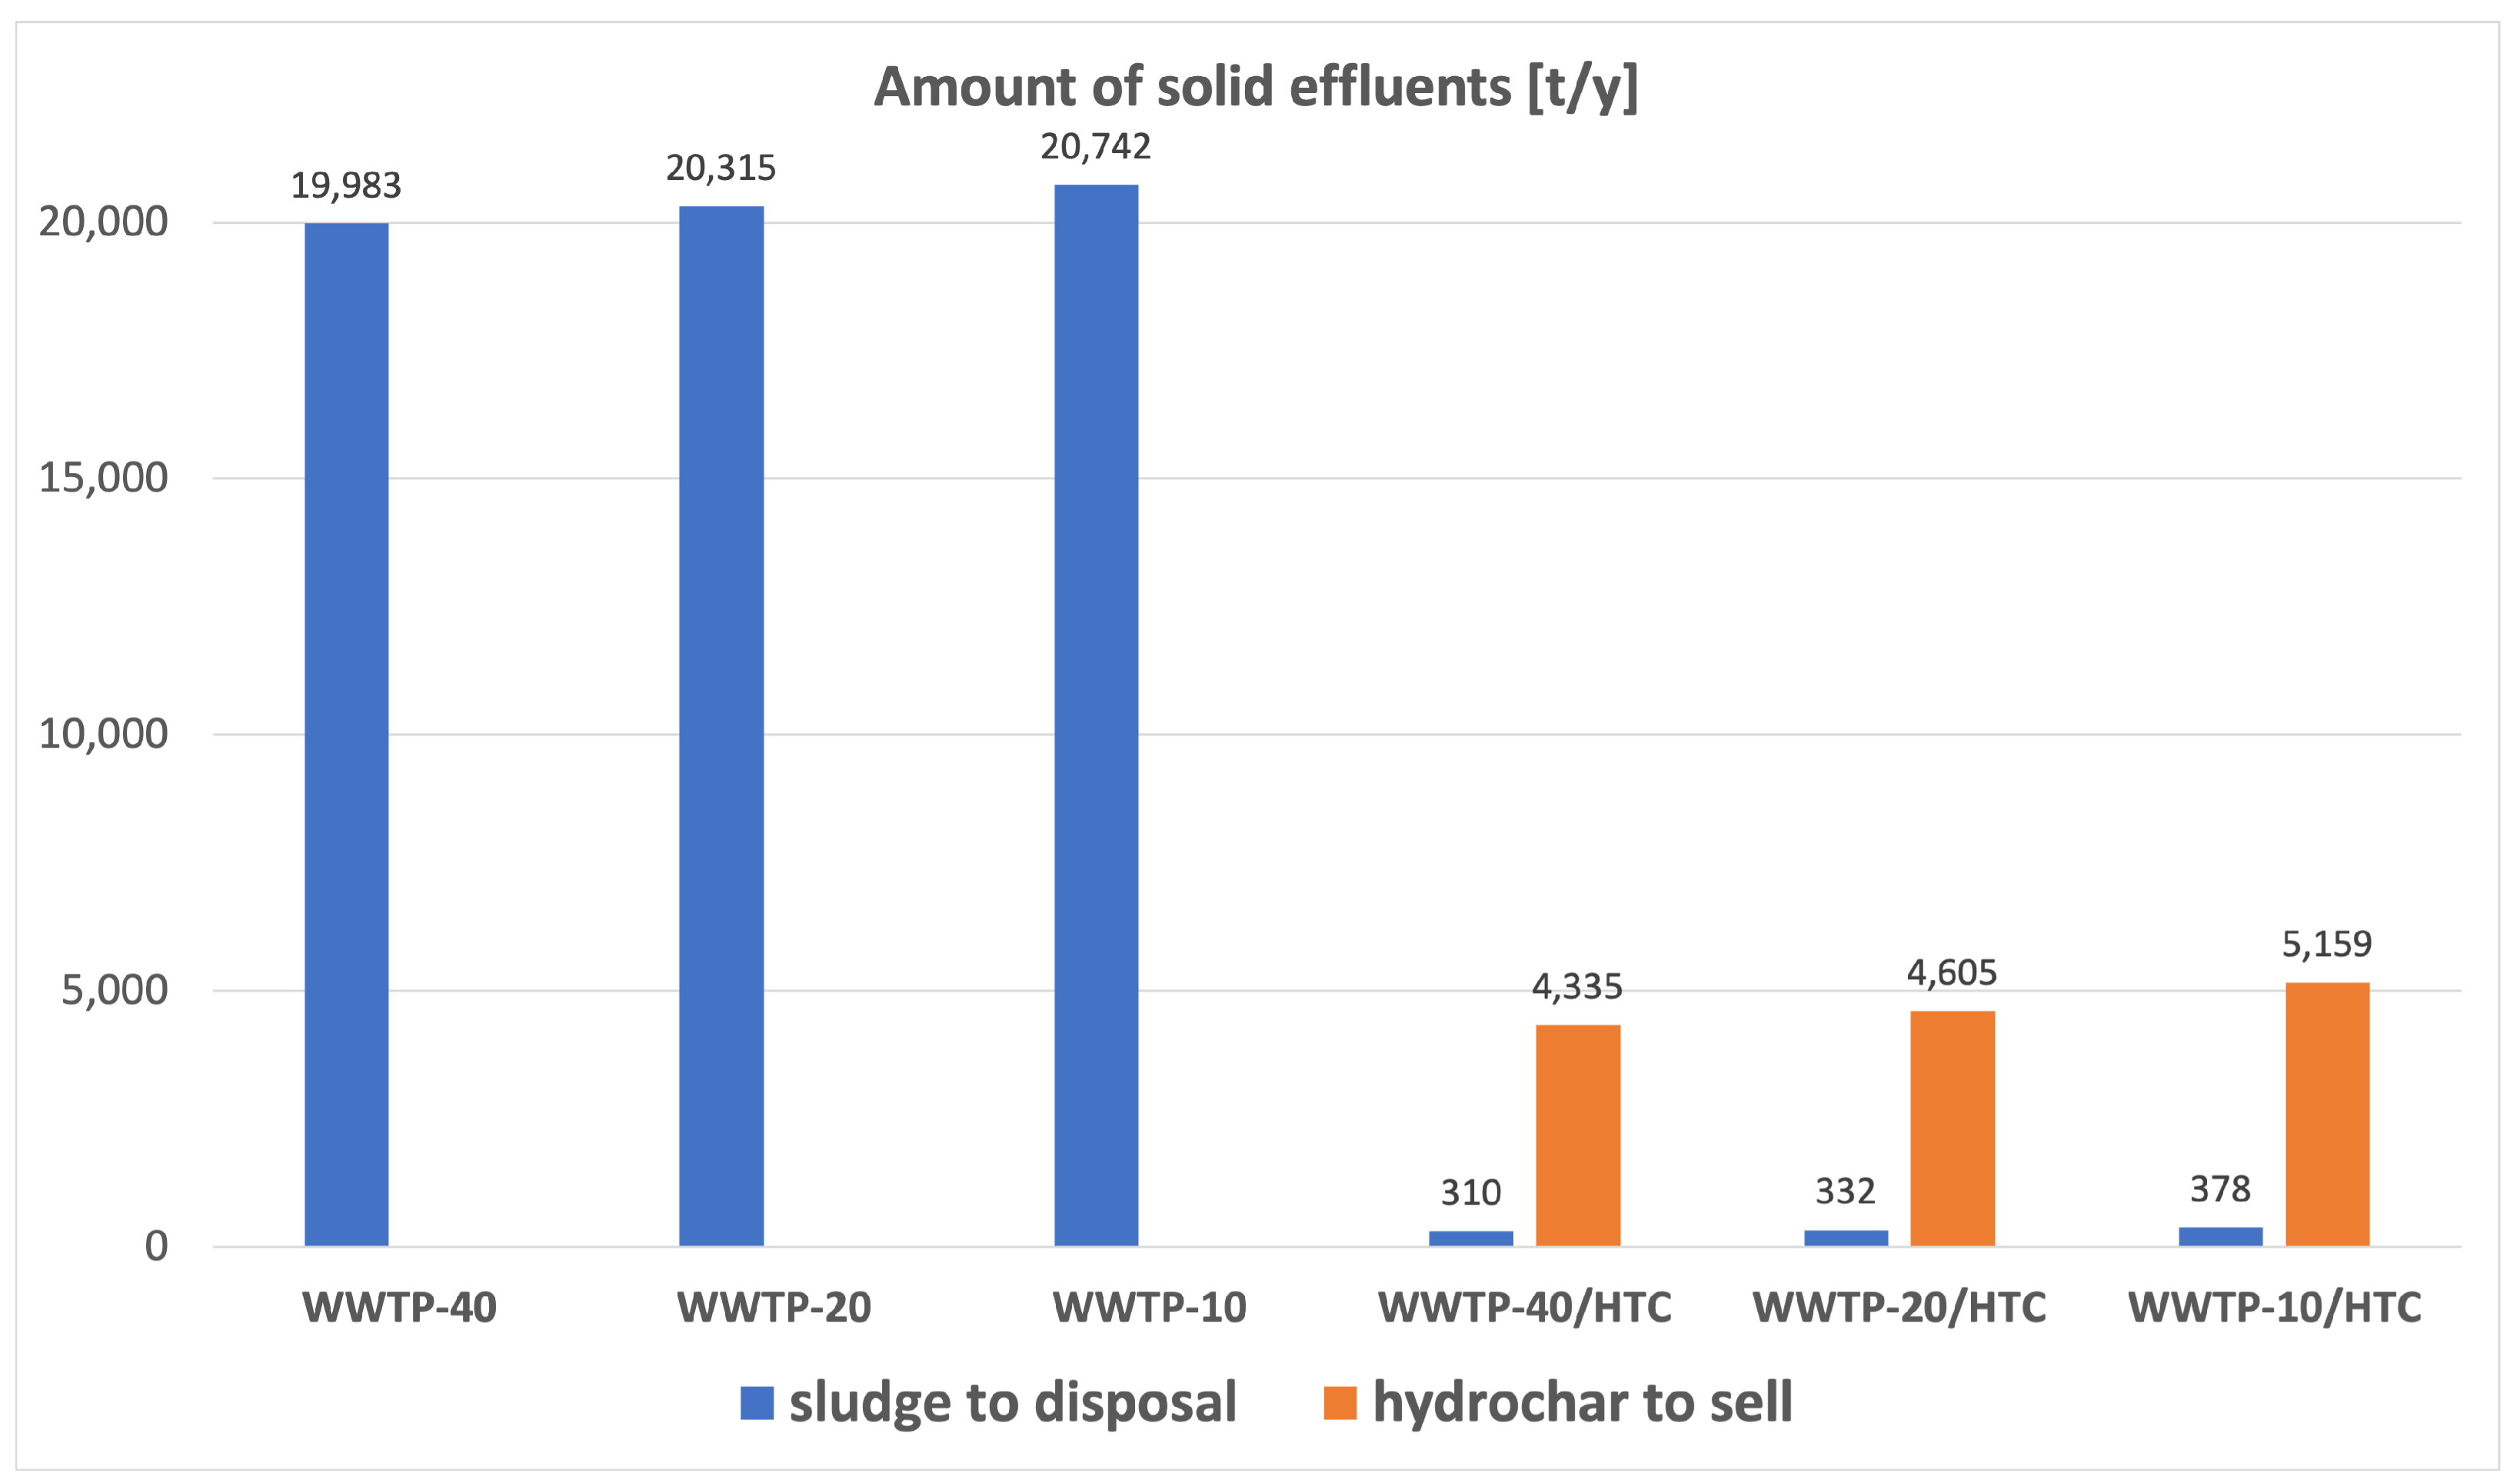
The operating conditions of the various scenarios were compared in terms of the amount of solid effluents, i.e., sewage sludge to be disposed ( M d e w ) and hydrochar to be sold ( Q h c ), expressed in tons per year (Figure 6). Integrated plants produce very lower amount of sewage sludge if compared with the conventional layouts, around two order of magnitude less. In addition, the sludge produced by traditional WWTPs has typically a high humidity rate, around 80%, leading to a considerable disposal cost (around 200 €/t). Conversely, the hydrochar obtained after hydrothermal carbonization and suitable drying process has very lower humidity content (10%), and its added value would be currently remarkable (around 80 €/t).
Effluent quality and impact on greenhouse gas (GHG) emissions were evaluated by the LCA methodology. In a nutshell, it has been found that the process scenario with the lowest impacts is the one associated with sludge age of 40 days, both without and with the implementation of HTC treatment. This is mainly due to a reduced electricity consumption of the sludge line, which instead increases with the excess sludge flow rate, i.e., as the sludge age decreases. Since the analyzed treatment plant actually operates with a S R T = 40 , the adopted configuration proves to be the optimal one.
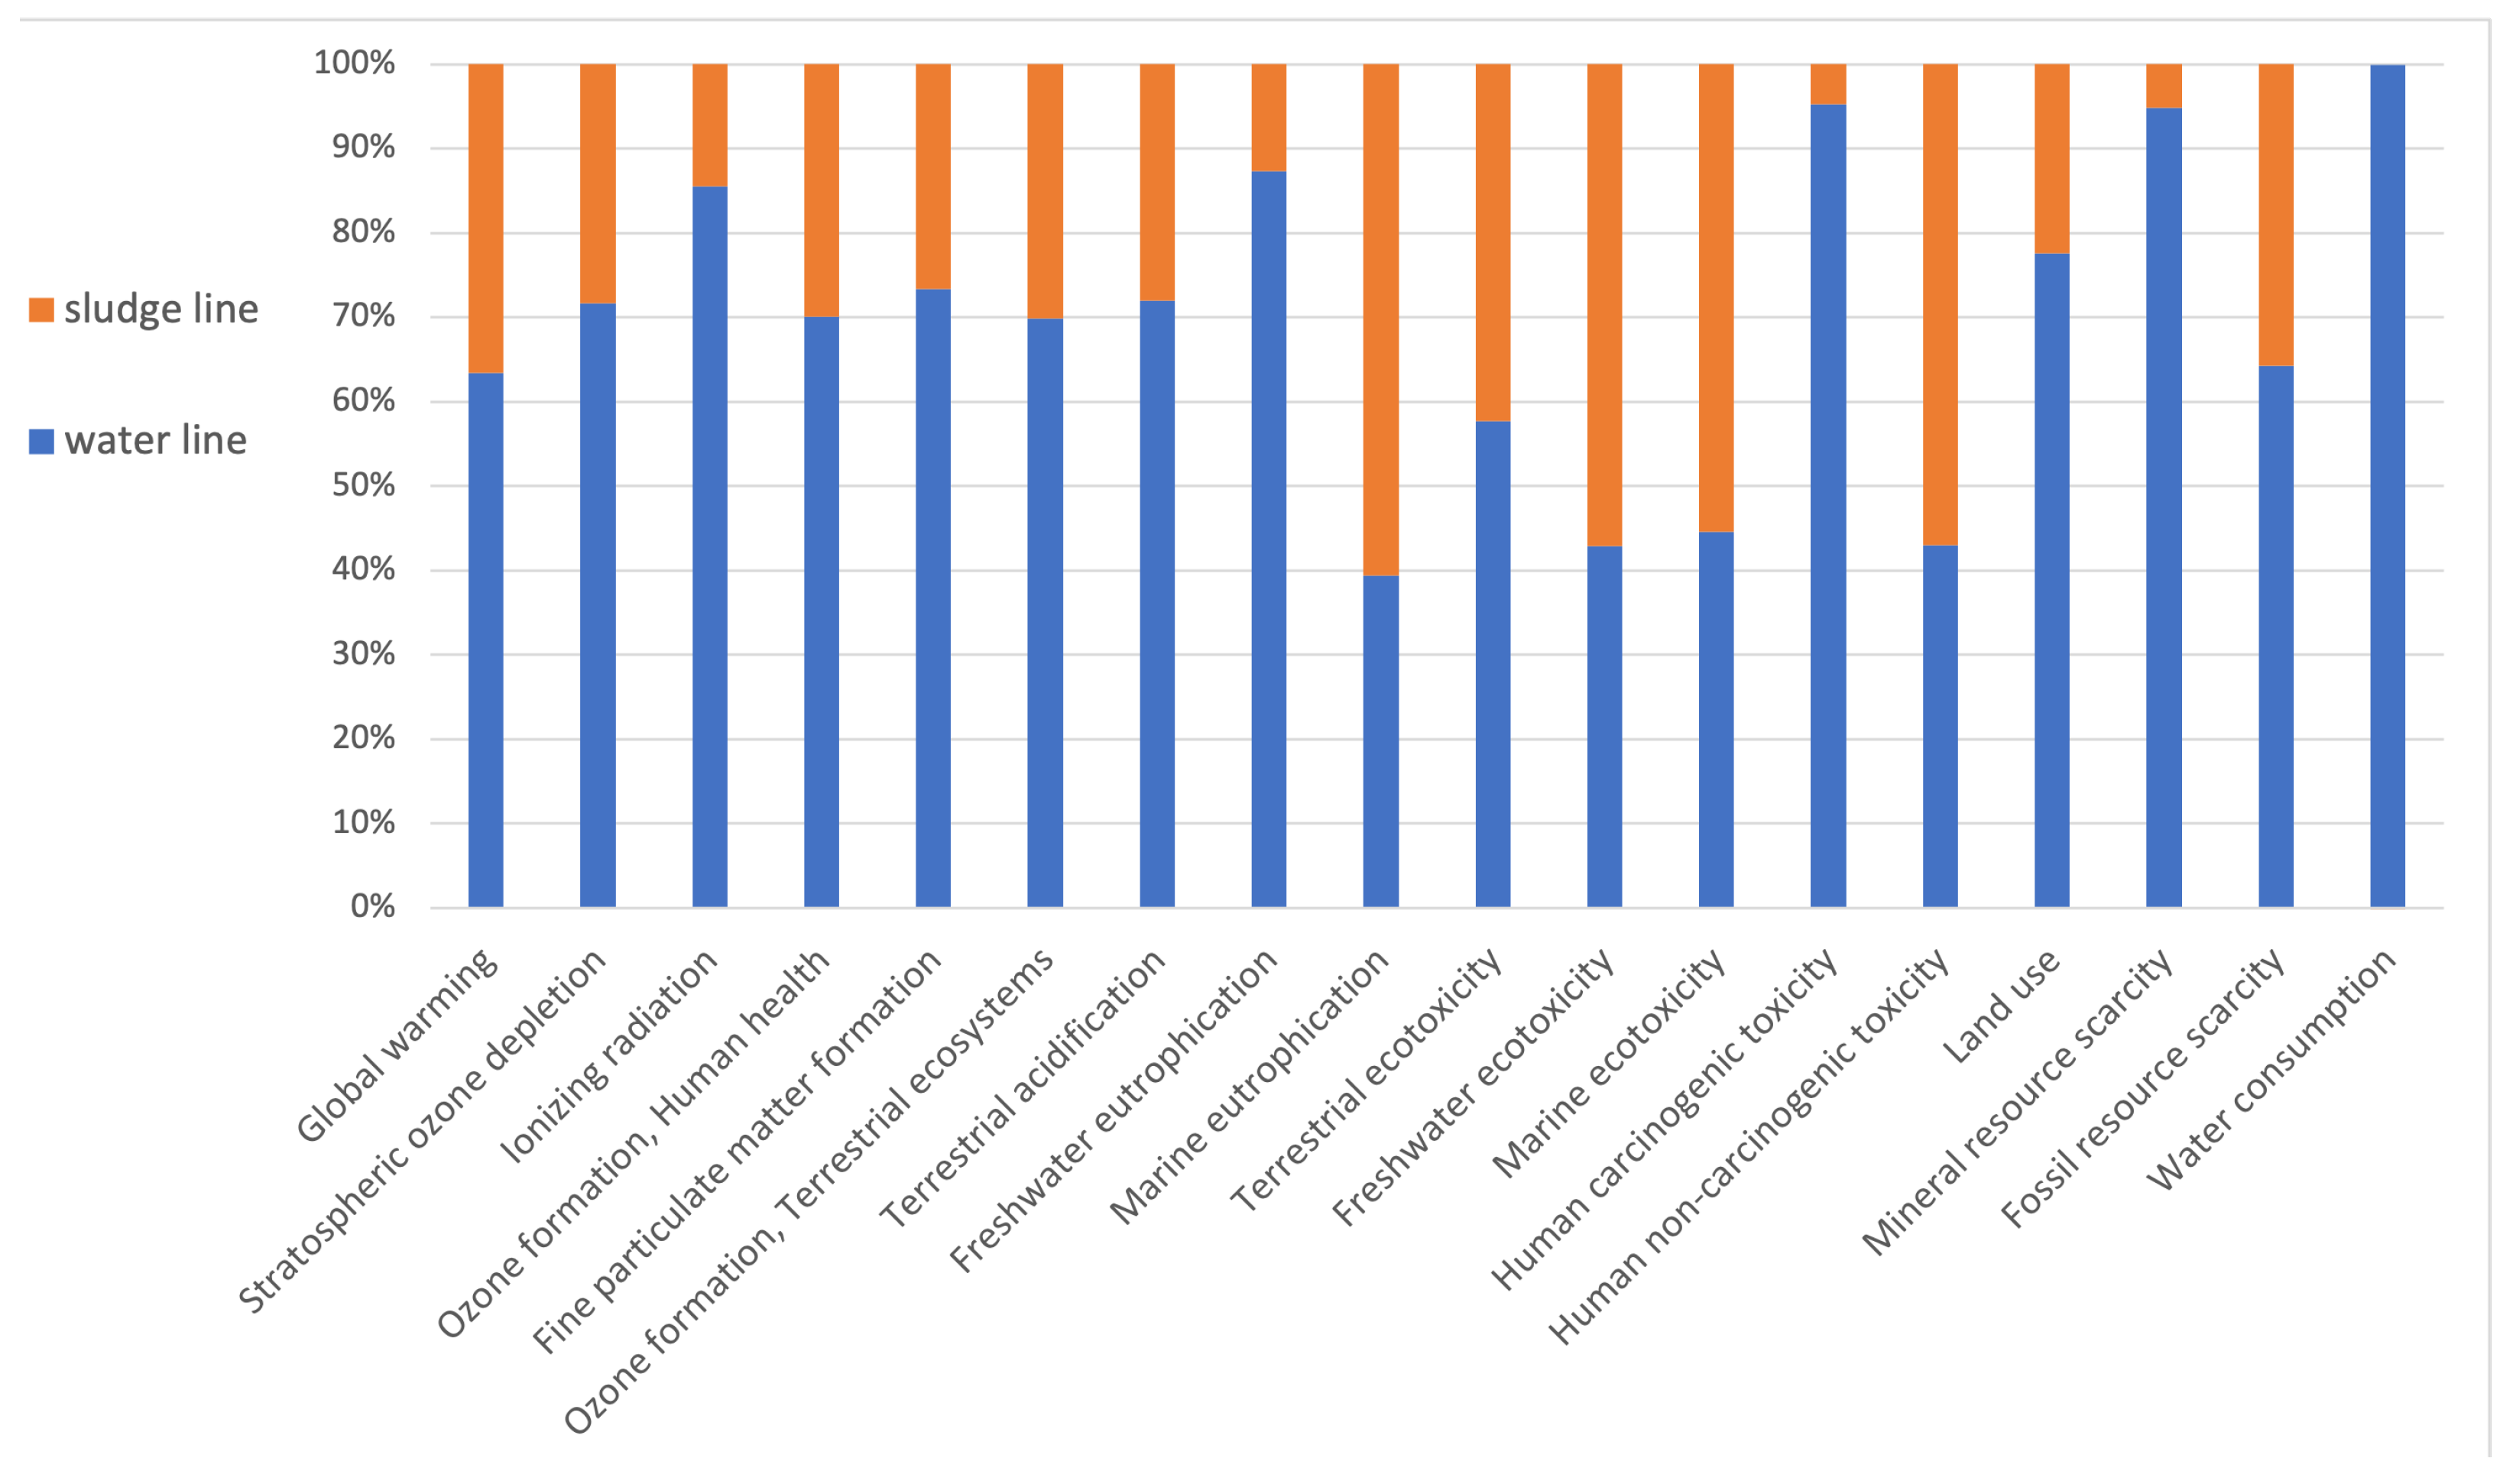
In detail, considering the three scenarios without hydrothermal carbonization (WWTP-10, -20, -40), the largest contributor to environmental impacts is the wastewater line, due to the high consumption of energy and chemical additives. Figure 7 shows the results for the WWTP-40 scenario, in terms of the relative impacts of wastewater line and sludge line.
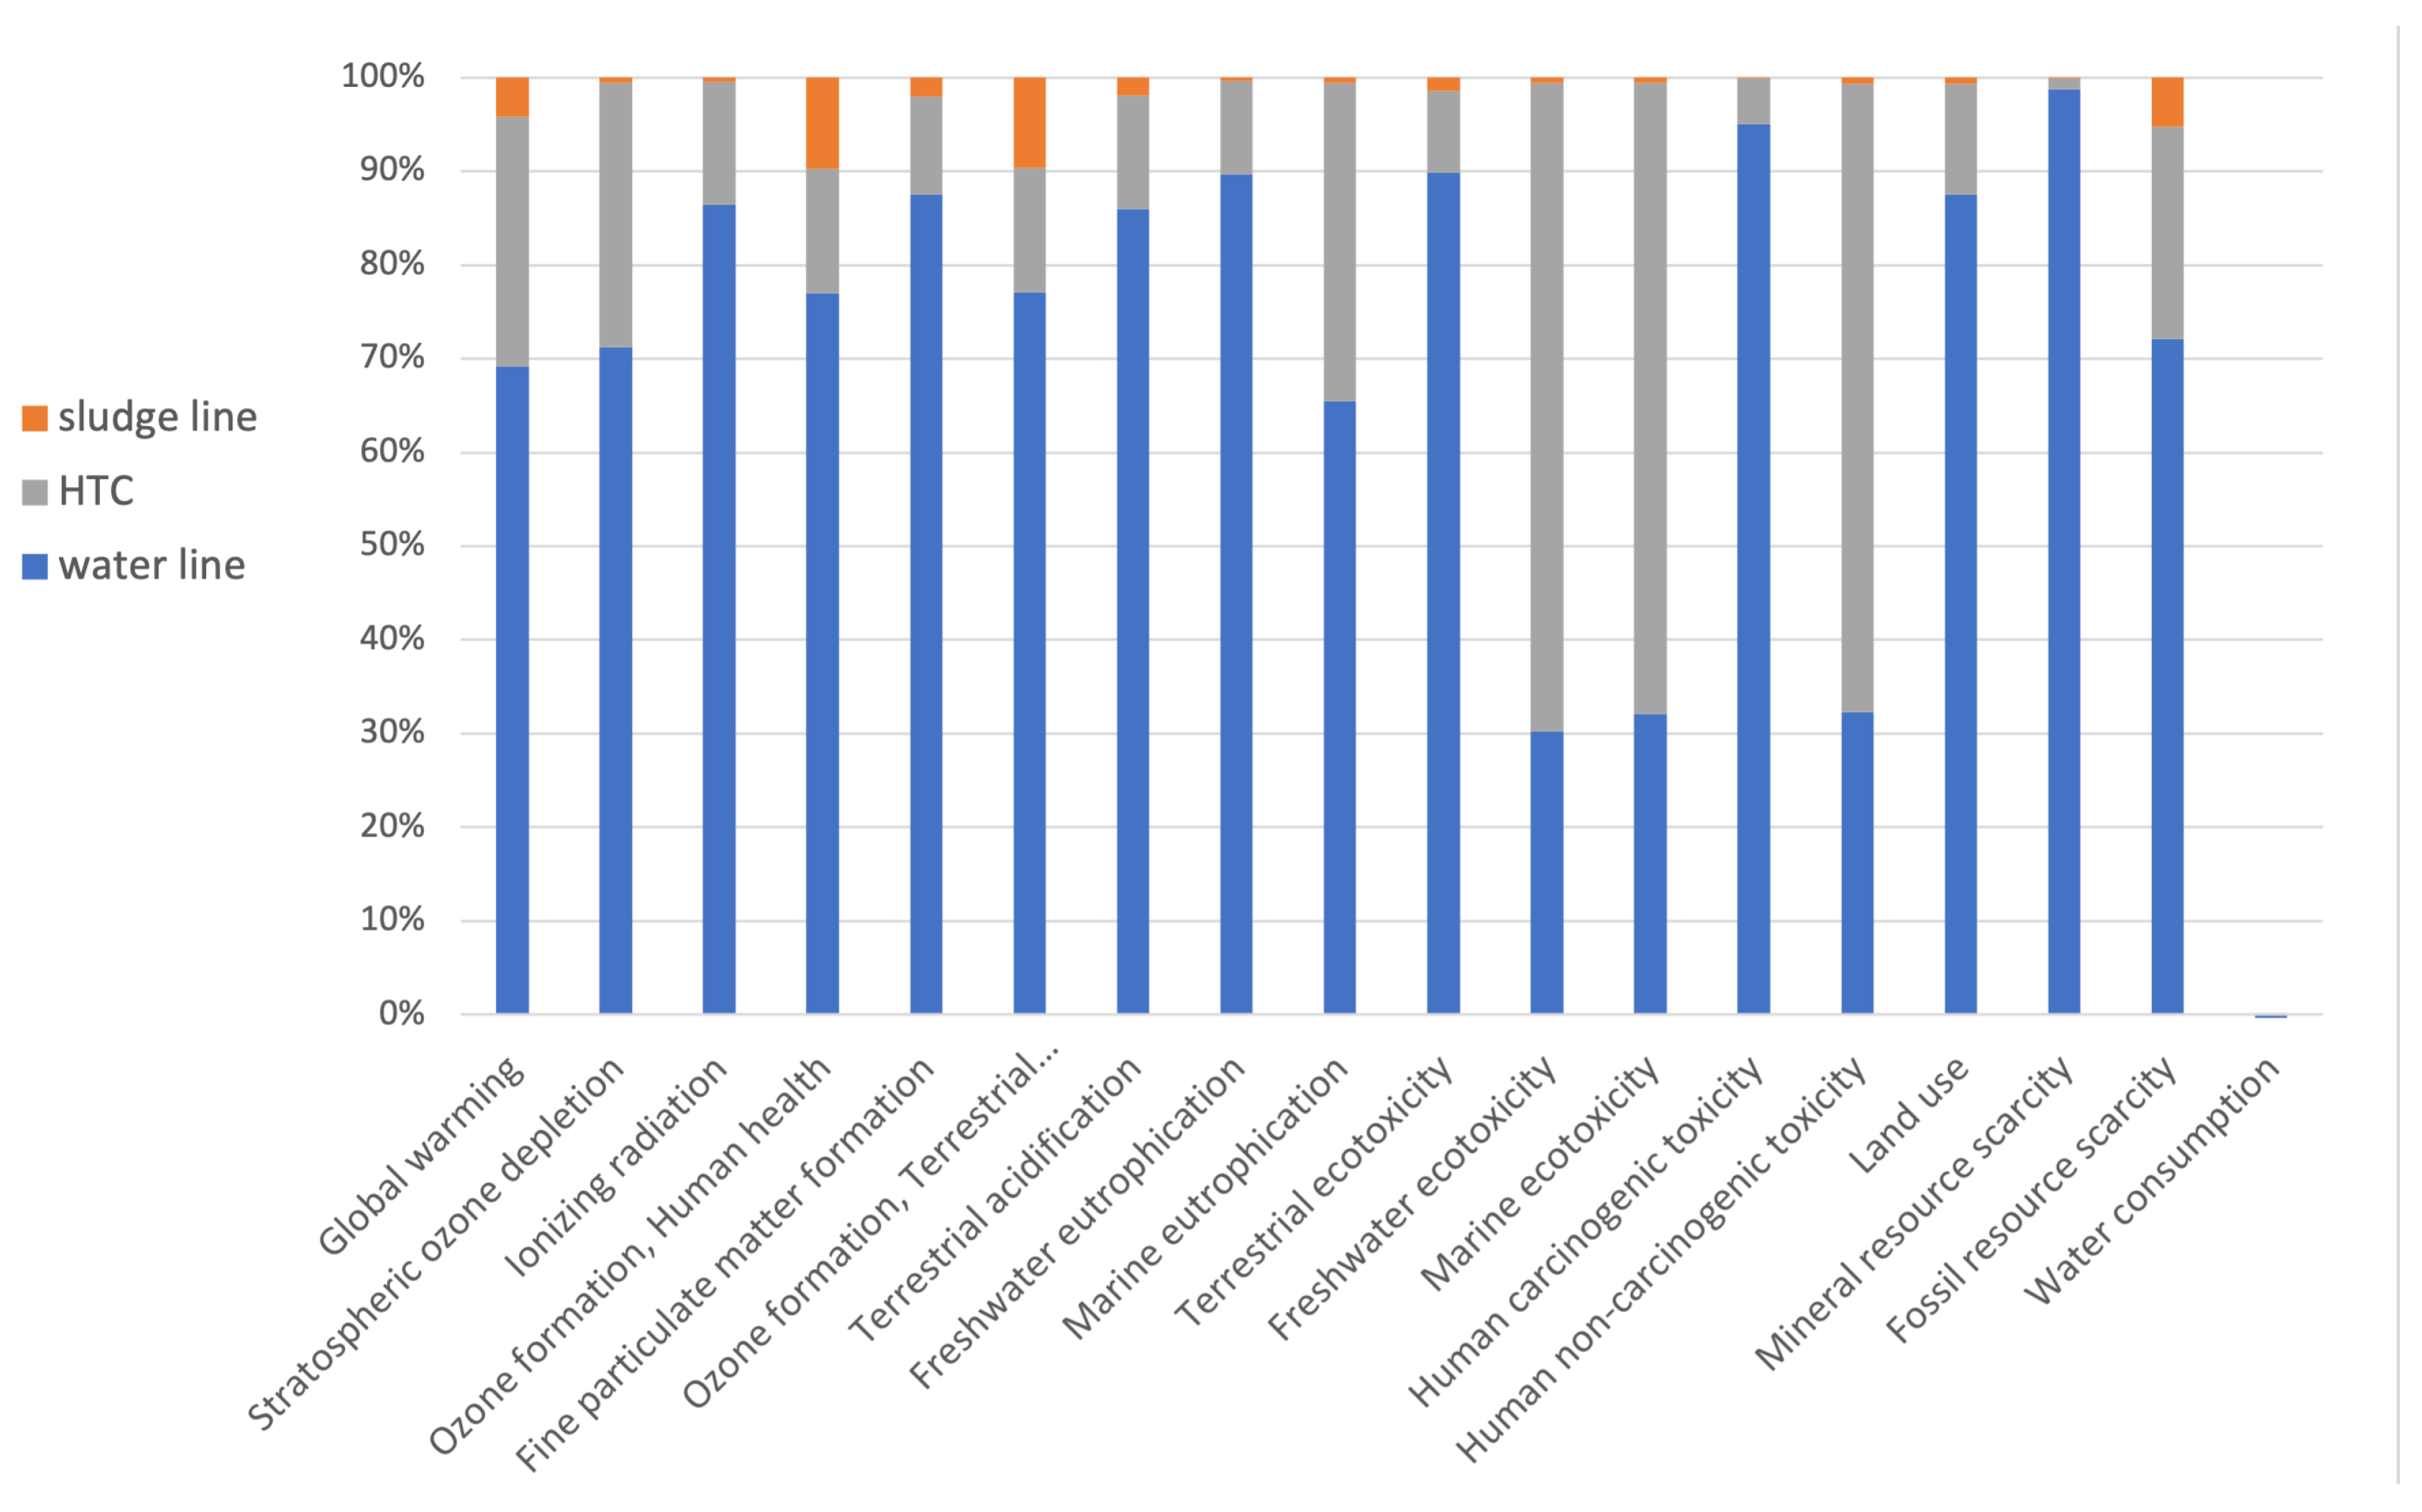
In addition, Figure 8 shows the contributions to the environmental impacts of the three sections (wastewater line, HTC unit, and sludge line) for the WWTP-40/HTC scenario. Wastewater line confirms to be the largest contributor in 15 out of 18 impact categories. Note that similar results have been obtained also for the other two integrated scenarios (WWTP-20/HTC and WWTP-10/HTC), which are not here presented for the sake of brevity.
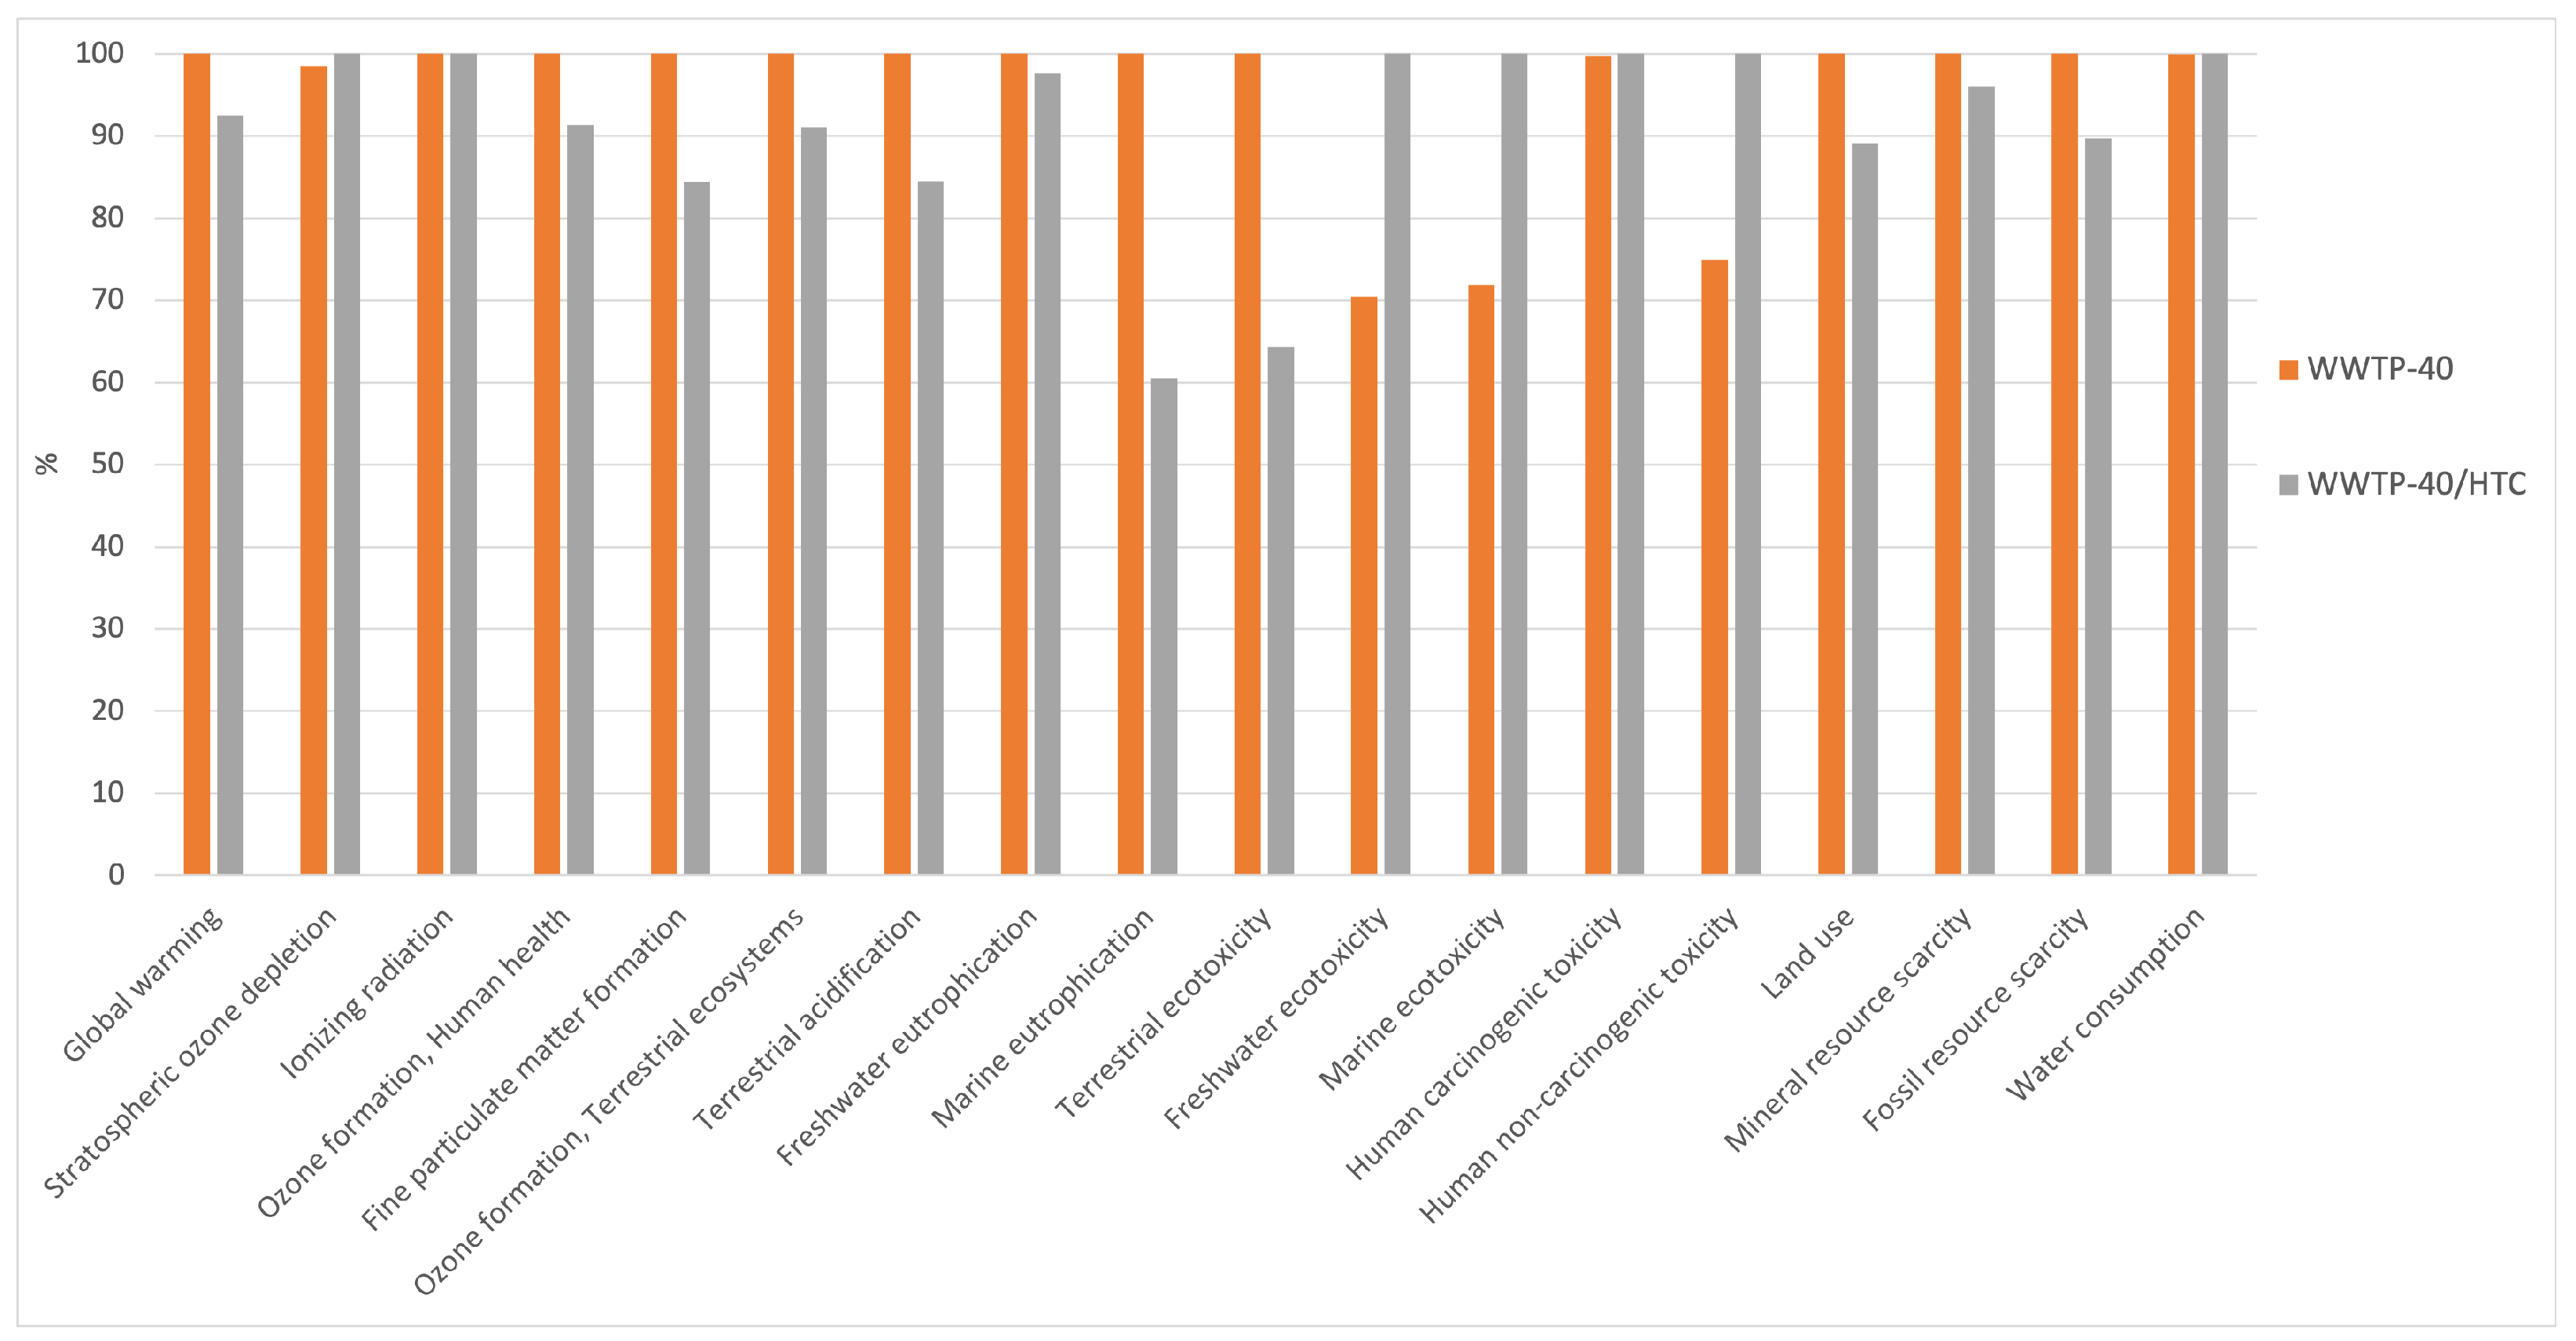
Finally, Figure 9 shows the comparison between the two best operating scenarios associated with a 40-day sludge age: WWTP-40 and WWTP-40/HTC.
This comparison results in a higher environmental impact associated with the integrated WWTP-40/HTC layout only in the following four categories: stratospheric ozone depletion, freshwater ecotoxicity, marine ecotoxicity, and non-carcinogenic human toxicity, due to the incineration of the obtained hydrochar. The overall reduced impact of the integrated scenario has to be ascribed to the avoided sludge disposal; indeed, notwithstanding the emission associated with the hydrochar incineration, this operation does not affect significantly most of the impact categories here analyzed.

5. Conclusions

In this paper, the analysis of the municipal wastewater purification process was carried out by developing an integrated mathematical modeling of two alternative treatments: (i) actual layout of the considered activated sludge plant, i.e., thickening, stabilization, conditioning, and dewatering; (ii) additional hydrothermal carbonization of the excess sludge and treatment of the liquid fraction in the sludge line.
Design Expert software was used to obtain a parametric modeling of the considered alternatives starting from the rigorous modeling obtained on the WEST simulation platform and on the basis of experimental lab scale data for the HTC section. The implementation of parametric correlations in Python allowed the definition of material and energy streams related to three scenarios corresponding to different sludge ages. Finally, environmental impacts were estimated by LCA analysis.
The energy consumption obtained from the integrated layout has been shown to be almost insensitive to variations of the Solids Retention Time, and it compares favourably with respect to the existing conventional MWWTP in the case of low SRT values. The integrated process WWTP/HTC generates a valuable product, whereas the traditional solution produces a considerable amount of sewage sludge to be disposed. In terms of environmental impacts, LCA analysis denoted the wastewater line as the greatest contributor to most of the considered impact categories. Additionally, operating with a high sludge age (of forty days, which is the actual SRT of the considered plant) proved to be associated with the lowest impact, especially due to the reduced energy demand. The comparison between the two scenarios—WWTP-40 and WWTP-40/HTC—reflects in a low environmental impact associated with the integrated layout, designing HTC-integration as a promising solution to a more sustainable management of sewage sludge.

Author Contributions

Conceptualization, R.G., M.P. and G.P.; methodology, R.G., M.P. and G.P.; software, R.B.d.C., R.G. and G.P.; validation, R.G., S.V. and M.P.; formal analysis, R.B.d.C., R.G. and G.P.; investigation, R.G., S.V. and M.P.; resources, S.V. and M.P.; data curation, R.B.d.C., R.G., S.V., M.P. and G.P.; writing—original draft preparation, R.B.d.C. and A.L.T.; writing—review and editing, R.B.d.C., A.L.T., M.P. and G.P.; visualization, R.B.d.C. and A.L.T.; supervision, R.G., M.P. and G.P.; project administration, R.G., M.P. and G.P.; funding acquisition, R.G., M.P. and G.P. All authors have read and agreed to the published version of the manuscript.

Funding

This work has been supported by Regione Toscana through the POR FESR (2014–2020) funding program within the research and development strategic project SLUDGE 4.0.

Institutional Review Board Statement

Not applicable.

Informed Consent Statement

Not applicable.

Data Availability Statement

The data presented in this study are available upon request from the corresponding author.

Acknowledgments

Authors greatly acknowledge Publiacqua S.p.A., and in particular Eng. Simone Caffaz, for providing the data of the San Colombano plant and for improving this study with constructive criticisms.

Conflicts of Interest

The authors declare no conflict of interest.

Abbreviations

The following abbreviations are used in this manuscript:
DoEDesign of Experiments
HTCHydrothermal Carbonization
HCHydrochar
LCALife Cycle Assessment
MWWTPMunicipal Wastewater Treatment Plant
PEPopulation Equivalent
RSMResponse Surface Model
SRTSolid Retention Time
TEEDTotal Electrical Energy Demand
TSSTotal Suspended Solids
WESTWorld Wide Engine for Simulation Training and Automation

References

  1. Van Haandel, A.; Van Der Lubbe, J. Handbook of Biological Wastewater Treatment—Design and Optimisation of Activated Sludge Systems, 2nd ed.; IWA Publishing: London, UK, 2012. [Google Scholar]
  2. Tchobanoglous, G.; Stensel, H.; Tsuchihashi, R.; Burton, F. Wastewater Engineering: Treatment and Resource Recovery, 5th ed.; Metcalf & Eddy Inc.: New York, NY, USA, 2014. [Google Scholar]
  3. Kelessidis, A.; Stasinakis, A.S. Comparative study of the methods used for treatment and final disposal of sewage sludge in European countries. Waste Manag. 2012, 32, 1189–1195. [Google Scholar] [CrossRef] [PubMed]
  4. Libra, J.; Ro, K.; Kammann, C.; Funke, A.; Berge, N.; Neubauer, Y.; Titirici, M.M.; Fuhner, C.; Bens, O.; Kern, J.; et al. Hydrothermal carbonization of biomass residuals: A comparative review of the chemistry, processes and applications of wet and dry pyrolysis. Biofuels 2011, 2, 89–124. [Google Scholar] [CrossRef]
  5. Czerwińska, K.; Śliz, M.; Wilk, M. Hydrothermal carbonization process: Fundamentals, main parameter characteristics and possible applications including an effective method of SARS-CoV-2 mitigation in sewage sludge. A review. Renew. Sustain. Energy Rev. 2022, 154, 111873. [Google Scholar] [CrossRef]
  6. Tasca, A.L.; Puccini, M.; Gori, R.; Corsi, I.; Raspolli Galletti, A.M.; Vitolo, S. Hydrothermal carbonization of sewage sludge: A critical analysis of process severity, hydrochar properties and environmental implications. Waste Manag. 2019, 93, 1–13. [Google Scholar] [CrossRef] [PubMed]
  7. Singh, D.K.; Garg, A. 18—A review on hydrothermal pretreatment of sewage sludge: Energy recovery options and major challenges. In Advanced Organic Waste Management; Hussain, C., Hait, S., Eds.; Elsevier: Amsterdam, The Netherlands, 2022; pp. 297–314. [Google Scholar]
  8. Liu, H.; Basar, I.A.; Nzihou, A.; Eskicioglu, C. Hydrochar derived from municipal sludge through hydrothermal processing: A critical review on its formation, characterization, and valorization. Water Res. 2021, 199, 117186. [Google Scholar] [CrossRef]
  9. He, C.; Giannis, A.; Wang, J.Y. Conversion of sewage sludge to clean solid fuel using hydrothermal carbonization: Hydrochar fuel characteristics and combustion behavior. Appl. Energy 2013, 111, 257–266. [Google Scholar] [CrossRef]
  10. Escala, M.; Zumbühl, T.; Koller, C.; Junge, R.; Krebs, R. Hydrothermal Carbonization as an Energy-Efficient Alternative to Established Drying Technologies for Sewage Sludge: A Feasibility Study on a Laboratory Scale. Energy Fuels 2013, 27, 454–460. [Google Scholar] [CrossRef]
  11. Bhatt, D.; Shrestha, A.; Dahal, R.K.; Acharya, B.; Basu, P.; MacEwen, R. Hydrothermal Carbonization of Biosolids from Waste Water Treatment Plant. Energies 2018, 11, 2286. [Google Scholar] [CrossRef]
  12. Chu, Q.; Xue, L.; Singh, B.P.; Yu, S.; Müller, K.; Wang, H.; Feng, Y.; Pan, G.; Zheng, X.; Yang, L. Sewage sludge-derived hydrochar that inhibits ammonia volatilization, improves soil nitrogen retention and rice nitrogen utilization. Chemosphere 2020, 245, 125558. [Google Scholar] [CrossRef]
  13. Benstoem, F.; Becker, G.; Firk, J.; Kaless, M.; Wuest, D.; Pinnekamp, J.; Kruse, A. Elimination of micropollutants by activated carbon produced from fibers taken from wastewater screenings using hydrothermal carbonization. J. Environ. Manag. 2018, 211, 278–286. [Google Scholar] [CrossRef]
  14. Huang, R.; Tang, Y. Speciation dynamics of phosphorous during (hydro)thermal treatments of sewage sludge. Environ. Sci. Technol. 2015, 49, 14466–14474. [Google Scholar] [CrossRef]
  15. Ren, J.; Wang, F.; Zhai, Y.; Zhu, Y.; Peng, C.; Wang, T.; Li, C.; Zeng, G. Effect of sewage sludge hydrochar on soil properties and Cd immobilization in a contaminated soil. Chemosphere 2017, 189, 627–633. [Google Scholar] [CrossRef]
  16. Nemcik, J.; Krupa, F.; Ozana, S.; Slanina, Z. Wastewater Treatment Modeling Methods Review. IFAC-PapersOnLine 2022, 55, 195–200. [Google Scholar] [CrossRef]
  17. Petrides, D.; Cruz, R.; Calandranis, J. Optimization of wastewater treatment facilities using process simulation. Comput. Chem. Eng. 1998, 22, S339–S346. [Google Scholar] [CrossRef]
  18. Moral, H.; Aksoy, A.; Gokcay, C.F. Modeling of the activated sludge process by using artificial neural networks with automated architecture screening. Comput. Chem. Eng. 2008, 32, 2471–2478. [Google Scholar] [CrossRef]
  19. Hvala, N.; Kocijan, J. Design of a hybrid mechanistic/Gaussian process model to predict full-scale wastewater treatment plant effluent. Comput. Chem. Eng. 2020, 140, 106934. [Google Scholar] [CrossRef]
  20. Aragón-Briceño, C.; Grasham, O.; Ross, A.; Dupont, V.; Camargo-Valero, M. Hydrothermal carbonization of sewage digestate at wastewater treatment works: Influence of solid loading on characteristics of hydrochar, process water and plant energetics. Renew. Energy 2020, 157, 959–973. [Google Scholar] [CrossRef]
  21. Knötig, P.; Etzold, H.; Wirth, B. Model-Based Evaluation of Hydrothermal Treatment for the Energy Efficient Dewatering and Drying of Sewage Sludge. Processes 2021, 9, 1346. [Google Scholar] [CrossRef]
  22. Zuluaga-Bedoya, C.; Ruiz-Botero, M.; Ospina-Alarcón, M.; Garcia-Tirado, J. A dynamical model of an aeration plant for wastewater treatment using a phenomenological based semi-physical modeling methodology. Comput. Chem. Eng. 2018, 117, 420–432. [Google Scholar] [CrossRef]
  23. Ocampo-Martinez, C. Model Predictive Control of Wastewater Systems; Springer: Berlin/Heidelberg, Germany, 2010. [Google Scholar]
  24. Alsulaili, A.; Refaie, A. Artificial neural network modeling approach for the prediction of five-day biological oxygen demand and wastewater treatment plant performance. Water Supply 2021, 21, 1861–1877. [Google Scholar] [CrossRef]
  25. Corominas, L.; Foley, J.; Guest, J.; Hospido, A.; Larsen, H.; Morera, S.; Shaw, A. Life cycle assessment applied to wastewater treatment: State of the art. Water Res. 2013, 47, 5480–5492. [Google Scholar] [CrossRef]
  26. Renou, S.; Thomas, J.; Aoustin, E.; Pons, M. Influence of impact assessment methods in wastewater treatment LCA. J. Clean. Prod. 2008, 16, 1098–1105. [Google Scholar] [CrossRef]
  27. Yoshida, H.; Clavreul, J.; Scheutz, C.; Christensen, T.H. Influence of data collection schemes on the Life Cycle Assessment of a municipal wastewater treatment plant. Water Res. 2014, 56, 292–303. [Google Scholar] [CrossRef] [PubMed]
  28. Gallego-Schmid, A.; Tarpani, R.R.Z. Life cycle assessment of wastewater treatment in developing countries: A review. Water Res. 2019, 153, 63–79. [Google Scholar] [CrossRef] [PubMed]
  29. Benavente, V.; Fullana, A.; Berge, N.D. Life cycle analysis of hydrothermal carbonization of olive mill waste: Comparison with current management approaches. J. Clean. Prod. 2017, 142, 2637–2648. [Google Scholar] [CrossRef]
  30. Berge, N.D.; Li, L.; Flora, J.R.; Ro, K.S. Assessing the environmental impact of energy production from hydrochar generated via hydrothermal carbonization of food wastes. Waste Manag. 2015, 43, 203–217. [Google Scholar] [CrossRef]
  31. Medina-Martos, E.; Istrate, I.R.; Villamil, J.A.; Gálvez-Martos, J.L.; Dufour, J.; Mohedano, Á.F. Techno-economic and life cycle assessment of an integrated hydrothermal carbonization system for sewage sludge. J. Clean. Prod. 2020, 277, 122930. [Google Scholar] [CrossRef]
  32. Meisel, K.; Clemens, A.; Fühner, C.; Breulmann, M.; Majer, S.; Thrän, D. Comparative Life Cycle Assessment of HTC Concepts Valorizing Sewage Sludge for Energetic and Agricultural Use. Energies 2019, 12, 786. [Google Scholar] [CrossRef]
  33. Mannarino, G.; Caffaz, S.; Gori, R.; Lombardi, L. Environmental Life Cycle Assessment of Hydrothermal Carbonization of Sewage Sludge and Its Products Valorization Pathways. Waste Biomass Valoriz. 2022, 13, 3845–3864. [Google Scholar] [CrossRef]
  34. Corvalán, C.; Espinoza Pérez, A.T.; Díaz-Robles, L.A.; Cubillos, F.; Vallejo, F.; Gómez, J.; Pino-Cortés, E.; Espinoza-Pérez, L.; Pelz, S.K.; Paczkowski, S.; et al. Life cycle assessment for hydrothermal carbonization of urban organic solid waste in comparison with gasification process: A case study of Southern Chile. Environ. Prog. Sustain. Energy 2021, 40, e13688. [Google Scholar] [CrossRef]
  35. WEST. WEST Software. 2023. Available online: https://www.mikepoweredbydhi.com/products/west (accessed on 24 April 2023).
  36. Muoio, R.; Palli, L.; Ducci, I.; Coppini, E.; Bettazzi, E.; Daddi, D.; Fibbi, D.; Gori, R. Optimization of a large industrial wastewater treatment plant using a modeling approach: A case study. J. Environ. Manag. 2019, 249, 109436. [Google Scholar] [CrossRef]
  37. Oehlert, G.W. A First Course in Design and Analysis of Experiments; W. H. Freeman: New York, NY, USA, 2010. [Google Scholar]
  38. Tasca, A.L.; Stefanelli, E.; Raspolli Galletti, A.M.; Gori, R.; Mannarino, G.; Vitolo, S.; Puccini, M. Hydrothermal Carbonization of Sewage Sludge: Analysis of Process Severity and Solid Content. Chem. Eng. Technol. 2020, 43, 2382–2392. [Google Scholar] [CrossRef]
  39. Yu, S.; Dong, X.; Zhao, P.; Luo, Z.; Sun, Z.; Yang, X.; Li, Q.; Wang, L.; Zhang, Y.; Zhou, H. Decoupled temperature and pressure hydrothermal synthesis of carbon sub-micron spheres from cellulose. Nat. Commun. 2022, 13, 3616. [Google Scholar] [CrossRef]
  40. Yu, S.; Yang, X.; Li, Q.; Zhang, Y.; Zhou, H. Breaking the temperature limit of hydrothermal carbonization of lignocellulosic biomass by decoupling temperature and pressure. Green Energy Environ. 2023; in press. [Google Scholar]
Figure 1. The integrated approach for simulation, modeling and life cycle assessment.
Chemengineering 07 00044 g001
Figure 2. Flow diagram of the MWWT process integrated with the HTC section.
Chemengineering 07 00044 g002
Figure 3. Lab apparatus for the hydrothermal carbonization of the sewage sludge.
Chemengineering 07 00044 g003
Figure 4. Flow diagram of HTC section with material and energy streams implemented in Python.
Chemengineering 07 00044 g004
Figure 5. Total electrical energy demand of the six different scenarios.
Chemengineering 07 00044 g005
Figure 6. Amount of solid effluents of the different scenarios.
Chemengineering 07 00044 g006
Figure 7. Estimated impacts: comparison between wastewater and sludge lines in the WWTP-40 scenario.
Chemengineering 07 00044 g007
Figure 8. Estimated impacts: comparison between wastewater and sludge treatment lines in the WWTP-40/HTC scenario.
Chemengineering 07 00044 g008
Figure 9. Comparison in terms of environmental impacts between the WWTP-40 and WWTP-40/HTC scenarios.
Chemengineering 07 00044 g009
Table 1. Features of the wastewater treated in the MWWTP under study.
ParameterUnitInputOutput
Chemical Oxygen Demand (COD as O 2 )g/m 3 141.0 ± 54.227.1 ± 6.4
Total Suspended Solids (TSS)g/m 3 65.1 ± 18.43.6 ± 0.6
Ammonia nitrogen (as NH 4 + )g/m 3 18.2 ± 5.40.95 ± 0.65
Nitrous nitrogen (as N)g/m 3 0.28 ± 0.120.07 ± 0.02
Nitric nitrogen (as N)g/m 3 2.6 ± 1.67.4 ± 2.0
Total nitrogen (as N)g/m 3 21.3 ± 6.88.6 ± 2.0
Total phosphorus (as P)g/m 3 2.6 ± 0.80.96 ± 0.27
pH-7.77 ± 0.057.89 ± 0.13
Table 2. Input factors considered for the wastewater treatment line.
FactorDescriptionLow
Level
High
Level
Unit
Q i n Inlet flow rate15,000350,000m 3 /d
C O D i n Inlet Chemical Oxygen Demand60270g/m 3
N-NH 4 , i n Inlet ammonia nitrogen content1040g/m 3
T o x Temperature in the oxidation tank1327°C
Q e x Excess sludge flow rate from secondary sedimentation14407200m 3 /d
Table 3. Output responses of the wastewater and sludge treatment lines (WWTP-i scenarios).
ResponseDescriptionUnitNotes
Wastewater line
T S S o x Total suspended solids in oxidation tankkg/m 3 -
T S S e x Total suspended solids in excess sludget/yASM3-HTC inlet
S R T Solids Retention Time in oxidation tankdenergy and process parameters
V S S / T S S o x Ratio Volatile - Total Suspended Solids% w/wenergy and process parameters
O 2 , o x Oxygen demand in oxidation tankkg/denergy and process parameters
E C o x Energy Consumption of oxidation tankkWh/denergy and process parameters
C O D o u t COD of clear liquidg/m 3 ASM3-clear liquid
T S S o u t Total Suspended Solids in clear liquidg/m 3 ASM3-clear liquid
N-NH 4 , o u t Ammonia nitrogen in clear liquidg/m 3 ASM3-clear liquid
N-NO 3 , o u t Nitric nitrogen in clear liquidg/m 3 ASM3-clear liquid
T N o u t Total Nitrogeng/m 3 ASM3-clear liquid
D O o u t Dissolved Oxygen in clear liquidg/m 3 ASM3-clear liquid
Sludge Line
Q e x , t h Flow rate of excess sludge after thickeningm 3 /d-
Q b g Flow rate of biogas exiting the sludge linem 3 /d-
Q d e w Flow rate of dewatered sludge exiting the sludge linem 3 /d-
C O D s u p COD of liquid supernatant exiting the sludge lineg/m 3 -
T N s u p Total Nitrogen in supernatant liquidg/m 3 -
Q s u p Flow rate of supernatant liquidm 3 /d-
Table 4. Input factors of the HTC section.
FactorDescriptionLow LevelHigh LevelUnit
T r Carbonization temperature190220°C
τ r Carbonization residence time85240min
S C t s Solid Content in thickened sludge512% w/w
Table 5. Output responses for the HTC section.
ResponseDescriptionUnit
η h c Yield in hydrochar%
η C Yield in carbon C%
H H V h c High Heating Value of hydrocharMJ/kg
D e w Dewaterability of hydrocharm/kg
A s h Ash content in hydrochar% w/w
Table 6. Input factors of the sludge line (integrated scenarios WWTP-i/HTC).
FactorsDescriptionLow LevelHigh LevelUnit of Measure
C O D p w Chemical Oxygen Demand of inlet process water10,00043,350g/m 3
N-NH 4 , p w Ammonia nitrogen content of inlet process water5291850g/m 3
Q p w Flow rate of inlet process water50850m 3 /d
Table 7. Major input data for Python modeling.
Input VariableValueScenarios
Q i n Inlet flow rate [m 3 /d]212,697all six
C O D i n Inlet Chemical Oxygen Demand [g/m 3 ]141all six
N-NH 4 , i n Inlet ammonia nitrogen content [g/m 3 ]18all six
T o x Temperature of the oxidation tank [°C]19all six
Q e x Excess sludge flow rate leaving the secondary sedimentation [m 3 /d]1547WWTP-40; WWTP-40/HTC
3187WWTP-20; WWTP-20/HTC
6465WWTP-10; WWTP-10/HTC
T r Carbonization temperature [°C]2203 WWTP-i/HTC
τ r Carbonization residence time [min]2403 WWTP-i/HTC
S C t s Solid Content in thickened sludge [%]153 WWTP-i/HTC
U h c , o u t Humidity of hydrochar leaving the dryer [-]0.103 WWTP-i/HTC
Table 8. Variables involved in material and energy balances for WWTP-i/HTC scenarios—HTC section.
SymbolDescription
Parameters
U h c , i n Humidity of hydrochar at dryer inlet [0.45]
T t h , 0 Temperature before preheating E1 [80 °C]
T t h , 1 Temperature post preheating E1 [120 °C]
T t h , 2 Temperature post preheating E2 [180 °C]
Unknowns
η h c Yield in hydrochar [%]
Q h c Flow rate of hydrochar leaving the dryer [kg/d]
Q w s Flow rate of wet solid leaving the filter press [kg/d]
Q s l Flow rate of slurry leaving the HTC reactor [kg/d]
Q p w Flow rate of process water leaving the filter press [m 3 /d]
Δ v a p Condensed vapor inside the HTC reactor [kg/d]
Q g a s Flow rate of gas required for drying the hydrochar [kg/d]
Table 9. Variables involved in material and energy balances of the WWTP-i/HTC scenarios-Utilities.
SymbolDescription
Parameters
T f m Temperature of the fumes leaving the boiler [245 °C]
R t a , f Ratio between theoretical air and fuel [17.31]
R r a , t a Ratio between real air and theoretical air [1.5]
T H 2 O Temperature of evaporator inlet water [23 °C]
T a i r Temperature of air to be mixed with the fumes for the dryer [90 °C]
T g a s Temperature of gas entering the dryer [115 °C]
T b Temperature of combustion in the boiler [1950 °C]
T w g , 1 Temperature of water-glycol before preheating E1 [180 °C]
T w g , 2 Temperature of water-glycol after preheating E1 [100 °C]
Unknowns
Q a i r Flow rate of air to be mixed with the fumes for the dryer [kg/d]
Q f m Flow rate of fumes leaving the boiler [kg/d]
Q v a p Flow rate of steam leaving the evaporator [kg/d]
T m i x Temperature of evaporator outlet water [°C]
Q v a p 1 Flow rate of steam entering the second preheater [kg/d]
Q v a p 2 Flow rate of steam entering the HTC reactor [kg/d]
Q a i r , c Flow rate of effective air for combustion [kg/d]
Q C H 4 Flow rate of fuel required for combustion [kg/d]
Q H 2 O Flow rate of water to be sent to the evaporator [kg/d]
Q w g Flow rate of water-glycol to be sent to the preheater [kg/d]
T s l Temperature of the slurry leaving the reactor exchanger (E3) [°C]
Q f m 1 Flow rate of fumes sent to the dryer [kg/d]
Q f m 2 Flow rate of fumes sent to energy recovery and to disposal [kg/d]
Table 10. Results of modeling in Python for three WWTP-i scenarios.
Output VariableWWTP-40WWTP-20WWTP-10
Clear liquid
C O D o u t Outlet Chemical Oxygen Demand [g/m 3 ]27.3727.0025.92
T S S o u t Total Suspended Solids [g/m 3 ]2.2541.5140.674
N-NH 4 , o u t Ammonia nitrogen content [g/m 3 ]1.1391.5122.633
N-NO 3 o u t Nitric nitrogen content [g/m 3 ]5.0545.1805.228
T N o u t Total Nitrogen content [g/m 3 ]6.4676.9628.120
D O o u t Dissolved Oxygen [g/m 3 ]0.5280.9281.728
Q o u t Flow rate of outlet clear liquid [m 3 /d]212,643212,642212,641
Thickened sludge
T S S e x Total Suspended Solids in excess sludge [t/y]557859046492
Q t h Thickened sludge flow rate [kg/d]15,28216,17617,787
Anaerobic digester
Q b g Biogas flow rate [Sm 3 /d]264131474130
Q d e w Flow rate of dewatered sludge [m 3 /d]53.9454.8056.00
M d e w Dewatered sludge amount [kg/d] ( * )54,74755,65756,827
C O D s u p COD of supernatant liquid [g/m 3 ]264.7183.086.19
T N s u p Total Nitrogen in supernatant liquid [g/m 3 ]129.9102.562.83
Q s u p Flow rate of supernatant liquid [m 3 /d]149331326409
Energy and process variables
T S S o x Total suspended solids in oxidation tank [kg/m 3 ]4.5083.0271.348
S R T Solids Retention Time [d]402010
V S S / T S S o x Ratio Volatile—Total Suspended Solids [-]0.5810.5950.626
O 2 , o x Oxygen demand in oxidation tank [kg/d]19,96719,45818,004
E C o x Energy Consumption of oxidation tank [kWh/d]774875506986
E C w l Energy Consumption of wastewater line [kWh/d]35,77036,04336,591
E C s l Energy Consumption of sludge line [kWh/d]4667961519,505
( * ): M d e w = Q d e w ρ s l , being ρ s l = 1.015 kg/m 3 the sludge density.
Table 11. Results of the modeling in Python for three WWTP-i/HTC scenarios—part 1.
Output VariablesWWTP-40/HTCWWTP-20/HTCWWTP-10/HTC
Clear liquid
C O D o u t Outlet Chemical Oxygen Demand [g/m 3 ]30.3530.0029.27
T S S o u t Total Suspended Solids [g/m 3 ]2.5231.6980.769
N-NH 4 , o u t Ammonia nitrogen content [g/m 3 ]1.1661.5362.668
N-NO 3 , o u t Nitric nitrogen content [g/m 3 ]5.5055.5145.544
T N o u t Total Nitrogen content [g/m 3 ]6.9747.3508.505
D O o u t Dissolved Oxygen [g/m 3 ]0.5280.9281.728
Q o u t Flow rate of outlet clear liquid [m 3 /d]212,687212,687212,686
Thickened sludge
T S S e x Total suspended solids in excess sludge [t/y]616265457332
Q t h Thickened sludge flow rate [kg/d]16,88217,93120,089
HTC section—extensive variables
Q h c Flow rate of hydrochar leaving the dryer [kg/d]11,87812,61614,134
Q p w Flow rate of process water leaving the filter press [m 3 /d]103.25109.7122.9
Q w s Flow rate of wet solid leaving the filter press [kg/d]112,548119,541133,927
Q g a s Flow rate of outlet gas required for drying the hydrochar [kg/d]279,813297,199332,966
Q g a s , o u t Flow rate of outlet gas [kg/d]287,372305,227341,961
Δ v a p Condensed vapor inside the HTC reactor [kg/d]10,13410,76412,059
Q s l Flow rate of slurry leaving the reactor [kg/d]122,682130,305145,987
Utilities—extensive variables
Q a i r Flow rate of air to mix with the fumes for the dryer [kg/d]240,619255,570286,327
Q c o n d 1 Flow rate of condensed vapour [kg/d]15,20216,14618,089
Q a i r , c Flow rate of effective air for combustion [kg/d]39,72042,18847,265
Q C H 4 Flow rate of fuel required for combustion [kg/d]152916251820
Q H 2 O Flow rate of water to be sent to the evaporator [kg/d]25,33626,91030,149
Q w g Flow rate of water-glycol to be sent to the preheater [kg/d]60,18663,92671,619
T s l Temperature of the slurry leaving the reactor exchanger (E3) [°C]183.3183.3183.3
Q f m 1 Flow rate of fumes sent to the dryer [kg/d]39,19441,62946,639
Q f m 2 Flow rate of fumes sent to energy recovery and to disposal [kg/d]205521832446
Table 12. Results of the modeling in Python for three WWTP-i/HTC scenarios—part 2.
Output VariableWWTP-40/HTCWWTP-20/HTCWWTP-10/HTC
Hydrochar features
η h c Yield in hydrochar [%]63.3063.3063.30
η C Yield in carbon C [%]54.6254.6254.62
H H V h c High heating Value [MJ/kg]11.0311.0311.03
D e w Dewaterability [m/kg]761.2 × 10 9 761.2 × 10 9 761.2 × 10 9
A s h Ash content [% w/w]59.1959.1959.19
Sludge line after HTC section
Q b g Biogas flow rate [Sm 3 /d]151816111801
Q d e w Flow rate of dewatered sludge [m 3 /d]0.8360.8961.021
M d e w Dewatered sludge amount [kg/d]849.0909.01036
C O D s u p Chemical Oxygen Demand in supernatant liquid [g/m 3 ]35,66535,66535,665
T N s u p Total Nitrogen in supernatant liquid [g/m 3 ]690969096909
Q s u p Flow rate of supernatant liquid [m 3 /d]102.9109.2122.4
Energy and process variables
T S S o x Total suspended solids in oxidation tank [kg/m 3 ]5.0453.3951.539
S R T Solids Retention Time in the oxidation tank [d]402010
V S S / T S S o x Ratio Volatile—Total Suspended Solids [-]0.5820.5960.626
O 2 , o x Oxygen demand in oxidation tank [kg/d]22,37321,60820,182
E C o x Energy Consumption of oxidation tank [kWh/d]868283857831
E C w l Energy Consumption of wastewater line [kWh/d]35,77736,05136,598
E C t h Energy Consumption of thickening [kWh/d]533.0721.01097
E C h c Energy Consumption of HTC [kWh/d]818886979743
E C s l Energy Consumption of sludge line [kWh/d]311.0331.0371.0
Disclaimer/Publisher’s Note: The statements, opinions and data contained in all publications are solely those of the individual author(s) and contributor(s) and not of MDPI and/or the editor(s). MDPI and/or the editor(s) disclaim responsibility for any injury to people or property resulting from any ideas, methods, instructions or products referred to in the content.

