

Enhancement of Photocatalytic Activity and Microstructural Growth of Cobalt-Substituted Ba1−xCoxTiO3 {x = 0, …, 1} Heterostructure

Abstract
:1. Introduction
2. Materials and Methods
2.1. Starting Reagents
2.2. Experimental Process
2.3. Characterization Methods
2.3.1. PXRD Analysis
2.3.2. TEM Scanning and Energy-Dispersive X-ray Spectroscopy (EDX)
2.3.3. Fourier Transform Infrared Spectroscopy (FTIR)
2.3.4. Photoluminescence Spectroscopy (PL)
2.3.5. UV-Visible Spectroscopy
2.3.6. Photocatalytic Application
3. Results and Discussion
3.1. Study of Structurals
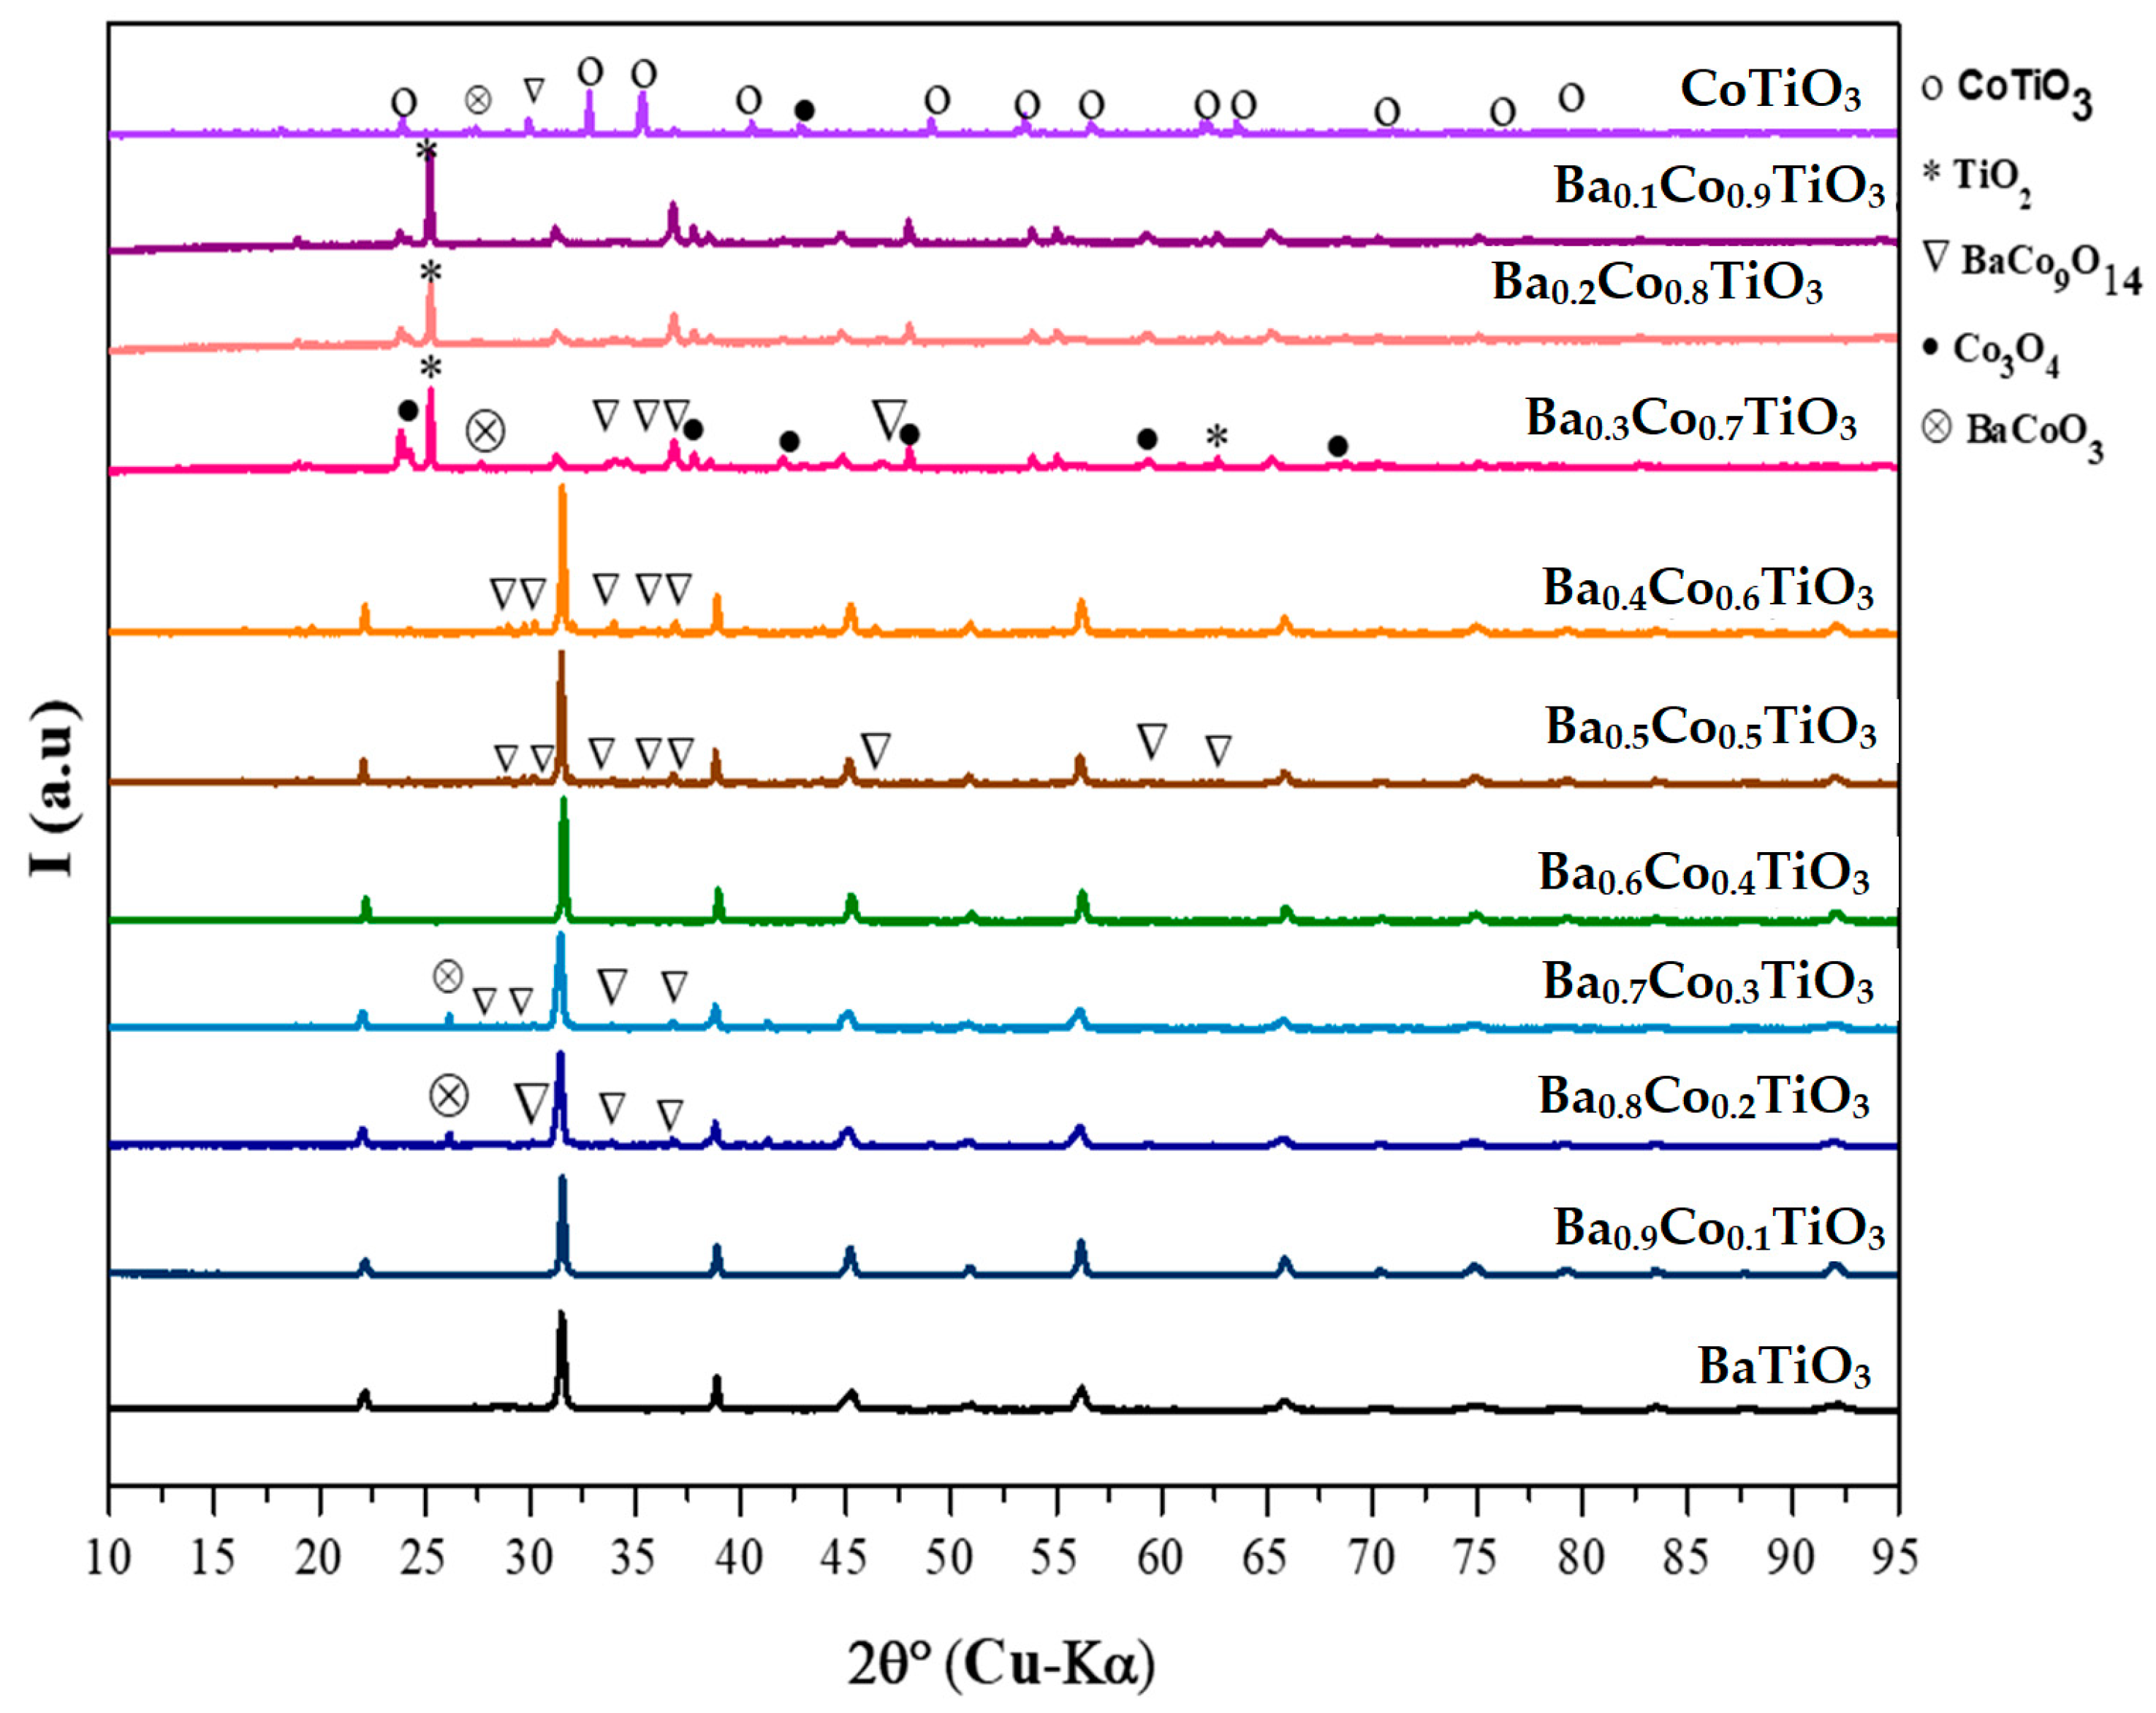
3.1.1. Qualitative PXRD Analysis
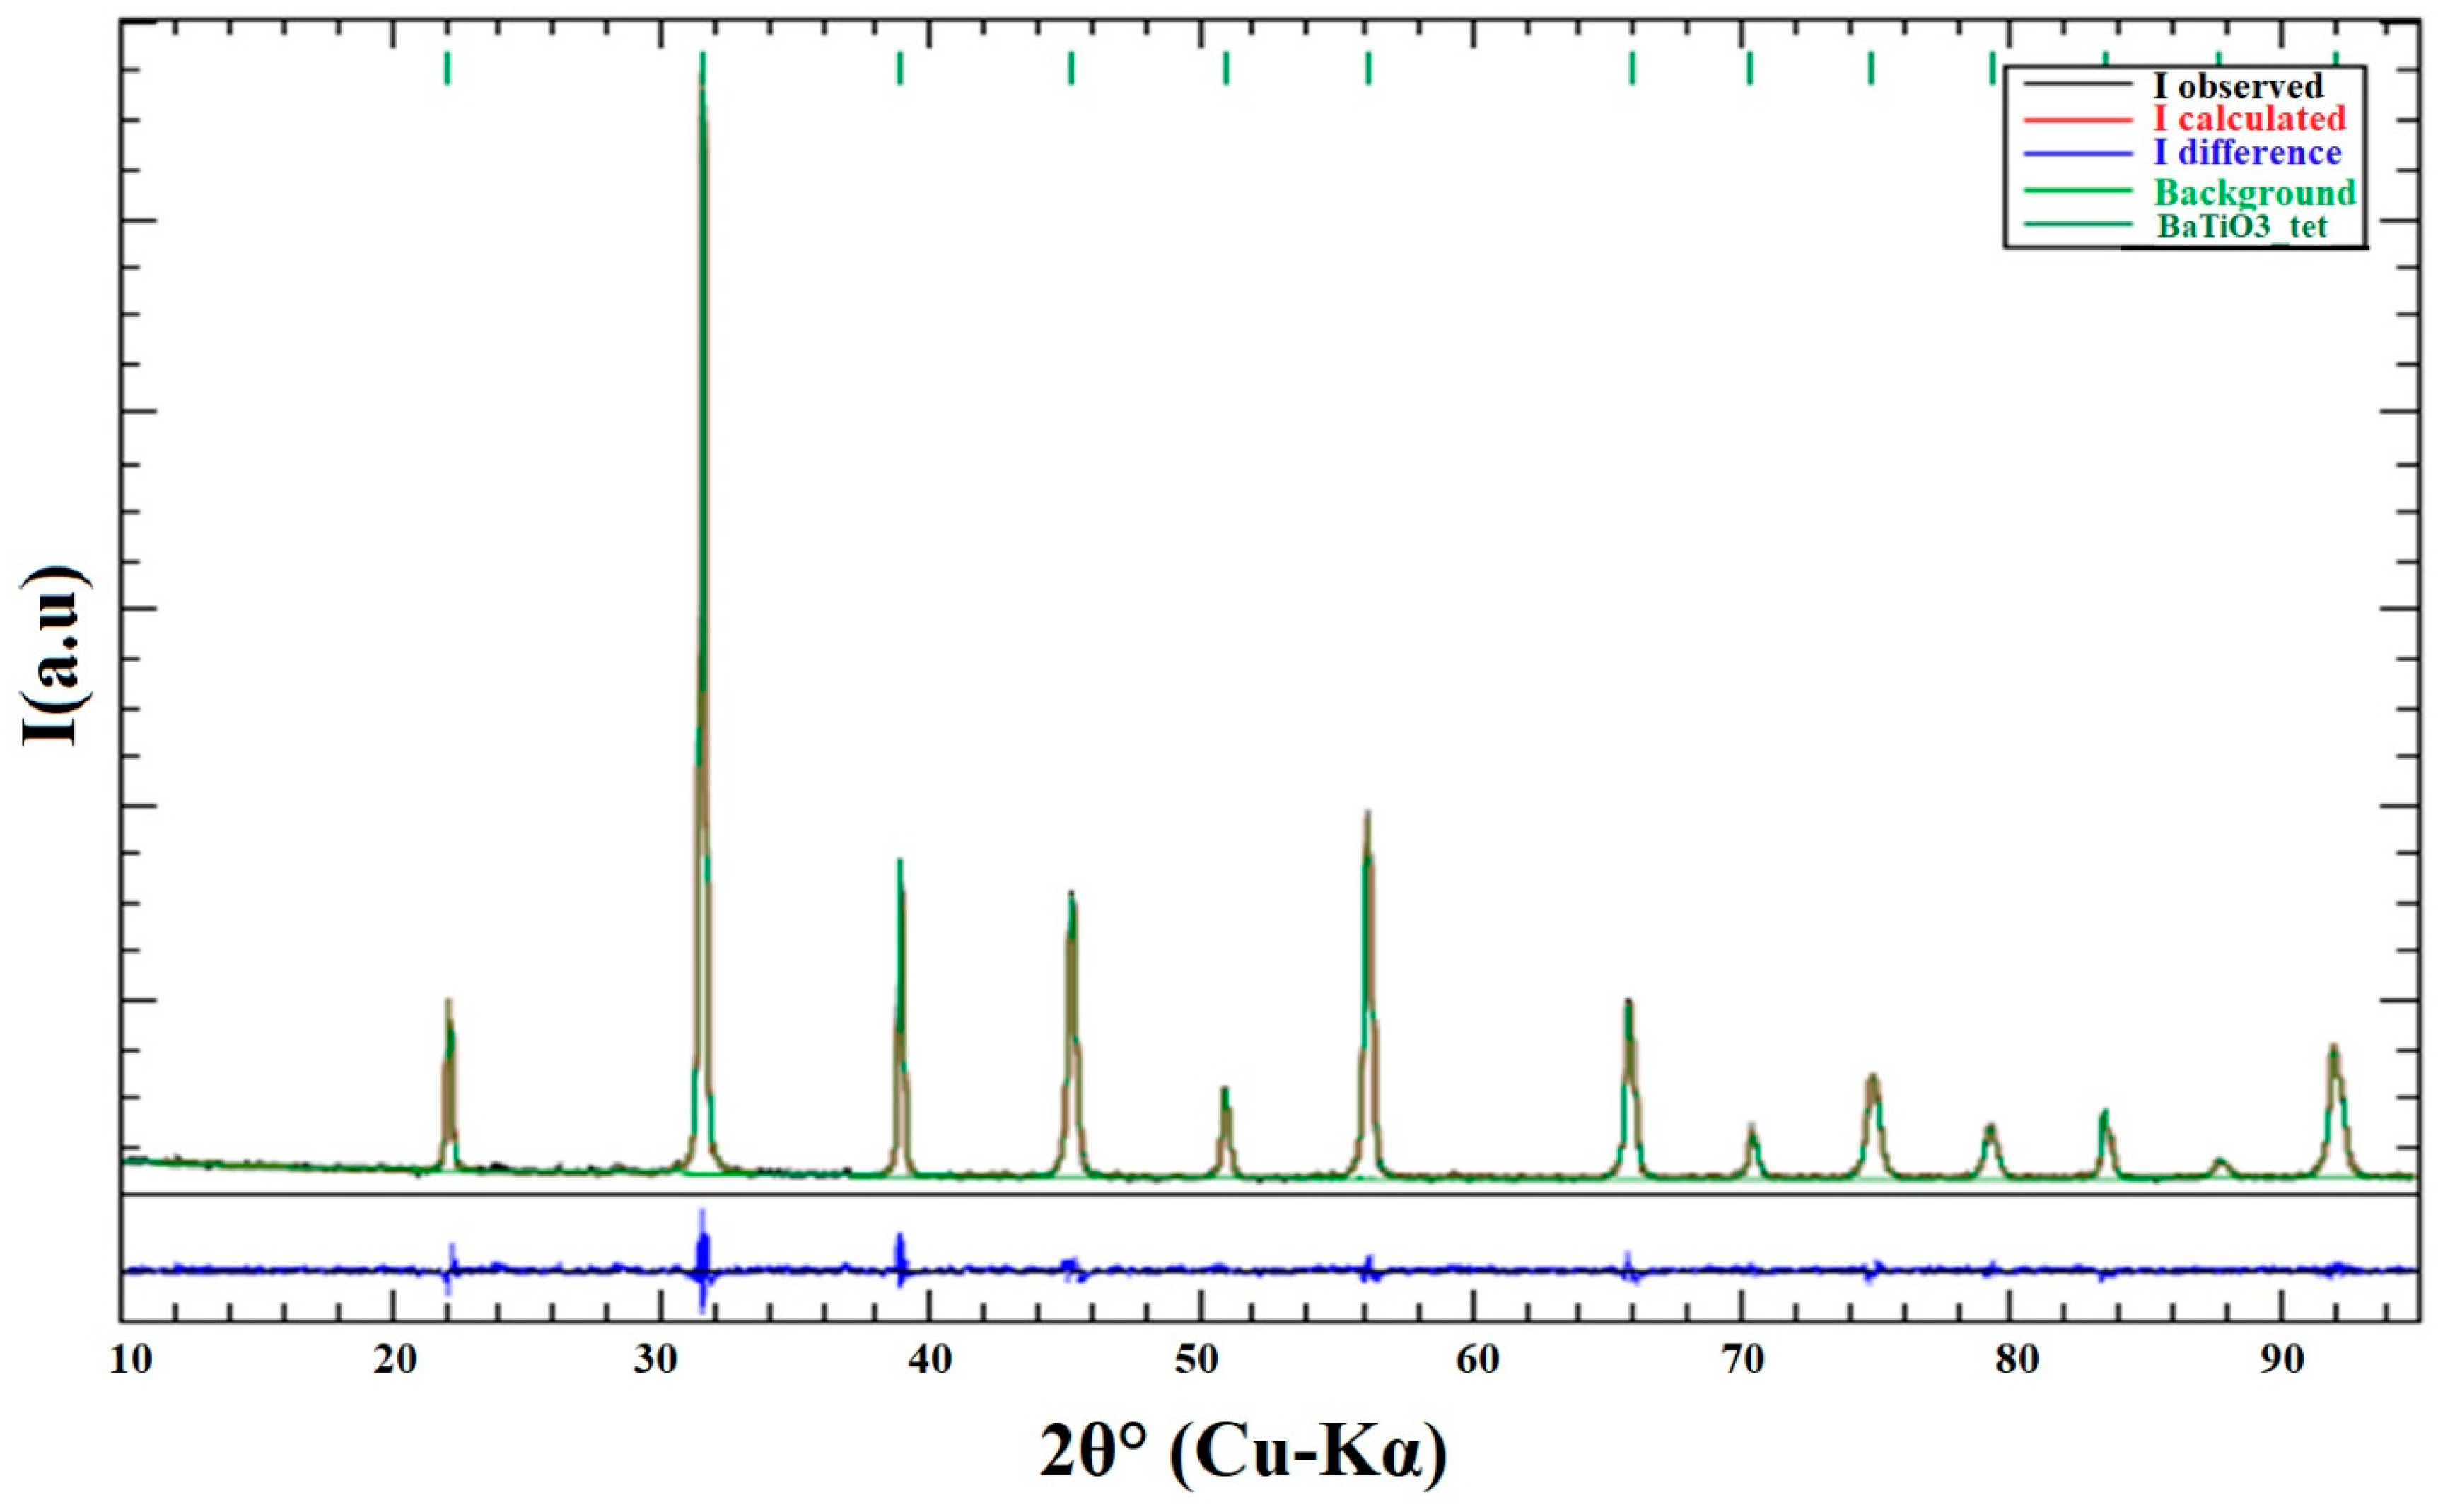
3.1.2. Quantitative PXRD Analysis
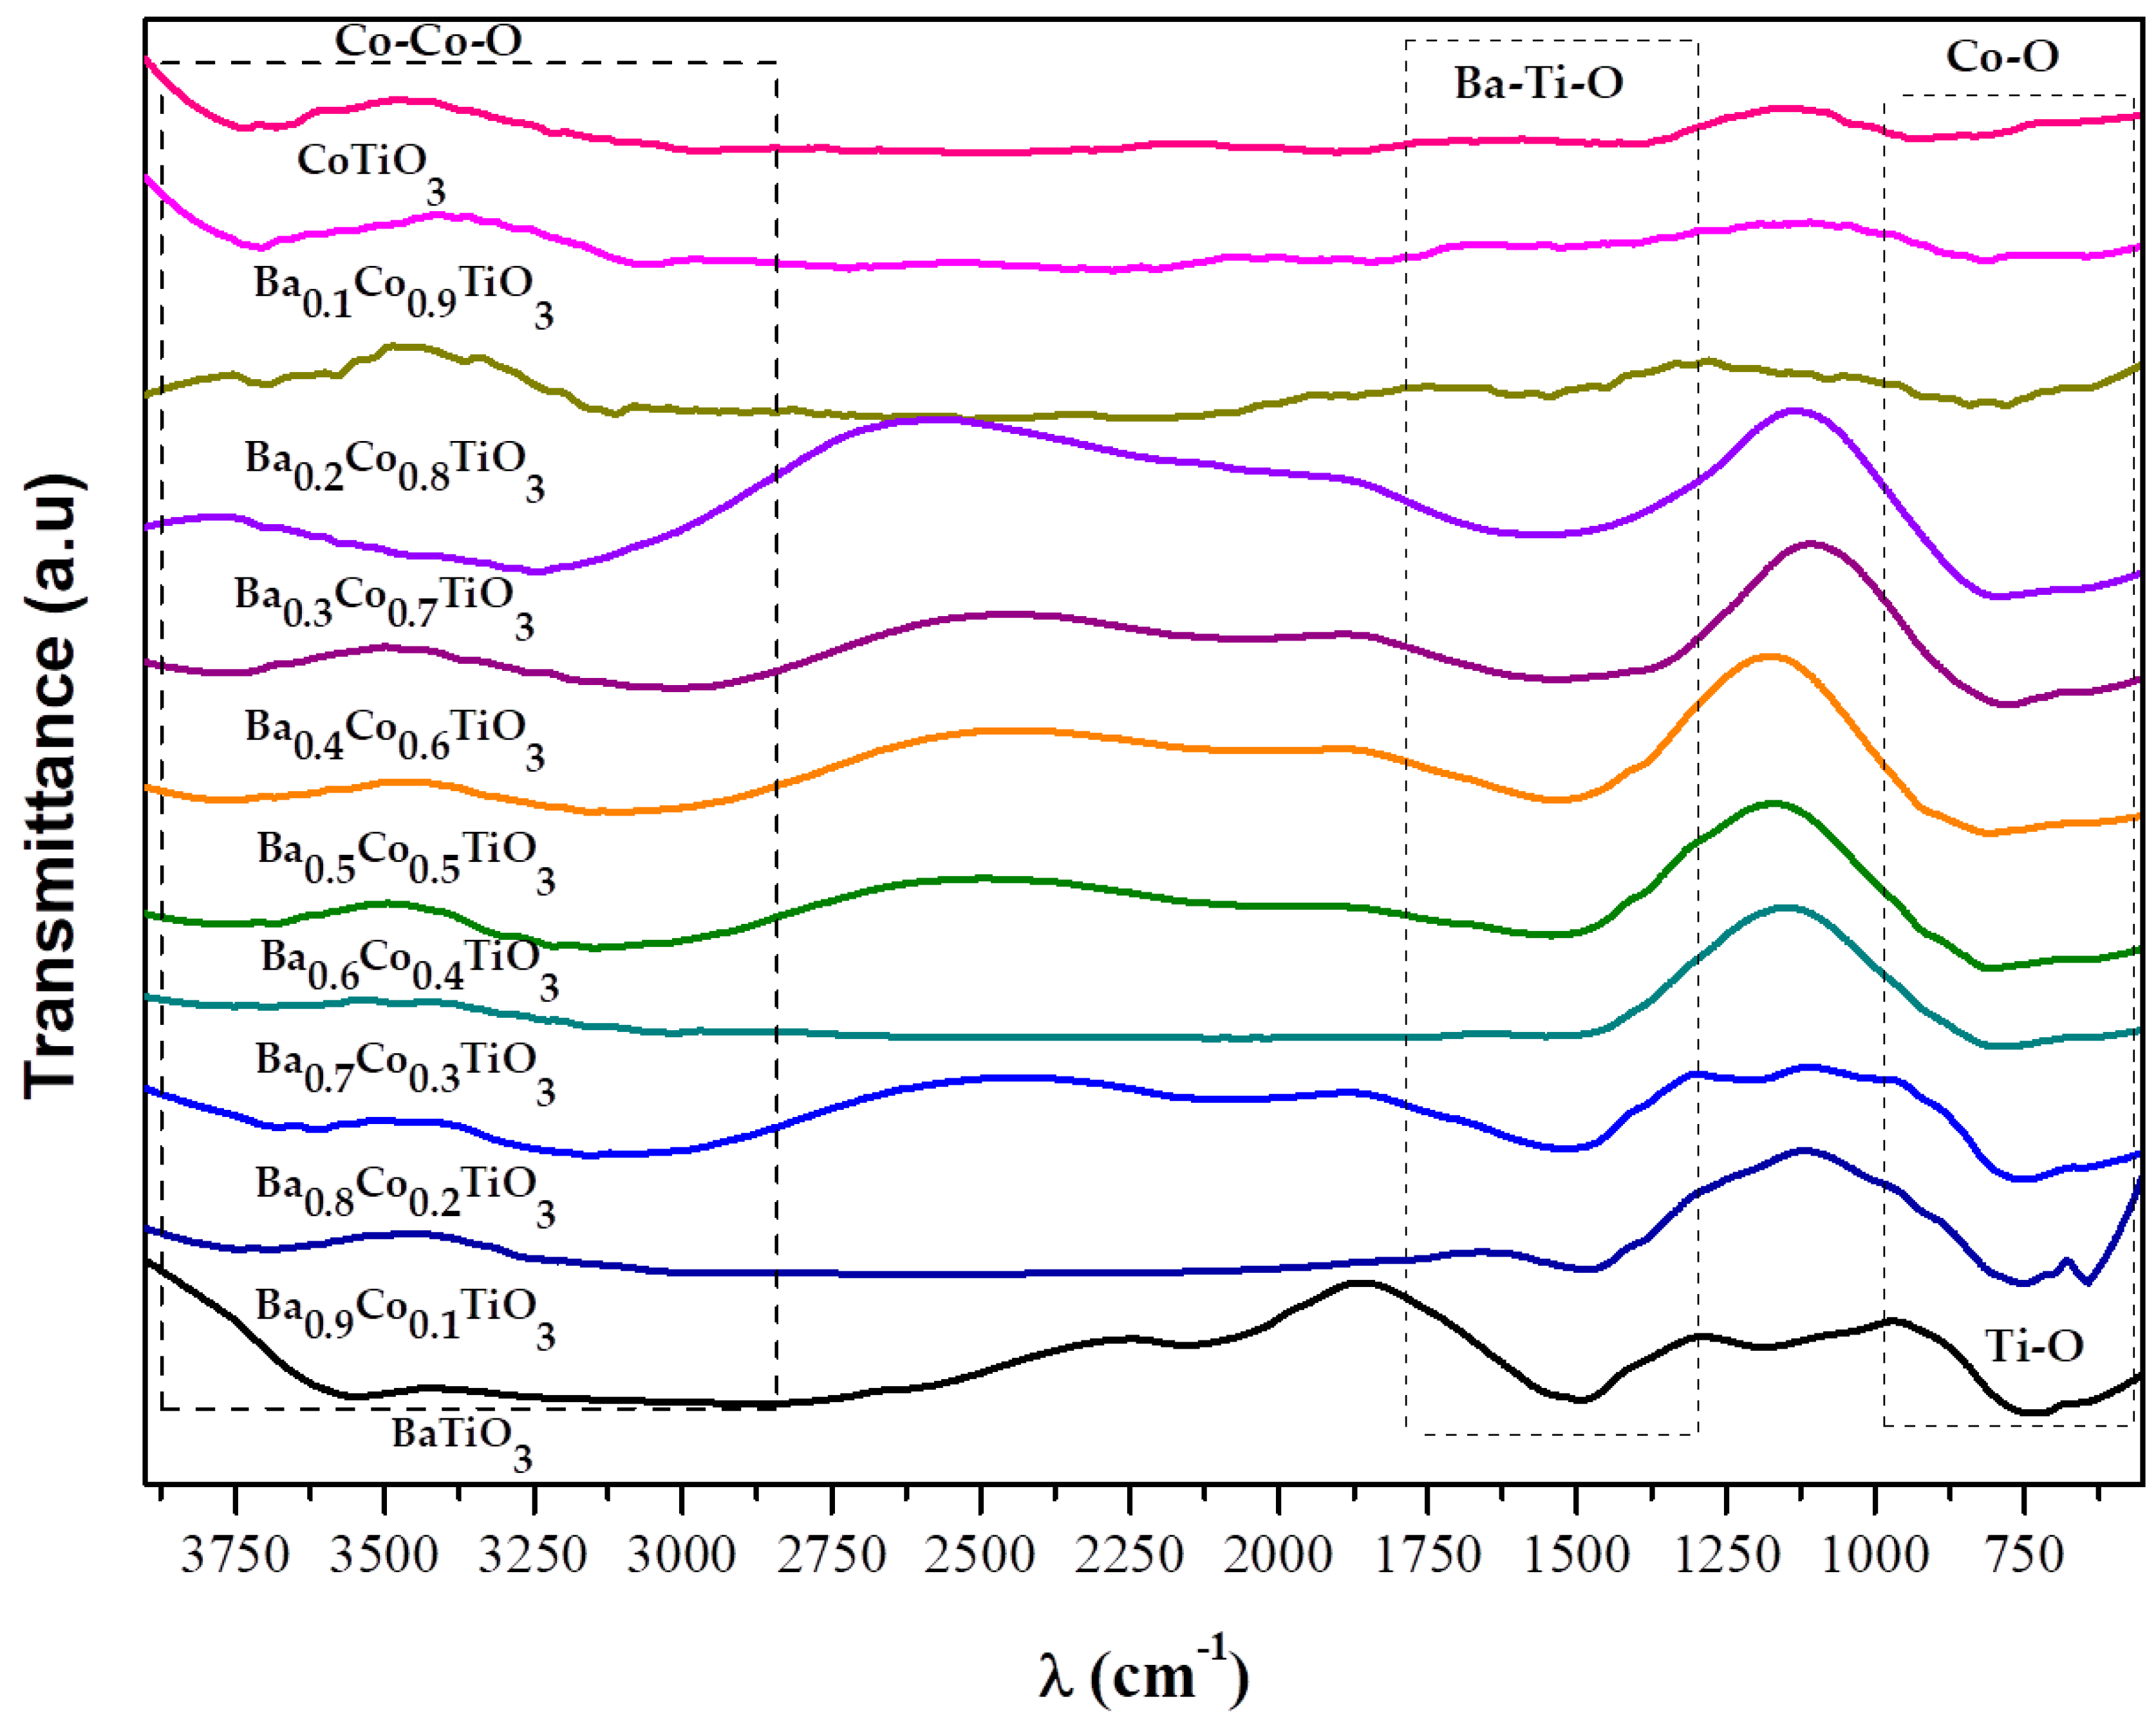
3.1.3. FT-IR
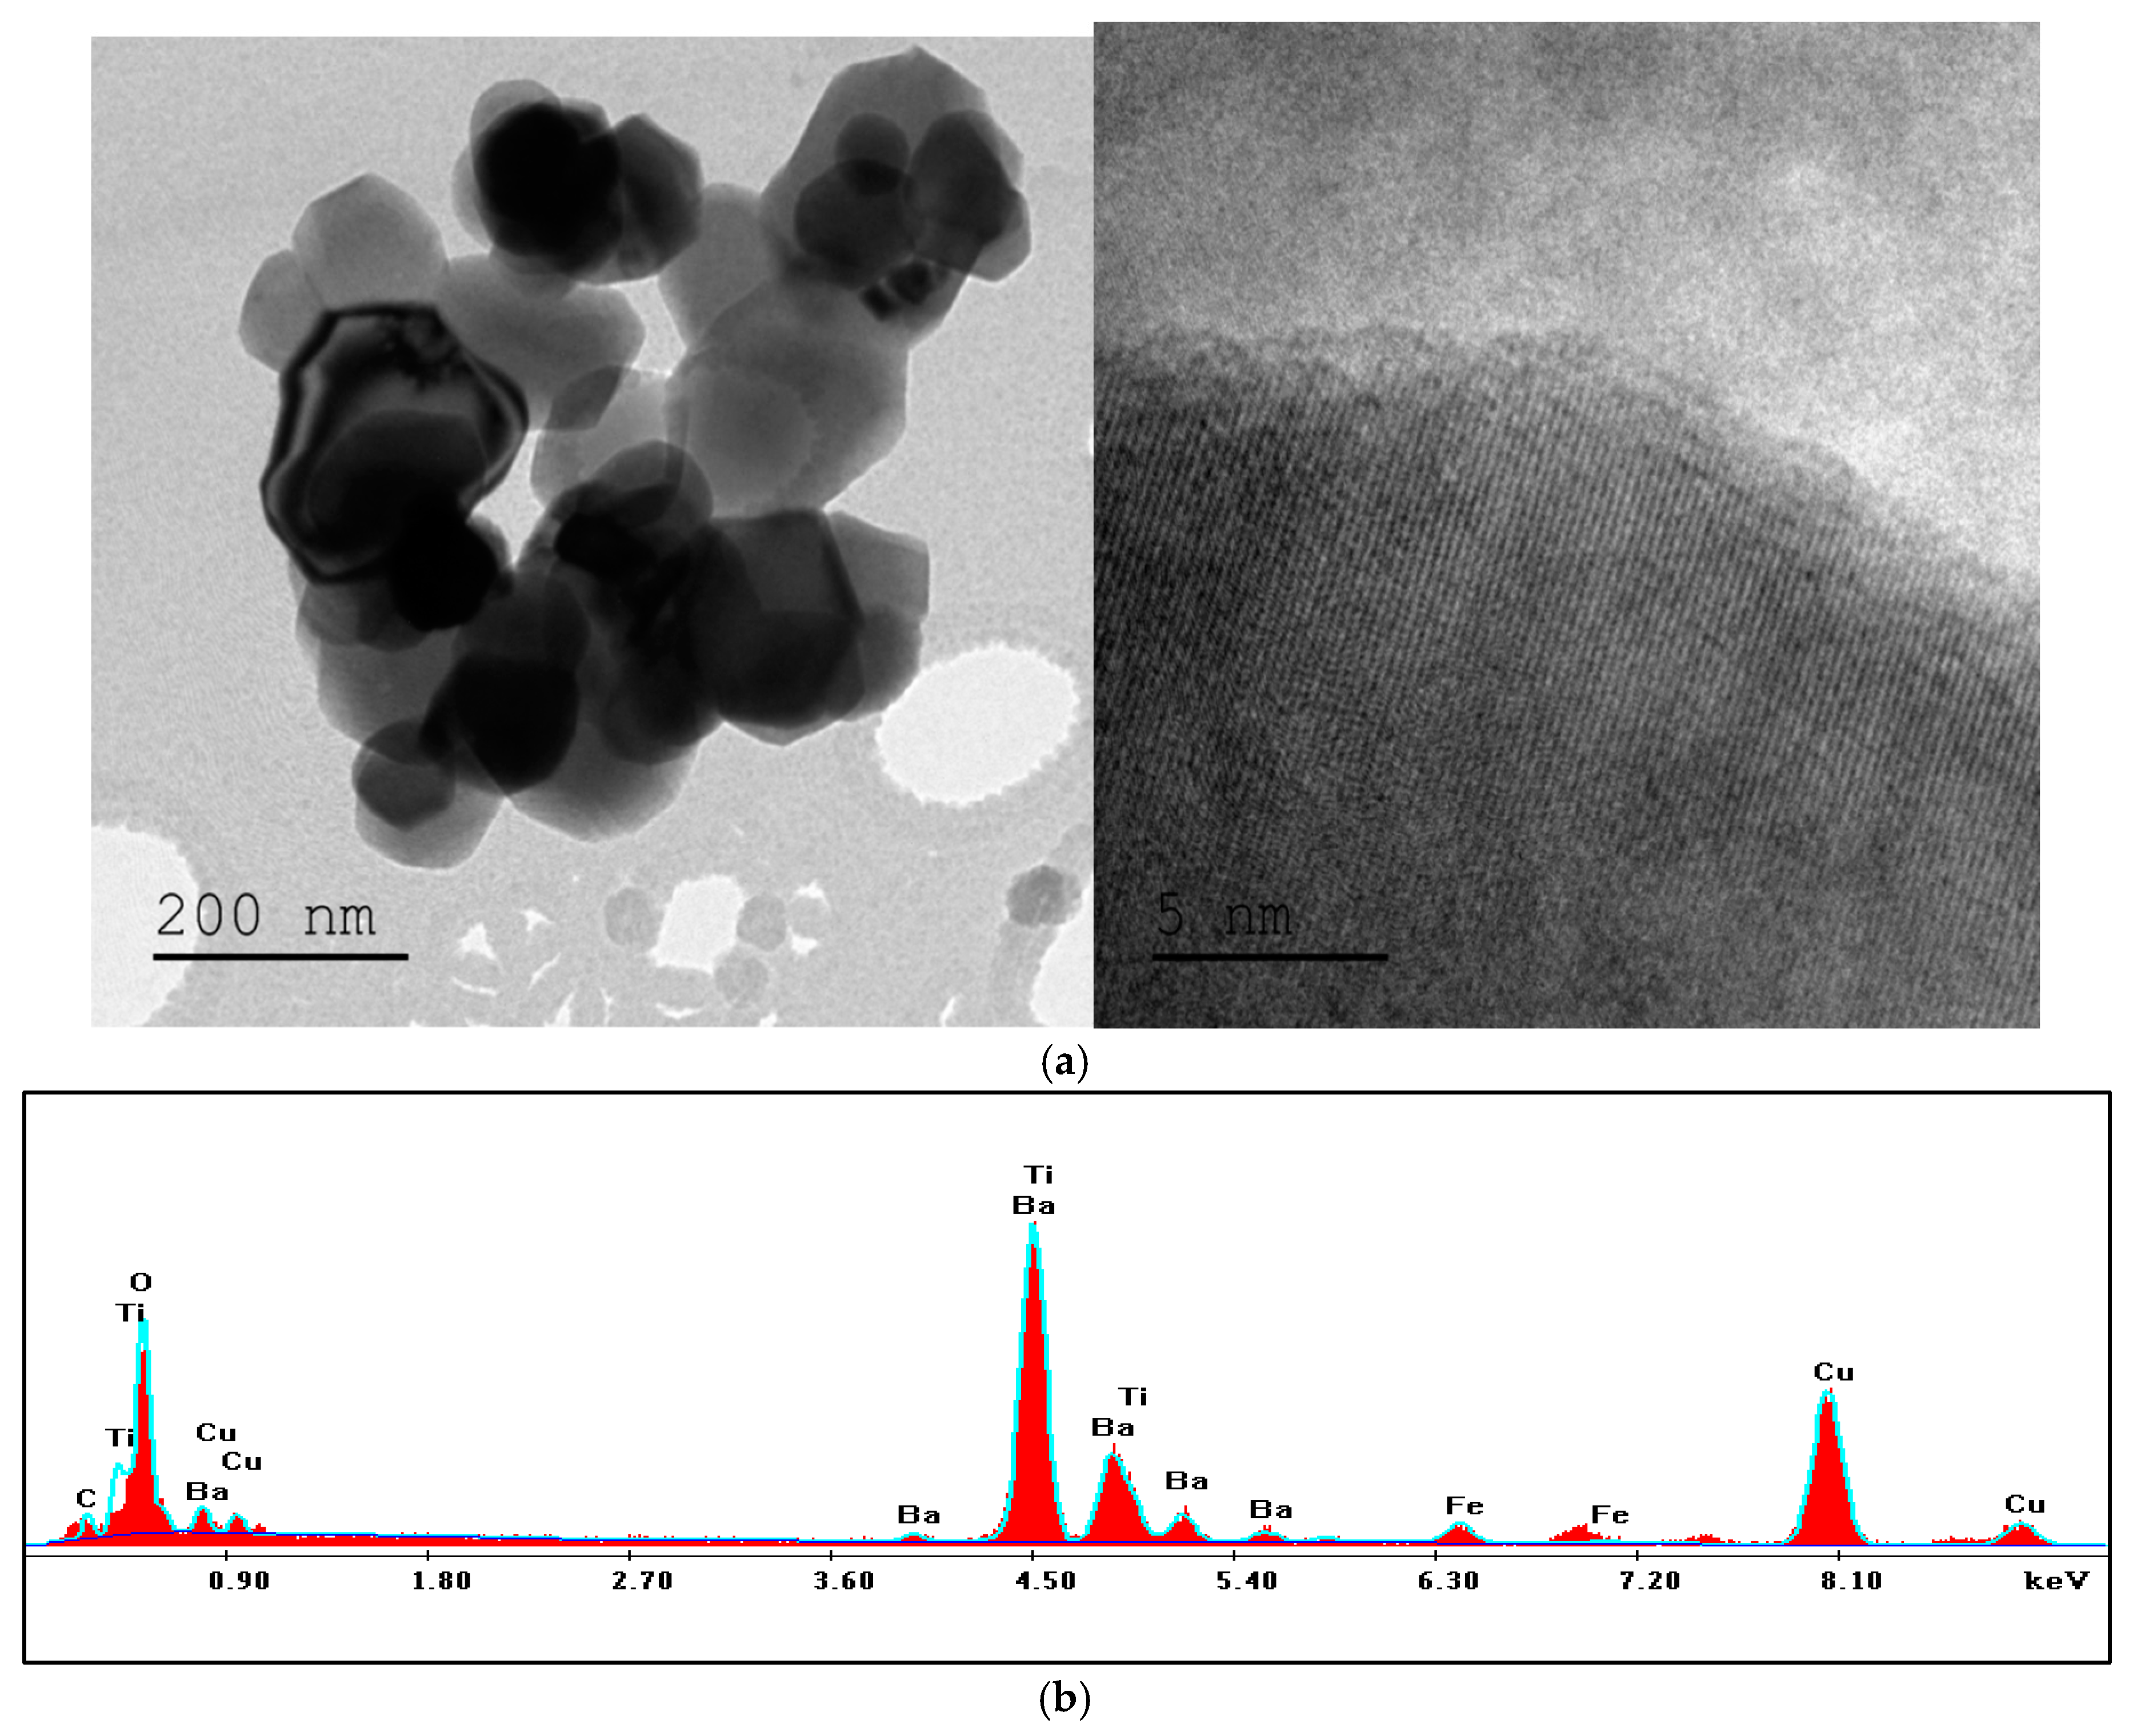
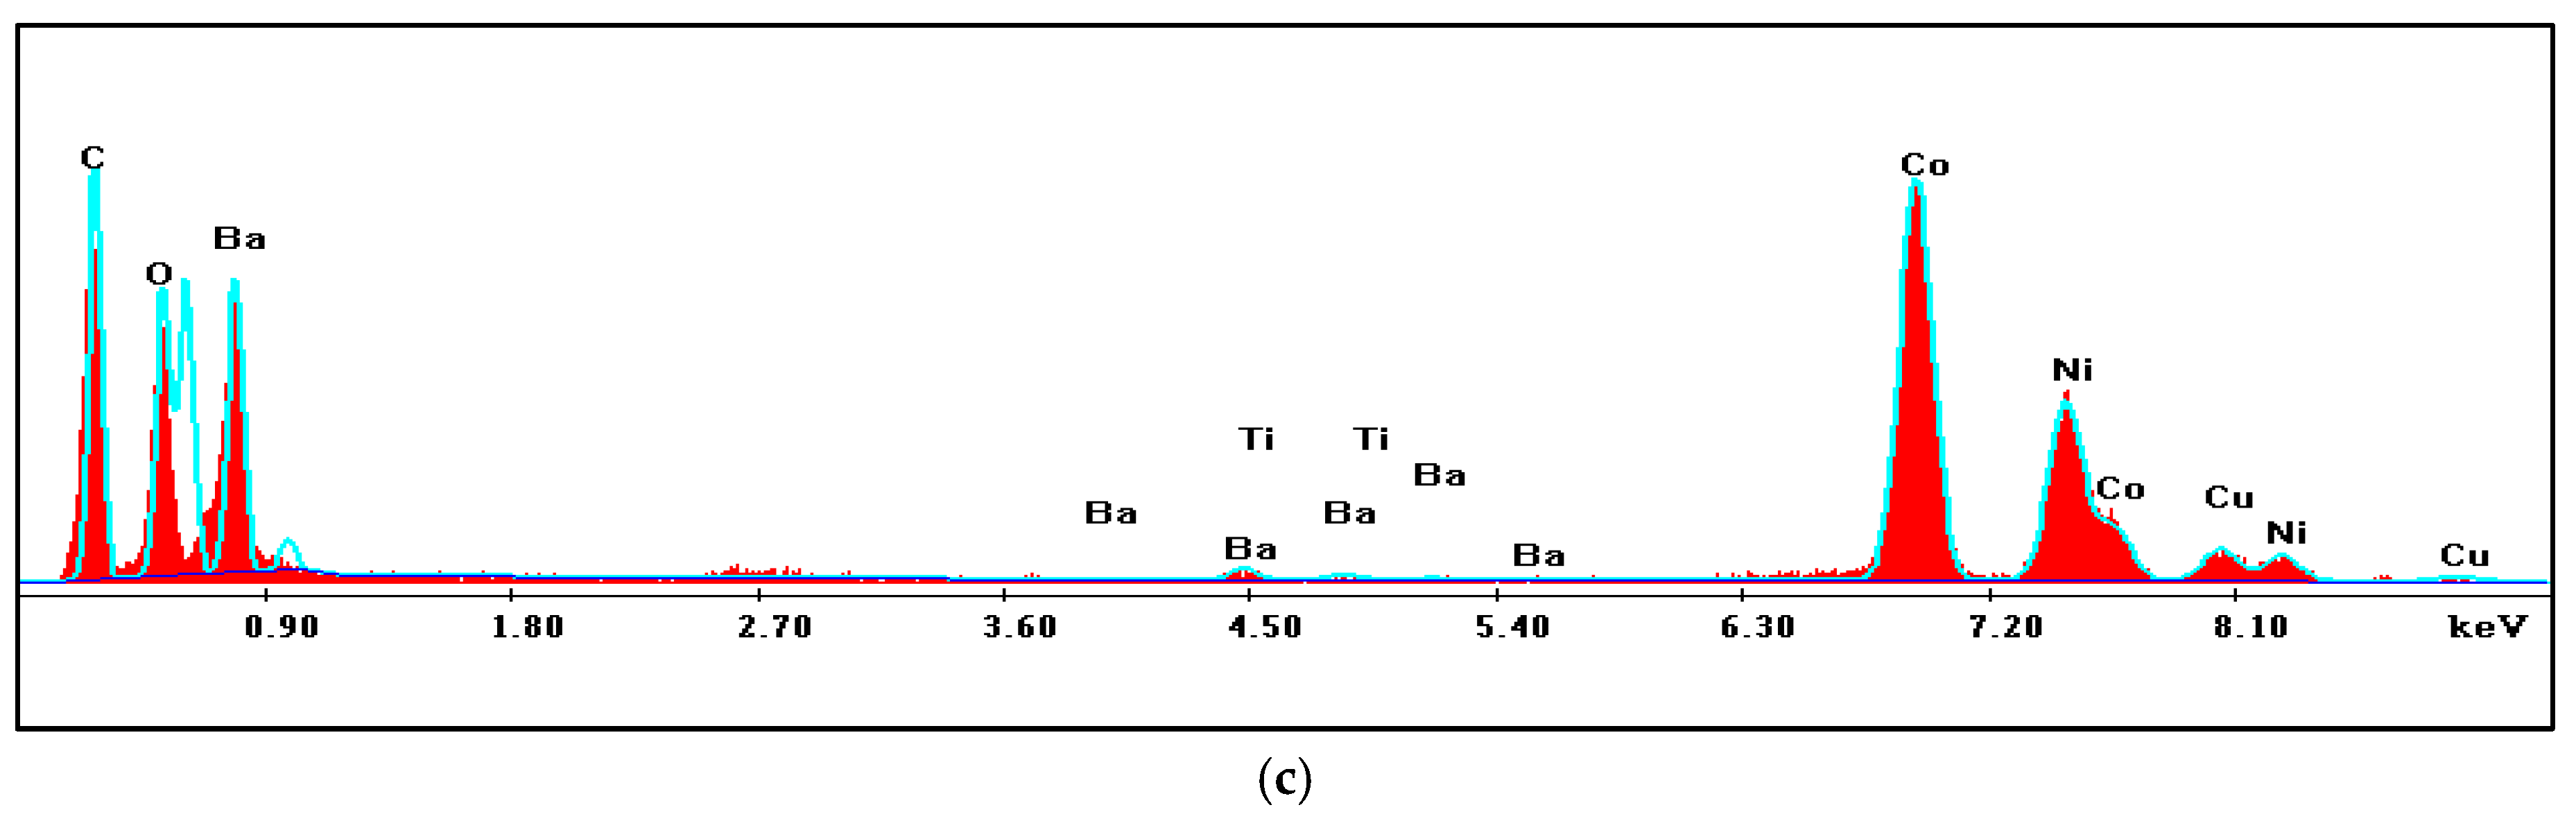
3.1.4. TEM and EDX
- Figure S5a,b show TEM images for pure BT powder, which were composed of irregular cubic-shaped solids with interplanar spacing dhkl equal to 0.32 nm and a size range between 30 and 114 nm, appearing as several micron-sized solids. Additionally, the highly crystalline surface textures and lack of agglomeration, along with the grain’s tendency to grow uniformly, are visible.
- Figure S5c,d depicts TEM images of the Ba0.8Co0.2TiO3 nano-compound, which had clearly defined quasi-cubic forms, sharp grain boundaries, and little agglomeration. The d-spacing was approximately 0.24 nm.
- Figure S5e,f show TEM images of the Ba0.6Co0.4TiO3 sample, where a secondary spherical shape with a size range between 34.41 nm and 54.10 nm emerges into the lattice and is attributed to an intermediate produced phase in agreement with the results of Rietveld analysis. Additionally, we can clearly see a hexagonal shape, attributable to phase transition of the P63/mmc space group.
- Figure S5g,h displays TEM images of Ba0.2Co0.8TiO3 with a range of sizes between 78.63 nm and 99.79 nm and a high-resolution treatment under 5 nm of scale; the d-spacing was measured for being 0.14 nm.
- The CoTiO3 single phase (full cobalt substitution rate) TEM images in Figure S5i,l have the fewest spherical-shaped agglomerations. The average particle size of the CT nanoparticles ranged from 36 to 93 nm, with a constrained size distribution.
3.2. Optical Studies
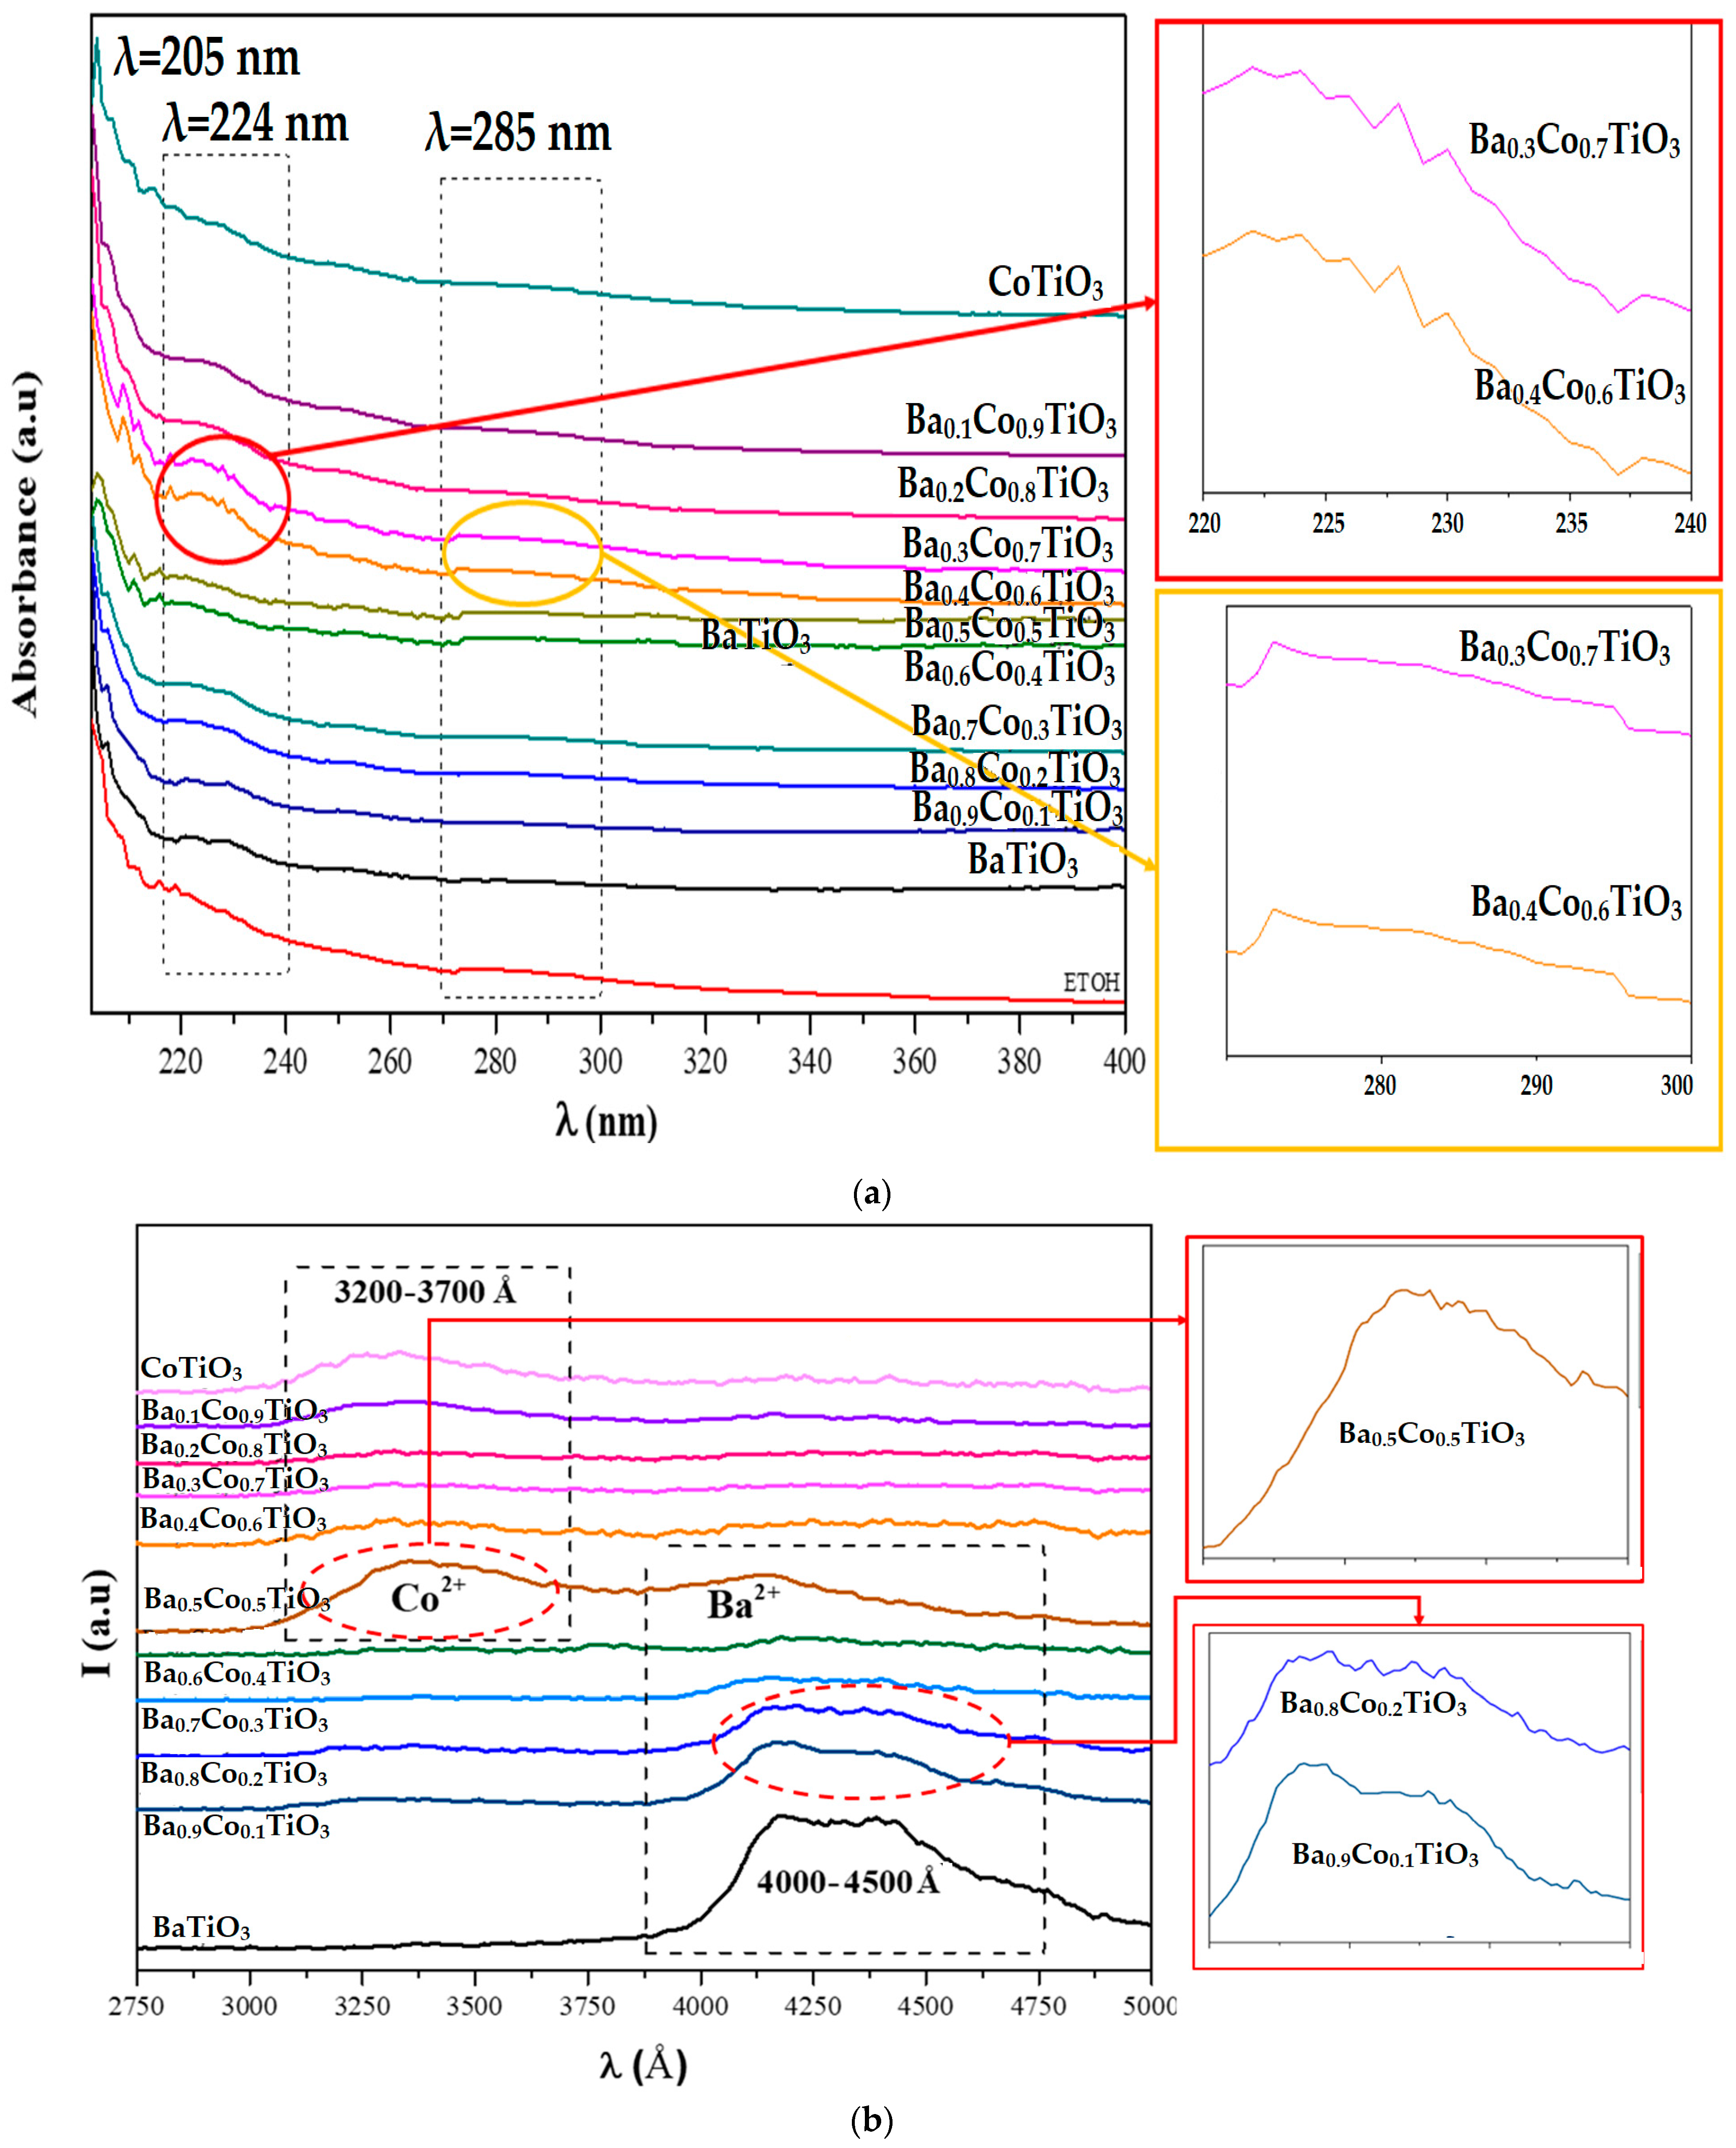
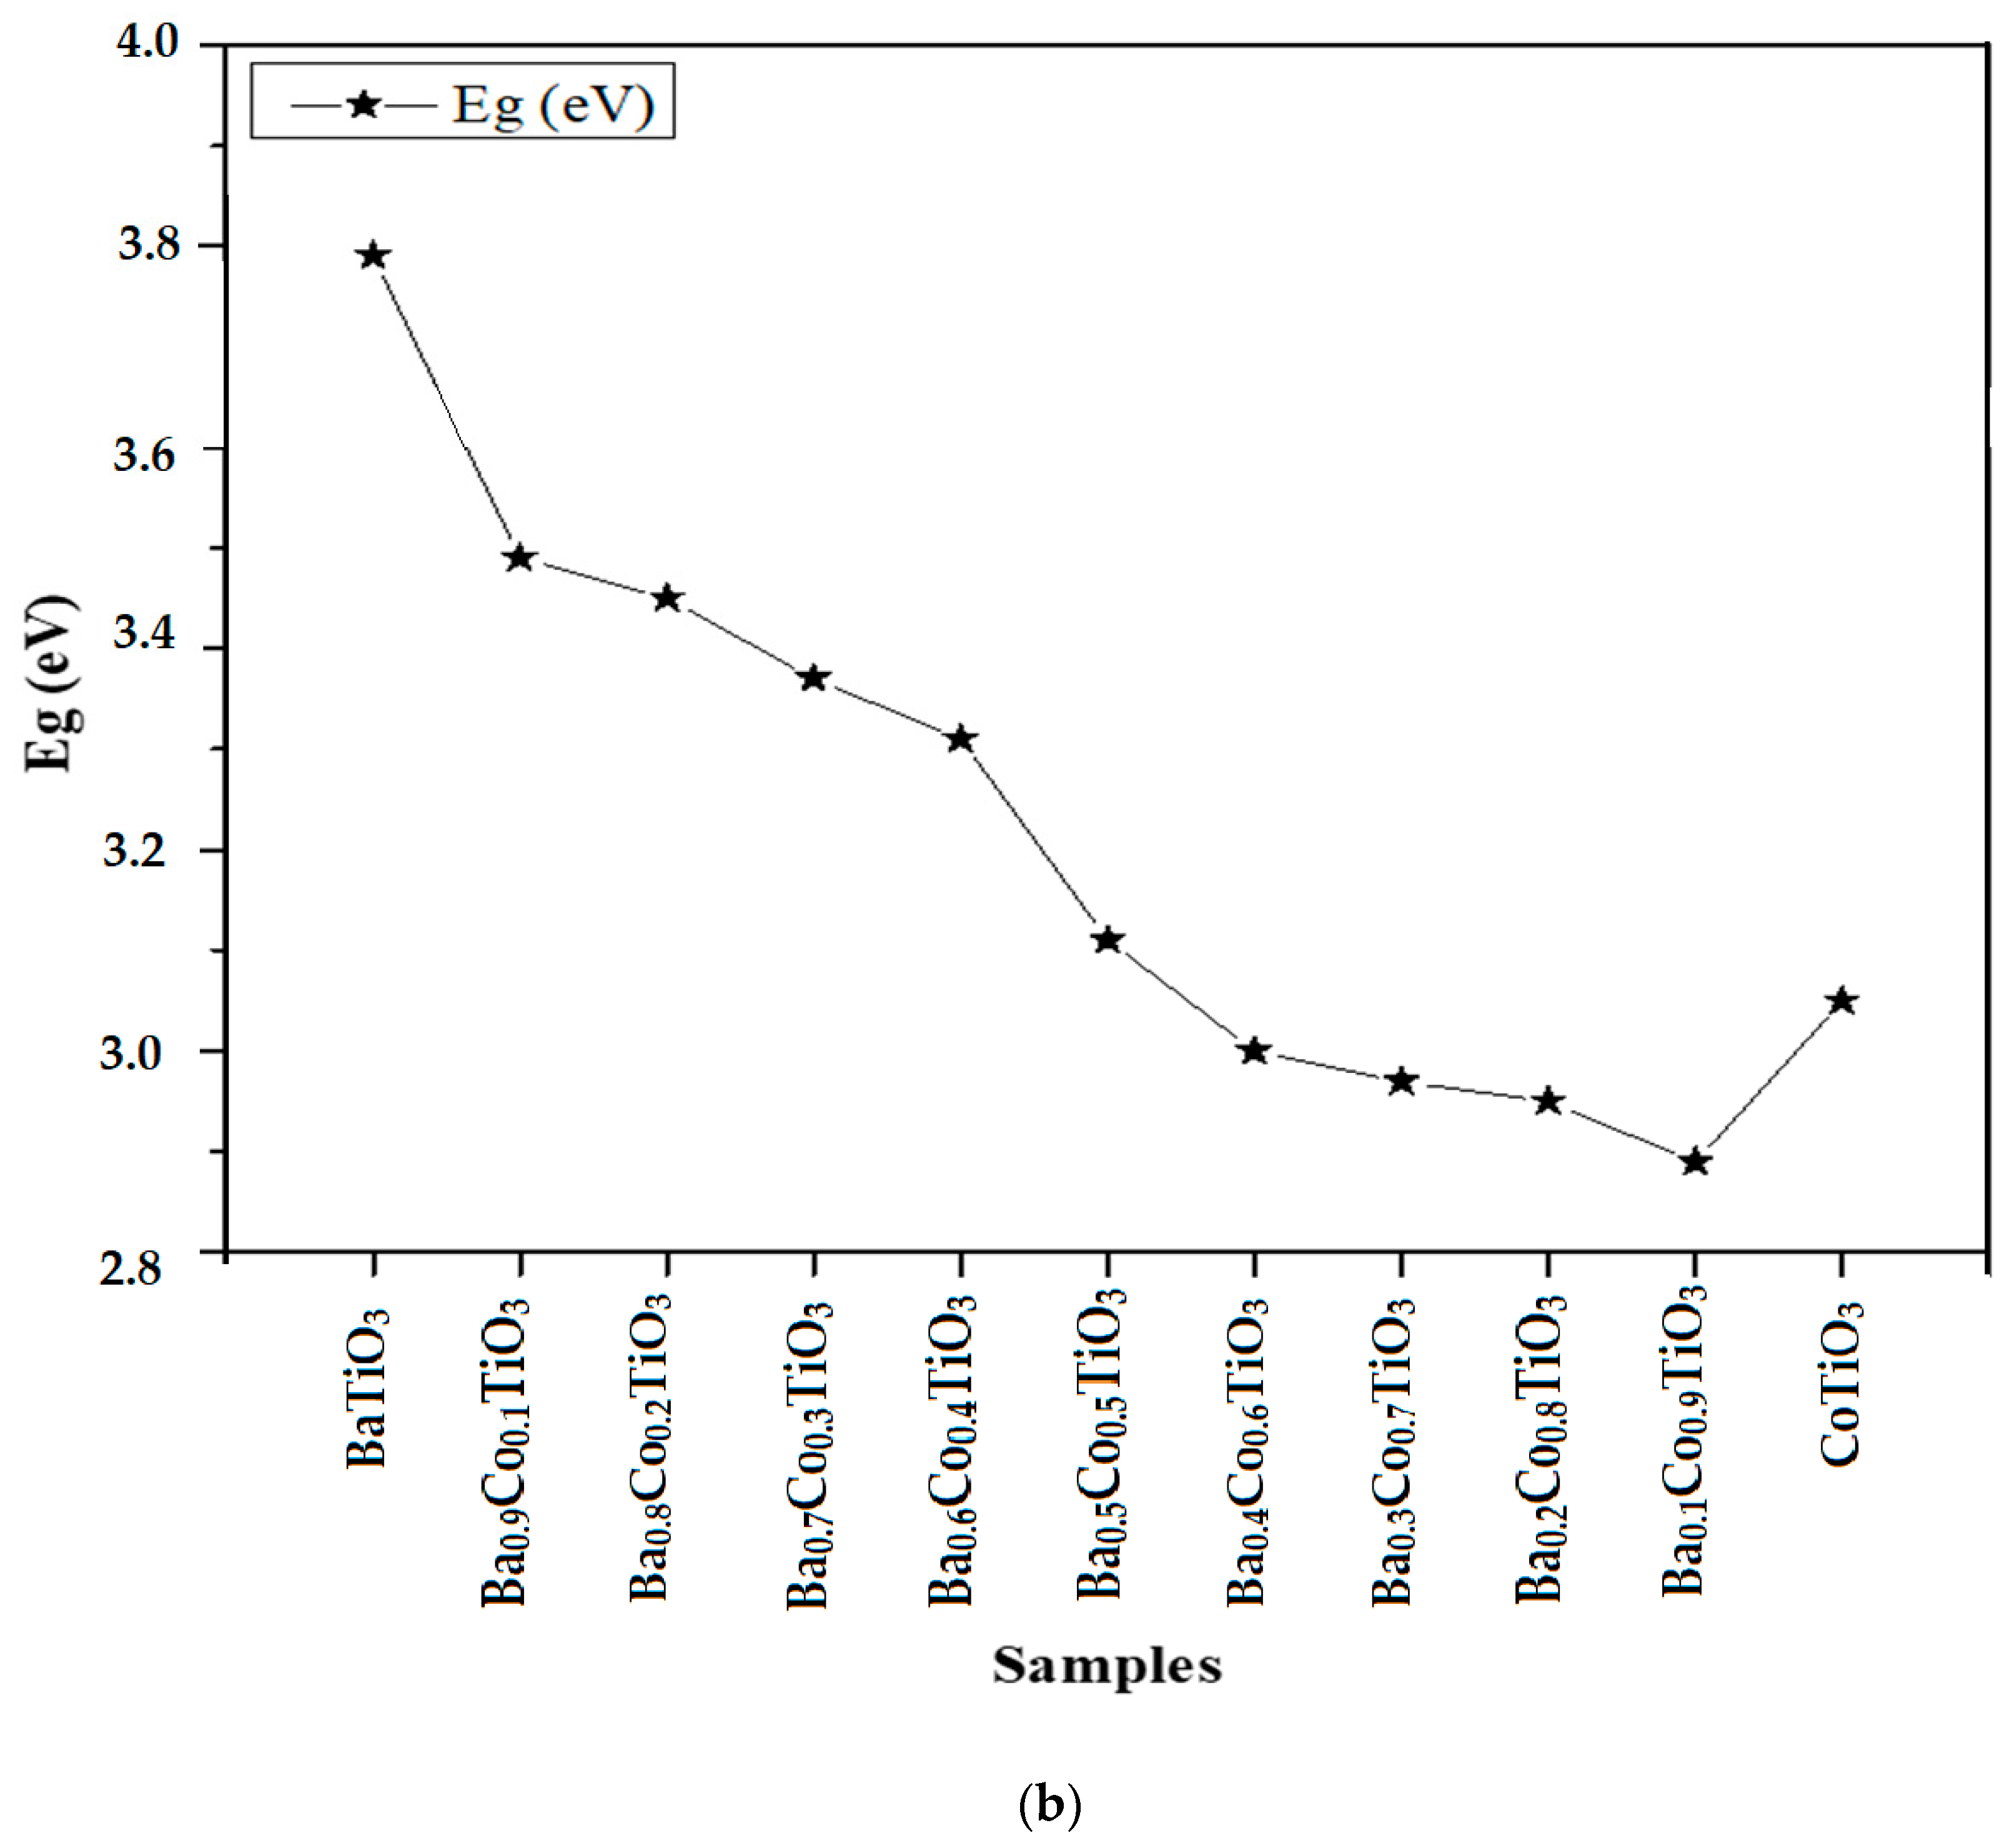
3.2.1. UV-Visible
3.2.2. PL
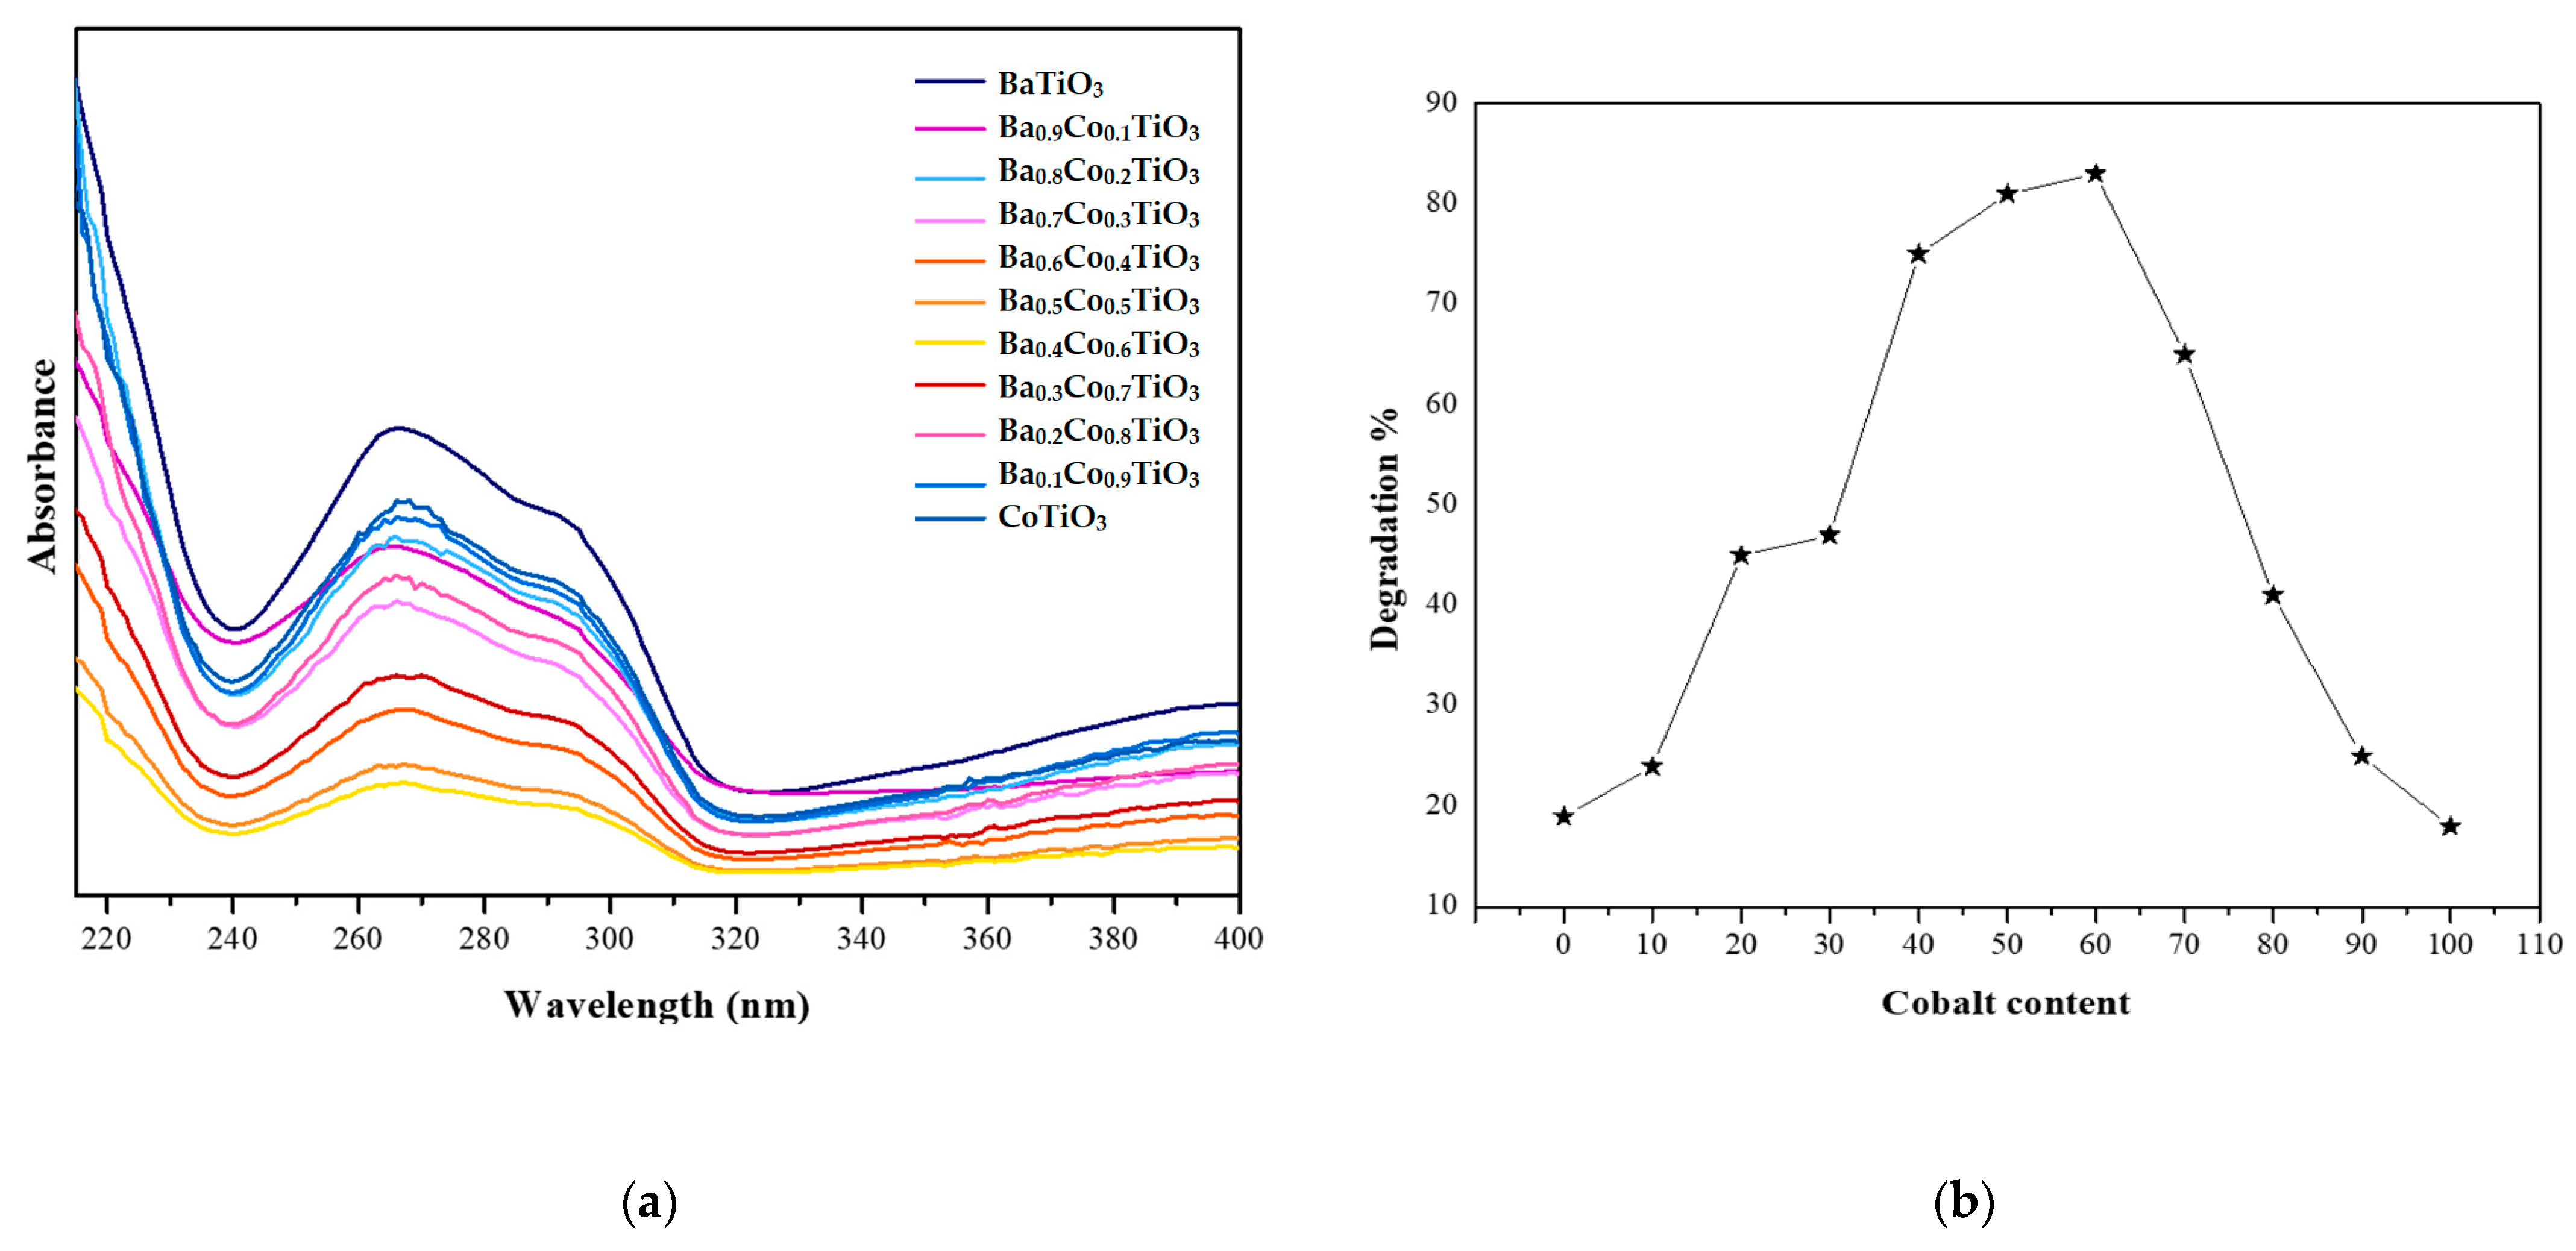
3.3. Photocatalytic Application
- χ(Ba) = 2.675 eV, χ(Co) = 4.27 eV, χ(Ti) = 3.455 eV, and χ(O) = 7.54 eV.
- E° = 4.5 eV.
4. Conclusions
Supplementary Materials
Author Contributions
Funding
Data Availability Statement
Acknowledgments
Conflicts of Interest
References
- Raj, S.; Singh, H.; Bhattacharya, J. Treatment of textile industry wastewater based on coagulation-flocculation aided sedimentation followed by adsorption: Process studies in an industrial ecology concept. Sci. Total Environ. 2023, 857, 159464. [Google Scholar] [CrossRef] [PubMed]
- Araña, J.; Herrera Melián, J.A.; Doña Rodríguez, J.M.; González Díaz, O.; Viera, A.; Pérez Peña, J.; Marrero Sosa, P.M.; Espino Jiménez, V. TiO2-photocatalysis as a tertiary treatment of naturally treated wastewater. Catal. Today 2002, 76, 279–289. [Google Scholar] [CrossRef]
- Coker, E.N.; Lujan-Flores, X.; Donaldson, B.; Yilmaz, N.; Atmanli, A. An Assessment of the Conversion of Biomass and Industrial Waste Products to Activated Carbon. Energies 2023, 16, 1606. [Google Scholar] [CrossRef]
- Abdellatief, M.; AL-Tam, S.M.; Elemam, W.E.; Alanazi, H.; Elgendy, G.M.; Tahwia, A.M. Development of ultra-high-performance concrete with low environmental impact integrated with metakaolin and industrial wastes. Case Stud. Constr. Mater. 2023, 18, e01724. [Google Scholar] [CrossRef]
- Hull, M.S.; Kennedy, A.J.; Steevens, J.A.; Bednar, A.J.; Weiss, C.A., Jr.; Vikesland, P.J. Release of Metal Impurities from Carbon Nanomaterials Influences Aquatic Toxicity. Environ. Sci. Technol. 2009, 43, 4169–4174. [Google Scholar] [CrossRef]
- Yaseen, D.A.; Scholz, M. Textile dye wastewater characteristics and constituents of synthetic effluents: A critical review. Int. J. Environ. Sci. Technol. 2019, 16, 1193–1226. [Google Scholar] [CrossRef]
- Katheresan, V.; Kansedo, J.; Lau, S.Y. Efficiency of various recent wastewater dye removal methods: A review. J. Environ. Chem. Eng. 2018, 6, 4676–4697. [Google Scholar] [CrossRef]
- Lada, Z.G.; Mathioudakis, G.N.; Pavlidou, S.; Goulas, G.; Anastasopoulos, C.; Bokias, G.; Voyiatzis, G.A. Comparative Assessment of the Dyeing Process for Pristine and Modified Cotton Fabrics towards the Reduction of the Environmental Fingerprint. Sustainability 2023, 15, 3144. [Google Scholar] [CrossRef]
- Aye, T.; Anderson, W.A.; Mehrvar, M. Photocatalytic Treatment of Cibacron Brilliant Yellow 3G-P (Reactive Yellow 2 Textile Dye). J. Environ. Sci. Health Part A 2003, 38, 1903–1914. [Google Scholar] [CrossRef]
- Saini, R.D. Textile Organic Dyes: Polluting effects and Elimination Methods from Textile Waste Water. Inter. J. Chem. Eng. Res. 2017, 9, 121–136. [Google Scholar]
- O’Shea, K.E.; Dionysiou, D.D. Advanced Oxidation Processes for Water Treatment. J. Phys. Chem. Lett. 2012, 15, 2112–2113. [Google Scholar] [CrossRef]
- Isopencu, G.O.; Mocanu, A.; Deleanu, I.-M. A Brief Review of Photocatalytic Reactors Used for Persistent Pesticides Degradation. ChemEngineering 2022, 6, 89. [Google Scholar] [CrossRef]
- Nora, S.; Diallo, M.S. Nanomaterials and Water Purification: Opportunities and Challenges. J. Nanoparticle Res. 2005, 7, 331–342. [Google Scholar] [CrossRef]
- Huang, R.; Han, J.W. Improved Catalytic Activity of the High-Temperature Water Gas Shift Reaction on Metal-Exsolved La0. 9Ni0. 05Fe0. 95O3 by Controlling Reduction Time. ChemEngineering 2021, 5, 28. [Google Scholar] [CrossRef]
- Bano, K.; Kaushal, S.; Singh, P.P. A review on photocatalytic degradation of hazardous pesticides using heterojunctions. Polyhedron 2021, 209, 115465. [Google Scholar] [CrossRef]
- Sun, B.; Zhou, G.; Sun, L.; Zhao, H.; Chen, Y.; Yang, F.; Song, Q. ABO 3 multiferroic perovskite materials for memristive memory and neuromorphic computing. Nanoscale Horiz. 2021, 6, 939–970. [Google Scholar] [CrossRef]
- Kovalenko, M.V.; Protesescu, L.; Bodnarchuk, M.I. Properties and potential optoelectronic applications of lead halide perovskite nanocrystals. Science 2017, 750, 745–750. [Google Scholar] [CrossRef]
- Fu, P.; Shan, Q.; Shang, Y.; Song, J.; Zeng, H.; Ning, Z.; Gong, J. Perovskite nanocrystals: Synthesis, properties and applications. Sci. Bull. 2017, 62, 369–380. [Google Scholar] [CrossRef] [PubMed]
- Lemziouka, H.; Nekkach, F.; Boutahar, A.; Moubah, R.; Omari, L.H.; Filali, M.; El Yazidi, M. Effect of Cobalt Doping on the Structural, Linear, and Nonlinear Optical Properties in Ba1−xCox TiO3 Perovskites. J. Electron. Mater. 2023, 52, 3420–3430. [Google Scholar] [CrossRef]
- Plyushch, A.; Macutkevič, J.; Sokal, A.; Lapko, K.; Kudlash, A.; Adamchuk, D.; Ksenevich, V.; Bychanok, D.; Selskis, A.; Kuzhir, P.; et al. The Phosphate-Based Composite Materials Filled with Nano-Sized BaTiO3 and Fe3O4: Toward the Unfired Multiferroic Materials. Materials 2021, 14, 133. [Google Scholar] [CrossRef]
- Peraza, J.; Bocanegra, E.H.; Tello, M.J.; Fernandez, J. Thermal properties of BaTiO3 crystals doped with cobalt. Mater. Res. Bull. 1976, 11, 981–984. [Google Scholar] [CrossRef]
- Yu, S.W.; Yeh, W.C.V.; Jou, J.L.; Lei, C.M. Synthesis and characterization the dielectric properties of cobalt doping hexagonal BaTiO3. Ferroelectrics 2013, 456, 31–37. [Google Scholar] [CrossRef]
- Fernandez, J.F.; Duran, P.; Moure, C. Microstructure and dielectric properties of BaTiO3 doped with niobium and cobalt. Ferroelectrics 1992, 127, 53–58. [Google Scholar] [CrossRef]
- Bujakiewicz-Koronska, R.; Gondek, Ł.; Vasylechko, L.; Balanda, M.; Juszynska-Galazka, E.; Galazka, M.; Nakazawa, Y. Magnetoelectric, spectroscopic, optical and elastic properties of Co-doped BaTiO3 ceramics. J. Alloy. Compd. 2023, 946, 169344. [Google Scholar] [CrossRef]
- Bujakiewicz-Koronska, R.; Vasylechko, L.; Markiewicz, E.; Nalecz, D.M.; Kalvane, A. X-ray and dielectric characterization of Co doped tetragonal BaTiO3 ceramics. Phase Transit. 2017, 90, 78–85. [Google Scholar] [CrossRef]
- Zhuravlev, V.A.; Minin, R.V.; Itin, V.I. Multiferrroics of (1–x) BaFe12O19–xBaTiO3 and (1–x) CoFe2O4–xPb (Zr0.53Ti0.47) O3 Compositions with a Template Structure. Russ. Phy. J. 2023, 65, 2170–2181. [Google Scholar] [CrossRef]
- Etier, M.; Gao, Y.; Shvartsman, V.V.; Elsukova, A.; Landers, J.; Wende, H.; Lupascu, D.C. Cobalt ferrite/barium titanate core/shell nanoparticles. Ferroelectrics 2012, 438, 115–122. [Google Scholar] [CrossRef]
- Rani, A.; Kolte, J.; Gopalan, P. Effect of Cobalt substitution on the structural, electrical and magnetic properties of BaTiO3 ceramics. In Proceedings of the Joint IEEE International Symposium on the Applications of Ferroelectric (ISAF), International Symposium on Integrated Functionalities (ISIF), and Piezoelectric Force Microscopy Workshop (PFM), Singapore, 24–27 May 2015. [Google Scholar] [CrossRef]
- Tihtih, M.; Sevostianova, I.N.; Kurovics, E.; Sablina, T.Y.; Kulkov, S.N.; Gömze, L.A. Examination of the influence of cobalt substitution on the properties of barium titanate ceramics. Epitoanyag-J. Silic. Based Compos. Mater. 2021, 73, 160–165. [Google Scholar] [CrossRef]
- Ul, R.; Marchet, P.; Pham-Thi, M.; Tran-Huu-Hue, L.P. Improved properties of doped BaTiO3 piezoelectric ceramics. Phy. Status Solidi 2019, 216, 1900413. [Google Scholar] [CrossRef]
- Yang, L.; Qiu, H.; Pan, L.; Guo, Z.; Xu, M.; Yin, J.; Zhao, X. Magnetic properties of BaTiO3 and BaTi1−xMxO3 (M = Co, Fe) nanocrystals by hydrothermal method. J. Magn. Magn. Mater. 2014, 350, 1–5. [Google Scholar] [CrossRef]
- Osoro, G.M.; Bregiroux, D.; Thi, M.P.; Levassort, F. Structural and piezoelectric properties evolution induced by cobalt doping and cobalt/niobium co-doping in BaTiO3. Mater. Lett. 2016, 166, 259–262. [Google Scholar] [CrossRef]
- Yang, Y.; Hao, H.; Zhang, L.; Chen, C.; Luo, Z.; Liu, Z.; Liu, H. Structure, electrical and dielectric properties of Ca substituted BaTiO3 ceramics. Ceram. Int. 2018, 44, 11109–11115. [Google Scholar] [CrossRef]
- Maikhuri, N.; Panwar, A.K.; Jha, A.K. Investigation of A-and B-site Fe substituted BaTiO3 ceramics. J. Appl. Phys. 2013, 113, 17D915. [Google Scholar] [CrossRef]
- Kishi, H.; Kohzu, N.; Iguchi, Y.; Sugino, J.; Kato, M.; Ohsato, H.; Okuda, T. Occupational sites and dielectric properties of rare-earth and Mn substituted BaTiO3. J. Eur. Ceram. Soc. 2001, 21, 1643–1647. [Google Scholar] [CrossRef]
- Verma, K.C.; Kotnala, R.K. Multiferroic approach for Cr, Mn, Fe, Co, Ni, Cu substituted BaTiO3 nanoparticles. Mater. Res. Express 2016, 3, 055006. [Google Scholar] [CrossRef]
- Tihtih, M.; Ibrahim, J.E.F.; Basyooni, M.A.; Kurovics, E.; Belaid, W.; Hussainova, I.; Kocserha, I. Role of A-site (Sr), B-site (Y), and A, B sites (Sr, Y) substitution in lead-free BaTiO3 ceramic compounds: Structural, optical, microstructure, mechanical, and thermal conductivity properties. Ceram. Int. 2023, 49, 1947–1959. [Google Scholar] [CrossRef]
- Kullmer, R. Dielectric and ferroelectric properties of pulsed-laser deposited BaTiO3 films. Appl. Phys. A 1997, 65, 273–279. [Google Scholar] [CrossRef]
- Zhu, J.; Li, H.; Zhong, L.; Xiao, P.; Xu, X.; Yang, X.; Zhao, Z.; Li, J. Perovskite oxides: Preparation, characterizations, and applications in heterogeneous catalysis. ACS Catal. 2014, 4, 2917–2940. [Google Scholar] [CrossRef]
- Peña, M.A.; Fierro, J.L.G. Chemical structures and performance of perovskite oxides. Chem. Rev. 2001, 101, 1981–2017. [Google Scholar] [CrossRef]
- Zhang, S.; Chen, D.; Liu, Z.; Ruan, M.; Guo, Z. Novel strategy for efficient water splitting through pyro-electric and pyro-photo-electric catalysis of BaTiO3 by using thermal resource and solar energy. Appl. Catal. B Environ. 2021, 284, 119686. [Google Scholar] [CrossRef]
- Pattanayak, P.; Singh, P.; Bansal, N.K.; Paul, M.; Dixit, H.; Porwal, S.; Mishra, S.; Singh, T. Recent progress in perovskite transition metal oxide-based photocatalyst and photoelectrode materials for solar-driven water splitting. J. Environ. Chem. Eng. 2022, 10, 108429. [Google Scholar] [CrossRef]
- Zhang, M.; Jeerh, G.; Zou, P.; Lan, R.; Wang, M.; Wang, H.; Tao, S. Recent development of perovskite oxide-based electrocatalysts and their applications in low to intermediate temperature electrochemical devices. Mater. Today 2021, 49, 351–377. [Google Scholar] [CrossRef]
- Shen, H.; Xia, K.; Wang, P. The electronic, structural, ferroelectric and optical properties of strontium and zirconium co-doped BaTiO3. Solid State Commun. 2022, 355, 114930. [Google Scholar] [CrossRef]
- You, H.; Li, S.; Fan, Y.; Guo, X.; Lin, Z.; Ding, R.; Cheng, X.; Zhang, H.; Lo, T.W.B.; Hao, J.; et al. Accelerated pyro-catalytic hydrogen production enabled by plasmonic local heating of Au on pyroelectric BaTiO3 nanoparticles. Nat. Commun. 2022, 13, 6144. [Google Scholar] [CrossRef]
- Noh, B.I.; Yang, S.C. Ferromagnetic, ferroelectric, and magnetoelectric properties in individual nanotube-based magnetoelectric films of CoFe2O4/BaTiO3 using electrically resistive core-shell magnetostrictive nanoparticles. J. Alloy. Compd. 2022, 891, 161861. [Google Scholar] [CrossRef]
- Hossain, S.; Hossain, S. Magnetic and Optical Characterization of Cobalt Ferrite–Barium Titanate Core–Shell for Biomedical Applications. IEEE Trans. Magn. 2021, 58, 1–8. [Google Scholar] [CrossRef]
- Sunarso, J.; Hashim, S.S.; Zhu, N.; Zhou, W. Perovskite oxides applications in high temperature oxygen separation, solid oxide fuel cell and membrane reactor: A review. Prog. Energy Combust. Sci. 2017, 61, 57–77. [Google Scholar] [CrossRef]
- Ertuğ, B. The overview of the electrical properties of barium titanate. Am. J. Eng. Res. 2013, 2, 1–7. [Google Scholar]
- Duong, N.X.; Bae, J.S.; Jeon, J.; Lim, S.Y.; Oh, S.H.; Ullah, A.; Kim, T.H. Polymorphic phase transition in BaTiO3 by Ni doping. Ceram. Int. 2019, 45, 16305–16310. [Google Scholar] [CrossRef]
- Shuai, Y.; Zhou, S.; Bürger, D.; Reuther, H.; Skorupa, I.; John, V.; Schmidt, H. Decisive role of oxygen vacancy in ferroelectric versus ferromagnetic Mn-doped BaTiO3 thin films. J. Appl. Phys. 2011, 109, 084105. [Google Scholar] [CrossRef]
- Guo, Z.; Pan, L.; Bi, C.; Qiu, H.; Zhao, X.; Yang, L.; Rafique, M.Y. Structural and multiferroic properties of Fe-doped Ba0.5Sr0.5TiO3 solids. J. Magn. Magn. Mater. 2013, 325, 24–28. [Google Scholar] [CrossRef]
- Chen, J.; Deng, H.; Pan, Y.; Zheng, D.; Sun, L.; Tao, J.; Chu, J. Band gap modulation and improved magnetism of double perovskite Sr2KMoO6 (K = Fe, Co, Ni, Mn) doped BaTiO3 ceramics. Ceram. Int. 2022, 48, 7629–7635. [Google Scholar] [CrossRef]
- Feng, M.; Wang, J.; Hu, J.-M.; Wang, J.; Ma, J.; Li, H.-B.; Shen, Y.; Lin, Y.-H.; Chen, L.-Q.; Nan, C.-W. Optimizing direct magnetoelectric coupling in Pb(Zr,Ti)O3/Ni multiferroic film heterostructures. Appl. Phys. Lett. 2015, 106, 72901. [Google Scholar] [CrossRef]
- Jayanthi, S.; Kutty, T.R.N. Dielectric properties of 3d transition metal substituted BaTiO3 ceramics containing the hexagonal phase formation. J. Mater. Sci. Mater. Electron. 2008, 19, 615–626. [Google Scholar] [CrossRef]
- Dawson, J.A.; Freeman, C.L.; Harding, J.H.; Sinclair, D.C. Phase stabilisation of hexagonal barium titanate doped with transition metals: A computational study. J. Solid State Chem. 2013, 200, 310–316. [Google Scholar] [CrossRef]
- Yadav, K.; Singh, M.P.; Razavi, F.S.; Varma, G.D. Effect of A-site cation size on magnetic and charge-ordering properties of Ln0.5Sr0.5Mn0.9Cu0.1O3 (Ln = La, Pr, Nd, or Ho). Mater. Sci. Eng. B 2012, 177, 1225–1231. [Google Scholar] [CrossRef]
- Taheri, M.; Maaref, S.; Kantzas, A.; Bryant, S.; Trudel, S. Improving the colloidal stability of PEGylated BaTiO3 nanoparticles with surfactants. Chem. Phys. 2023, 564, 111701. [Google Scholar] [CrossRef]
- Abdullah, H.; Abdullah, N.A.; Zulfakar, M.S.; Wan Jalal, W.N. Fabrication of Nanostructure Ba(1−x)Co(x) TiO3 thin Films Synthesized by Sol-Gel Method for Patch Antenna Application. In Developments in Strategic Materials and Computational Design V: A Collection of Papers, Proceedings of the 38th International Conference on Advanced Ceramics and Composites, Daytona Beach, FL, USA, 27–31 January 2014; John Wiley & Sons, Inc.: Hoboken, NJ, USA, 2014; Volume 35, pp. 189–199. [Google Scholar] [CrossRef]
- Mi, L.; Zhang, Q.; Wang, H.; Wu, Z.; Guo, Y.; Li, Y.; Qi, X. Synthesis of BaTiO3 nanoparticles by sol-gel assisted solid phase method and its formation mechanism and photocatalytic activity. Ceram. Int. 2020, 46, 10619–10633. [Google Scholar] [CrossRef]
- Pierre, A.C. Introduction to Sol-Gel Processing, 1st ed.; Springer Nature: Berlin/Heidelberg, Germany, 2020; pp. 1–700. [Google Scholar]
- Doebelin, N.; Kleeberg, R. Profex: A graphical user interface for the Rietveld refinement program BGMN. J. Appl. Crystallogr. 2015, 48, 1573–1580. [Google Scholar] [CrossRef]
- Schanze, K.S.; Kamat, P.V.; Yang, P.; Bisquert, J. Progress in perovskite photocatalysis. ACS Energy Lett. 2020, 5, 2602–2604. [Google Scholar] [CrossRef]
- Won, S.W.; Yun, Y.S. Biosorptive removal of Reactive Yellow 2 using waste biomass from lysine fermentation process. Dyes Pigments 2008, 76, 502–507. [Google Scholar] [CrossRef]
- Natarajan, S.; Bajaj, H.C.; Tayade, R.J. Recent advances based on the synergetic effect of adsorption for removal of dyes from waste water using photocatalytic process. J. Environ. Sci. 2018, 65, 201–222. [Google Scholar] [CrossRef]
- Sakkas, V.A.; Islam, M.A.; Stalikas, C.; Albanis, T.A. Photocatalytic degradation using design of experiments: A review and example of the Congo red degradation. J. Hazard. Mater. 2010, 175, 33–44. [Google Scholar] [CrossRef] [PubMed]
- Jia, Z.; Miao, J.; Lu, H.B.; Habibi, D.; Zhang, W.C.; Zhang, L.C. Photocatalytic degradation and absorption kinetics of cibacron brilliant yellow 3G-P by nanosized ZnO catalyst under simulated solar light. J. Taiwan Inst. Chem. Eng. 2016, 60, 267–274. [Google Scholar] [CrossRef]
- Alshamsi, H.A.; Hussein, B.S. Synthesis, characterization and photocatalysis of γ-Fe2O3 nanoparticles for degradation of Cibacron Brilliant Yellow 3G-P. Asian J. Chem. 2018, 30, 273–279. [Google Scholar] [CrossRef]
- Miao, J.; Zhang, R.; Zhang, L. Photocatalytic degradations of three dyes with different chemical structures using ball-milled TiO2. Mater. Res. Bull. 2018, 97, 109–114. [Google Scholar] [CrossRef]
- Ammar, S.H.; Elaibi, A.I.; Mohammed, I.S. Core/shell Fe3O4@ Al2O3-PMo magnetic nanocatalyst for photocatalytic degradation of organic pollutants in an internal loop airlift reactor. J. Water Process Eng. 2020, 37, 101240. [Google Scholar] [CrossRef]
- Alshamsi, H.A.H.; Hussein, B.S. Hydrothermal preparation of silver doping zinc oxide nanoparticles: Study the characterization and photocatalytic activity. Orient. J. Chem. 2018, 34, 1898. [Google Scholar] [CrossRef]
- Rovani, S.; Fernandes, A.N.; Prola, L.D.; Lima, E.C.; Santos, W.O.; Adebayo, M.A. Removal of Cibacron Brilliant Yellow 3G-P Dye from aqueous solutions by Brazilian peats as biosorbents. Chem. Eng. Commun. 2014, 201, 1431–1458. [Google Scholar] [CrossRef]
- Jia, Z.; Zhang, W.C.; Wang, W.M.; Habibi, D.; Zhang, L.C. Amorphous Fe78Si9B13 alloy: An efficient and reusable photo-enhanced Fenton-like catalyst in degradation of cibacron brilliant red 3B-A dye under UV–vis light. Appl. Catal. B Environ. 2016, 192, 46–56. [Google Scholar] [CrossRef]
- Vicas, C.S.; Namratha, K.; Nayan, M.B.; Byrappa, K. Controlled Hydrothermal Synthesis of Bismuth Vanadate Nano-articulate Structures: Photooxidation of Methicillin Resistant Staphylococcus aureus and Organic Dyes. Mater. Today Proc. 2019, 9, 468–480. [Google Scholar] [CrossRef]
- Radia, D.; Fouzia, T.; Rachida, R.; Wahib, N.M.; Bentahar, F. Photocatalysis process to treat polluted water by azo dye Cibacron Brilliant Yellow 3G-P. Water Sci. Technol. 2022, 86, 1774–1789. [Google Scholar] [CrossRef]
- Amaechi, I.C.; Youssef, A.H.; Kolhatkar, G.; Rawach, D.; Gomez-Yañez, C.; Claverie, J.P.; Ruediger, A. Ultrafast microwave-assisted hydrothermal synthesis and photocatalytic behaviour of ferroelectric Fe3+-doped BaTiO3 nanoparticles under simulated sunlight. Catal. Today 2021, 360, 90–98. [Google Scholar] [CrossRef]
- Senthilkumar, P.; Jency, D.A.; Kavinkumar, T.; Dhayanithi, D.; Dhanuskodi, S.; Umadevi, M.; Jothivenkatachalam, K. Built-in electric field assisted photocatalytic dye degradation and photoelectrochemical water splitting of ferroelectric Ce doped BaTiO3 nanoassemblies. ACS Sustain. Chem. Eng. 2019, 7, 12032–12043. [Google Scholar] [CrossRef]
- Srilakshmi, C.; Saraf, R.; Prashanth, V.; Rao, G.M.; Shivakumara, C. Structure and catalytic activity of Cr-doped BaTiO3 nanocatalysts synthesized by conventional oxalate and microwave assisted hydrothermal methods. Inorg. Chem. 2016, 55, 4795–4805. [Google Scholar] [CrossRef] [PubMed]
- Srilakshmi, C.; Rao, G.M.; Saraf, R. Effect of the nature of a transition metal dopant in BaTiO 3 perovskite on the catalytic reduction of nitrobenzene. RSC Adv. 2015, 5, 45965–45973. [Google Scholar] [CrossRef]
- Yang, B.; Chen, H.; Yang, Y.; Wang, L.; Bian, J.; Liu, Q.; Lou, X. Insights into the tribo-/pyro-catalysis using Sr-doped BaTiO3 ferroelectric nanocrystals for efficient water remediation. Chem. Eng. J. 2021, 416, 128986. [Google Scholar] [CrossRef]
- Alkathy, M.S.; Eiras, J.A.; Zabotto, F.L.; Raju, K.J. Structural, optical, dielectric, and multiferroic properties of sodium and nickel co-substituted barium titanate ceramics. J. Mater. Sci. Mater. Electron. 2021, 32, 12828–12840. [Google Scholar] [CrossRef]
- Liebermann, R.C. Elasticity of the ilmenite-perovskite phase transformation in CdTiO3. Earth Planet. Sci. Lett. 1976, 29, 326–332. [Google Scholar] [CrossRef]
- Navrotsky, A. Energetics and crystal chemical systematics among ilmenite, lithium niobate, and perovskite structures. Chem. Mater. 1998, 10, 2787–2793. [Google Scholar] [CrossRef]
- Susaki, J.I. CdGeO3-phase transformations at high pressure and temperature and structural refinement of the perovskite polymorph. Phys. Chem. Miner. 1989, 16, 634–641. [Google Scholar] [CrossRef]
- Kuroda, K.; Irifune, T.; Inoue, T.; Nishiyama, N.; Miyashita, M.; Funakoshi, K.; Utsumi, W. Determination of the phase boundary between ilmenite and perovskite in MgSiO 3 by in situ X-ray diffraction and quench experiments. Phys. Chem. Miner. 2000, 27, 523–532. [Google Scholar] [CrossRef]
- Yamazaki, D.; Ito, E.; Tange, Y.; Yoshino, T.; Zhai, S.; Fukui, H.; Funakoshi, K.I. Phase boundary between ilmenite and perovskite structures in MnGeO3 determined by in situ X-ray diffraction measurements. Phys. Chem. Miner. 2007, 34, 269–273. [Google Scholar] [CrossRef]
- Patterson, A.L. The Scherrer formula for X-ray particle size determination. Phys. Rev. 1939, 56, 978. [Google Scholar] [CrossRef]
- Bormanis, K.; Kalvane, A.; Burkhanov, A.I.; Eglite, L.; Dikov, R.V. Dielectric and acoustic properties of modified barium titanate ceramics. Ferroelectrics 2019, 538, 12–19. [Google Scholar] [CrossRef]
- Wang, S.; Tang, S.; Gao, H.; Chen, X.; Liu, H.; Yu, C.; Yang, H. Microstructure, optical, photoluminescence properties and the intrinsic mechanism of photoluminescence and photocatalysis for the BaTiO3, BaTiO3/TiO2 and BaTiO3/TiO2/CeO2 smart composites. Opt. Mater. 2021, 118, 111273. [Google Scholar] [CrossRef]
- Darwish, A.G.A.; Badr, Y.; El Shaarawy, M.; Shash, N.M.H.; Battisha, I. KInfluence of the Nd3+ ions content on the FTIR and the visible up-conversion luminescence properties of nano-structure BaTiO3, prepared by sol–gel technique. J. Alloy. Compd. 2010, 489, 451–455. [Google Scholar] [CrossRef]
- Baiju, K.G.; Nagarajan, A.; Marappa Gounder Sadasivam, A.; Sukumar Rajan, D.D.; Sri Sai Vignathi, K.; Balu, M.; Kumaresan, D. Hydrothermal synthesis, dielectric properties of barium titanate, cobalt doped barium titanate, and their graphene nanoplatelet composites. Asia-Pac. J. Chem. Eng. 2020, 15, e2550. [Google Scholar] [CrossRef]
- Myrick, M.L.; Simcock, M.N.; Baranowski, M.; Brooke, H.; Morgan, S.L.; McCutcheon, J.N. The Kubelka-Munk diffuse reflectance formula revisited. Appl. Spectrosc. Rev. 2011, 46, 140–165. [Google Scholar] [CrossRef]
- Makuła, P.; Pacia, M.; Macyk, W. How to correctly determine the band gap energy of modified semiconductor photocatalysts based on UV–Vis spectra. J. Phys. Chem. Lett. 2018, 9, 6814–6817. [Google Scholar] [CrossRef]
- Cardona, M. Optical properties and band structure of SrTiO3 and BaTiO3. Phy. Rev. 1965, 140, A651–A655. [Google Scholar] [CrossRef]
- Shihab, N.K. Cavity enhancement in nonlinear absorption and photoluminescence of BaTiO3. Optik 2020, 207, 163896. [Google Scholar] [CrossRef]
- Hasan, M.; Hossain, A.A. Structural, electronic and optical properties of strontium and nickel co-doped BaTiO3: A DFT based study. Comput. Condens. Matter 2021, 28, e00578. [Google Scholar] [CrossRef]
- Dudnikov, V.A.; Orlov, Y.S.; Gavrilkin, S.Y.; Gorev, M.V.; Vereshchagin, S.N.; Solovyov, L.A.; Ovchinnikov, S.G. Effect of Gd and Sr ordering in A sites of doped Gd0.2Sr0.8CoO3−δ perovskite on its structural, magnetic, and thermodynamic properties. J. Phys. Chem. C 2016, 120, 13443–13449. [Google Scholar] [CrossRef]
- Sabyasachi, S.; Majumdar, S.; Giri, S. Field induced phase transition in Sm 0.5 (Ca1−xSrx)0.5 MnO3. AIP Conf. Proc. 2014, 1591, 1539–1540. [Google Scholar] [CrossRef]
- Tong, P.; Yu, J.; Huang, Q.; Yamada, K.; Louca, D. Possible Link of a Structurally Driven Spin Flip Transition and the Insulator-Metal Transition in the Perovskite La1−xBax CoO3. Phys. Rev. Lett. 2011, 106, 156407. [Google Scholar] [CrossRef] [PubMed]
- Naresh, G.; Malik, J.; Meena, V.; Mandal, T.K. pH-mediated collective and selective solar photocatalysis by a series of layered Aurivillius perovskites. ACS Omega 2018, 3, 11104–11116. [Google Scholar] [CrossRef]


| Catalysts | Irradiation Source | Rate (%) | Time (min) | References |
|---|---|---|---|---|
| Nanosized ZnO | Simulated solar light | 98 | 60 | [67] |
| ɣ-Fe2O3 | Visible light | 68 | 120 | [68] |
| Ball milled TiO2 | UV-Visible | 78.1 | 120 | [69] |
| Core/Shell Fe3O4@Al2O3-PMo | UV light | >90 | 300 | [70] |
| Degussa P25 | UV-A | 71.3 | 111 | [43] |
| Ag-ZnO | Visible light | 65 | 120 | [71] |
| Brazilian peats (DP) and (FP) | UV-Visible | 95.56 | 270 | [72] |
| Amourphous Fe78Si9B13 and Fe73.5Si13.5B9Cu1Nb3 | Visible light | 100 70 | 5 20 | [73] |
| Nano-articulate crystals | Sun light | 94 | 180 | [74] |
| TiO2 semi-conductor | UV-Visible | 95 | 120 | [75] |
| BaTiO3 Doped Materials | Dye | Irradiation Source | Degradation Rate (%) | Time (min) | References |
|---|---|---|---|---|---|
| Fe3+-doped BT | Methyl orange (MO) | Sun light | 70 | 90 | [76] |
| Ce-doped BT | Methylene blue (MB) Methylene violet (MV) (CR) | UV-Vsible | 90.2 82.4 78.5 | 120 | [77] |
| Cr-doped BT | Nitrobenzene Aniline yield | Microwave | 99.9 99.7 | 180 180 | [78] |
| Fe-, Co-, Ni-doped BT | Azoxybenzene Nitrobenzene | * | 93, 84 (Fe) 91, 80 (Ni) 100, 93(Co) | * | [79] |
| Sr-doped BT | Rhodamine B (RhB) | Dark condition | 98 | * | [80] |
| Compound | Position (°2θ) | dhkl (nm) | Crystallite Size (nm) | Crystal System | Identification Reference |
|---|---|---|---|---|---|
| BaTiO3 | 31.49 | 0.284 | 114 | Tetragonal | 01-075-2121 |
| Ba0.9Co0.1TiO3 | 31.52 | 0.283 | 97 | Tetragonal | 01-079-2264 |
| Ba0.8Co0.2TiO3 | 31.58 | 0.283 | 94 | Tetragonal | 01-079-2265 |
| Ba0.7Co0.3TiO3 | 31.43 | 0.284 | 9388 | Hexagonal | 00-008-0372 |
| Ba0.6Co0.4TiO3 | 31.47 | 0.284 | 87,119 | Hexagonal | 00-051-1873 |
| Ba0.5Co0.5TiO3 | 31.46 | 0.284 | 104 | Hexagonal | 00-051-1873 |
| Ba0.4Co0.6TiO3 | 31.52 | 0.283 | 10,496 | Hexagonal | 00-051-1873 |
| Ba0.3Co0.7TiO3 | 25.27 | 0.352 | 66,137 | Hexagonal | 00-051-1873 |
| Ba0.2Co0.8TiO3 | 25.27 | 0.352 | 69,118 | Rhombohedral | 00-001-1040 |
| Ba0.1Co0.9TiO3 | 25.24 | 0.352 | 78,134 | Rhombohedral | 01-077-0153 |
| CoTiO3 | 32.79 | 0.273 | 56 | Rhombohedral | 01-077-1373 |
| Compound Bax Co1−x TiO3 x = {0, …, 1} | Unit Cell | Reliability Factors | Space Group | |||||||
|---|---|---|---|---|---|---|---|---|---|---|
| a (Å) | b (Å) | c (Å) | α (°) | β (°) | ɣ (°) | RP | RWP | GoF | ||
| BaTiO3 | 3.9886 | 3.9886 | 4.00060 | 90.00 | 90.00 | 90.00 | 5.57 | 06.99 | 1.25 | P4mm |
| Ba0.9 Co0.1TiO3 | 3.9980 | 3.9980 | 4.01800 | 90.00 | 90.00 | 90.00 | 5.62 | 11.11 | 1,97 | P4mm |
| Ba0.8Co0.2TiO3 | 3.9980 | 3.9980 | 4.02200 | 90.00 | 90.00 | 90.00 | 5.29 | 14.72 | 2.78 | P4mm |
| Ba0.7Co0.3TiO3 | 3.9900 | 3.9900 | 12.2114 | 90.00 | 90.00 | 120.0 | 3.53 | 16.46 | 4.66 | P63/mmc |
| Ba0.6Co0.4TiO3 | 3.6983 | 3.6983 | 12.6023 | 90.00 | 90.00 | 120.0 | 3.50 | 6.40 | 4.60 | P63/mmc |
| Ba0.5Co0.5TiO3 | 2.7240 | 2.7240 | 11.9640 | 90.00 | 90.00 | 120.0 | 5.70 | 10.87 | 1.32 | P63/mmc |
| Ba0.4Co0.6TiO3 | 2.9301 | 2.9301 | 11.9980 | 90.00 | 90.00 | 120.0 | 2.83 | 09.98 | 3.52 | R-3 |
| Ba0.3Co0.7TiO3 | 5.4860 | 5.4860 | 7.03200 | 90.00 | 90.00 | 120.0 | 1.78 | 04.74 | 2.66 | R-3 |
| Ba0.2Co0.8TiO3 | 5.4860 | 5.4860 | 7.03200 | 90.00 | 90.00 | 120.0 | 1.78 | 05.29 | 2.97 | R-3 |
| Ba0.1Co0.9TiO3 | 5.0760 | 5.0760 | 5.48600 | 54.83 | 54.83 | 54.83 | 1.53 | 04.87 | 3.18 | R-3 |
| CoTiO3 | 5.0760 | 5.0760 | 5.48600 | 54.83 | 54.83 | 54.83 | 1.78 | 04.74 | 2.66 | R-3 |
| Bandes (cm−1) | Liaisons | Modes |
|---|---|---|
| 1631 and 1440 | Ba-Ti-O | Elongation |
| 520, 545 and 850 | Ti-O | Elongation |
| 525 | Co-O | Elongation |
| 647 | O-Co-O | Elongation |
| Element for (x = 0.6) | Weight % | Atomic % |
|---|---|---|
| Ba (L) | 7.1 | 3.2 |
| Ti (K) | 0.2 | 0.3 |
| Co (K) | 92.7 | 96.6 |
| Total | 100.0 | 100.0 |
| Compounds | Band Gap (eV) |
|---|---|
| BaTiO3 | 3.79 |
| Ba0.9Co0.1TiO3 | 3.49 |
| Ba0.8Co0.2TiO3 | 3.45 |
| Ba0.7Co0.3TiO3 | 3.37 |
| Ba0.6Co0.4TiO3 | 3.31 |
| Ba0.5Co0.5TiO3 | 3.11 |
| Ba0.4Co0.6TiO3 | 3.00 |
| Ba0.3Co0.7TiO3 | 2.97 |
| Ba0.2Co0.8TiO3 | 2.96 |
| Ba0.1Co0.9TiO3 | 2.95 |
| CoTiO3 | 3.05 |
| Compound | Emission Peaks Wavelength (nm) | Ray Emission Color Range |
|---|---|---|
| BaTiO3 | 400–450 | Violet |
| Ba0.9Co0.1TiO3 | ||
| Ba0.8Co0.2TiO3 | ||
| Ba0.7Co0.3TiO3 | ||
| Ba0.6Co0.4TiO3 | ||
| Ba0.5Co0.5TiO3 | 420 and 340 | Violet and Ultraviolet |
| Ba0.4Co0.6TiO3 | 340 | Ultraviolet |
| Ba0.3Co0.7TiO3 | ||
| Ba0.2Co0.8TiO3 | ||
| Ba0.1Co0.9TiO3 | ||
| CoTiO3 |
| Compounds | ECB (eV) | EVB (eV) |
|---|---|---|
| BaTiO3 | −1.153 | 2.637 |
| Ba0.9Co0.1TiO3 | −0.953 | 2.537 |
| Ba0.8Co0.2TiO3 | −0.884 | 3.616 |
| Ba0.7Co0.3TiO3 | −0.793 | 2.577 |
| Ba0.6Co0.4TiO3 | −0.713 | 2.597 |
| Ba0.5Co0.5TiO3 | −0.562 | 2.548 |
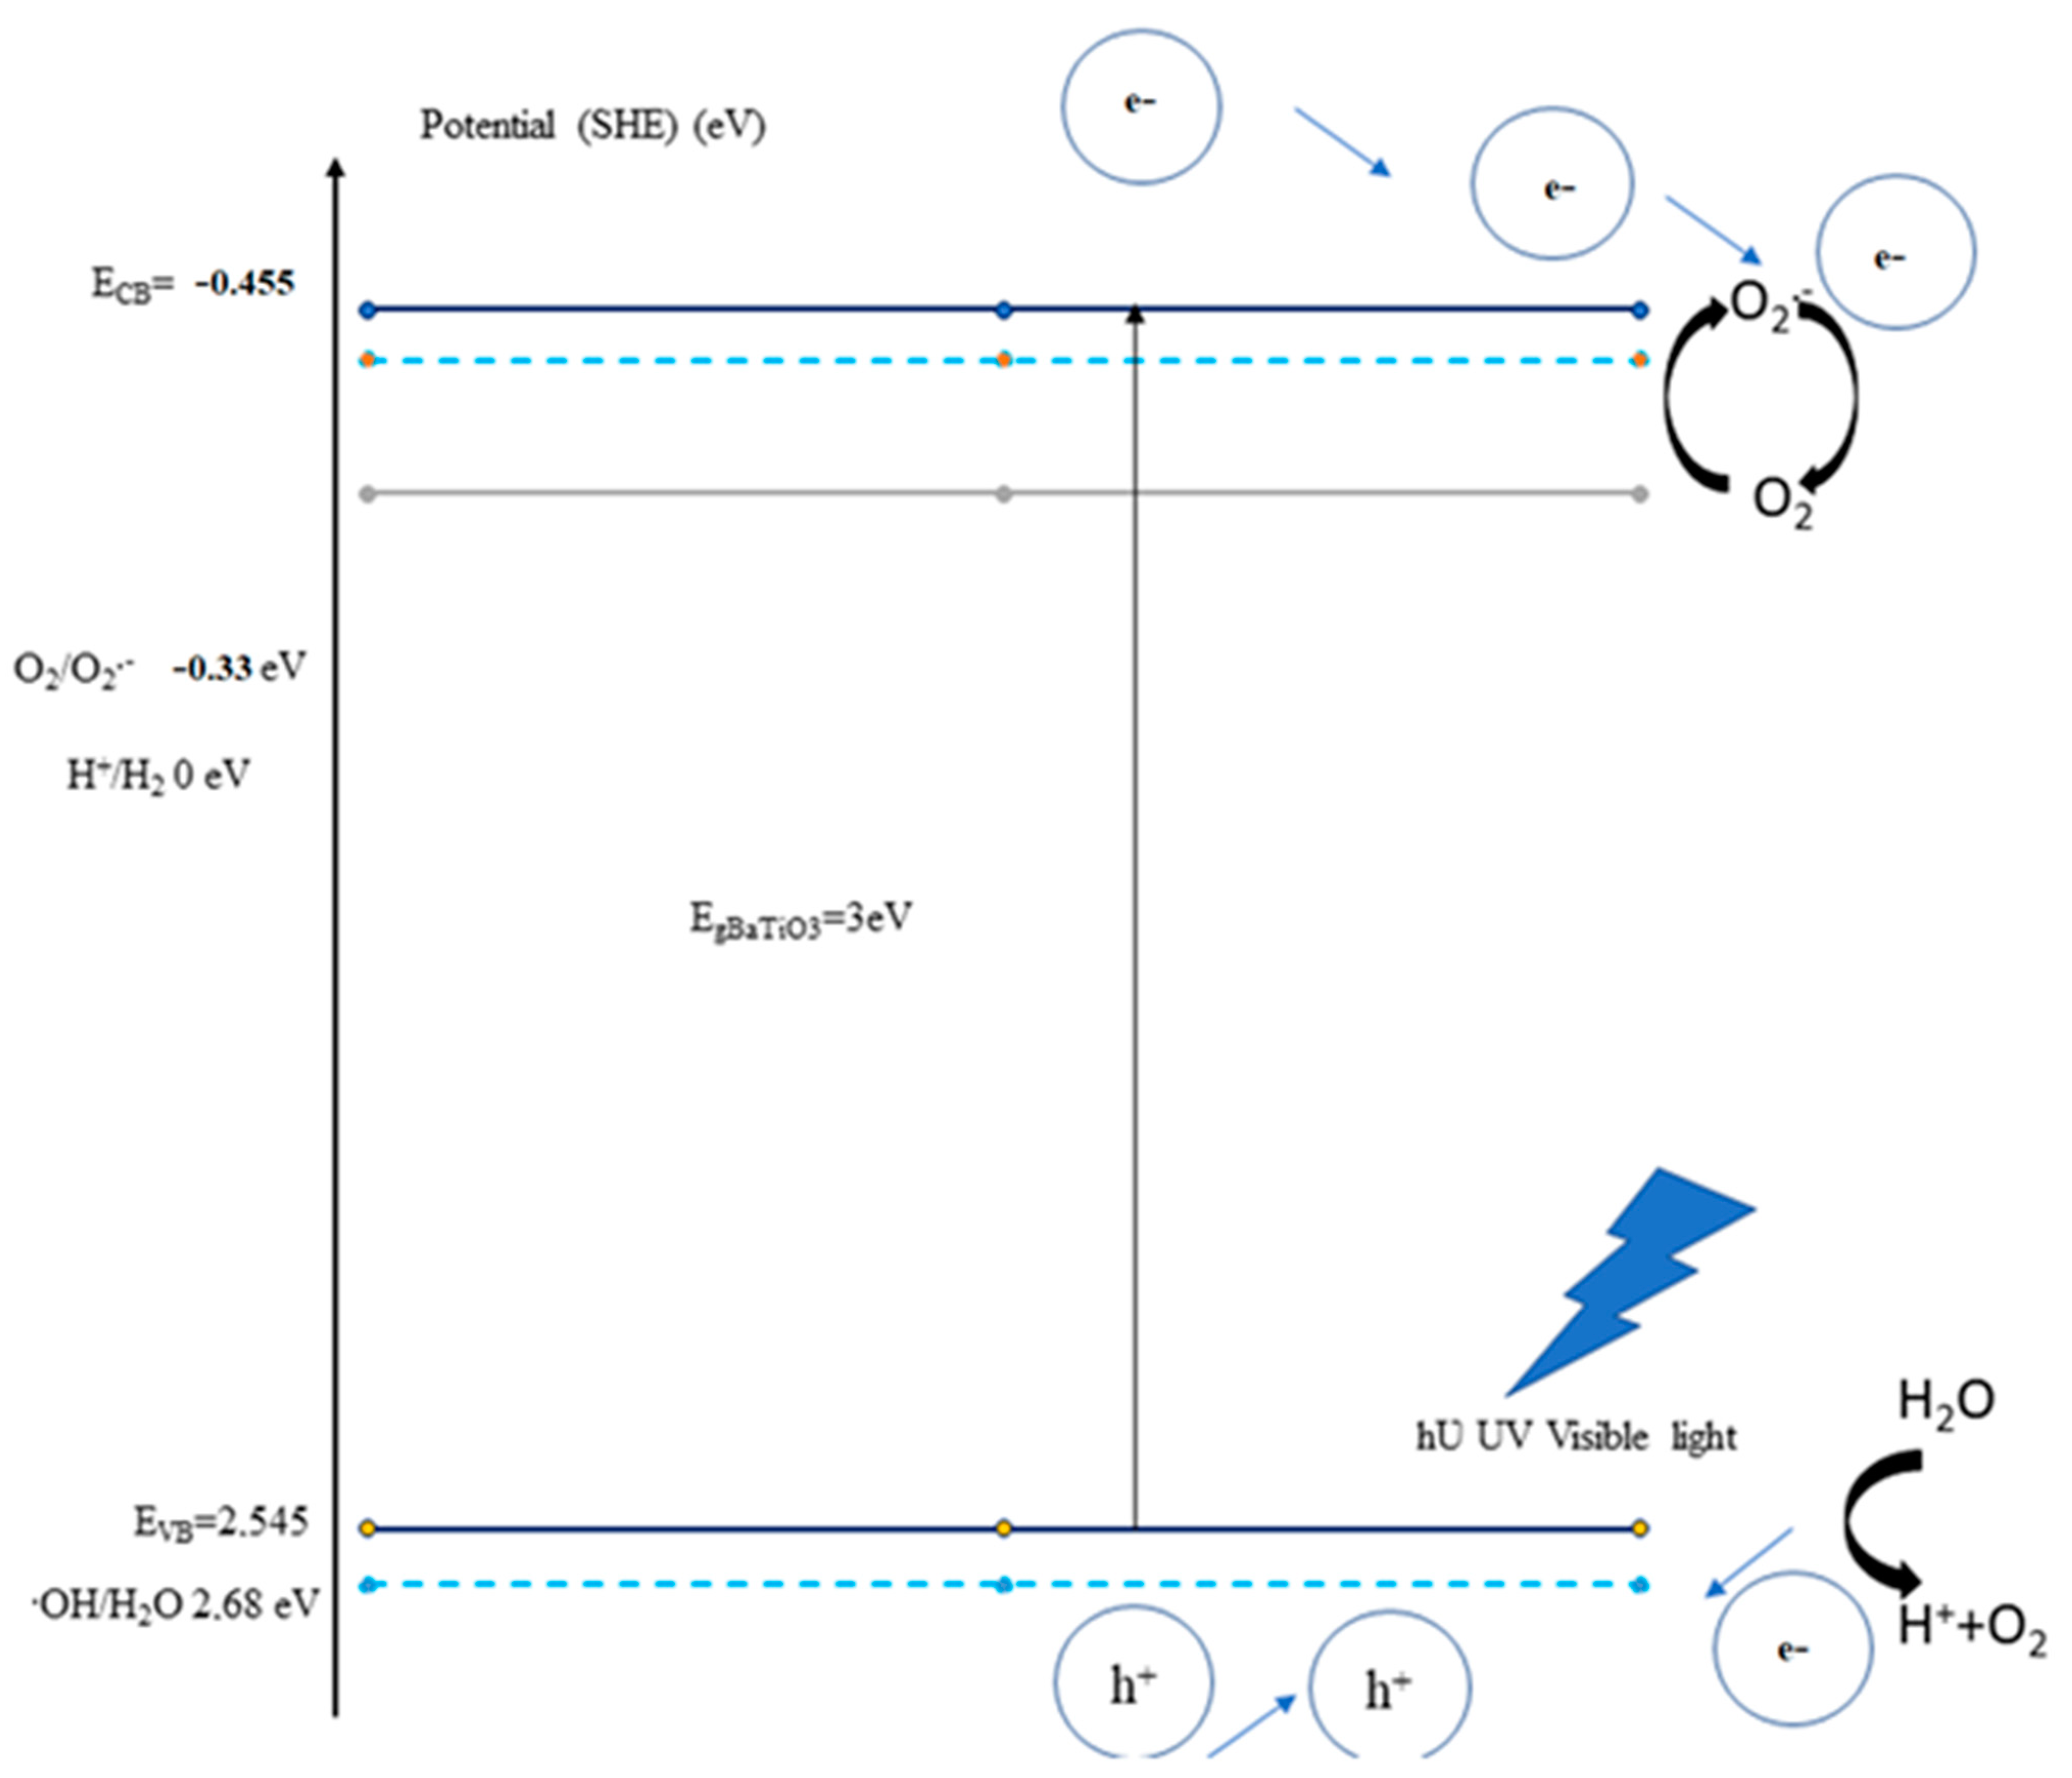
| Ba0.4Co0.6TiO3 | −0.455 | 2.545 |
| Ba0.3Co0.7TiO3 | −0.388 | 2.582 |
| Ba0.2Co0.8TiO3 | −0.325 | 2.625 |
| Ba0.1Co0.9TiO3 | −0.242 | 2.648 |
| CoTiO3 | −0.268 | 2.782 |
Disclaimer/Publisher’s Note: The statements, opinions and data contained in all publications are solely those of the individual author(s) and contributor(s) and not of MDPI and/or the editor(s). MDPI and/or the editor(s) disclaim responsibility for any injury to people or property resulting from any ideas, methods, instructions or products referred to in the content. |
© 2023 by the authors. Licensee MDPI, Basel, Switzerland. This article is an open access article distributed under the terms and conditions of the Creative Commons Attribution (CC BY) license (https://creativecommons.org/licenses/by/4.0/).
Share and Cite
Jebali, S.; Meftah, M.; Mejri, C.; Ben Haj Amara, A.; Oueslati, W. Enhancement of Photocatalytic Activity and Microstructural Growth of Cobalt-Substituted Ba1−xCoxTiO3 {x = 0, …, 1} Heterostructure. ChemEngineering 2023, 7, 43. https://doi.org/10.3390/chemengineering7030043
Jebali S, Meftah M, Mejri C, Ben Haj Amara A, Oueslati W. Enhancement of Photocatalytic Activity and Microstructural Growth of Cobalt-Substituted Ba1−xCoxTiO3 {x = 0, …, 1} Heterostructure. ChemEngineering. 2023; 7(3):43. https://doi.org/10.3390/chemengineering7030043
Chicago/Turabian StyleJebali, Sana, Mahdi Meftah, Chadha Mejri, Abdesslem Ben Haj Amara, and Walid Oueslati. 2023. "Enhancement of Photocatalytic Activity and Microstructural Growth of Cobalt-Substituted Ba1−xCoxTiO3 {x = 0, …, 1} Heterostructure" ChemEngineering 7, no. 3: 43. https://doi.org/10.3390/chemengineering7030043