Article

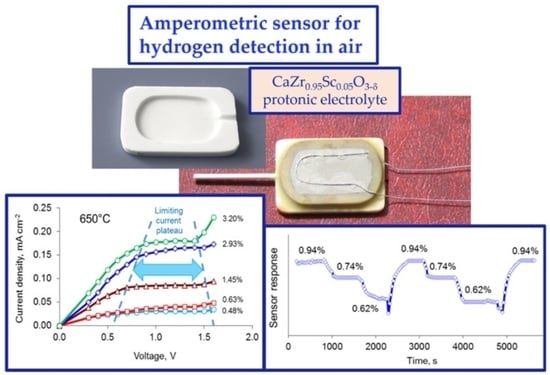
Solid-Oxide Amperometric Sensor for Hydrogen Detection in Air

Institute of High Temperature Electrochemistry, Ural Branch of the Russian Academy of Sciences, 20 Akademicheskaya St., 620066 Ekaterinburg, Russia
*
Author to whom correspondence should be addressed.
ChemEngineering 2023, 7(3), 45; https://doi.org/10.3390/chemengineering7030045
Submission received: 13 April 2023 / Revised: 28 April 2023 / Accepted: 9 May 2023 / Published: 11 May 2023

Abstract

:
An amperometric sensor based on CaZr0.95Sc0.05O3−δ (CZS) proton-conducting oxide for the measurement of hydrogen concentration in air was designed and tested. Dense CZS ceramics were fabricated through uniaxial pressing the powder synthesized by the solid-state method and sintering at 1650 °C for 2 h. The conductivity of CZS was shown to increase with increasing air humidity, which indicates the proton type of conductivity. The sensor was made from two CZS plates, one of which had a cavity was drilled to form an inner chamber, that were then pressed against each other and sealed around the perimeter to prevent gas leaking. The inner chamber of the sensor was connected with the outer atmosphere via an alumina ceramic capillary, which acted as a diffusion barrier. The sensor performance was studied in the temperature range of 600–700 °C in the mixtures of air with hydrogen. The sensor signal, or the limiting current, was found to linearly increase with the hydrogen concentration, which simplifies the sensor calibration. The sensor demonstrated a high sensitivity of ~60 μA per 1% H2 at 700 °C, a fast response, high reproducibility, good selectivity, and long-term stability.

Graphical Abstract

1. Introduction

Hydrogen is commonly used for a variety of applications. It is needed for hydrocracking in the petroleum refining industry, for treating metals in metallurgy, and in thermal and nuclear power engineering. A large amount of hydrogen is consumed by the chemical industry in order to produce chemicals, mainly ammonia for the agricultural industry, but also methanol, hydrogen peroxide, and others. Hydrogen is also used in electronics and in flat glass manufacturing, arc welding, the food industry, and in medicine. In recent years, hydrogen has been considered as an ideal fuel which has a high energy density, is effective for energy storage, and does not produce dangerous emissions. The growing need for hydrogen requires robust safety measures because hydrogen is more hazardous than many other fuels. The key problems are a high leaking ability due to the very small size of H2 molecules and extremely high flammability of hydrogen. Since hydrogen is colorless, odorless, and tasteless, reliable hydrogen sensors for the detection of hydrogen leakage are needed. Hydrogen concentration monitoring is also necessary for the control of technological processes in semiconductor manufacturing, glass manufacturing etc.
Various types of hydrogen sensors with different operating mechanisms are known to be suitable for hydrogen detection. Traditional sensing methods, such as gas chromatography, mass spectrometry, and chemiluminescence can be used, but they are expensive, slow, and require large complicated apparatus and qualified personnel, which restrict their application [1]. Pd-based sensors use the ability of palladium to absorb hydrogen; the interaction with hydrogen results in changes in the electrical, optical, acoustic, and other properties of the metal, which allows for the measuring of the hydrogen concentration [2,3,4]. However, the lifetime of the Pd-based sensors is affected by the degradation of electrical contacts in harsh environments; additionally, the presence of such species as carbon monoxide, hydrogen sulfide, and sulfur dioxide in the target gas influences the sensor readings. The semiconducting hydrogen sensors are based on a change in the electrical properties of a semiconducting oxide in the presence of hydrogen in the surrounding atmosphere. The semiconducting hydrogen sensors can be miniaturized, exhibit high sensitivity, a fast response, and long-term stability [1,5]. However, these sensors also typically respond to a wide range of other reducing gases such as CO, CH3, hydrocarbons etc., which restrains the sensing accuracy. In pellistor sensors, small pellets of catalyst cause flammable gas within the sensor to ignite, and the produced heat leads to a change in the resistance of a detecting element which is proportional to the concentration of the flammable gas. Pellistors are simple and low cost, however, they have a short lifetime because the chemical catalyst degrades over time; furthermore, they do not operate in an oxygen-free environment [6].
Electrochemical sensors that use a solid-oxide electrolyte can be effectively used for hydrogen detection. Solid-oxide sensors operate at high temperatures (typically, above 450 °C), because the solid-oxide electrolytes demonstrate an appropriate ionic conductivity only at high temperature [7,8]. Electrochemical sensors are usually divided into impedancemetric, potentiometric, and amperometric sensors [7,9,10]. The impedancemetric sensors require the use of a high-cost apparatus, namely a high-frequency AC signal source and a frequency response analyzer; in addition, changes in the electrode microstructure and electrical properties during operation influence the sensor response [11]. Potentiometric sensors demonstrate high selectivity and excellent reliability. However, for the potentiometric sensor operation, it is necessary to supply a reference gas to the reference electrode, and this complicates the design of the sensors; additionally, their performance is sensitive to changing electrode behavior in a way similar to that of the impedancemetric sensors [12,13,14]. Amperometric-type sensors operate in the diffusion-limited mode, when the current is controlled by diffusion and independent of the working electrode potential [7]. Amperometric sensing is a low-cost and simple to use technology, which is widely applied to the measurement of different gas components.
An amperometric sensor, based on the ZrO2 + 10 mol% Y2O3 (10YSZ) oxide-ion electrolyte, for measuring H2O and H2 concentrations in air, was designed in [15]. The sensor operated in the mode of pumping out oxygen from an analyzed gas. It was shown that both H2O and H2 concentrations in the air could be determined by measuring the limiting currents in the analyzed air and in the preliminary dried air. When there was no hydrogen in the air, the obtained limiting current values were similar, while a difference between the two limiting currents indicated the presence of hydrogen. The analytic expressions for calculation of H2O and H2 concentrations from the obtained values of the limiting current were derived; however, the sensitivity of the sensor was rather low. The ability to determine the concentration of H2, CO, and CH4 in nitrogen by using an amperometric YSZ-based sensor was shown in [16]. The limiting current was found to linearly increase with an increase in the combustible gases concentration; the sensor demonstrated a good reproducibility and a short transient time of about 100 s. An amperometric sensor with BaHf0.7Sn0.1In0.2O3−δ proton-conducting electrolyte and BaHf0.8Fe0.2O3−δ proton-electron mixed conductor as a diffusion barrier for hydrogen detection in air, fabricated by the co-pressing and co-sintering methods, demonstrated good long-term stability and high anti-interference capability towards O2, CO2, or H2S, but water vapor affected the sensor readings [17]. The amperometric sensors with the proton-conducting electrolytes, La0.95Sr0.05YO3−δ and CaZr0.9Sc0.1O3−δ, were shown to be effective for hydrogen measuring in the gaseous mixtures of nitrogen, hydrogen, and water vapor [18].
Sc-doped CaZrO3 is known to combine high ionic conductivity with excellent chemical stability; in a wet atmosphere, these oxides exhibit appreciable proton conduction [18,19,20,21,22]. CaZrO3-based oxides demonstrate the highest proton transference numbers among alkaline earth zirconates [19]. In oxidizing atmospheres, the conductivity of CaZr0.95Sc0.05O3−δ was reported to be predominantly ionic with a small hole component at temperatures above 800 °C; at lower temperatures, the conduction was practically purely ionic [20,22]. Therefore, CaZr0.95Sc0.05O3−δ is a promising proton-conducting electrolyte for use in the electrochemical sensors for hydrogen detection. Due to its excellent chemical stability, CaZr0.95Sc0.05O3−δ ceramic was used in the potentiometric sensor for the measurement of hydrogen concentration in molten Al and was recommended for use in liquid Flibe, Li and Pb–Li [12].
The present research is aimed at the development of a simple and reliable amperometric sensor based on CaZr0.95Sc0.05O3−δ (CZS) proton-conducting electrolyte for the measurement of hydrogen in air. CZS ceramics for the sensor were fabricated through solid-state synthesis and sintering at 1650 °C; the phase purity, microstructure, chemical composition, and electrical conductivity were characterized using X-ray diffraction (XRD), scanning electron microscopy (SEM), energy dispersive X-ray spectroscopy (EDX), and impedance spectroscopy methods. The sensor performance was studied in the temperature range of 600–700 °C in the mixtures of air with hydrogen.

2. Materials and Methods

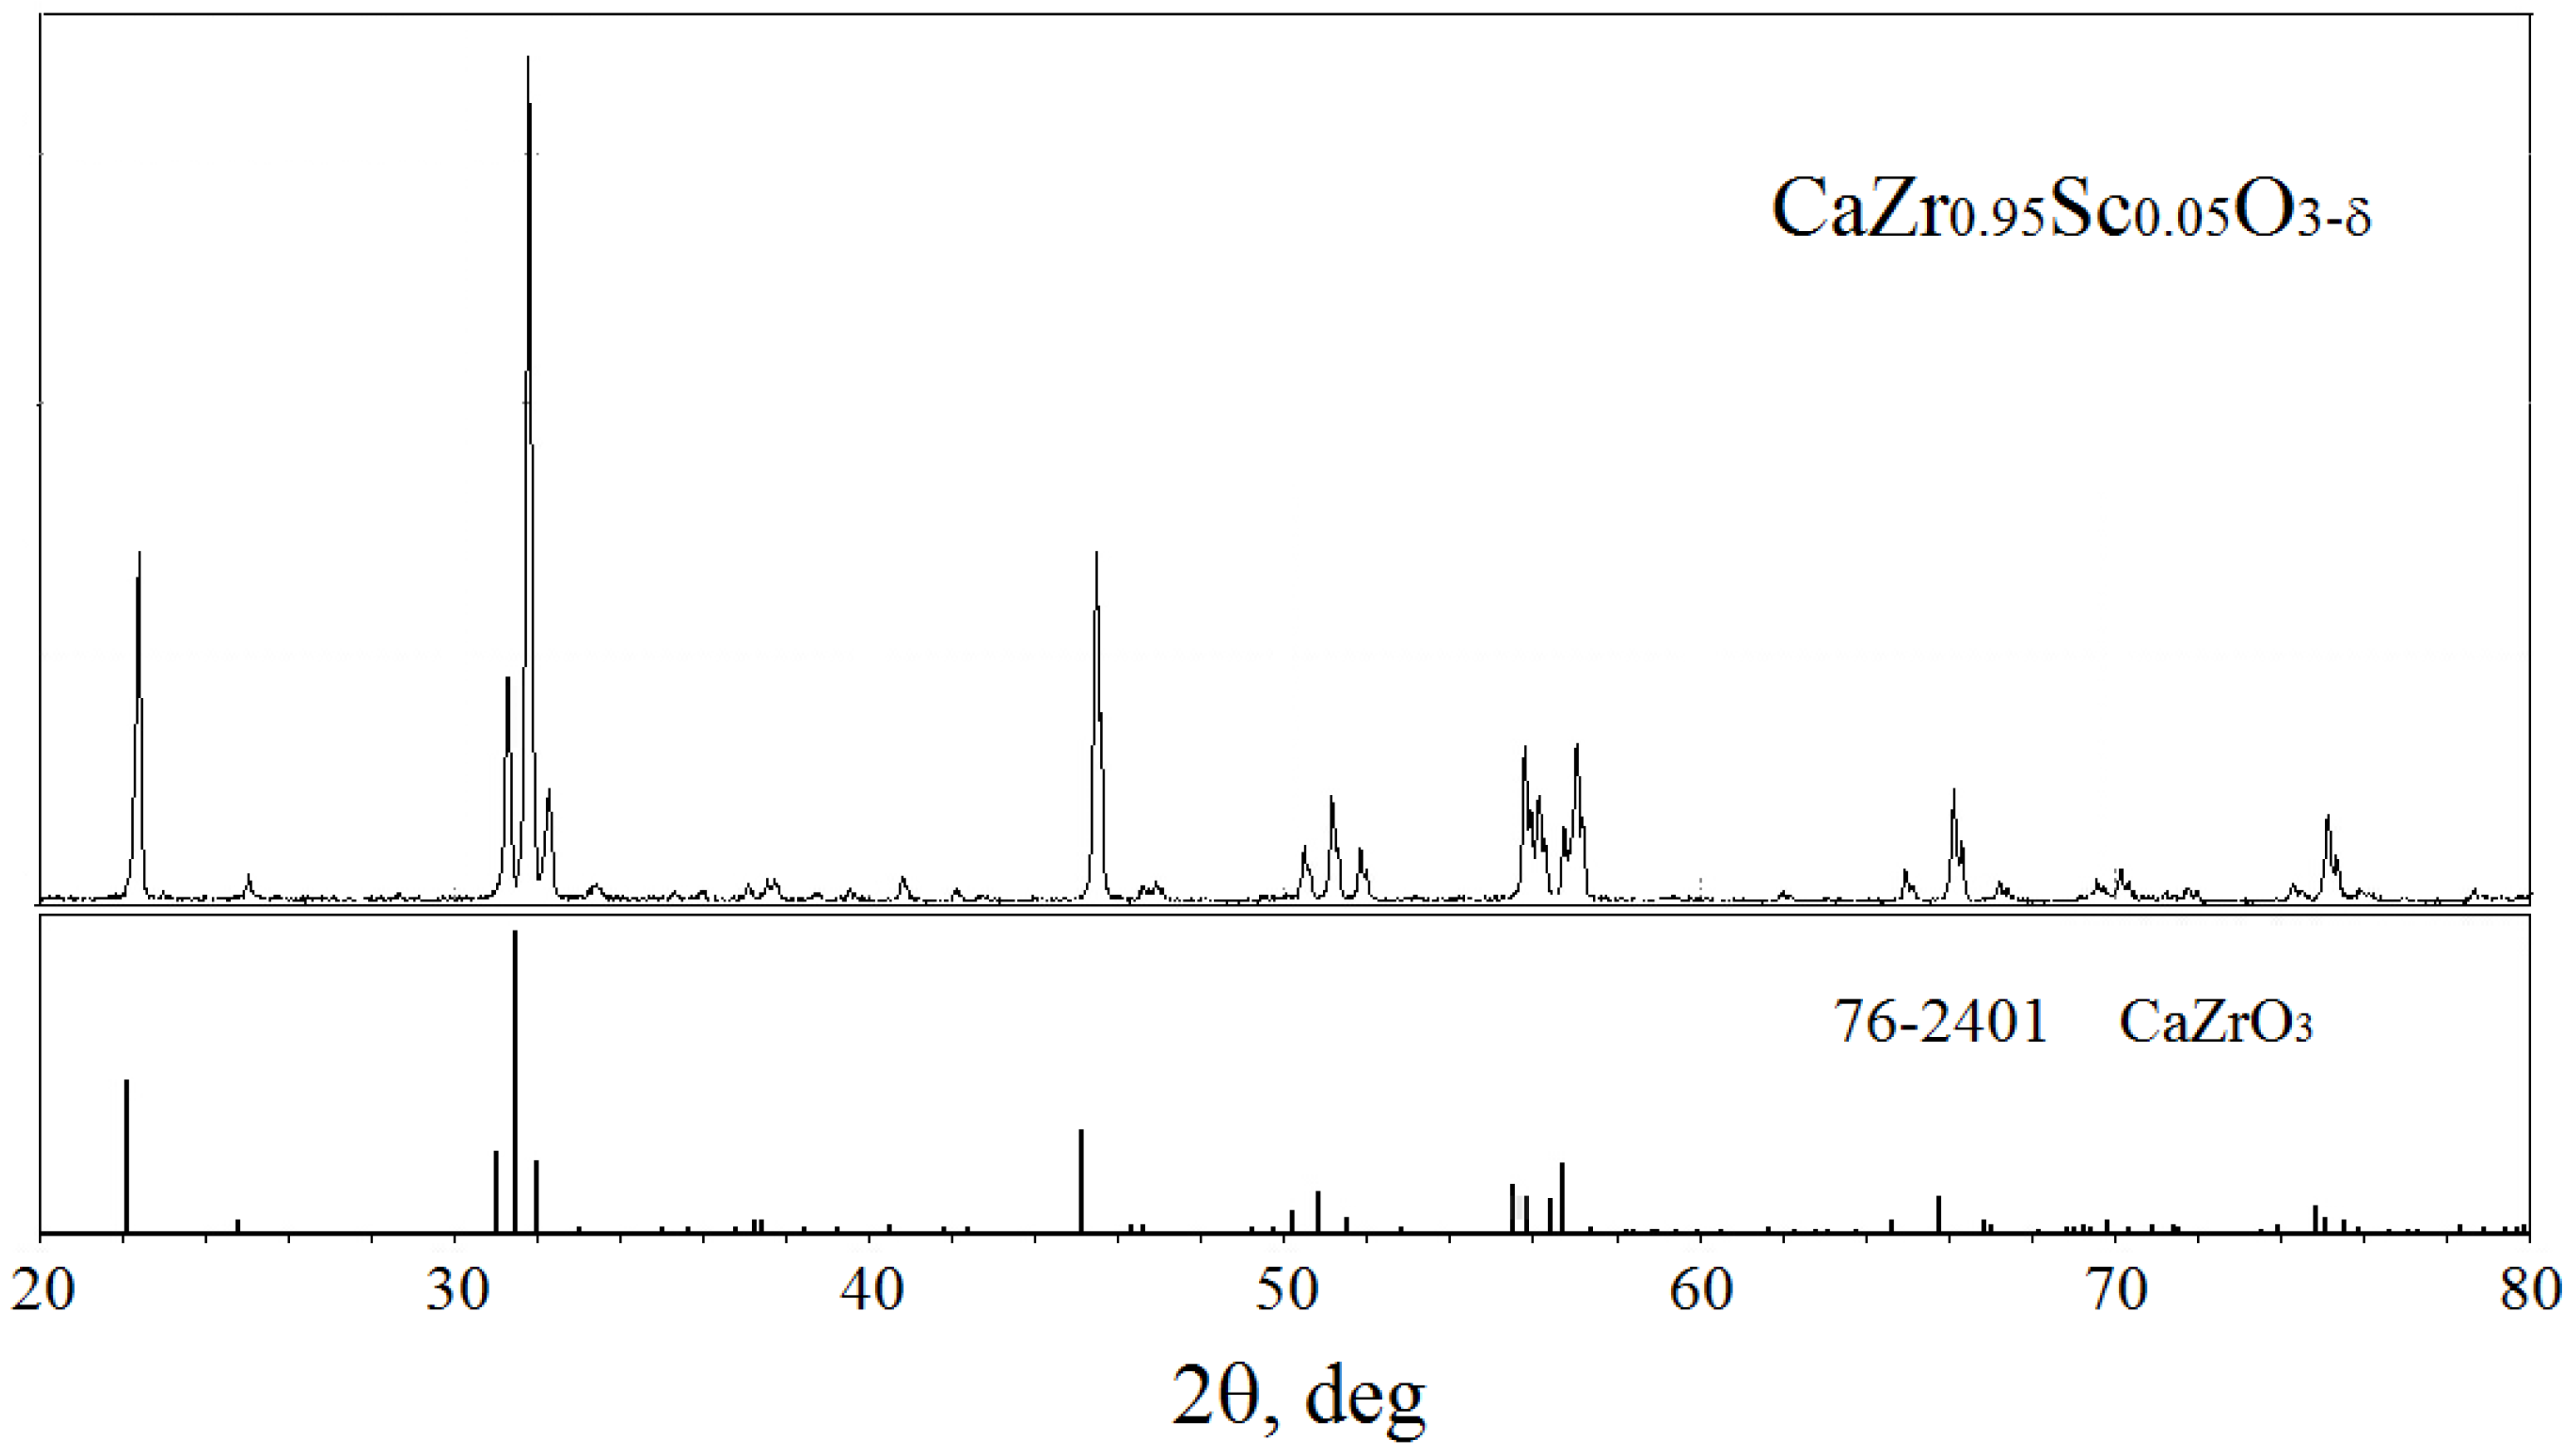
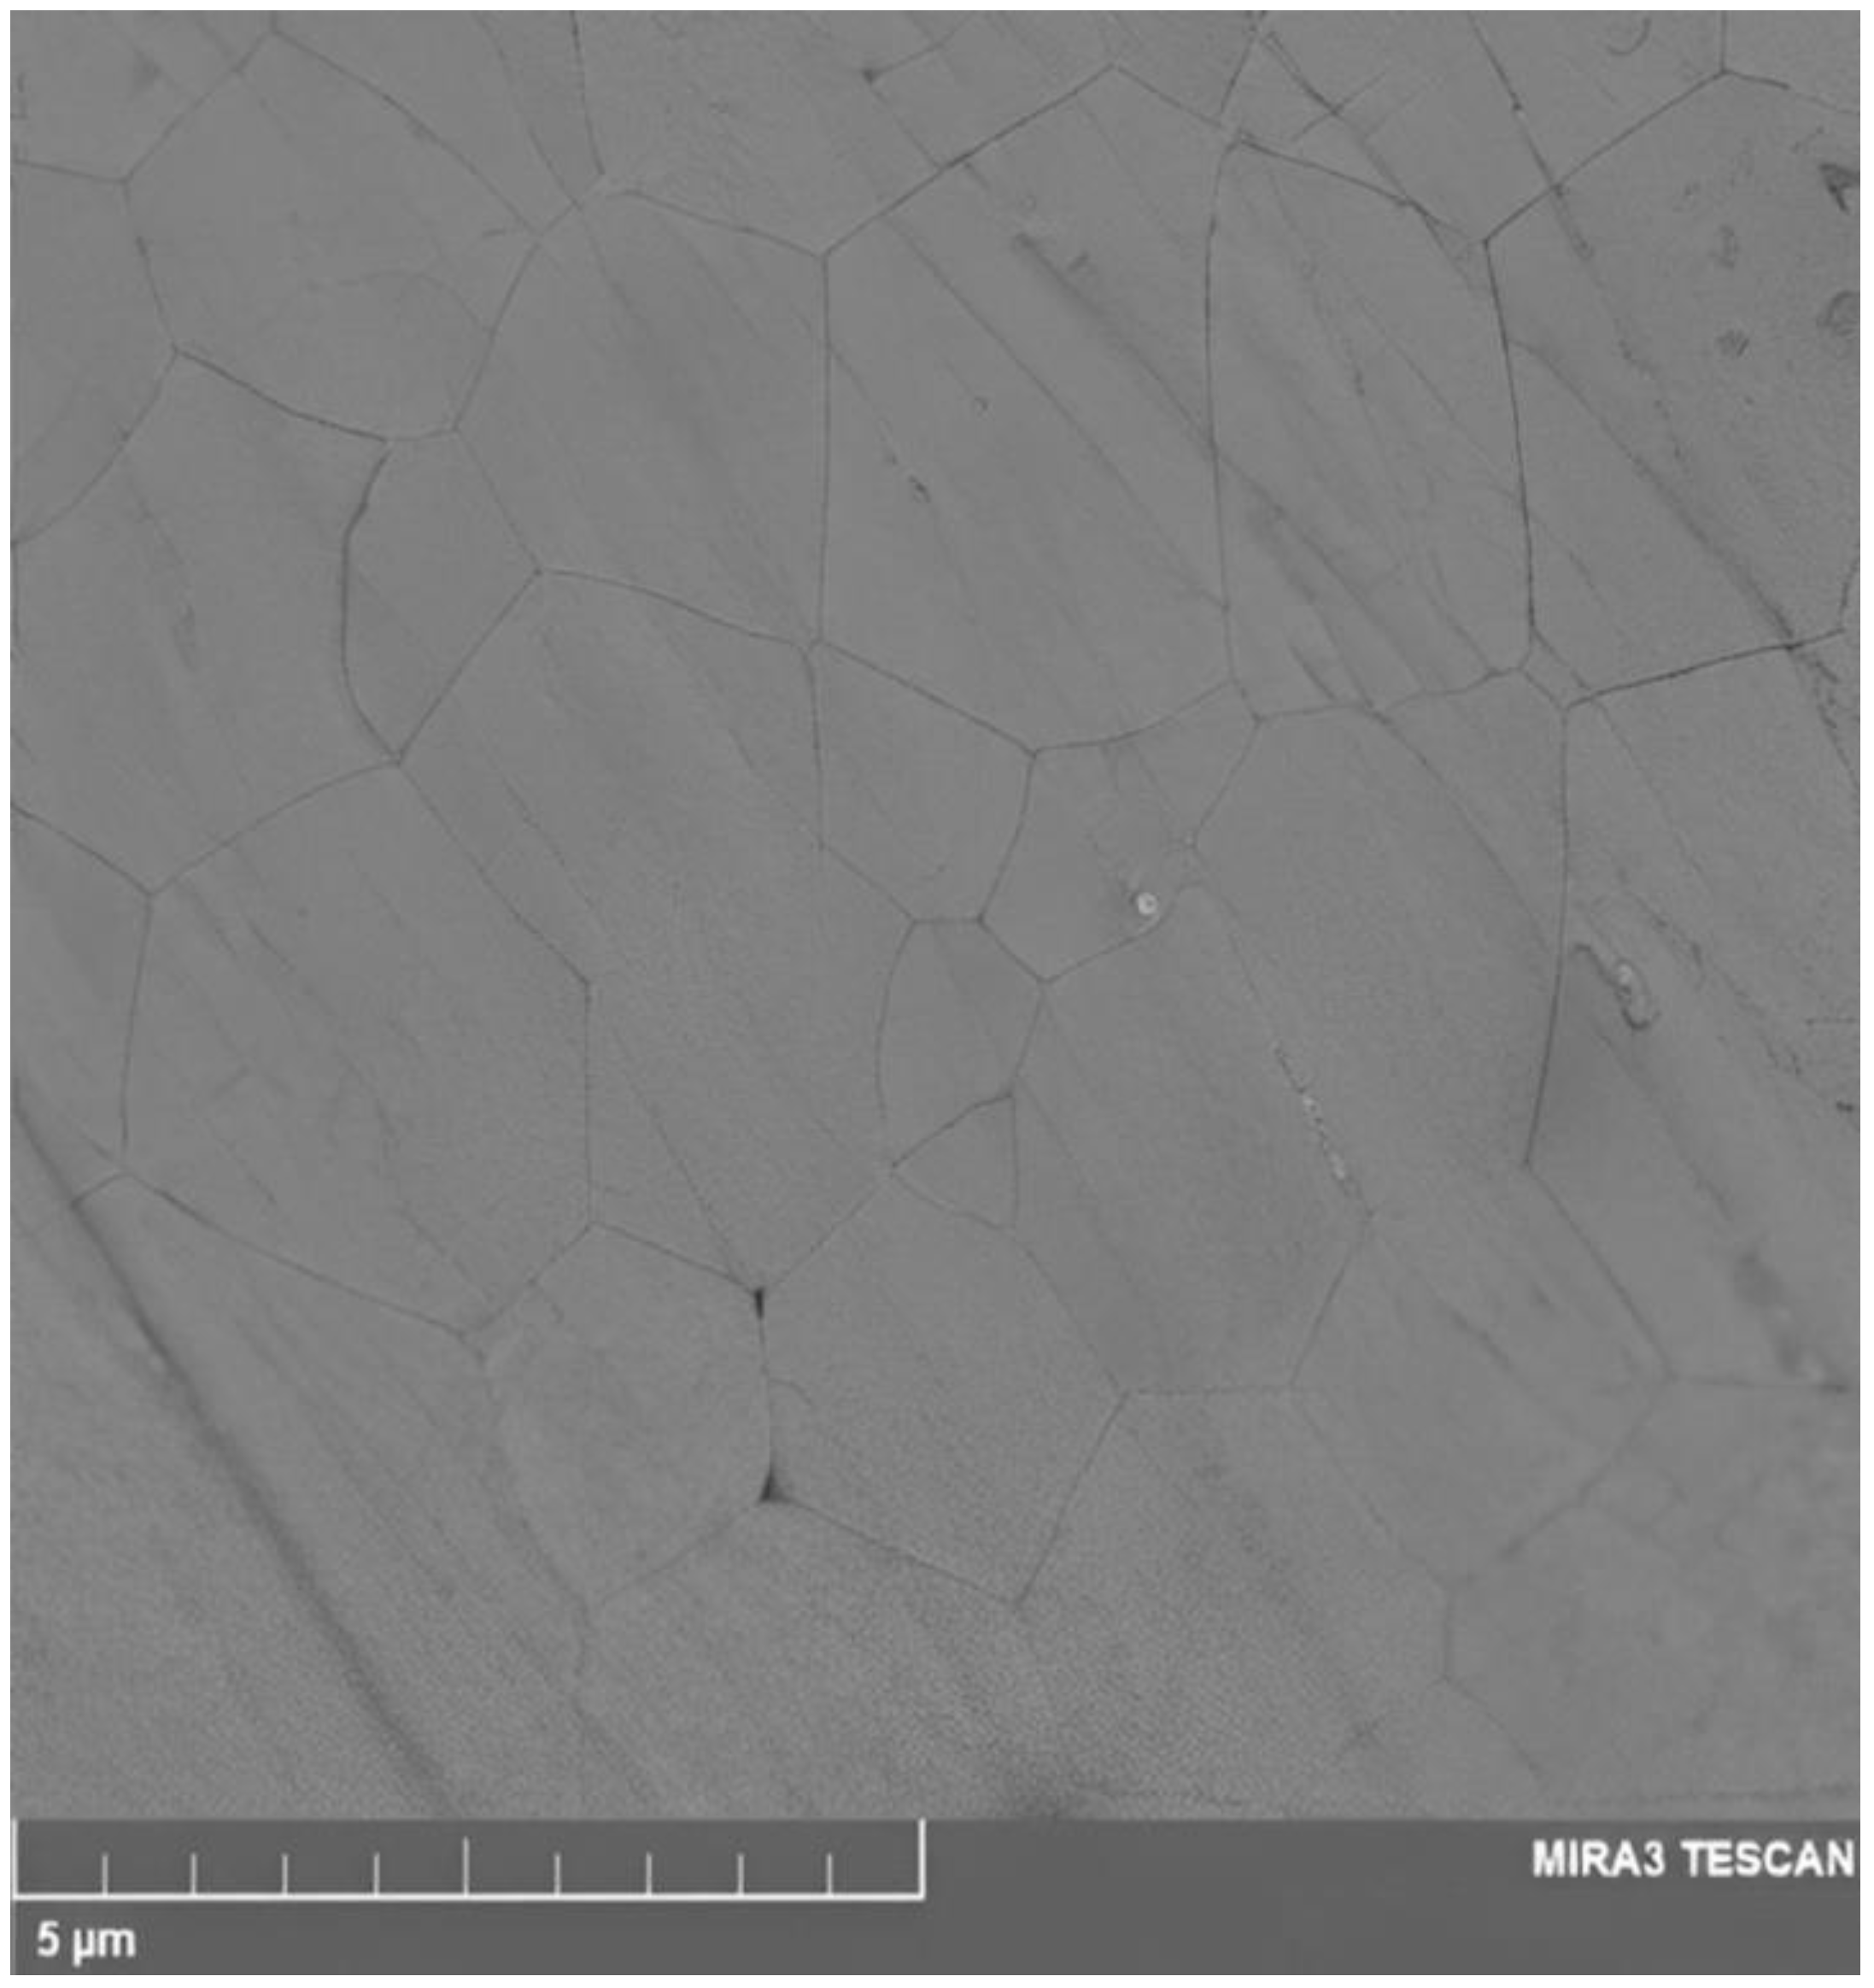
2.1. Fabrication and Characterization of CZS Ceramics

CZS powder was synthesized by the solid-state reaction using ZrO2 (extra pure grade), CaCO3 (extra pure grade), and Sc2O3 (99.9%) as precursors. The starting materials were thoroughly mixed in a planetary mill (Retsch PM 100) in a calculated ratio and synthesized at 1150 °C for 1 h in a zirconia crucible. The obtained material was ground, pressed into pellets at a pressure of 300 MPa, and sintered at 1650 °C for 2 h in a zirconia crucible. The phase purity of the obtained ceramics was characterized by the powder XRD method using an X-ray diffractometer D-Max 2200 (Rigaku, Tokyo, Japan) in Cu Kα radiation in the range from 20 to 80°. The XRD pattern was analyzed using MDI Jade 6 software. Scanning electron microscopy (MIRA 3 LMU, Tescan, Brno, Czech Republic) with an energy dispersive X-ray spectrometer (Oxford Instruments X-MAX 80, Abingdon, UK) was used to study the microstructure and composition of CZS ceramics. For this study, the surface of the CZS sample was polished and then annealed at a temperature of 1200 °C for 4 h to make the pattern of grains visible. The chemical composition of the sample was calculated from the EDX data averaged for 10 spots.
The electrical conductivity of CZS ceramics was studied by the impedance spectroscopy method using Parstat 2273 potentiostat/galvanostat/frequency response analyzer (Princeton Applied Research, USA) in the range of frequency 0.1 Hz–1 MHz at an amplitude of 30 mV. Platinum electrodes were symmetrically applied on both sides of the CZS pellet by painting Pt paste and sintering at 1000 °C for 1 h. The surface area of the electrodes was 0.84 cm2; the thickness of the CZS pellet was 0.15 cm. The impedance measurements were conducted in a temperature range of 350–800 °C in dry and humid air. The dry air was obtained by blowing atmospheric air through a bulb filled with zeolite beads. The residual pressure of the water vapor in the dry air, measured by the thermohygrometer IVTM-7 M (Eksis, Moscow, Russia), was 0.04 kPa. The humid air was obtained by blowing atmospheric air through a bubbler with the water thermostatically controlled at 30 °C (pH2O = 4.25 kPa).

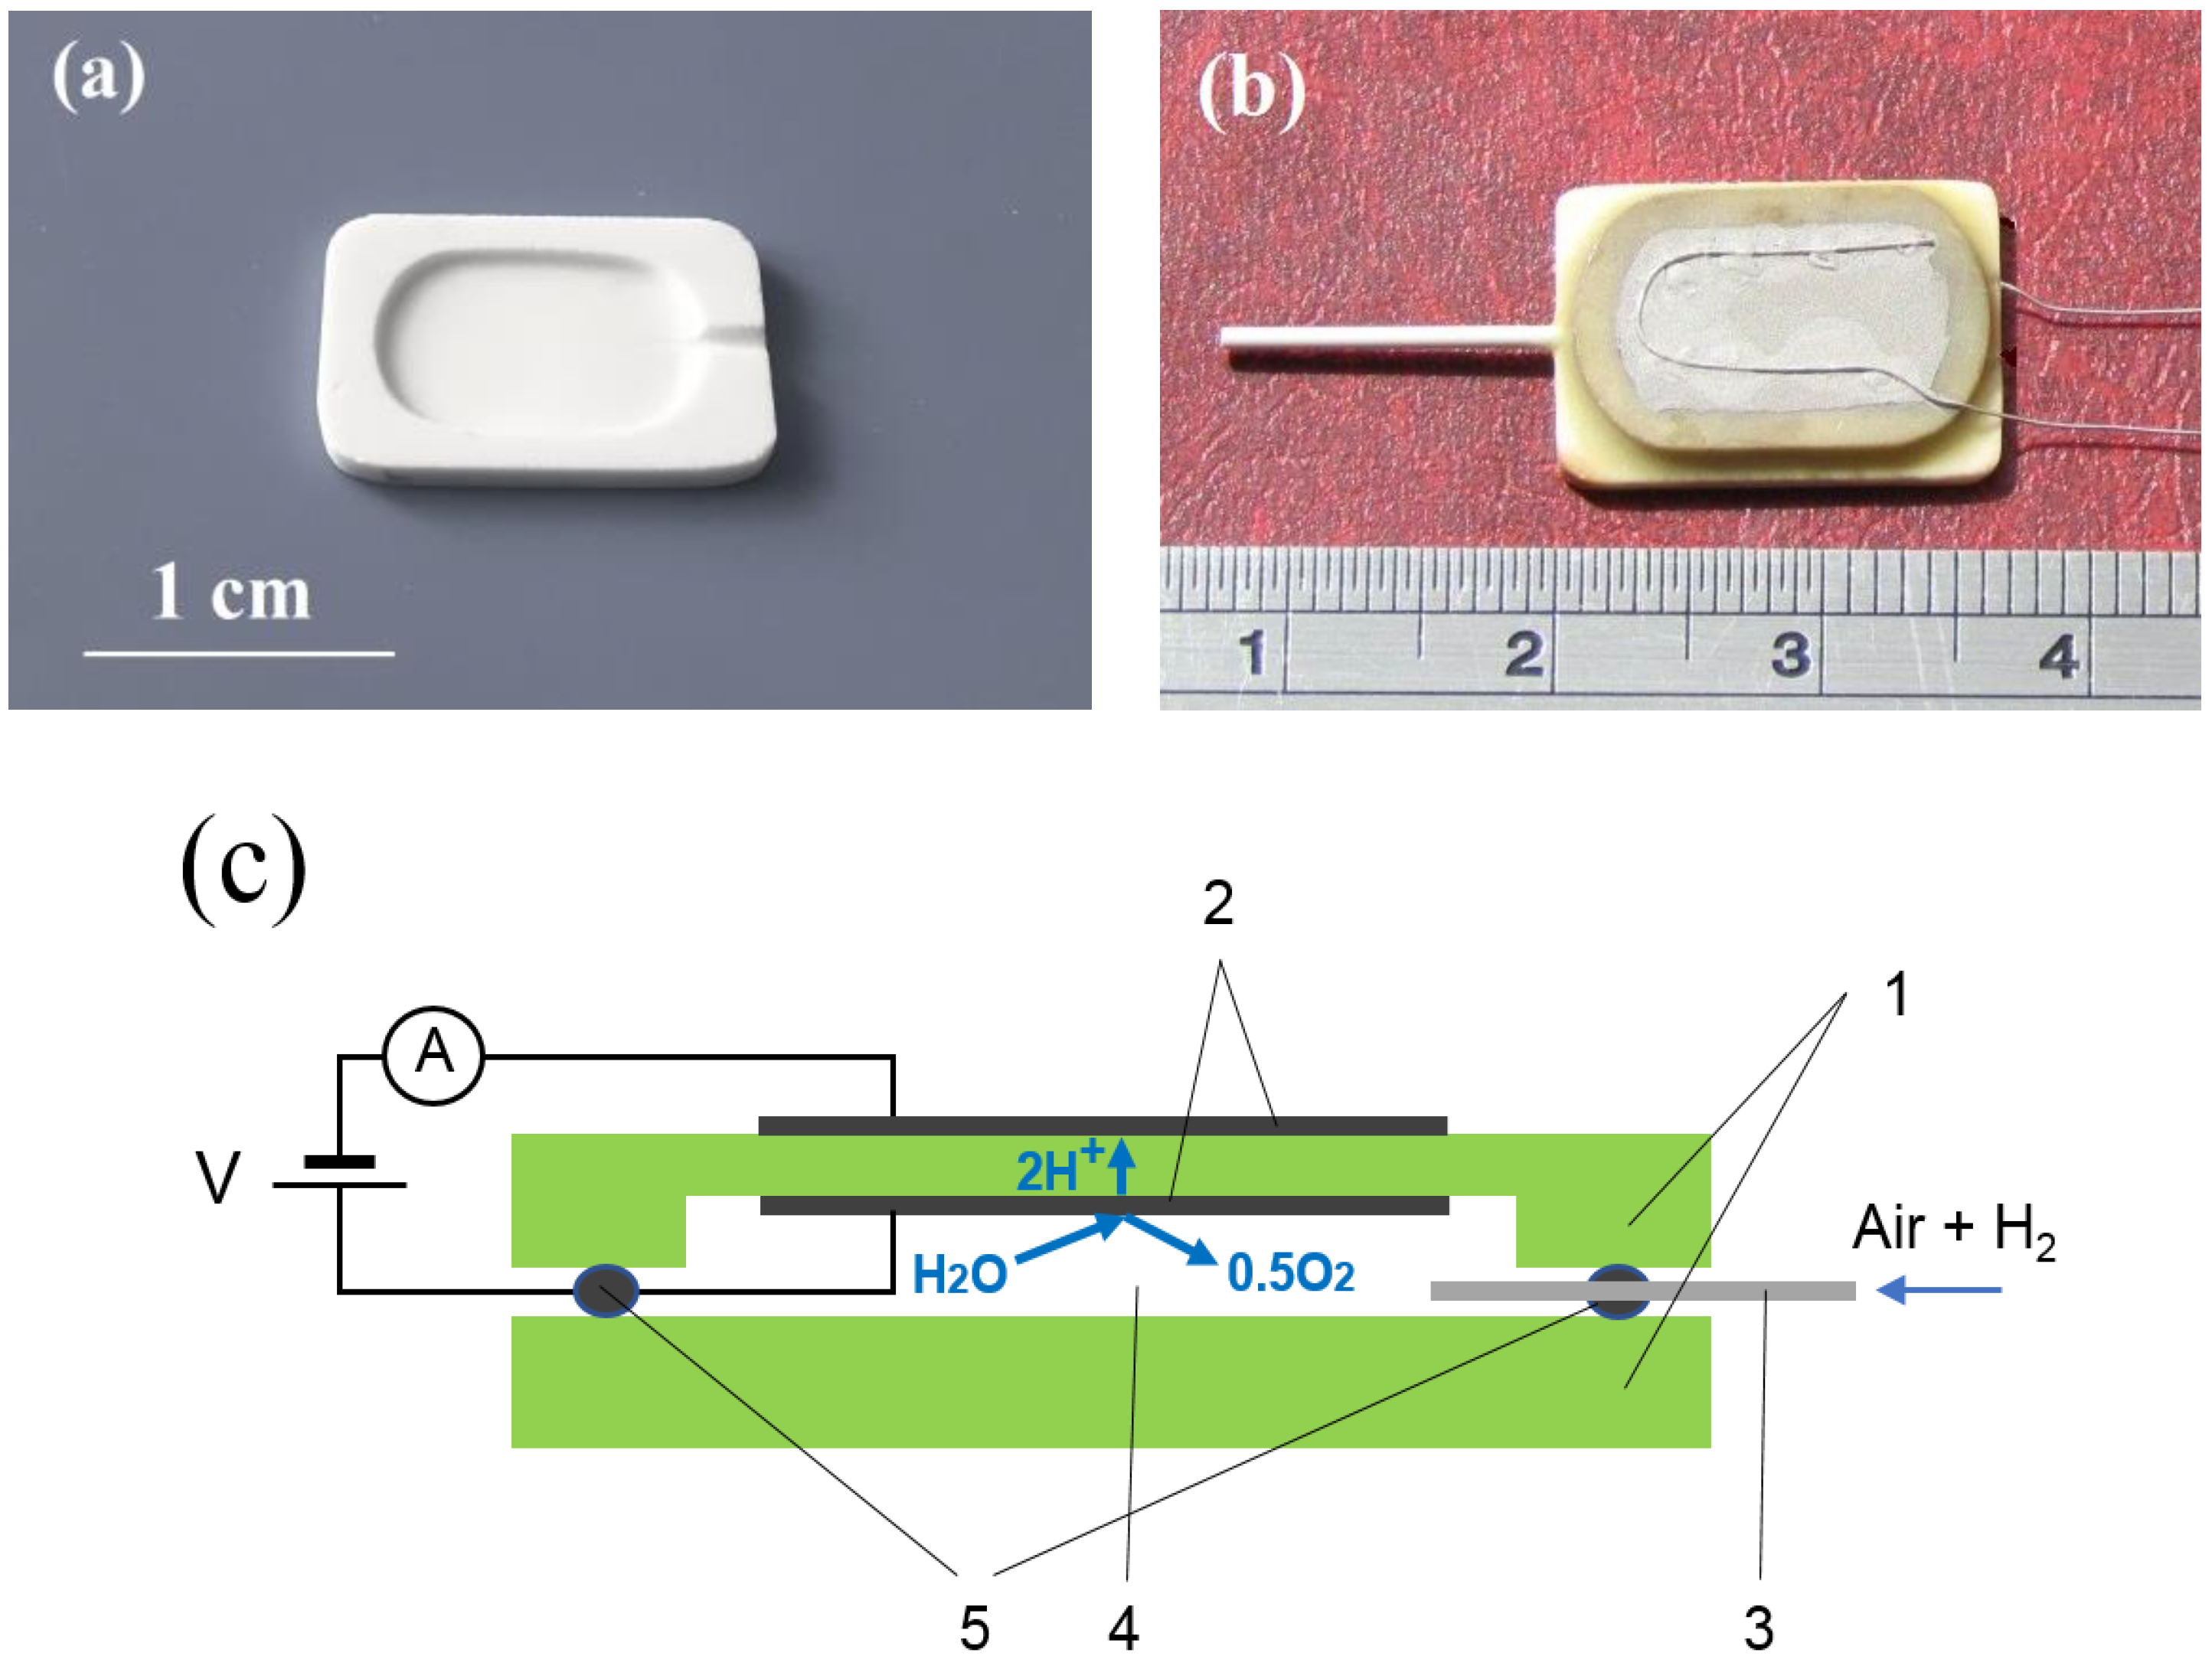
2.2. Fabrication of Sensor

For the fabrication of a sensor, two plates of about equal size (1.5 cm × 1.0 cm × 0.1 cm) were cut from the CZS pellets. Then, a 0.05 cm deep cavity and a groove were drilled in one of the plates to form an inner chamber and room for a capillary. The photos of the CZS ceramic plate with a cavity and the fabricated sensor, as well as a schematic view of the sensor, are presented in Figure 1. The opposite faces of the plate with a cavity were coated with Pt paste, which was then sintered at a temperature of 1160 °C for 1 h. The area of the Pt electrodes was 1 cm2 and the loading was about 5 mg cm−2. Then, Pt wires with a diameter of 0.2 mm to carry an electric current were attached to each electrode and annealed at 1100 °C for 1 h as shown in Figure 1b. The prepared CZS plates were pressed against each other and the contact perimeter was sealed with a hermetic glass to prevent gas leaking. The inner chamber was connected with the outer atmosphere via an alumina ceramic capillary with a length of 20 mm and an inner diameter of 0.26 mm.

2.3. Sensor Operation

The sensor was placed into a tube furnace and heated to 600–700 °C. Analyzed gas was supplied to the furnace tube with a flow rate of 20 mL min−1 and filled the sensor inner chamber through the capillary, so that the inner and outer atmospheres were the same; therefore, the inner and outer electrodes of the sensor were in the same conditions. For the sensor testing, the mixture of wet air and hydrogen with a given hydrogen concentration was composed using gas flow controllers F-201C-33-V (Bronkhorst, Germany). The mixture of air with methane and carbon monoxide was prepared in the same way. The concentration of hydrogen in the air did not exceed 3.20% due to the high explosiveness. The H2O concentration in air varied within the range of 0.1–0.35%. The water vapor concentration in the gas was measured with the help of a thermohygrometer IVTM-7 M (Eksis, Moscow, Russia). First, the gas mixture was dried by passing through a column filled with zeolite beads, so that the water vapor concentration in the dried gas was less than 0.05%, and then the dried gas was supplied to the sensor. Upon heating the air + H2 mixture to the temperature of the furnace (600–700 °C), hydrogen is oxidized according to the following reaction:
H2 + 0.5O2 → H2O.
The amount of water produced is equal to the hydrogen concentration in the gas. As mentioned in the introduction, CZS has a nearly pure proton conductivity in wet oxidizing atmospheres at temperatures of 600–700 °C [20,22]. When voltage (V) is applied to the sensor electrodes, as shown in Figure 1c, the proton current in CZS electrolyte is generated, and the electrochemical reactions (2) and (3) occur at the positively charged inner electrode and the negatively charged outer electrode, respectively:
H2O → 2H+ + 0.5O2 + 2e
2H+ + 2e → H2
The sensor current, recorded by an ammeter, is equivalent to the proton current across the electrolyte, and it has to increase with increasing applied voltage. The growing consumption of hydrogen at the inner electrode causes an increase in the diffusive flux of hydrogen from the outside towards the inner chamber via the capillary. The diffusive flux of hydrogen is proportional to the hydrogen concentration gradient in accordance with Fick’s law; therefore, the diffusive flux of hydrogen increases with an increase in the voltage. However, the diffusive supply of hydrogen is limited by the parameters of a diffusion channel, which leads to a situation where an increase in the applied voltage above a certain value does not lead to an increase in the current; as a result, a plateau, also known as a limiting current, is observed on the current–voltage curve. The limiting current corresponds to the equal rates of pumping out and diffusive supply of hydrogen, and it depends on the geometry of a diffusion channel, and the concentration and diffusion coefficient of hydrogen as follows [23]:
I lim = 2 F D H 2 S P R T L ln 1 X H 2 ,
where D H 2 denotes the diffusion coefficient of hydrogen in air, S is a cross section area of a diffusion channel, L is a length of a diffusion channel, P is the total gas pressure, X H 2 is the molar fraction of hydrogen, F is Faraday constant, and R is the universal gas constant.
At small hydrogen concentrations (<10%), Equation (4) can be simplified to:
I lim = 2 F D H 2 S P R T L X H 2
Thus, the sensor-limiting current is proportional to the hydrogen concentration in air, which makes the calibration of the sensor and the measurement of the hydrogen concentration in gases simple and accurate.
During the sensor testing, an applied DC voltage was regulated using a direct current source GPS-18500 (GW INSTEC, Taiwan) and the current was measured by a multimeter GDM–8246 (GW INSTEC, Taiwan). The error in the measurement of the current density of ~5% was caused mainly by errors in the evaluation of the capillary diameter and the effective area of electrodes.

3. Results and Discussion

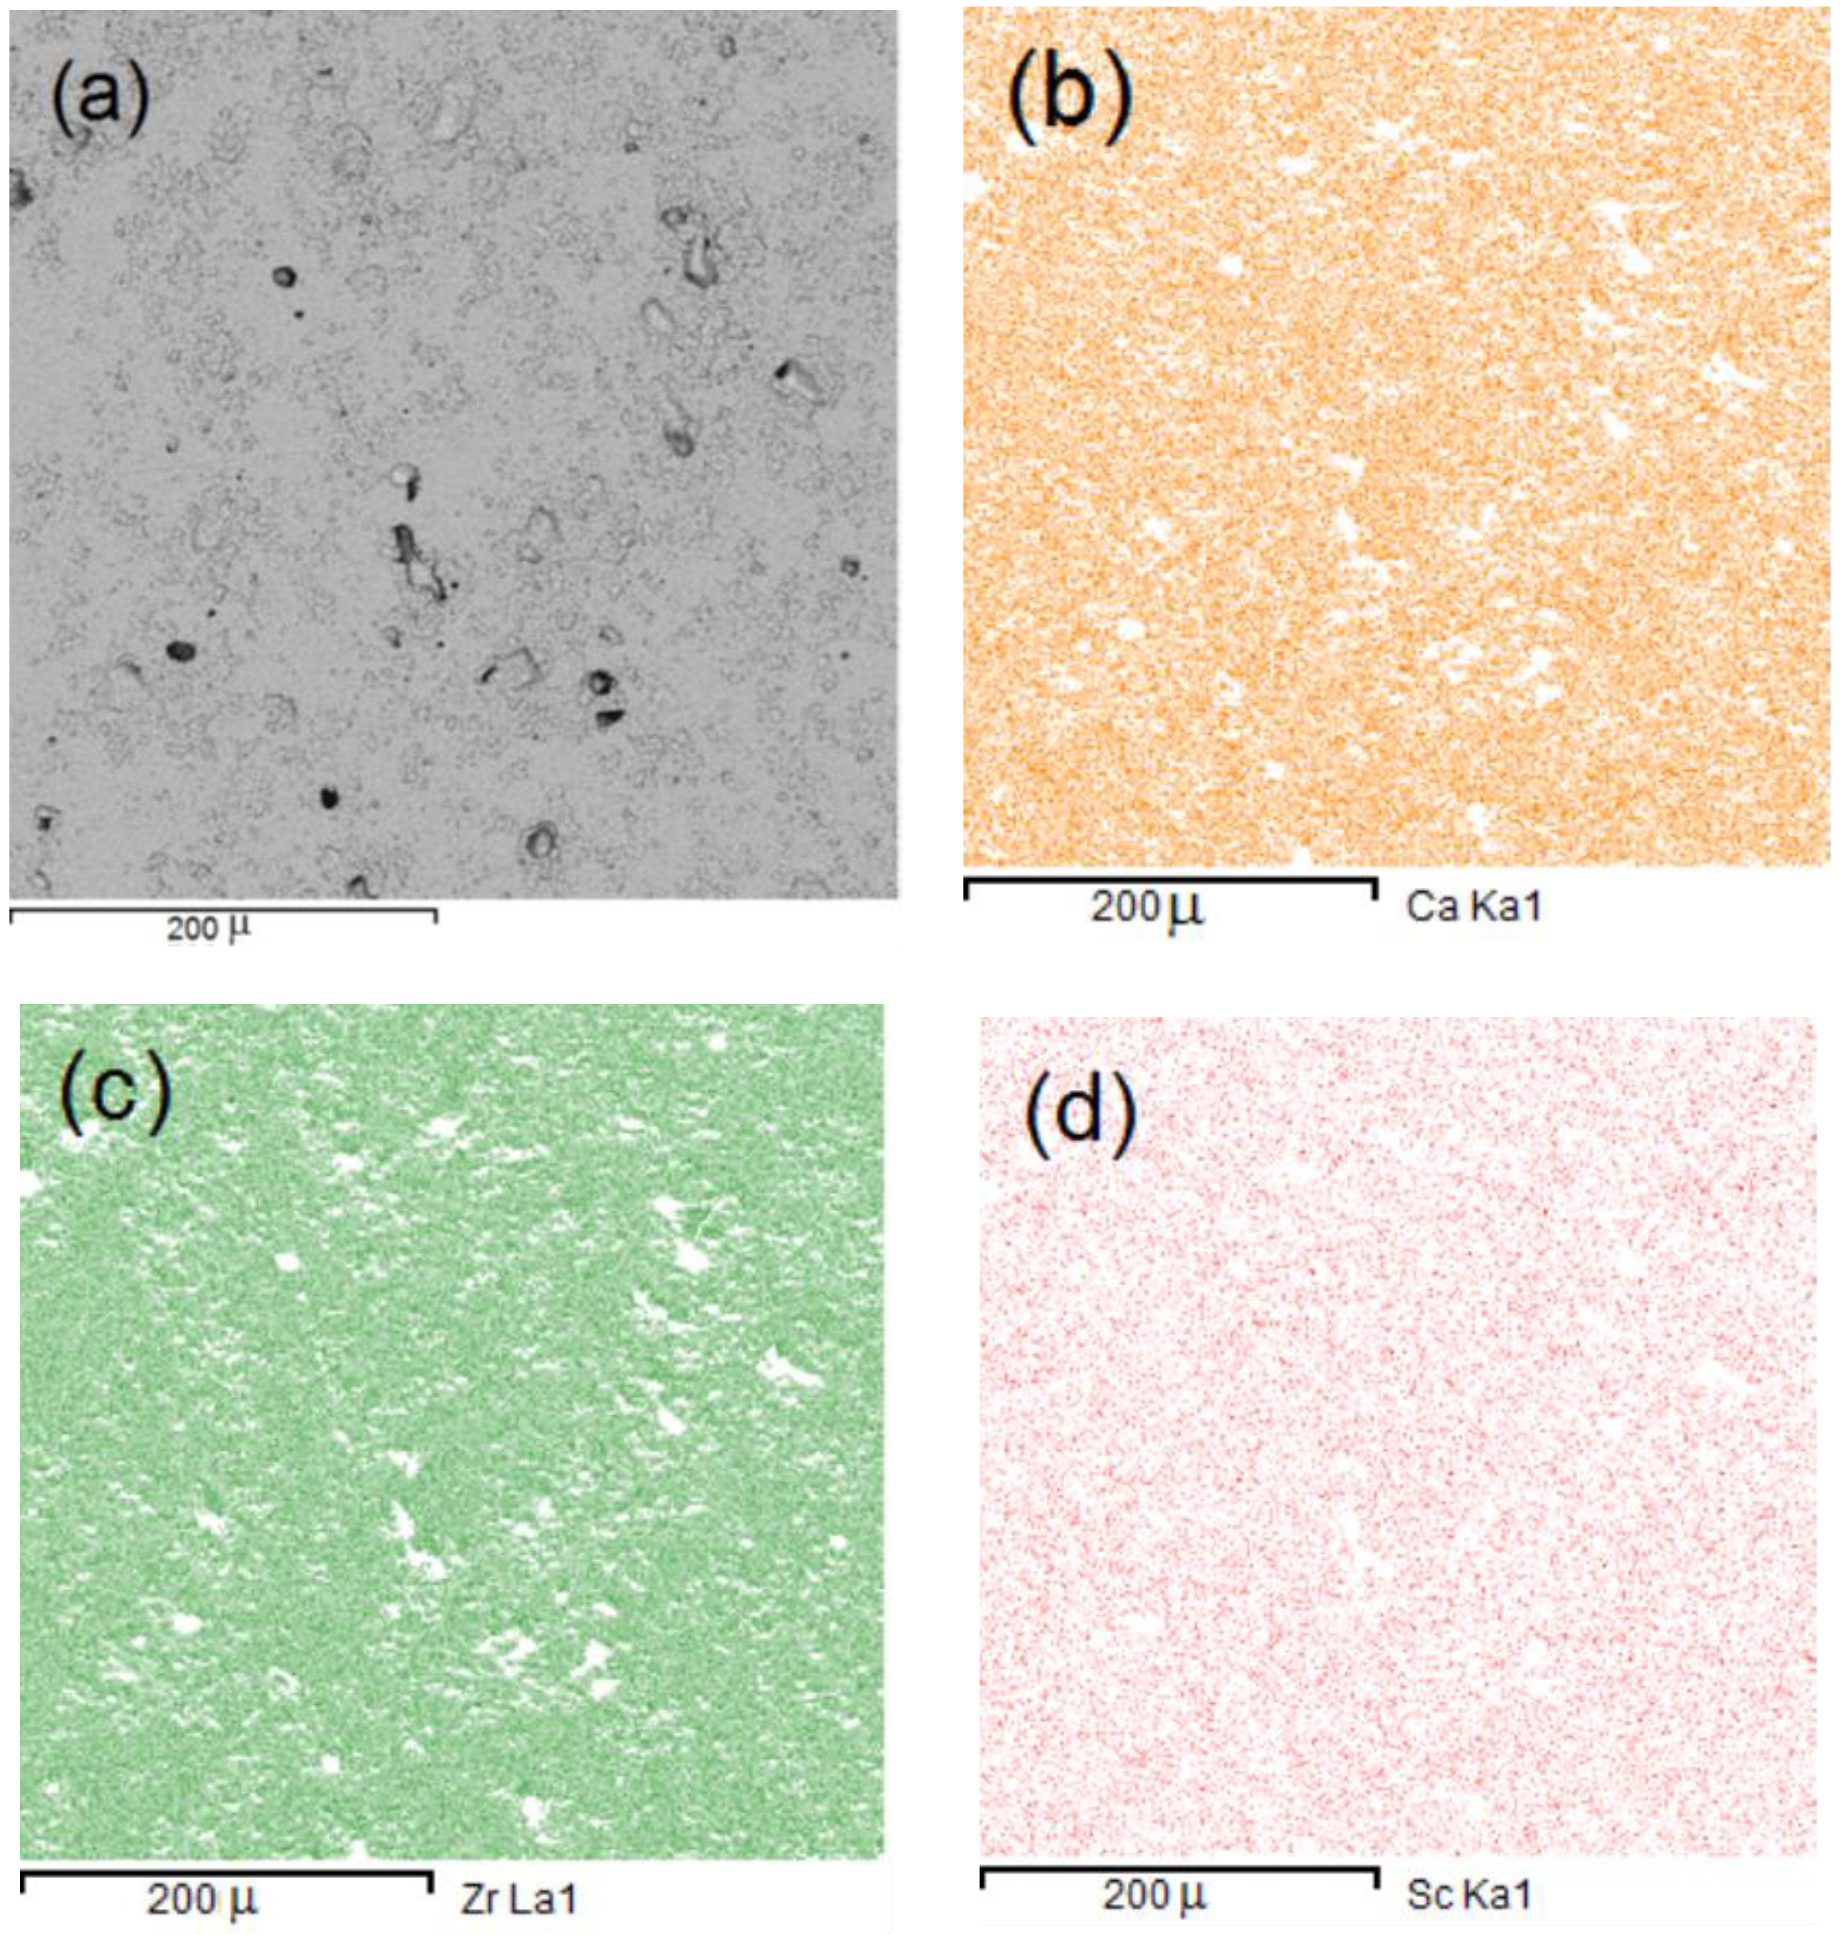
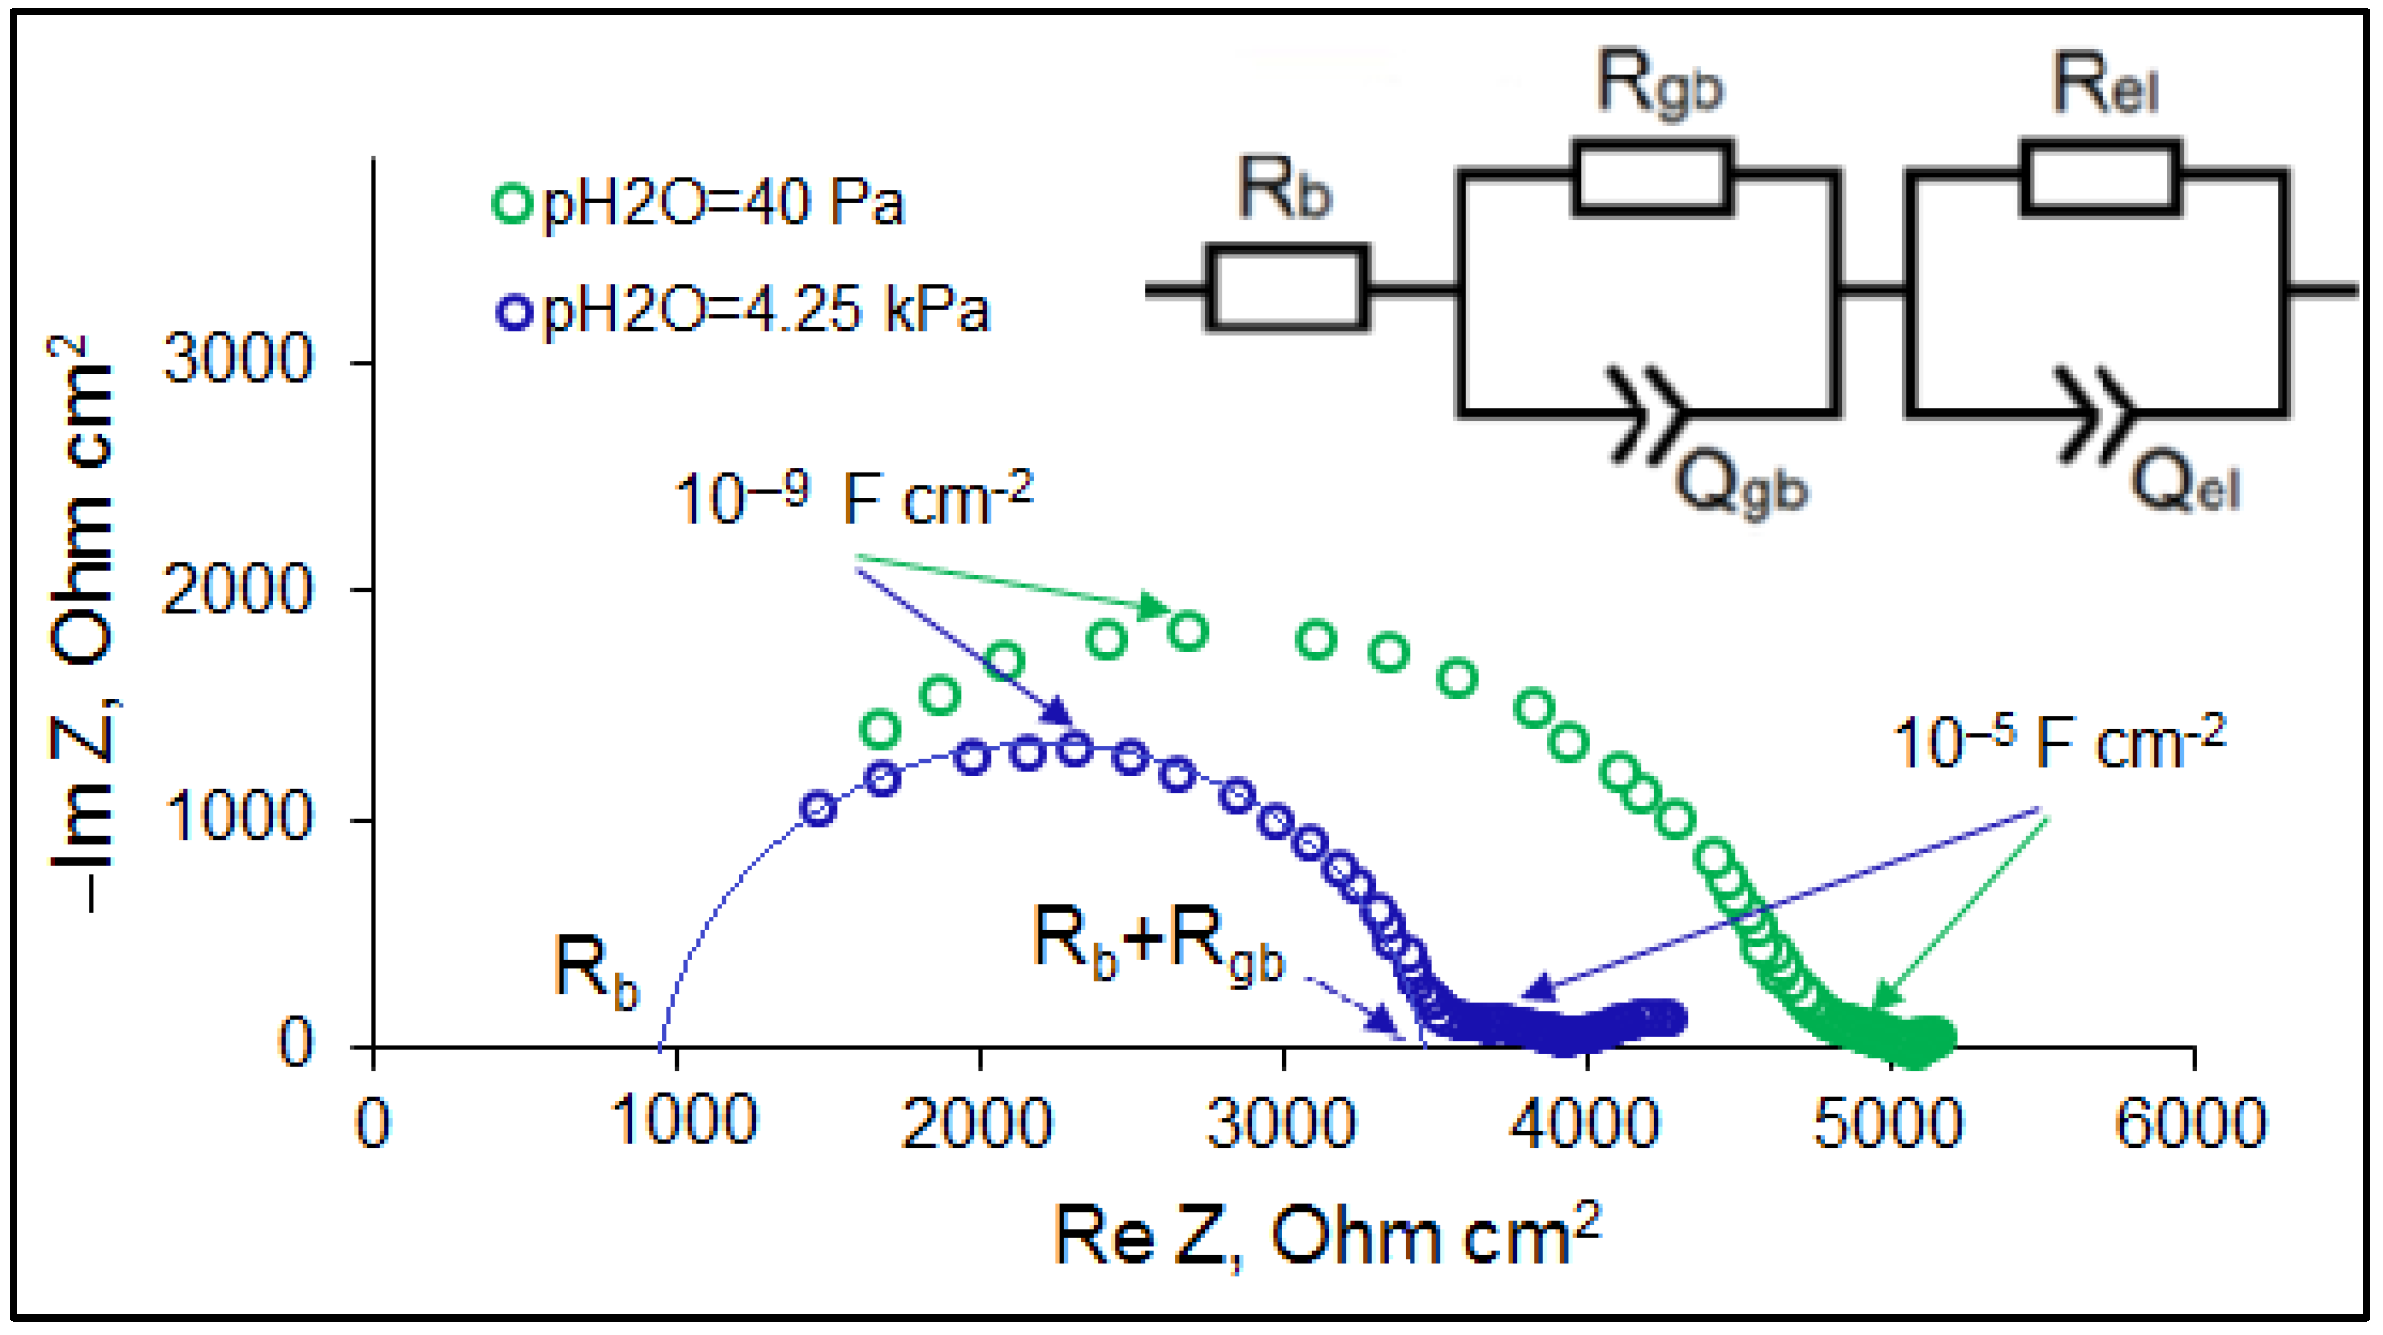
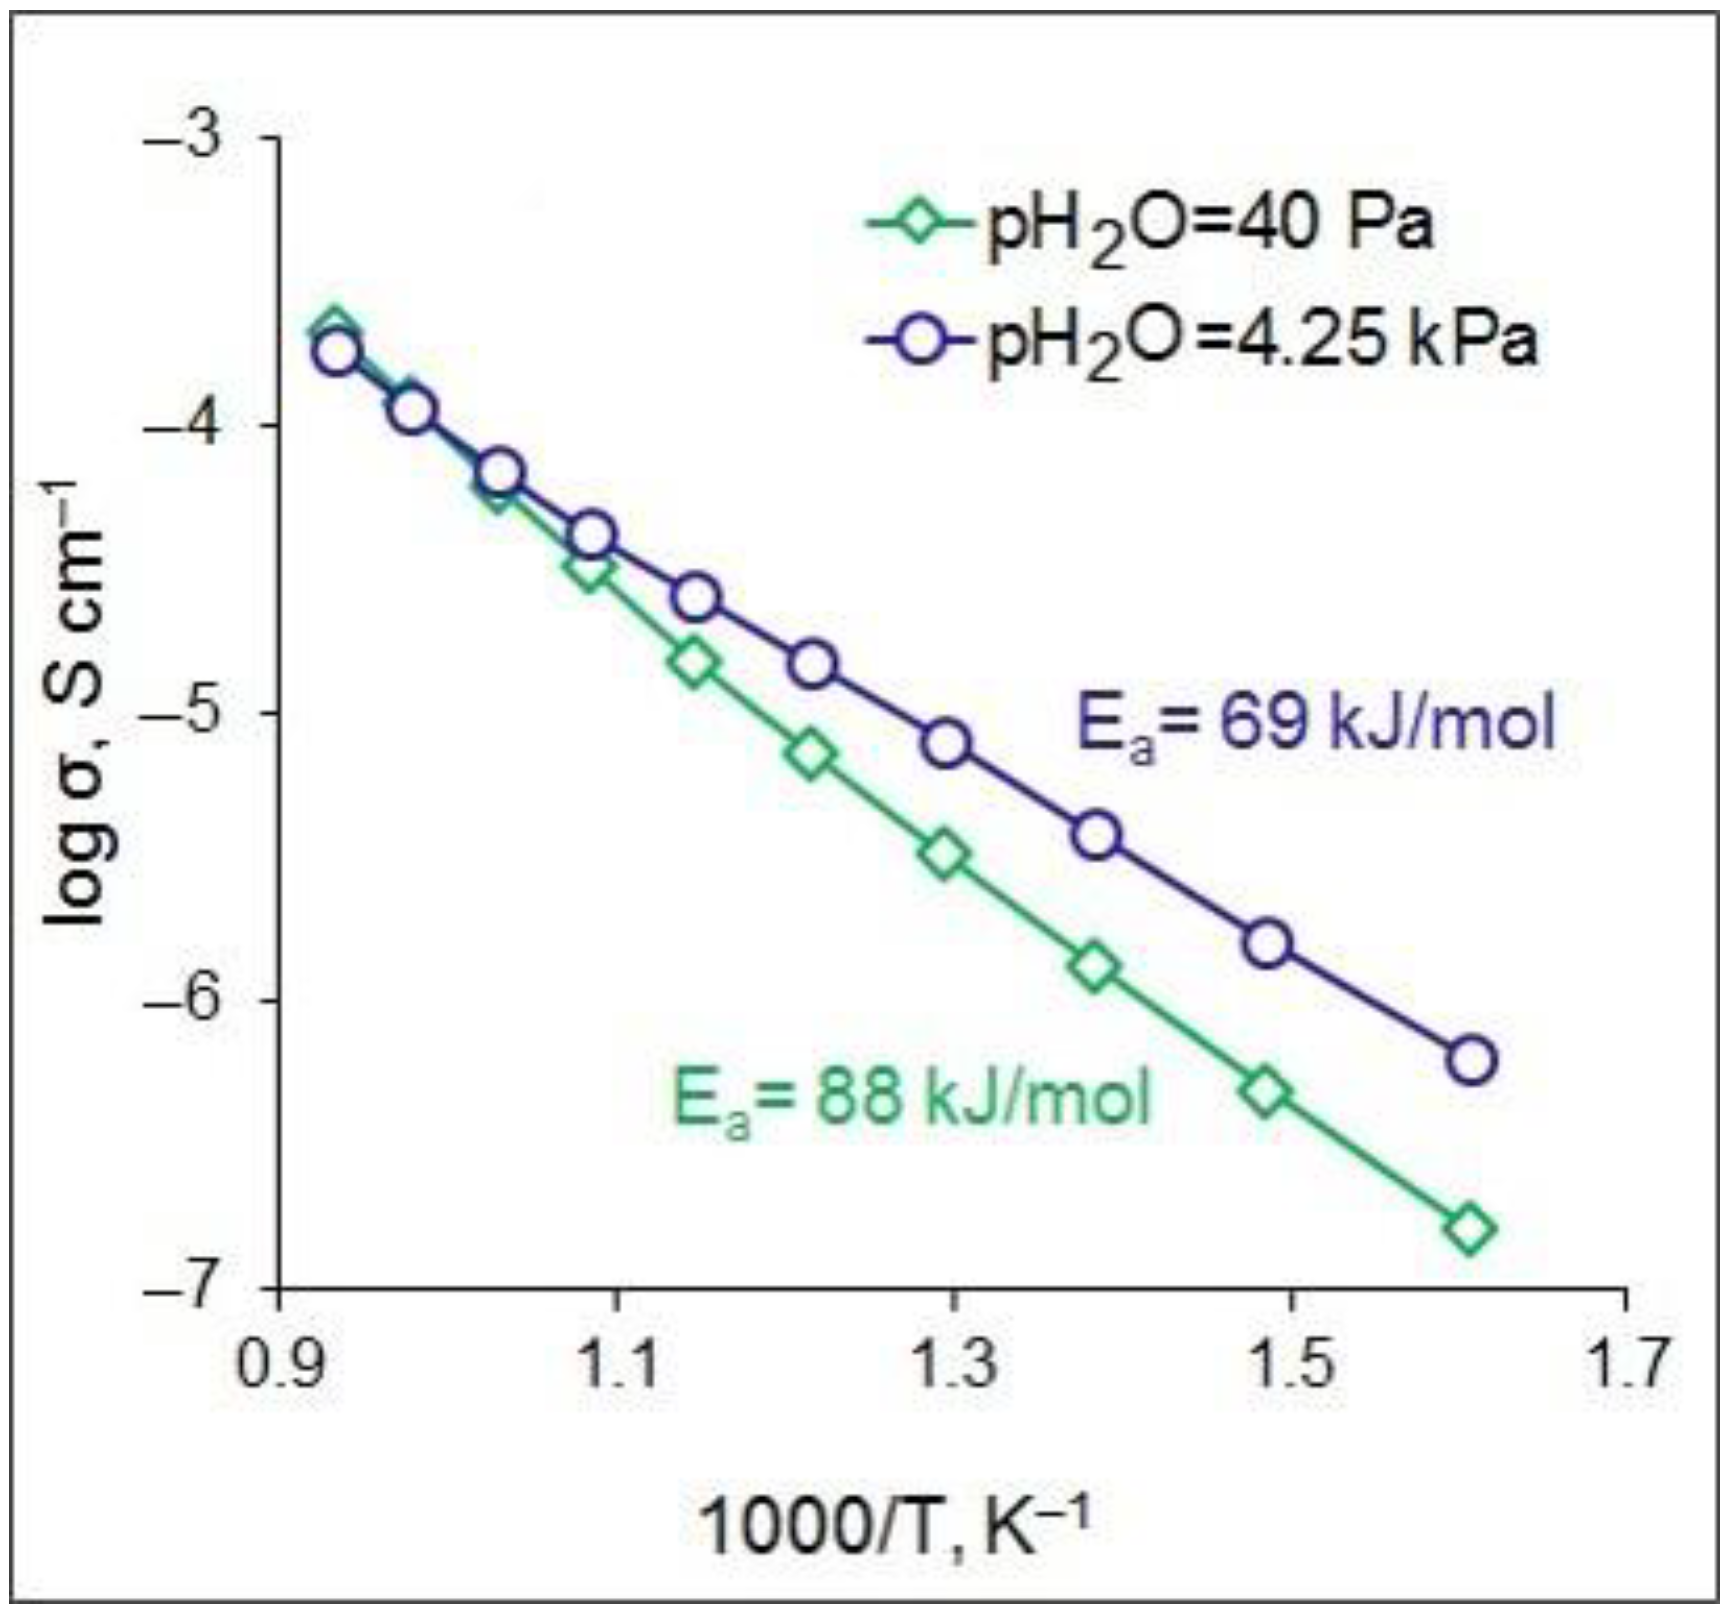
3.1. Fabrication and Characterization of CZS Ceramics

An analysis of the powder XRD pattern of CZS, which is shown in Figure 2, indicates that the sample is phase pure and has the orthorhombic structure of CaZrO3. Figure 3 presents the SEM image of CZS ceramics. As can be seen, the sample has a dense granular structure with an average grain size of 1.7 μm. The relative density of the ceramics, determined as the ratio of measured to theoretical density, was 96%. EDX mapping demonstrates the uniform distribution of elements in CZS ceramics (Figure 4). The chemical composition of the sample calculated from the EDX data was close to the target composition, namely Ca0.98Zr0.95Sc0.06O3−δ.
The impedance spectra of CZS were measured in a temperature range of 350–800 °C in dry and humid air. For illustration purposes, the hodographs obtained at 650 °C are presented in Figure 5. As can be seen, the Nyquist plots consist of an uncompleted high-frequency semicircle with a characteristic capacitance of ~10−9 F cm2, a lower-frequency arc with a characteristic capacitance of ~10−5 F cm2, and an onset of the lowest-frequency arc. Extrapolation of the uncompleted semicircle to the high-frequency region gives an intercept with the real impedance axis at a Rb value. The spectra were fitted on the basis of the equivalent circuit shown in the insert in Figure 5. The high-frequency interception, Rb, can be assigned to the grain interior response of CZS, the semicircle with a characteristic capacitance of ~10−9 F cm2 was ascribed to the response of grain boundaries, and the low-frequency arcs with a capacitance of ~10−5 F cm2 and higher were attributed to the electrode processes. In the equivalent circuit, Rb, Rgb, and Rel denote the resistances of bulk and grain boundaries of CZS, and the electrode polarization, respectively; Qgb and Qel are the related constant phase elements. The electrical conductivity σ of CZS was determined as follows:
σ = h R S
where h is the thickness of the CZS pellet, S is the electrode area, and R is the resistance of CZS which is a sum of Rb and Rgb.
The Arrhenius plots of the conductivity of CZS are presented in Figure 6. The dependences are close to linear; the calculated values of the activation energy are 88 and 69 kJ/mol in dry and humid air, respectively. At high temperatures (>700 °C), the conductivity does not change with variation of humidity; however, with temperature decrease, the conductivity increases with an increase in the water vapor partial pressure. This is typical of the conductivity of proton-conducting oxides, which is explained by the hydration of the oxides with the formation of proton defects [19,20]. From the obtained results it follows that, in dry air, the ionic conductivity of CZS is due to the motion of oxygen ions while, in humid air, at temperatures below ~700 °C, protons contribute significantly to charge transfer. Therefore, the CZS ceramic is applicable to the sensors, which operate in the mode described in Section 2.3 in the temperature range of 600–700 °C.

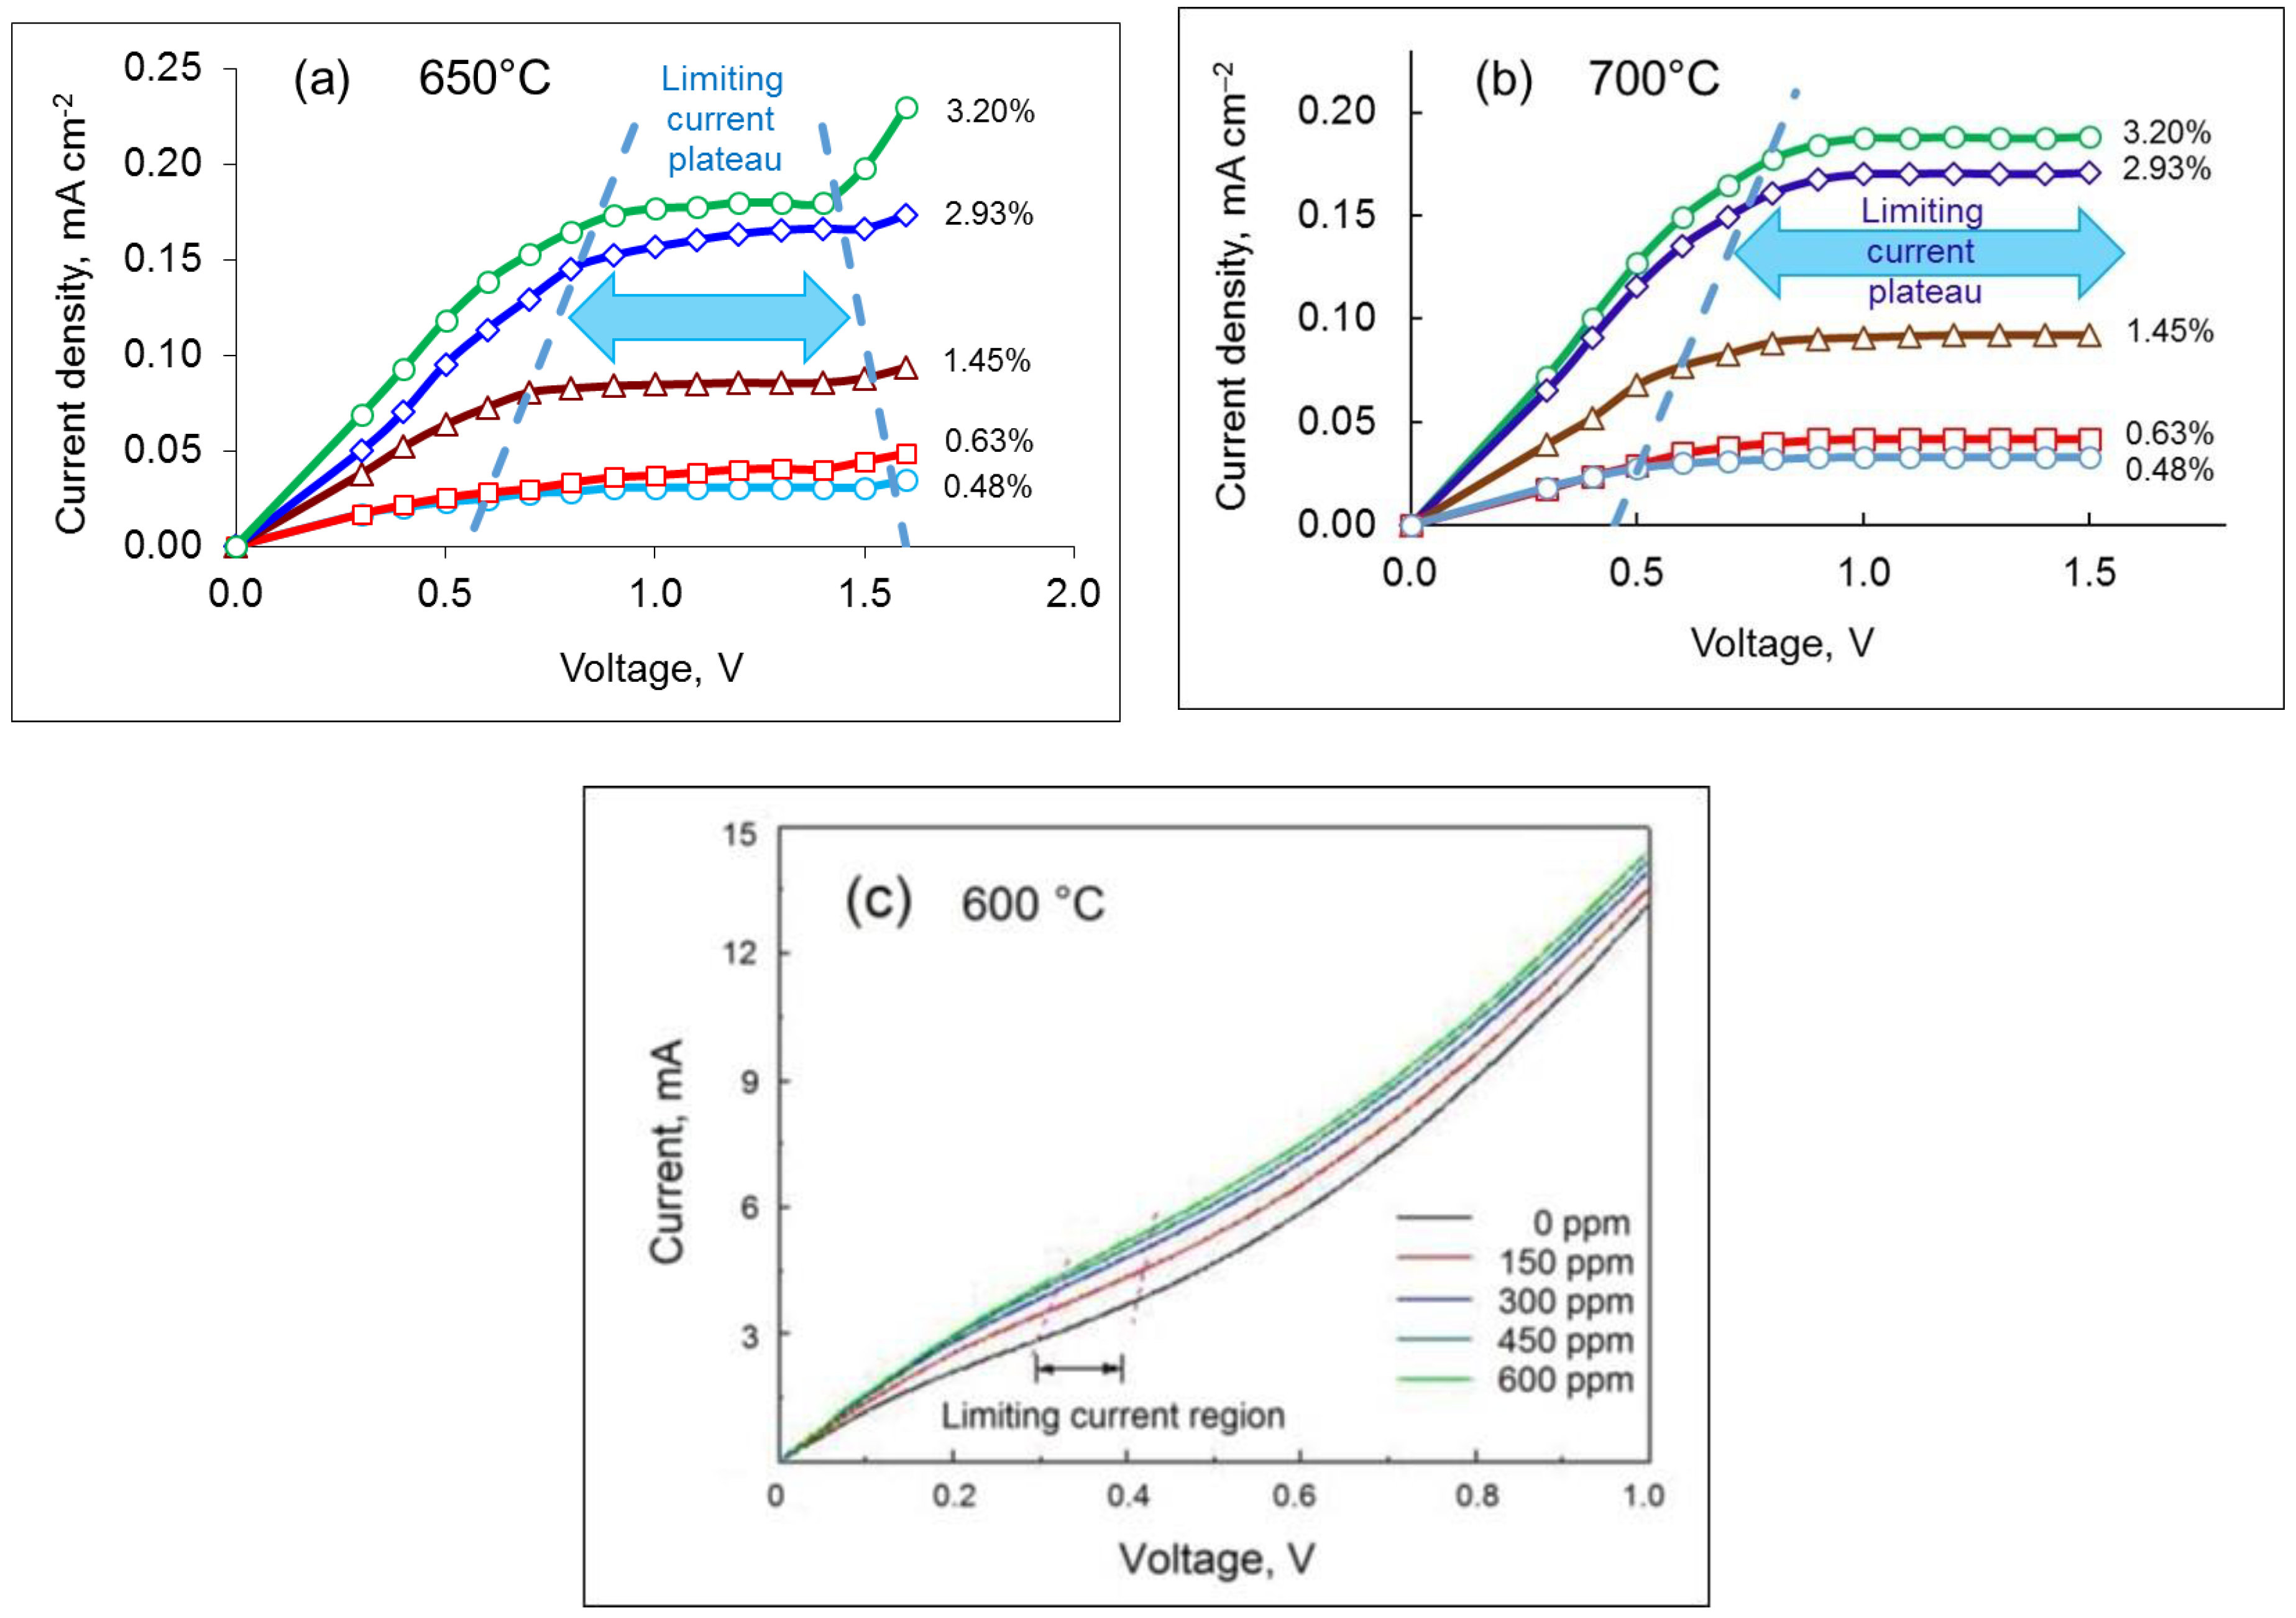
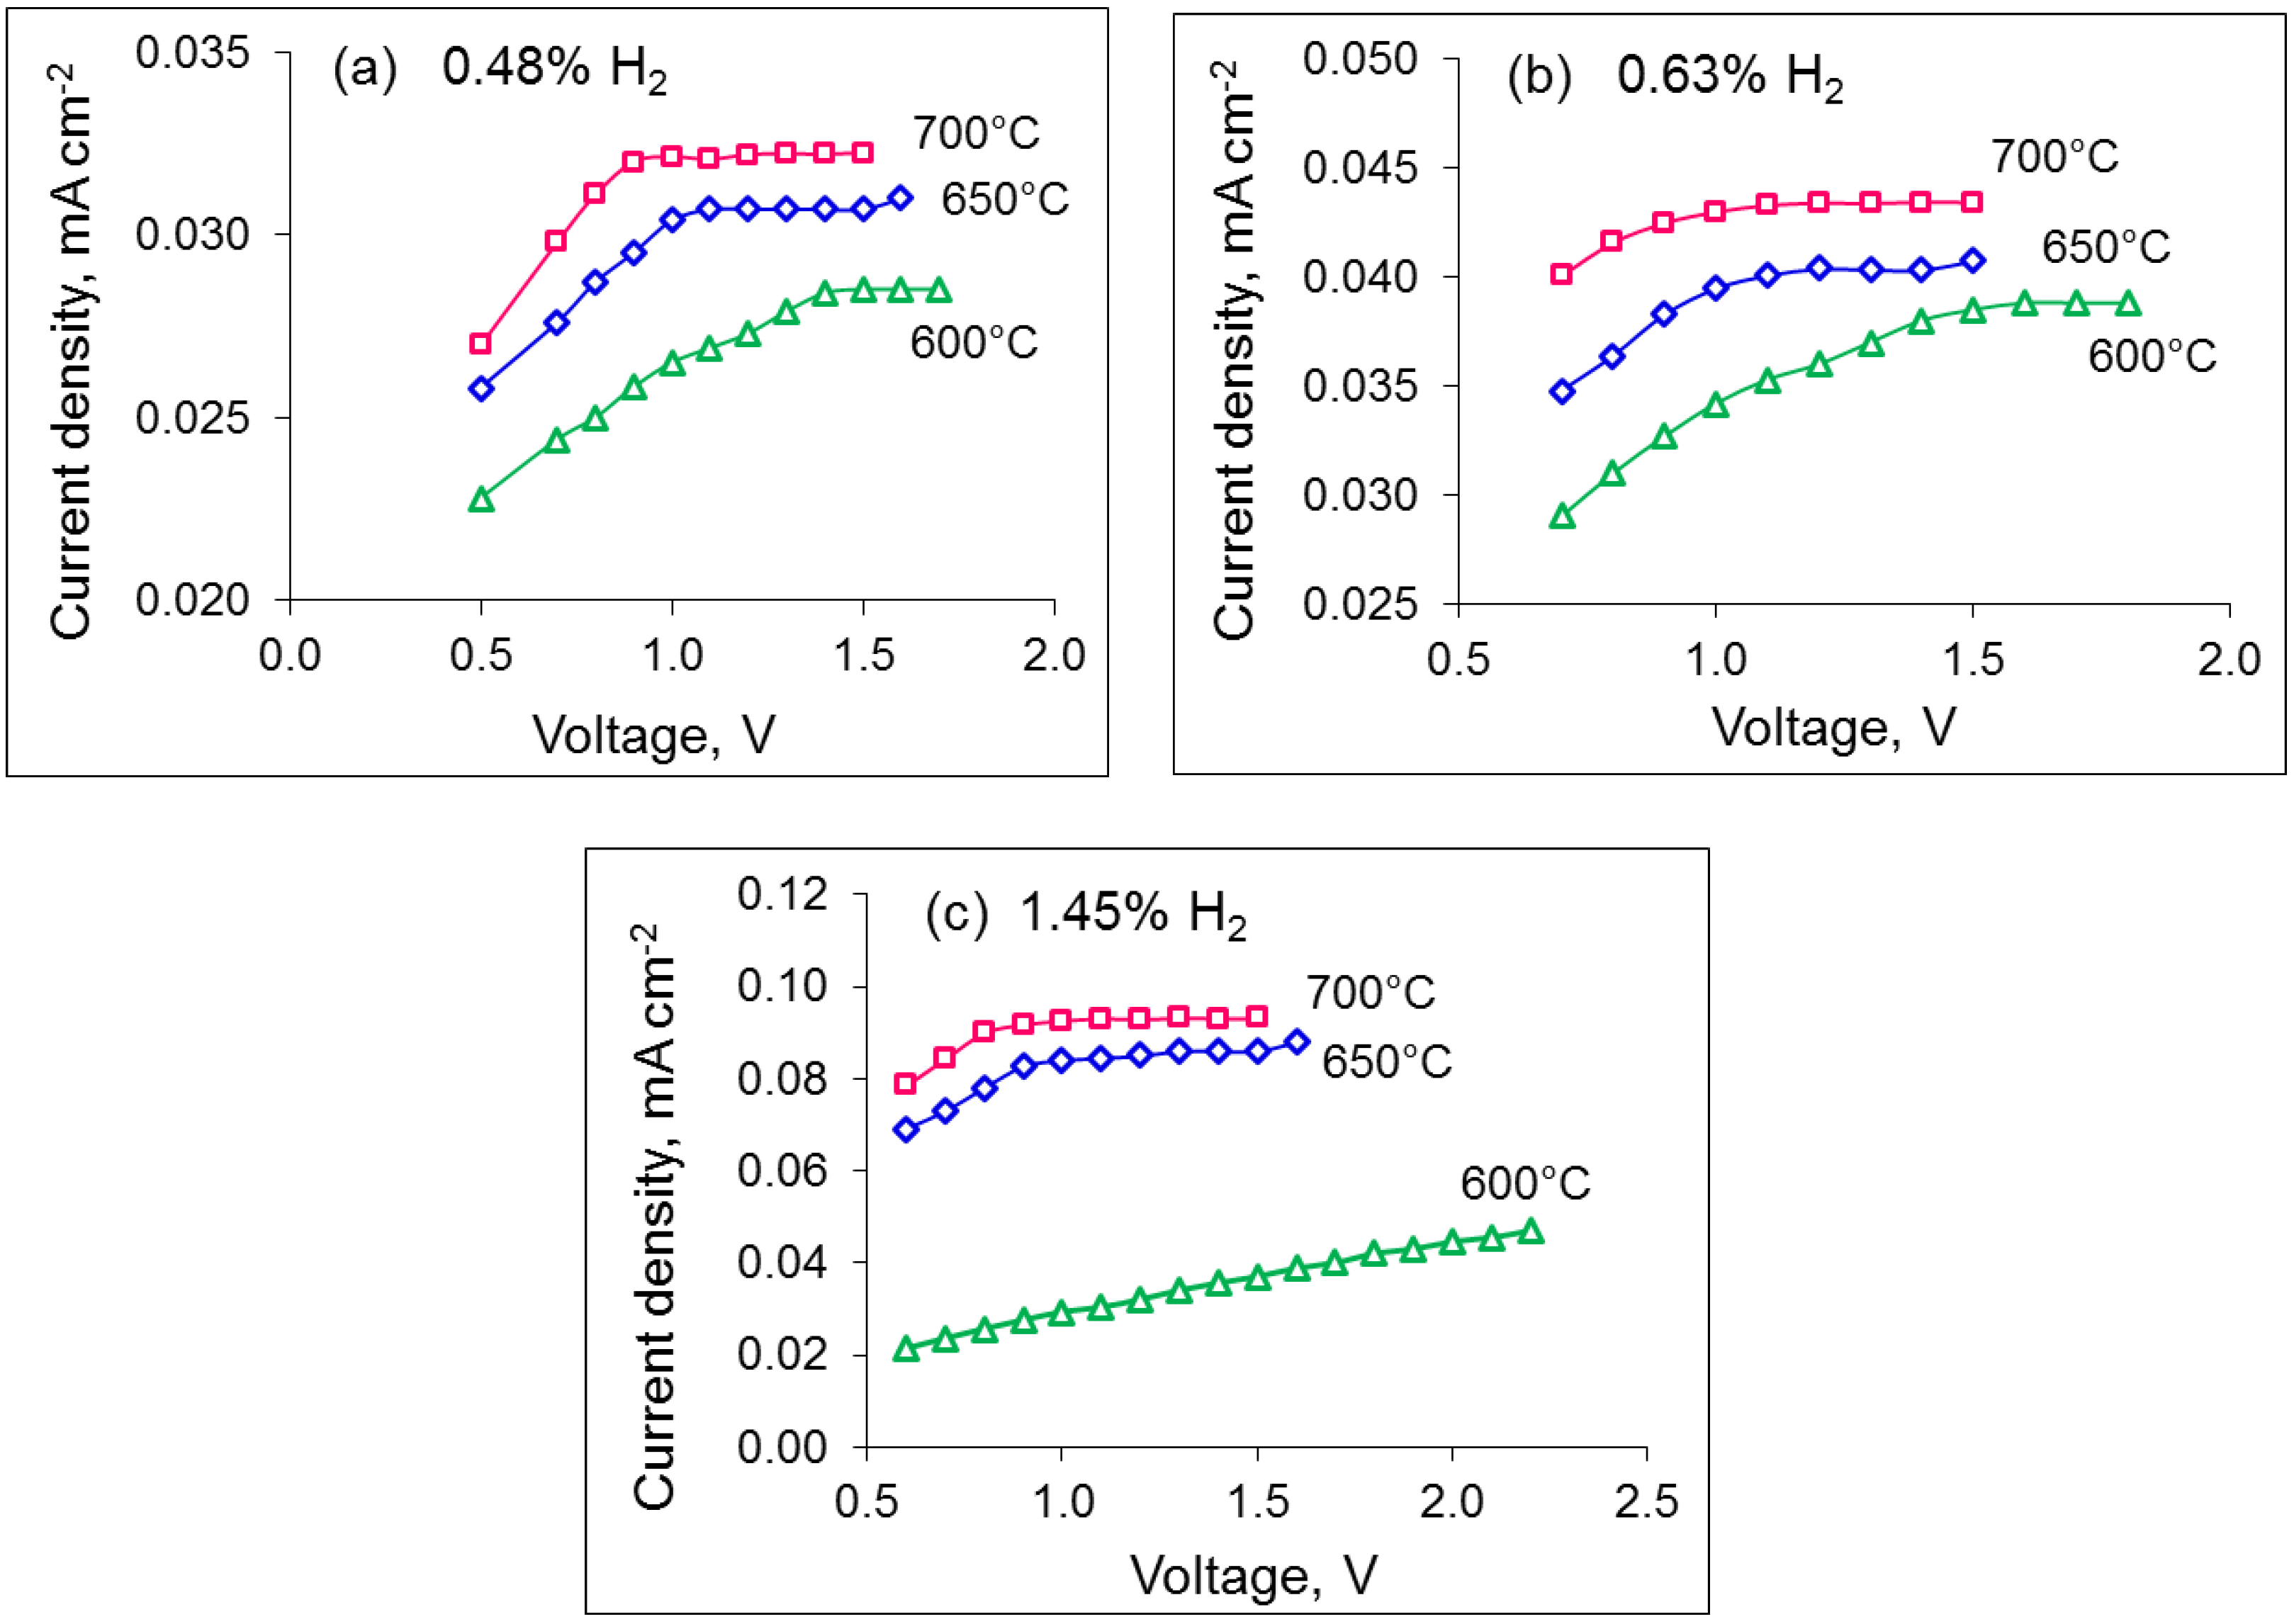
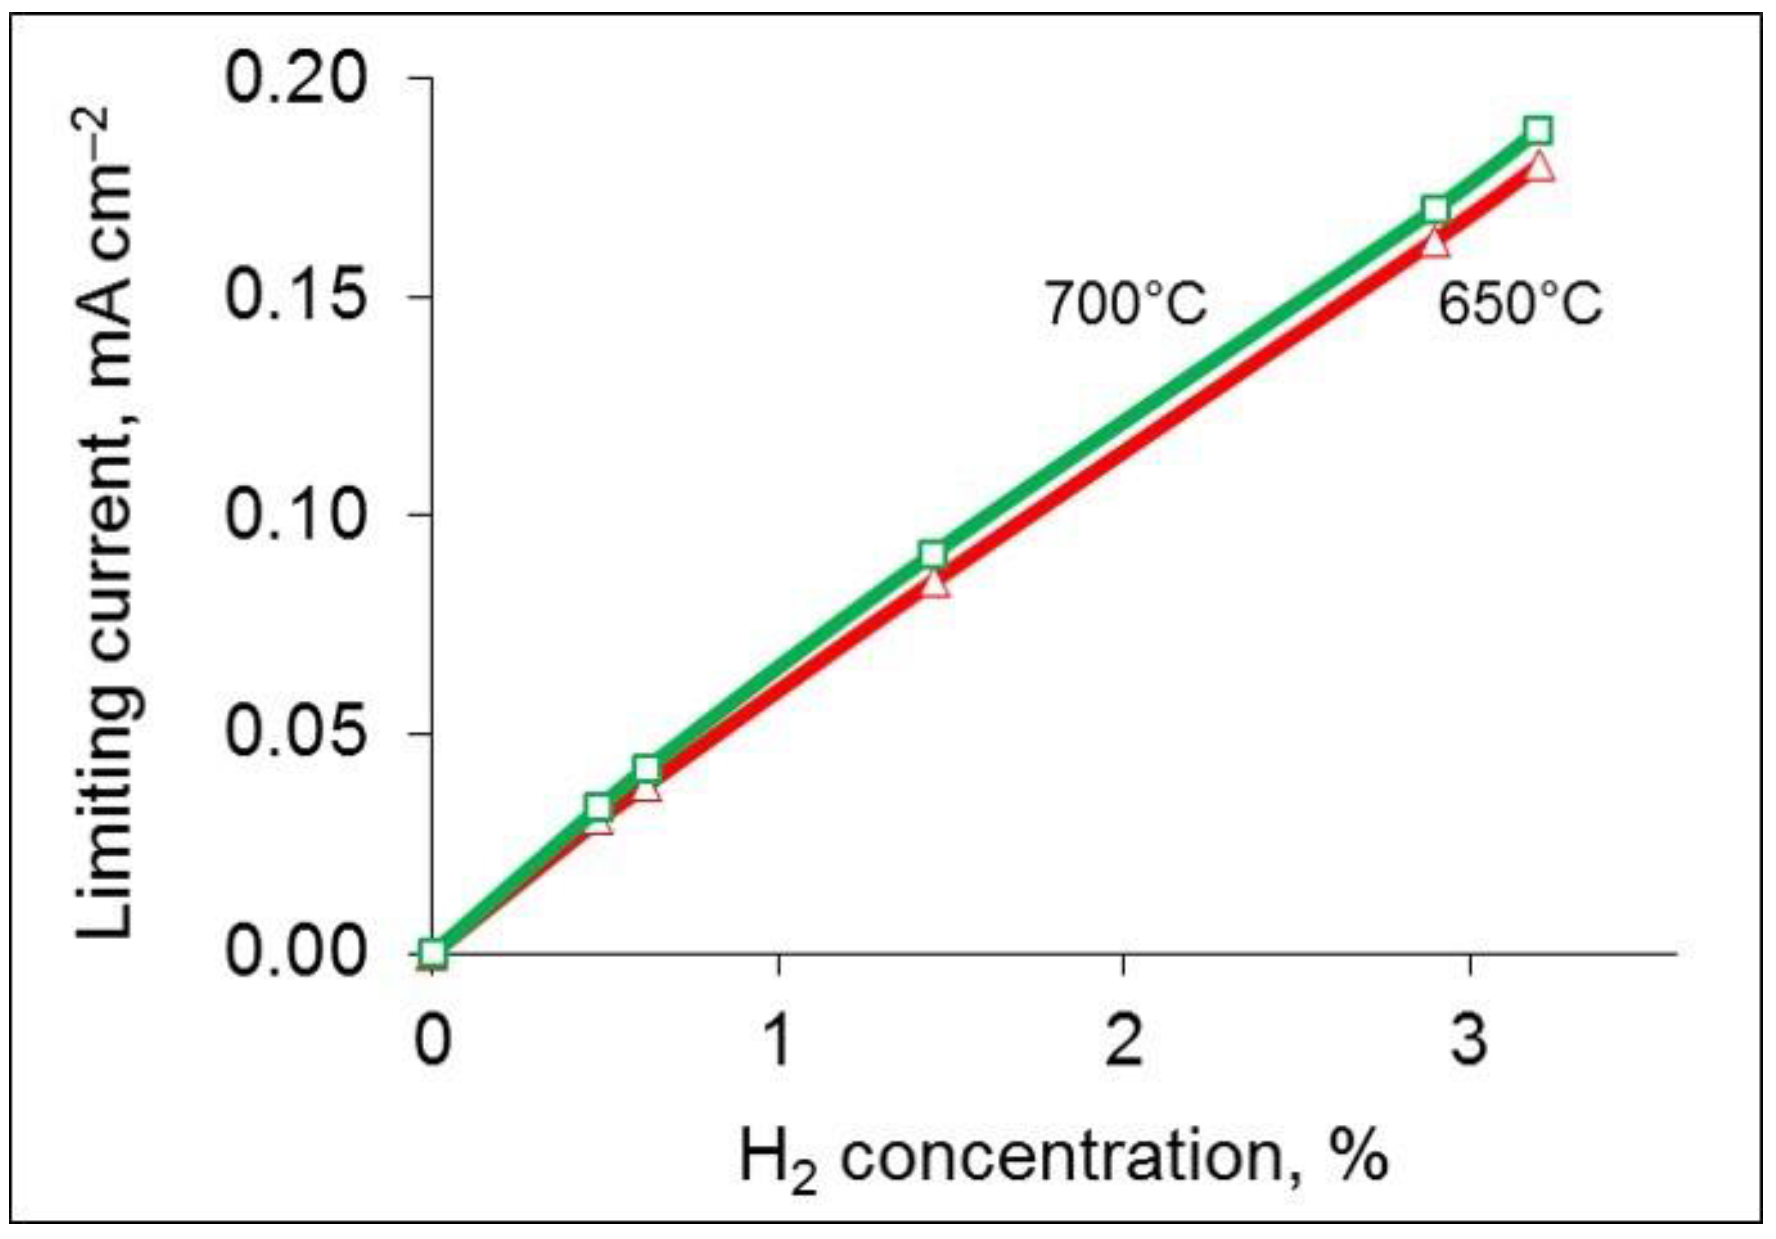
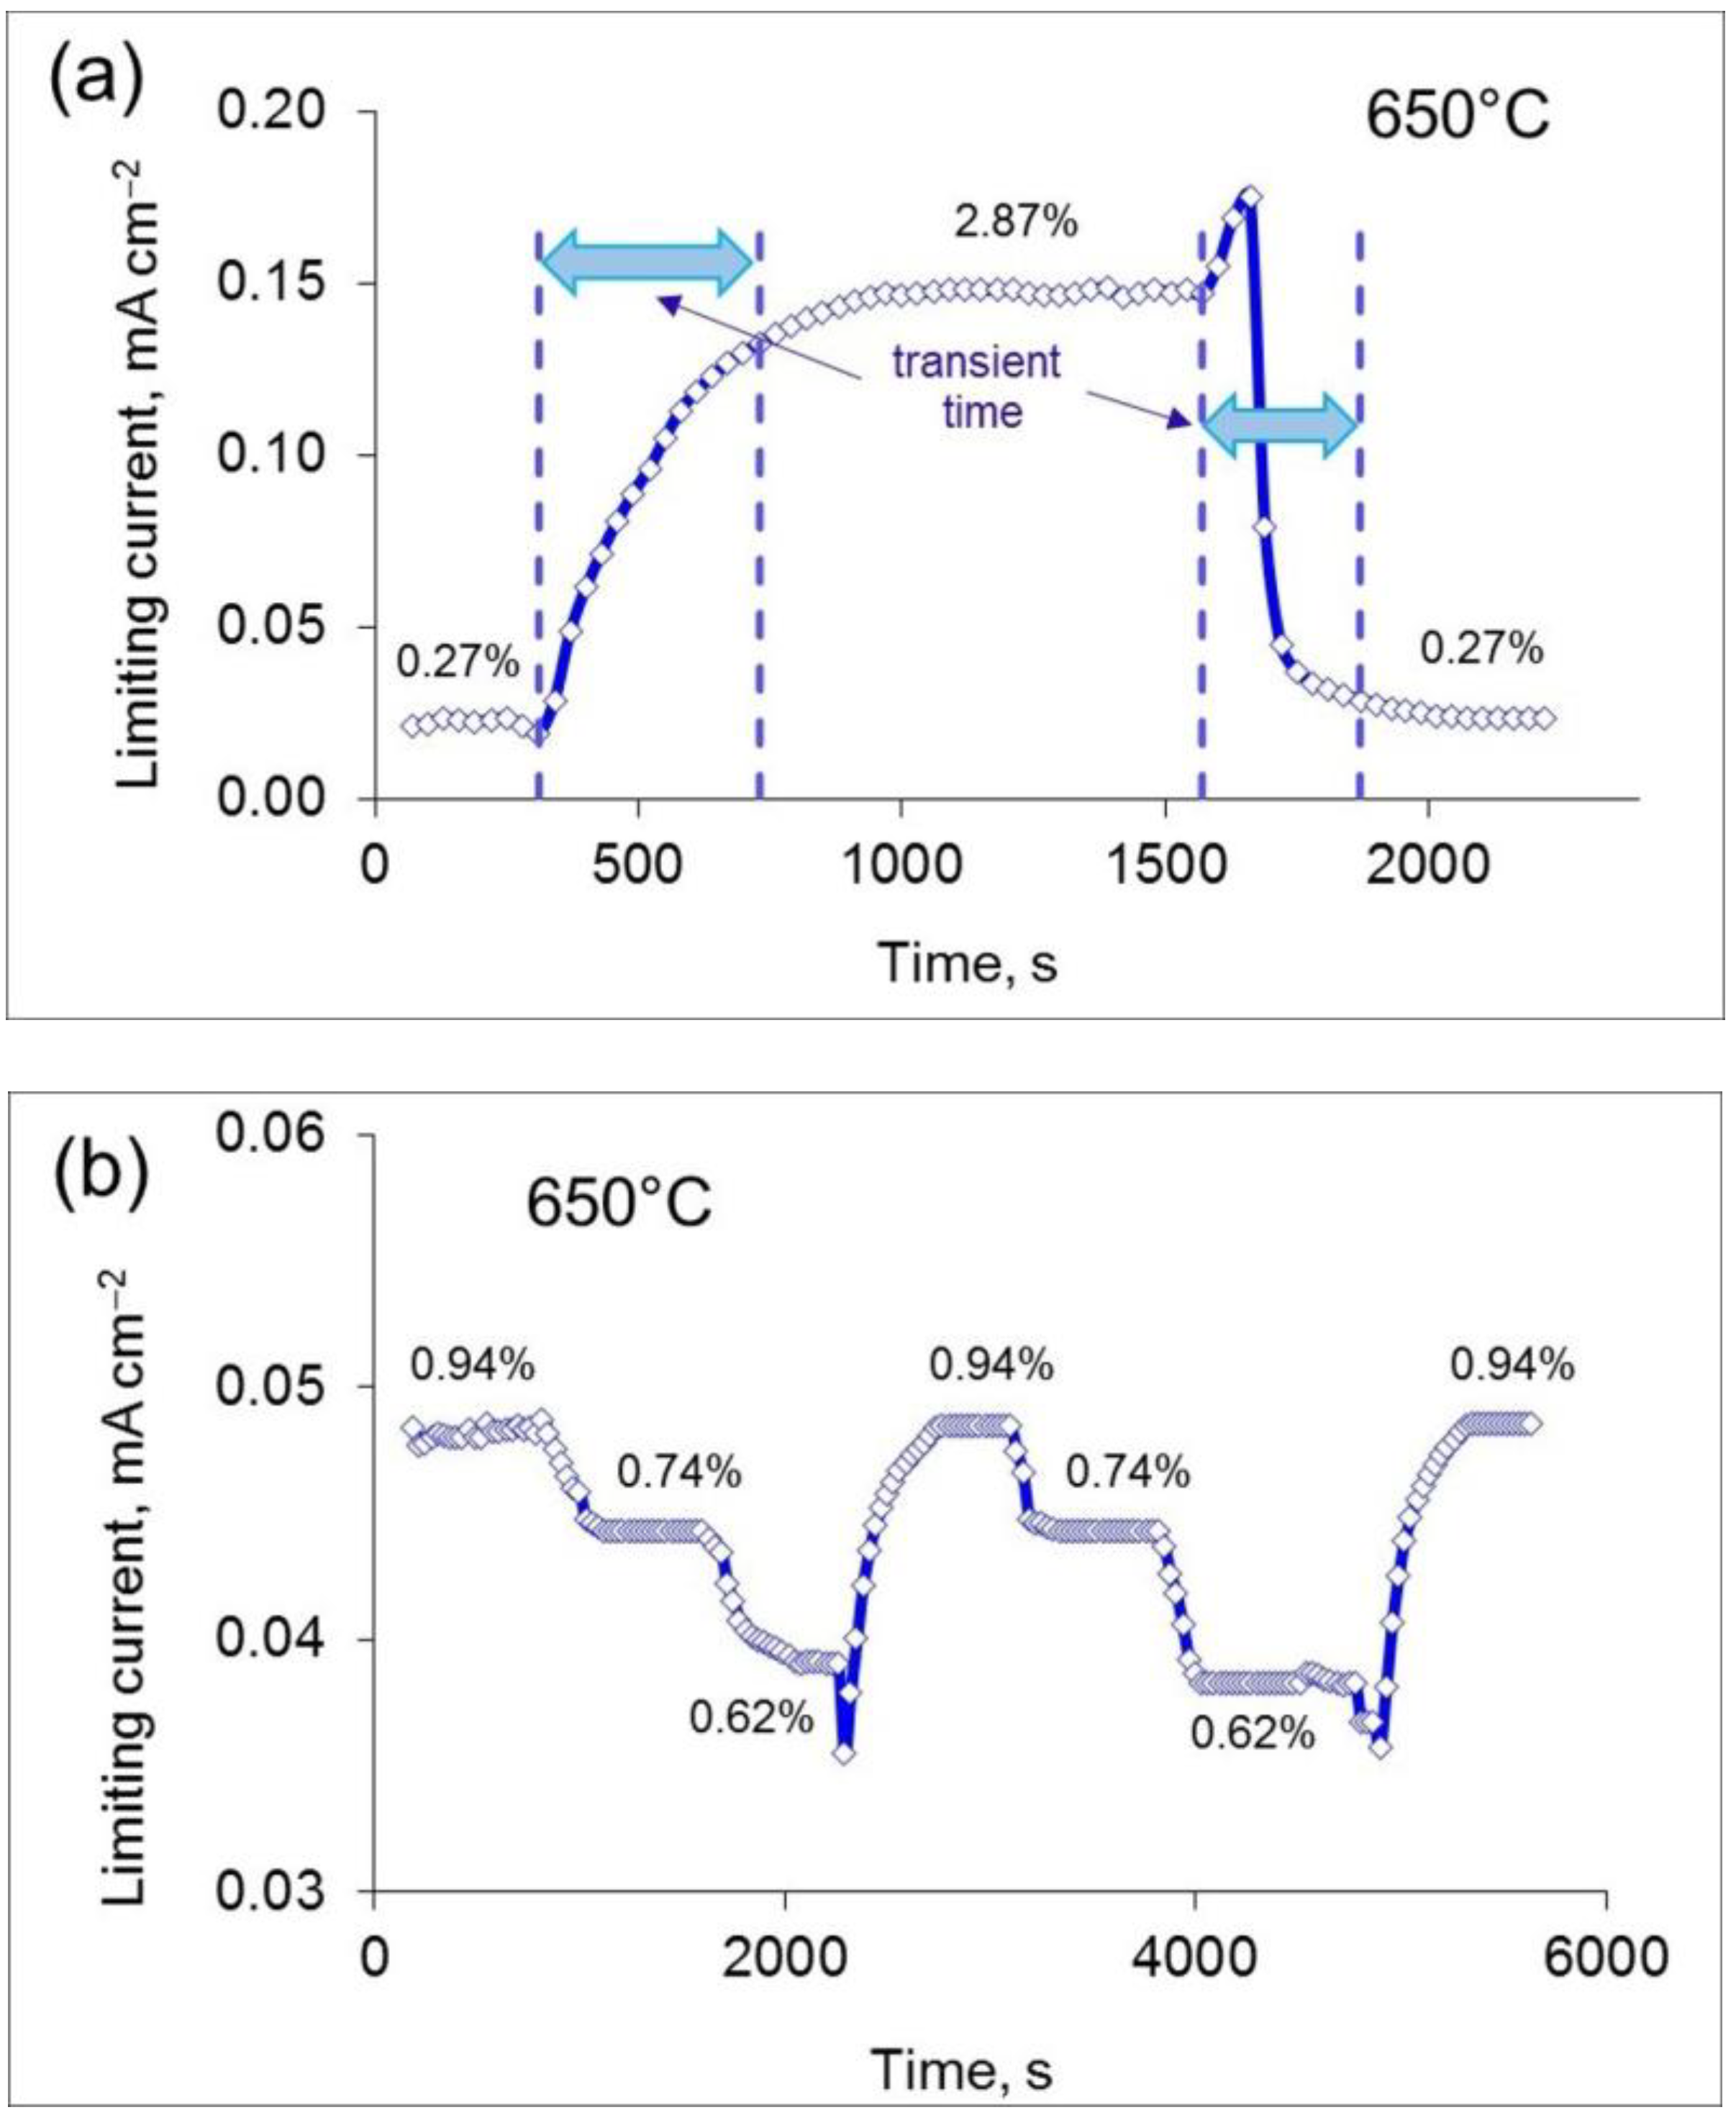
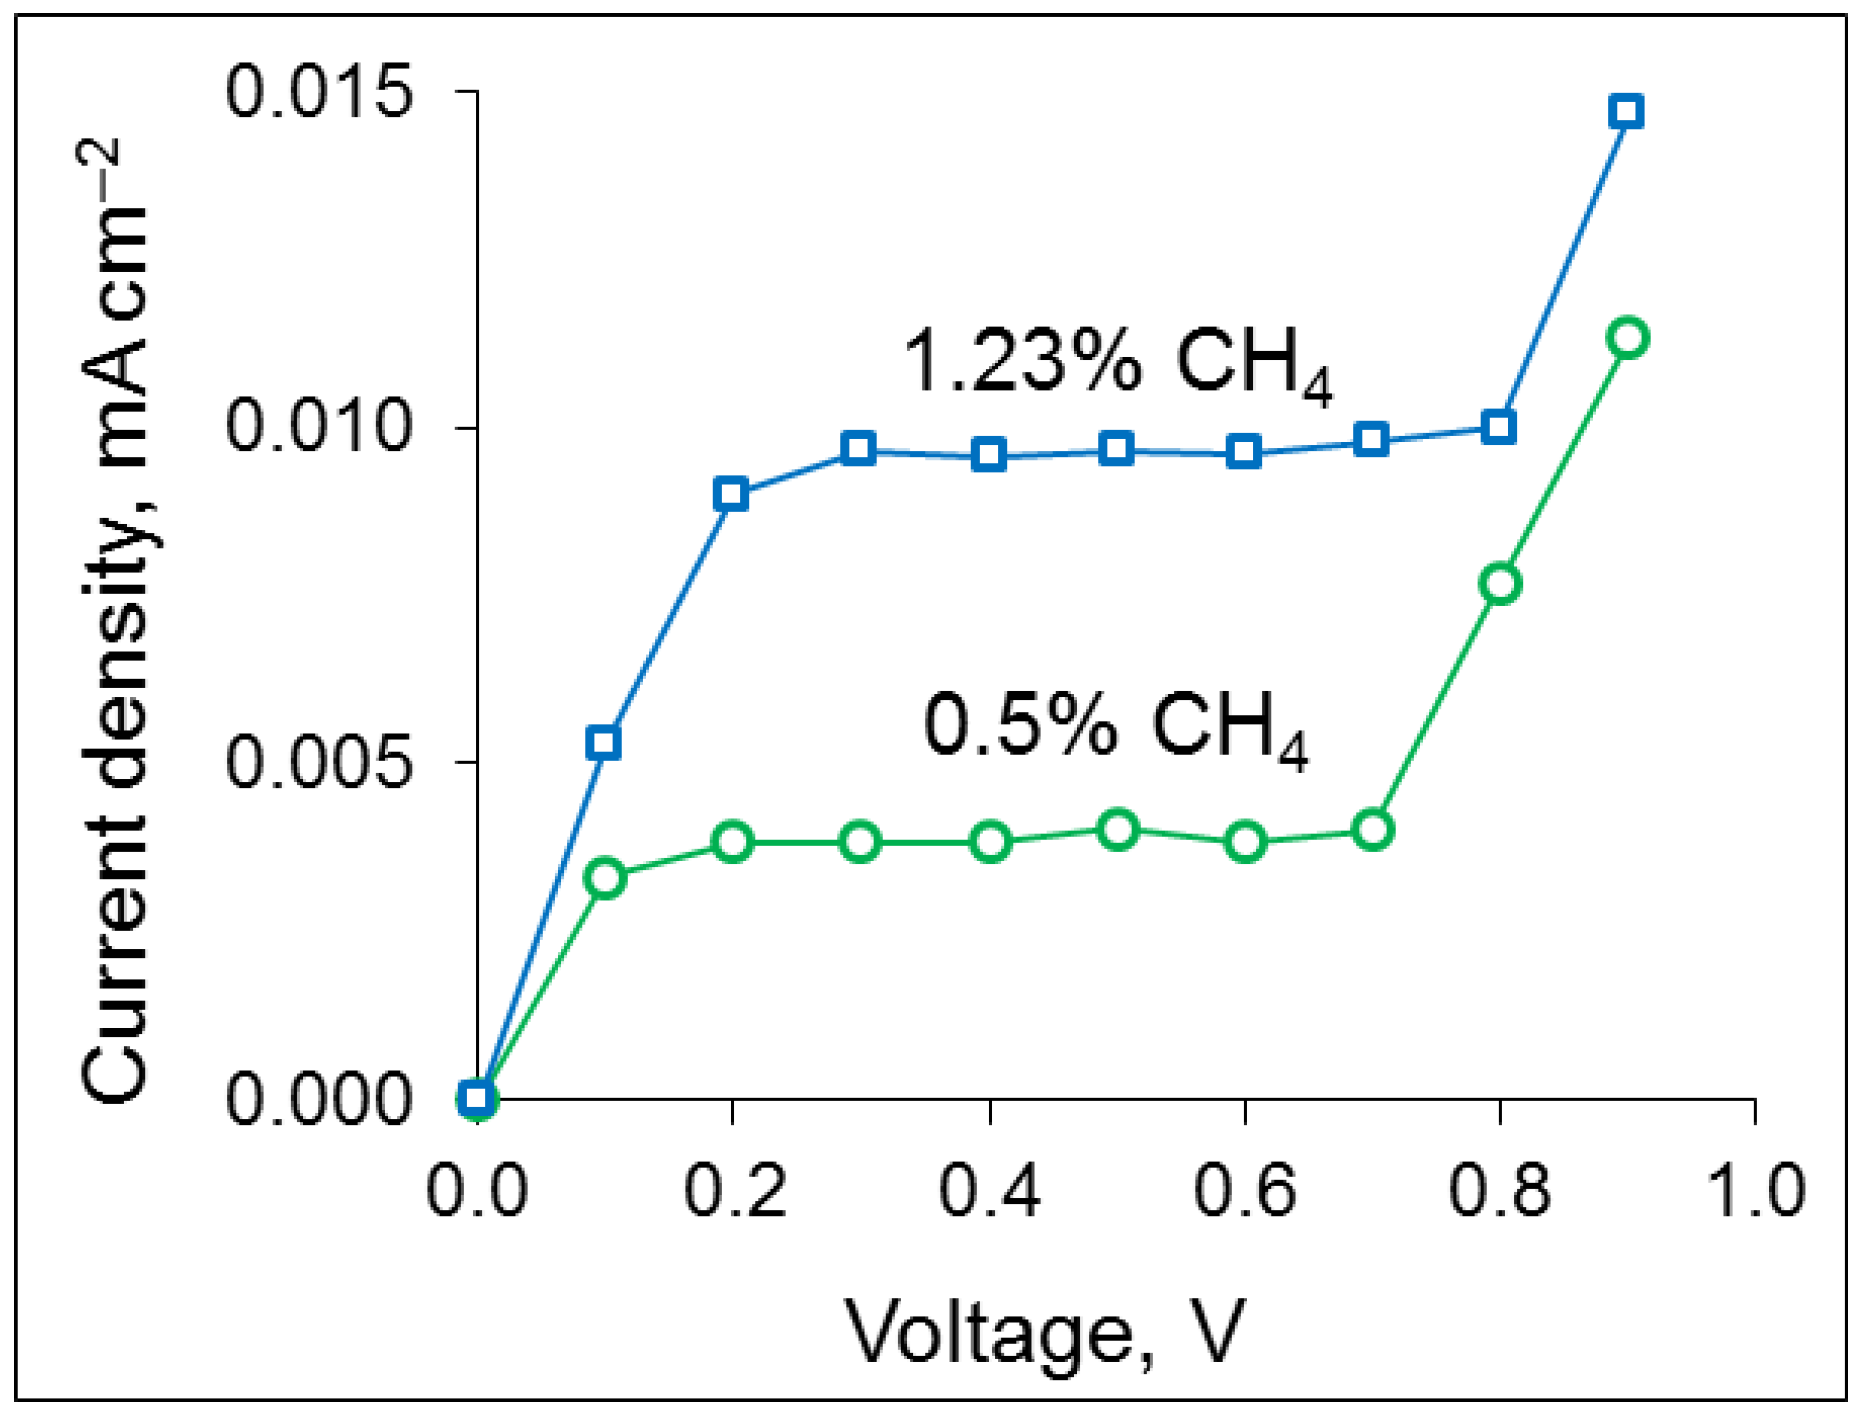
3.2. Sensor Performance

The fabricated sensor was tested in the temperature range of 600–700 °C. The current vs. voltage dependences measured in the air + H2 mixtures with different H2 concentrations are presented in Figure 7. As can be seen, at low applied voltages, the sensor current increases with an increase in voltage until the voltage reaches a certain value; then, a plateau, also known as a limiting current, is observed, which corresponds to the stationary state, where the diffusion of hydrogen determines the rate of hydrogen pumping out. At high applied voltages, the current increases again (see Figure 7a); this is a typical characteristic of solid-oxide amperometric sensors, and is supposed to be caused by the electrolyte decomposition and generation of electron charge carriers under high applied voltages [7,15,16,17,18].
With increasing hydrogen concentration, the voltage from which the limiting current plateau begins increases. The reasons for this are as follows: (i) the more hydrogen must be pumped out of the inner chamber, the greater the voltage that must be applied to reach the diffusion-controlled stationary state; (ii) the polarization resistance of Pt electrodes increases with an increase in the water vapor partial pressure in air (see Figure 5), (iii) since hydrogen at high temperatures turns into water according to Reaction (1), and an increase in water concentration leads to an increase in polarization losses at the electrodes, then a higher voltage is required to maintain a given current.
The advantage of the developed sensor is the severity of the limiting current plateau, which is wide (>0.5 V) and nearly horizontal in contrast to the solid-oxide amperometric hydrogen sensor reported in [17] (see Figure 7c). This can be explained by the use of an inert alumina capillary as a diffusion barrier, the properties of which do not vary with changes in gas composition. The sensor reported in [17] was composed of a BaHf0.7Sn0.1In0.2O3−δ proton electrolyte layer and a BaHf0.8Fe0.2O3−δ proton-electron mixed conductor layer as a dense diffusion barrier. In this sensor, the diffusion flux of hydrogen is controlled by the ambipolar conductivity of the mixed conductor, which can vary with changing gas composition. It is probably for this reason that the limiting current plateau of this sensor was narrow (about 0.1 V) and not horizontal, which negatively affects the accuracy of hydrogen measurement.
Figure 8 presents the current–voltage curves, measured in air + H2 mixtures with a fixed H2 concentration at different temperatures. With temperature decrease, the limiting current plateau shifts to higher voltages, which is caused by the decreasing conductivity of the CZS electrolyte. An increase in the hydrogen concentration leads to the same effect as was discussed above. As a result, when the hydrogen concentration increases to 1.45% and the temperature decreases to 600 °C, the limiting current is not observed up to a voltage of 2.2 V (see Figure 8c). In addition, the low conductivity of the electrolyte at low temperatures negatively affects the response time of the sensor. Given the above reasons, lowering the operating temperature of the sensor below 650 °C is undesirable.
Figure 9 displays the limiting currents as a function of H2 concentration in air at 650 and 700 °C. The limiting current linearly increases with the hydrogen concentration, which is convenient for the sensor calibration. The sensor demonstrates good sensitivity of ~56 μA per 1% H2 at 650 °C and ~60 μA per 1% H2 at 700 °C, which exceeds the characteristics of a sensor having the similar design but made of YSZ electrolyte with oxide ion conductivity, developed in [15]: ~44 μA per 1% H2 at 700 °C.
It should be noted that if the analyzed mixture of air with hydrogen contains water vapor, after heating this mixture to the operating temperature of the sensor, the concentration of water vapor in it will be equal to the sum of the concentrations of water vapor and hydrogen in the initial gas. Therefore, the sensor limiting current will correspond to the water vapor concentration in the “hot” gas. To calculate the hydrogen concentration in the analyzed (“cold”) gas, it is necessary to subtract the concentration of water vapor in the “cold” gas from the concentration of water vapor in the “hot” gas. This requires measuring the water vapor content of the analyzed gas using, for example, a humidity sensor. Moreover, the designed sensor can be used for measuring the H2O concentration in air as described in [24].
To evaluate the reproducibility of the sensor designed in the present research, the dynamic response of the sensor response to the step-wise variations in H2 concentration in air was studied at 650 °C. As can be seen in Figure 10, the sensor signal is well reproduced, with a scatter of less than 1%. The transient time of the sensor, or the time required for a 90% change in the sensor signal after H2 concentration shift, was 420 s and 300 s at the variations of H2 concentration from 0.27% to 2.87% and vice versa, respectively (see Figure 10a), which matches the requirements for practical use. Nonetheless, the transient time can be decreased by reducing the thickness of the CZS ceramic, and thus decreasing its resistance. However, it should be mentioned that it is necessary to find a compromising solution between reducing the thickness and maintaining the gas tightness of the electrolyte.
One of the basic properties of a sensor is selectivity. The selectivity properties of the CZS-based sensor were tested in the air–CO and air–CH4 mixtures. It was found that the presence of CO does not affect the sensor readings, which is explained by the inertness of the proton-conducting electrolyte to CO. Since the operation principle of the sensor is based on the use of a proton-conducting electrolyte, the sensor should respond to the presence of other hydrogen-containing gases, in addition to hydrogen. To demonstrate the effect of methane in the air on the sensor readings, the current–voltage curves measured in the air–methane mixtures at the methane concentrations of 0.5% and 1.23% are presented in Figure 11. Comparing Figure 7b and Figure 11, one can see that in the presence of methane in the analyzed gas at concentrations comparable with hydrogen, the limiting current values are an order of magnitude smaller. Therefore, the CZS-based sensor has good selectivity properties.
Long-term stability is an important characteristic of a gas sensor. Long-term testing of the sensor in the mixture of air with 2.93% H2 at 700 °C is now in progress. Figure 12 displays the results of the long-term testing with periodic power outages in the mixture of air with 2.93% H2 at 700 °C As can be seen, the sensor readings are stable for 8050 h, with a scatter of no more than 2%.
It should be noted that the use of a proton-conducting electrolyte allows to simplify the measurement of hydrogen by comparison with the sensor based on an oxide-ion electrolyte. As was reported in [15], to determine the hydrogen concentration with the help of a YSZ-based sensor, the limiting currents in the analyzed air and in the preliminary dried air are to be measured, and then the hydrogen concentration can be calculated from these limiting current values. Along with CZS, other proton-conducting electrolytes can be used, and the selection criteria are a high conductivity, chemical stability and high density.

4. Conclusions

A limiting-current solid-oxide sensor with a CZS proton-conducting electrolyte for the measurement of H2 concentration in air was designed. Dense CZS ceramics for the sensor were fabricated through uniaxial pressing of the powder synthesized by the solid-state method and sintering at 1650 °C for 2 h. Studying the electrical conductivity of CZS showed that, in humid air, at temperatures below ~700 °C, CZS has significant proton conductivity.
The sensor had a simple design: it was made from two CZS ceramic plates, one of which had a cavity forming the inner chamber, pressed against each other and sealed around the perimeter to prevent gas leaking. An alumina ceramic capillary connecting the inner chamber of the sensor with the outer atmosphere was used as a diffusion barrier. The sensor performance was studied in the temperature range of 600–700 °C in the mixtures of air with hydrogen. The current–voltage curves exhibited a wide limiting current plateau, and the limiting current was found to linearly increase with the hydrogen concentration. This opens up the possibility of reliably determining the hydrogen concentration in air. It was shown that the sensor effectively operated in the air +H2 mixtures (0.48–3.20% H2) in the temperature range of 650–700 °C; however, with decreasing temperature to 600 °C, in the gas mixtures with high H2 concentrations (≥1.45%), the limiting current was not observed in the studied range of voltage (up to 2.2 V). Thus, lowering the operating temperature of the sensor below 650 °C is not recommended. The sensor demonstrated a good sensitivity of ~60 μA per 1% H2 at 700 °C and ~56 μA per 1% H2 at 650 °C, an acceptable response time (420 s after variations of H2 concentration from 0.27% to 2.87%), a high reproducibility, good selectivity properties, and long-term stability. The obtained characteristics of the sensor match the requirements for practical use.

Author Contributions

Conceptualization, A.V.; methodology, A.K., A.V. and L.D.; investigation, A.K. and L.D.; data curation, A.V. and L.D.; writing—original draft preparation, A.V.; writing—review and editing, L.D.; visualization, L.D.; supervision, A.V. All authors have read and agreed to the published version of the manuscript.

Funding

This research received no external funding.

Data Availability Statement

Not applicable.

Acknowledgments

SEM and XRD experiments were carried out using the facilities of the shared access center “Composition of compounds” (Institute of High-Temperature Electrochemistry, Ural Branch of the Russian Academy of Sciences).

Conflicts of Interest

The authors declare no conflict of interest.

References

  1. Gu, H.; Wang, Z.; Hu, Y. Hydrogen gas sensors based on semiconductor oxide nanostructures. Sensors 2012, 12, 5517–5550. [Google Scholar] [CrossRef] [PubMed]
  2. Ndaya, C.C.; Javahiraly, N.; Brioude, A. Recent advances in palladium nanoparticles-based hydrogen sensors for leak detection. Sensors 2019, 19, 4478. [Google Scholar] [CrossRef] [PubMed]
  3. Alam, M.Z.; Carriere, N.; Bahrami, F.; Mojahedi, M.; Aitchison, J.S. Pd-based integrated optical hydrogen sensor on a silicon-on-insulator platform. Opt. Lett. 2013, 38, 1428–1430. [Google Scholar] [CrossRef] [PubMed]
  4. Darmadi, I.; Nugroho, F.A.A.; Langhammer, C. High-performance nanostructured palladium-based hydrogen sensors—Current limitations and strategies for their mitigation. ACS Sens. 2020, 5, 3306–3327. [Google Scholar] [CrossRef] [PubMed]
  5. Wright, J.S.; Lim, W.; Norton, D.P.; Pearton, S.J.; Ren, F.; Johnson, J.L.; Ural, A. Nitride and oxide semiconductor nanostructured hydrogen gas sensors. Semicond. Sci. Technol. 2010, 25, 024002. [Google Scholar] [CrossRef]
  6. Engel, M.; Baumbach, M.; Kammerer, T.; Schütze, A. Preparation of microstructured pellistors and their application for fast fuel vapor discrimination. In Proceedings of the 17th IEEE International Conference on Micro Electro Mechanical Systems. Maastricht MEMS 2004 Technical Digest, Maastricht, The Netherlands, 25–29 January 2004; pp. 268–271. [Google Scholar]
  7. Gorbova, E.; Tzorbatzoglou, F.; Molochas, C.; Chloros, D.; Demin, A.; Tsiakaras, P. Fundamentals and principles of solid-state electrochemical sensors for high temperature gas detection. Catalysts 2021, 12, 1. [Google Scholar] [CrossRef]
  8. Liu, Y.; Parisi, J.; Sun, X.; Lei, Y. Solid-state gas sensors for high temperature applications—A review. J. Mater. Chem. A 2014, 2, 9919. [Google Scholar] [CrossRef]
  9. Akbar, S.; Dutta, P.; Lee, C. High-temperature ceramic gas sensors: A review. Int. J. Appl. Ceram. Technol. 2006, 3, 302–311. [Google Scholar] [CrossRef]
  10. Ivers-Tiffee, E.; Hardtl, K.; Menesklou, W.; Riegel, J. Principles of solid state oxygen sensors for lean combustion gas control. Electrochim. Acta 2001, 47, 807–814. [Google Scholar] [CrossRef]
  11. Shimizu, Y.; Nakano, H.; Takase, S.; Song, J.-H. Solid electrolyte impedancemetric NOx sensor attached with zeolite receptor. Sens. Actuators B 2018, 264, 177–183. [Google Scholar] [CrossRef]
  12. Kondo, M.; Muroga, T.; Katahira, K.; Oshima, T. Sc-doped CaZrO3 hydrogen sensor for liquid blanket system. Fusion Eng. Des. 2008, 83, 1277–1281. [Google Scholar] [CrossRef]
  13. Pasierb, P.; Rekas, M. Solid-state potentiometric gas sensors—Current status and future trends. J. Solid State Electrochem. 2009, 13, 3–25. [Google Scholar] [CrossRef]
  14. Yang, Y.-C.; Park, J.; Kim, J.; Choi, A.; Park, C.O. The study of the voltage drift in high-temperature proton conductor-based hydrogen sensors adopting the solid reference electrode. Sens. Actuators B 2009, 140, 273–277. [Google Scholar] [CrossRef]
  15. Kalyakin, A.; Demin, A.K.; Gorbova, E.; Volkov, A.; Tsiakaras, P.E. Sensor based on a solid oxide electrolyte for measuring the water-vapor and hydrogen content in air. Catalysts 2022, 12, 1558. [Google Scholar] [CrossRef]
  16. Fadeyev, G.; Kalyakin, A.; Gorbova, E.; Brouzgou, A.; Demin, A.; Volkov, A.; Tsiakaras, P. A simple and low-cost amperometric sensor for measuring H2, CO and CH4. Sens. Actuators B 2015, 221, 879–883. [Google Scholar] [CrossRef]
  17. Yang, W.; Wang, L.; Li, Y.; Zhou, H.; He, Z.; Liu, H.; Dai, L. A limiting current hydrogen sensor based on BaHf0.8Fe0.2O3−δ dense diffusion barrier and BaHf0.7Sn0.1In0.2O3−δ protonic conductor. Ceram. Int. 2022, 48, 22072–22082. [Google Scholar] [CrossRef]
  18. Kalyakin, A.; Fadeyev, G.; Demin, A.; Gorbova, E.; Brouzgou, A.; Volkov, A.; Tsiakaras, P. Application of solid oxide proton-conducting electrolytes for amperometric analysis of hydrogen in H2+N2+H2O gas mixtures. Electrochim. Acta 2014, 141, 120–125. [Google Scholar] [CrossRef]
  19. Kochetova, N.; Animitsa, I.; Medvedev, D.; Demin, A.; Tsiakaras, P. Recent activity in the development of proton conducting oxides for high-temperature applications. RSC Adv. 2016, 6, 73222–73268. [Google Scholar] [CrossRef]
  20. Gorelov, V.P.; Balakireva, V.B.; Kuzmin, A.V.; Plaksin, S.V. Electrical conductivity of CaZr1−xScxO3−d (x = 0.01 − 0.20) in dry and humid air. Inorg. Mater. 2014, 50, 495–502. [Google Scholar] [CrossRef]
  21. Løken, A.; Kjølseth, C.; Haugsrud, R. Electrical conductivity and TG-DSC study of hydration of Sc-doped CaSnO3 and CaZrO3. Solid State Ion. 2014, 267, 61–67. [Google Scholar] [CrossRef]
  22. Tian, Z.; Ruan, F.; Bao, J.; Song, X.; An, S.; Wu, R.; Jing, Q.; Lv, H.D.; Zhou, F.; Xie, M. Preparation and electrochemical properties of CaZr1-xScxO3-α. J. Electrochem. Soc. 2019, 166, B441–B448. [Google Scholar] [CrossRef]
  23. Gopel, W.; Reinhardt, G.; Rosch, M. Trends in the development of solid state amperometric and potentiometric high temperature sensors. Solid State Ion. 2000, 136, 519–531. [Google Scholar] [CrossRef]
  24. Kalyakin, A.S.; Danilov, N.A.; Volkov, A.N. Determining humidity of nitrogen and air atmospheres by means of a protonic ceramic sensor. J. Electroanal. Chem. 2021, 895, 115523. [Google Scholar] [CrossRef]
Figure 1. Photos of (a) the CZS plate with a cavity and a groove, (b) the fabricated sensor, and (c) a schematic view of the sensor: 1—CZS ceramic plates; 2—Pt electrodes; 3—ceramic capillary; 4—inner chamber; 5—sealing glass; V—source of DC voltage; A—ammeter.
Chemengineering 07 00045 g001
Figure 2. XRD pattern of CZS powder.
Chemengineering 07 00045 g002
Figure 3. SEM image of the surface of CZS ceramic sample.
Chemengineering 07 00045 g003
Figure 4. SEM image of CZS (a) and EDX mapping patterns of Ca (b), Zr (c), and Sc (d).
Chemengineering 07 00045 g004
Figure 5. Impedance spectra of CZS in dry and humid air at 650 °C.
Chemengineering 07 00045 g005
Figure 6. Arrhenius plots of CZS in dry (pH2O = 40 Pa) and humid (pH2O = 4.25 kPa) air.
Chemengineering 07 00045 g006
Figure 7. Current–voltage curves of the sensor, measured in air + H2 mixtures with different H2 concentrations at (a) 650 °C and (b) 700 °C; (c) current–voltage curves of the hydrogen sensor in 0–600 ppm H2 in air-Ar mixture at 600 °C, reported in [17]. Reproduced with permission from Ref. [17].
Chemengineering 07 00045 g007
Figure 8. Current–voltage curves measured in air + H2 mixtures with H2 concentrations of (a) 0.48%, (b) 0.63%, and (c) 1.45%, at 600, 650, and 700 °C.
Chemengineering 07 00045 g008
Figure 9. Dependences of limiting current on hydrogen concentration in air.
Chemengineering 07 00045 g009
Figure 10. Dynamic response of the sensor signal to changes in H2 concentration in the range of (a) 0.27–2.87% and (b) 0.62–0.94% at 650 °C. Error bars do not exceed the symbol size.
Chemengineering 07 00045 g010
Figure 11. Current–voltage curves of the sensor, measured in air + CH4 mixtures at CH4 concentrations of 0.5% and 1.23% at 700 °C.
Chemengineering 07 00045 g011
Figure 12. Long-term testing of the sensor in the mixture of air with 2.93% H2 at 700 °C.
Chemengineering 07 00045 g012
Disclaimer/Publisher’s Note: The statements, opinions and data contained in all publications are solely those of the individual author(s) and contributor(s) and not of MDPI and/or the editor(s). MDPI and/or the editor(s) disclaim responsibility for any injury to people or property resulting from any ideas, methods, instructions or products referred to in the content.

