
One-Step Crystallization of Gahnite Glass-Ceramics in a Wide Thermal Gradient

 ,
,
Abstract
:1. Introduction
2. Materials and Methods
2.1. Glass Production and Polythermal Crystallization
2.2. Glass and Glass-Ceramics Characterization
3. Results and Discussion
3.1. Polythermal Crystallization of Glass
3.2. Transformation of Glass Structure and Properties in the Thermal Gradient
4. Conclusions
Supplementary Materials
Author Contributions
Funding
Data Availability Statement
Conflicts of Interest
References
- Liu, X.; Zhou, J.; Zhou, S.; Yue, Y.; Qiu, J. Transparent Glass-Ceramics Functionalized by Dispersed Crystals. Prog. Mater. Sci. 2018, 97, 38–96. [Google Scholar] [CrossRef]
- Shakhgildyan, G.; Lipatiev, A.; Lotarev, S.; Fedotov, S.; Sigaev, V. Glass: Home of the Periodic Table. Front. Chem. 2020, 8, 384. [Google Scholar] [CrossRef]
- Alekseeva, I.; Dymshits, O.; Tsenter, M.; Zhilin, A.; Golubkov, V.; Denisov, I.; Skoptsov, N.; Malyarevich, A.; Yumashev, K. Optical Applications of Glass-Ceramics. J. Non-Cryst. Solids 2010, 356, 3042–3058. [Google Scholar] [CrossRef]
- Sakamoto, A.; Yamamoto, S. Glass-Ceramics: Engineering Principles and Applications. Int. J. Appl. Glass Sci. 2010, 1, 237–247. [Google Scholar] [CrossRef]
- Gallo, L.S.; Villas Boas, M.O.C.; Rodrigues, A.C.M.; Melo, F.C.L.; Zanotto, E.D. Transparent Glass–Ceramics for Ballistic Protection: Materials and Challenges. J. Mater. Res. Technol. 2019, 8, 3357–3372. [Google Scholar] [CrossRef]
- Shakhgildyan, G.; Durymanov, V.; Ziyatdinova, M.; Atroshchenko, G.; Golubev, N.; Trifonov, A.; Chereuta, O.; Avakyan, L.; Bugaev, L.; Sigaev, V. Effect of Gold Nanoparticles on the Crystallization and Optical Properties of Glass in ZnO-MgO-Al2O3-SiO2 System. Crystals 2022, 12, 287. [Google Scholar] [CrossRef]
- Beall, G.H.; Pinckney, L.R. Nanophase Glass-Ceramics. J. Am. Ceram. Soc. 2004, 82, 5–16. [Google Scholar] [CrossRef]
- Komatsu, T. Design and Control of Crystallization in Oxide Glasses. J. Non-Cryst. Solids 2015, 428, 156–175. [Google Scholar] [CrossRef]
- Deubener, J.; Allix, M.; Davis, M.J.; Duran, A.; Höche, T.; Honma, T.; Komatsu, T.; Krüger, S.; Mitra, I.; Müller, R.; et al. Updated Definition of Glass-Ceramics. J. Non-Cryst. Solids 2018, 501, 3–10. [Google Scholar] [CrossRef]
- Kurajica, S.; Šipušić, J.; Zupancic, M.; Brautović, I.; Albrecht, M. ZnO-Al2O3-SiO2 Glass Ceramics: Influence of Composition on Crystal Phases, Crystallite Size and Appearance. J. Non-Cryst. Solids. 2021, 553, 120481. [Google Scholar] [CrossRef]
- Mitchell, A.L.; Perea, D.E.; Wirth, M.G.; Ryan, J.V.; Youngman, R.E.; Rezikyan, A.; Fahey, A.J.; Schreiber, D.K. Nanoscale Microstructure and Chemistry of Transparent Gahnite Glass-Ceramics Revealed by Atom Probe Tomography. Scr. Mater. 2021, 203, 114110. [Google Scholar] [CrossRef]
- Molla, A.R.; Rodrigues, A.M.; Singh, S.P.; Lancelotti, R.F.; Zanotto, E.D.; Rodrigues, A.C.M.; Reza Dousti, M.; de Camargo, A.S.S.; Magon, C.J.; Silva, I.D.A. Crystallization, Mechanical, and Optical Properties of Transparent, Nanocrystalline Gahnite Glass-Ceramics. J. Am. Ceram. Soc. 2017, 100, 1963–1975. [Google Scholar] [CrossRef]
- Wang, S.; Guo, Y.; Lu, Y.; Liu, C.; Deng, Z.; Han, N.; Cui, J. Microstructure and Ion-Exchange Properties of Transparent Glass-Ceramics Containing Zn2TiO4/α-Zn2SiO4 Nanocrystals. J. Eur. Ceram. Soc. 2022, 42, 3595–3602. [Google Scholar] [CrossRef]
- Loiko, P.; Belyaev, A.; Dymshits, O.; Evdokimov, I.; Vitkin, V.; Volkova, K.; Tsenter, M.; Volokitina, A.; Baranov, M.; Vilejshikova, E.; et al. Synthesis, Characterization and Absorption Saturation of Co:ZnAl2O4 (Gahnite) Transparent Ceramic and Glass-Ceramics: A Comparative Study. J. Alloys Compd. 2017, 725, 998–1005. [Google Scholar] [CrossRef]
- Ignat’ev, A.I.; Shalamaiko, E.E.; Shmatok, L.K. Crystallizability of Optical Glasses and Their Melts. Glass Ceram. 1995, 52, 84–86. [Google Scholar] [CrossRef]
- Alekseev, R.O.; Romanov, N.A.; Savinkov, V.I.; Klimenko, N.N.; Sigaev, V.N. Multicomponent Optical Glasses with High Refractive Index. Glass Ceram. 2021, 78, 3–7. [Google Scholar] [CrossRef]
- Velmuzhov, A.P.; Sukhanov, M.V.; Plekhovich, A.D.; Suchkov, A.I.; Shiryaev, V.S.; Churbanov, M.F. Preparation and Investigation of Glasses in the GeS2–GeI4 System. Opt. Mater. 2015, 42, 340–344. [Google Scholar] [CrossRef]
- Gardopee, G.J.; Newnham, R.E.; Halliyal, A.G.; Bhalla, A.S. Pyroelectric Glass-ceramics. Appl. Phys. Lett. 1980, 36, 817–818. [Google Scholar] [CrossRef]
- Ochi, Y.; Meguro, T.; Kakegawa, K. Orientated Crystallization of Fresnoite Glass-Ceramics by Using a Thermal Gradient. J. Eur. Ceram. Soc. 2006, 26, 627–630. [Google Scholar] [CrossRef]
- Sigaev, V.N.; Sarkisov, P.D.; Stefanovich, S.Y.; Pernice, P.; Aronne, A. Glass Ceramic Textures Based on New Ferroelectric Complex Oxides. Ferroelectrics 1999, 233, 165–185. [Google Scholar] [CrossRef]
- Kim, S.J.; Birnie, D.P.; Zelinski, B.J.J.; Uhlmann, D.R. Practical Limits on Up-Gradient Crystallization. J. Non-Cryst. Solids 1995, 181, 291–300. [Google Scholar] [CrossRef]
- Lipatiev, A.S.; Lipateva, T.O.; Lotarev, S.V.; Okhrimchuk, A.G.; Larkin, A.S.; Presnyakov, M.Y.; Sigaev, V.N. Direct Laser Writing of LaBGeO5 Crystal-in-Glass Waveguide Enabling Frequency Conversion. Cryst. Growth Des. 2017, 17, 4670–4675. [Google Scholar] [CrossRef]
- Shakhgildyan, G.Y.; Lipatiev, A.S.; Fedotov, S.S.; Vetchinnikov, M.P.; Lotarev, S.V.; Sigaev, V.N. Microstructure and Optical Properties of Tracks with Precipitated Silver Nanoparticles and Clusters Inscribed by the Laser Irradiation in Phosphate Glass. Ceram. Int. 2021, 47, 14320–14329. [Google Scholar] [CrossRef]
- Shakhgil’dyan, G.Y.; Savinkov, V.I.; Shakhgil’dyan, A.Y.; Alekseev, R.O.; Naumov, A.S.; Lopatkina, E.V.; Sigaev, V.N. Effect of Sitallization Conditions on the Hardness of Transparent Sitalls in the System ZnO–MgO–Al2O3–SiO2. Glass Ceram. 2021, 77, 426–428. [Google Scholar] [CrossRef]
- Schneider, C.A.; Rasband, W.S.; Eliceiri, K.W. NIH Image to ImageJ: 25 Years of Image Analysis. Nat. Methods 2012, 9, 671–675. [Google Scholar] [CrossRef] [PubMed]
- Hunger, A.; Carl, G.; Rüssel, C. Formation of Nano-Crystalline Quartz Crystals from ZnO/MgO/Al2O3/TiO2/ZrO2/SiO2 Glasses. Solid State Sci. 2010, 12, 1570–1574. [Google Scholar] [CrossRef]
- Langford, J.I.; Wilson, A.J.C. Scherrer after Sixty Years: A Survey and Some New Results in the Determination of Crystallite Size. J. Appl. Crystallogr. 1978, 11, 102–113. [Google Scholar] [CrossRef]
- Golubkov, V.V.; Dymshits, O.S.; Petrov, V.I.; Shashkin, A.V.; Tsenter, M.Y.; Zhilin, A.A.; Kang, U. Small-Angle X-Ray Scattering and Low-Frequency Raman Scattering Study of Liquid Phase Separation and Crystallization in Titania-Containing Glasses of the ZnO–Al2O3–SiO2 System. J. Non-Cryst. Solids 2005, 351, 711–721. [Google Scholar] [CrossRef]
- Alekseeva, I.; Baranov, A.; Dymshits, O.; Ermakov, V.; Golubkov, V.; Tsenter, M.; Zhilin, A. Influence of CoO Addition on Phase Separation and Crystallization of Glasses of the ZnO–Al2O3–SiO2–TiO2 System. J. Non-Cryst. Solids 2011, 357, 3928–3939. [Google Scholar] [CrossRef]
- Ghose, S.; Choudhury, N.; Chaplot, S.L.; Pal Chowdhury, C.; Sharma, S.K. Lattice Dynamics and Raman Spectroscopy of Protoenstatite Mg2Si2O6. Phys. Chem. Miner. 1994, 20, 469–477. [Google Scholar] [CrossRef]
- Okuno, M.; Zotov, N.; Schmücker, M.; Schneider, H. Structure of SiO2–Al2O3 Glasses: Combined X-Ray Diffraction, IR and Raman Studies. J. Non-Cryst. Solids 2005, 351, 1032–1038. [Google Scholar] [CrossRef]
- Wang, Z.; Wang, Z.; Gan, L.; Zhang, J.; Wang, P. Structure/Property Nonlinear Variation Induced by Gamma Ray Irradiation of Boroaluminosilicate Transparent Glass Ceramic Containing Gahnite Nanocrystallite. J. Non-Cryst. Solids 2022, 578, 121346. [Google Scholar] [CrossRef]
- Vasanthavel, S.; Ezhilan, M.; Ponnilavan, V.; Ferreira, J.M.F.; Kannan, S. Manganese Induced ZrSiO4 Crystallization from ZrO2SiO2 Binary Oxide System. Ceram. Int. 2019, 45, 11539–11548. [Google Scholar] [CrossRef]
- Cormier, L. Nucleation in Glasses—New Experimental Findings and Recent Theories. Procedia Mater. Sci. 2014, 7, 60–71. [Google Scholar] [CrossRef]
- Rice, R.W.; McMillan, P.W.; Stryjak, A.J. Internal Stress Dependence of the Hardness of Crystallized Glasses. J. Mater. Sci. 1979, 14, 2768–2772. [Google Scholar] [CrossRef]
- Huang, J.; Zhang, J.; Yu, Y.; Bai, H.; Zhang, Z.; Huang, Y. Transparent MgO-Al2O3-SiO2 Glass-Ceramics Prepared with ZrO2 and SnO2 as Nucleating Agents. J. Non-Cryst. Solids 2022, 588, 121585. [Google Scholar] [CrossRef]
- Sant’Ana Gallo, L.; Célarié, F.; Bettini, J.; Rodrigues, A.C.M.; Rouxel, T.; Zanotto, E.D. Fracture Toughness and Hardness of Transparent MgO–Al2O3–SiO2 Glass-Ceramics. Ceram. Int. 2022, 48, 9906–9917. [Google Scholar] [CrossRef]


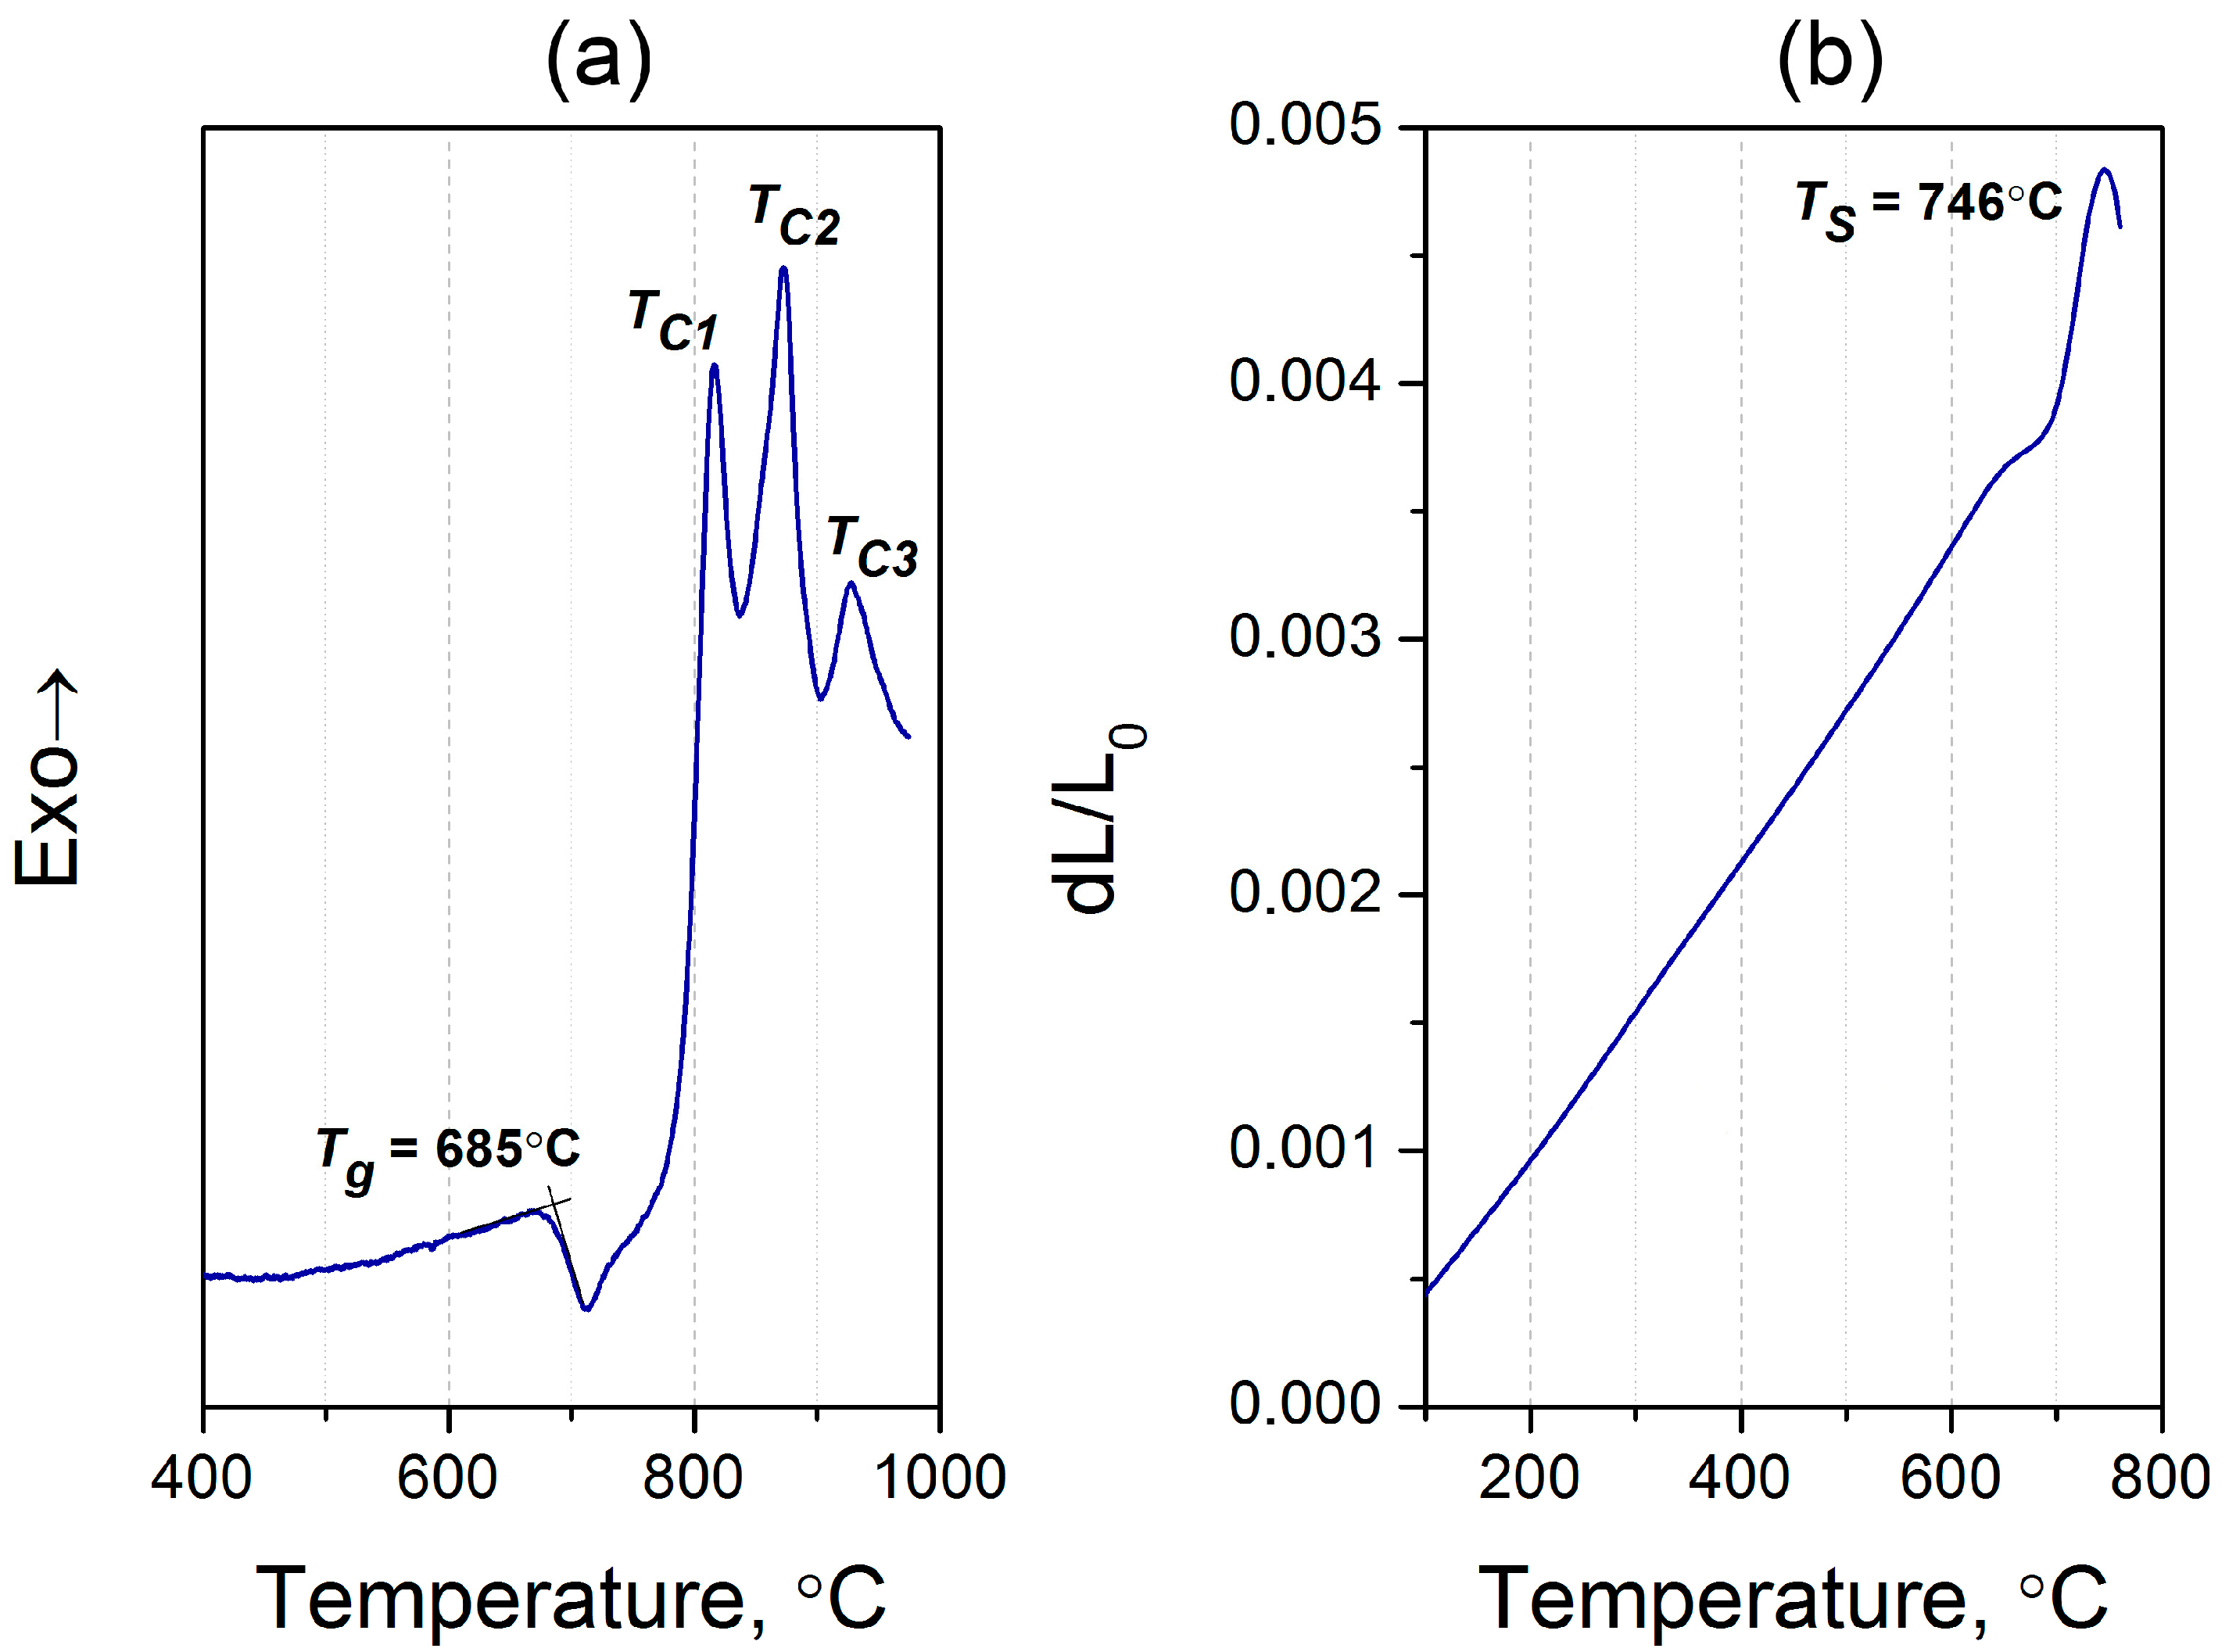
| Density, g/cm3 | Tg, °C | TC1, °C | TC2, °C | TC3, °C | TS, °C | CTE50–500 °C, °C−1 | Refractive Index |
|---|---|---|---|---|---|---|---|
| 3.5 | 685 | 816 | 872 | 928 | 746 | 5.6 × 10⁻⁶ | 1.56 |
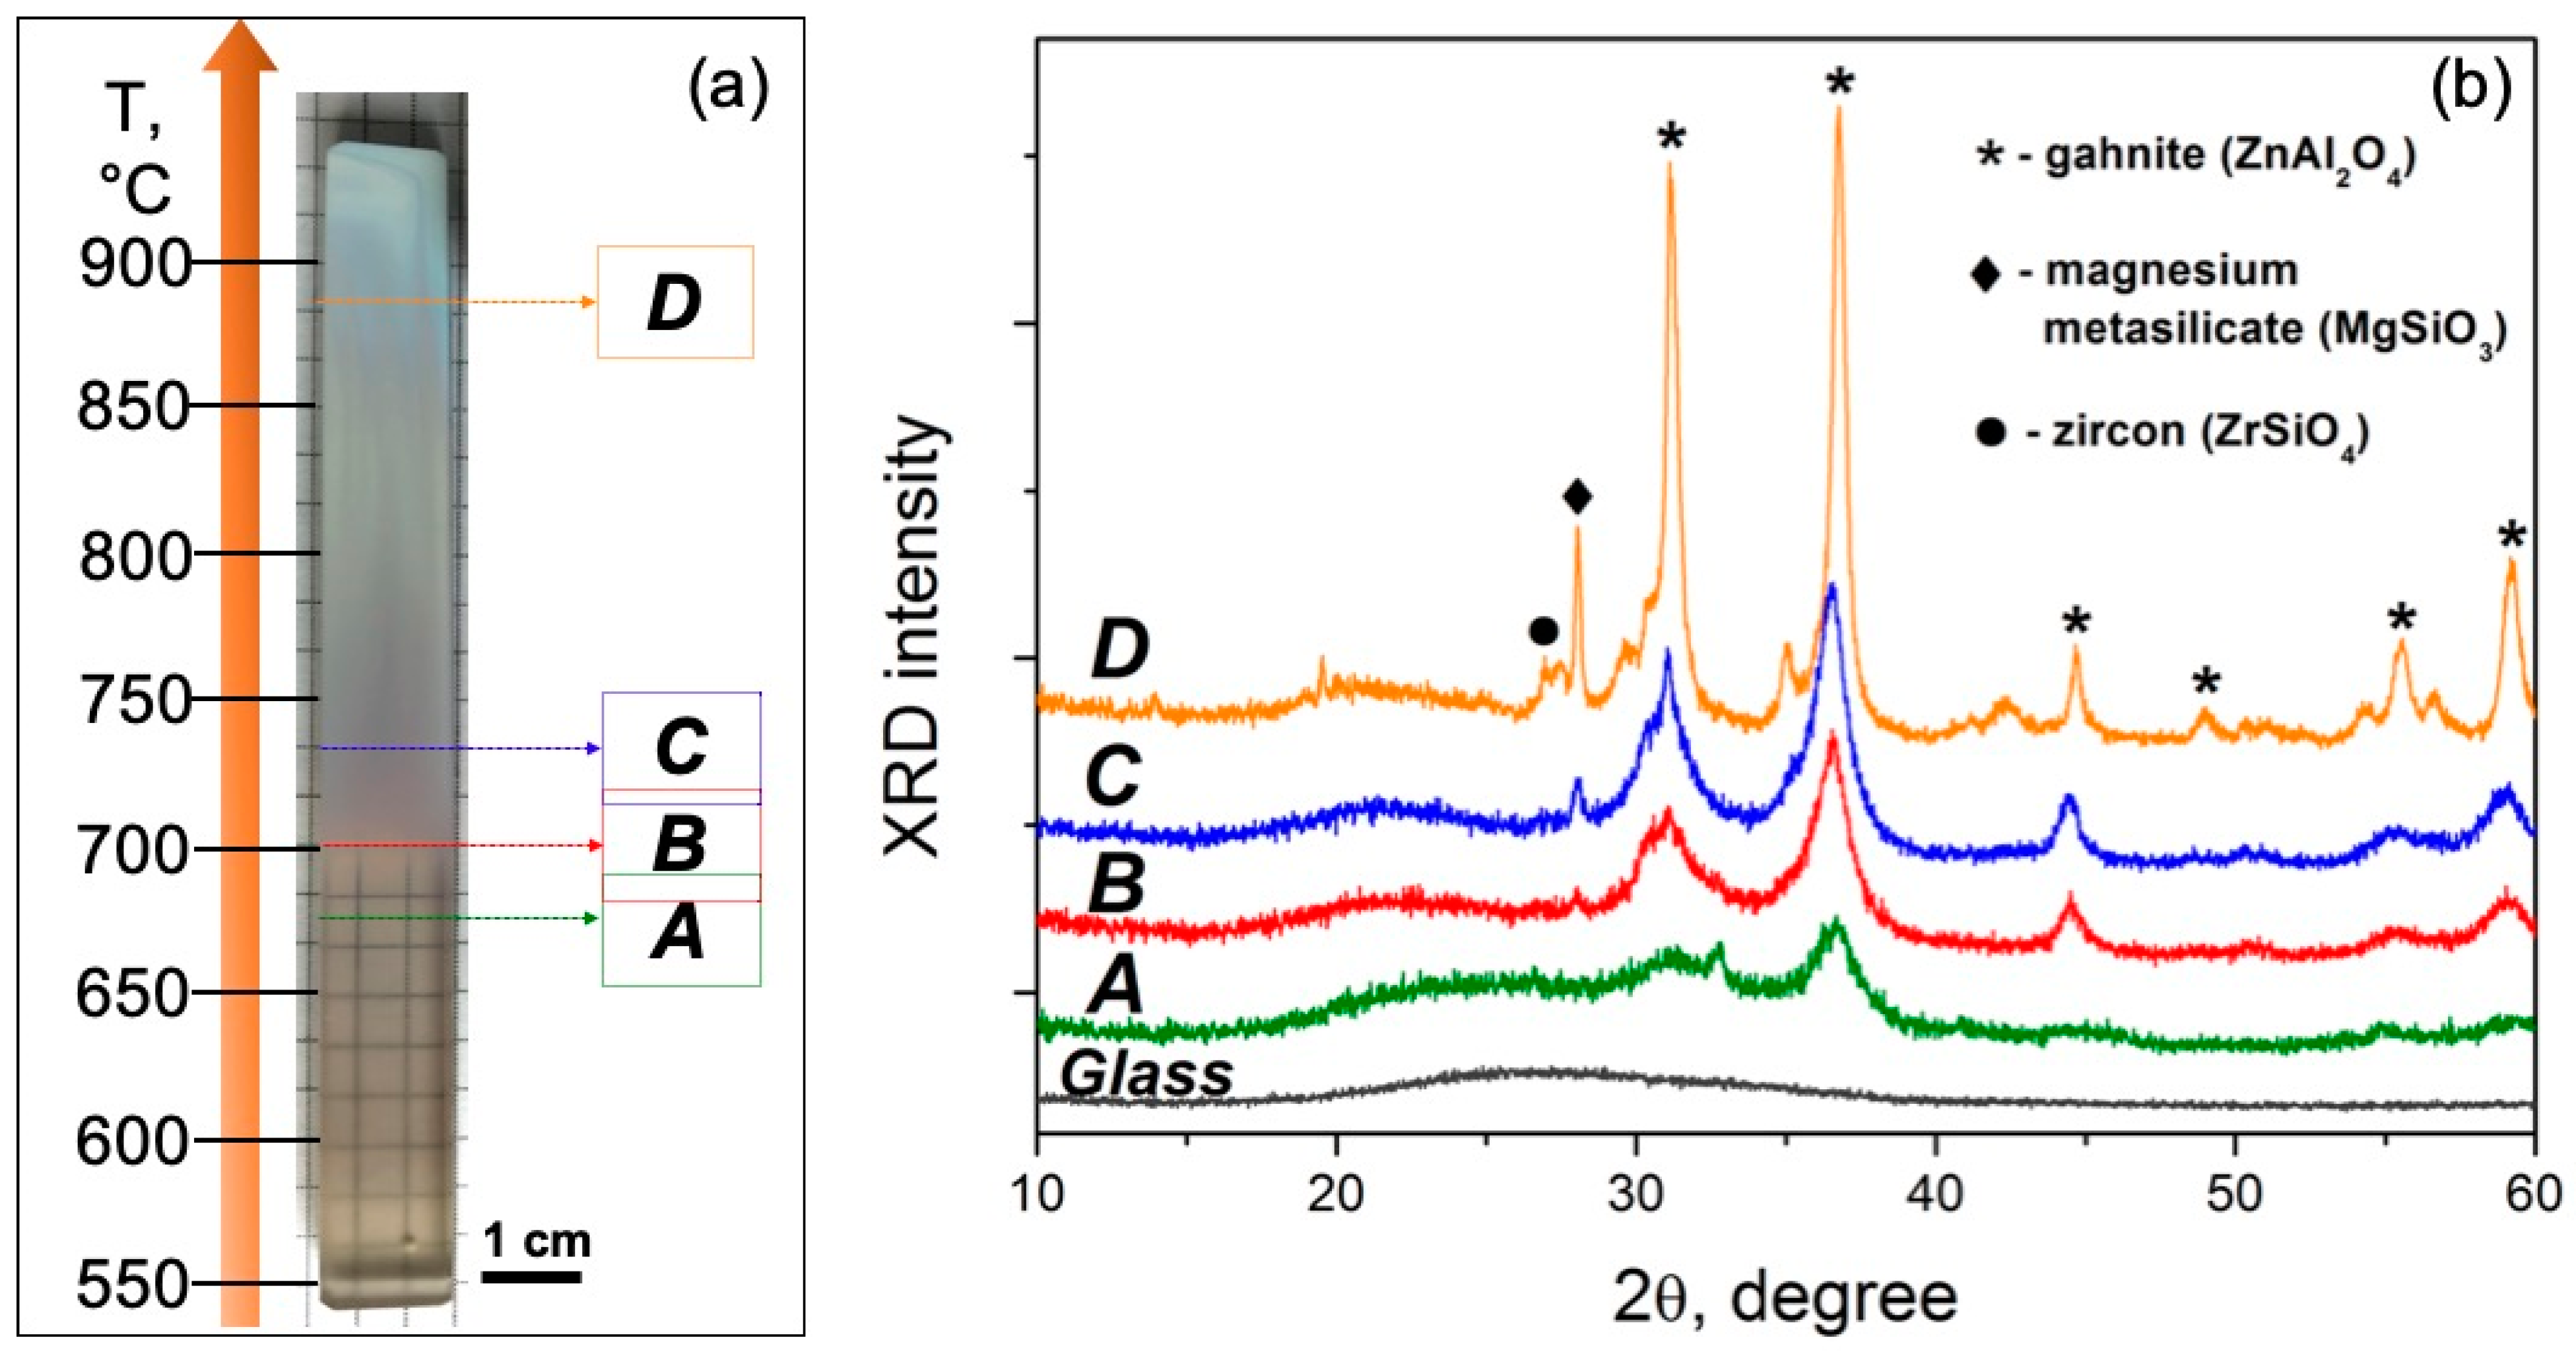
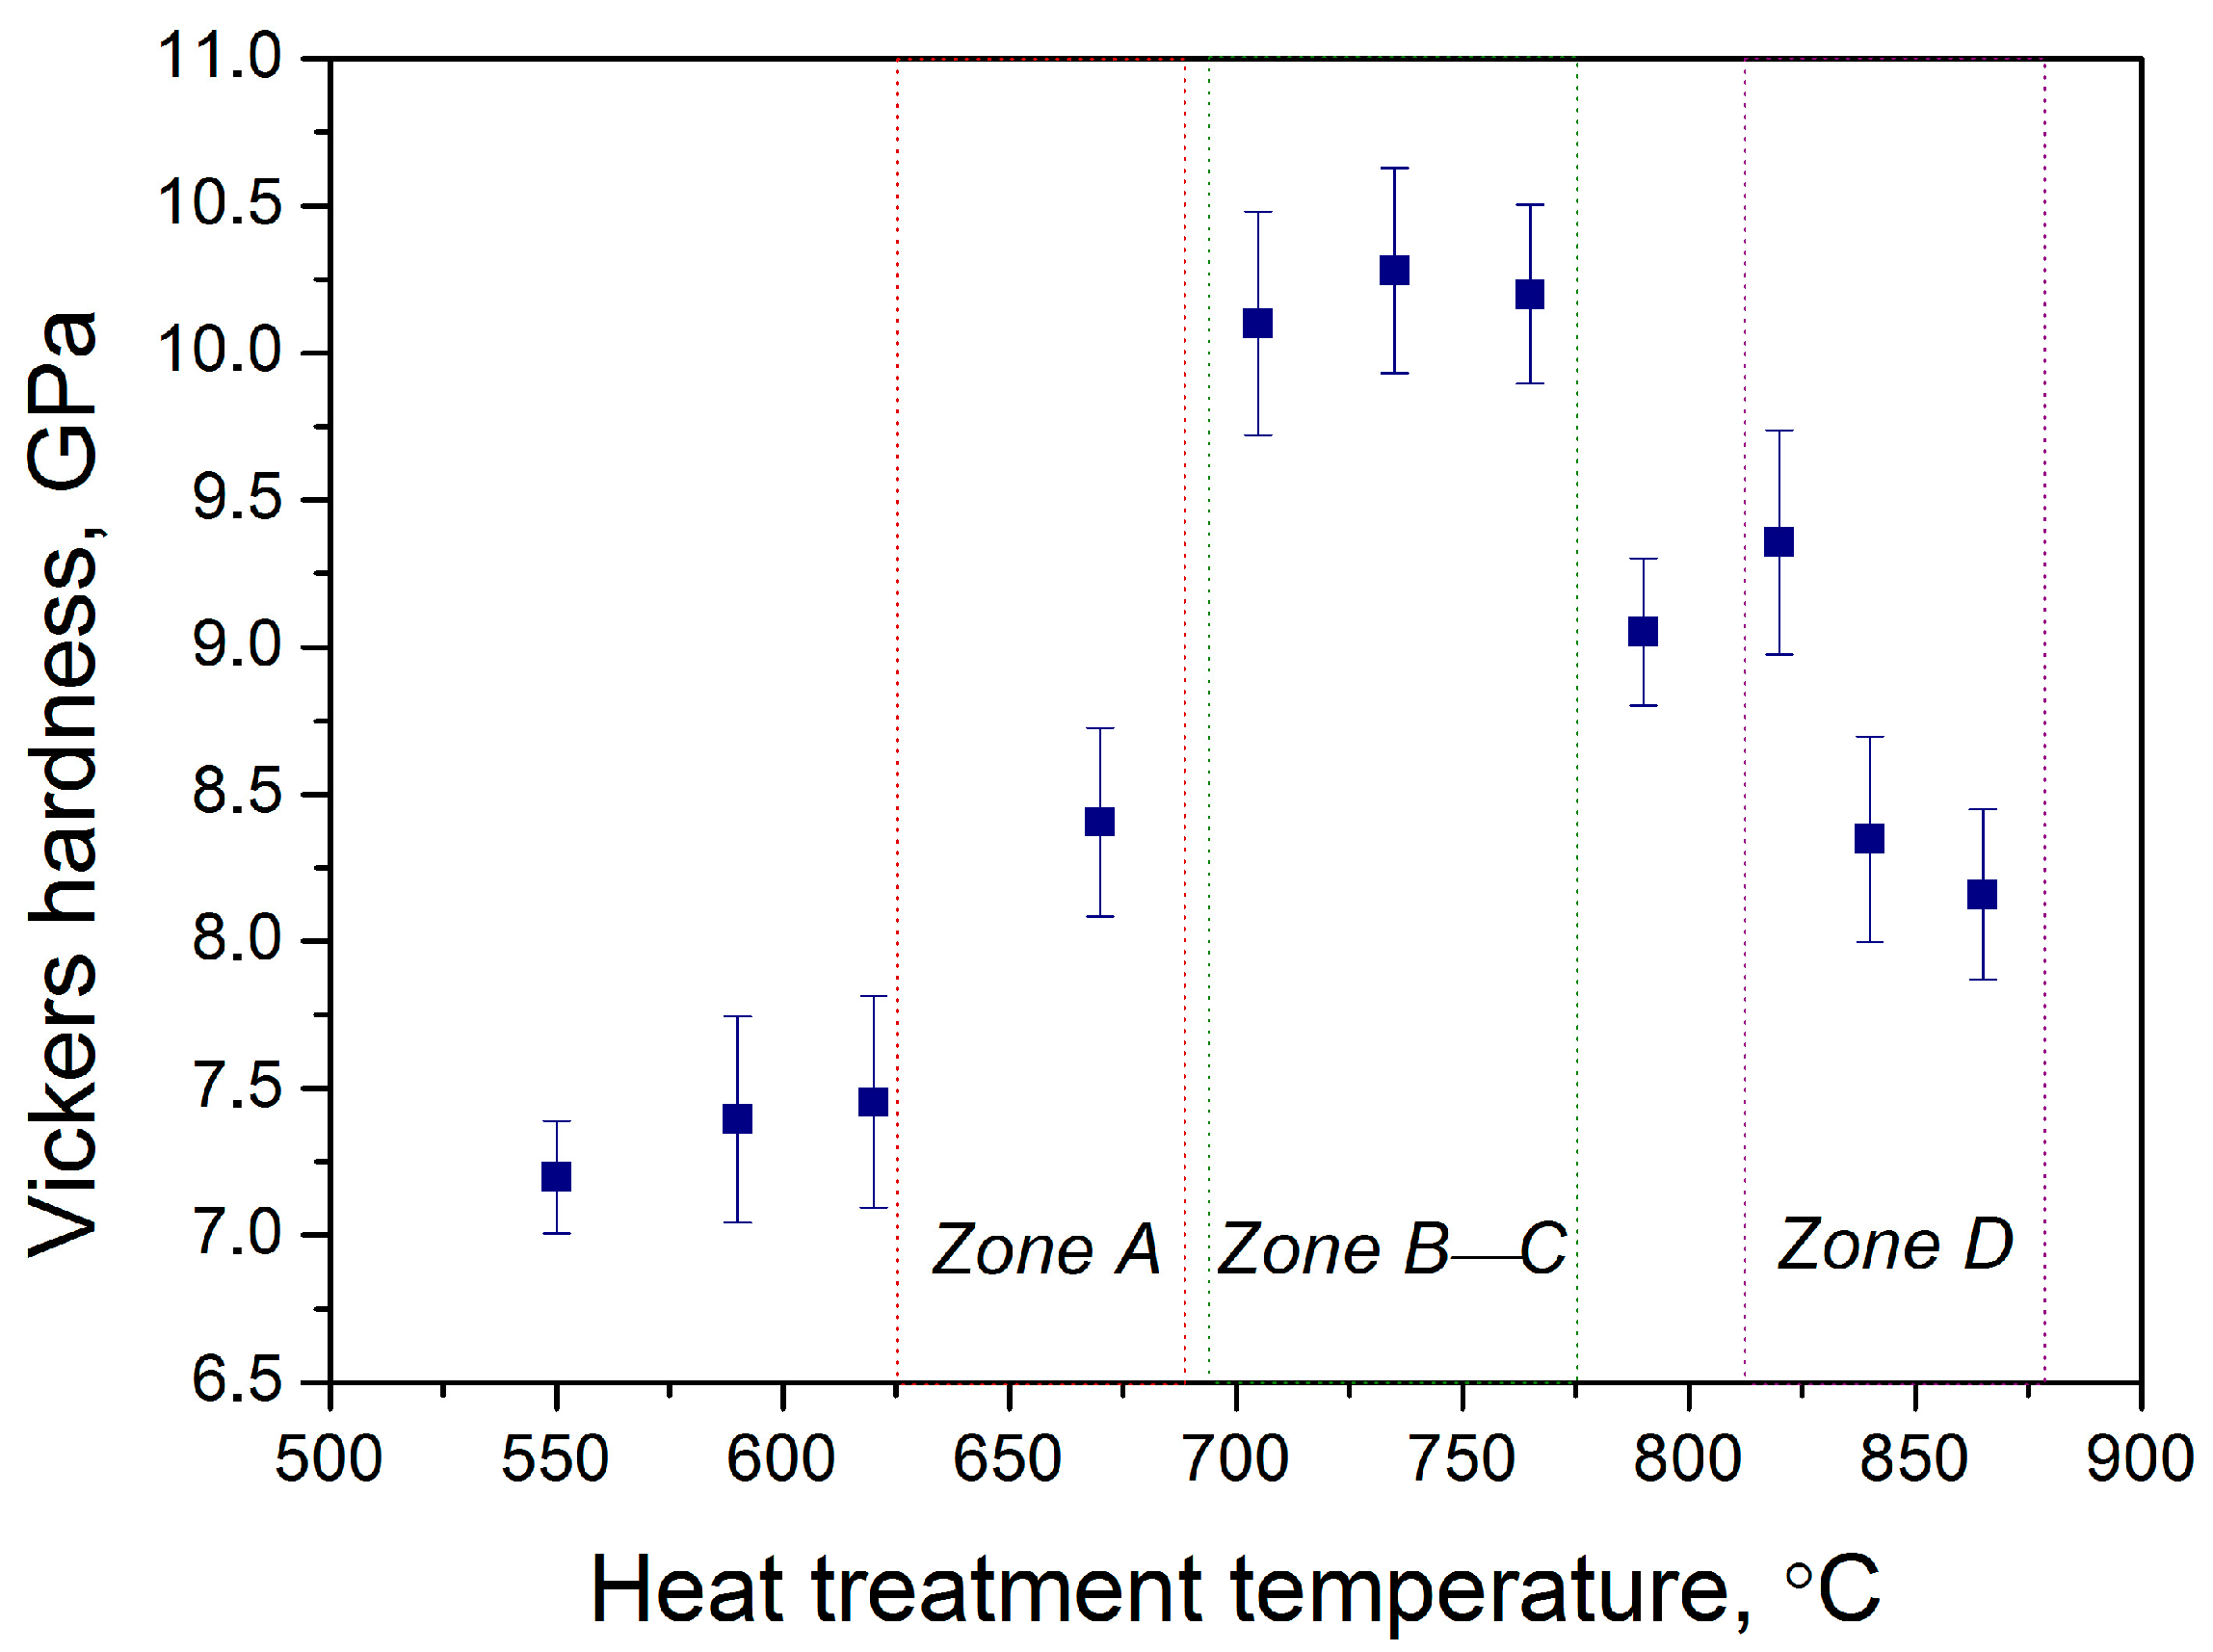
| Zone | Crystallite Size, nm |
|---|---|
| A | 5.4 |
| B | 7.7 |
| C | 9.0 |
| D | 18.5 |
Disclaimer/Publisher’s Note: The statements, opinions and data contained in all publications are solely those of the individual author(s) and contributor(s) and not of MDPI and/or the editor(s). MDPI and/or the editor(s) disclaim responsibility for any injury to people or property resulting from any ideas, methods, instructions or products referred to in the content. |
© 2023 by the authors. Licensee MDPI, Basel, Switzerland. This article is an open access article distributed under the terms and conditions of the Creative Commons Attribution (CC BY) license (https://creativecommons.org/licenses/by/4.0/).
Share and Cite
Shakhgildyan, G.Y.; Alekseev, R.O.; Golubev, N.V.; Savinkov, V.I.; Naumov, A.S.; Presnyakova, N.N.; Sigaev, V.N. One-Step Crystallization of Gahnite Glass-Ceramics in a Wide Thermal Gradient. ChemEngineering 2023, 7, 37. https://doi.org/10.3390/chemengineering7020037
Shakhgildyan GY, Alekseev RO, Golubev NV, Savinkov VI, Naumov AS, Presnyakova NN, Sigaev VN. One-Step Crystallization of Gahnite Glass-Ceramics in a Wide Thermal Gradient. ChemEngineering. 2023; 7(2):37. https://doi.org/10.3390/chemengineering7020037
Chicago/Turabian StyleShakhgildyan, Georgiy Yu., Roman O. Alekseev, Nikita V. Golubev, Vitaliy I. Savinkov, Andrey S. Naumov, Natalia N. Presnyakova, and Vladimir N. Sigaev. 2023. "One-Step Crystallization of Gahnite Glass-Ceramics in a Wide Thermal Gradient" ChemEngineering 7, no. 2: 37. https://doi.org/10.3390/chemengineering7020037