Article

Synthesis and Characteristics of Composite Material with a Plant-Based Filler

by
Natalia Igorevna Cherkashina
*,
Zoya Vladimirovna Pavlenko
,
Dar’ya Sergeyevna Matveenko
,
Semen Nikolayevich Domarev
,
Dar’ya Vasil’yevna Pushkarskaya
and
Dar’ya Aleksandrovna Ryzhikh
Department of Theoretical and Applied Chemistry, Belgorod State Technological University Named after V.G. Shukhov, 308012 Belgorod, Russia
*
Author to whom correspondence should be addressed.
ChemEngineering 2023, 7(2), 38; https://doi.org/10.3390/chemengineering7020038
Submission received: 24 March 2023 / Revised: 11 April 2023 / Accepted: 13 April 2023 / Published: 18 April 2023
(This article belongs to the Collection Green and Environmentally Sustainable Chemical Processes)

Abstract

:
The article presents the results of synthesis of polymeric composite material based on epoxy binder and plant-based filler. Pre-dried and powdered wheat straw was used as a plant-based filler. The wheat straw content in the composite varied from 10 to 50 wt.%. Thermal, mechanical, and surface properties of composites depending on the wheat straw content were researched. In addition, the samples were studied for resistance to corrosive environments. The hydrophobic–hydrophilic surface balance of composites was evaluated, and their free surface energy was studied. Introduction of wheat straw in small amounts (up to 30 wt.%) increases bending strength of polymer from 18.65 ± 1.12 MPa to 22.61 ± 0.91 MPa; when the content is more than 40 wt.%, reduction of strength is observed. Even with a wheat straw powder content of 50 wt.%, the bending strength is 11.52 ± 1.03 MPa, which corresponds to the strength of the construction material. The upper limit of working temperature for the epoxy binder is 306 °C, and for the composite with the wheat straw content of 30 wt.%—264 °C. The surface of the pure polymer shows a hydrophilic character. The average value of the water wetting contact angle of the pure epoxy sample is 84.96 ± 9.03°. The introduction of 30 wt.% of wheat straw powder filler transforms the surface into hydrophobic one (average value of water wetting contact angle is 96.69 ± 5.71°). The developed composites can be applied in furniture production including tabletops or panels for floors. Future research will focus on expanding the types of plant-based fillers for polymer composites.

1. Introduction

Nowadays a great attention is paid to polymeric composites from plant raw materials, which are a renewable natural resource. Therefore, the composites based on plants have a low production cost and are more environmentally friendly materials in comparison with the composites with synthetic filler [1,2,3,4]. The use of agricultural production wastes for the synthesis of composite materials not only reduces the cost of the final product, but it also solves the ecological problem of waste utilization [5,6].
Agricultural production wastes can serve as excellent fillers for biodegradable polymer composites [7]. Such composites can find a wide range of applications in various industries, including electronics, packaging materials, and biomedical applications [8,9,10]. Coconut shell powder [11] and rice husk [12,13,14] are used as plant-based fillers. However, it is necessary to take into account that for high-performance biocomposites, not only the filler needs to be of biological origin, but also the polymer matrix needs to have a high degree of biodegradation [15,16]. The principles of increasing the biodegradability of polymers are widely known and described in many scientific papers [17,18,19]. It is also possible to add special reagents (biodeterioration agents) to polymers to increase their biodegradation [20]. Biodegradation occurs in polymers capable of oxidation by oxygen and/or hydrolysis [21]. The polymers capable of significant biodegradation include macromolecules containing groupings of alcohols, esters, ethers, lactones, and others [22,23,24].
Using plant raw materials in addition to biodegradable composites, it is possible to obtain high-performance thermal insulation composites, as well as materials for construction and furniture manufacturing [25,26,27]. Adding a plant-based filler to the polymer matrix helps improve the operational properties of the composites. For example, the use of sunflower seed husk as a filler for polymer composites can increase the thermal insulation properties of composites [28,29]. B. Marques et al. developed polymer-based composites from rice husk and expanded cork by-products [30]. It was determined that a larger rice husk content can improve the acoustic characteristics, and the inclusion of cork granules in composite compositions helps to reduce thermal conductivity and improve mechanical properties.
M. Barczewski et al. found out that composites containing waste fillers such as sunflower seed husk, hazelnut, and walnut shells show increased stiffness and hardness along with reduced tensile and bending strength [31].
One of the common types of plant raw materials is wheat straw. Wheat straw is one of the main by-products of agriculture and not used as an industrial raw material on a significant scale. Wheat straw can be used as animal feed, household fuel, or as a raw material for the paper industry [32,33]. However, for the most part, wheat straw is burned, which creates significant environmental problems. Therefore, the use of wheat straw as a filler for polymer composites is a promising trend. There are few works on the use of wheat straw in polymer composites compared to the use of other plant wastes [34,35]. M. Yu et al. created hybrid composites from wheat straw, inorganic filler, and recycled polypropylene [36]. Tong et al. developed transparent composites using wheat straw fibers for applications in translucent buildings [37]. The authors found that a 3 mm thick composite with 10 wt.% fiber contents has a transmittance factor of 88.11% and turbidity of 25.59%. Many studies are devoted to the use of wheat straw in cement compositions [38,39,40].
Analysis of the literature showed that, when creating compositions using wheat straw, its introduction into the matrix is insignificant (up to 20 wt.%). It will not be possible to solve the problem of disposal of huge amounts of wastes this way. Therefore, the aim of this work is assessment of the possibility of creating highly filled polymer composites containing 50 wt.% or more of wheat straw filler.
This article presents the results concerning the synthesis and study of the characteristics of highly filled polymer composites based on epoxy binder and wheat straw powder.

2. Materials and Methods

2.1. Synthesis of Polymer Composites

ED-20 epoxy resin (Khimindustriya-Invest, Staraya Kupavna, Russia) was used as a polymeric binder. Polyethylene polyamine (PEPA) was used as a hardener.
Summer wheat straw from 2022 (Belgorod region, Russia) was used as a filler. To introduce the filler into the polymeric binder, it was necessary to obtain a highly dispersed powder from plant raw materials. The wheat straw was pre-cut with scissors into pieces of 3–5 cm in size. Then it was pre-dried in a desiccator at 105–110 °C; the weight was constant, and in the case of the sample taken, 40 min was enough. After the performed operations, the plant raw material dried to a constant weight was ground in a planetary mill. Figure 1 shows photos of the obtained wheat straw powder.
To obtain the composites, the epoxy resin was mixed with the hardener in the ratio according to the manufacturer’s instructions. Then the filler was introduced into the prepared mixture and stirred intensively for 7–10 min using an ultrasonic bath. The viability time of the mixture was 1.5–2 h. The amount of the filler varied from 10 to 50 wt.%. The homogenized mixture with different wheat straw content was poured into the molds and sent to the desiccator for two hours at a temperature of 85 °C. Complete curing occurred after 24 h. The synthesis parameters (processing temperature, holding time), as well as the pot life of the mixture, are indicated by the manufacturer in the instructions for the epoxy resin. In the course of the study, samples of 2 shapes were produced: 1 × 1 × 4 cm and 2 × 2 × 8 cm. Such sample sizes are necessary for all kinds of tests in accordance with the regulatory documents.

2.2. Research Methods

The structure of the wheat straw, a plant-based filler, was studied using X-ray diffraction on an ARL X’TRA instrument (Thermo Fisher Scientific SARL, Ecublens, Switzerland) with a CuKα source in the 2θ angle range from 4° to 56° in the asymmetric coplanar mode with a sliding angle of incidence α = 3° (θ-scan). Phase identification and peak indexing were performed using the ICDD (International Center for Diffraction Data) JCPDF database.
The granulometric analysis of plant raw materials was performed by laser scattering on an ANALYSETTE 22 NanoTec plus diffraction microanalyzer (Frisch, Idar-Oberstein, Germany).
The morphology of initial particles of plant raw materials was investigated using scanning electron microscopy (SEM) on TESCAN MIRA 3 LMU (Tescan, Brno, Czech Republic) in a mode of registration of secondary electrons.
The atomic elemental composition was investigated using energy dispersive spectrometry using a TESCAN MIRA 3 microscope equipped with EX-2300BU. The device allows the analysis of elements from Be to U with a localization of several microns.
The studies of the spatial structure of wheat straw powder were carried out using a VERTEX 70 FTIR spectrometer (Bruker, Ettlingen, Germany).
The differential thermal analysis of wheat straw and composites on its basis was carried out using STA 449F1 Jupiter® (NETZSCH-Gerätebau GmbH, Selb, Germany). The studies were performed in the temperature range from 20 to 1000 °C in an argon (Ar) atmosphere.
The samples were tested for three-point bending on a universal testing machine REM-100-A-1-1 (LLC Metrotest, Bashkortostan, Russia).
A Carl Zeiss Jena NU 2 optical microscope (Carl Zeiss, Oberkochen, Germany) was used to study the microscopic properties of the surface of the obtained composites. The microscope is designed for microscopic methods of research (petrographic analysis). It allows you to conduct research in reflected and transmitted light. The maximum magnification was ×1250. The samples were preliminarily ground using the grinding and polishing machine LaboPol-5.
The Vickers microhardness of the surface was measured with the NEXUS 4504 hardness tester (INNOVATEST Europe BV, Maastricht, The Netherlands). A four-sided Vickers diamond pyramid with a square base and an apex angle between opposite faces of 136° was used as an indenter. When evaluating microhardness according to Vickers, a pyramidal diamond indenter was pressed into the surface of the composites under a load applied for a fixed period of time (not less than 10 s). The load in all measurements was the same—100 g.
Wetting contact angle values were measured at 25 °C using the Krüss DSA30 droplet shape analysis system (Krüss GmbH, Hamburg, Germany). Distilled water or diiodomethane was applied to the material surface. The wetting contact angles (both left and right) were measured in 3 s. using the DSA4 software (Krüss GmbH, Hamburg, Germany).

3. Results and Discussion

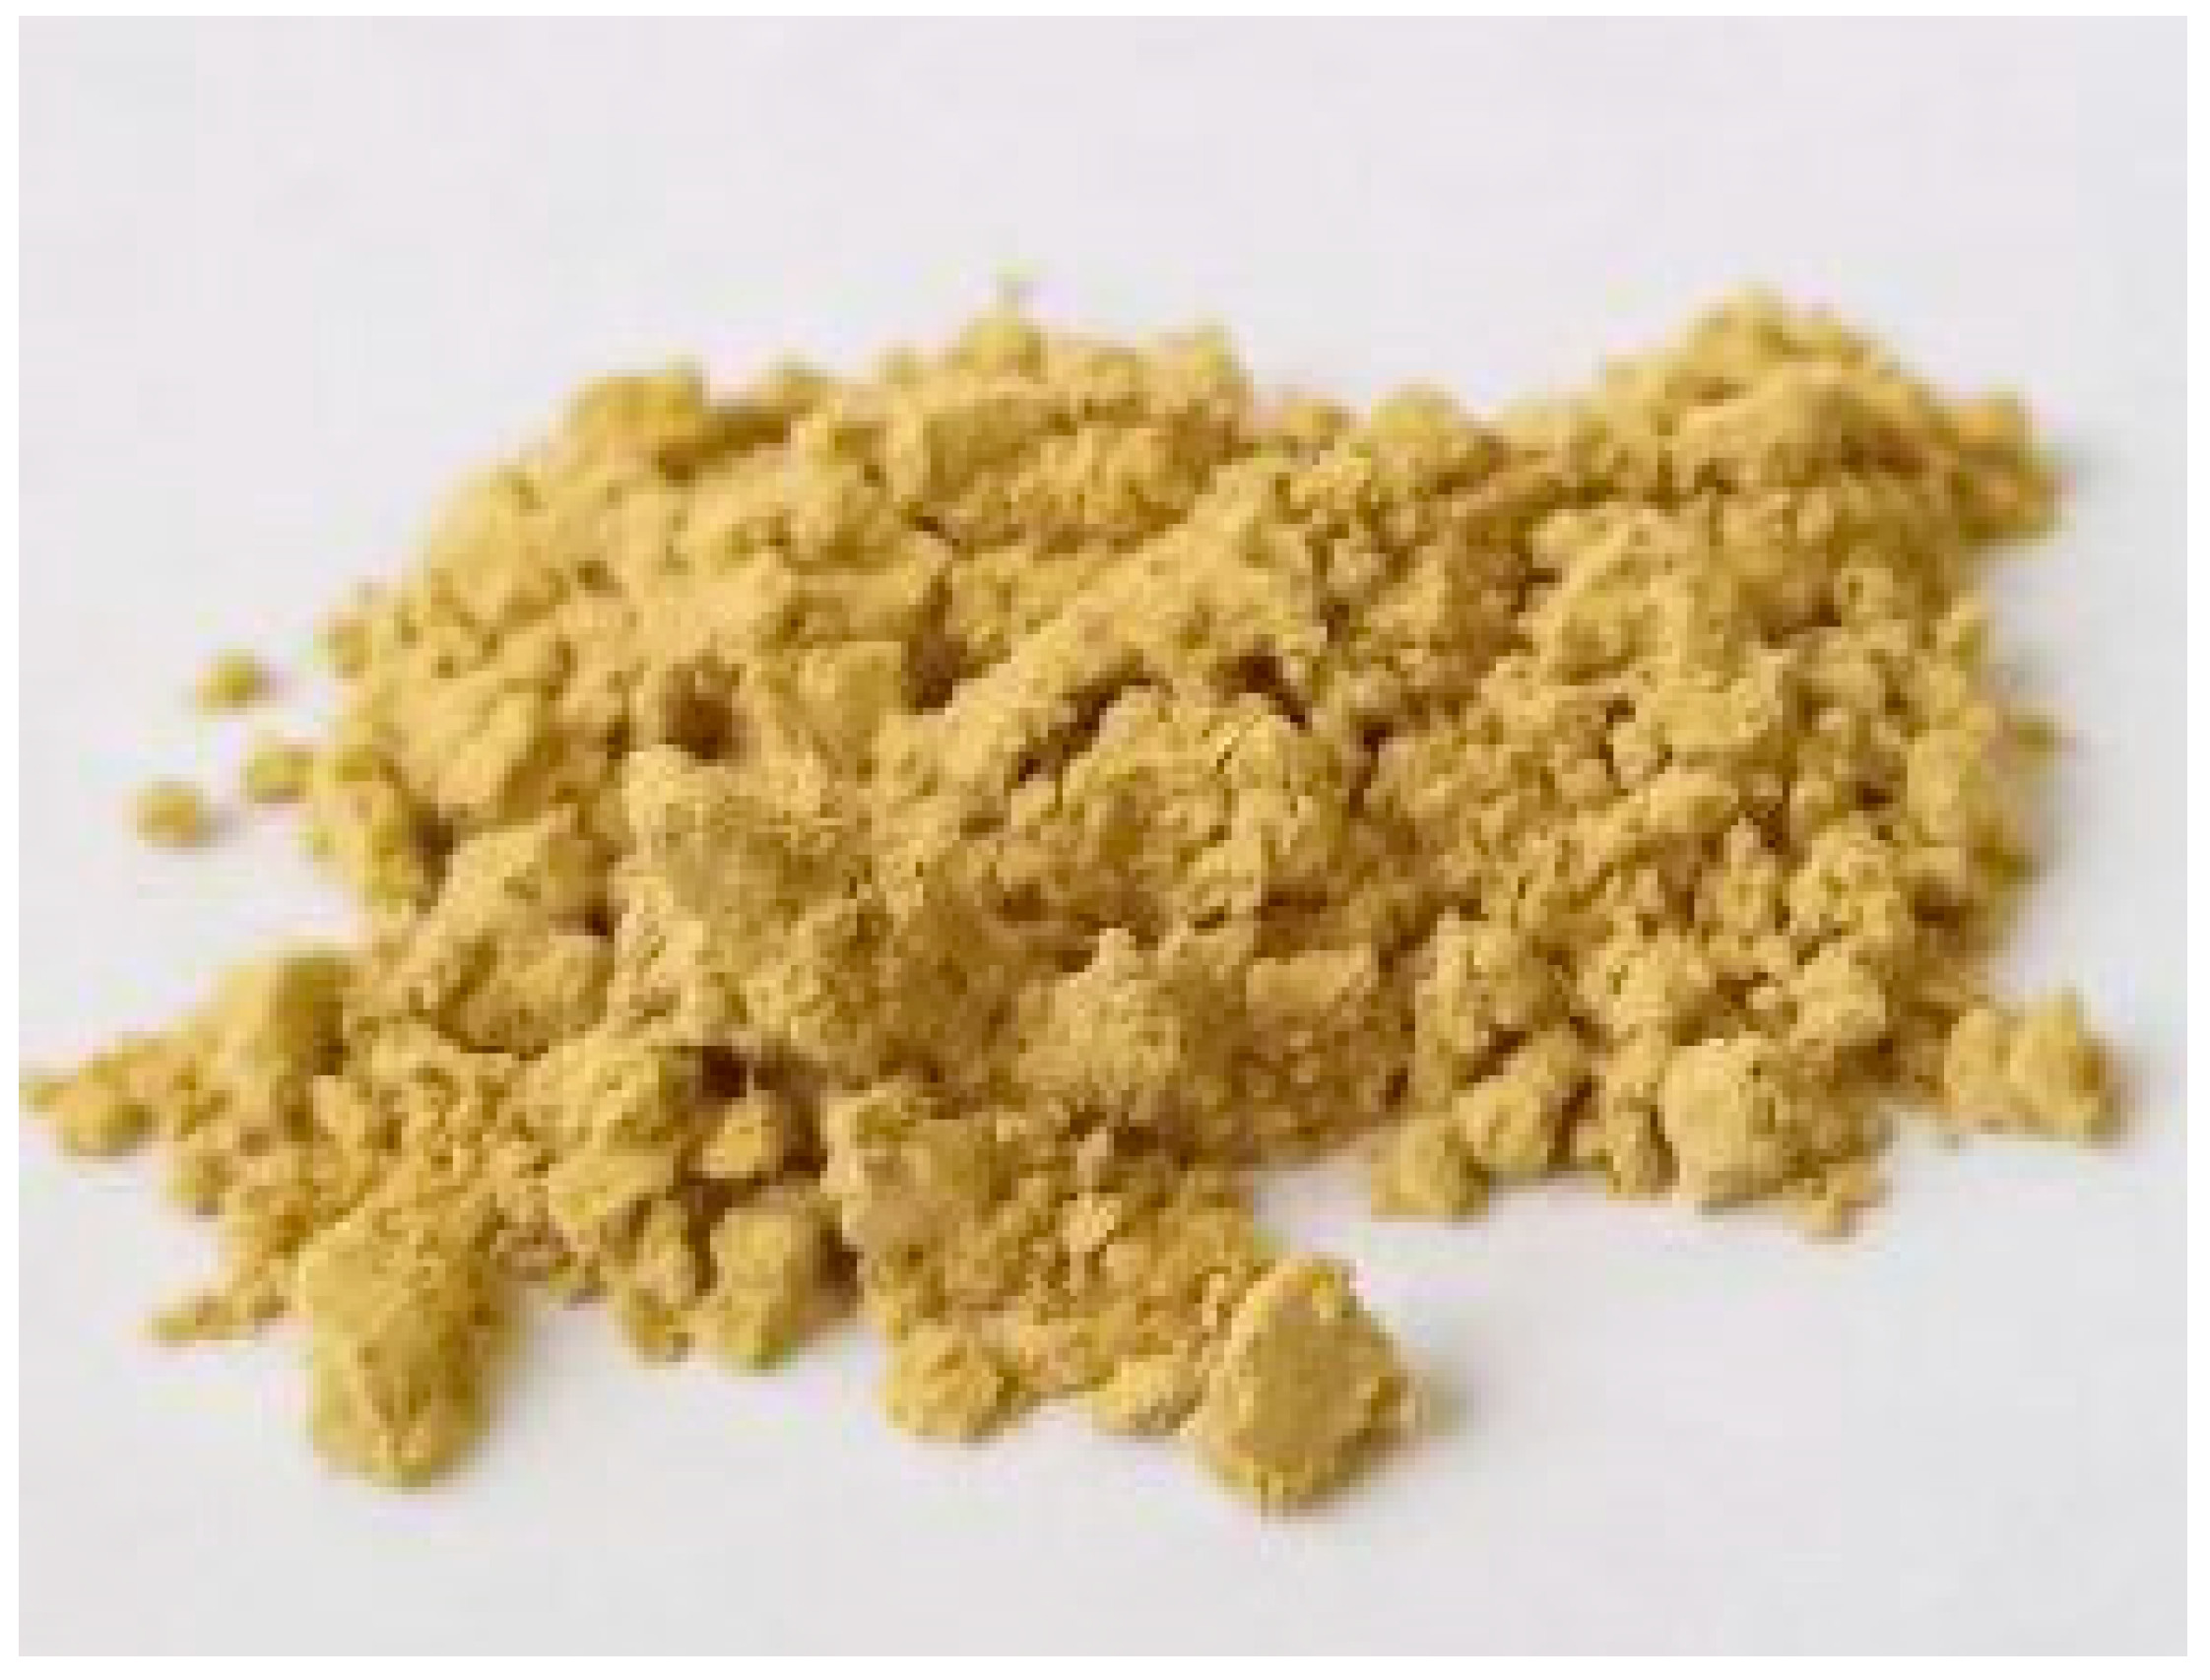
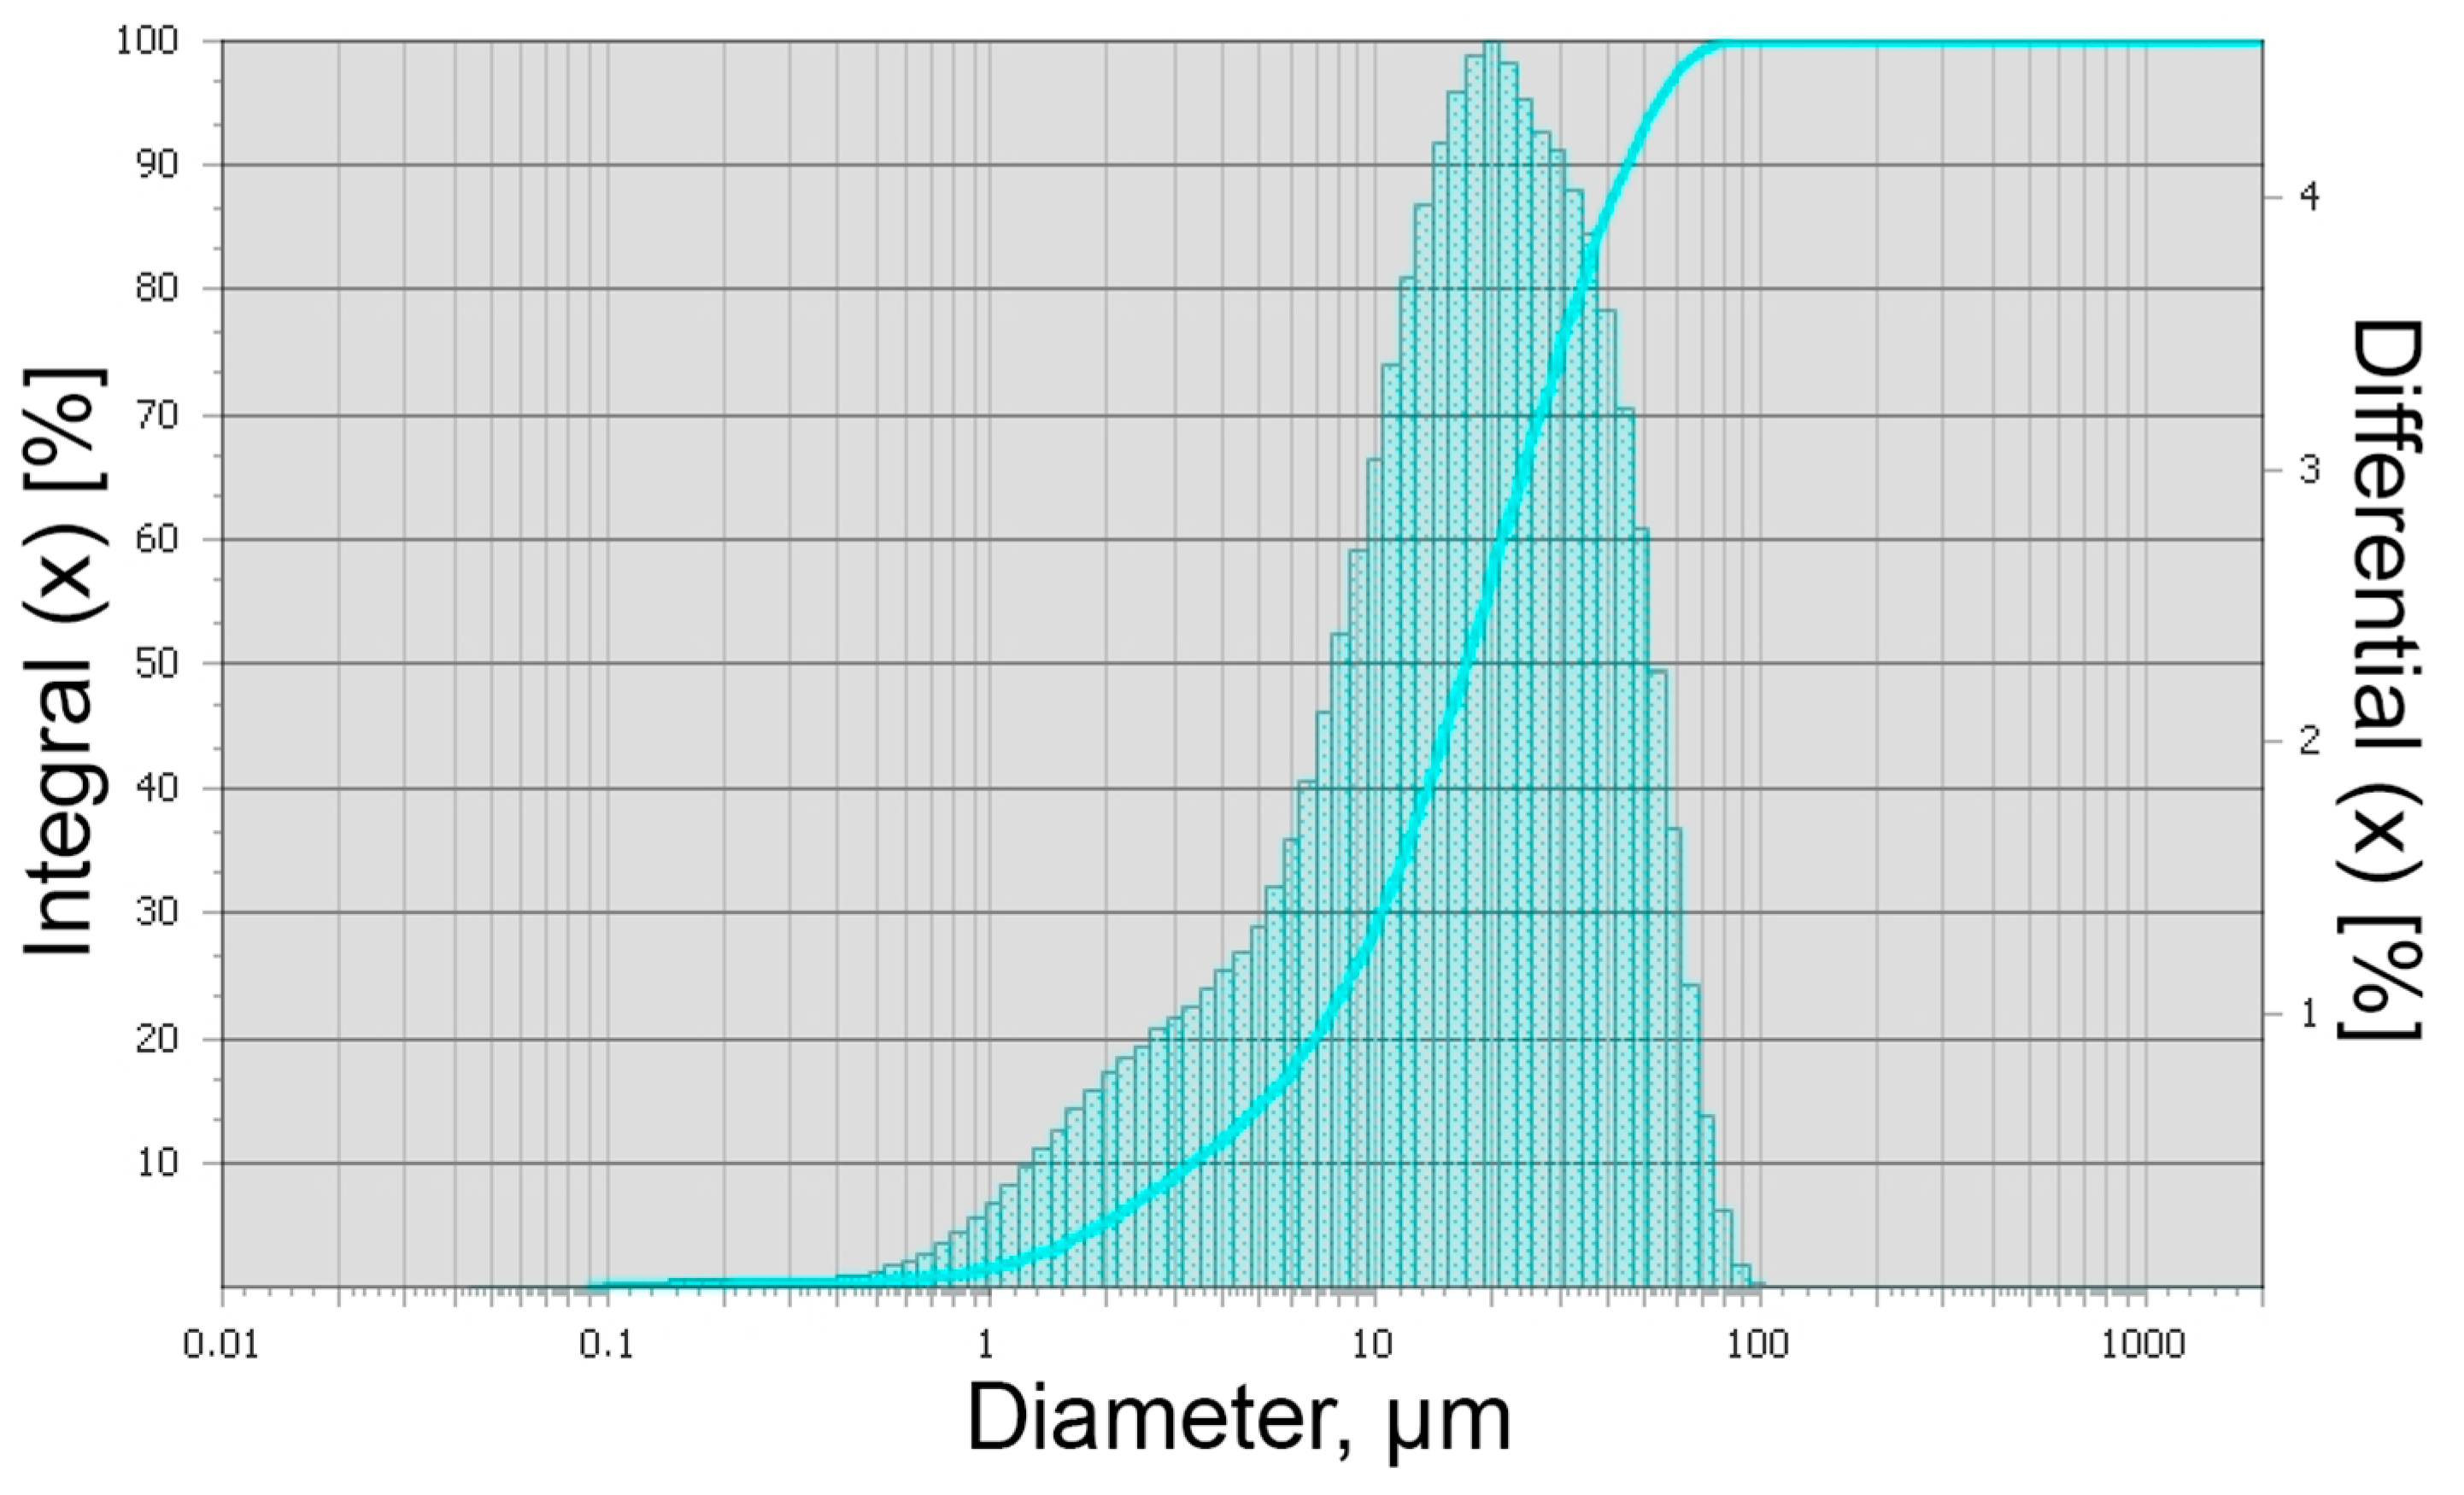
3.1. Study of Wheat Straw Filler

X-ray powder diffractogram of wheat straw powder is shown in Figure 2.
X-ray analysis shows that the wheat straw powder has an amorphous-crystalline character (Figure 2). Two crystalline peaks at Bragg angles of 20.7° and 26.6° with parameters of 4.281 Å and 2.251 Å, respectively, are observed on the X-ray diffraction pattern (Figure 2).
Figure 3 shows the fractional composition of the obtained wheat straw powder.
The analysis of the data on the granulometry of the wheat straw powder showed that the particles range from 0.1 to 106.9 μm, with most of the particles ranging in size from 6.45 to 58.04 μm (Figure 3). The modal particle diameter is 19.73 μm, and the specific surface area of the particles is 8498 cm2/cm3.
Figure 4 shows SEM images of wheat straw powder particles at different resolutions. The analysis of microphotographs of wheat straw powder particles (Figure 4) shows that the particles do not have a pronounced shape; the plates have irregular shapes and different sizes, including the ones in the form of flakes. The particle size varies from 2 to 25 µm. The microphotograph shows that individual particles are combined into large agglomerates up to 150 μm in size (Figure 4b).
The spectrum of energy dispersive microanalysis of the plant-based filler—wheat straw—is shown in Figure 5. The analysis of the obtained data reveals that wheat straw mainly consists of atoms C (49.5%) and O (44.2%). In addition, the spectrum of wheat straw shows the following atoms: Si, K, Ca, Ni, Mg, S, Cl, Fe, and P. H atoms are absent in the spectrum, since H is outside the range that is registered by EX-2300BU.
For a better understanding of the distribution of the atomic composition of wheat straw, Figure 6 presents its complete multilayer EDS map.
Figure 7 shows the FT-IR spectrum of wheat straw powder. In the FT-IR spectrum there are absorption bands with the following maxima: 466.89; 561.73; 609.10; 663.67; 782.59; 897.68; 1054.08; 1161.27; 1244.66; 1322.47; 1375.21; 1424.98; 1460.46; 1510.65; 1604.96; 1654.07; and 1734.51 cm−1 and broad absorption bands in the regions of 3000–2900 cm−1 and 3650–200 cm−1.
The data obtained using FT-IR spectroscopy of wheat straw are in agreement with the data of other authors [41]. The configurations of these peaks relate mainly to the valence vibrations of the O-H, C-H, C-O, and C=O bonds. The broad absorption band at 3650–3200 cm−1 with maximum at 3401.87 cm−1 corresponds to the valent vibrations of the O-H bond. The absorption band at 3000–2900 cm−1 with maximum at 2919.37 cm−1 corresponds to the vibrations of the C-H bond.
The bands in the range 1734.51–1604.96 cm–1 correspond to vibrations of the C=O bond. The absorption band at 1375.21 cm−1 refers to the C-O or C-H valence vibrations. The bands in the range 1322.47–1244.66 cm–1 were attributed to the benzene hydroxyl of the C-O bond of lignin or the C-O bond of hydrocarbons, and the absorption bands with maximums at 1054.08 and 1161.27 cm–1 correspond to the O-H and C-O-C vibrations.
Figure 8 shows the data of thermal analysis of wheat straw powder (TG and DTA curves of wheat straw powder).
The analysis of the TG curve of wheat straw showed that when the temperature is increased to 1000 °C, the weight loss is 77.81%. In the temperature range of 25–150 °C, about 6% of initial weight is lost—intensive removal of adsorbed water occurs. This endothermic process peaks at 83.3 °C on the DTA curve. The second endothermic peak is observed at 306.4 °C, and the effect interval falls at 250–320 °C (Figure 8). This exothermic peak is associated with the beginning of thermal decomposition of the material, which corresponds to the beginning of intense weight loss according to the TG curve. The third endothermic peak on the DTA curve is observed at 335.7 °C, and the effect interval falls at 330–420 °C (Figure 8). This exothermic peak is associated with the maximum thermal decomposition of the material, which corresponds to a large weight loss according to the TG curve data.

3.2. Physical and Mechanical Properties of Composites

The density of the samples of the obtained polymer composites containing different amounts of wheat straw powder (from 10 to 50 wt.%) was studied. The density of the samples was measured using hydrostatic weighing. The density of the samples (ρ) was calculated using the following formula:
p = m m m 1 p l i q p a i r + p a i r
where  m   and   m 1  are the weight of the sample in the air and liquid, respectively, g; and  p l i q   and   p a i r  are the densities of the liquid and air, respectively, g/cm3, at the temperature of the experiment.
Table 1 shows the results of measuring the average density of the samples with different contents of plant raw materials.
In the course of the study, it was found that the average density of the samples increases slightly with the increase of the content of wheat straw powder filler (Table 1).
Bending tests of the obtained samples of polymer composites containing fine-dispersed wheat straw particles were carried out. Loads were performed for three-point bending tests. The three-point bending strength (MPa) was calculated with the formula:
σf,m = 3Fm·L/(2bh2)
where Fm—maximum load, H; L—distance between the bottom supports, mm; b—sample width, mm; and h—average thickness of the sample, mm.
Table 2 presents data on the geometrical parameters of the studied samples of polymer composites with wheat straw powder. The measurements were carried out using a caliper.
The results of bending tests of composites with different contents of the plant-based filler are presented in Table 3. Comparing the sample without any filler with highly filled polymer composites, we can conclude that the presence of the filler in a small amount (up to 30 wt.%) increases the strength of the material and requires a greater amount of applied force for fracture. However, when the content of wheat straw in the composite is more than 40 wt.%, there is a decrease in strength. At the same time, even with wheat straw powder content of 50 wt.%, the bending strength is 11.52 ± 1.03 MPa, which corresponds to the strength of construction materials.
The data on the increase in the strength properties of polymer composites with vegetable filler with the introduction of low concentrations and the decrease in strength with a large amount of filler are in agreement with the literature. For example, Huda and Yang find that flexural and impact resistance properties of lightweight polypropylene composites increase with increasing cornhusk fibers up to 35%, stay unchanged up to 40%, and then decrease [42].
It should be noted that during the bending tests the sample with pure epoxy resin bent but did not collapse, while the application of the load to the composites with a plant filler led to their collapse.

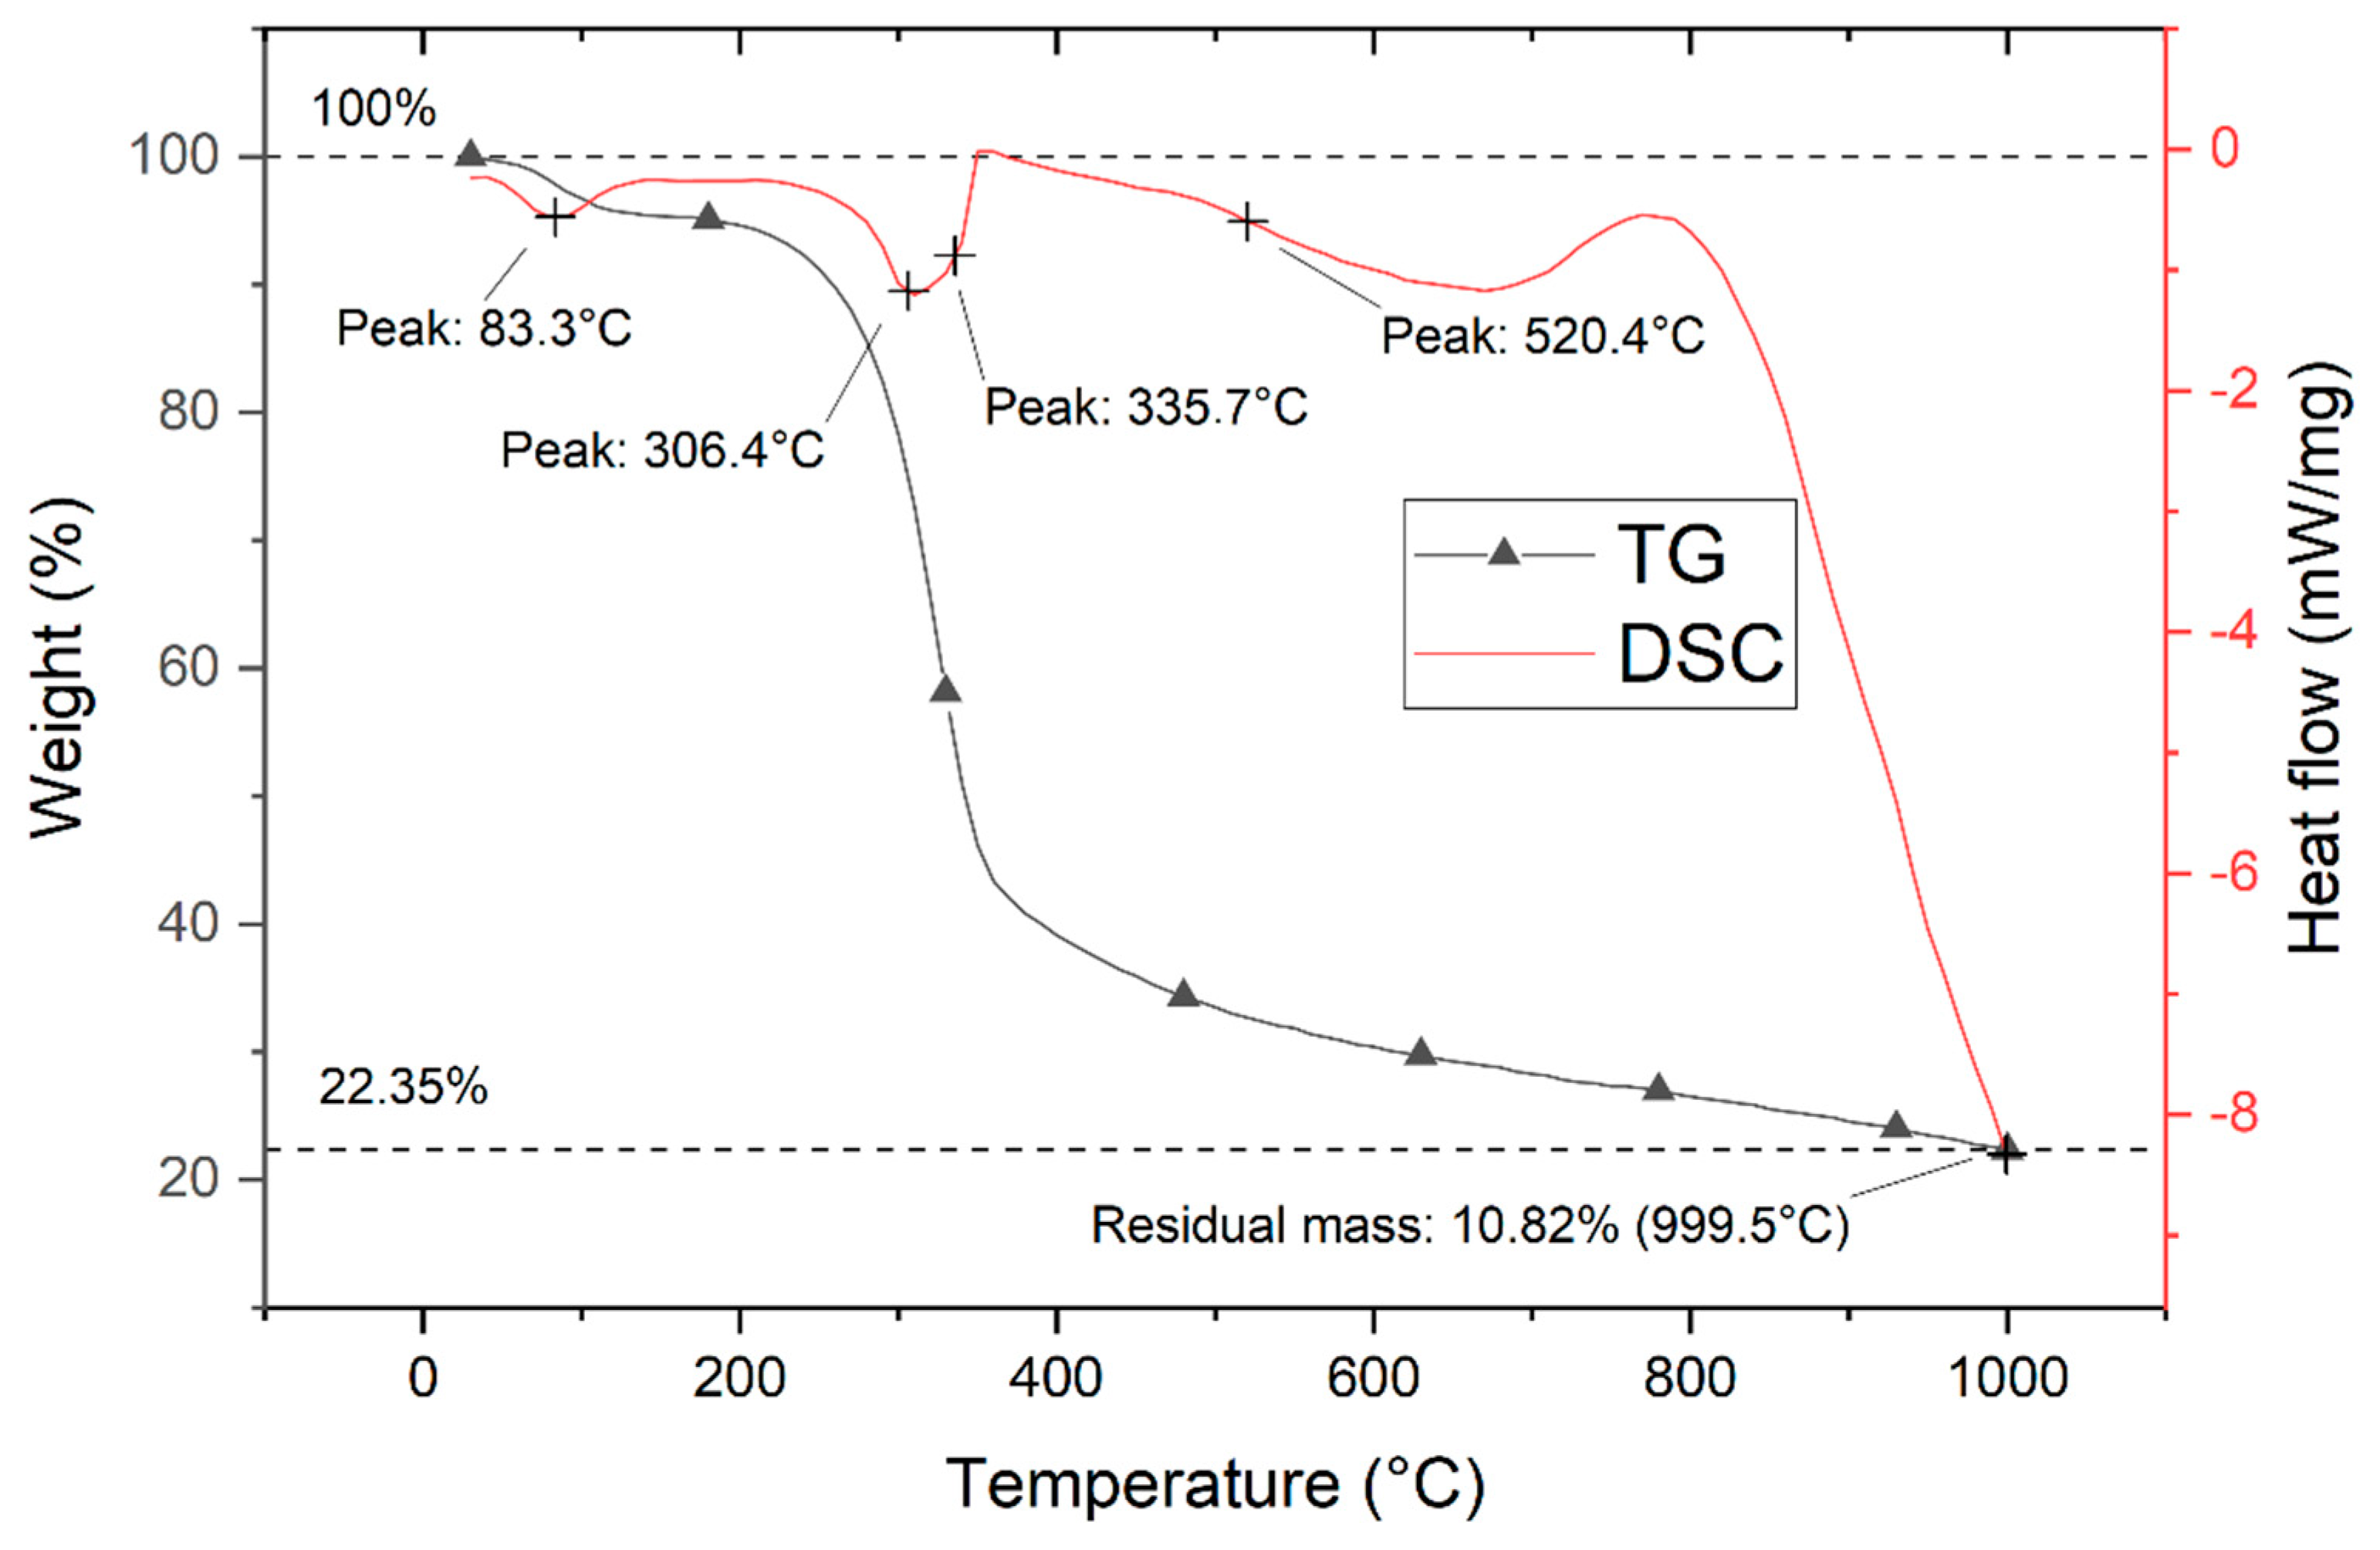
3.3. Thermal Properties of Composites

In order to estimate the upper limit of the operating temperature and to assess the physical transitions in the structure of composites accompanied by exo- and endo-effects, a thermal analysis of polymer composites with different contents of wheat straw powder was carried out. Table 4 presents the data on the residual weight of composites with different content of wheat straw powder. Pure polymer is stable up to 290 °C. Up to this temperature the polymer practically does not lose weight. Further, in the temperature range of 290–450 °C, there is a weight loss of ~55% due to the breaking of bonds in the polymer and oxidation of gaseous decomposition products. After 450 °C, the polymer gradually loses the rest of its weight.
Figure 9 shows TG and DTA curves of the composite containing 30 wt.% wheat straw powder. The DTA curve of the composite is characterized by endo-effects with highlighted maximums at temperatures 83.3 °C, 306.4 °C, and 335.7 °C, which correspond to the thermal effects occurring with the wheat straw filler. The values of these three peaks coincide with the data of the thermal analysis of the wheat straw powder itself (Figure 8). The first peak (83.3 °C) corresponds to the process of intensive removal of adsorbed water; the second peak (306.4 °C) corresponds to the beginning of intensive loss of wheat straw weight; and the third peak (335.7 °C) is associated with the maximum thermal decomposition of wheat straw powder. A vaguely pronounced peak at 291 °C corresponds to the exo-effect of oxidation of gaseous products of polymer decomposition and is superimposed on the endo-effect, which is the consequence of bonds breaking in the polymer. Another exothermic peak is observed at 520.4 °C. The exothermic peak is associated with the maximum thermal decomposition of the epoxy binder.
Since the upper limit of the operating temperature for polymeric materials is determined by the temperature at which the weight loss is no more than 5%, the upper limit of the operating temperature for the epoxy binder is 306 °C, and for the composite with 30 wt.% wheat straw it is 264 °C.

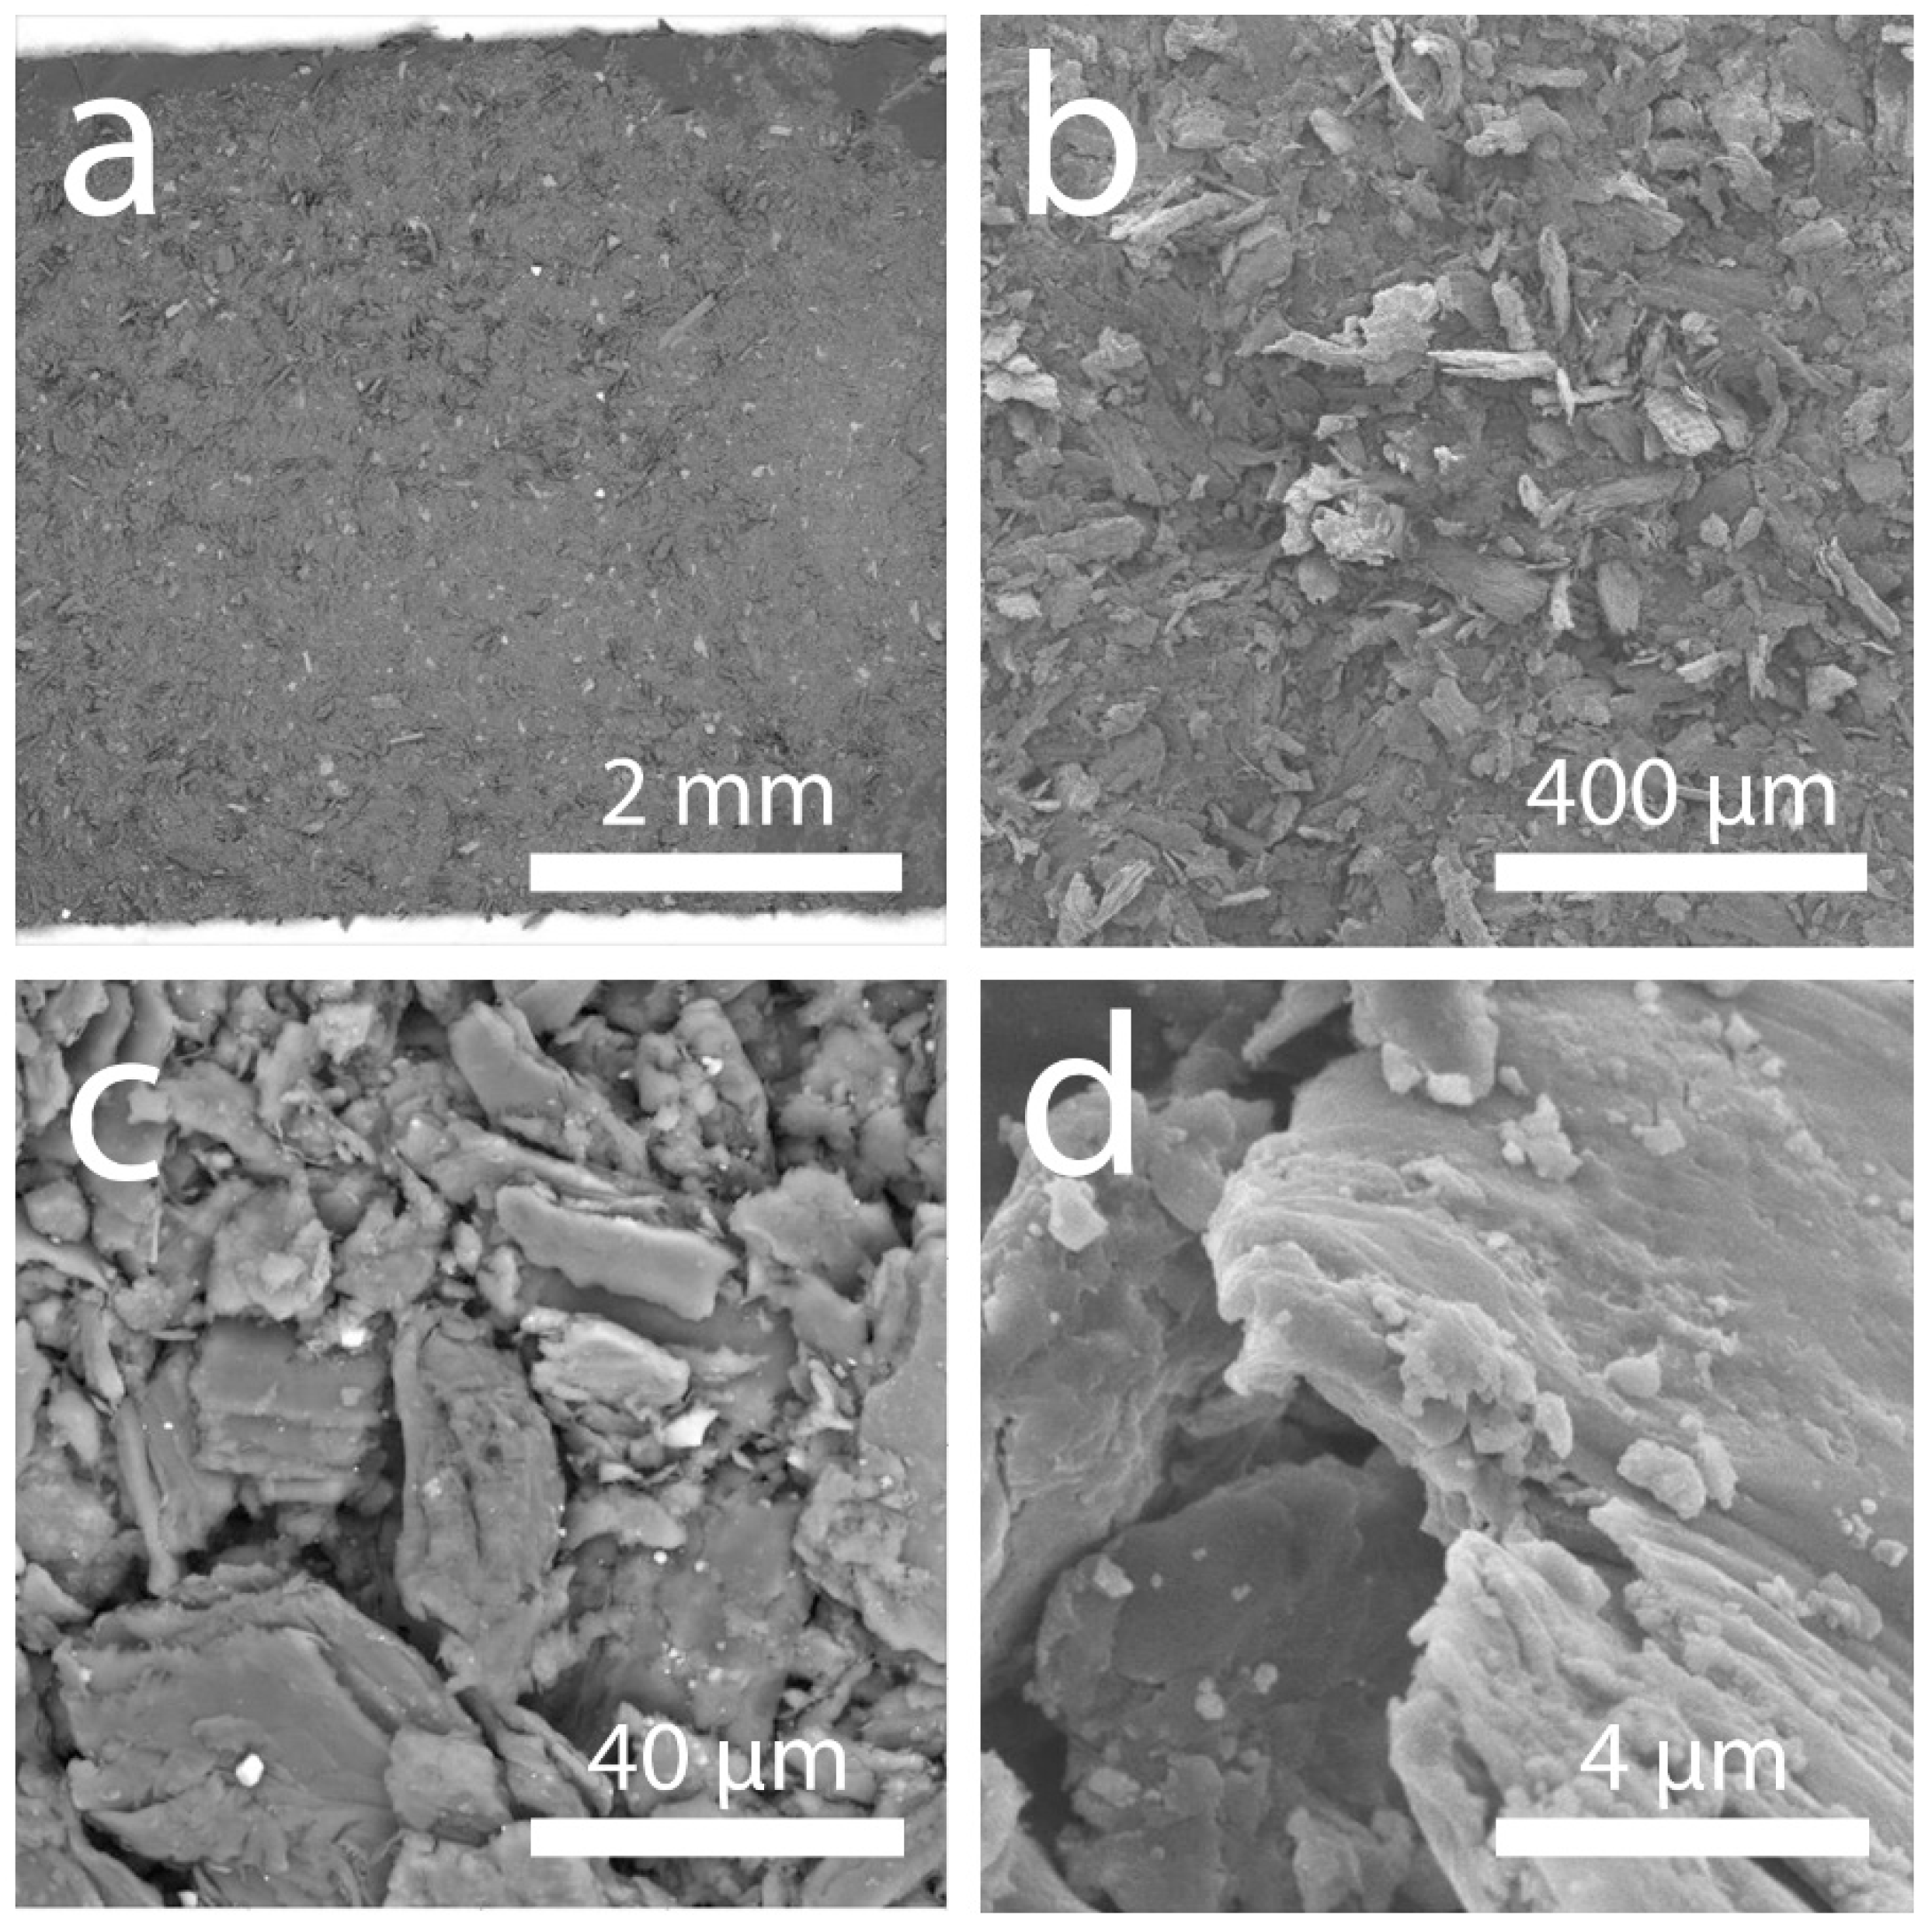
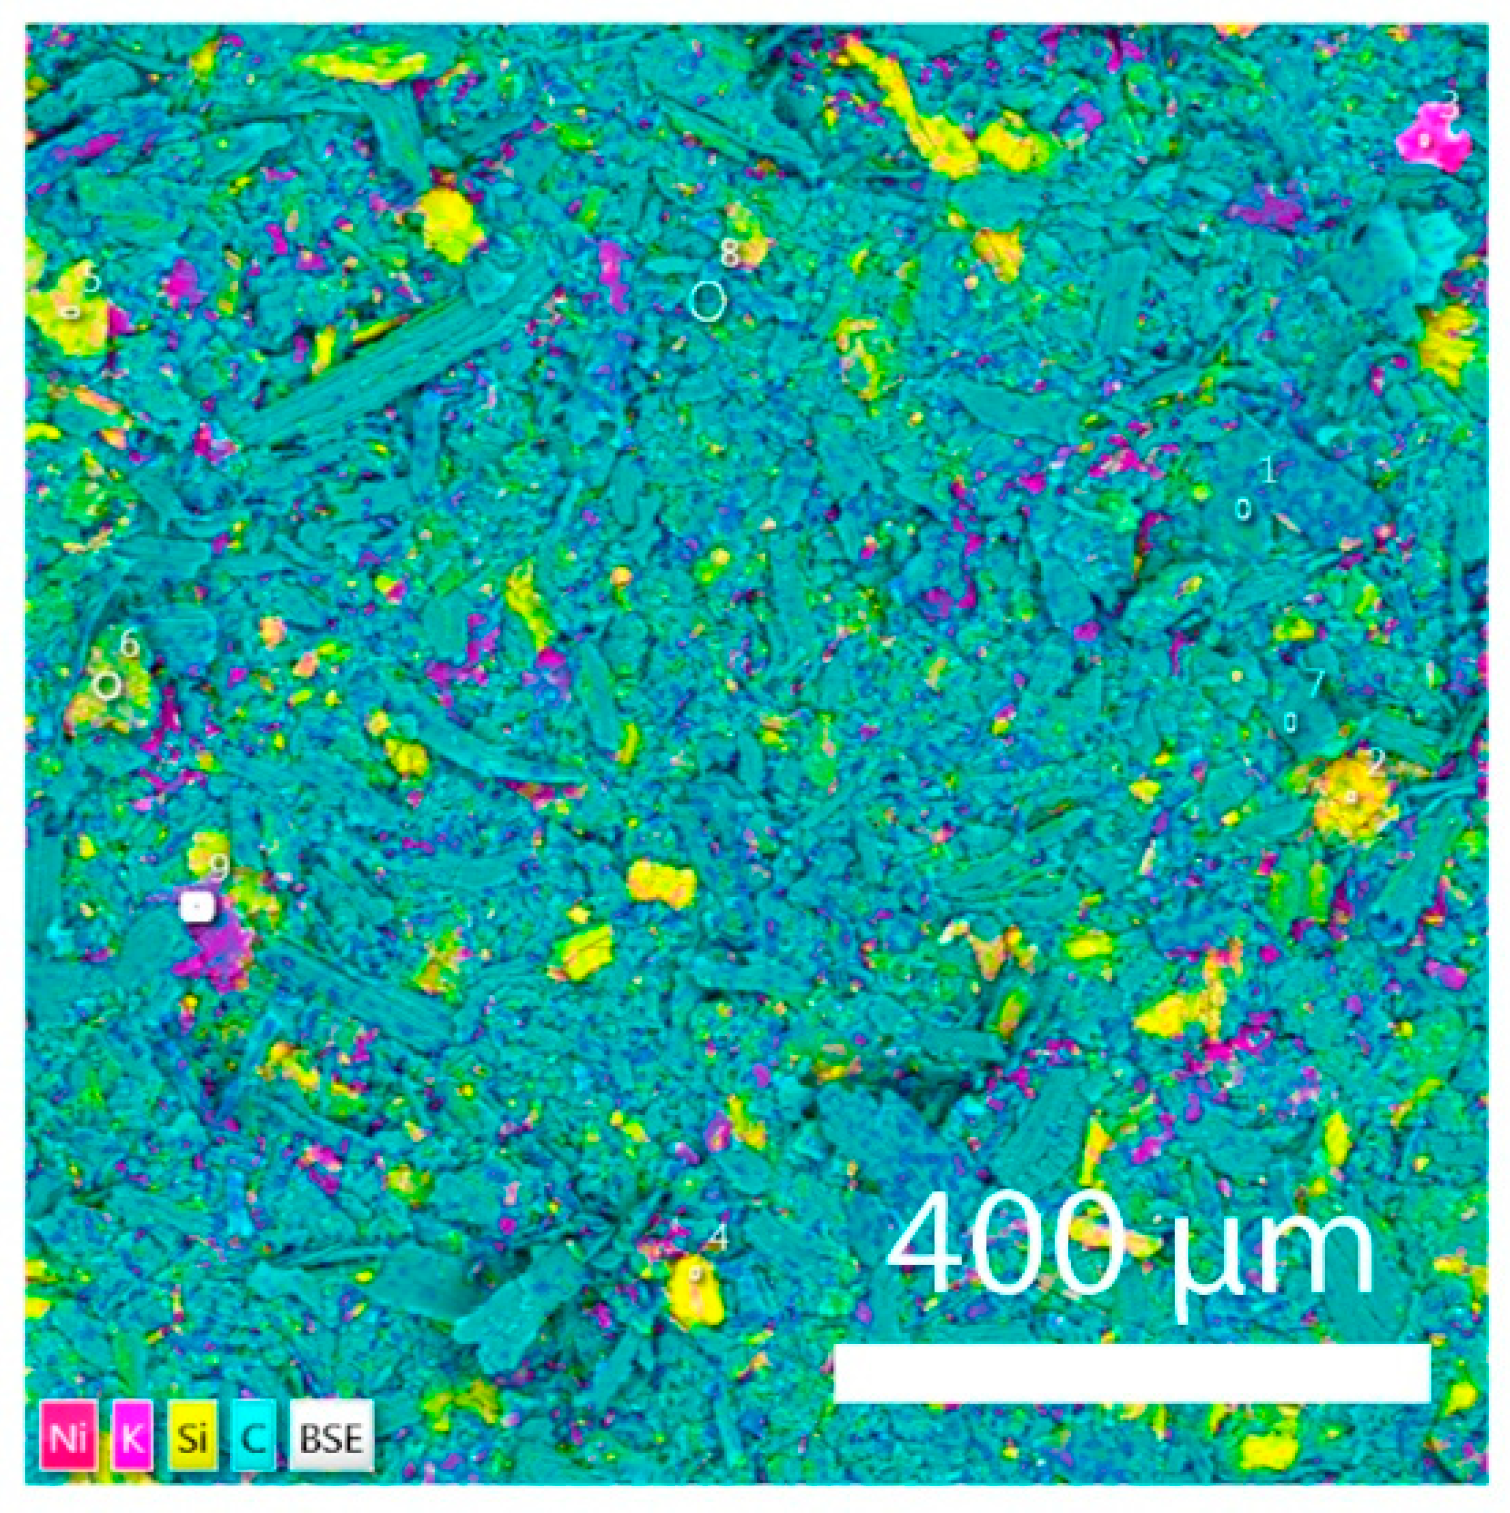
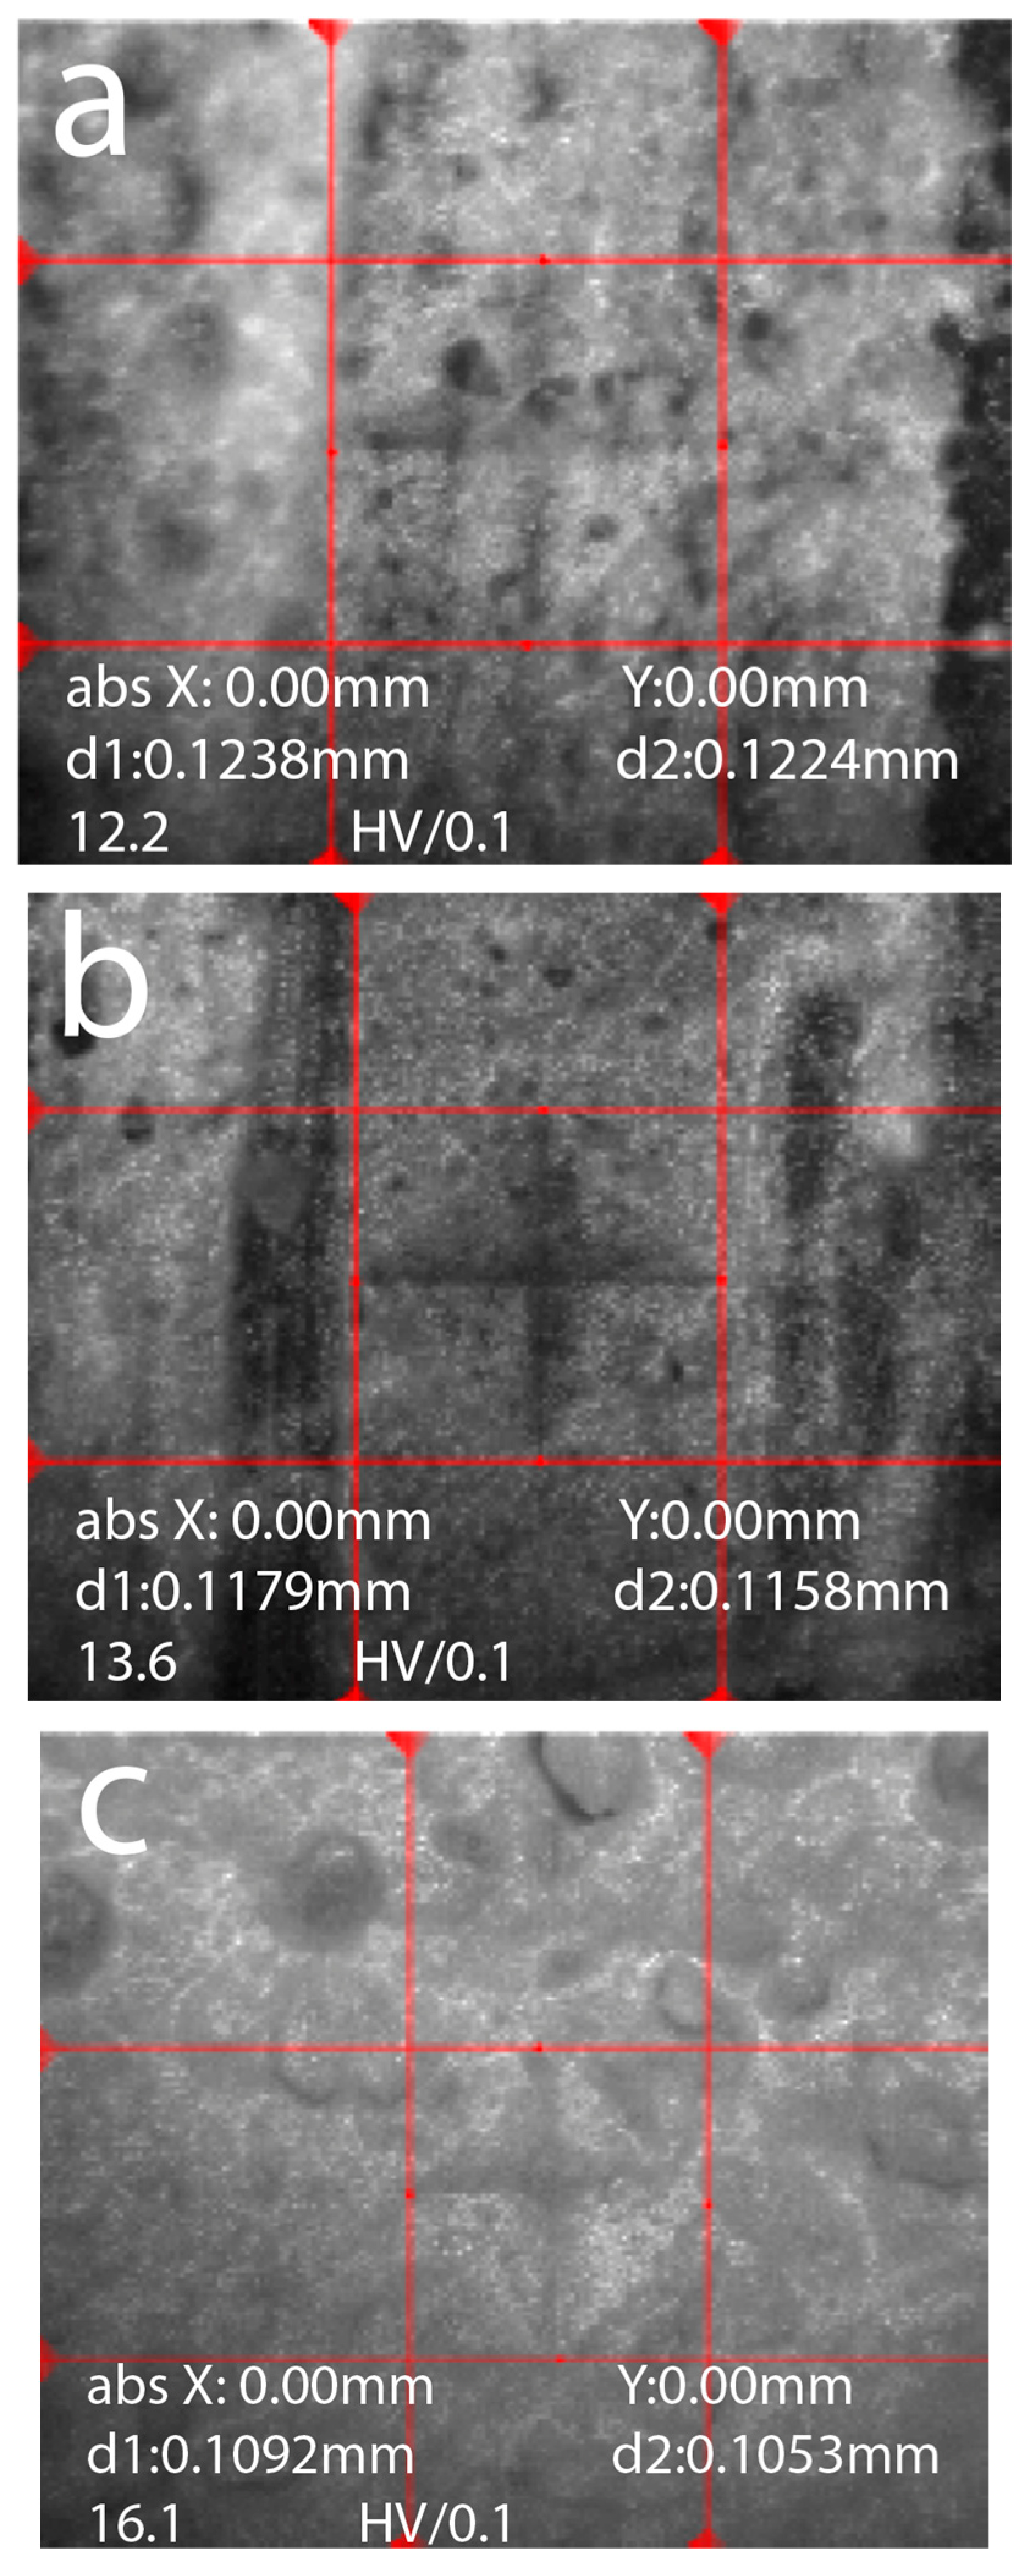
3.4. Surface Structure of Composites

Figure 10 shows optical photos of pure epoxy resin without filler and composites with 30 and 50 wt.% wheat straw powder.
The obtained optical microphotographs of composites with plant raw materials (Figure 10) show that there is a good compatibility of the polymeric binder and wheat straw in the developed composites. No chipping or delamination is observed in the images. The boundaries between the filler and the matrix are blurred. According to optical microscopy data, the obtained materials have a void-free structure.
In order to analyze the surface structure and thin near-surface layers of the developed composites with wheat straw, the surface microhardness of the composites was investigated.
Table 5 presents the Vickers microhardness data (at 100 g load) of composites with different filler contents. The measurements were carried out 5 times for each sample. In the table, average microhardness values are presented. Figure 11 shows the obtained tetrahedral pyramidal imprints on the examined samples.
The analysis of the obtained data on the microhardness of composites with wheat straw (Table 5) showed that the introduction of wheat straw leads to an increase in microhardness of the composite surface.

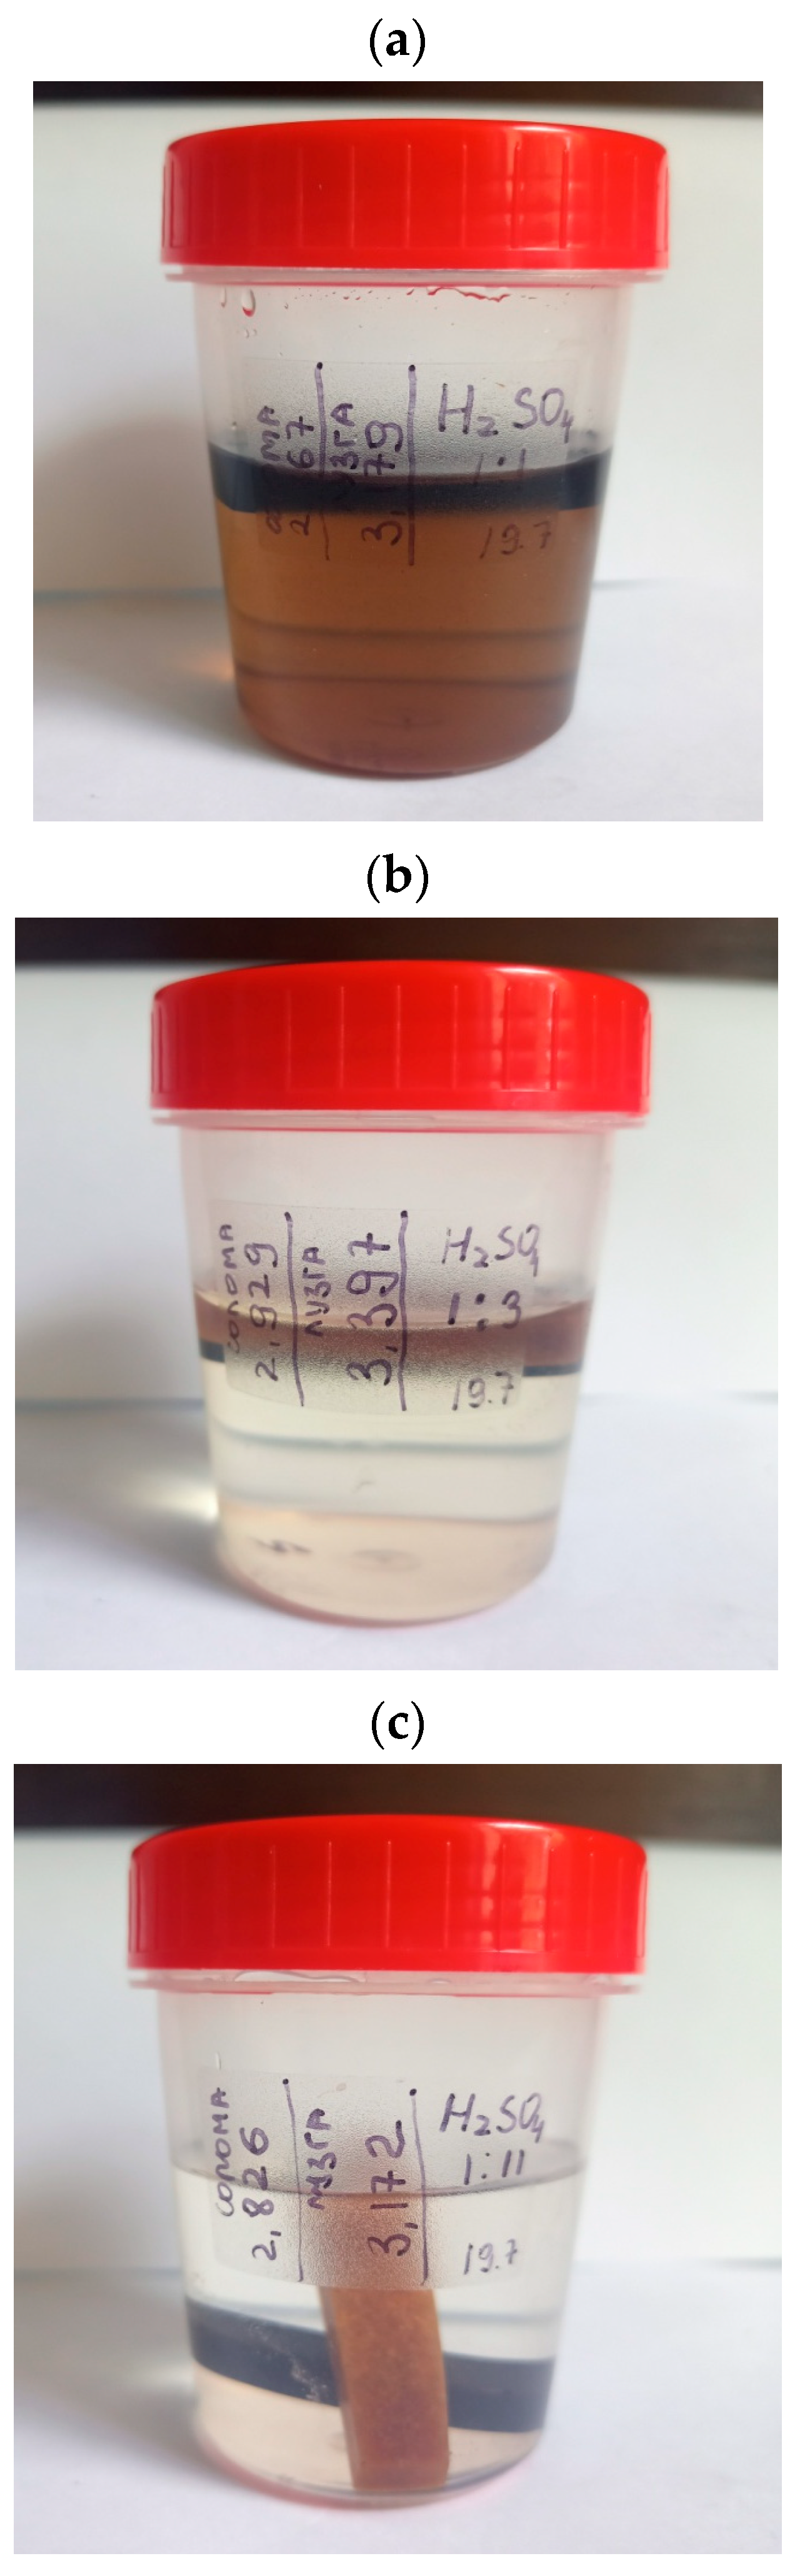
3.5. Behavior of Composites in an Aggressive Environment

To study the behavior of the samples of polymer composites with finely dispersed particles from plant raw materials in an aggressive environment, sulfuric acid (H2SO4) of the following concentrations was used: 1:1, 1:3, and 1:11. The samples were kept in containers with the acid for a month to study the effect of the environment.
Figure 12 shows the photos of polymer composites with wheat straw powder (filler content 30 wt.%) after a month’s soaking in the acid.
Figure 12 shows that with increasing acid concentration there is a significant change in the color of the solution after one month of the exposure of the composite. This may indicate the degradation of the composites due to the acid oxidation reactions in the samples. At the lowest acid concentration of 1:11 the solution practically did not change and remained transparent (Figure 12c). At the acid concentration of 1:3 a slight darkening of the solution was observed (Figure 12b). At the highest acid concentration of 1:1, however, the solution darkened completely (Figure 12a).
The weight change of polymer composites with different filler content after soaking in acid was studied. Table 6 presents the data on the weight change of polymer composites after soaking in acid at different concentrations.
It is noticeable that after soaking in the acid the weight of the samples increases. It can be explained by the fact that under the influence of sulfuric acid there occurs degradation (oxidation) first of surface layers and then of deep layers of polymer composites, and some part of the water-acid solution remains in the pores of the composite, thereby increasing its weight. It should be noted that initially the water absorption of all polymer composites was equal to zero.

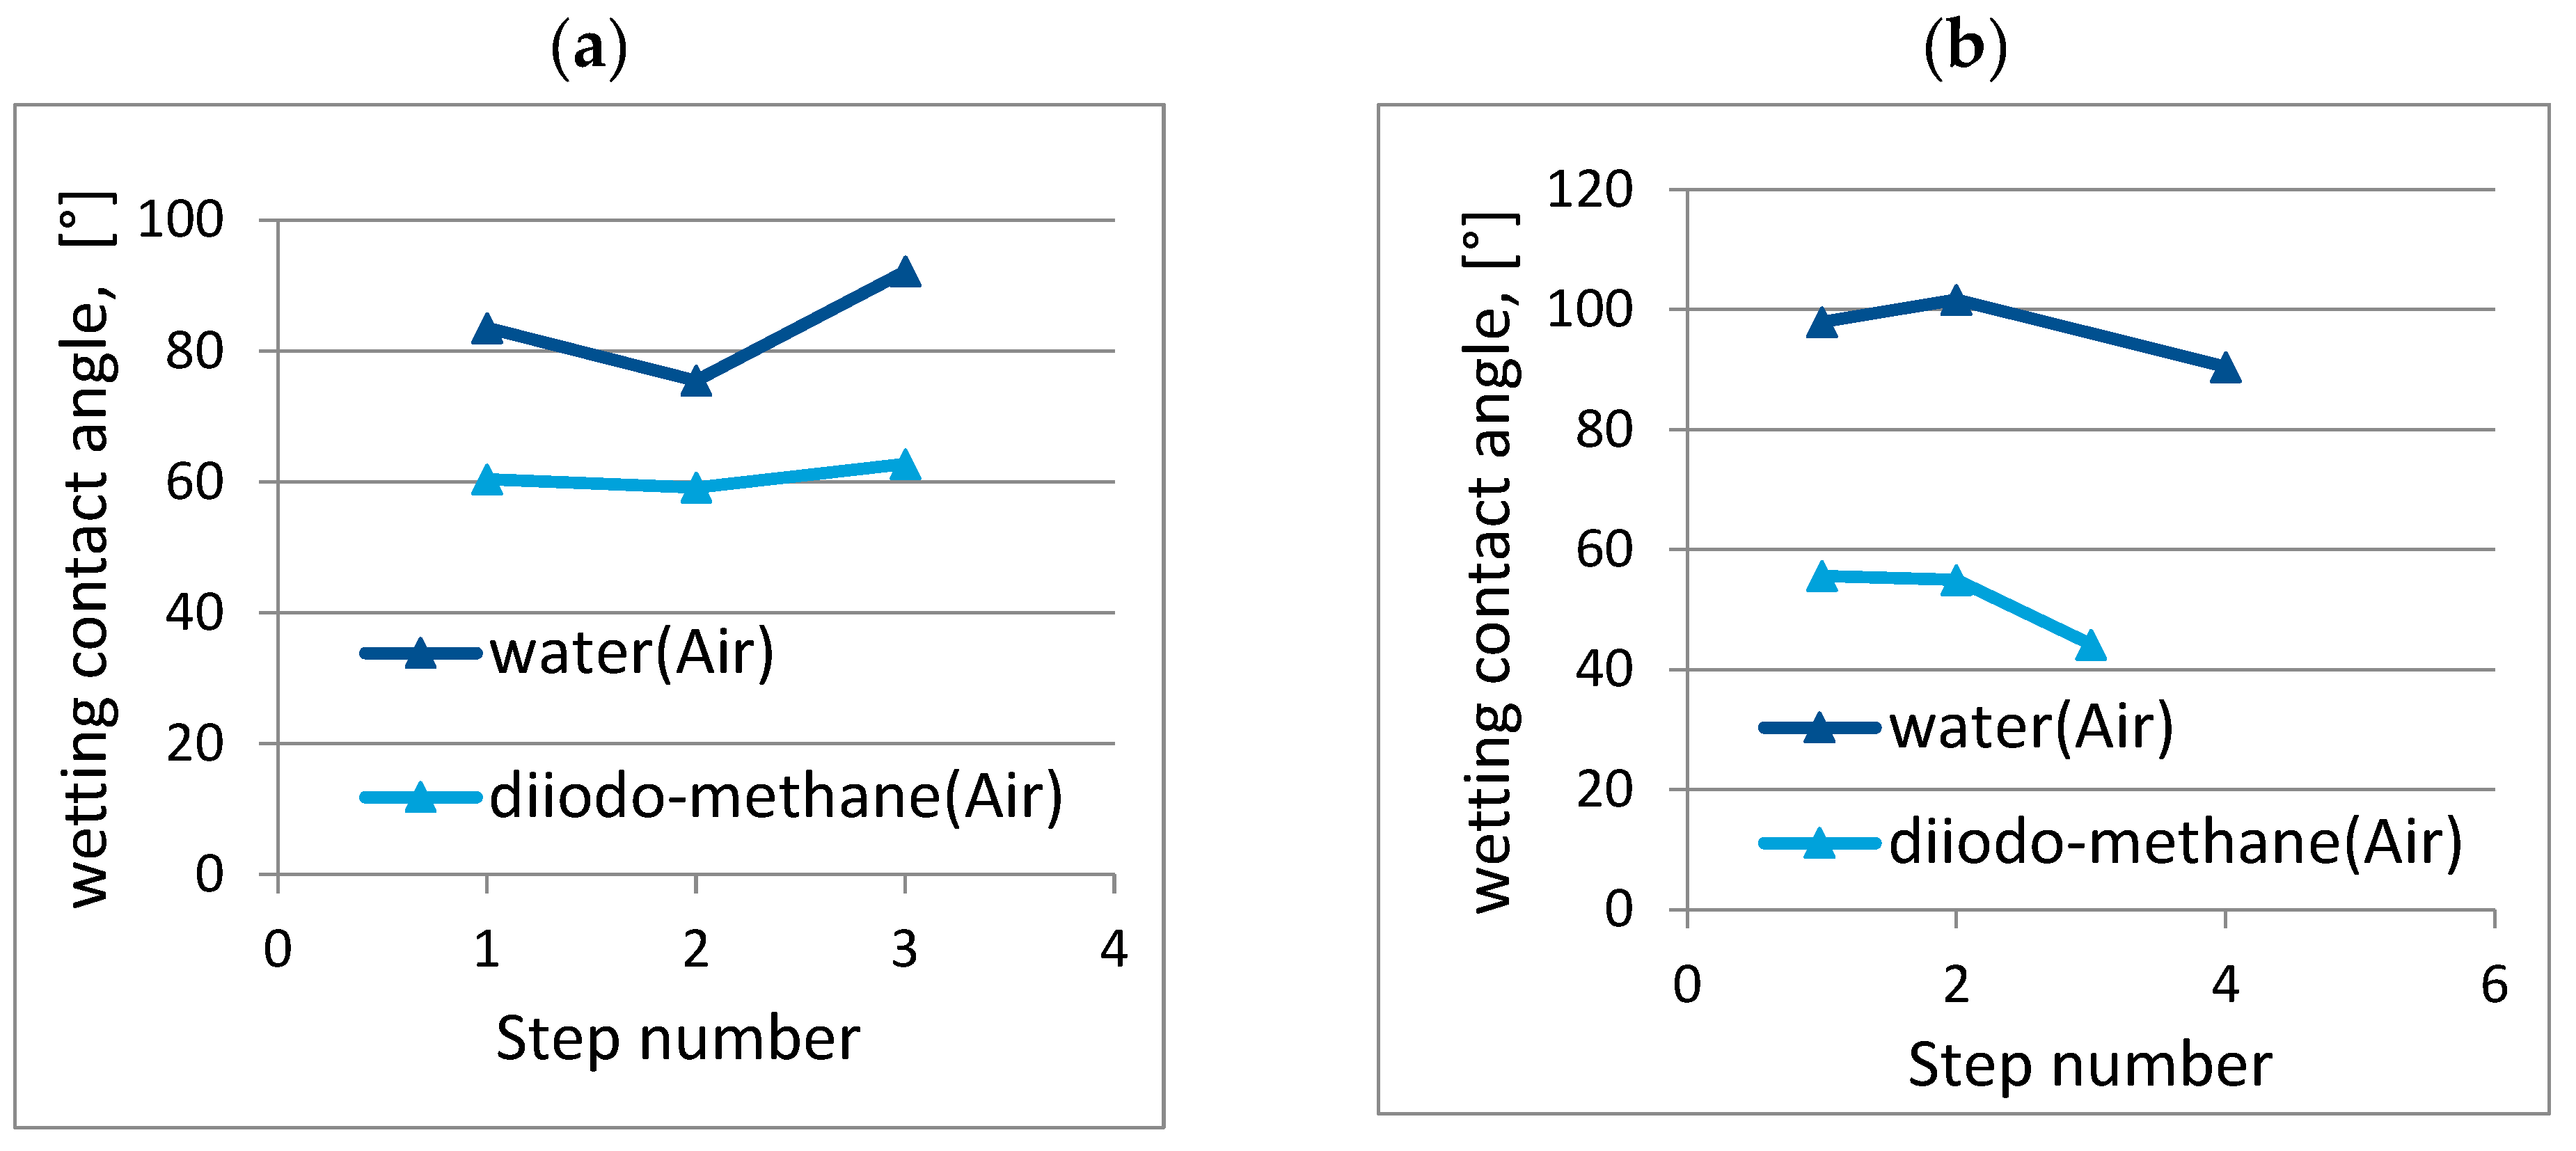
3.6. Wettability of the Composite Surface

The influence of wheat straw filler on the hydrophobic–hydrophilic balance of the composite surface was studied. The hydrophobicity of the sample surface of pure epoxy resin without filler and the composite containing 30 wt.% of wheat straw was evaluated by measuring the wetting contact angle.
Figure 13 shows the measured wetting contact angle of the pure epoxy resin sample without filler and the composite containing 30 wt.% wheat straw. The contact angle was measured three times; then the arithmetic mean was calculated.
The average value of the wetting contact angle of the pure epoxy sample is 84.96 ± 9.03°. Thus, the surface of polymer matrix shows a hydrophilic character. Introduction of 30 wt.% of wheat straw powder filler transforms the surface into hydrophobic one (average value of water wetting contact angle is 96.69 ± 5.71°).
Using the values of the water and diiodomethane wetting contact angle, the free surface energy (surface layer energy) of a pure epoxy resin sample without a filler and a composite containing 30 wt.% wheat straw was calculated.
The surface energy (γ) and its polar (γp) and dispersive (γd) components were determined using OWRK (Owens–Wendt–Rabel–Kaelble) according to the following formula:
( 1 + cos θ ) · γ L 2 · γ L d = γ S p · γ L p γ L d + γ S d
where: γS, γL—surface energy of solids and surface tension of liquids;  γ S p ,   γ S d ,   γ L p ,   γ L p  are polar and dispersive components of the surface energy of a solid and the surface tension of a liquid, respectively.
Table 7 presents the results of the calculated values of surface energy and its polar and dispersed components for the sample of pure epoxy resin without filler and the composite containing 30 wt.% of wheat straw.
According to Table 7, the polar component of the free surface energy (γp) of both the pure polymer and the composite with wheat straw powder is significantly less than the nonpolar component (γd). It can be noted that the values of the free surface energy of both the polymer and the composite are almost identical, but the values of the nonpolar component for the polymer are about an order of magnitude greater than those for the composite with 30 wt.% wheat straw content.

4. Conclusions

(1)
The possibility of using a plant-based filler, that is wheat straw, for the synthesis of polymer composites was established. The optimum content of wheat straw powder in the polymer composite material was revealed—30 wt.%.
(2)
Introduction of wheat straw in small amounts up to 30 wt.% increases the bending strength of polymer from 18.65 ± 1.12 MPa to 22.61 ± 0.91 MPa, and, when the content is more than 40 wt.%, a decrease of the bending strength is observed.
(3)
The developed composites can be applied in furniture production including tabletops or panels for floors, walls or ceilings as they possess the necessary constructional, waterproof (hydrophobic surface of composites) properties. The developed composites can replace traditionally used wood materials.
(4)
Future research will focus on expanding the types of plant-based fillers for polymer composites.

Author Contributions

Conceptualization, N.I.C.; methodology, validation, N.I.C. and Z.V.P.; formal analysis, S.N.D.; investigation, D.S.M. and D.V.P.; writing—original draft preparation, D.V.P.; writing—review and editing, D.A.R.; supervision, N.I.C.; funding acquisition, N.I.C. All authors have read and agreed to the published version of the manuscript.

Funding

This work was realized using the equipment of the High Technology Center of BSTU named after V.G. Shukhov, and followed the framework of the State Assignment of the Ministry of Education and Science of the Russian Federation, project No. FZWN-2021-0015.

Data Availability Statement

Data sharing not applicable.

Conflicts of Interest

The authors declare no conflict of interest. The funders had no role in the design of the study; in the collection, analyses, or interpretation of data; in the writing of the manuscript; or in the decision to publish the results.

References

  1. Väisänen, T.; Haapala, A.; Lappalainen, R.; Tomppo, L. Utilization of agricultural and forest industry waste and residues in natural fiber-polymer composites: A review. Waste Manag. 2016, 54, 62–73. [Google Scholar] [CrossRef]
  2. Treinyte, J.; Bridziuviene, D.; Urboniene-Fataraite, E.; Rajan, R.; Cesoniene, L.; Grazuleviciene, V. Forestry wastes filled polymer composites for agricultural use. J. Clean. Prod. 2018, 205, 388–406. [Google Scholar] [CrossRef]
  3. Huang, C.-C.; Chang, C.-W.; Jahan, K.; Wu, T.-M.; Shih, Y.-F. Effects of the Grapevine Biochar on the Properties of PLA Composites. Materials 2023, 16, 816. [Google Scholar] [CrossRef] [PubMed]
  4. Scaffaro, R.; Citarrella, M.C.; Morreale, M. Green Composites Based on Mater-Bi® and Solanum lycopersicum Plant Waste for 3D Printing Applications. Polymers 2023, 15, 325. [Google Scholar] [CrossRef]
  5. Rigail-Cedeño, A.; Lazo, M.; Gaona, J.; Delgado, J.; Tapia-Bastidas, C.V.; Rivas, A.L.; Adrián, E.; Perugachi, R. Processability and Physical Properties of Compatibilized Recycled HDPE/Rice Husk Biocomposites. J. Manuf. Mater. Process. 2022, 6, 67. [Google Scholar] [CrossRef]
  6. Mohite, A.S.; Jagtap, A.R.; Avhad, M.S.; More, A.P. Recycling of major agriculture crop residues and its application in polymer industry: A review in the context of waste to energy nexus. Energy Nexus 2022, 7, 100134. [Google Scholar] [CrossRef]
  7. Kenawy, E.-R.; Seggiani, M.; Hosny, A.; Rashad, M.; Cinelli, P.; Saad-Allah, K.M.; El-Sharnouby, M.; Shendy, S.; Azaam, M.M. Superabsorbent composites based on rice husk for agricultural applications: Swelling behavior, biodegradability in soil and drought alleviation. J. Saudi Chem. Soc. 2021, 25, 101254. [Google Scholar] [CrossRef]
  8. Sun, J.; Shen, J.; Chen, S.; Cooper, M.A.; Fu, H.; Wu, D.; Yang, Z. Nanofiller Reinforced Biodegradable PLA/PHA Composites: Current Status and Future Trends. Polymers 2018, 10, 505. [Google Scholar] [CrossRef]
  9. Al-Shalawi, F.D.; Hanim, M.A.A.; Ariffin, M.K.A.; Kim, C.L.S.; Brabazon, D.; Calin, R.; Al-Osaimi, M.O. Biodegradable synthetic polymer in orthopaedic application: A review. Mater. Today Proc. 2023, 74, 540–546. [Google Scholar] [CrossRef]
  10. Parente, J.F.; Sousa, V.I.; Marques, J.F.; Forte, M.A.; Tavares, C.J. Biodegradable Polymers for Microencapsulation Systems. Adv. Polym. Technol. 2022, 2022, 4640379. [Google Scholar] [CrossRef]
  11. Sundarababu, J.; Anandan, S.S.; Griskevicius, P. Evaluation of mechanical properties of biodegradable coconut shell/rice husk Powder polymer composites for light weight applications. Mater. Today Proc. 2021, 39, 1241–1247. [Google Scholar] [CrossRef]
  12. Tinoco, M.P.; Gouvêa, L.; de Cássia Magalhães Martins, K.; Filho, R.D.T.; Reales, O.A.M. The use of rice husk particles to adjust the rheological properties of 3D printable cementitious composites through water sorption. Constr. Build. Mater. 2023, 365, 130046. [Google Scholar] [CrossRef]
  13. Deepan, S.; Jeyakumar, R.; Mohankumar, V.; Manojkumar, A. Influence of rice husk fillers on mechanical properties of banana/epoxy natural fiber hybrid composites. Mater. Today Proc. 2022, 74, 575–580. [Google Scholar] [CrossRef]
  14. Arjmandi, R.; Hassan, A.; Majeed, K.; Zakaria, Z. Rice Husk Filled Polymer Composites. Int. J. Polym. Sci. 2015, 2015, 501471. [Google Scholar] [CrossRef]
  15. Adnan, M.; Siddiqui, A.J.; Ashraf, S.A.; Snoussi, M.; Badraoui, R.; Alreshidi, M.; Elasbali, A.M.; Al-Soud, W.A.; Alharethi, S.H.; Sachidanandan, M.; et al. Polyhydroxybutyrate (PHB)-Based Biodegradable Polymer from Agromyces indicus: Enhanced Production, Characterization, and Optimization. Polymers 2022, 14, 3982. [Google Scholar] [CrossRef]
  16. Prakash, S.O.; Sahu, P.; Madhan, M.; Santhosh, A.J. A Review on Natural Fibre-Reinforced Biopolymer Composites: Properties and Applications. Int. J. Polym. Sci. 2022, 2022, 7820731. [Google Scholar] [CrossRef]
  17. Jeon, J.S.; Han, D.H.; Shin, B.Y. Improvements in the Rheological Properties, Impact Strength, and the Biodegradability of PLA/PCL Blend Compatibilized by Electron-Beam Irradiation in the Presence of a Reactive Agent. Adv. Mater. Sci. Eng. 2018, 2018, 5316175. [Google Scholar] [CrossRef]
  18. Tokiwa, Y.; Calabia, B.P.; Ugwu, C.U.; Aiba, S. Biodegradability of Plastics. Int. J. Mol. Sci. 2009, 10, 3722–3742. [Google Scholar] [CrossRef] [PubMed]
  19. Vikhareva, I.N.; Buylova, E.A.; Yarmuhametova, G.U.; Aminova, G.K.; Mazitova, A.K. An Overview of the Main Trends in the Creation of Biodegradable Polymer Materials. J. Chem. 2021, 2021, 5099705. [Google Scholar] [CrossRef]
  20. Kruszkowska- Olewnik, E.; Burkowska-But, A.; Tarach, I.; Walczak, M.; Jakubowska, E. Biodegradation of polylactide-based composites with an addition of a compatibilizing agent in different environments. Int. Biodeterior. Biodegrad. 2020, 147, 104840. [Google Scholar] [CrossRef]
  21. Zhang, C.; Quirino, L.R.; Sun, J. Biobased Polymers and Composites. Int. J. Polym. Sci. 2018, 2018, 7693489. [Google Scholar] [CrossRef]
  22. Shi, T.; Liang, J.; Li, X.; Zhang, C.; Yang, H. Improving the Corrosion Resistance of Aluminum Alloy by Creating a Superhydrophobic Surface Structure through a Two-Step Process of Etching Followed by Polymer Modification. Polymers 2022, 14, 4509. [Google Scholar] [CrossRef] [PubMed]
  23. Wang, X.; Zhang, Z.; Hadjichristidis, N. Poly(amino ester)s as an emerging synthetic biodegradable polymer platform: Recent developments and future trends. Prog. Polym. Sci. 2023, 136, 101634. [Google Scholar] [CrossRef]
  24. Hill, A.; Ronan, W. Relationship between failure strain, molecular weight, and chain extensibility in biodegradable polymers. J. Mech. Behav. Biomed. Mater. 2023, 139, 105663. [Google Scholar] [CrossRef]
  25. Taurino, R.; Bondioli, F.; Messori, M. Use of different kinds of waste in the construction of new polymer composites: Review. Mater. Today Sustain. 2023, 21, 100298. [Google Scholar] [CrossRef]
  26. Islam, M.; Kovalcik, A.; Hasan, M.; Thakur, V.K. Natural Fiber Reinforced Polymer Composites. Int. J. Polym. Sci. 2015, 2015, 813568. [Google Scholar] [CrossRef]
  27. Parameswaranpillai, J.; Gopi, A.J.; Radoor, S.; Dominic, C.M.; Krishnasamy, S.; Deshmukh, K.; Hameed, N.; Salim, N.V.; Sienkiewicz, N. Turning waste plant fibers into advanced plant fiber reinforced polymer composites: A comprehensive review. Compos. Part C Open Access 2023, 10, 100333. [Google Scholar] [CrossRef]
  28. Matykiewicz, D.; Barczewski, M.; Mousa, M.S.; Sanjay, M.R.; Siengchin, S. Impact Strength of Hybrid Epoxy–Basalt Composites Modified with Mineral and Natural Fillers. ChemEngineering 2021, 5, 56. [Google Scholar] [CrossRef]
  29. Patiño, A.A.B.; Lassalle, V.L.; Horst, M.F. Magnetic hydrocharnanocomposite obtained from sunflower husk: A potential material for environmental remediation. J. Mol. Struct. 2021, 1239, 130509. [Google Scholar] [CrossRef]
  30. Marques, B.; Tadeu, A.; António, J.; Almeida, J.; de Brito, J. Mechanical, thermal and acoustic behaviour of polymer-based composite materials produced with rice husk and expanded cork by-products. Constr. Build. Mater. 2020, 239, 117851. [Google Scholar] [CrossRef]
  31. Barczewski, M.; Sałasińska, K.; Szulc, J. Application of sunflower husk, hazelnut shell and walnut shell as waste agricultural fillers for epoxy-based composites: A study into mechanical behavior related to structural and rheological properties. Polym. Test. 2019, 75, 1–11. [Google Scholar] [CrossRef]
  32. Peiji, G.; Yinbo, Q.; Xin, Z.; Mingtian, Z.; Yongcheng, D. Screening microbial strain for improving the nutritional value of wheat and corn straws as animal feed. Enzym. Microb. Technol. 1997, 20, 581–584. [Google Scholar] [CrossRef]
  33. Giovannozzi-Sermanni, G.; D’Annibale, A.; Crestini, C. Solid state fermentation of wheat straw for paper production. In Advances in Solid State Fermentation; Roussos, S., Lonsane, B.K., Raimbault, M., Viniegra-Gonzalez, G., Eds.; Springer: Dordrecht, The Netherlands, 1997. [Google Scholar] [CrossRef]
  34. Masłowski, M.; Miedzianowska, J.; Delekta, M.; Czylkowska, A.; Strzelec, K. Natural Rubber Biocomposites Filled with Phyto-Ashes Rich in Biogenic Silica Obtained from Wheat Straw and Field Horsetail. Polymers 2021, 13, 1177. [Google Scholar] [CrossRef]
  35. Zhang, Y.; Xu, X. Machine learning tensile strength and impact toughness of wheat straw reinforced composites. Mach. Learn. Appl. 2021, 6, 100188. [Google Scholar] [CrossRef]
  36. Yu, M.; Huang, R.; He, C.; Wu, Q.; Zhao, X. Hybrid Composites from Wheat Straw, Inorganic Filler, and Recycled Polypropylene: Morphology and Mechanical and Thermal Expansion Performance. Int. J. Polym. Sci. 2016, 2016, 2520670. [Google Scholar] [CrossRef]
  37. Tong, J.; Wang, H.; Kuai, B.; Gao, J.; Zhang, Y.; Huang, Z.; Cai, L. Development of transparent composites using wheat straw fibers for light-transmitting building applications. Ind. Crops Prod. 2021, 170, 113685. [Google Scholar] [CrossRef]
  38. Jiang, D.; An, P.; Cui, S.; Sun, S.; Zhang, J.; Tuo, T. Effect of Modification Methods of Wheat Straw Fibers on Water Absorbency and Mechanical Properties of Wheat Straw Fiber Cement-Based Composites. Adv. Mater. Sci. Eng. 2020, 2020, 5031025. [Google Scholar] [CrossRef]
  39. Qudoos, A.; Ullah, Z.; Atta-ur-Rehman; Baloch, Z. Performance Evaluation of the Fiber-Reinforced Cement Composites Blended with Wheat Straw Ash. Adv. Mater. Sci. Eng. 2019, 2019, 1835764. [Google Scholar] [CrossRef]
  40. Jiang, D.; Jiang, D.; Lv, S.; Cui, S.; Sun, S.; Song, X.; He, S.; Zhang, J. Effect of modified wheat straw fiber on properties of fiber cement-based composites at high temperatures. J. Mater. Res. Technol. 2021, 14, 2039–2060. [Google Scholar] [CrossRef]
  41. Leishan, C.; Cunjing, W.; Yu, M.; Gairong, C. A New and Environmentally Friendly Route for Preparation of Carbon Microspheres from Wheat Straw. Sci. World J. 2023, 2013, 146930. [Google Scholar] [CrossRef] [PubMed]
  42. Huda, S.; Yang, Y. Chemically extracted cornhusk fibers as reinforcement in light-weight poly (propylene) composites. Macromol. Mater. Eng. 2008, 293, 235–243. [Google Scholar] [CrossRef]
Figure 1. Photo of wheat straw powder.
Chemengineering 07 00038 g001
Figure 2. X-ray powder diffractogram of wheat straw powder.
Chemengineering 07 00038 g002
Figure 3. Fractional composition of wheat straw powder.
Chemengineering 07 00038 g003
Figure 4. SEM images of the surface of wheat straw particles at different magnifications (ad).
Chemengineering 07 00038 g004
Figure 5. Spectrum of energy dispersive microanalysis of wheat straw powder.
Chemengineering 07 00038 g005
Figure 6. Full multilayer EDS map of wheat straw powder.
Chemengineering 07 00038 g006
Figure 7. FT-IR spectrum of wheat straw powder.
Chemengineering 07 00038 g007
Figure 8. TG and DTA curves of wheat straw powder.
Chemengineering 07 00038 g008
Figure 9. TGA and DTA curves for the composite containing 30 wt.% wheat straw powder.
Chemengineering 07 00038 g009
Figure 10. Optical microphotographs of polymer binder surface (a) and composites with wheat straw and filler content: (b)—30 wt.%; (c)—50 wt.%.
Chemengineering 07 00038 g010
Figure 11. Image of the imprint of microhardness tester indentor when measuring microhardness at a load of 100 g on the surface of polymeric binder (a) and composites with wheat straw with the filler content: (b)—30 wt.%; (c)—50 wt.%.
Chemengineering 07 00038 g011
Figure 12. Photo of polymer composites with wheat straw powder (filler content 30 wt.%) after a month of soaking in acid at concentration: (a)—1:1, (b)—1:3, (c)—1:11.
Chemengineering 07 00038 g012
Figure 13. Wetting contact angle of pure epoxy sample without filler (a) and composite containing 30 wt.%. wheat straw (b).
Chemengineering 07 00038 g013
Table 1. Average density of composites with wheat straw.
Wheat Straw Powder Content, wt.%m, gm1, gρ, g/cm3ρaverage., g/cm3
03.19090.48120.96450.9644
3.25610.49420.9642
3.00640.45240.9646
Wheat straw as a filler
102.93030.31910.97500.9747
3.20420.36210.9741
3.10030.33710.9751
203.16660.31150.97750.9765
3.39120.34950.9764
3.02230.32350.9755
303.43240.32210.97860.9786
3.14080.30390.9779
3.25340.30240.9794
403.15380.28540.97930.9795
3.95870.37310.9785
3.27910.27620.9808
503.29440.26750.98150.9823
3.13860.25380.9824
3.05620.22630.9831
Table 2. Geometric parameters of the studied samples of polymer composites with wheat straw powder.
Wheat Straw Powder Content, wt.%Length, mmThickness, mmWidth, mm
066.614.415.3
1070.915.617.2
2070.715.217.5
3070.614.615.9
4070.214.816.6
5070.315.916.2
Table 3. Results of bending tests of composites.
Filling, wt.%Maximum Load, NMaximum Deformation, mmTensile Strength, MPa
0554.09 ± 33.248.4 ± 0.4218.65 ± 1.12
Wheat straw as a filler
101166.94 ± 93.351.8 ± 0.131.66 ± 1.58
20989.85 ± 79.181.3 ± 0.126.39 ± 2.11
30671.15 ± 33.552.3 ± 0.222.61 ± 0.91
40460.18 ± 27.611.9 ± 0.115.41 ± 1.08
50332.14 ± 23.281.8 ± 0.111.52 ± 1.03
Table 4. Residual weight in composites with wheat straw powder.
Temperature, °CContent of Wheat Straw, wt.%
01020304050
30095.8494.0892.3290.5688.8087.04
40044.6144.0743.5242.9742.4241.88
50032.2232.3532.4832.6132.7432.87
6006.659.0311.4013.7816.1618.54
7005.878.1110.3612.6014.8417.09
8005.877.9310.0012.0614.1316.19
9005.877.749.6111.4813.3415.21
10005.877.529.1710.8212.4614.11
Table 5. Microhardness of composites using Vickers method (HV).
Wheat Straw Powder Content, wt.%
03050
12.02 ± 0.8213.35 ± 1.1317.73 ± 0.82
Table 6. Data on weight changes of polymer composites after soaking in acid.
Type of Filler in Polymer CompositeAcid Concentration
1:11:31:11
Wheat strawInitial weightFinal weightInitial weightFinal weightInitial weightFinal weight
2.862.89
(+1.04%)
2.923.03
(+3.76%)
2.822.97
(+5.32%)
Table 7. Free surface energy of materials.
Type of SampleValue, mN/m
γγdγp
Epoxy resin32.64 ± 4.2728.39 ± 0.964.25 ± 3.31
Composite33.95 ± 3.9533.36 ± 3.130.59 ± 0.83
Disclaimer/Publisher’s Note: The statements, opinions and data contained in all publications are solely those of the individual author(s) and contributor(s) and not of MDPI and/or the editor(s). MDPI and/or the editor(s) disclaim responsibility for any injury to people or property resulting from any ideas, methods, instructions or products referred to in the content.

