Article

Prediction of Particle Suspension State for Various Particle Shapes Used in Slug Flow Crystallization

Laboratory of Plant and Process Design, Department of Biochemical and Chemical Engineering, TU Dortmund University, D-44227 Dortmund, Germany
*
Author to whom correspondence should be addressed.
ChemEngineering 2023, 7(2), 34; https://doi.org/10.3390/chemengineering7020034
Submission received: 3 March 2023 / Revised: 28 March 2023 / Accepted: 3 April 2023 / Published: 12 April 2023

Abstract

:
Particle transport is still an immense challenge in many processes today and affects both the operation and the consistency of the product quality, which is essential in the pharmaceutical industry, for example. Therefore, we developed a suspension correlation of particles in the crystallization process for a slug flow crystallizer in the field of small-scale continuous crystallization in this paper to predict and ensure a reproducible process and consistent product quality. Furthermore, the developed suspension correlation shall provide the possibility to perform mechanistic modeling of the agglomeration behavior depending on the operating parameters in the crystallization process. For this purpose, already existing dimensionless numbers were evaluated and modified employing force balances in order to predict the particle behavior in the liquid compartments in the slug flow crystallizer under different operating conditions and particle shapes of the substance system l-alanine/water using L-glutamic acid as impurity during crystallization.

1. Introduction

The transport of particles is still a challenge in many processes and industrial applications today, affecting the operation, but also the critical quality attributes of products. In this context, it is important to ensure that application properties such as bioavailability, strength, the activity of a heterogeneous catalyst, as well as technical processing product properties (flowability, filtration behavior, miscibility, and others), are not impaired by the transport of the dispersed particles [1,2]. For crystallization, the subject of this publication, this means that homogeneous mixing of the liquid phase, as well as particle suspension, are crucial for producing in-spec products and thus enabling resource-efficient production. Therefore, understanding individual particles’ properties is key to managing the processes of dispersed systems [1,3].
Insufficient suspended particles within crystallization processes lead to reduced mass transfer and consequently reduce the growth of particles present, often resulting in unwanted nucleation occurrence. Furthermore, agglomeration can appear due to increased particle-particle collision probabilities, which is undesirable in most cases, as the purity of the product is reduced by the inclusion of mother liquor and particle size distribution is broadened. Furthermore, deposits can occur in dead zones, if not blockages of the apparatus, which lead to downtime of the plant and production losses [4,5,6].
In the field of small-scale continuous crystallization, producing high-quality products is crucial and knowledge regarding hydrodynamics and particles is decisive, but there are only a few applications for characterizing the particles in the respective crystallizer. In principle, a distinction is made between mixed suspension mixed product removal (MSMPR) crystallizers and tubular crystallizers.
For MSMPR crystallizers, various criteria have been introduced in the literature in order to be able to describe and set the particle suspension state in a vessel in a targeted manner. A complete suspension is considered to be present if the particles remain at the bottom of a crystallizer for a maximum of one second and are immediately whirled up again (1 s criterion). Another criterion is the layer height criterion, which specifies a certain height of the suspended particles (layer height = 0.9) for a suspended state. To achieve the respective criteria for homogeneous suspension, the energy input, e.g., via a stirrer, is often used for approximation. Depending on the apparatus and the overall flow, these estimates can vary in accuracy and precision. In most cases, the correlations used are only valid for the respective operating range, so extrapolation to other operating ranges and application areas is inadequate [1,7,8,9,10].
Despite the correlations available to determine and evaluate particle suspension, the MSMPR crystallizer has disadvantages related to the residence time distribution (RTD), which can lead to an inhomogeneous product. A narrower RTD can be achieved using tubular crystallizers. For tubular crystallizers, the particle suspension behavior cannot be described by an agitated vessel, as in the case of the MSMPR crystallizer, therefore, the consideration of tubular crystallizer suspension behavior is limited. For a solid-liquid flow, different flow patterns can occur depending on the distribution of the particles within the tube. A distinction is made between homogeneous and heterogeneous flow, as well as formed beds (moving or static beds). These regimes depend on the polydispersity of the dispersed medium, the particle concentration, and the velocity of the continuous phase [11].
The crystallizer used in this publication is a special tubular crystallizer called Slug Flow Crystallizer (SFC). It is characterized by its segmented alternating flow of two immiscible fluids. For application in crystallization, using a gas phase as a segmenting medium of the mother liquor is favorable to avoid contamination and further separation efforts to obtain the product phase. Within the liquid segments (slugs), the particles are suspended and induced to grow by imposing supersaturation as the driving force. The shape of the slugs can be adjusted, and different RTDs of the liquid and solid phases can be achieved by a suitable selection of the tubing material and the material system [12,13,14]. For crystallization applications, it is advisable to aim for a narrow RTD in order to achieve the target particle size and its distribution. Therefore, the formation of a wall film should be prevented so that slugs of equal size with a defined residence time in the apparatus can be ensured, enabling uniform growth of all crystals.
However, the same residence time alone is not sufficient; mixing and suspension are also important in a slug. Completely homogeneous mixing of the liquid phase is achieved due to the presence of so-called Taylor vortices [15]. In the ideal case of homogeneous suspension, the particles follow these Taylor vortices so that phenomena such as agglomeration can be reduced to a minimum without external devices [12,16]. Factors influencing the particle suspension state are the flow velocity, the slug length, and the corresponding particle properties [14,17,18,19,20,21]. The crystallization behavior inside the SFC has been described elsewhere [12,22,23,24,25,26,27,28,29].
Some approaches to describe the particle suspension inside slugs have already been used in the literature by applying dimensionless numbers, which can theoretically solve the issue of transferability of suspension criterion to different tubular crystallizers. Starting from a simplified vertical balance on a single particle, the Shield parameter θ was developed and used by Kurup and Basu [30] to describe the suspension behavior of 38 μm glass spheres in liquid-liquid slug flow in a tubing with d i = 0.5 mm. Here, θ describes the ratio of drag force to gravitational force. Since the experiments were performed in the Stokes regime (particle Reynolds number R e P < 0.25 [31]), the assumption of a Stokes’ particle settling velocity can be made. Thus, θ can be described by the slug velocity u slug , the particle diameter d P , the fluid viscosity η, the density difference between particle ρP and fluid ρF, and the acceleration due to gravity g (Equation (1)).
θ = 9 η u slug d P 2 2 ρ P ρ F g
In order to lift and circulate a particle, the drag force must be greater than the gravitational force. The critical value above which a particle is lifted was experimentally determined by Kurup and Basu [30] to θ M = 10, according to the findings of Miller et al. [32]. For values below the critical value, no circulation of particles in the slug was detected, and for θ M > 42, circulation was seen along the entire slug length in the horizontal direction. From this point of view, Kurup and Basu [30] developed the length of circulation zone L c , indicating the distance a single particle is carried in the axial direction before it arrives at a stagnation point of the internal circulation and is transported back to the starting point. L c has been de-dimensioned with the slug radius R (= d i /2) and given as a function of the shield parameter θ or the slug and sinking velocity of a particle u P (Equation (2)).
L c R = 5 2 48 θ = 5 2 24 u s l u g u P
The idea of using θ was adopted by Scheiff [20,33], who examined further experiments in a liquid-liquid slug flow with various spherical catalyst particle diameters up to 100 µm. The limits shown in Table 1 were defined according to specific material system properties used in the experiments by Kurup and Basu [30] and Scheiff [20,33]. The Shields parameter θ has already been successfully applied for the Archimedes tube crystallizer (ATC) [16], another continuous tubular crystallizer with coiled slugs, which is characterized by the superposition of Taylor with Dean vortices.
Furthermore, a radial force balance at the rear end of the vortex was conducted for liquid-liquid slug flow [33], where a particle can leave the main vortex and become trapped in a tail vortex at high particle velocities due to centrifugal and Saffman forces. If the particles are trapped once in this tail vortex, the particles cannot leave this tail again because the applied forces are too small. This effect could not be observed in the gas-liquid slug flow due to the lack of a tail vortex [33].
The shield parameter is alternatively described by Agudo et al. [34] using the drag force and the fluid’s shear rate γ ˙ (Equation (3)). In addition, numerical investigations of fluid forces for spheres in a fixed bed were conducted (ReP = 0.01, variable particle size) to obtain a critical shield parameter for whirling up sedimented particles.
θ Agudo = γ ˙ η d P 2 ρ P ρ F g
Another dimensionless number to describe the suspension state in a special tubular crystallizer, named coiled flow inverter crystallizer (CFIC), was successfully applied by Hohmann et al. [35]. They used the Froude number F r , which indicates the ratio of inertial force to gravitational force (Equation (4)). For characteristic length L, the equivalent diameter d eq is used.
F r = u slug 2 g L
However, due to the complexity of dispersing particles in different systems and apparatuses under different process conditions, the characterization and description of the suspension state is not easily applicable in practice.
We now use this knowledge of particle suspension in the field of crystallization for saturated solutions and in reaction technology for heterogeneous catalysis in order to quantitatively predict it in the slug flow crystallization process. For this purpose, existing experimental results from previous studies [17,21] are combined together with results newly generated in this study to account for the influence of both operating parameters and particle shape. Our hypothesis is that the dimensionless numbers presented above are not sufficiently able to describe particle suspension for non-spherical particles. Our second hypothesis is that it is able to describe the suspension of particles of different shapes at various operating conditions inside the slug flow by combining hydrodynamics in the liquid phase with force balances on a single particle. The superior goal pursued is to develop a predictive correlation of particle suspension, providing operating parameters for a crystallization process, which can be used for modeling slug flow crystallization with consideration of agglomeration behavior for a respective material system with spherical and non-spherical particles.

2. Experimental Investigations of Particle Suspension inside Slugs

This section introduces the used material system, the experimental setup utilized, and the evaluation of the results.

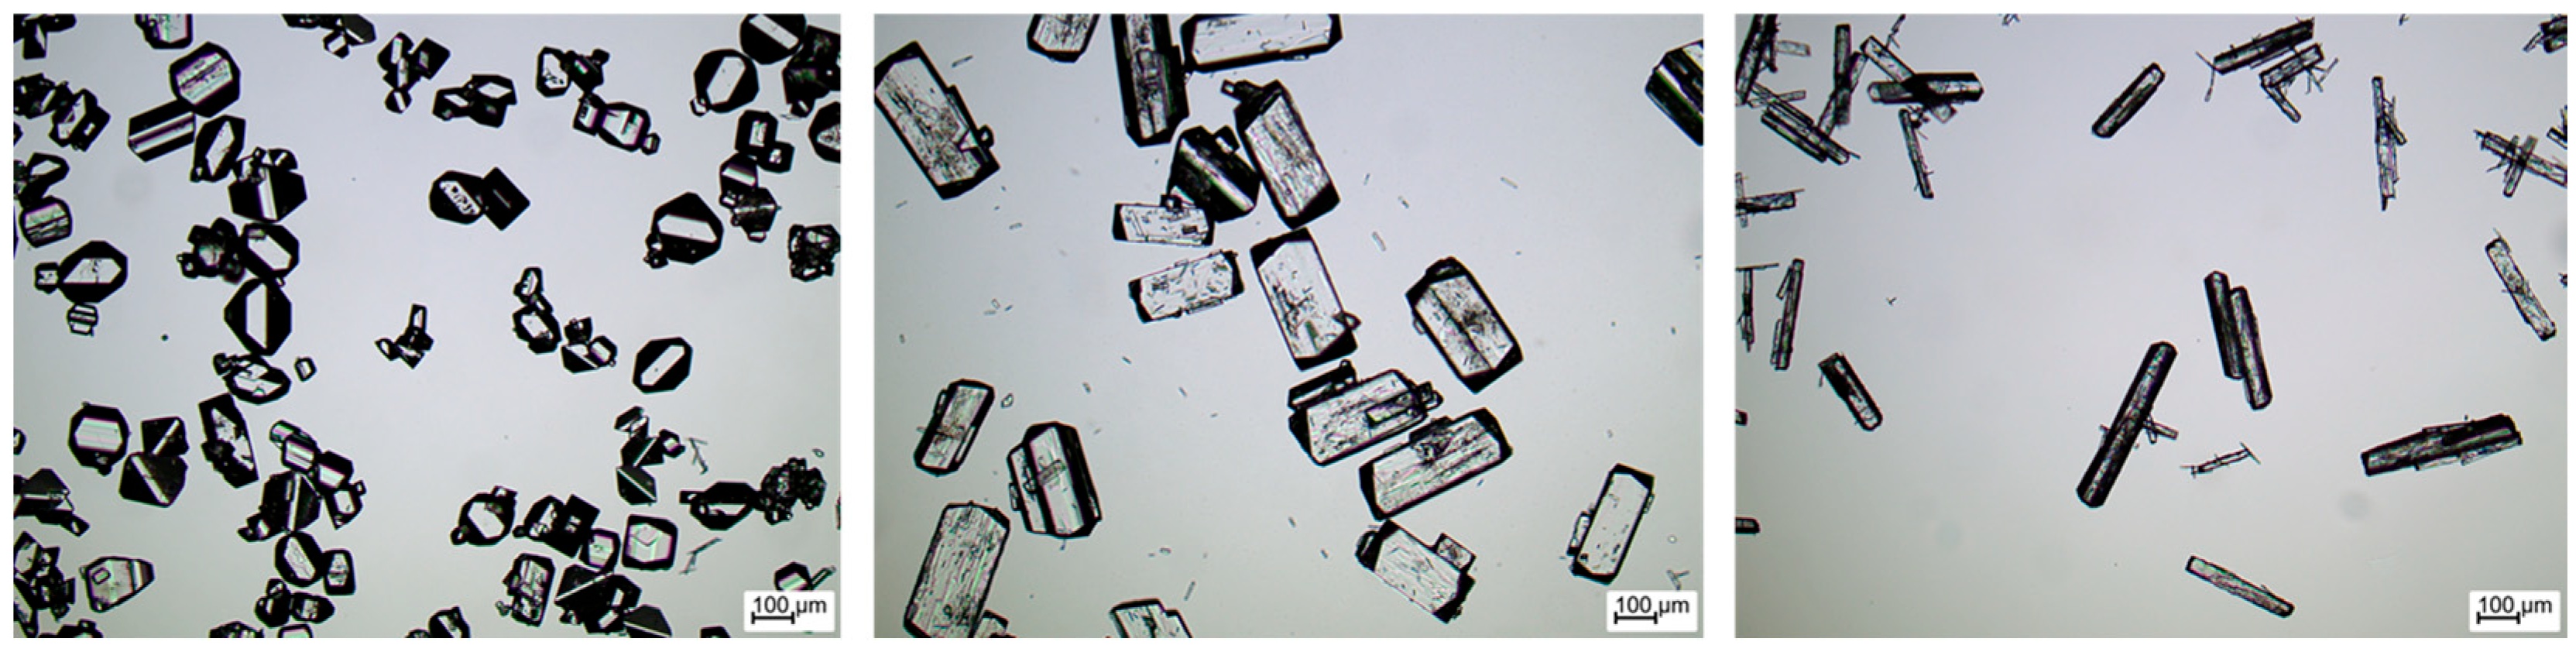
2.1. Material System Used

For the experimental investigations, the solute l-alanine purchased by Evonik Industries AG, Essen, Germany (purity ≥ 99.7%) was used and solved in ultrapure, and bacteria-free water (Milli-Q®, total organic carbon content ≤ 3 ppb, purified by a Milli-Q® Advantage A10 apparatus of Merck KGaA, Darmstadt, Germany). The solubility data of l-alanine in water was utilized according to the regression curve (Equation (5)) obtained by Wohlgemuth et al. [36].
c * g Ala g solution 1 = 0.11238 · e x p 9.0849 · 10 3 · ϑ * ° C
Different shapes (bipyramidal, cuboidal, and needle-like) of l-alanine crystals ( ρ S = 1420 kg m−3) were applied as seed crystals, as shown in Figure 1. The preparation to receive different shaped seed crystals was carried out using l-glutamic acid (purity 99%, Acros OrganicsTM, Fisher Scientific GmbH, Schwerte, Germany) as a habit modifier during crystallization, as described by Steenweg et al. [37].

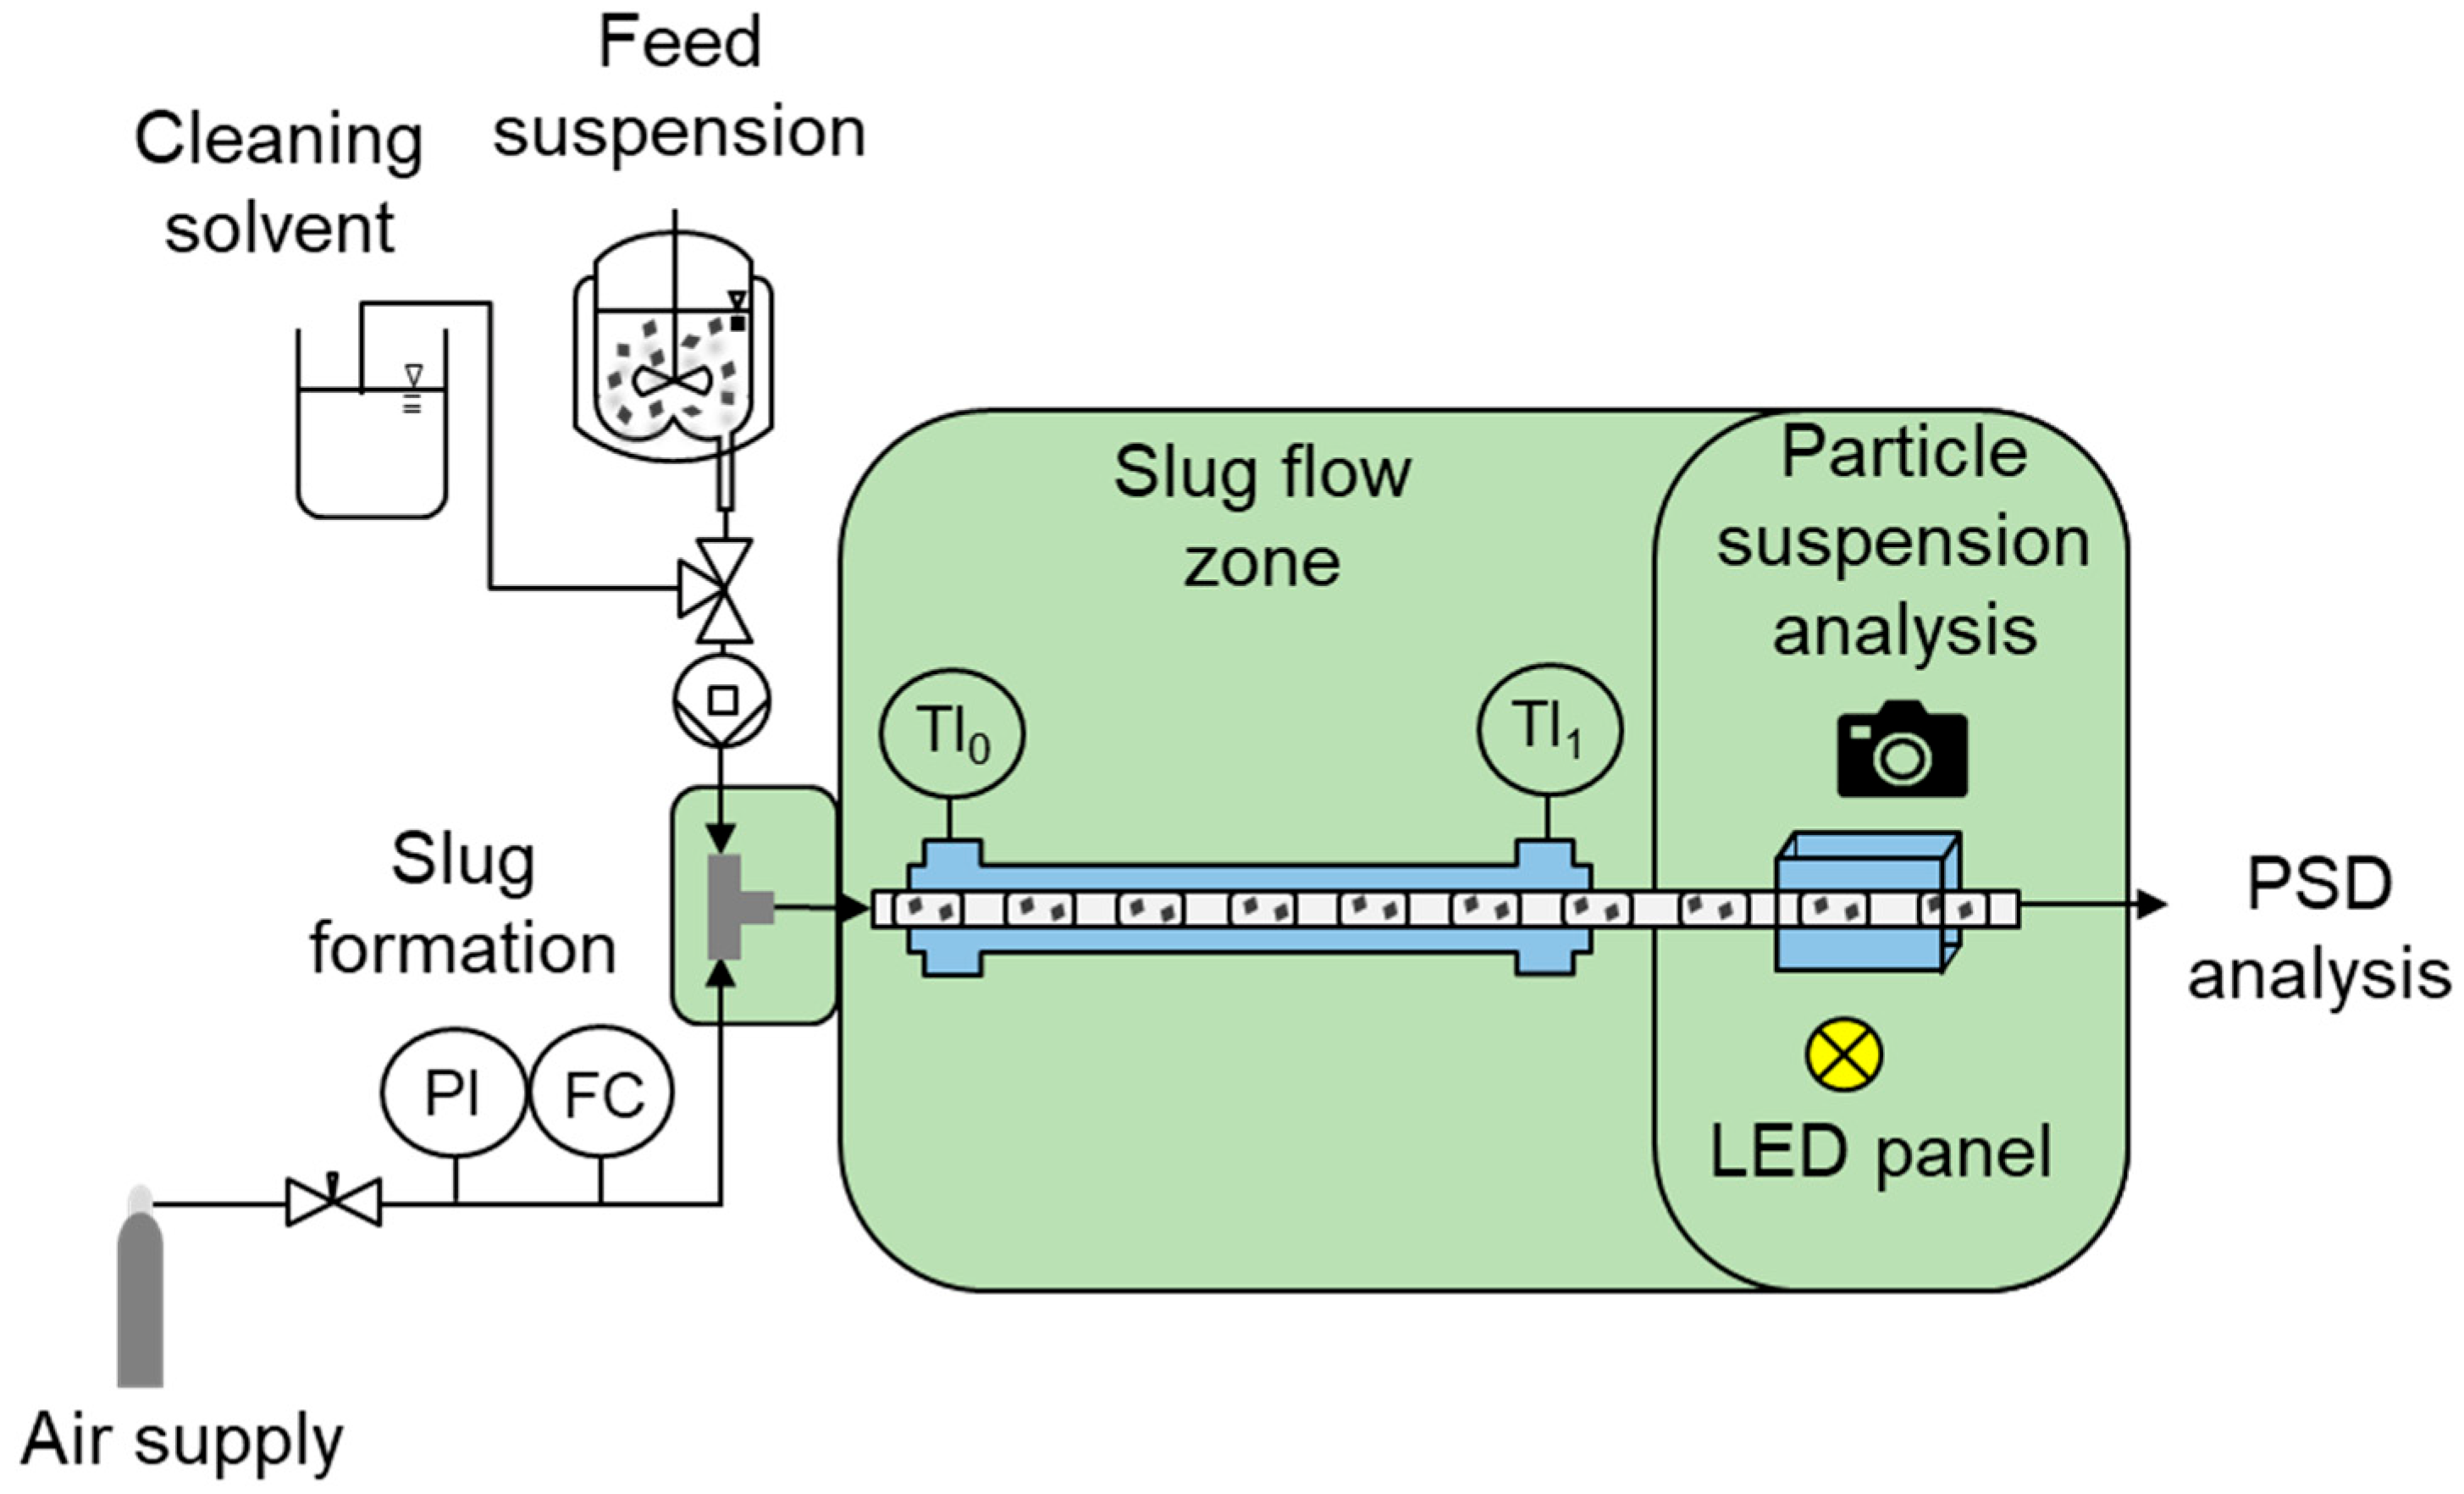
2.2. Experimental Setup and Procedure

Figure 2 schematically shows the experimental setup. It was similar to the study from Termühlen et al. [17,21] in order to utilize and extend the experimentally obtained data.
In a storage vessel ( V = 500 mL, n stirrer = 450 rpm [38]), aqueous saturated l-alanine solution at ambient temperature ( ϑ amb  20.2–28.0 °C) containing seed crystals (wseed = 1 gsolidgsolution−1) is provided, which is transported to the T-junction in the slug formation zone via a peristaltic pump (Ismatec Reglo Digital MS-4/12, d i = 2.29 mm Pharmed) by adjusting the three-way valve. From the opposite side within the T-junction (polypropylene (PP), d i = 3 mm), synthetic air is fed in, controlled by a needle valve (NV-001-HR, Bronkhorst) and a flow meter (El-Flow-Select, Bronkhorst, The Netherlands), so that slug formation occurs via the squeezing mechanism [39]. The resulting alternating gas and liquid segments are conveyed along the tubing (fluorinated-ethylene-propylene (FEP), d i = 3.18 mm). A double jacket tube (polyvinyl chloride (PVC)) is attached around the process tubing inside the slug flow zone, which can be used for an adjustable cooling profile in the case of cooling crystallization experiments. Here, all experiments are carried out at ambient temperature so that no cooling profile is applied. Since the particle segregation is not always instantaneously occurring after slug formation [33], the camera is placed at the end of the SFC ( L tubing = 7.5 m) to evaluate the suspension state as reliably as possible. Therefore, the transparent process medium tubing passes a glass box (14 cm × 6 cm × 6 cm), which is illuminated with a LED lamp and filled with degassed water so that video recordings of the slugs and the particle suspension inside can be made. These videos are subsequently evaluated using a MATLAB script, and characteristic values for the slug length distribution (SLD) and the particle distribution within the slug are determined. The characteristic values are described in the next section. For the detailed evaluation procedure, the reader is referred to the literature [17,21,39].

2.3. Evaluation Procedure

Since the slug length influences hydrodynamic properties such as circulation intensity, an operation in steady-state leading to uniform product particles requires a constant slug length. Image analysis is utilized to determine the median slug length Lslug,50 and its distribution L slug , 90 10 . A MATLAB script developed by Termühlen et al. [21,39] is applied to calculate the slug length distribution (SLD). Moreover, the parameters for the Goodness of Suspension (GoS, χ50,H and χ50,V) [17,21] are examined to describe the particle distribution inside a slug by transferring the pictures of the single slugs into binary images. The white area represents detected crystals, while the black area corresponds to the liquid (Figure S1 in the Supporting Information shows an example). Based on the respective areas, a cumulative intensity distribution is generated and the median suspension width χ50,H and height χ50,V can be determined. To compare the suspension states for slugs, which deviate in length, the centroids and distributions are normalized with respect to the slug length. The centroid for an ideal suspension in horizontal and vertical directions corresponds to χ50 = 0.5, whereas an ideal distribution of particles corresponds to χ90-10 = 0.8. The characteristic values obtained by the image analysis and used for quantification of the particle suspension are the median slug length L slug , 50 , and the GoS-values χ50,H and χ50,V. Figure 3 exemplarily shows the non-homogeneous and homogeneous suspension states for bipyramidal, cuboidal, and needle-like shaped l-alanine particles.
Furthermore, for predicting the particle suspension within the slug, it is also crucial to have an accurate method for evaluating the particle size, its distribution, and shape. Dynamic image analysis (QICPIC, Sympatec, 1024 × 1024 resolution, module M6) is used to measure particle suspension probes taken at the outlet of the SFC. The evaluation of particle population starts afterwards using an artificial neural network implemented in MATLAB [40,41], where shape factors such as circularity and sphericity are outputs. Moreover, the minor axis length ( M I L ) and major axis length ( M A L ) are given, which are crucial to describe the aspect ratio ( A R ) and the particle shape. The characteristic MILch and MALch values are calculated according to the procedure described in detail by Steenweg et al. [37].

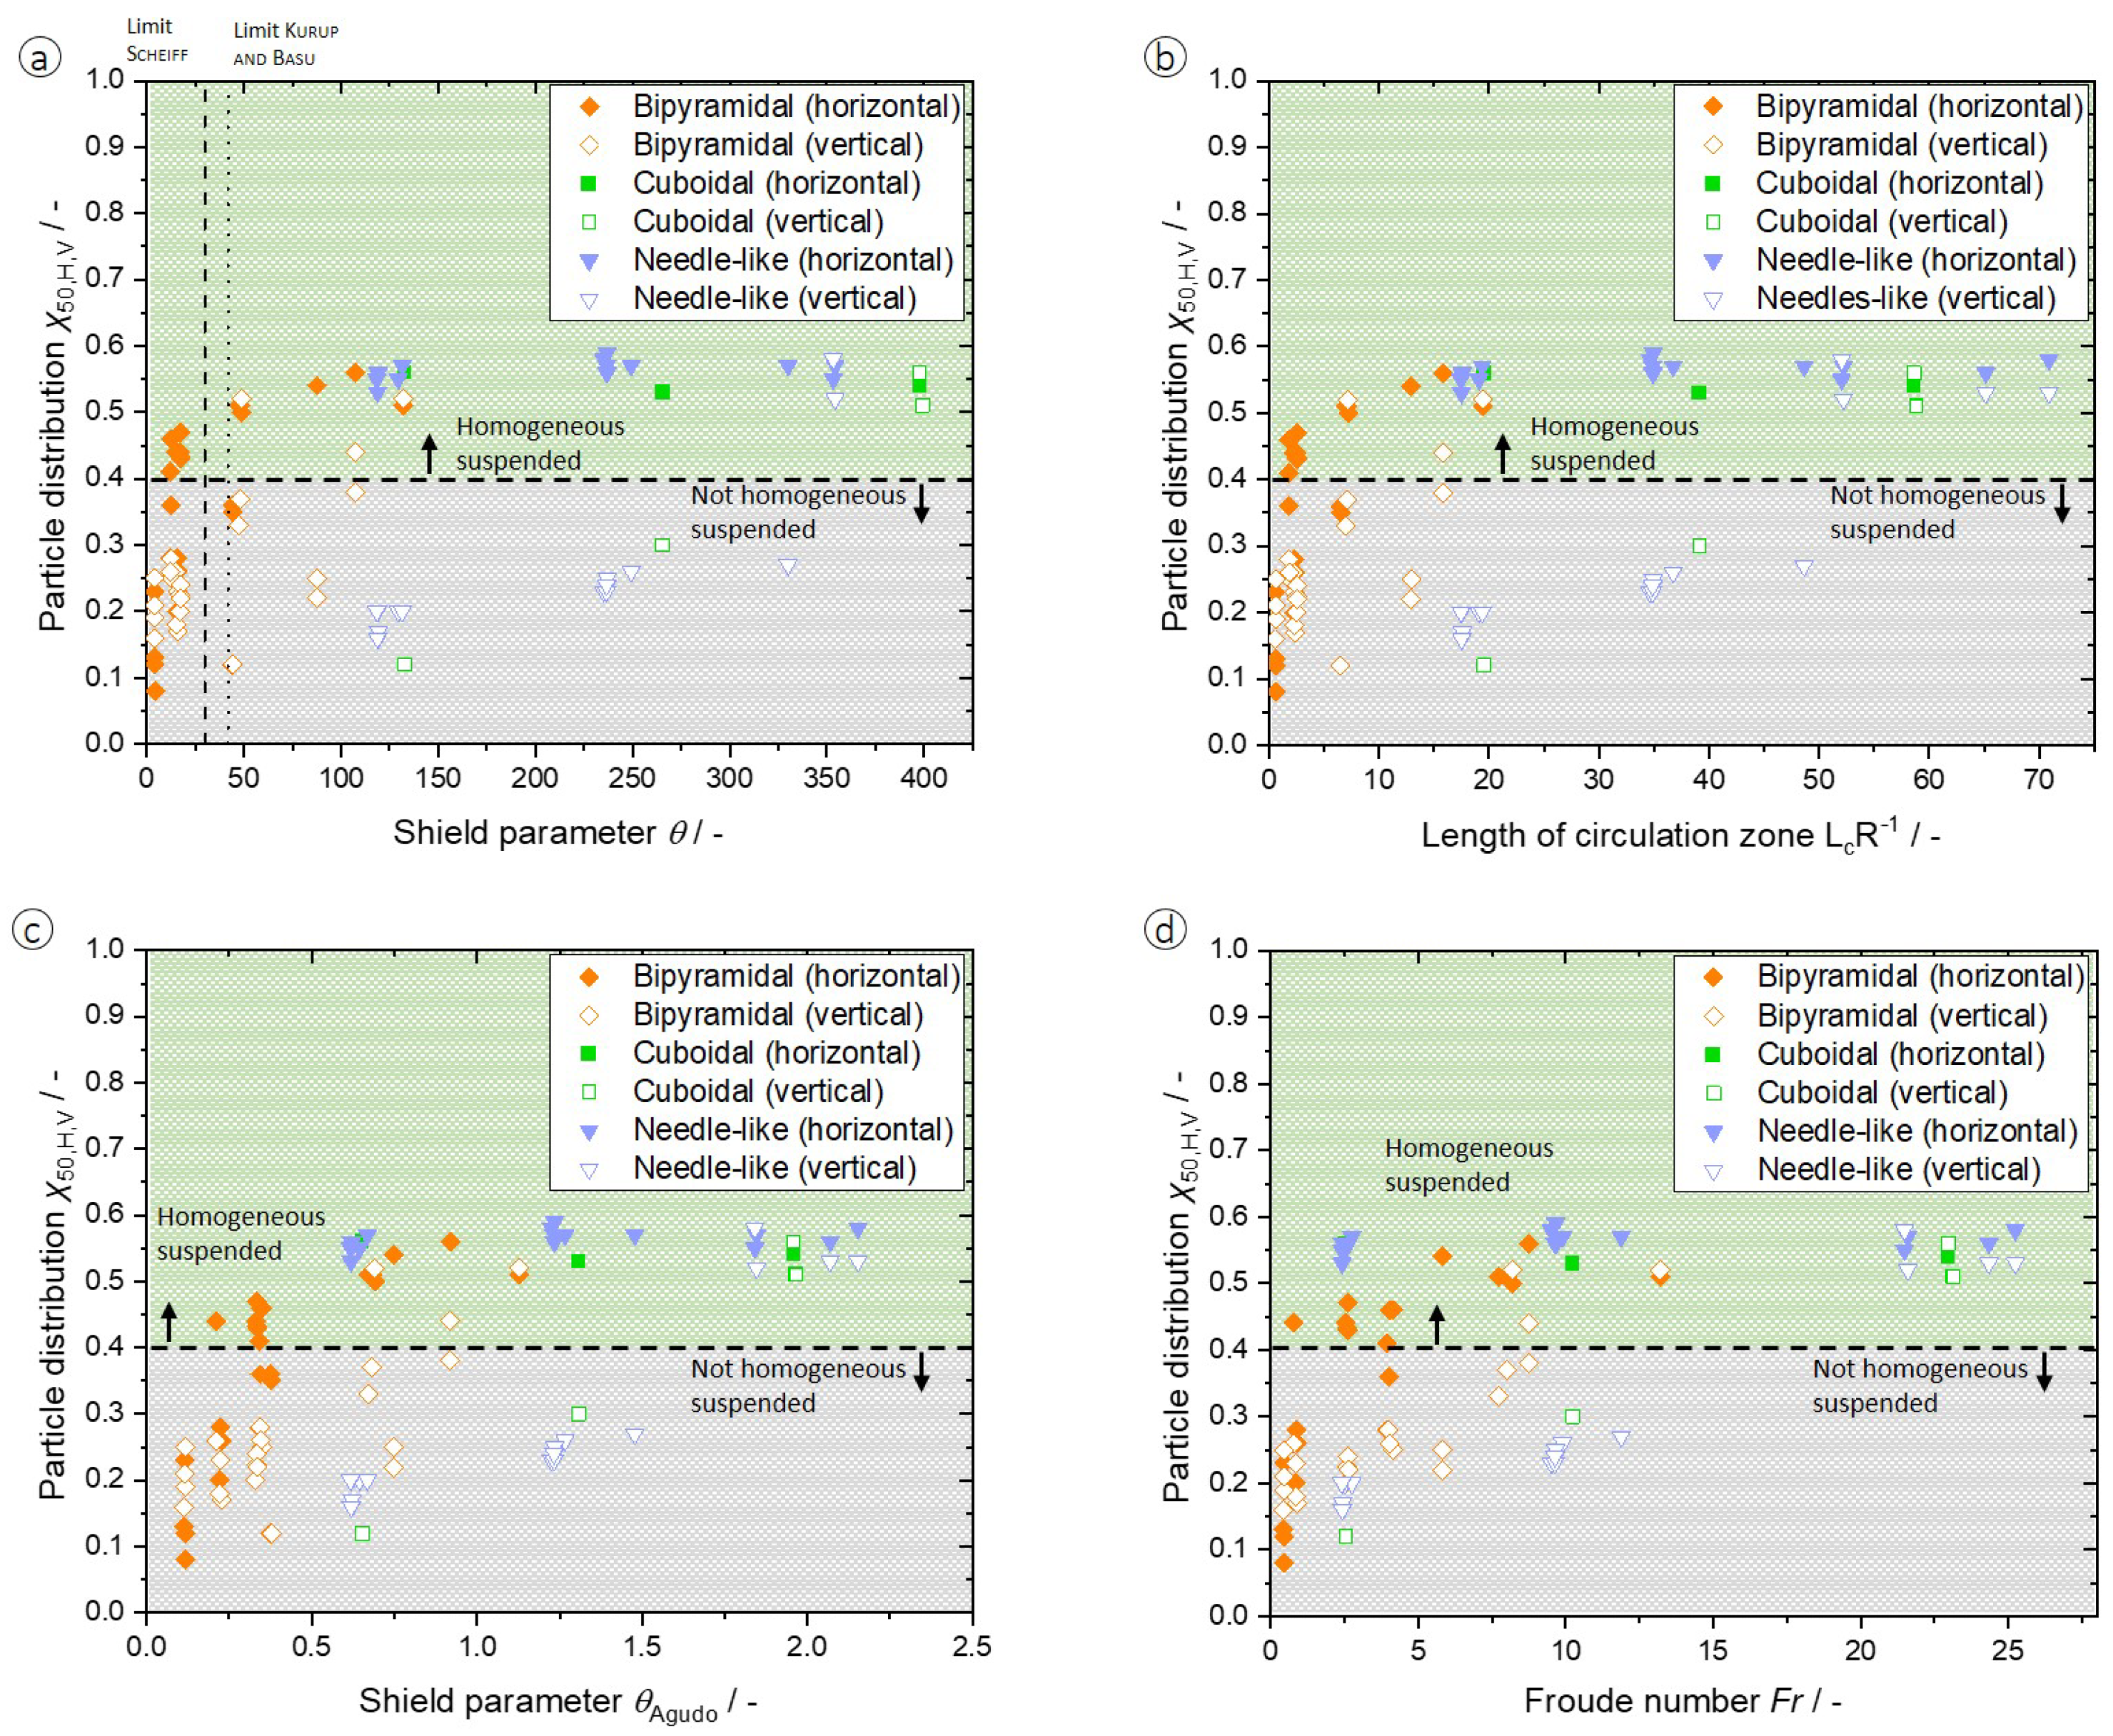
3. Applying Existing Dimensionless Numbers to Describe Particle Suspension in Slugs

To prove our first hypothesis, the dimensionless numbers introduced in Section 1 are applied to the experiments under consideration. The experiments include the data generated by Termühlen [21] and the results generated in this work. The operating conditions include performances at different velocities, slug lengths, particle sizes, particle shapes, and mass fractions in the suspension. Tables S1 and S2 in the Supporting Information list all operating parameters and results.
Figure 4 shows the results for the evaluation of the suspension state for all experiments with different particle shapes plotted against the Shield parameter θ (a), the length of circulation zone L c R 1 (b), the Shield parameter defined by Agudo et al. [34] θ Agudo (c), and the Froude number F r (d) for the respective experiments. In order to obtain a homogeneous particle distribution in a horizontal and vertical direction, the criterion for the respective suspension state parameters was set to χ50 > 0.4 in order to limit agglomeration in the crystallization process to a minimum.
For the Shield parameter θ (Figure 4a), it can be seen that the horizontal suspension (filled experimental data points) can largely be reliably represented with the limits defined by Scheiff ( θ > 30) [20] and Kurup and Basu ( θ > 42) [30] for a completely horizontal particle distribution in the slug. However, the limits for vertical suspension are not applicable. Only for bipyramidal particles (unfilled diamonds), which can be assumed to be nearly spherical, can a distinction according to Scheiff’s limits be observed. However, for θ < 180, fluctuations in θ results. This region represents the area where suspension of the particles is already improved but is still incomplete, and it is important for the crystallization process and its modeling in order to be able to understand and predict the agglomeration process more accurately. The examination of the other three dimensionless numbers, L c R 1 (Figure 4b), θ Agudo (Figure 4c), and F r (Figure 4d), lead to the same conclusions, whereby F r still seems to be the most promising of all considered dimensionless numbers for the vertical suspension description of the various shaped particles.
Nevertheless, the known dimensionless numbers for predicting the particle suspension state inside slugs are not accurate enough for our purpose, since the influence of the particle shape on the suspension state is not regarded, which proves our first hypothesis that known dimensionless numbers are not sufficiently able to describe the suspension state of non-spherical particles.

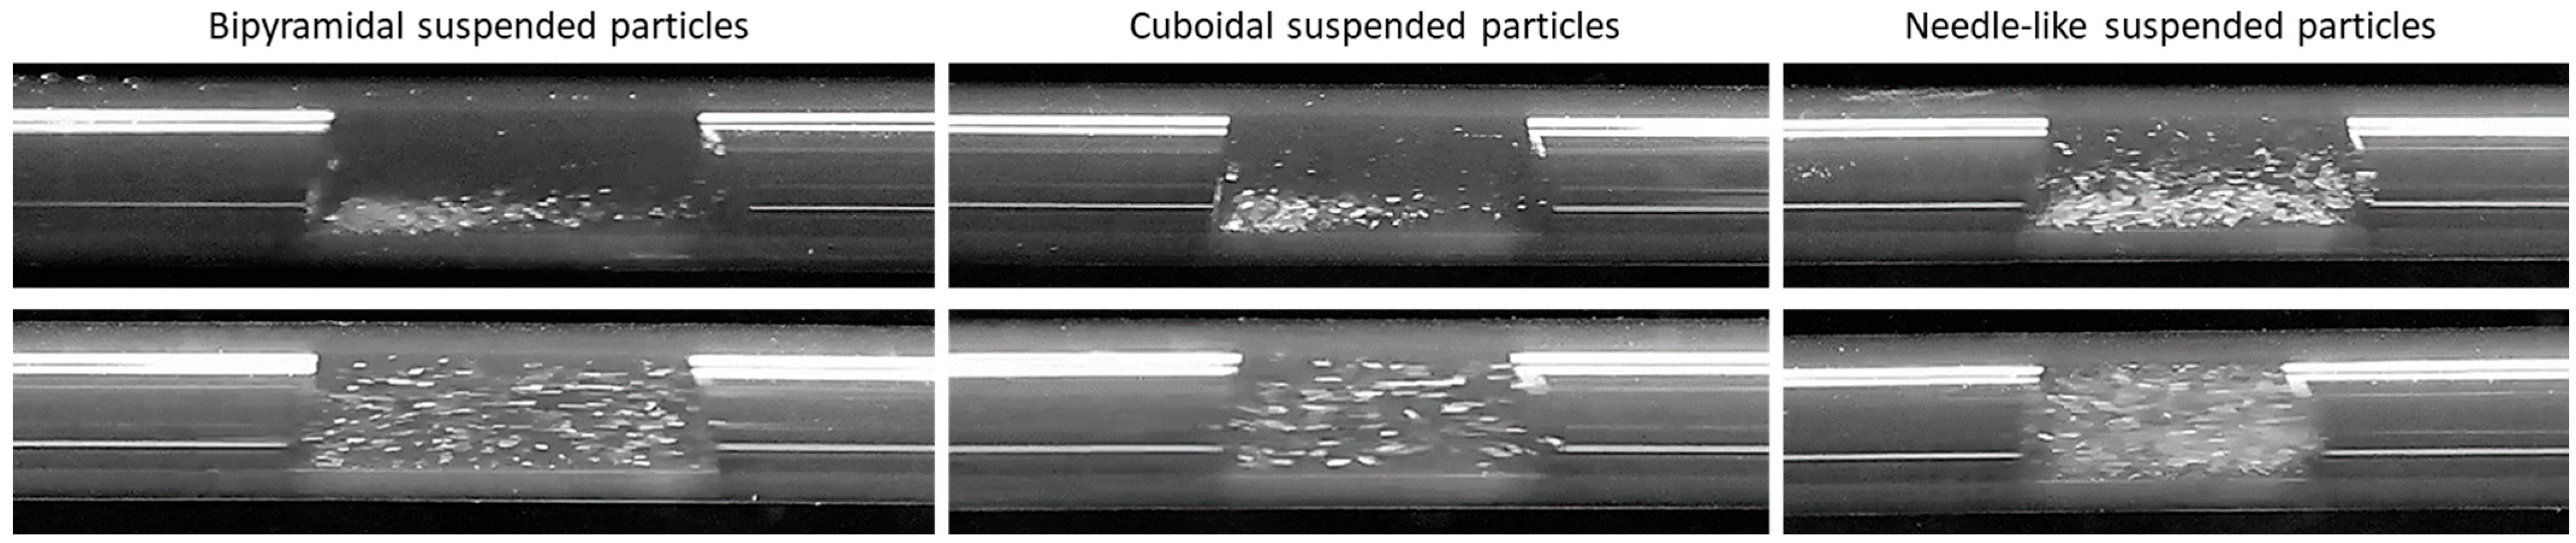
4. Characterization of Particle Suspension inside Slugs

To develop a reliable correlation for predicting particle suspension for different particle shapes inside slugs, we first introduce the mathematical descriptions of hydrodynamics in the liquid phase (Section 4.1) and the solid phase for spherical particles (Section 4.2) followed by a detailed discussion of the influence of the particle shape (Section 4.3).

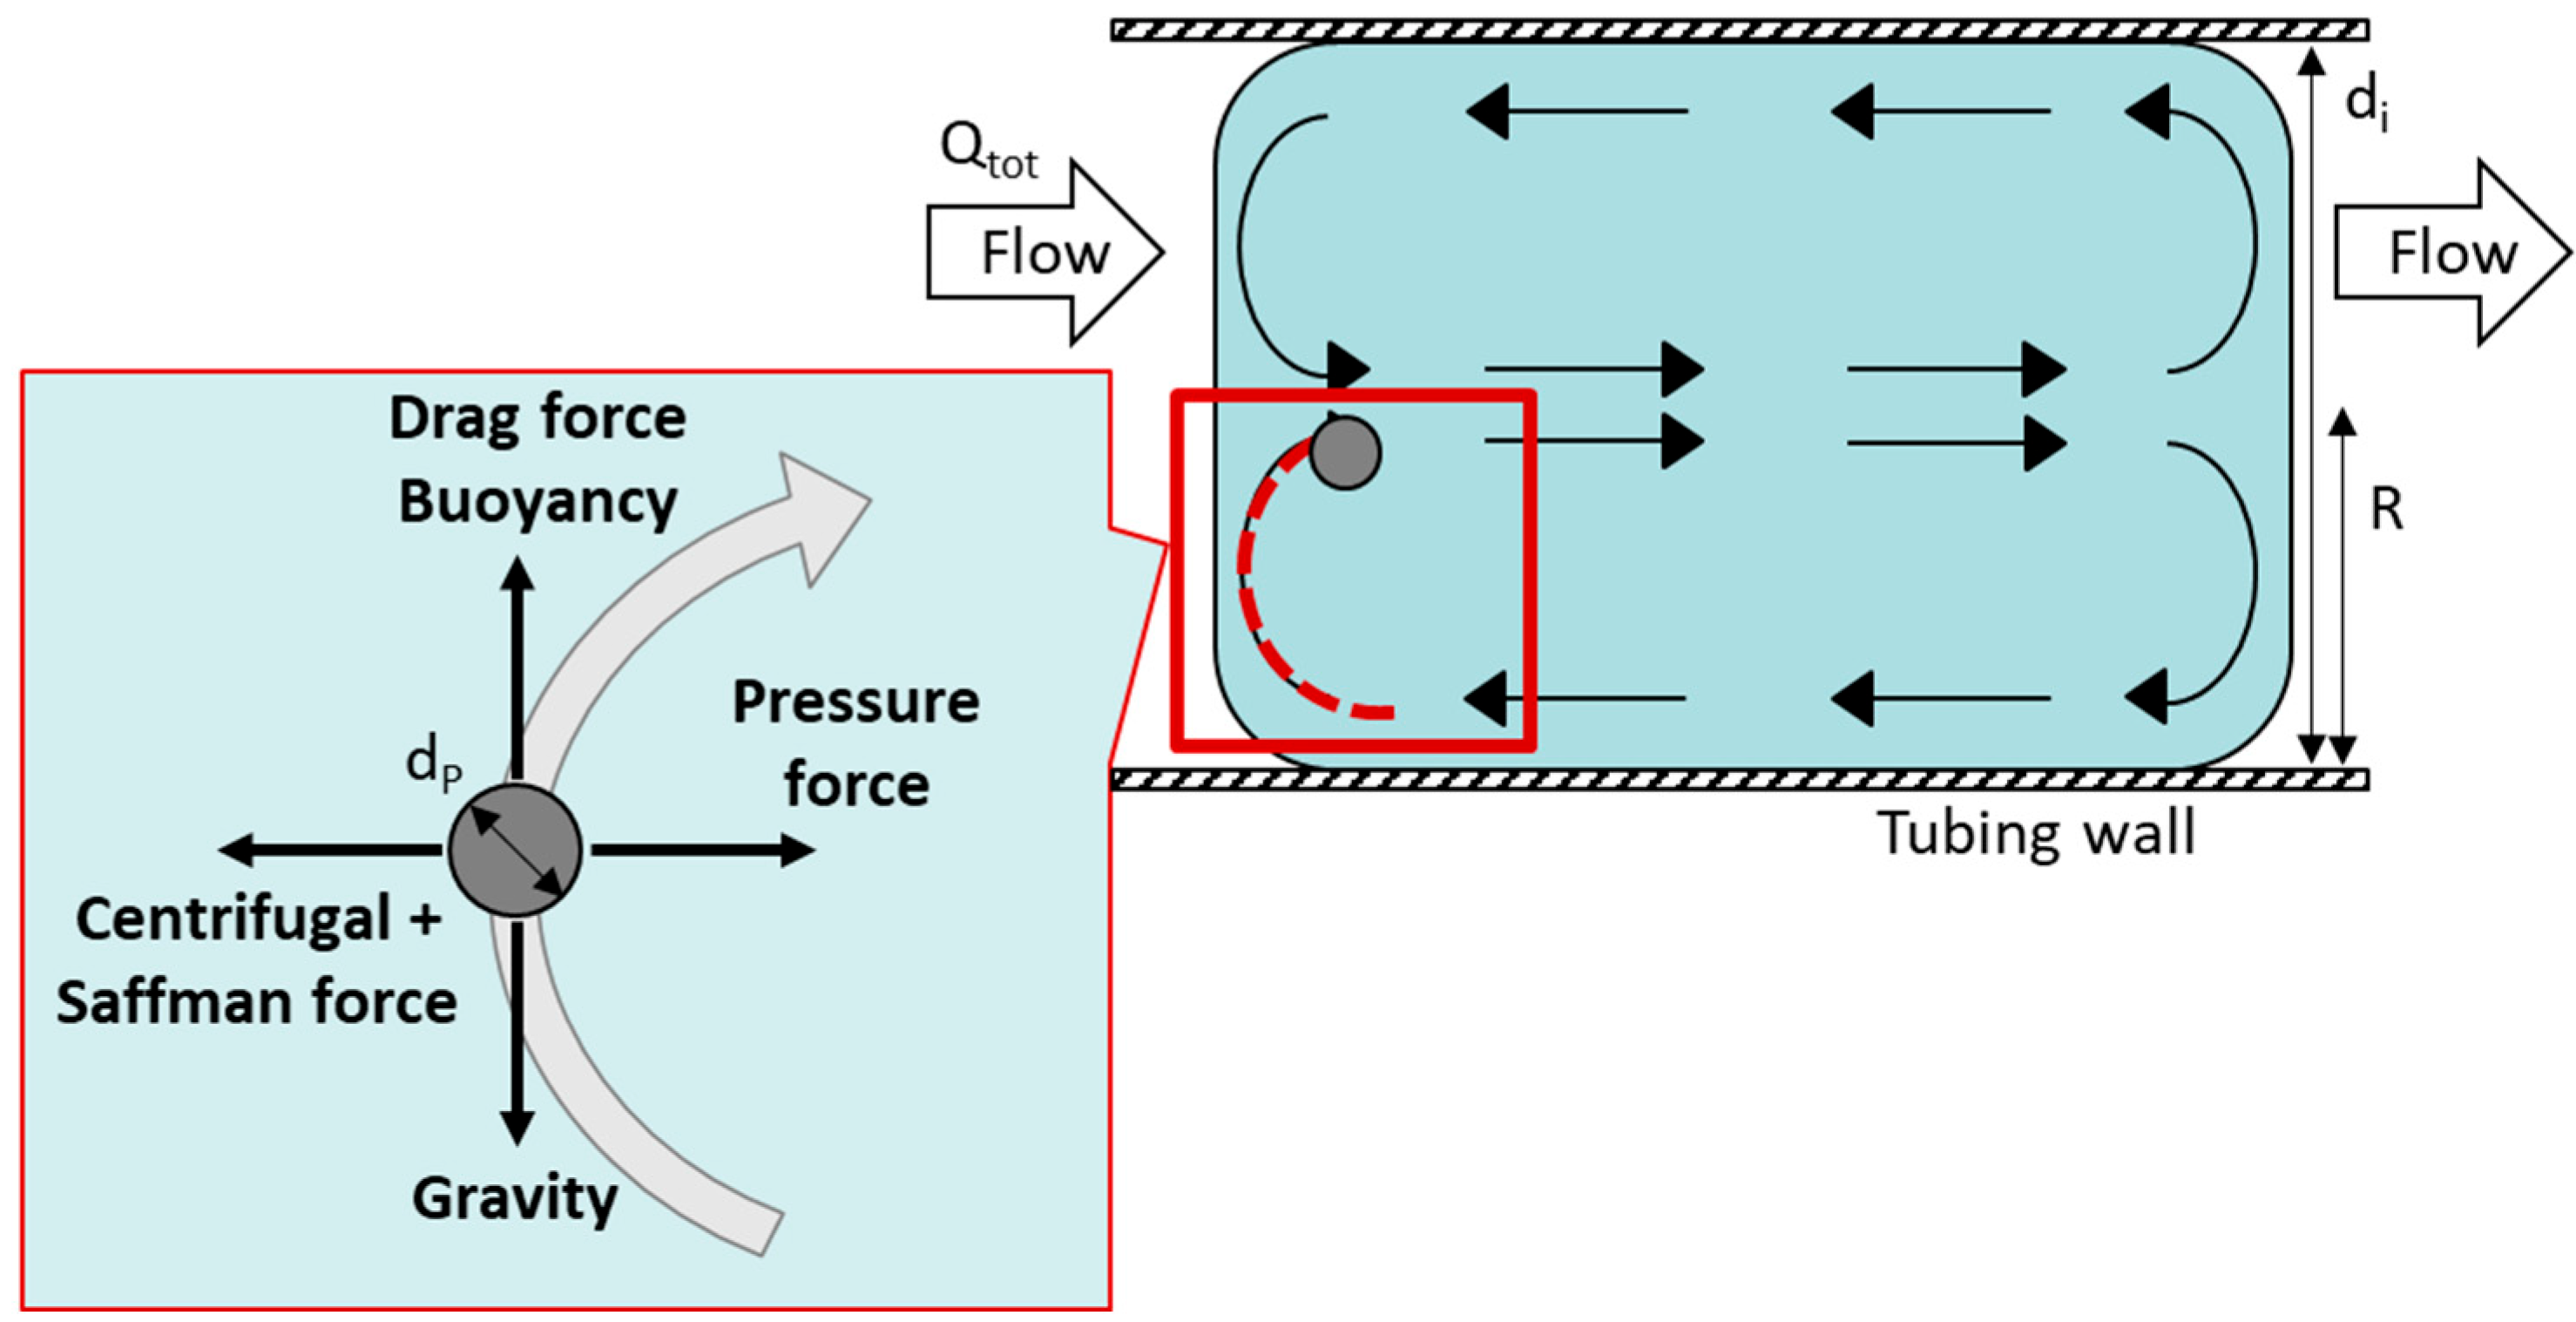
4.1. Mathematical Description of Hydrodynamics inside Slugs

The hydrodynamic properties of the flow pattern are directly responsible for the suspension state, and a profound description is necessary in order to predict the particle suspension state. There are various dimensionless numbers for an accurate determination of hydrodynamics. For slug flow, the most important ones are the Reynolds number (Re), the Capillary number ( C a ), and the Eötvös number ( E ö ) [42]. The latter is not relevant in our study since a constant tubing diameter was used and stable slug flow was generated.
Re is important to characterize the flow pattern. Operating in the laminar flow regime is crucial for segmented flow applications, respectively below R e < 2100 for stable slug flow [29]. Therefore, the absolute fluid velocity must be known, which is adjusted by total flow rate Q tot , combining the liquid and the air volume flow rate ( Q L + Q A i r ) .
According to Equation (6), the R e value for the highest total volume flow rate used in experiments ( Q tot = 60 mL min−1) is calculated to be R e = 260. Therefore, all considered operating points are in the laminar flow regime, confirming the literature [42,43].
R e = u L   d i   ρ L η = inertial   forces viscous   forces
The overall flow velocity equals the liquid velocity u L and is calculated according to Equation (7), which is valid in the case of the absence of a wall film because, otherwise, gas bubbles would travel at a higher velocity than the average liquid velocity [29]. The total volume flow rate Q tot is, therefore, the sum of liquid and gas volume flow rate.
u L = Q tot π d i 2 2
The C a number is determined to assess the influence of viscous forces on the circulation inside the slugs and can be calculated according to Equation (8).
C a = u L   η σ = viscous   forces surface   tension   forces
Ca increases with an increasing slug velocity, and viscous effects do not disturb mixing up to C a < 10−2 [43]. The calculated values for C a for the respective flow rates are shown in Table 2. The low calculated C a numbers and the measured static contact angle θstat lead to the assumption of a stable slug flow and a negligible wall film being present [13].
Going into further detail of the hydrodynamics inside the slug, internal vortices caused by wall friction in the slugs dominate the flow pattern and are characteristic for the slug flow. Therefore, a higher circulation intensity of the vortices leads to a higher mixing intensity. However, whether a higher mixing intensity leads to increased mass transfer depends on the material system considered [33,44].
The mixing intensity can be determined by using a recirculation rate (Equation (9)), correlating the slug’s velocity u L , max and its length L slug . The recirculation rate provides information about rotations per second of the vortices inside the slugs; thus, it is necessary to analyze the properties of the vortices. The course of a full circulation of the vortex is assumed to be twice as long as the slug itself. Therefore, the mixing intensity varies with the slug length. If the slug length increases, the circulation intensity in the slug’s rear decreases [33].
R e c i r c u l a t i o n   r a t e = u L , max 2 L slug
Thulasidas et al. [43] observed a correlation between the wall film thickness and mixing intensity, using the dimensionless bubble velocity Ψb (= u b / u tot ) indicating the highest mixing intensity in case of an absent wall film (Ψb = 1, u b = u slug [14,42,43]).
According to the no-slip condition, the maximum liquid velocity in the slug must be the same as the slug’s velocity ( u slug = | u L , max |) [43,45]. Due to the laminar flow regime, a Poiseuille flow is present, described by a parabolic flow profile (Figure S2). Moving in a radial direction towards the slug center, the velocity increases and reaches its maximum in the middle of the slug while passing a stagnation zone. The assumption of a constant velocity gradient towards the slug center is valid for a fully developed Poiseuille flow profile. The velocity profile for the liquid phase u L inside the slug can be described by Equation (10), which includes the dimensionless velocity Ψ b, as well as the gas bubble velocity u b , the position of stagnation zone r 0 , and the tubing radius R . At the position r 0 in the vortex, the function of Equation (10) passes a point of zero velocity ( u L = 0 , Equation (11)). At this point, the vortex flow reverses in direction and tends closer to the wall than the slug’s center [43].
u L r = 2 u b Ψ b 1 r 2 R 2 u b
r 0 = R 2 2 Ψ b
Concluding from the laminar flow profile, the streamlines inside the slugs have the same orientation, and a constant velocity is assumed for each streamline, especially the center streamline and the one at the slug’s interface [43]. The vortices are assumed to consist of two main vortices without any additional front or rear vortices. This is caused by the high viscosity ratio of process and segmenting medium [33]. Accordingly, at the slug’s interface, a maximum fluid velocity prevails. When particles begin to settle, they always pass the streamline of the highest velocity. Therefore, the maximum flow velocity and the shear rate at the interface are crucial to describe the hydrodynamics inside slugs. However, the hydrodynamics are based on an ideal model and are potentially disturbed by particles or other influences.

4.2. Mathematical Description of the Solid Phase inside Slugs

The gained insights regarding hydrodynamics enable a profound investigation of particle suspension behavior inside slugs. In order to apply an understanding of which forces act on a particle within the slug and how the particles can be suspended, force balances are performed on a single particle (Figure 5), similar to Scheiff and Agar’s [20] approach for liquid-liquid slug flow. For a systematic investigation, the calculations are split into two sections: radial and vertical force balances.

4.2.1. Radial Force Balance on a Single Spherical Particle

Radial forces on particles occur during the circular motion when the liquid is reversed at the front and rear of the slug’s interface. A characteristic property of the radial forces is the correlation with fluid velocity, as most effects become stronger when circulation intensity increases. In this case, the term ‘segregation’ means the accumulation of particles. Segregation is usually observed in the rear end of the slugs, which is partly related to a weaker circulation intensity in the rear than in the front end. Therefore, Figure 5 shows the rear deflection, which is regarded as a critical point for a particle whether it stays suspended or not [17,21,33].
For the calculation of radial forces, the velocity of the particle or volume element must be known. The particle velocity differs from the fluid velocity u L due to the particle settling velocity u P . Accordingly, the particle velocity u P , φ at the respective position is a function of u L and u P : u p , φ = u L u P . Furthermore, radial forces are stronger at the outer streamline. Thus, the regarded particle position is directly at the interface and the deflection has a circular course with the radius r Vortice = R /2 [31,33].
A stable suspension state is reached if radial forces have a negative value and are directed towards the slug’s center. Therefore, particles remain in the main vortices, and no accumulation of particles occurs due to radial forces. In practice, multiple forces act on particles in a shear flow, but most of them are negligible. For instance, the Coriolis force becomes relevant at higher relative particle velocities, but the particle’s settling velocity is low for the conditions considered compared to the fluid velocity [1]. For the radial force balance, the relevant forces are displayed in Figure 5 and will be used. The centrifugal force points outwards, while the dynamic pressure force acts as a counterforce and is directed inwards. In contrast to the centrifugal force, the dynamic pressure force depends on the fluid’s density and is only negligible for low densities such as gas [46]. Centrifugal and pressure forces can be calculated by combining them in the effective centrifugal force F C , p , which is defined in Equation (12), where V P is the particle volume and ρ is the respective density for particles and liquid phase [1,33,47,48].
F C , p = V P ρ P u P , φ 2 ρ L u L , max 2 1 r Vortice
However, the force balance does not only consist of the effective centrifugal force and must be complemented by the Saffman force F Saff , which acts in the same direction as the centrifugal force. F Saff is a lift force caused by the liquid velocity gradient (Equation (13)).
F Saff , 0 is applicable at very low Reynolds numbers ( R e << 1) (Equation (14)) and can be adapted to higher R e numbers by a correction factor β (Equation (15)), which describes the shear flow. The shear gradient induces a pressure difference due to different flow velocities at both sides of the particle. This pressure gradient results in an orientated force perpendicular to the streamlines. In this case, F Saff increases with an increasing flow rate and particle diameter [20,31,33,47].
F Saff F Saff , 0 = 140 β 5   ln β 2 0.3   1 + tanh 2.5 log β + 0.191 0.667 + tan 6 β 0.32 1 0.287 β 2
F Saff , 0 = 1.615 η u L u P d P 2 ρ η u L u P
for β 1 0.1 β 20 β 1 ;     β = 2 η 2 ρ R u Slug
The radial forces acting on a single particle continue to be opposed by forces (interfacial and lift forces) emanating from the gas-liquid interface of the slug flow. They are oriented perpendicular to the interface. The main principle calculating the lift force F lift is the same as for the F Saff because a velocity gradient between the particle and the interface is present if the particle is close to the interface. It is calculated according to the correlation stated by Bagchi and Balachadar [49]. The interfacial force F σ depends on the substance system and particle size ( F σ = σ π d P ). In order to operate at stable slug flow conditions, the forces directed away from the interface must outweigh F C , p and F Saff . Otherwise, particles pass through the interface and leave the slug, which causes a broader RTD of the solid phase.
The forces are determined for the largest particles ( d P = 399 µm) and the highest volume flow rate ( Q tot = 60 mL min−1) examined in the experiments:
F σ F lift F C , p + F Saff
83.61 µN   >   1.86 µN   >   0.03 µN
The high value for F σ reinforces the theory that particles remain in the vortex because interfacial forces are strong enough to keep particles at a distance to the interface. This explains the improved suspension states at higher flow rates even if radial forces accelerate the particles towards the slug’s interface. Moreover, the high interfacial force prevents particles from accumulating inside the interface, which is also vital for the particle suspension. Since the calculation is a simplified force balance, it has to be regarded that forces can deviate from the theoretical values. If a particle is accelerated, it causes the liquid close to the particle’s surface to accelerate, increasing the effective mass of the particle. This is known as virtual mass, and it enhances the effect of F C . Moreover, F Saff is affected by particle rotation, which leads to a distortion of the velocity gradient. The rotational effect is covered by the Magnus force and is neglected in this work since the rotation of particles in the SFC can only be considered with the help of simplified correlations. However, neither forces significantly change the ratio of centrifugal to interfacial forces due to the domination of the latter. Other forces and interactions, such as Van-der-Waals forces, electrostatic forces, and especially particle collisions that influence particle suspension in practice, are not considered for reasons of simplicity.

4.2.2. Radial Force Balance on a Single Spherical Particle

Considering the stationary vertical motion of a single particle, it is based on three forces, as shown in Figure 5: gravity F G , buoyancy F B , and drag force F D . The vertical forces determine the settling velocity and are decisive for the suspension state. The resulting force F G , B of buoyancy and gravity depends on the difference in densities and is defined in Equation (16).
F G , B = V P g ρ P ρ L
The resulting force causes particles to sink if ρ P > ρ L . The stationary settling velocity is reached if the vertical force balance equals zero, which means F D = F G , B [31].
The drag is composed of friction and pressure-related drag, and is directed in the opposite direction to the particle’s movement. The drag force is calculated by using Equation (17) [50], where u P is the relative particle velocity, c D is the drag coefficient, and A Proj is the projected area.
F D = c D A Proj ρ L u P 2 2
The surrounding flow profile of the regarded particle influences the drag coefficient and is described by the particle Reynolds number R e P and the relative particle velocity depending on each other. An iterative solution can be avoided by calculating the Archimedes number A r , which is then used for determining R e P . Afterwards, R e P is used to identify c D . Equations (18) and (19) give the correlation between these three parameters [31,50].
A r ρ P ρ L ρ L g d P 3 η 2 = 3 4 R e P 2 c D
R e P = 18 1 + A r 0.5 9 1 2
It is vital to determine R e P in order to use the respective correlation depending on the flow regimes for calculating c D . The flow regimes for spherical particles can be categorized by R e P into three areas:
R e P < 0.1 (creeping flow in Stokes regime) − c D , sphere = 24 R e P
0.1 < R e P < 1000 (transient regime) − c D , sphere = 24 R e P + 4 R e P + 0.4
R e P > 1000 (turbulent flow in Newton regime) − c D , sphere = c o n s t a n t
Stoke’s law applies to creeping flow at low R e P < 0.1 . The flow in the Newton regime at R e P > 1000 is turbulent and the drag coefficient stays at about the same value for further increasing R e P . In between is the transient regime and occurring turbulences are considered by an approximation. Values of R e P for the particle sizes used by Termühlen [21] of 203–399 μm range from R e P = 0.58 3.52 , and therewith belong to the transient regime.

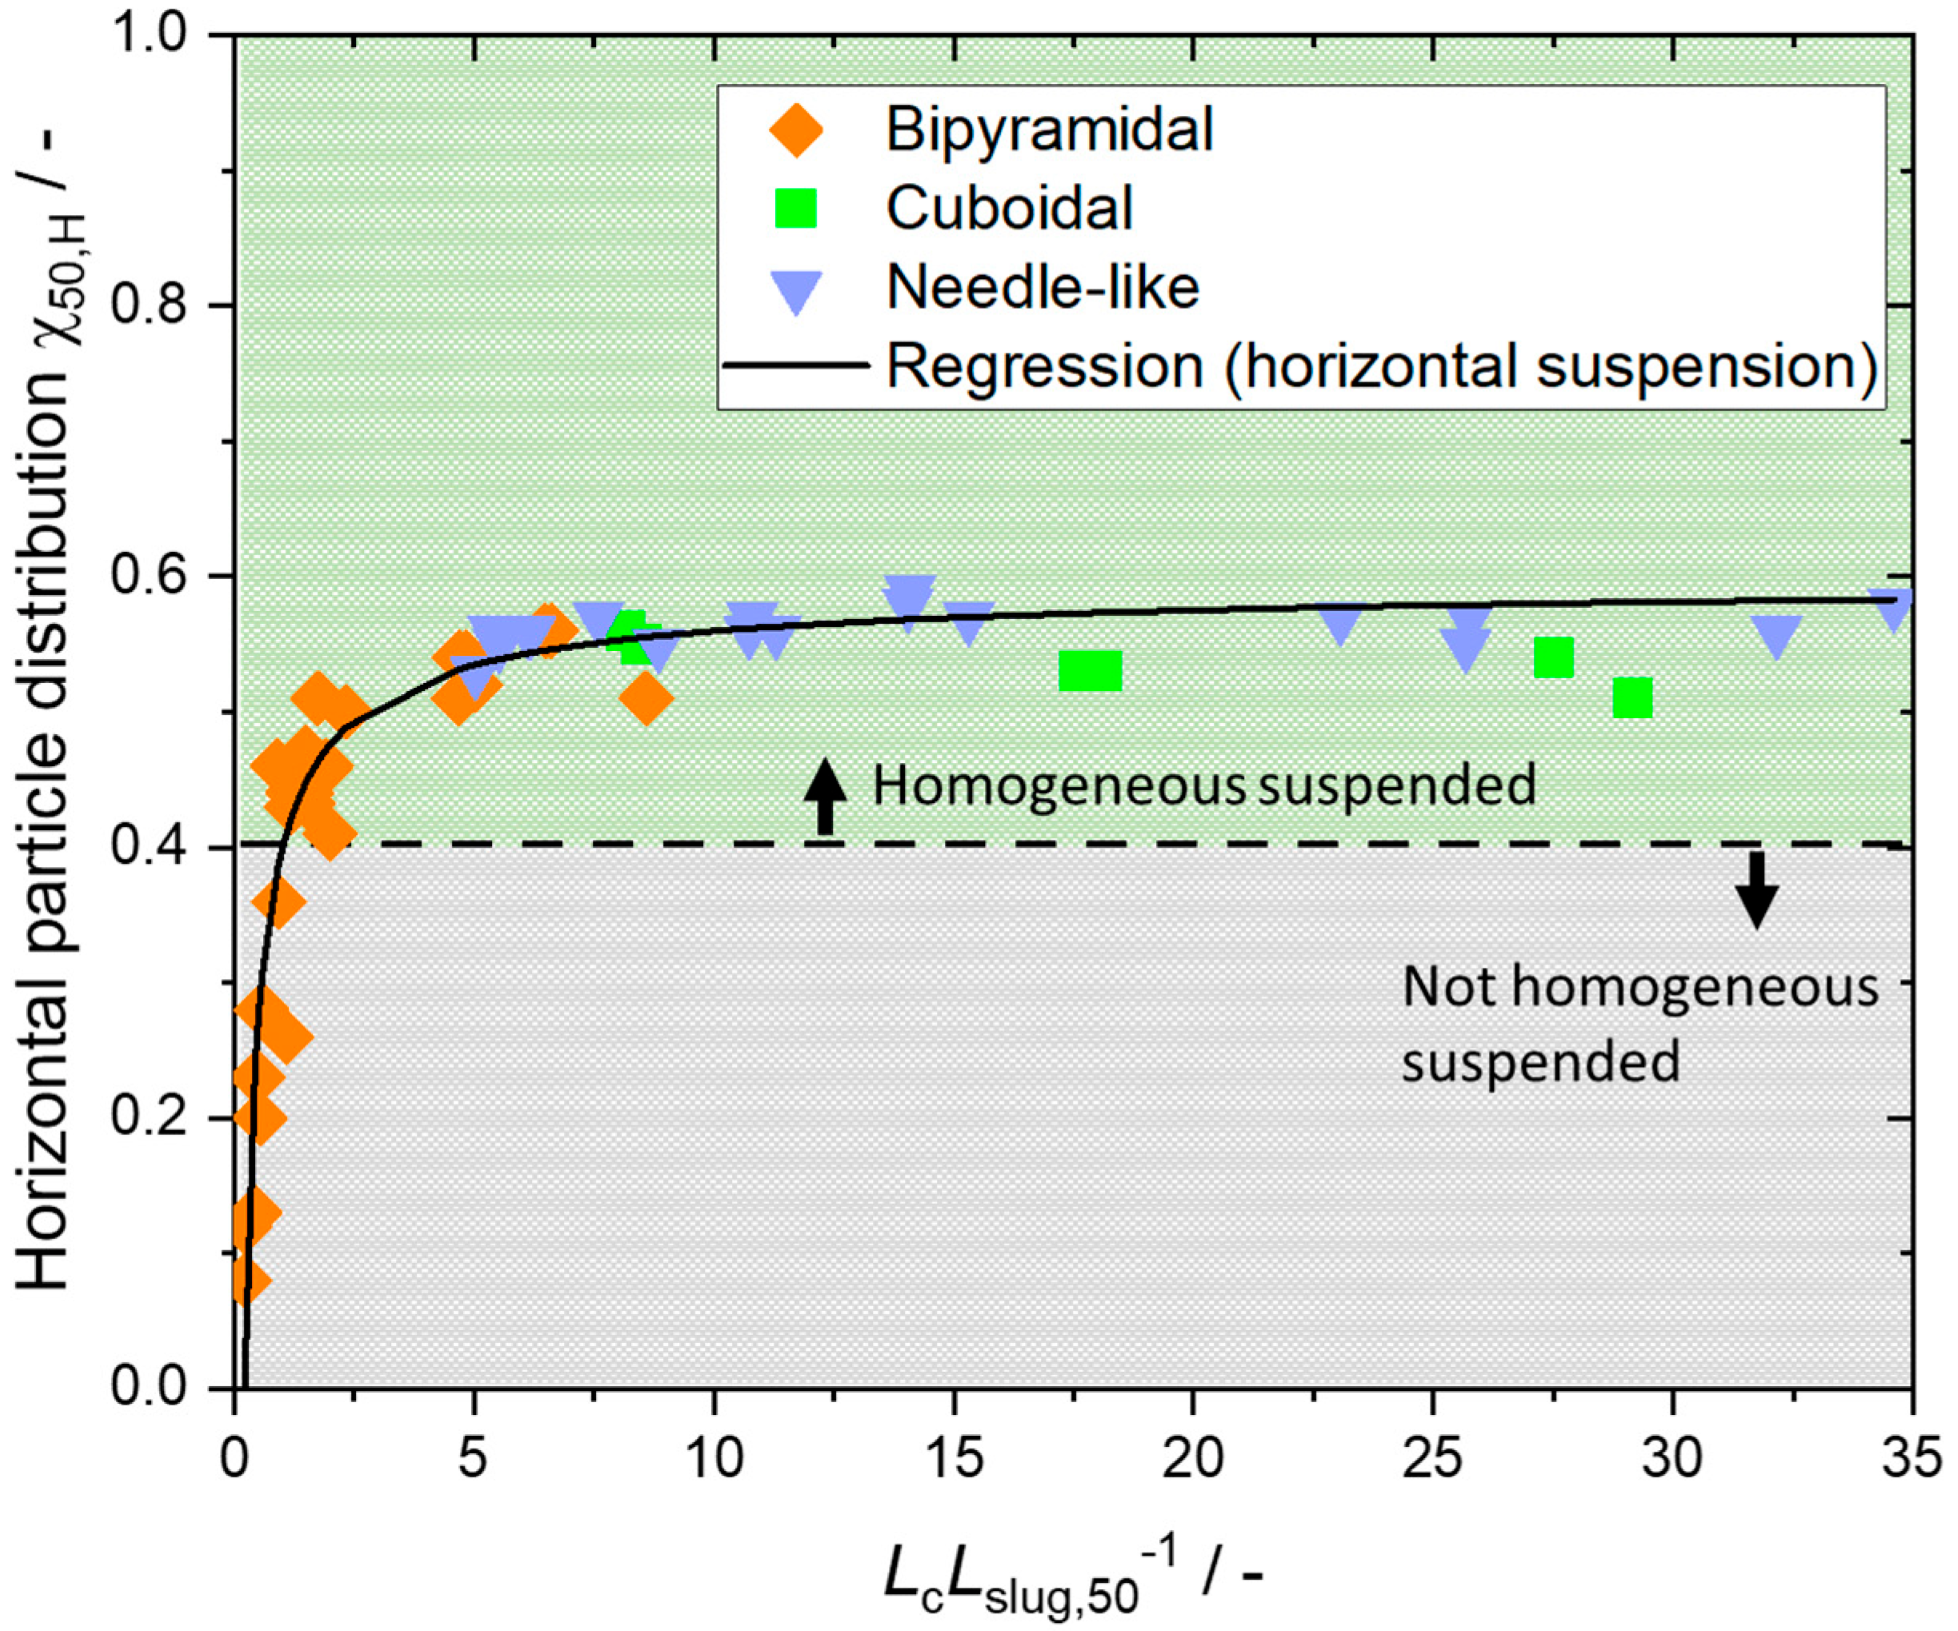
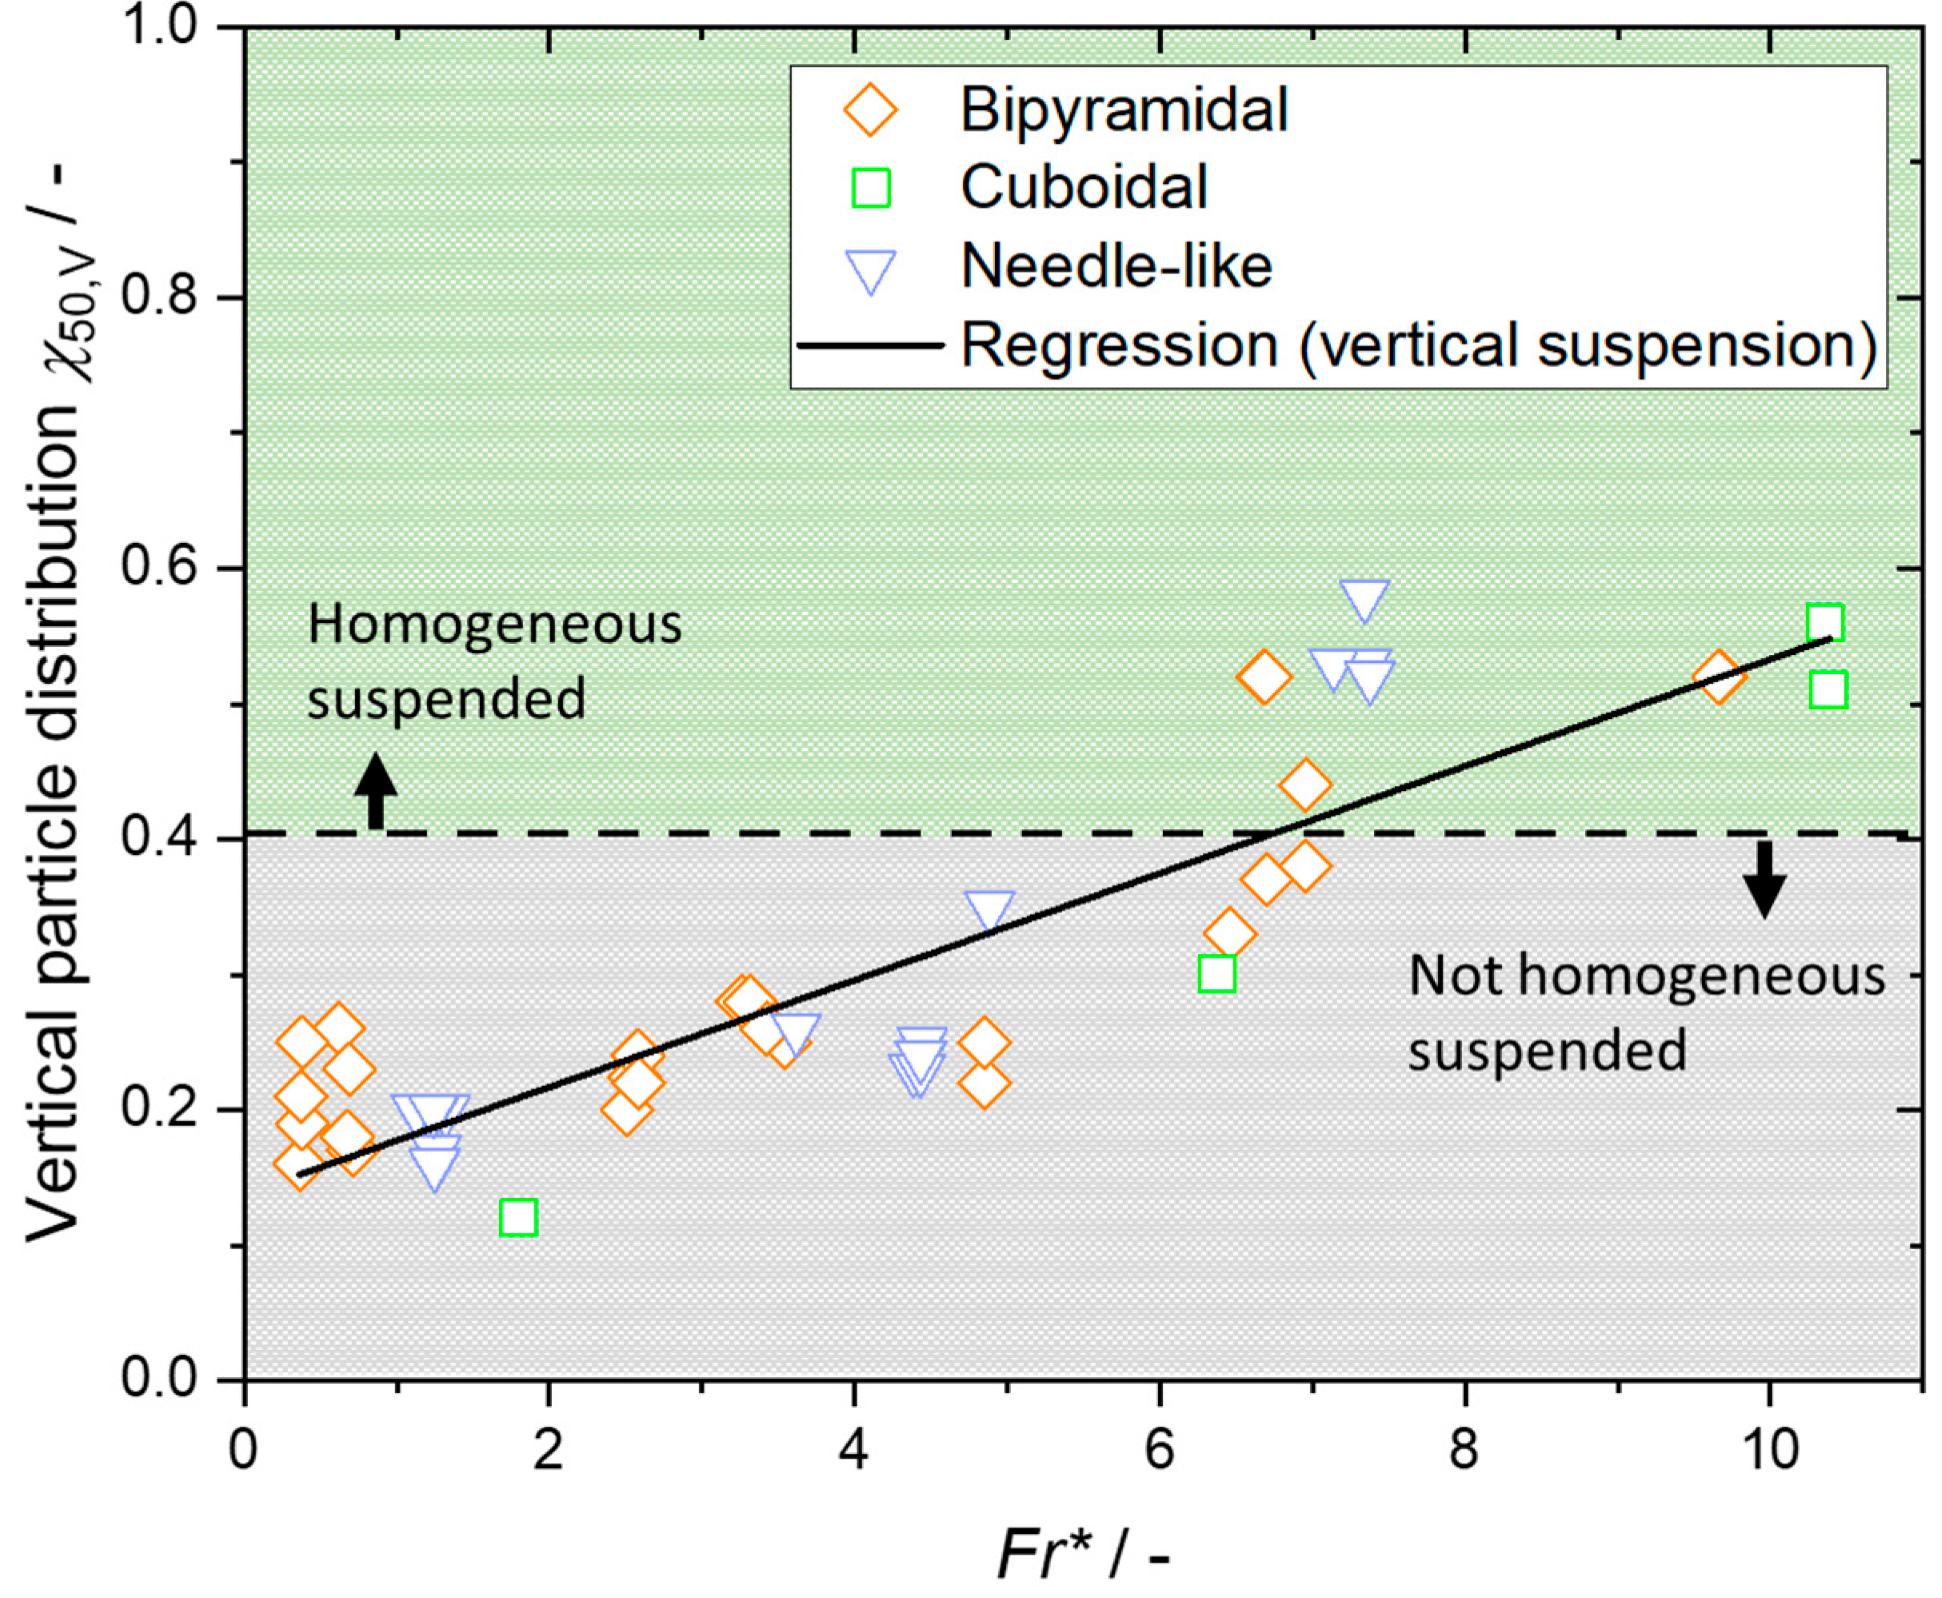
4.3. Influence of Particle Shape on Particle Suspension inside Slugs

In practice, particle shapes in crystallization processes mostly deviate from ideal spheres [1], especially in the focused field of active pharmaceutical ingredients production. Non-spherical particles have varying settling velocities for different orientations in the flow compared to spherical particles. This effect is especially interesting for needle-shaped particles since the projected area significantly changes with different orientations [51].
The drag force F D (Equation (17)) depends on the drag coefficient c D and the projected area A Proj that are separately regarded in the following. Different approaches exist for the calculation of the c D for non-spherical particles. The approximations are based on experimental data for various particle shapes and R e P numbers. The deviation to a sphere is generally considered in the drag coefficient by using the sphericity Φ . It represents the surface ratio of a sphere A sphere to the regarded particle A P and has low values for highly irregular particles. Φ can be calculated for all geometrical shapes with Equation (20). It must be kept in mind that surface roughness significantly affects Φ and is not considered in Equation (20). The calculated Φ for bipyramidal l-alanine particles with a smooth surface used in this work is about 0.86 ( A R = 1.5, M I L ch = 50 µm), and for needle-shaped particles it is about 0.65 ( A R = 4, M I L ch = 50 µm). A descriptor for particle size for non-spherical particles is the volume equivalent diameter d eq (Equation (21)), which replaces the particle diameter d P to determine R e P [1,31,52].
Φ = A sphere A P
d eq = 6 π V P 1 3
For R e P in the Newton or Stokes regime, the drag force can be adapted by utilizing a correction factor based on empirical data. This factor depends on Φ and is multiplied with the settling velocity u P for spheres to compensate the difference in drag. This method is simple but not applicable in the transient regime. Moreover, correction factors exist for geometric shapes such as cylinders and cubes, whereas individually shaped particles are not covered. A more sophisticated approach was established by Dioguardi et al. [53] (Equation (22)) based on the correlation from Haider and Levenspiel [54] and is valid for Φ ranging from 0.335 to 1, and R e P between 0.03–10,000. In these studies, the drag of highly irregular particles was measured and compared to the respective approximation. The high accuracy of the equation is a result of the precise particle measuring technique, but also due to an additional shape factor Ω (Equation (23)). This introduced shape factor provides additional particle information by correlating Φ with a two-dimensional (2D) factor, the circularity λ . The circularity is the deviation of the particle contour to an ideal circle.
c D = 24 R e P 1 Ω R e P + 1 0.25 + 24 R e P 0.1806   R e P 0.6459   Ω R e P 0.08 + 0.4251 1 + 6889.95 R e P   Ω 5.05
Ω = Φ λ
The measurement techniques for the shape factor limit the accuracy of this model. The measuring error increases the more a particle deviates from the spherical shape, and the measured particle size is generally smaller than the real one [55]. If data for λ is not available, a simplification for the shape factor ( Ω = Φ · 0.83 ) is sufficiently accurate for a wide range of particle shapes [53].
With the help of this shape-dependent correlation, the drag force coefficients, and consequently, the settling velocities for the considered particle shapes used in this work, are determined and exemplified, as shown in Table 3, where (‖) represents a particle that is aligned parallel and (Ʇ) perpendicular to the flow. The results are compared to spherical and bipyramidal particles with the same equivalent volume of a cylinder with smooth surfaces based on the characteristic values for the needles used in the experiments.
The obtained values emphasize the importance of particle shape and orientation while viewing the suspension state of particles.
For the dynamic image analysis used in this work, in order to maintain the properties of particles, precision is limited by the particle orientation, which can be arbitrary. According to Bernstein and Shapiro [56], a broad particle orientation distribution for elongated particles is present inside the slugs for the conducted operating range, since R e < 300 . A narrow particle orientation distribution is stated for R e > 500 [56]. Due to the arbitrary orientation of particles in the SFC, the projected area significantly differs for particles of the same size and a 1D factor for evaluating the particle size, i.e., d eq , is representative of the particle population and the description of particle suspension. Therefore, the characteristic major and minor lengths ( M A L c h , M I L c h ) are used to represent the particle population according to the procedure described in Section 2.3.

5. Correlations for the Prediction of Particle Suspension State inside Slugs for Varying Particle Shapes

In this section, we modified dimensionless numbers based on the existing ones shown in Section 1 to develop correlations reliably predicting the particle suspension state for different shaped particles by combining hydrodynamics in the liquid phase with force balances on a single particle to prove our second hypothesis. For this purpose, the suspension state was divided into horizontal and vertical suspension states, since it was already evident from Section 3 that the representation of the particle suspension state with only one dimensionless number was not sufficient.
In order to be able to describe the particle distribution in the horizontal direction, the vertical force balance (Section 4.2.2) is used to consider the settling of particles. Here, the combination of this balance with the circulation zone length L c described in Section 1 is suitable, since the path until sinking to the lower vortex is evaluated. Therefore, the particle sinking velocity u P , which is in the denominator of the dimensionless number, is determined from the force balance. This ensures that both the hydrodynamics and the particle properties are adequately taken into account. The L c value is normalized to the respective slug length for the dimensionless consideration to preserve the axial fraction of particles inside a slug. Figure 6 shows the results for bipyramidal, cuboidal, and needle-shaped particles of the respective experiments. Plotting the ratio L c L slug , 50 1 against the χ50,H shows that a clear trend and course can be seen, and the suspension behavior of the particles for this material system can be reliably estimated via the regressed equation with a mean squared error M S E = 0.0024 :
χ 50 , H = 0.6 0.2016 · L c L slug , 50 0.7
For homogeneous vertical suspension, the particles must leave the lower vortex and are transported into the upper vortex. It is assumed that this is only possible in the rear lower vortex. Here, the particles are transported from the back vortex flow with the flow upward to the center of the slug. Thus, a particle to be suspended in the upper vortex should leave the lower vortex when it is transported up at the rear end and then be transported to the front end of the vortex. Afterwards, the particle can be transported further upwards. This creates two conditions for vertical suspension: First, the particle should be transported into the upper vortex and should not sink into the lower vortex again. This behavior can be described by the radial force balance on the single particle (Section 4.2.1). Due to high centrifugal forces, the particles may leave the vortex. Since the occurrence of another tail vortex does not apply to the gas-liquid slug flow and the high interfacial forces acting at the selected flow velocities compared to the centrifugal force (Section 4.2.1), the particles can only leave the lower vortex upward to the upper Taylor vortex. Furthermore, since the force required to move a particle outward depends on the mass, large particles require more force than small particles, so F C , p + F Saff is normalized over the particle mass. This results in an acceleration that is equivalent to F C , P , indicating whether the particle is leaving its streamline (Equation (25)).
a = F C , p + F Saff ρ P V P
Equation (26) gives the modified Froude number F r * which couples this acceleration with the original Froude number F r . Due to the fact that the particles experience an acceleration at the rear end, either a lower (a > 0) or higher (a < 0) force acts downward, affecting the influence of inertial forces. Thus, F r * can be used to describe the behavior of the particles in the vortex and for the subsequent path along the slug. For characteristic length L , the M A L ch value was used (instead of d eq ) in order to describe all possible particle shapes.
F r * = u L , max 2 g a · L
Due to the use of shape-dependent length and the acceleration a based on force balances, particle properties and operating conditions are considered. In Figure 7, the vertical χ 50 , V parameter is plotted over the modified Froude number F r * .
Based on the clear trend until the homogeneously suspended state is reached ( χ 50 , V > 0.4), the vertical suspension behavior of l-alanine particles can be described by the regression line given in Equation (27) with M S E = 0.0042 . The M S E here is still higher than for the horizontal suspension, but it is reduced compared to the description using the original Froude number (compare Figure S3 in the Supporting Information, regression line M S E = 0.0053 ).
χ 50 , V = 0.1379 + 0.0395 · F r *
The y-axis intercept can be explained by the transported particle cloud at the end of the slug in a non-homogeneous suspended state, depending on the particle shape and size, as well as the mass fraction.

6. Conclusions

For crystallization, setting the desired product quality is crucial to make the further downstream processes as efficient as possible, but also to keep properties of the product uniform and reproducible, leading to the desired bioavailability, etc., for instance, in the pharmaceutical industry. Therefore, it is important in the crystallization process to set the operating conditions so that homogeneous mixing and particle suspension are realized, resulting in high mass transfer and reduced agglomeration. We proved our hypothesis that existing dimensionless numbers are not sufficiently able to describe particle suspension for non-spherical particles. Afterwards, we proved our second hypothesis, that it is able to describe the suspension of particles of different shapes at various operating conditions inside the slug flow by combining hydrodynamics in the liquid phase with force balances on a single particle. With the help of the knowledge of hydrodynamics and force balances on the particle, modified dimensionless numbers and correlations were developed to exemplarily predict the suspension behavior within the crystallizer for the material system l-alanine/water. Therefore, with the aid of different particle sizes, various operating conditions (slug flow velocities, slug lengths) and differing mass fractions, the suspension behavior was regressed in the horizontal direction via the modified length of circulation zone L c normalized with the slug length L slug , 50 . The vertical direction was accurately described by a regressed correlation including the modified Froude number F r * . Due to the dimensionless approach based on force balances, it can be assumed that other material systems can also be represented with this strategy, which still has to be verified in the future. By means of these developed equations, the setting of optimal operating parameters or the mechanistic modeling of the agglomeration behavior in the crystallization process within the SFC are enabled. For this purpose, the region between the non-homogeneous suspended state and the homogeneous suspended state is of particular importance and can be represented very well by the regressed correlations. Furthermore, the correlation has the potential to predict the risk of clogging in the tubing when the particle size and shape are evolving.

Supplementary Materials

The following supporting information can be downloaded at: https://www.mdpi.com/article/10.3390/chemengineering7020034/s1, Figure S1: Picture of evaluated frame of the video at the end of the tubing (Ltubing = 7.5 m) for the experiment with needle-shaped particles at Qtot = 20 mL min−1.; Figure S2: Schematic illustration of the parabolic flow profile and the Taylor vortices present inside the liquid slug.; Figure S3: Plot of the vertical particle distribution represented by χ 50 , V over the original Froude number Fr.; Table S1: Data for experiments in SFC conducted by Termühlen [21]; Table S2: Data for experiments in SFC owned in this work.

Author Contributions

Conceptualization, A.C.K.; methodology, A.C.K.; investigation, A.C.K., N.W. and H.B.; writing—original draft preparation, A.C.K.; writing—review and editing, K.W.; supervision, K.W.; All authors have read and agreed to the published version of the manuscript.

Funding

Our research receives funding by the German Research Foundation (Deutsche Forschungsgemeinschaft–DFG) in the framework of the Priority Programme SPP 2364–Project No. 504676854.

Data Availability Statement

Data is contained within the article and Supplementary Material.

Acknowledgments

The authors express their special thanks to Daniela Ermeling, Tobias Pape, and Marén Schwandt for the technical support during the experiments.

Conflicts of Interest

The authors declare no conflict of interest.

Abbreviations

Abbreviations
Alal-alanine
ARAspect ratio
bBubble
BBuoyancy
CCentrifugal
DDrag
FEPFluorinated ethylene propylene
GGravity
GoSGoodness of suspension
HHorizontal
iInner
LLiquid
maxMaximal
MALMajor axis length
MALchCharacteristic major axis length
MILMinor axis length
MILchCharacteristic minor axis length
MSEMean squared error
pPressure
PParticle
PPPolypropylene
ProjProjected
PVCPolyvinyl chloride
SSolid
SaffSaffman
SeedSeed fraction
TotOverall
VVertical
0Initial state
Latin Symbols
aAcceleration/m s−2
c Concentration/g g−1
c * Saturation concentration/g g−1
CaCapillary number/-
cDDrag coefficient/-
dDiameter/mm
Eötvös number/-
FForce/kgm s−2
FrFroude number/-
gGravitational acceleration/m s−2
LCharacteristic length/m
Lslug,50Median slug length/mm
Lslug,90-10Width of slug length/mm
LcLength of circulation zone/mm
LtubingLength of tubing/m
QVolume flow rate/mL min−1
RSlug radius/m
ReReynolds number/-
uFlow velocity/m s−1
VVolume/m3
wMass fraction/gsolid gsolution−1
Greek Symbols
βCorrection factor for Saffman force/-
γ ˙ Shear rate/m s−1
ηDynamic viscosity/Pa s
θShield parameter/-
ϑ * Saturation temperature/°C
λ Circularity/-
ρ Density/kg m−3
σ Surface tension/kg s−2
ΦSphericity/-
φ Radial/°
χ50Centroid of particle distribution/-
χ90-10Width of particle distribution/-
ΨBDimensionless bubble velocity/-
ΩShape parameter/-

References

  1. Schubert, H. Handbuch der Mechanischen Verfahrenstechnik, 1st ed.; Wiley-VCH: Weinheim, Germany, 2008. [Google Scholar]
  2. Stieß, M. Mechanische Verfahrenstechnik—Partikeltechnologie 1, 3rd ed.; Springer: Berlin/Heidelberg, Germany, 2009. [Google Scholar]
  3. Paul, E.L.; Atiemo-Obeng, V.A.; Kresta, S.M. Handbook of Industrial Mixing; John Wiley & Sons, Inc.: Hoboken, NJ, USA, 2003. [Google Scholar]
  4. Lewis, A.; Seckler, M.; Kramer, H.; van Rosmalen, G. Industrial Crystallization; Springer: Berlin/Heidelberg, Germany, 2015. [Google Scholar]
  5. Mullin, J.W. Crystallization, 4th ed.; Elsevier Science, Jordan Hill: Oxford, UK, 2014. [Google Scholar]
  6. Hofmann, G. Kristallisation in der Industriellen Praxis, 1st ed.; Wiley-VCH: Weinheim, Germany, 2004. [Google Scholar]
  7. Kraume, M.; Zehner, P. Suspendieren im Rührbehälter—Vergleich unterschiedlicher Berechnungsgleichungen. Chem. Ing. Tech. 1988, 60, 822–829. [Google Scholar] [CrossRef]
  8. Voit, H.; Mersmann, A. Allgemeingültige Aussage zur Mindest-Rührerdrehzahl beim Suspendieren. Chem. Ing. Tech. 1985, 57, 692–693. [Google Scholar] [CrossRef]
  9. Zwietering, T. Suspending of solid particles in liquid by agitators. Chem. Eng. Sci. 1958, 8, 244–253. [Google Scholar] [CrossRef]
  10. Vieweg, R. Verfahrenstechnische Berechnungsmethoden Teil 4: Stoffvereinigen in fluiden Phasen—Ausrüstungen und ihre Berechnung von einem Autorenkollektiv unter Federführung von F. Liepe (Herausgeber der Reihe: Herausgeberkollektiv unter Leitung von S. Weiß); Leipz. Z. Chem. 1988, 28, 417–418. [Google Scholar] [CrossRef]
  11. Brennen, C. Fundamentals of Multiphase Flow; Cambridge University Press: Cambridge, UK, 2005. [Google Scholar]
  12. Termühlen, M.; Etmanski, M.M.; Kryschewski, I.; Kufner, A.C.; Schembecker, G.; Wohlgemuth, K. Continuous slug flow crystallization: Impact of design and operating parameters on product quality. Chem. Eng. Res. Des. 2021, 170, 290–303. [Google Scholar] [CrossRef]
  13. Kufner, A.; Krummnow, A.; Danzer, A.; Wohlgemuth, K. Strategy for Fast Decision on Material System Suitability for Continuous Crystallization Inside a Slug Flow Crystallizer. Micromachines 2022, 13, 1795. [Google Scholar] [CrossRef] [PubMed]
  14. Besenhard, M.O.; Neugebauer, P.; Scheibelhofer, O.; Khinast, J.G. Crystal Engineering in Continuous Plug-Flow Crystallizers. Cryst. Growth Des. 2017, 17, 6432–6444. [Google Scholar] [CrossRef]
  15. Muzychka, Y.S.; Walsh, E.J.; Walsh, P. Heat Transfer Enhancement Using Laminar Gas-Liquid Segmented Plug Flows. J. Heat Transf. 2011, 133, 041902. [Google Scholar] [CrossRef]
  16. Sonnenschein, J.; Friedrich, P.; Aghayarzadeh, M.; Mierka, O.; Turek, S.; Wohlgemuth, K. Flow Map for Hydrodynamics and Suspension Behavior in a Continuous Archimedes Tube Crystallizer. Crystals 2021, 11, 1466. [Google Scholar] [CrossRef]
  17. Termühlen, M.; Strakeljahn, B.; Schembecker, G.; Wohlgemuth, K. Quantification and evaluation of operating parameters’ effect on suspension behavior for slug flow crystallization. Chem. Eng. Sci. 2021, 243, 116771. [Google Scholar] [CrossRef]
  18. Jiang, M.; Zhu, Z.; Jimenez, E.; Papageorgiou, C.D.; Waetzig, J.; Hardy, A.; Langston, M.; Braatz, R.D. Continuous-Flow Tubular Crystallization in Slugs Spontaneously Induced by Hydrodynamics. Cryst. Growth Des. 2014, 14, 851–860. [Google Scholar] [CrossRef]
  19. Su, M.; Gao, Y. Air–Liquid Segmented Continuous Crystallization Process Optimization of the Flow Field, Growth Rate, and Size Distribution of Crystals. Ind. Eng. Chem. Res. 2018, 57, 3781–3791. [Google Scholar] [CrossRef]
  20. Scheiff, F.; Agar, D.W. Solid Particle Handling in Microreaction Technology: Practical Challenges and Application of Microfluid Segments for Particle-Based Processes. In Micro-Segmented Flow; Köhler, J.M., Cahill, B.P., Eds.; Springer: Berlin/Heidelberg, Germany, 2014; pp. 103–148. [Google Scholar]
  21. Termühlen, M. From Design to Operation of a Continuous Slug Flow Crystallizer for Cooling Crystallization; Dr. Hut: München, Germany, 2022. [Google Scholar]
  22. Zhang, D.; Xu, S.; Du, S.; Wang, J.; Gong, J. Progress of Pharmaceutical Continuous Crystallization. Engineering 2017, 3, 354–364. [Google Scholar] [CrossRef]
  23. Wang, T.; Lu, H.; Wang, J.; Xiao, Y.; Zhou, Y.; Bao, Y.; Hao, H. Recent progress of continuous crystallization. J. Ind. Eng. Chem. 2017, 54, 14–29. [Google Scholar] [CrossRef]
  24. Ma, Y.; Wu, S.; Macaringue, E.G.J.; Zhang, T.; Gong, J.; Wang, J. Recent Progress in Continuous Crystallization of Pharmaceutical Products: Precise Preparation and Control. Org. Process Res. Dev. 2020, 24, 1785–1801. [Google Scholar] [CrossRef]
  25. Orehek, J.; Teslić, D.; Likozar, B. Continuous Crystallization Processes in Pharmaceutical Manufacturing: A Review. Org. Process Res. Dev. 2021, 25, 16–42. [Google Scholar] [CrossRef]
  26. Jiang, M.; Braatz, R.D. Designs of continuous-flow pharmaceutical crystallizers: Developments and practice. CrystEngComm 2019, 21, 3534–3551. [Google Scholar] [CrossRef] [Green Version]
  27. Eren, A.; Civati, F.; Ma, W.; Gamekkanda, J.C.; Myerson, A.S. Continuous crystallization and its potential use in drug substance Manufacture: A review. J. Cryst. Growth 2023, 601, 126958. [Google Scholar] [CrossRef]
  28. Pu, S.; Hadinoto, K. Continuous crystallization as a downstream processing step of pharmaceutical proteins: A review. Chem. Eng. Res. Des. 2020, 160, 89–104. [Google Scholar] [CrossRef]
  29. Yazdanpanah, N.; Nagy, Z.K. The Handbook of Continuous Crystallization; Royal Society of Chemistry: Cambridge, UK, 2020. [Google Scholar]
  30. Kurup, G.K.; Basu, A.S. Field-free particle focusing in microfluidic plugs. Biomicrofluidics 2012, 6, 022008. [Google Scholar] [CrossRef] [Green Version]
  31. Kraume, M. Transportvorgänge in der Verfahrenstechnik: Grundlagen und Apparative Umsetzungen; Morgan Kaufmann: San Francisco, CA, USA, 2020. [Google Scholar]
  32. Miller, M.C.; McCave, I.N.; Komar, P.D. Threshold of sediment motion under unidirectional currents. Sedimentology 1977, 24, 507–527. [Google Scholar] [CrossRef]
  33. Scheiff, F. Fluiddynamik, Stofftransport und Chemische Reaktion der Suspensionskatalyse bei der Flüssig/Flüssig-Pfropfenströmung in Mikrokanälen. Ph.D. Thesis, Technische Universität Dortmund, Dortmund, Germany, 2015. [Google Scholar]
  34. Agudo, J.R.; Illigmann, C.; Luzi, G.; Laukart, A.; Delgado, A.; Wierschem, A. Shear-induced incipient motion of a single sphere on uniform substrates at low particle Reynolds numbers. J. Fluid Mech. 2017, 825, 284–314. [Google Scholar] [CrossRef]
  35. Hohmann, L.; Schmalenberg, M.; Prasanna, M.; Matuschek, M.; Kockmann, N. Suspension flow behavior and particle residence time distribution in helical tube devices. Chem. Eng. J. 2019, 360, 1371–1389. [Google Scholar] [CrossRef]
  36. Wohlgemuth, K.; Schembecker, G. Modeling induced nucleation processes during batch cooling crystallization: A sequential parameter determination procedure. Comput. Chem. Eng. 2013, 52, 216–229. [Google Scholar] [CrossRef]
  37. Steenweg, C.; Habicht, J.; Wohlgemuth, K. Continuous Isolation of Particles with Varying Aspect Ratios up to Thin Needles Achieving Free-Flowing Products. Crystals 2022, 12, 137. [Google Scholar] [CrossRef]
  38. Lührmann, M.-C.; Timmermann, J.; Schembecker, G.; Wohlgemuth, K. Enhanced Product Quality Control through Separation of Crystallization Phenomena in a Four-Stage MSMPR Cascade. Cryst. Growth Des. 2018, 18, 7323–7334. [Google Scholar] [CrossRef]
  39. Termühlen, M.; Strakeljahn, B.; Schembecker, G.; Wohlgemuth, K. Characterization of slug formation towards the performance of air-liquid segmented flow. Chem. Eng. Sci. 2019, 207, 1288–1298. [Google Scholar] [CrossRef]
  40. Heisel, S.; Ernst, J.; Emshoff, A.; Schembecker, G.; Wohlgemuth, K. Shape-independent particle classification for discrimination of single crystals and agglomerates. Powder Technol. 2019, 345, 425–437. [Google Scholar] [CrossRef]
  41. Heisel, S.; Rolfes, M.; Wohlgemuth, K. Discrimination between Single Crystals and Agglomerates during the Crystallization Process. Chem. Eng. Technol. 2018, 41, 1218–1225. [Google Scholar] [CrossRef]
  42. Etminan, A.; Muzychka, Y.S.; Pope, K. A Review on the Hydrodynamics of Taylor Flow in Microchannels: Experimental and Computational Studies. Processes 2021, 9, 870. [Google Scholar] [CrossRef]
  43. Thulasidas, T.C.; Abraham, M.A.; Cerro, R.L. Flow patterns in liquid slugs during bubble-train flow inside capillaries. Chem. Eng. Sci. 1997, 52, 2947–2962. [Google Scholar] [CrossRef]
  44. Liedtke, A.-K.; Scheiff, F.; Bornette, F.; Philippe, R.; Agar, D.W.; de Bellefon, C. Liquid–Solid Mass Transfer for Microchannel Suspension Catalysis in Gas–Liquid and Liquid–Liquid Segmented Flow. Ind. Eng. Chem. Res. 2015, 54, 4699–4708. [Google Scholar] [CrossRef]
  45. King, C.; Walsh, E.; Grimes, R. PIV measurements of flow within plugs in a microchannel. Microfluid. Nanofluid 2007, 3, 463–472. [Google Scholar] [CrossRef]
  46. Stephan, P.; Kabelac, S.; Kind, M.; Mewes, D.; Schaber, K.; Wetzel, T. VDI-Wärmeatlas: Fachlicher Träger VDI-Gesellschaft Verfahrenstechnik und Chemieingenieurwesen, 12th ed.; Springer: Berlin/Heidelberg, Germany, 2019. [Google Scholar]
  47. VDI, e.V. VDI-Wärmeatlas, 11th ed.; Springer: Berlin/Heidelberg, Germany, 2013. [Google Scholar]
  48. Köhler, J.M.; Cahill, B.P. (Eds.) Micro-Segmented Flow: Applications in Chemistry and Biology, 1st ed.; Springer: Berlin/Heidelberg, Germany, 2014. [Google Scholar]
  49. Bagchi, P.; Balachandar, S. Effect of free rotation on the motion of a solid sphere in linear shear flow at moderate Re. Phys. Fluids 2002, 14, 2719–2737. [Google Scholar] [CrossRef]
  50. Elger, D.F.; LeBret, B.A.; Crowe, C.T. Engineering Fluid Mechanics; Wiley: Hoboken, NJ, USA, 2016. [Google Scholar]
  51. Crowe, C.T. A Guide for Learning Engineering Fluid Mechanics: Practice Problems with Solutions, 9th ed.; John Wiley: Hoboken, NJ, USA; Chichester, UK, 2009. [Google Scholar]
  52. Hölzer, A.; Sommerfeld, M. New simple correlation formula for the drag coefficient of non-spherical particles. Powder Technol. 2008, 184, 361–365. [Google Scholar] [CrossRef]
  53. Dioguardi, F.; Mele, D.; Dellino, P. A New One-Equation Model of Fluid Drag for Irregularly Shaped Particles Valid over a Wide Range of Reynolds Number. J. Geophys. Res. Solid Earth 2018, 123, 144–156. [Google Scholar] [CrossRef] [Green Version]
  54. Haider, A.; Levenspiel, O. Drag coefficient and terminal velocity of spherical and nonspherical particles. Powder Technol. 1989, 58, 63–70. [Google Scholar] [CrossRef]
  55. Zhang, R.; Ma, C.Y.; Liu, J.J.; Wang, X.Z. On-line measurement of the real size and shape of crystals in stirred tank crystalliser using non-invasive stereo vision imaging. Chem. Eng. Sci. 2015, 137, 9–21. [Google Scholar] [CrossRef]
  56. Bernstein, O.; Shapiro, M. Direct determination of the orientation distribution function of cylindrical particles immersed in laminar and turbulent shear flows. J. Aerosol Sci. 1994, 25, 113–136. [Google Scholar] [CrossRef]
Figure 1. Microscopic images of the bipyramidal (spherical-like), cuboidal, and needle-like seed crystals of the material system l-alanine/water modified with l-glutamic acid of different concentrations in solution (higher concentration from (left) to (right) [37]).
Chemengineering 07 00034 g001
Figure 2. Schematic experimental setup of SFC.
Chemengineering 07 00034 g002
Figure 3. Images of bipyramidal (left), cuboidal (middle), and needle-like (right) shaped l-alanine particles in non-homogeneous (top images, Q tot = 20 mL min−1) and homogeneous (bottom images, Q tot = 60 mL min−1) suspended states inside a slug during experiments. Microscopic images showing the particle shapes are given in Figure 1. The recordings were taken after L tubing = 7.5 m. The ratio of gas and liquid volume flow rate was set to 1:1, and the flow direction was from the (left) to the (right).
Chemengineering 07 00034 g003
Figure 4. Particle distribution parameters χ50,H and χ50,V are plotted against the Shield parameter θ (a), the length of circulation zone L c R 1 (b), the Shield parameter defined by Agudo et al. [34] θ Agudo (c), and the Froude number F r (d) for various particle shapes. The used data are given in the Supporting Information in Tables S1 and S2.
Chemengineering 07 00034 g004
Figure 5. Schematic representation of relevant forces acting on a single particle at the moving on the vortex at the rear end of the slug for radial and vertical force balances.
Chemengineering 07 00034 g005
Figure 6. Plot of the horizontal particle distribution represented by χ 50 , H over the dimensionless number L c L slug , 50 1 . The used data are given in the Supporting Information in Tables S1 and S2.
Chemengineering 07 00034 g006
Figure 7. Plot of the vertical particle distribution represented by χ 50 , V over the modified Froude number F r * . The used data are given in the Supporting Information in Tables S1 and S2.
Chemengineering 07 00034 g007
Table 1. Limits for the classification of the particle suspension state inside slugs based on the Shield parameter θ .
Suspension StateKurup and Basu [30]Scheiff [20,33]
Accumulation/segregation of particles<10<<10
Increase of horizontal particle suspension10 < θ < 4210 < θ < 30
Increase of vertical particle suspension θ > 4230 < θ < 180
Complete vertical suspension/ θ > 180
Table 2. Calculated Ca numbers for the respective volume flow rates used in the considered experiments.
Volume Flow Rate/mL min−1Ca/-
201.01∙10−3
402.03∙10−3
603.04∙10−3
Table 3. Calculated drag coefficients c D and settling velocities u P for the respective particle shapes and orientations. The calculations were carried out for Q tot = 20 mL min−1, and a d eq = 64 µm. The shape factor Ω was calculated according to Equation (23) using the circularity λ .
Particle ShapeShape Factor Ω /- Sphericity Φ /-Circularity λ /- c D / - u P / mm   s 1
Sphere1.001.001.001162.50.55
Bipyramidal0.600.701.162433.30.33
Cuboidal ‖0.360.471.322725.70.48
Cuboidal Ʇ0.360.471.322725.70.30
Needle 0.110.252.272793.30.58
Needle Ʇ0.110.252.272793.30.26
Disclaimer/Publisher’s Note: The statements, opinions and data contained in all publications are solely those of the individual author(s) and contributor(s) and not of MDPI and/or the editor(s). MDPI and/or the editor(s) disclaim responsibility for any injury to people or property resulting from any ideas, methods, instructions or products referred to in the content.

