
Evaluating Electrochemical Properties of Layered NaxMn0.5Co0.5O2 Obtained at Different Calcined Temperatures
 , ,
, ,
Abstract
:1. Introduction
2. Materials and Methods
3. Results
4. Discussion

| Voltage Range | Specific Capacity (mah·g−1)/Current Density | Capacity Retention/Cycle Number | Refs | |
|---|---|---|---|---|
| P2-Na0.7Cu0.2Fe0.2Mn0.6O2 | 1.5–4.5 V | ~190 (C/10) | ~69% (30) | [52] |
| P2-NaMn0.5Fe0.5O2 | 2.0–4.3 V | 185 (C/10) | 60% (50) | [53] |
| P2-Na2/3Ni1/3Mn2/3O2 | 2.0–4.5 V | 133 (~C/10) | 42% (50) | [54] |
| P2-Na0.66Mn0.9Mg0.1O2 | 2.0–4.5 V | 152 (~C/5) | 71% (100) | [55] |
| P3-Na0.9Ni0.5Mn0.5O2 | 1.5–4.5 V | 102 (1C) | 78% (500) | [56] |
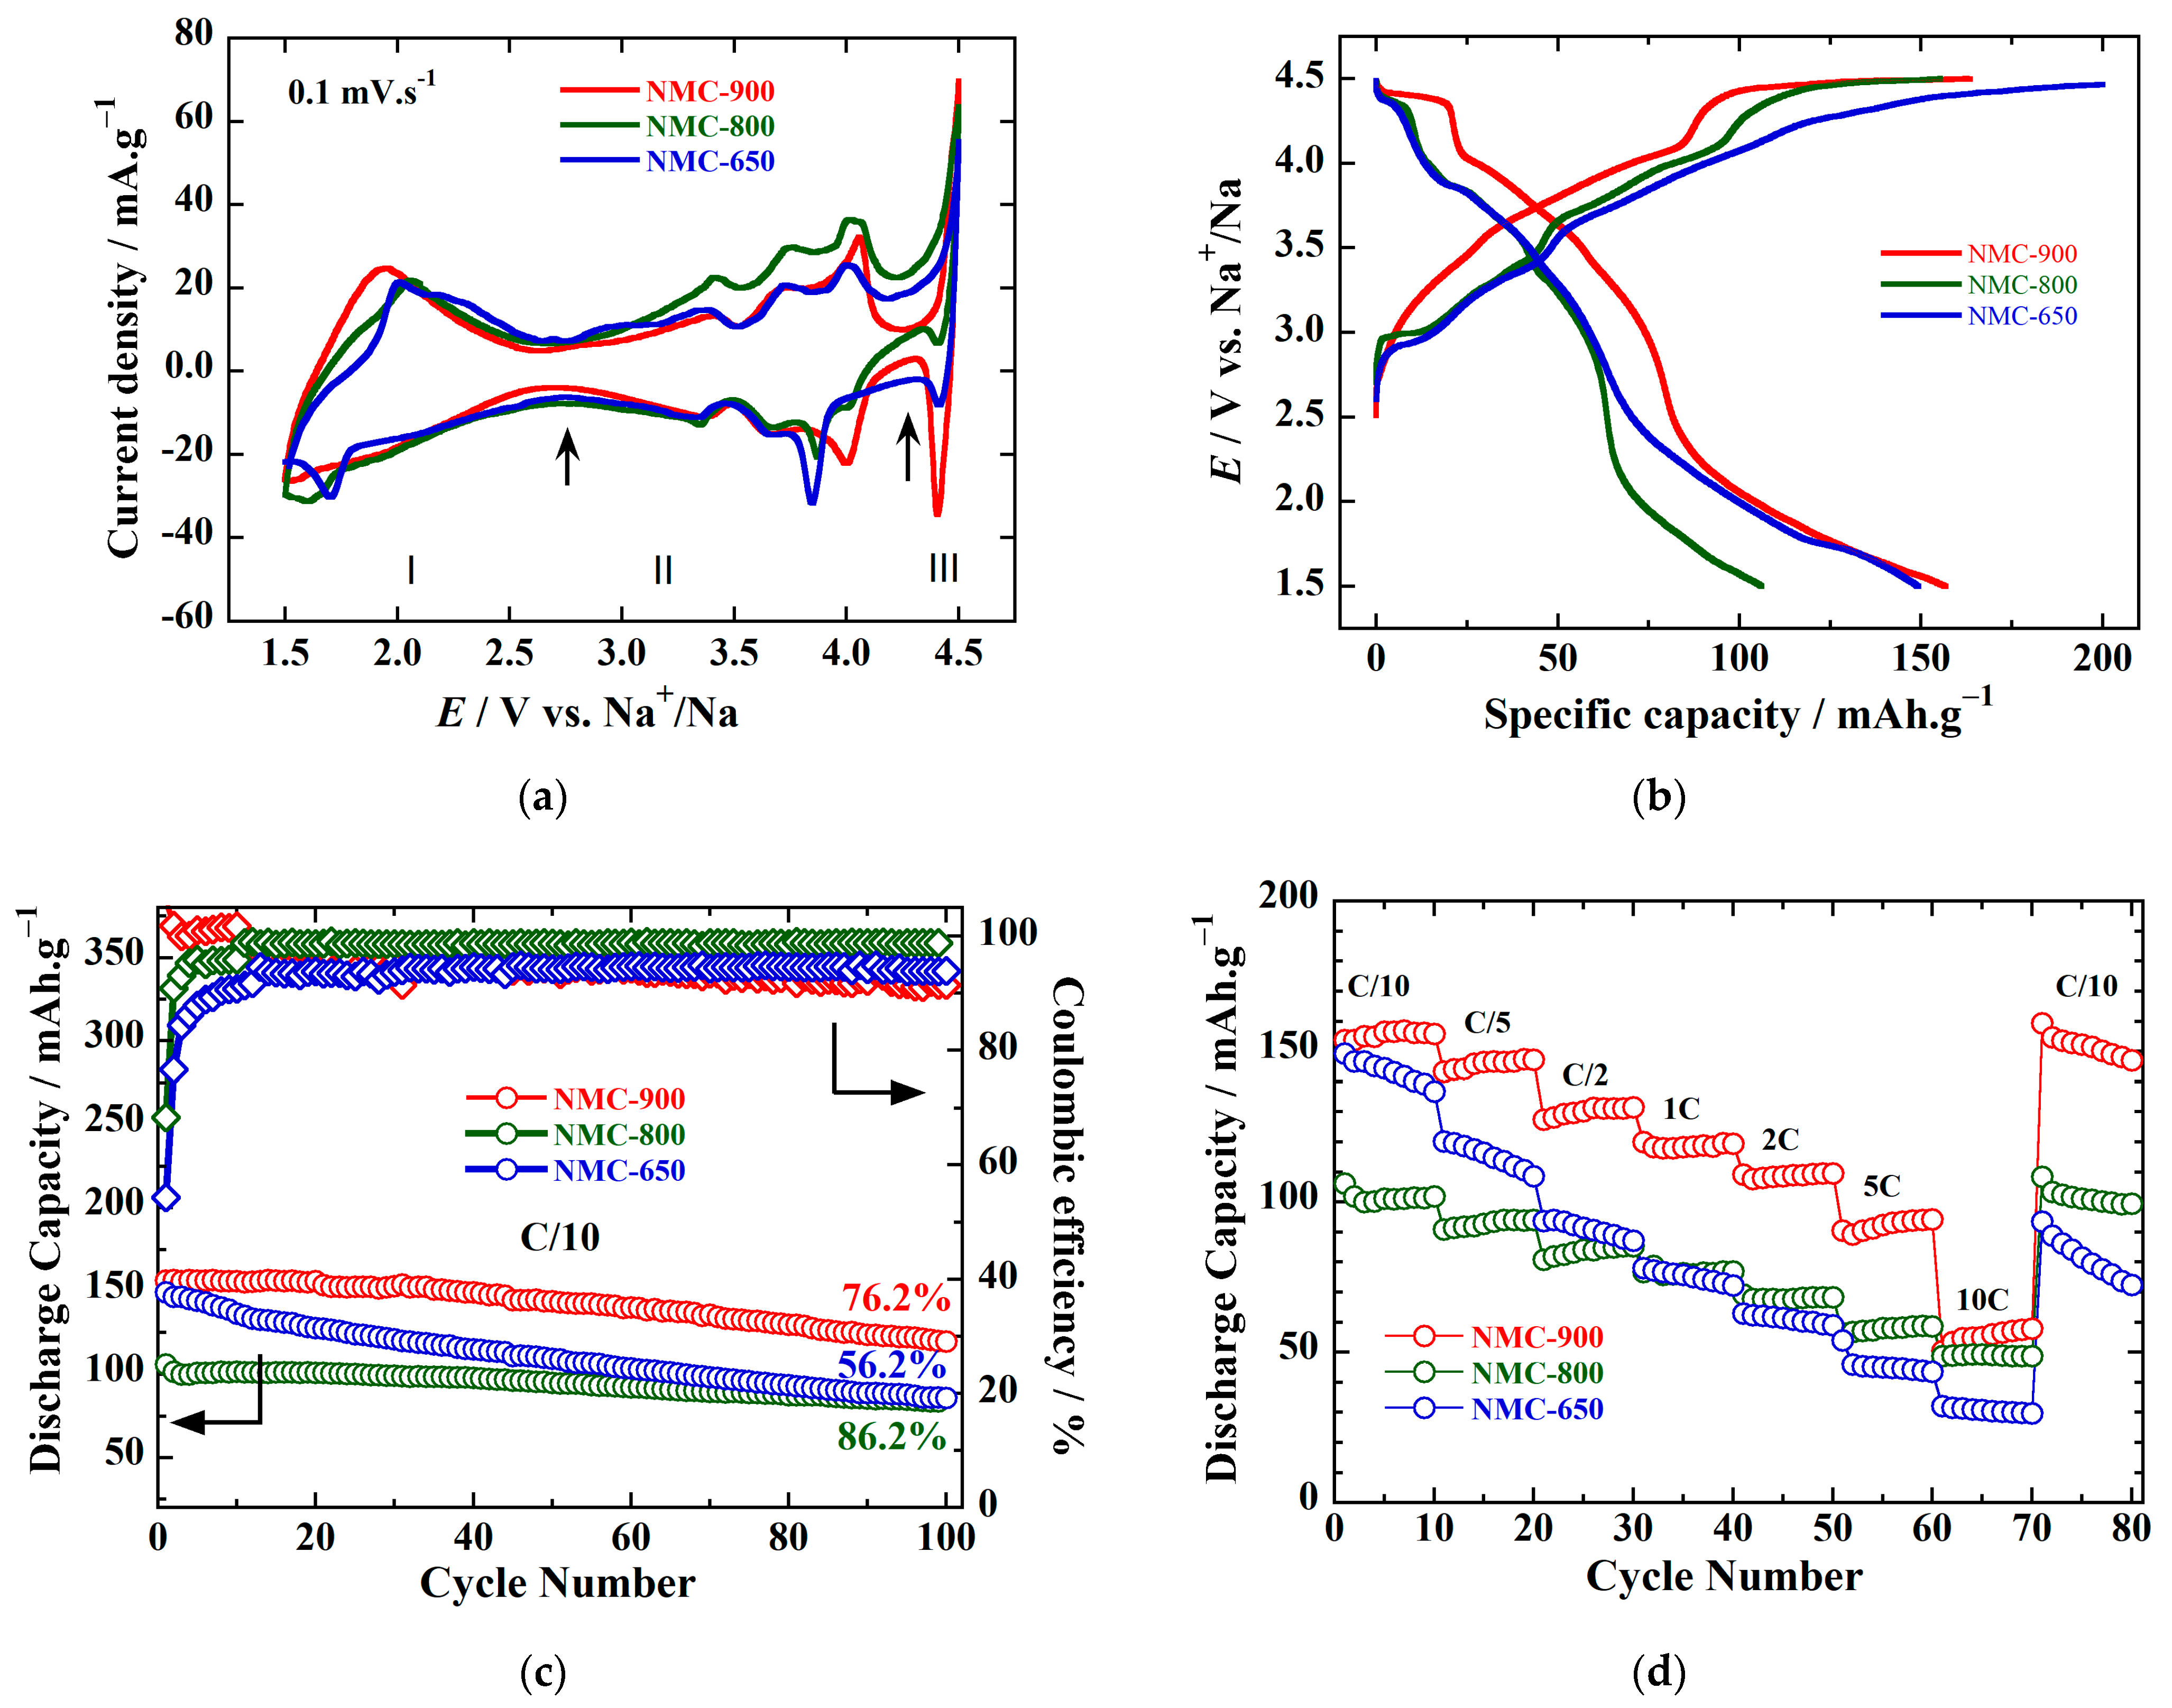
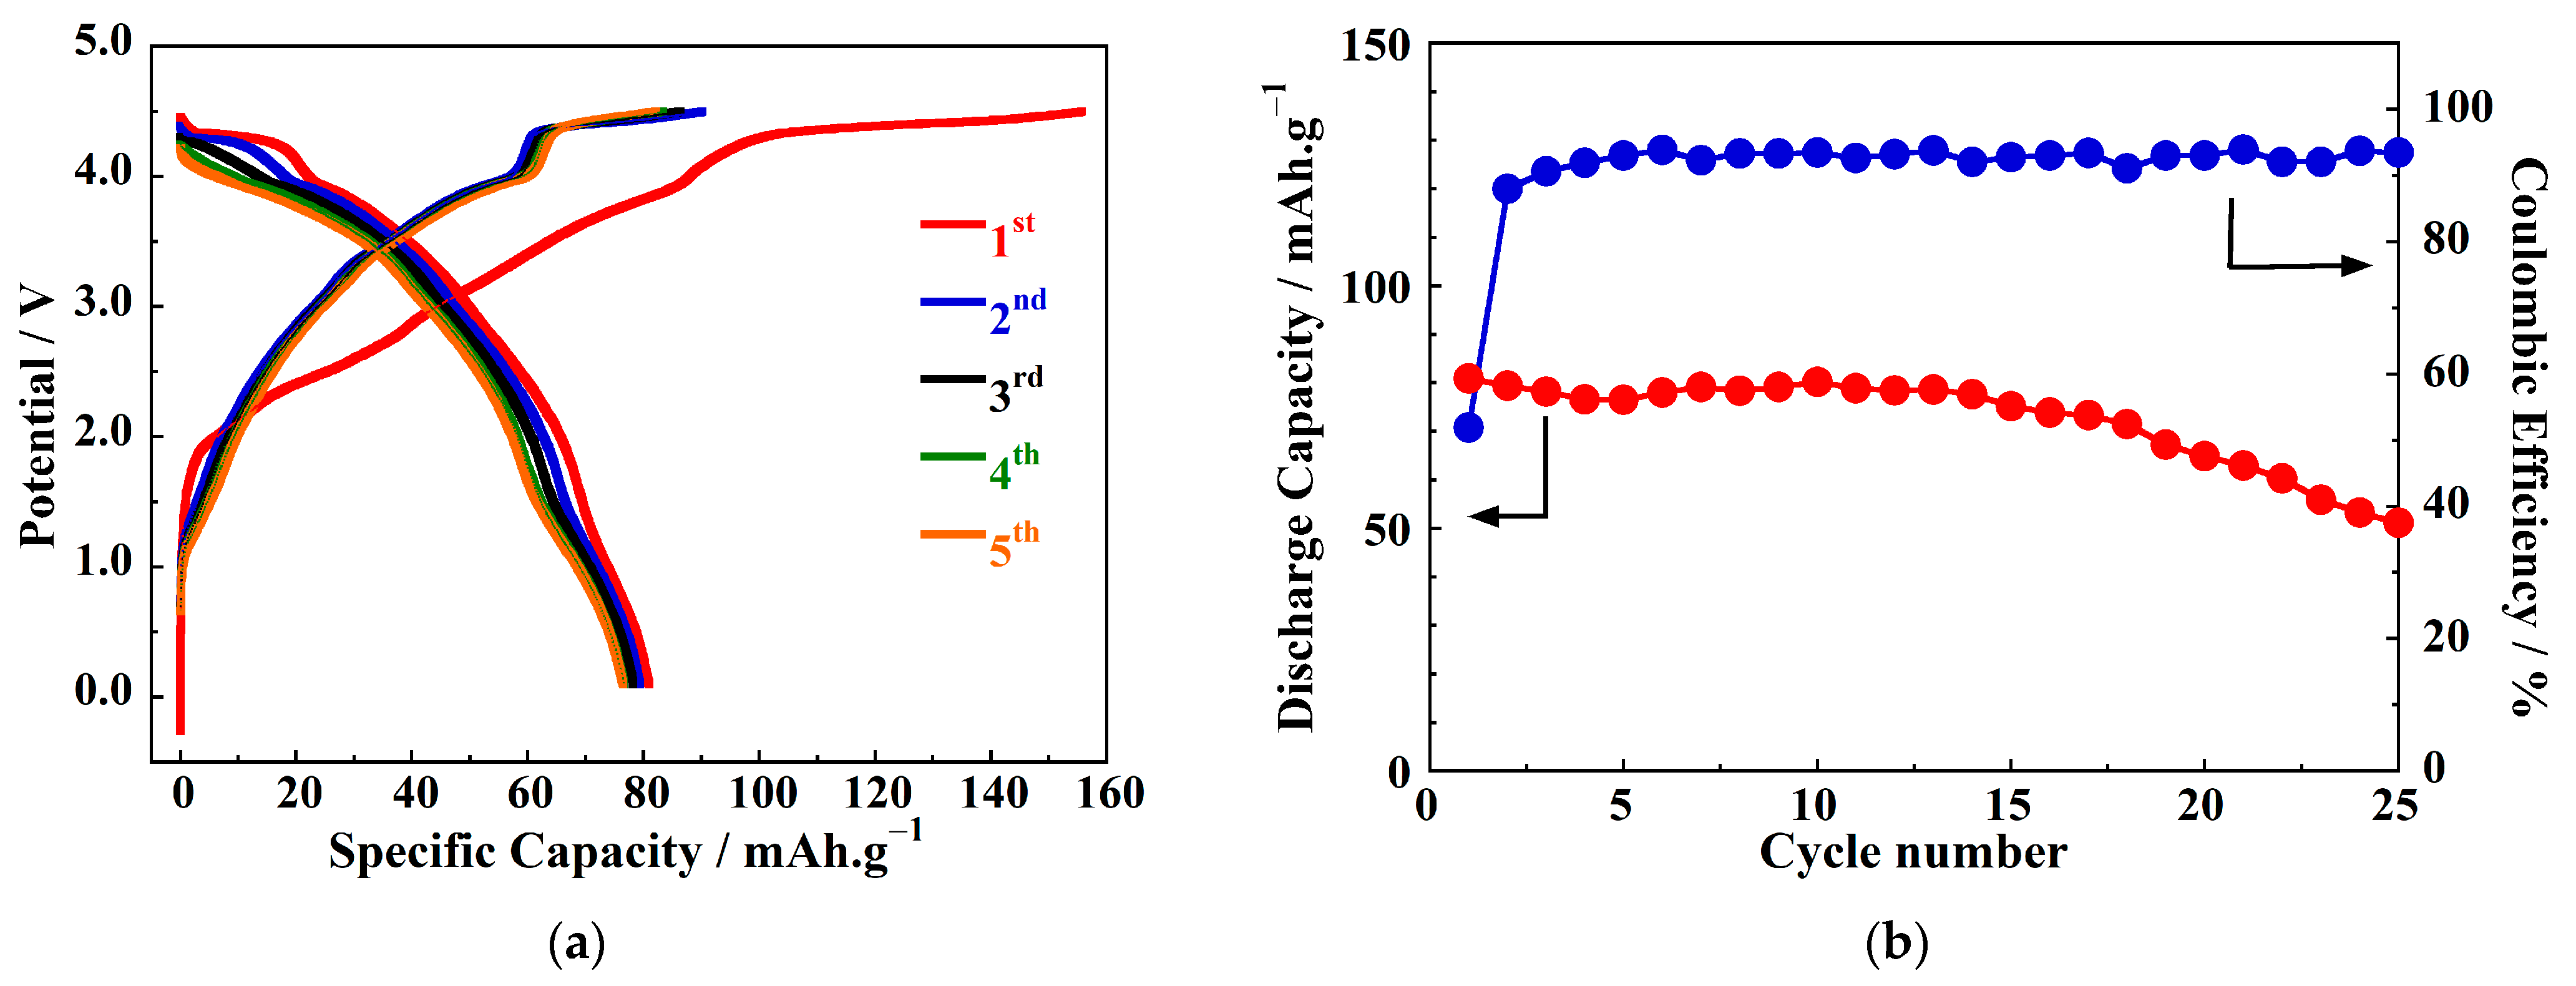
| P2-NaCo0.5Mn0.5O2 (This work) | 1.5–4.5 V | 149 (C/10) | 76% (100) |
5. Conclusions
Author Contributions
Funding
Informed Consent Statement
Data Availability Statement
Conflicts of Interest
References
- Palomares, V.; Serras, P.; Villaluenga, I.; Hueso, K.B.; Carretero-González, J.; Rojo, T. Na-ion batteries, recent advances and present challenges to become low cost energy storage systems. Energy Environ. Sci. 2012, 5, 5884. [Google Scholar] [CrossRef]
- Pan, H.; Hu, Y.-S.; Chen, L. Room-temperature stationary sodium-ion batteries for large-scale electric energy storage. Energy Environ. Sci. 2013, 6, 2338. [Google Scholar] [CrossRef]
- Delmas, C.; Fouassier, C.; Hagenmuller, P. Structural classification and properties of the layered oxides. Phys. BC 1980, 99, 81–85. [Google Scholar] [CrossRef]
- Yuan, D.; Hu, X.; Qian, J.; Pei, F.; Wu, F.; Mao, R.; Ai, X.; Yang, H.; Cao, Y. P2-type Na0.67Mn0.65Fe0.2Ni0.15O2 cathode material with high-capacity for sodium-ion battery. Electrochim. Acta 2014, 116, 300–305. [Google Scholar] [CrossRef]
- Kang, W.; Yu, D.Y.W.; Lee, P.-K.; Zhang, Z.; Bian, H.; Li, W.; Ng, T.-W.; Zhang, W.; Lee, C.-S. P2-type NaxCu0.15Ni0.20Mn0.65O2 cathodes with high voltage for high-power and long-life sodium-ion batteries. ACS Appl. Mater. Interfaces 2016, 8, 31661–31668. [Google Scholar] [CrossRef]
- Lee, D.H.; Xu, J.; Meng, Y.S. An advanced cathode for Na-ion batteries with high rate and excellent structural stability. Phys. Chem. Chem. Phys. 2013, 15, 3304. [Google Scholar] [CrossRef]
- Li, Y.; Yang, Z.; Xu, S.; Mu, L.; Gu, L.; Hu, Y.-S.; Li, H.; Chen, L. Air-stable copper-based P2-Na7/9Cu2/9Fe1/9Mn2/3O2 as a new positive electrode material for sodium-ion batteries. Adv. Sci. 2015, 2, 1500031. [Google Scholar] [CrossRef]
- Yabuuchi, N.; Kajiyama, M.; Iwatate, J.; Nishikawa, H.; Hitomi, S.; Okuyama, R.; Usui, R.; Yamada, Y.; Komaba, S. P2-type Nax[Fe1/2Mn1/2]O2 made from earth-abundant elements for rechargeable Na batteries. Nat. Mater. 2012, 11, 512–517. [Google Scholar] [CrossRef]
- Sun, X.; Jin, Y.; Zhang, C.-Y.; Wen, J.-W.; Shao, Y.; Zang, Y.; Chen, C.-H. Na[Ni0.4Fe0.2Mn0.4−xTix]O2: A cathode of high capacity and superior cyclability for Na-ion batteries. J. Mater. Chem. A 2014, 2, 17268–17271. [Google Scholar] [CrossRef]
- Vassilaras, P.; Toumar, A.J.; Ceder, G. Electrochemical properties of NaNi1/3Co1/3Fe1/3O2 as a cathode material for Na-ion batteries. Electrochem. Commun. 2014, 38, 79–81. [Google Scholar] [CrossRef]
- Mendiboure, A.; Delmas, C.; Hagenmuller, P. Electrochemical intercalation and deintercalation of NaxMnO2 bronzes. J. Solid State Chem. 1985, 57, 323–331. [Google Scholar] [CrossRef]
- Delmas, C.; Braconnier, J.; Fouassier, C.; Hagenmuller, P. Electrochemical intercalation of sodium in NaxCoO2 bronzes. Solid State Ion. 1981, 3–4, 165–169. [Google Scholar] [CrossRef]
- Carlier, D.; Cheng, J.H.; Berthelot, R.; Guignard, M.; Yoncheva, M.; Stoyanova, R.; Hwang, B.J.; Delmas, C. The P2-Na2/3Co2/3Mn1/3O2 phase: Structure, physical properties and electrochemical behavior as positive electrode in sodium battery. Dalton. Trans. 2011, 40, 9306. [Google Scholar] [CrossRef]
- Manikandan, P.; Heo, S.; Kim, H.W.; Jeong, H.Y.; Lee, E.; Kim, Y. Structural characterization of layered Na0.5Co0.5Mn0.5O2 material as a promising cathode for sodium-ion batteries. J. Power Sources 2017, 363, 442–449. [Google Scholar] [CrossRef]
- Yang, P.; Zhang, C.; Li, M.; Yang, X.; Wang, C.; Bie, X.; Wei, Y.; Chen, G.; Du, F. P2-NaCo0.5Mn0.5O2 as a positive electrode material for sodium-ion batteries. ChemPhysChem 2015, 16, 3408–3412. [Google Scholar] [CrossRef]
- Bucher, N.; Hartung, S.; Franklin, J.B.; Wise, A.M.; Lim, L.Y.; Chen, H.-Y.; Weker, J.N.; Toney, M.F.; Srinivasan, M. P2-NaxCoyMn1–yO2 (y = 0, 0.1) as cathode materials in sodium-ion batteries-effects of doping and morphology to enhance cycling stability. Chem. Mater. 2016, 28, 2041–2051. [Google Scholar] [CrossRef]
- Wang, X.; Tamaru, M.; Okubo, M.; Yamada, A. Electrode properties of P2-Na2/3MnyCo1–yO2 as cathode materials for sodium-ion batteries. J. Phys. Chem. C 2013, 117, 15545–15551. [Google Scholar] [CrossRef]
- Chen, X.; Zhou, X.; Hu, M.; Liang, J.; Wu, D.; Wei, J.; Zhou, Z. Stable layered P3/P2 Na0.66Co0.5Mn0.5O2 cathode materials for sodium-ion batteries. J. Mater. Chem. A 2015, 3, 20708–20714. [Google Scholar] [CrossRef]
- Zhu, Y.-E.; Qi, X.; Chen, X.; Zhou, X.; Zhang, X.; Wei, J.; Hu, Y.; Zhou, Z. A P2-Na0.67Co0.5Mn0.5O2 cathode material with excellent rate capability and cycling stability for sodium ion batteries. J. Mater. Chem. A 2016, 4, 11103–11109. [Google Scholar] [CrossRef]
- Xu, X.; Ji, S.; Gao, R.; Liu, J. Facile synthesis of P2-type Na0.4Mn0.54Co0.46O2 as a high capacity cathode material for sodium-ion batteries. RSC Adv. 2015, 5, 51454–51460. [Google Scholar] [CrossRef]
- Le Nguyen, M.; Van Nguyen, H.; Ghosh, N.; Garg, A.; Van Tran, M.; Le, P. High-voltage performance of P2-NaxMn0.5Co0.5O2 layered cathode material. Int. J. Energy Res. 2021, 46, 5119–5133. [Google Scholar] [CrossRef]
- Konarov, A.; Kim, H.J.; Voronina, N.; Bakenov, Z.; Myung, S.-T. P2-Na2/3MnO2 by co incorporation: As a cathode material of high capacity and long cycle life for sodium-ion batteries. ACS Appl. Mater. Interfaces 2019, 11, 28928–28933. [Google Scholar] [CrossRef] [PubMed]
- Hwang, J.-Y.; Myung, S.-T.; Sun, Y.-K. Sodium-ion batteries: Present and future. Chem. Soc. Rev. 2017, 46, 3529–3614. [Google Scholar] [CrossRef] [PubMed] [Green Version]
- Chen, X.; Song, J.; Li, J.; Zhang, H.; Tang, H. A P2/P3 composite-layered cathode material with low-voltage decay for sodium-ion batteries. J. Appl. Electrochem. 2021, 51, 619–627. [Google Scholar] [CrossRef]
- Shi, Y.; Zhang, Z.; Jiang, P.; Gao, A.; Li, K.; Zhang, Q.; Sun, Y.; Lu, X.; Cao, D.; Lu, X. Unlocking the potential of P3 structure for practical Sodium-ion batteries by fabricating zero strain framework for Na+ intercalation. Energy Storage Mater. 2021, 37, 354–362. [Google Scholar] [CrossRef]
- Zhang, L.; Wang, J.; Li, J.; Schuck, G.; Winter, M.; Schumacher, G.; Li, J. Preferential occupation of Na in P3-type layered cathode material for sodium ion batteries. Nano Energy 2020, 70, 104535. [Google Scholar] [CrossRef]
- Zhou, Y.-N.; Wang, P.-F.; Zhang, X.-D.; Huang, L.-B.; Wang, W.-P.; Yin, Y.-X.; Xu, S.; Guo, Y.-G. Air-stable and high-voltage layered p3-type cathode for sodium-ion full battery. ACS Appl. Mater. Interfaces 2019, 11, 24184–24191. [Google Scholar] [CrossRef]
- Lei, Y.; Li, X.; Liu, L.; Ceder, G. Synthesis and stoichiometry of different layered sodium cobalt oxides. Chem. Mater. 2014, 26, 5288–5296. [Google Scholar] [CrossRef]
- Han, M.H.; Acebedo, B.; Gonzalo, E.; Fontecoba, P.S.; Clarke, S.; Saurel, D.; Rojo, T. Synthesis and electrochemistry study of P2- and O3-phase Na2/3Fe1/2Mn1/2O2. Electrochim. Acta 2015, 182, 1029–1036. [Google Scholar] [CrossRef]
- Sendova-Vassileva, M.; Stoyanova, R.; Carlier, D.; Yoncheva, M.; Zhecheva, E.; Delmas, C. Raman spectroscopy study on Na2/3Mn1-xFexO2 oxides. Adv. Sci. Technol. 2010, 74, 60–65. [Google Scholar]
- Qu, J.F.; Wang, W.; Chen, Y.; Li, G.; Li, X.G. Raman spectra study on nonstoichiometric compound NaxCoO2. Phys. Rev. B 2006, 73, 092518. [Google Scholar] [CrossRef]
- Wang, C.; Yan, J.; Li, T.; Lv, Z.; Hou, X.; Tang, Y.; Zhang, H.; Zheng, Q.; Li, X. A coral-like FeP@NC anode with increasing cycle capacity for sodium-ion and lithium-ion batteries induced by particle refinement. Angew. Chem. Int. Ed. 2021, 60, 25013–25019. [Google Scholar] [CrossRef]
- Liu, Q.; Hu, Z.; Zou, C.; Jin, H.; Wang, S.; Li, L. Structural engineering of electrode materials to boost high-performance sodium-ion batteries. Cell Rep. Phys. Sci. 2021, 2, 100551. [Google Scholar] [CrossRef]
- Wang, P.-F.; Yao, H.-R.; Liu, X.-Y.; Zhang, J.-N.; Gu, L.; Yu, X.-Q.; Yin, Y.-X.; Guo, Y.-G. Ti-substituted NaNi0.5Mn0.5-xTixO2 cathodes with reversible O3−P3 phase transition for high-performance sodium-ion batteries. Adv. Mater. 2017, 29, 1700210. [Google Scholar] [CrossRef]
- Yao, H.-R.; Wang, P.-F.; Wang, Y.; Yu, X.; Yin, Y.-X.; Guo, Y.-G. Excellent comprehensive performance of Na-based layered oxide benefiting from the synergetic contributions of multimetal ions. Adv. Energy Mater. 2017, 7, 1700189. [Google Scholar] [CrossRef]
- Wei, T.-T.; Zhang, N.; Zhao, Y.-S.; Zhu, Y.-R.; Yi, T.-F. Sodium-deficient O3-Na0.75Fe0.5-xCuxMn0.5O2 as high-performance cathode materials of sodium-ion batteries. Compos. Part B Eng. 2022, 238, 109912. [Google Scholar] [CrossRef]
- Wei, T.-T.; Liu, X.; Yang, S.-J.; Wang, P.-F.; Yi, T.-F. Regulating the electrochemical activity of Fe-Mn-Cu-based layer oxides as cathode materials for high-performance Na-ion battery. J. Energy Chem. 2023, 80, 603–613. [Google Scholar] [CrossRef]
- Bredar, A.R.C.; Chown, A.L.; Burton, A.R.; Farnum, B.H. Electrochemical impedance spectroscopy of metal oxide electrodes for energy applications. ACS Appl. Energy Mater. 2020, 3, 66–98. [Google Scholar] [CrossRef] [Green Version]
- Costard, J.; Joos, J.; Schmidt, A.; Ivers-Tiffée, E. Charge transfer parameters of NixMnyCo1−x−y cathodes evaluated by a transmission line modeling approach. Energy Technol. 2021, 9, 2000866. [Google Scholar] [CrossRef]
- Ma, X.; Chen, H.; Ceder, G. Electrochemical properties of monoclinic NaMnO2. J. Electrochem. Soc. 2011, 158, A1307. [Google Scholar] [CrossRef]
- Zhou, D.; Huang, W.; Lv, X.; Zhao, F. A novel P2/O3 biphase Na0.67Fe0.425Mn0.425Mg0.15O2 as cathode for high-performance sodium-ion batteries. J. Power Sources 2019, 421, 147–155. [Google Scholar] [CrossRef]
- Yan, Z.; Tang, L.; Huang, Y.; Hua, W.; Wang, Y.; Liu, R.; Gu, Q.; Indris, S.; Chou, S.-L.; Huang, Y.; et al. A hydrostable cathode material based on the layered P2@P3 composite that shows redox behavior for copper in high-rate and long-cycling sodium-ion batteries. Angew. Chem. 2019, 131, 1426–1430. [Google Scholar] [CrossRef]
- Liang, X.; Yu, T.-Y.; Ryu, H.-H.; Sun, Y.-K. Hierarchical O3/P2 heterostructured cathode materials for advanced sodium-ion batteries. Energy Storage Mater. 2022, 47, 515–525. [Google Scholar] [CrossRef]
- Peng, B.; Chen, Y.; Wang, F.; Sun, Z.; Zhao, L.; Zhang, X.; Wang, W.; Zhang, G. Unusual Site-Selective Doping in Layered Cathode Strengthens Electrostatic Cohesion of Alkali-Metal Layer for Practicable Sodium-Ion Full Cell. Adv. Mater. 2022, 34, 2103210. [Google Scholar] [CrossRef] [PubMed]
- Wang, H.; Xiao, Y.; Sun, C.; Lai, C.; Ai, X. A type of sodium-ion full-cell with a layered NaNi0.5Ti0.5O2 cathode and a pre-sodiated hard carbon anode. RSC Adv. 2015, 5, 106519–106522. [Google Scholar] [CrossRef]
- Jiang, M.; Qian, G.; Liao, X.-Z.; Ren, Z.; Dong, Q.; Meng, D.; Cui, G.; Yuan, S.; Lee, S.-J.; Qin, T.; et al. Revisiting the capacity-fading mechanism of P2-type sodium layered oxide cathode materials during high-voltage cycling. J. Energy Chem. 2022, 69, 16–25. [Google Scholar] [CrossRef]
- Li, Z.-Y.; Zhang, J.; Gao, R.; Zhang, H.; Hu, Z.; Liu, X. Unveiling the role of co in improving the high-rate capability and cycling performance of layered Na0.7Mn0.7Ni0.3–xCoxO2 cathode materials for sodium-ion batteries. ACS Appl. Mater. Interfaces 2016, 8, 15439–15448. [Google Scholar] [CrossRef]
- Fu, C.C.; Wang, J.; Li, Y.; Liu, G.; Deng, T. Explore the effect of Co doping on P2-Na0.67MnO2 prepared by hydrothermal method as cathode materials for sodium ion batteries. J. Alloys. Compd. 2022, 918, 165569. [Google Scholar] [CrossRef]
- Hou, P.; Li, F.; Wang, Y.; Yin, J.; Xu, X. Mitigating the P2–O2 phase transition of high-voltage P2-Na2/3[Ni1/3Mn2/3]O2 cathodes by cobalt gradient substitution for high-rate sodium-ion batteries. J. Mater. Chem. A 2019, 7, 4705–4713. [Google Scholar] [CrossRef]
- Rahman, M.M.; Mao, J.; Kan, W.H.; Sun, C.-J.; Li, L.; Zhang, Y.; Avdeev, M.; Du, X.-W.; Lin, F. An ordered P2/P3 composite layered oxide cathode with long cycle life in sodium-ion batteries. ACS Mater. Lett. 2019, 1, 573–581. [Google Scholar] [CrossRef]
- Zhou, Y.-N.; Wang, P.-F.; Niu, Y.-B.; Li, Q.; Yu, X.; Yin, Y.-X.; Xu, S.; Guo, Y.-G. A P2/P3 composite layered cathode for high-performance Na-ion full batteries. Nano Energy 2019, 55, 143–150. [Google Scholar] [CrossRef]
- Zhang, Y.; Kim, S.; Feng, G.; Wang, Y.; Liu, L.; Ceder, G.; Li, X. The interaction between Cu and Fe in P2-type NaxTMO2 cathodes for advanced battery performance. J. Electrochem. Soc. 2018, 165, A1184–A1192. [Google Scholar] [CrossRef] [Green Version]
- Mortemard de Boisse, B.; Carlier, D.; Guignard, M.; Bourgeois, L.; Delmas, C. P2-NaxMn1/2Fe1/2O2 phase used as positive electrode in na batteries: Structural changes induced by the electrochemical (de)intercalation process. Inorg. Chem. 2014, 53, 11197–11205. [Google Scholar] [CrossRef]
- Singh, G.; Tapia-Ruiz, N.; Lopez del Amo, J.M.; Maitra, U.; Somerville, J.W.; Armstrong, A.R.; Martinez de Ilarduya, J.; Rojo, T.; Bruce, P.G. High voltage Mg-doped Na0.67Ni0.3–xMgxMn0.7O2 (x = 0.05, 0.1) Na-ion cathodes with enhanced stability and rate capability. Chem. Mater. 2016, 28, 5087–5094. [Google Scholar] [CrossRef] [Green Version]
- Or, T.; Kaliyappan, K.; Bai, Z.; Chen, Z. High voltage stability and characterization of P2-Na0.66Mn1-yMgyO2 cathode for sodium-on batteries. ChemElectroChem 2020, 7, 3284–3290. [Google Scholar] [CrossRef]
- Risthaus, T.; Chen, L.; Wang, J.; Li, J.; Zhou, D.; Zhang, L.; Ning, D.; Cao, X.; Zhang, X.; Schumacher, G.; et al. P3 Na0.9Ni0.5Mn0.5O2 cathode material for sodium ion batteries. Chem. Mater. 2019, 31, 5376–5383. [Google Scholar] [CrossRef]


| Sample ID | Notation | Space Group | Lattice Parameters | Weight Percentage (Rietveld) | ||
|---|---|---|---|---|---|---|
| a (Å) | c (Å) | V (Å3) | ||||
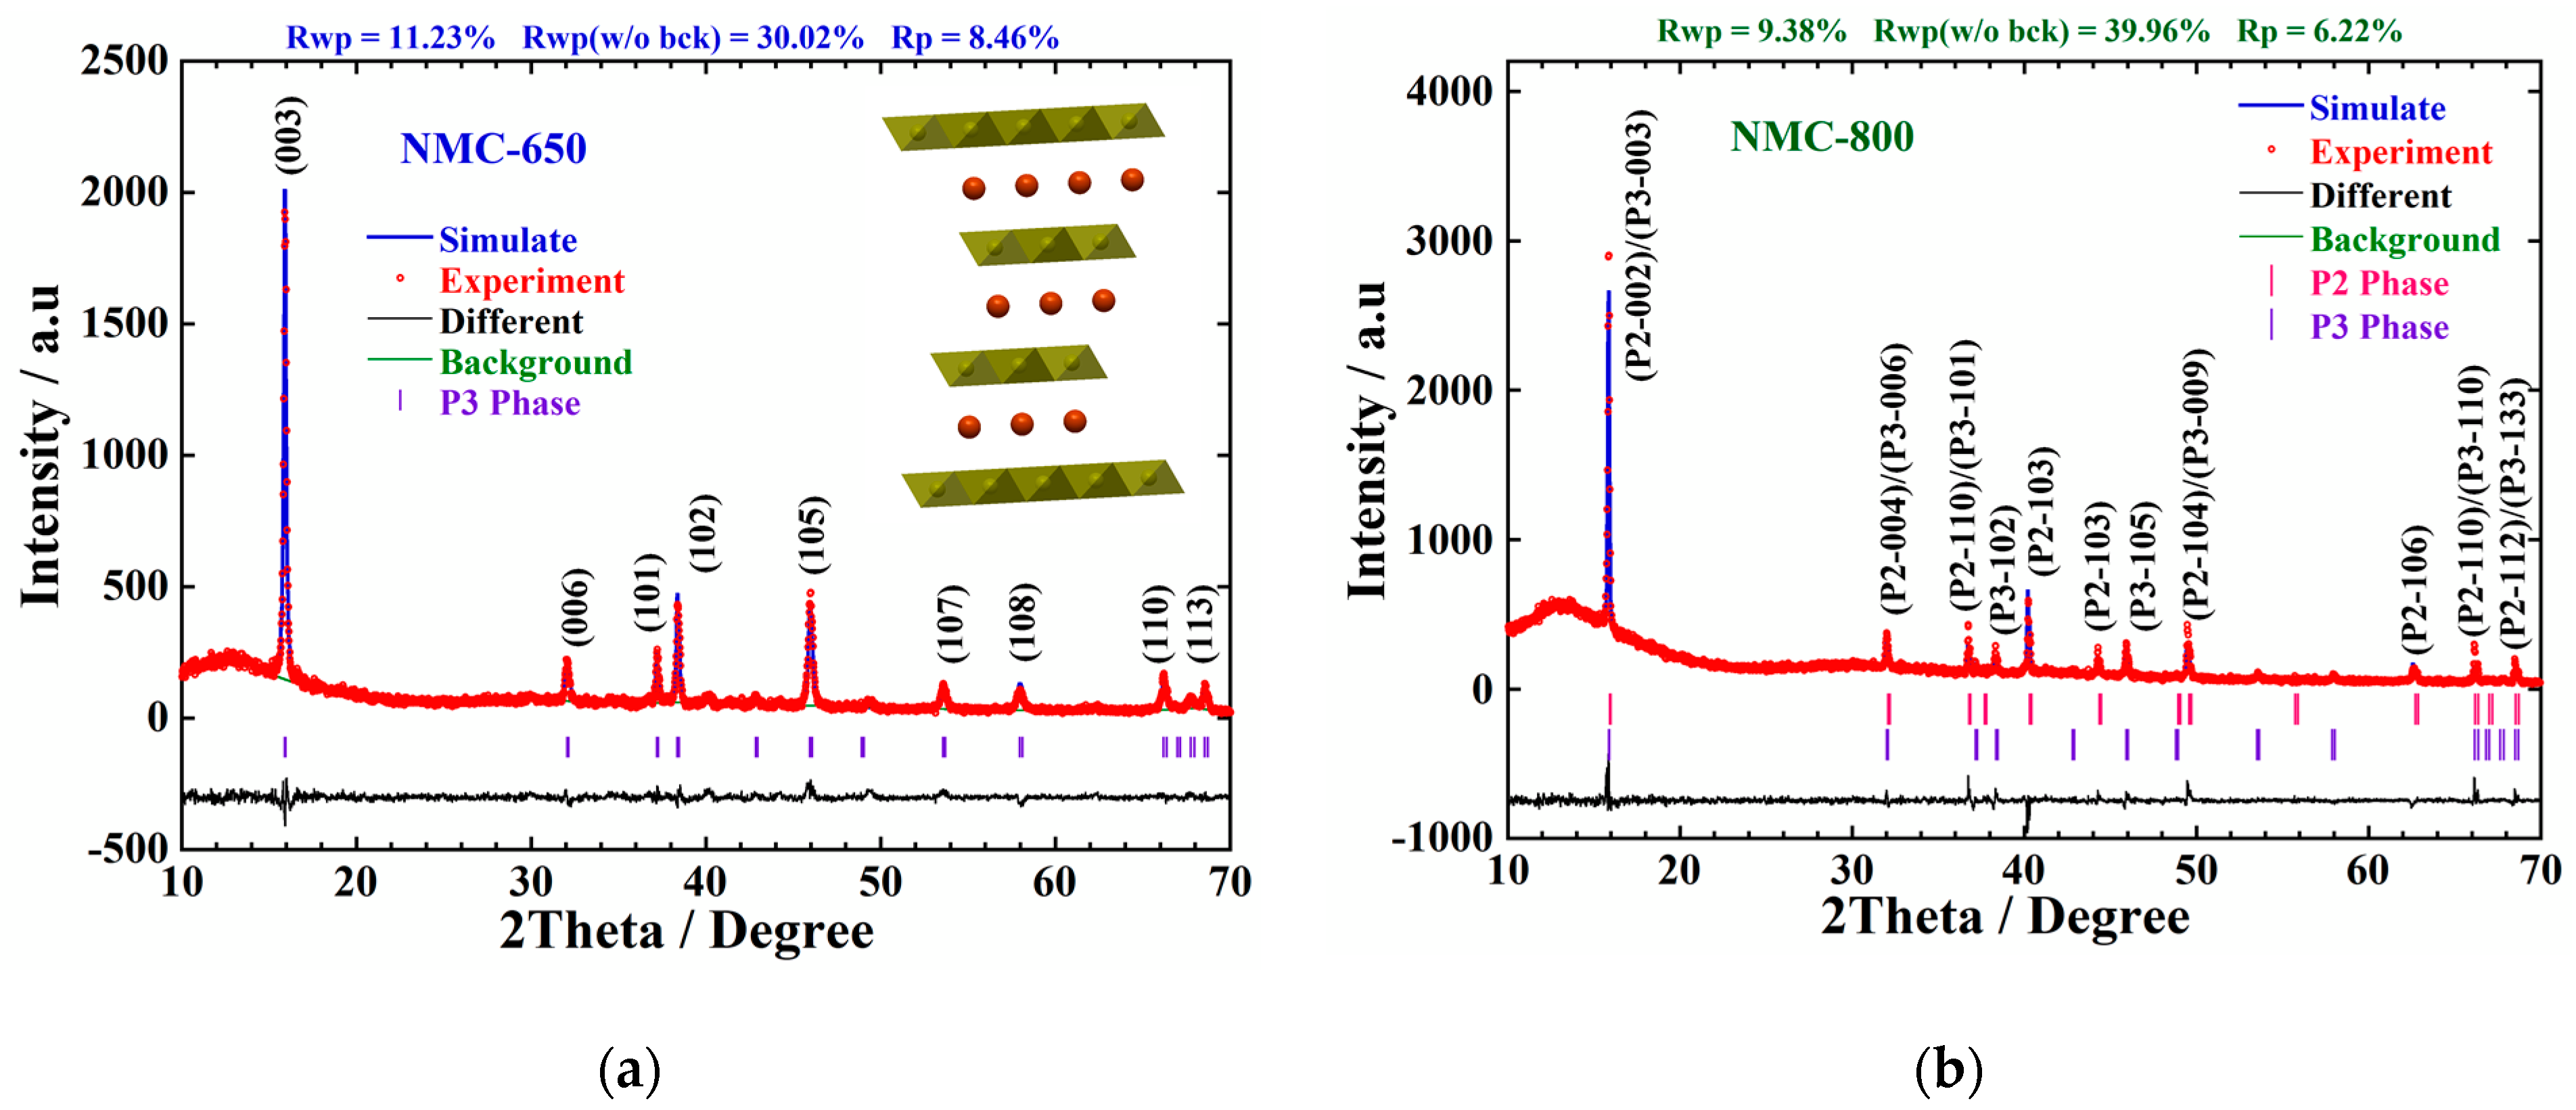
| NMC-650 | P3 | Cm | 2.831 | 16.530 | 114.730 | 100.00 |
| NMC-800 | P2 | P63/mmc | 2.823 | 11.192 | 77.258 | 58.60 |
| P3 | Cm | 2.827 | 16.735 | 115.799 | 41.40 | |
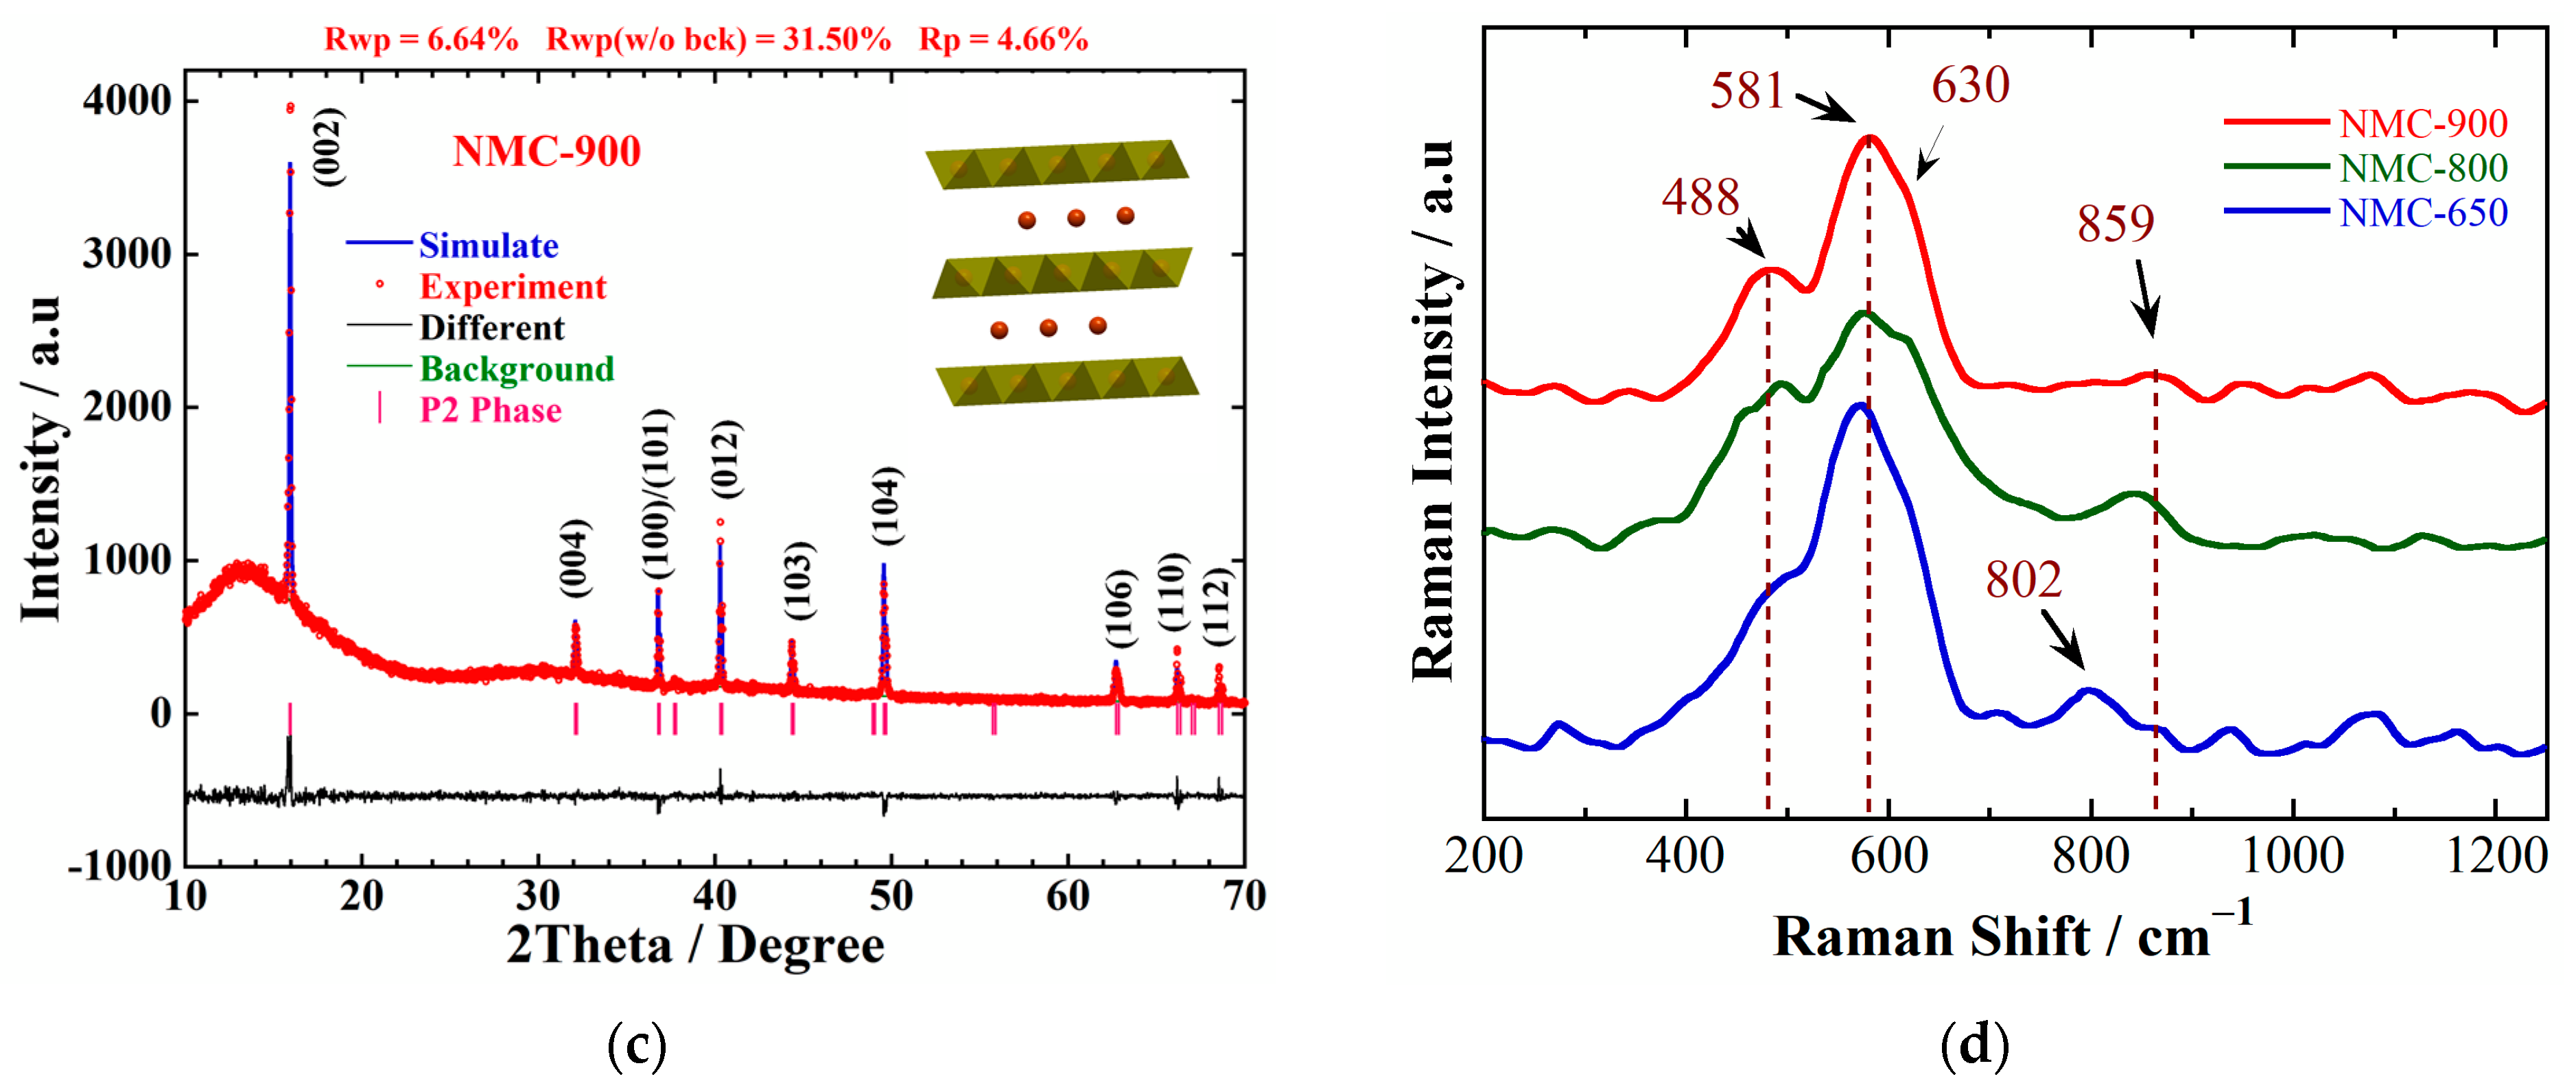
| NMC-900 | P2 | P63/mmc | 2.825 | 11.178 | 77.279 | 100.00 |
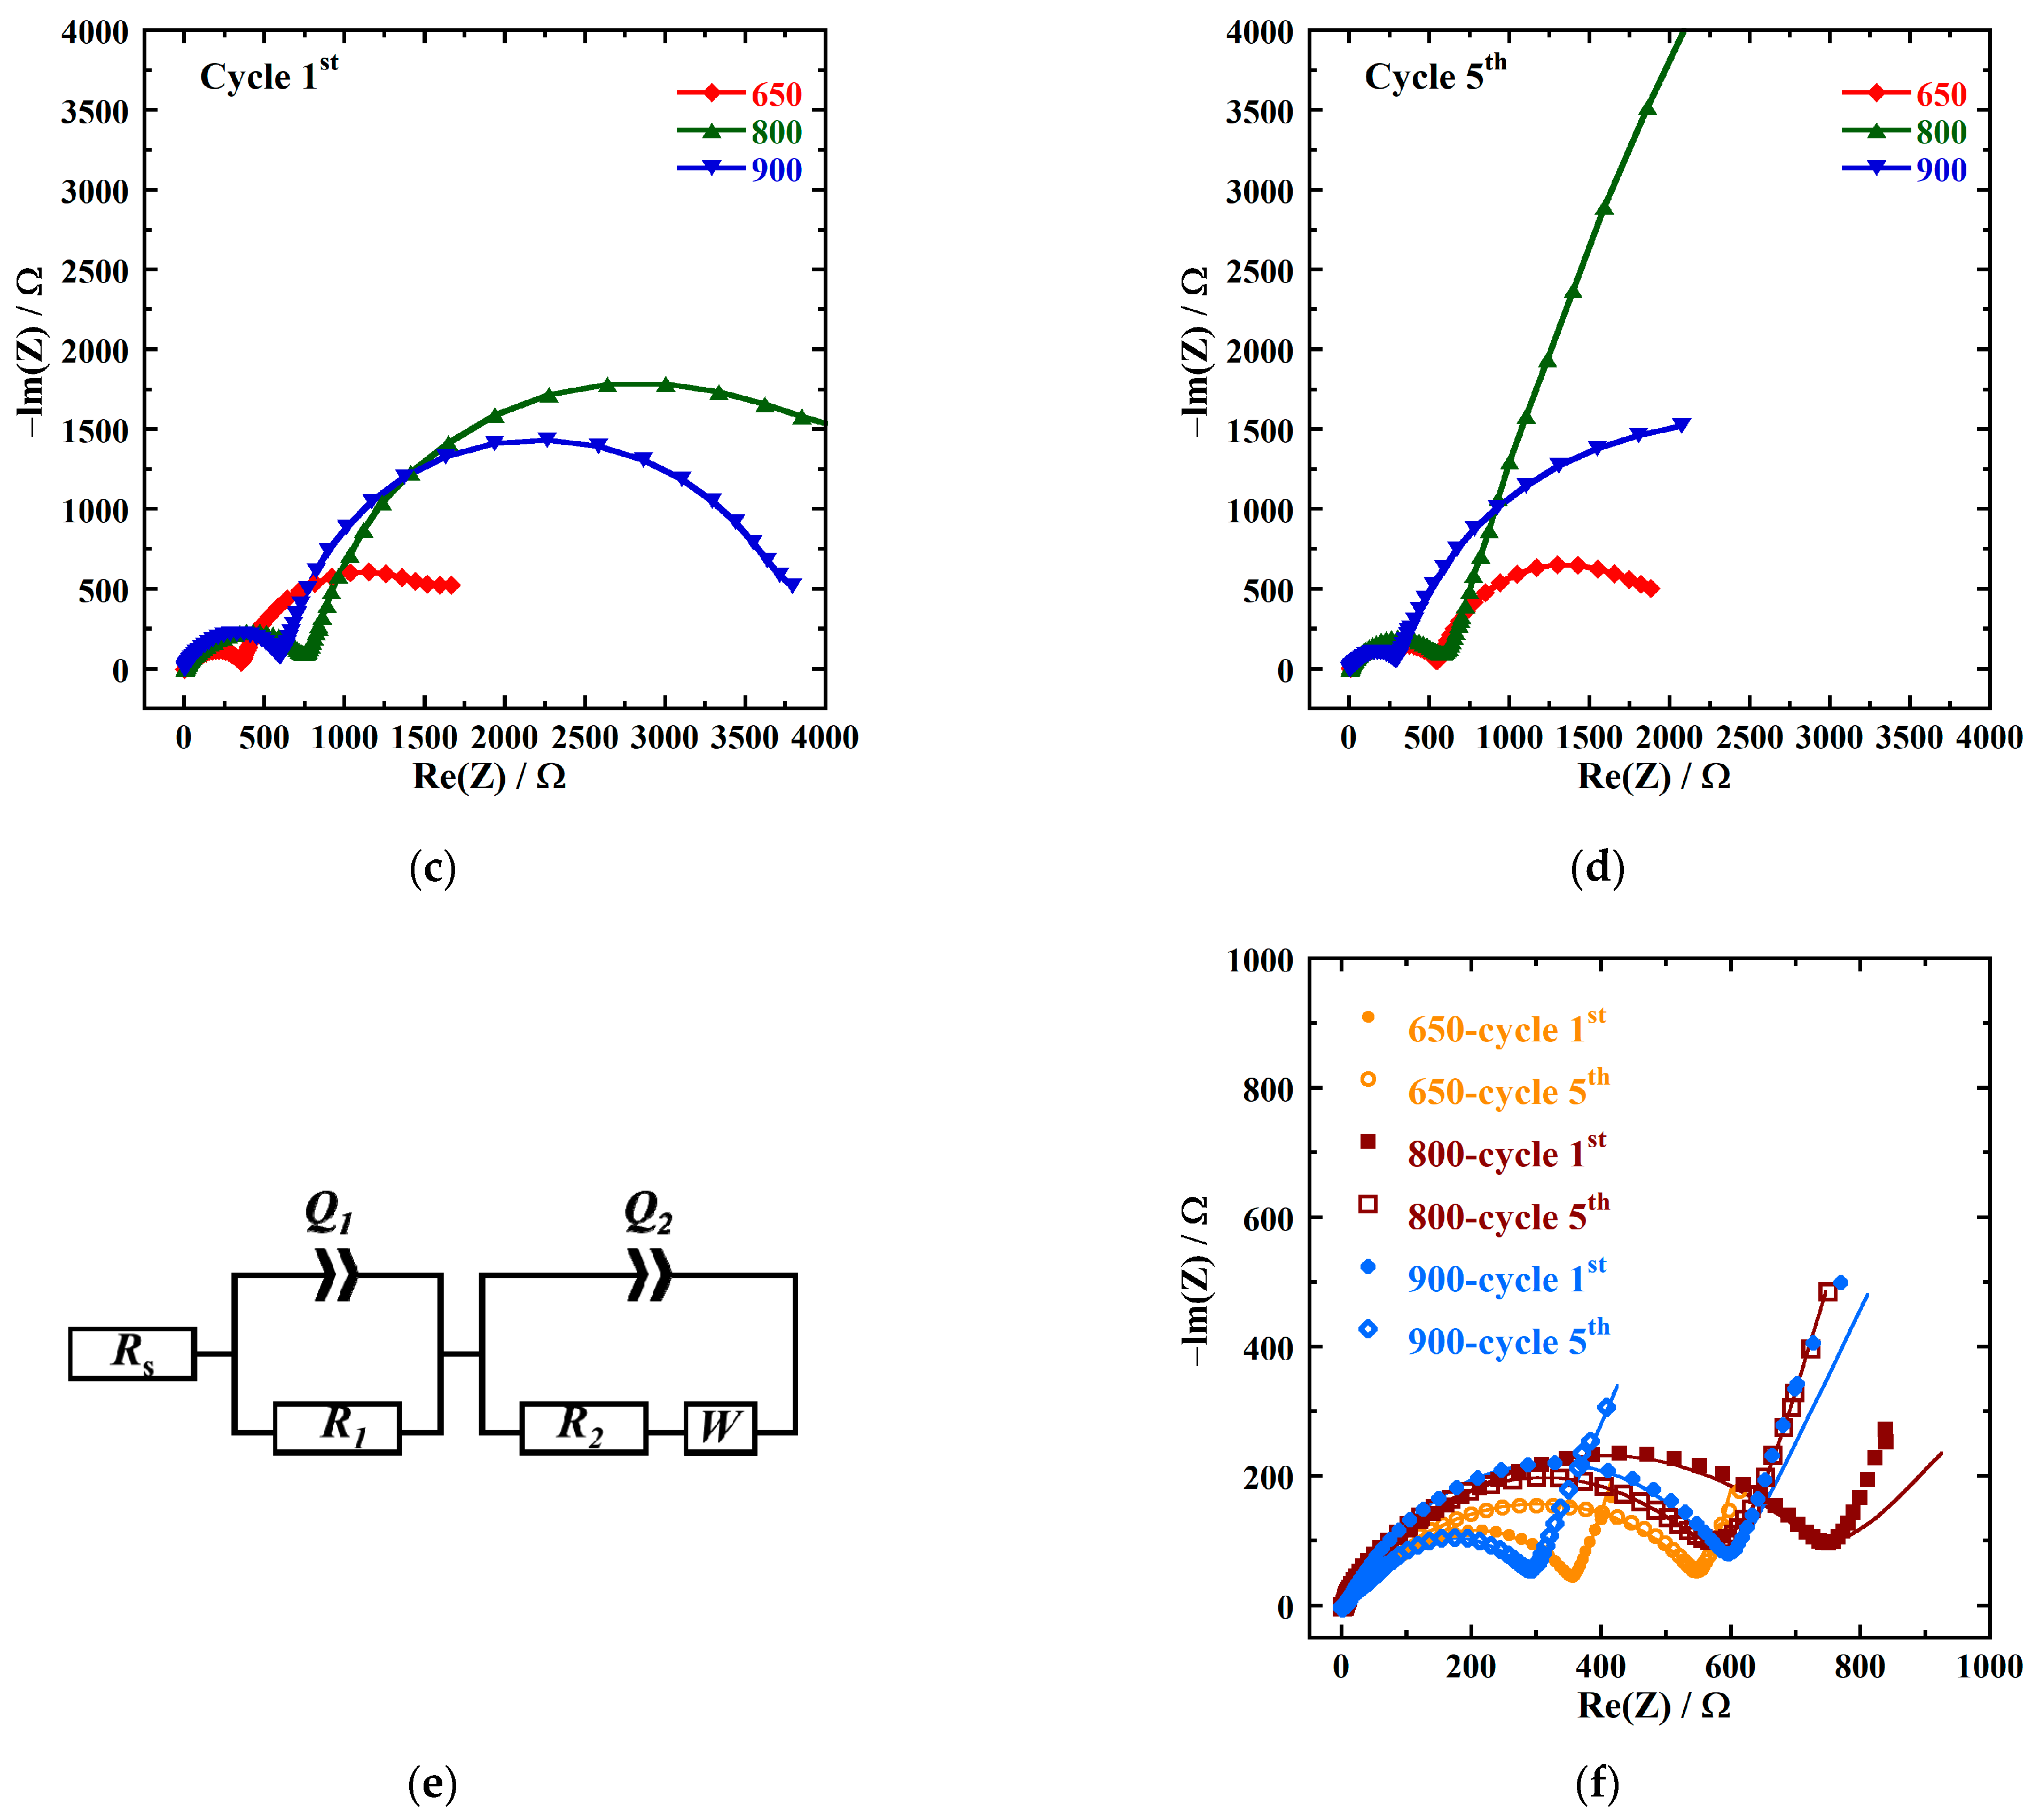
| Sample ID | Rs | R1 | R2 | Total Charge Transfer Resistance | |
|---|---|---|---|---|---|
| NMC-650 | 1st | 7.995 | 53.07 | 297.1 | 350.2 |
| 5th | 5.605 | 69.17 | 490.8 | 560.0 | |
| NMC-800 | 1st | 5.053 | 65.02 | 657.2 | 722.2 |
| 5th | 4.809 | 23.75 | 543.6 | 567.4 | |
| NMC-900 | 1st | 5.364 | 82.32 | 498.6 | 580.2 |
| 5th | 6.526 | 50.11 | 226.3 | 276.4 | |
Disclaimer/Publisher’s Note: The statements, opinions and data contained in all publications are solely those of the individual author(s) and contributor(s) and not of MDPI and/or the editor(s). MDPI and/or the editor(s) disclaim responsibility for any injury to people or property resulting from any ideas, methods, instructions or products referred to in the content. |
© 2023 by the authors. Licensee MDPI, Basel, Switzerland. This article is an open access article distributed under the terms and conditions of the Creative Commons Attribution (CC BY) license (https://creativecommons.org/licenses/by/4.0/).
Share and Cite
Nguyen, L.M.; Nguyen, V.H.; Nguyen, D.M.N.; Le, M.K.; Tran, V.M.; Le, M.L.P. Evaluating Electrochemical Properties of Layered NaxMn0.5Co0.5O2 Obtained at Different Calcined Temperatures. ChemEngineering 2023, 7, 33. https://doi.org/10.3390/chemengineering7020033
Nguyen LM, Nguyen VH, Nguyen DMN, Le MK, Tran VM, Le MLP. Evaluating Electrochemical Properties of Layered NaxMn0.5Co0.5O2 Obtained at Different Calcined Temperatures. ChemEngineering. 2023; 7(2):33. https://doi.org/10.3390/chemengineering7020033
Chicago/Turabian StyleNguyen, Le Minh, Van Hoang Nguyen, Doan My Ngoc Nguyen, Minh Kha Le, Van Man Tran, and My Loan Phung Le. 2023. "Evaluating Electrochemical Properties of Layered NaxMn0.5Co0.5O2 Obtained at Different Calcined Temperatures" ChemEngineering 7, no. 2: 33. https://doi.org/10.3390/chemengineering7020033