Article

Experimental Evaluation of a Coated Foam Catalytic Reactor for the Direct CO2-to-Methanol Synthesis Process

by
Kyatsinge Cedric Musavuli
1,
Nicolaas Engelbrecht
1,
Raymond Cecil Everson
2,
Phillimon Modisha
1,
Gunther Kolb
3,
Ralf Zapf
3,
Christian Hofmann
3 and
Dmitri Bessarabov
1,*
1
HySA Infrastructure Centre of Competence, Faculty of Engineering, North-West University, Private Bag X6001, Potchefstroom 2531, South Africa
2
Centre of Excellence in Carbon Based Fuels, School of Chemical and Minerals Engineering, Faculty of Engineering, North-West University, Private Bag X6001, Potchefstroom 2531, South Africa
3
Fraunhofer Institute for Microengineering and Microsystems, Carl-Zeiss-Str. 18-20, 55129 Mainz, Germany
*
Author to whom correspondence should be addressed.
ChemEngineering 2023, 7(2), 16; https://doi.org/10.3390/chemengineering7020016
Submission received: 2 December 2022 / Revised: 20 January 2023 / Accepted: 15 February 2023 / Published: 21 February 2023
(This article belongs to the Special Issue Recent Advances in Novel Chemical Reactor)

Abstract

:
The era of considering carbon dioxide (CO2) as a waste stream has passed. New methods of utilising CO2 as a carbon feedstock are currently the focus of extensive research efforts. A fixed-bed reactor containing a commercial Cu/ZnO/Al2O3 catalyst washcoated on a Cu foam was used for the synthesis of methanol through direct CO2 hydrogenation. Catalytic activity tests in this reactor were conducted at reaction pressures of 30 and 50 bar, temperatures in the range 190–250 °C, and weight hourly space velocities (WHSV) in the range 1.125–2.925 NL gcat−1 h−1. The best reactor performance was recorded at 50 bar pressure: CO2 conversion and methanol selectivity of 27.46% and 82.97%, respectively, were obtained at 240 °C and 1.125 NL gcat−1 h−1. Increasing the WHSV to 2.925 NL gcat−1 h−1 resulted in a twofold increase in methanol weight time yield (WTY) to 0.18 gMeOH gcat−1 h−1 and a decrease in methanol selectivity to 70.55%. The results presented in this investigation provide insight into the performance of a bench-scale reactor in which mass transfer limitations are non-negligible and demonstrate that metal foams are promising catalyst support structures for CO2 hydrogenation towards methanol production.

1. Introduction

The increase in anthropogenic carbon dioxide (CO2) emissions in the last century is a major global concern for environmental and social well-being. Global warming and other climate perturbations urge the industrial sector to consider more sustainable energy alternatives for their fossil fuel-reliant processes. Since the turn of the 21st century, the share of renewable energy sources such as solar and wind power grew exponentially in the sector of electricity generation. This rapid increase in fluctuating power supplied to power grids involved numerous challenges associated with the stability and balance of supply and demand [1].
Chemical energy conversion presents advantages over other energy storage methods, such as hydropower, compressed air energy storage, flywheels and batteries, due to both its long-term storage capability and its potential to trade energy on a global scale [2,3]. In this context, power-to-gas (PtG) and power-to-X (PtX) technologies, which represent the conversion of renewable energy via electrolysis into hydrogen (H2) and other chemicals such as methane (CH4) and methanol (MeOH), are opportune. PtG and PtX represent promising solutions for both the mitigation of global CO2 emissions and the storage of energy from variable renewable sources during peaks in renewable energy supply. Subsequently, the produced chemicals may be used when the demand for power exceeds the supply capacity [4].
Arguably, one of the sectors hardest to abate from fossil fuel use as primary energy source is the petrochemical industry. MeOH production by means of PtX is considered a topic worthy of investigation, considering the available industrial sources of concentrated CO2 as feedstock for MeOH production, and MeOH’s current global production and demand (MeOH is the second most produced chemical from syngas, at an estimated annual production rate of 110 million tonnes [5]). MeOH has numerous other conversion pathways towards dimethyl ether, formaldehyde and other value-added fuels and chemicals [6].
Industrially, MeOH is produced from carbon monoxide (CO)-based syngas at reaction pressures of 50–100 bar and temperatures of 240–260 °C [7]. The alternative direct CO2 hydrogenation to MeOH process is an exothermic, thermodynamically limited process; it has been investigated at relatively high temperatures (200–300 °C) and pressures (5–80 bar) due to the high bond dissociation energy of the stable CO2 molecule (1072 kJ mol−1) [2,8]. The most popular catalysts for MeOH synthesis are the bi-metallic Cu/ZnO catalysts which favour conversion pathways of the hydrogenation of CO2 to MeOH rather than CH4 [8]. A proposed dual-site mechanism supposes that Cu sites are responsible for the adsorption and splitting of H2 into atoms which then transfer to the ZnO sites to hydrogenate CO2, which is adsorbed in the form of bicarbonate [8]. Cu/ZnO catalysts are usually promoted by a metal oxide (e.g., Al2O3 or ZrO2). Individually, both Cu and ZnO are only slightly active in promoting MeOH production. The synergetic effect obtained from the bi-metallic catalyst, however, is attributed to the stabilisation and dispersion of Cu particles in the presence of ZnO [8]. Kasatkin et al. [9] considered ZnO as a spacer and structure-directing support between Cu particles, affecting the morphology and improving the dispersion of the Cu particles. As a promoter, Al2O3 increases the stability of the catalytic pair [8].
In addition to the CO2 hydrogenation (Equation (1)), the endothermic reverse water gas shift (RWGS) reaction (Equation (2)) is inevitable in a H2/CO2 system if the catalyst selection and process operation are not ideal. The RWGS reaction decreases the selectivity towards MeOH production via undesired CO formation.
CO 2 + 3   H 2 CH 3 OH + H 2 O   Δ H 298 K = 49.3   kJ   mol 1
CO 2 + H 2 CO + H 2 O   Δ H 298 K = 41.2   kJ   mol 1
Furthermore, several authors have reported the undesirable effects of CO [10,11] and steam (H2O) [2,7,12] on the catalytic activity of Cu/ZnO/Al2O3 for MeOH synthesis from direct CO2 hydrogenation. Therefore, the operating conditions and the design of the MeOH synthesis reactor should be carefully chosen so as to maintain the highest possible MeOH selectivity in the process (i.e., to limit the RWGS reaction).
Several studies have focused on the optimisation of process performance by investigating the intrinsic properties of the catalyst [13,14,15]. For example, Dasireddy and Likozar [14] compared different synthesis methods, including co-precipitation and ultrasound-assisted catalyst preparation. Qi et al. [15] synthesised a Cu/ZnO-based bi-metallic metal organic framework, which resulted in improved CO2 conversion, MeOH selectivity and space–time yield when compared to the performance of a conventional Cu/ZnO/Al2O3 prepared from Cu and Zn nitrate precursors. Other works have focused on the modification of the Cu/ZnO binary catalyst by the addition of promoters such as Ag, Mg, Cr, or different metal oxide supports such as ZrO2 or SiO2 [16,17,18,19,20]. Additionally, these processes were investigated in microreactors in which heat and mass transfer limitations are usually negligible.
To the best of the authors’ knowledge, the performance of highly-structured catalyst supports coated with Cu/ZnO/Al2O3, and used for direct CO2-to-MeOH processes, has not been reported yet. A promising option pertaining to the catalyst support is the use of an open-cell metal foam. The latter is a highly porous catalyst support structure that enhances heat and mass transport phenomena due to its high thermal conductivity (commonly Cu or Al sintered metals) and increased mixing potential (high tortuosity) [21,22,23]. The high thermal conductivity of the metal foam allows for heat transfer to be less dependent on convective effects; instead, it is enhanced by conduction within the metallic matrix, thus limiting hot spots within the reactor, which may be associated with undesired side reactions or catalyst decay [21,23,24,25]. Radial mass transfer enhances the uniformity of the gas flow pattern, resulting in better accessibility to the completely open-cell foam structure (avoidance of channelled flows) [24,26]. These structures are characterised by a high surface area to volume ratio (>1000 m2 m−3) and by better effectiveness factors than conventional catalyst pellets [24,27,28]. In addition, open-cell metal foams are known to be resistant to thermal and mechanical stresses [28].
Open-cell foams have been successfully used in processes including NOx reduction through NH3 [24], NH3 decomposition [29], CO oxidation [26,30], CH4 steam reforming [23], MeOH steam reforming [31,32,33] and MeOH synthesis from syngas [21].
This paper aims to expand the knowledge on the typical operations of foam-based intensified reactors to MeOH synthesis from CO2 waste streams and to demonstrate the performance of a 1.08 L bench-scale reactor by providing suitable steady-state reactor operating conditions for satisfactory CO2 conversions, MeOH yields and selectivities.
A Cu foam (40 PPI) was used as catalyst support structure for a commercial Cu/ZnO/Al2O3 catalyst in a reactor with a designed production capacity of 10 gMeOH h−1. During the evaluation of the reactor, the following conditions were used: reaction pressures 30–50 bar, reaction temperatures 190–250 °C and space velocities 1.125–2.925 NL gcat−1 h−1. Overall, this investigation supports new information on the process and operation of a catalytic reactor, employing a novel and process-intensifying catalyst support structure for the synthesis of methanol directly from captured CO2 and renewable H2.

2. Materials and Methods

The following sections provide detailed information on the set-up used during the experimentation (Section 2.1); the design of the two-module fixed-bed reactor with structured catalyst support (Section 2.2), the characterisation methods used to determine key properties of the catalyst support structure (Section 2.3) and the process parameters that were investigated in this study are summarised (Section 2.4).

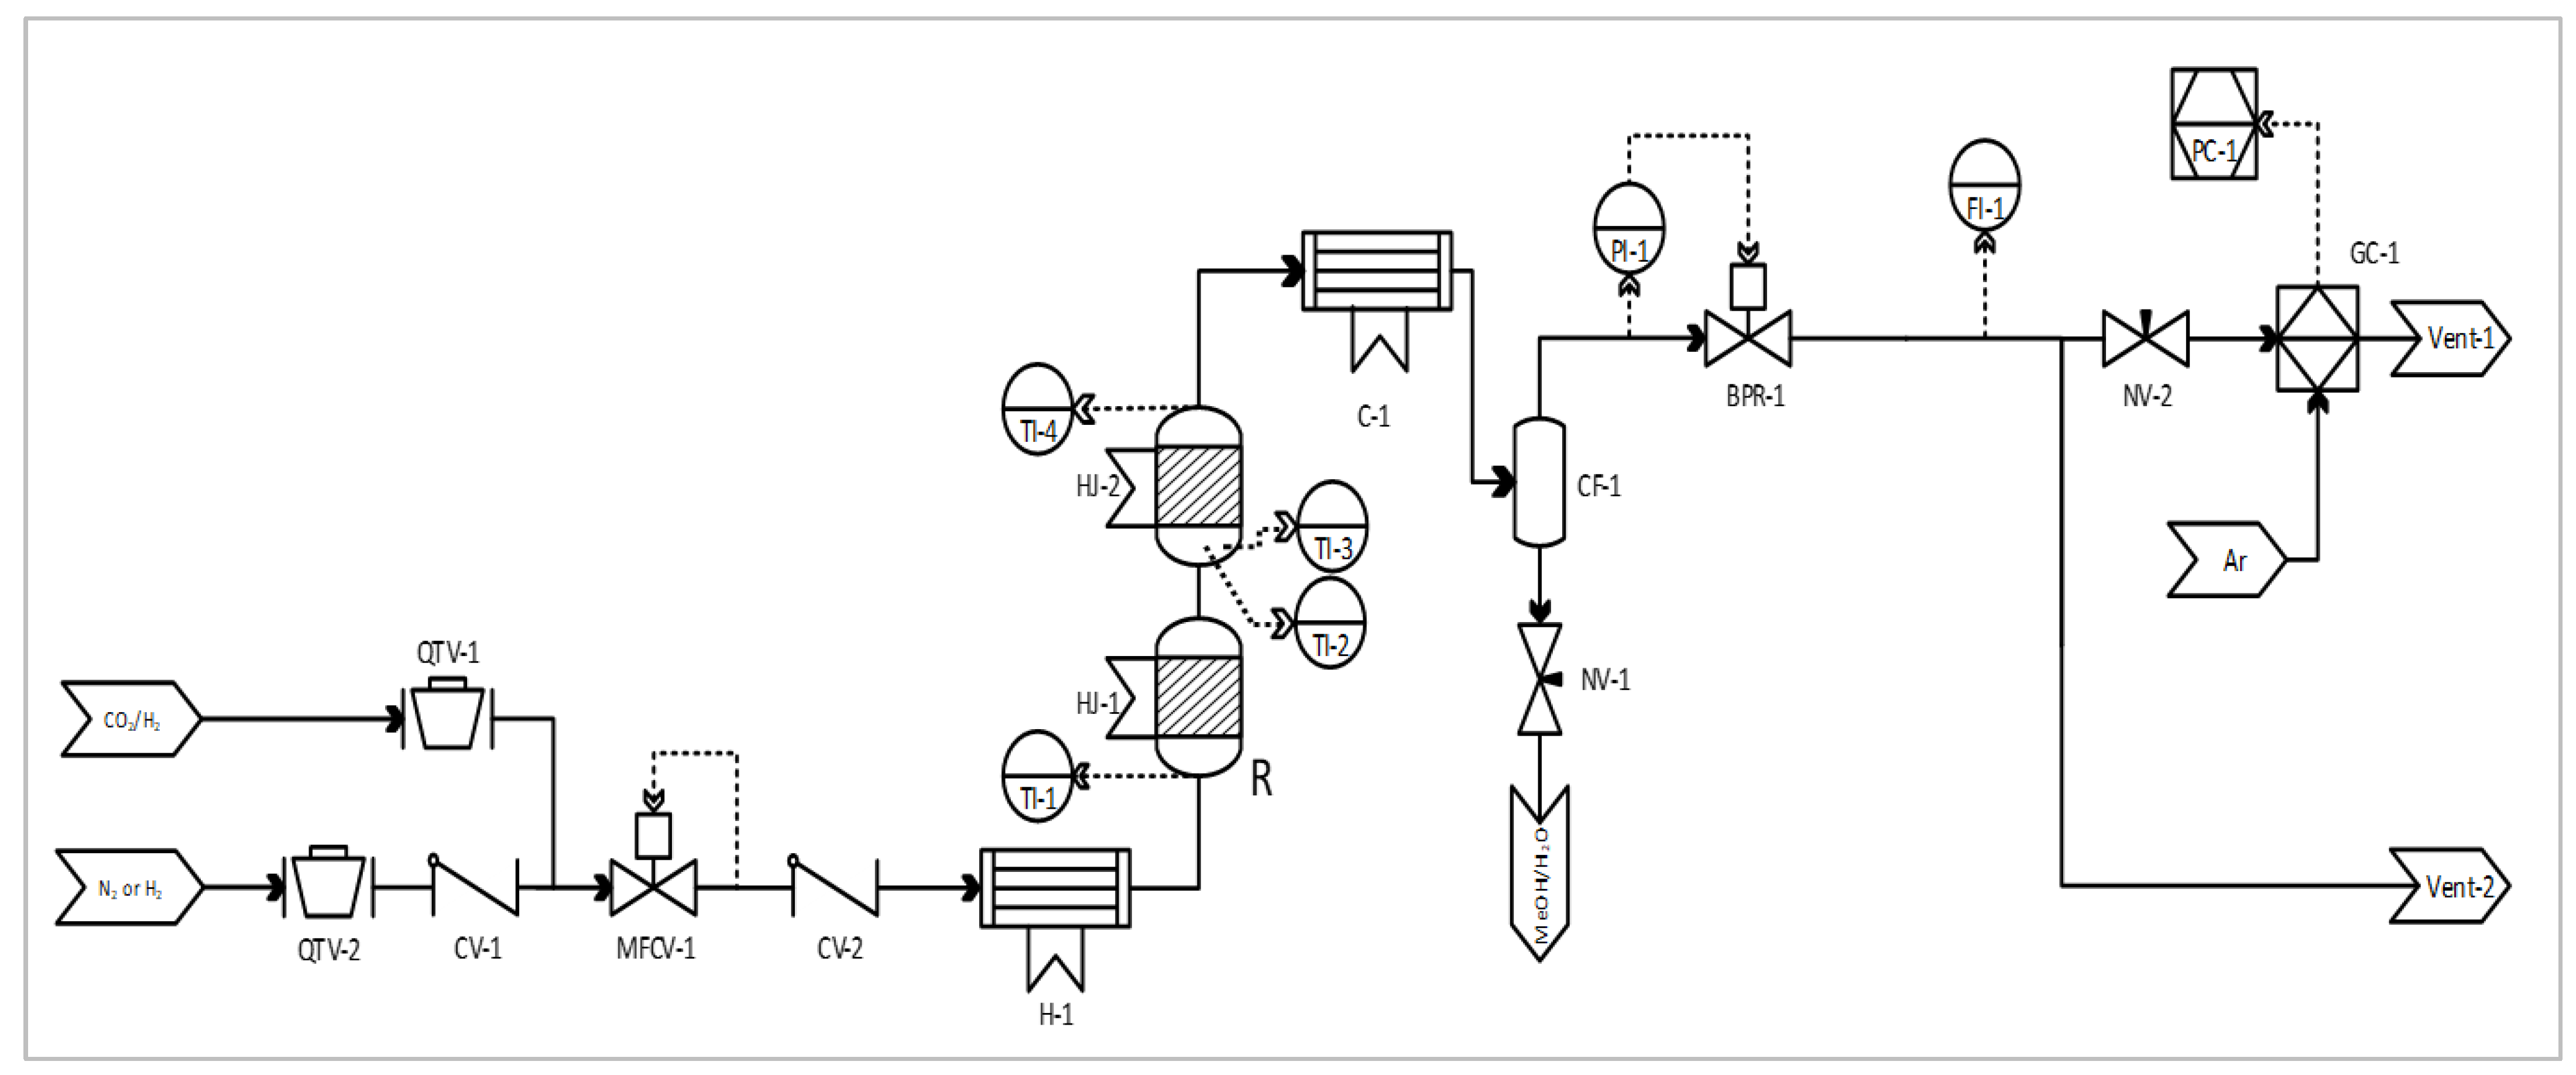
2.1. Process Flow Sheet

The piping and instrument diagram (PID) in Figure 1 illustrates the set-up used during the MeOH synthesis experiments. Two gas feed streams were connected to the reactor inlet. The first supplied, at low pressure, N2 and H2, used as purging and reducing fluids, respectively. The second feed stream supplied the reactant mixture: ca. 25 vol.% CO2 in a balance of H2 (Afrox, Johannesburg, South Africa). The supply pressure of the reactant mixture was controlled with a KP-series pressure regulator (Swagelok, Johannesburg, South Africa). Both gas streams’ flow rates were controlled with respective SLA5800-series thermal mass flow controllers (Brooks Instruments, Hatfield, PA, USA). Directly upstream of the reactor, a gas pre-heater was fitted with a heating cartridge to pre-heat the incoming cold gas stream prior its injection into the modular MeOH synthesis reactor. It was envisioned that a cold gas fed to the reactor’s first module would induce sluggish MeOH reaction kinetics, hence the use of a feed pre-heater (set at the same isothermal temperature condition as the reactor). Downstream of the reactor and after the cold trap, the reactor pressure was controlled using a KPB-series back-pressure regulator (Swagelok, Johannesburg, South Africa).
Sensible and latent heat from the reactor product gas was removed using natural convection over a ¼ inch stainless steel (SS316) pipe coil of 4 m length. Furthermore, the water vapour and MeOH in the product were condensed in a 190 mm shell-and-tube heat exchanger containing a glycol–water coolant (shell-side), the temperature of which was regulated to 10 °C, using a chiller (Julabo, Seelbach, Germany). A stainless steel (SS316) coalescing filter (Classic Filters, Rochester, UK) was used to drain the condensate after each experiment.
In this study, the once-through conversion of CO2 and H2 was considered (no gas recycling). The flow rate of the product gas was measured with a variable area flow meter (Cole-Parmer, Vernon Hills, IL, USA). The absolute pressure was measured immediately downstream of the variable area flow meter using a high-accuracy digital pressure meter (Wika, Klingenberg, Germany). Both these measurements were used to normalise the product gas flow rate. The product gas composition was quantified with an online SRI 8610C gas chromatograph (SRI Instruments, Torrance, CA, USA) fitted with a HayeSep D column and two molecular sieve 13X columns. The instrument was also fitted with a helium ionisation detector and two thermal conductivity detectors. The composition of the liquid product (MeOH and H2O) was determined using a high-performance liquid chromatography instrument (HPLC 1200 instrument; Agilent Technologies, Santa Clara, CA, USA) fitted with refractive index detector and an Aminex HPX-87P column. The weight of the liquid was accurately measured using a high precision balance (Adam Equipment, Johannesburg, South Africa) for subsequent calculations of the MeOH WTY.

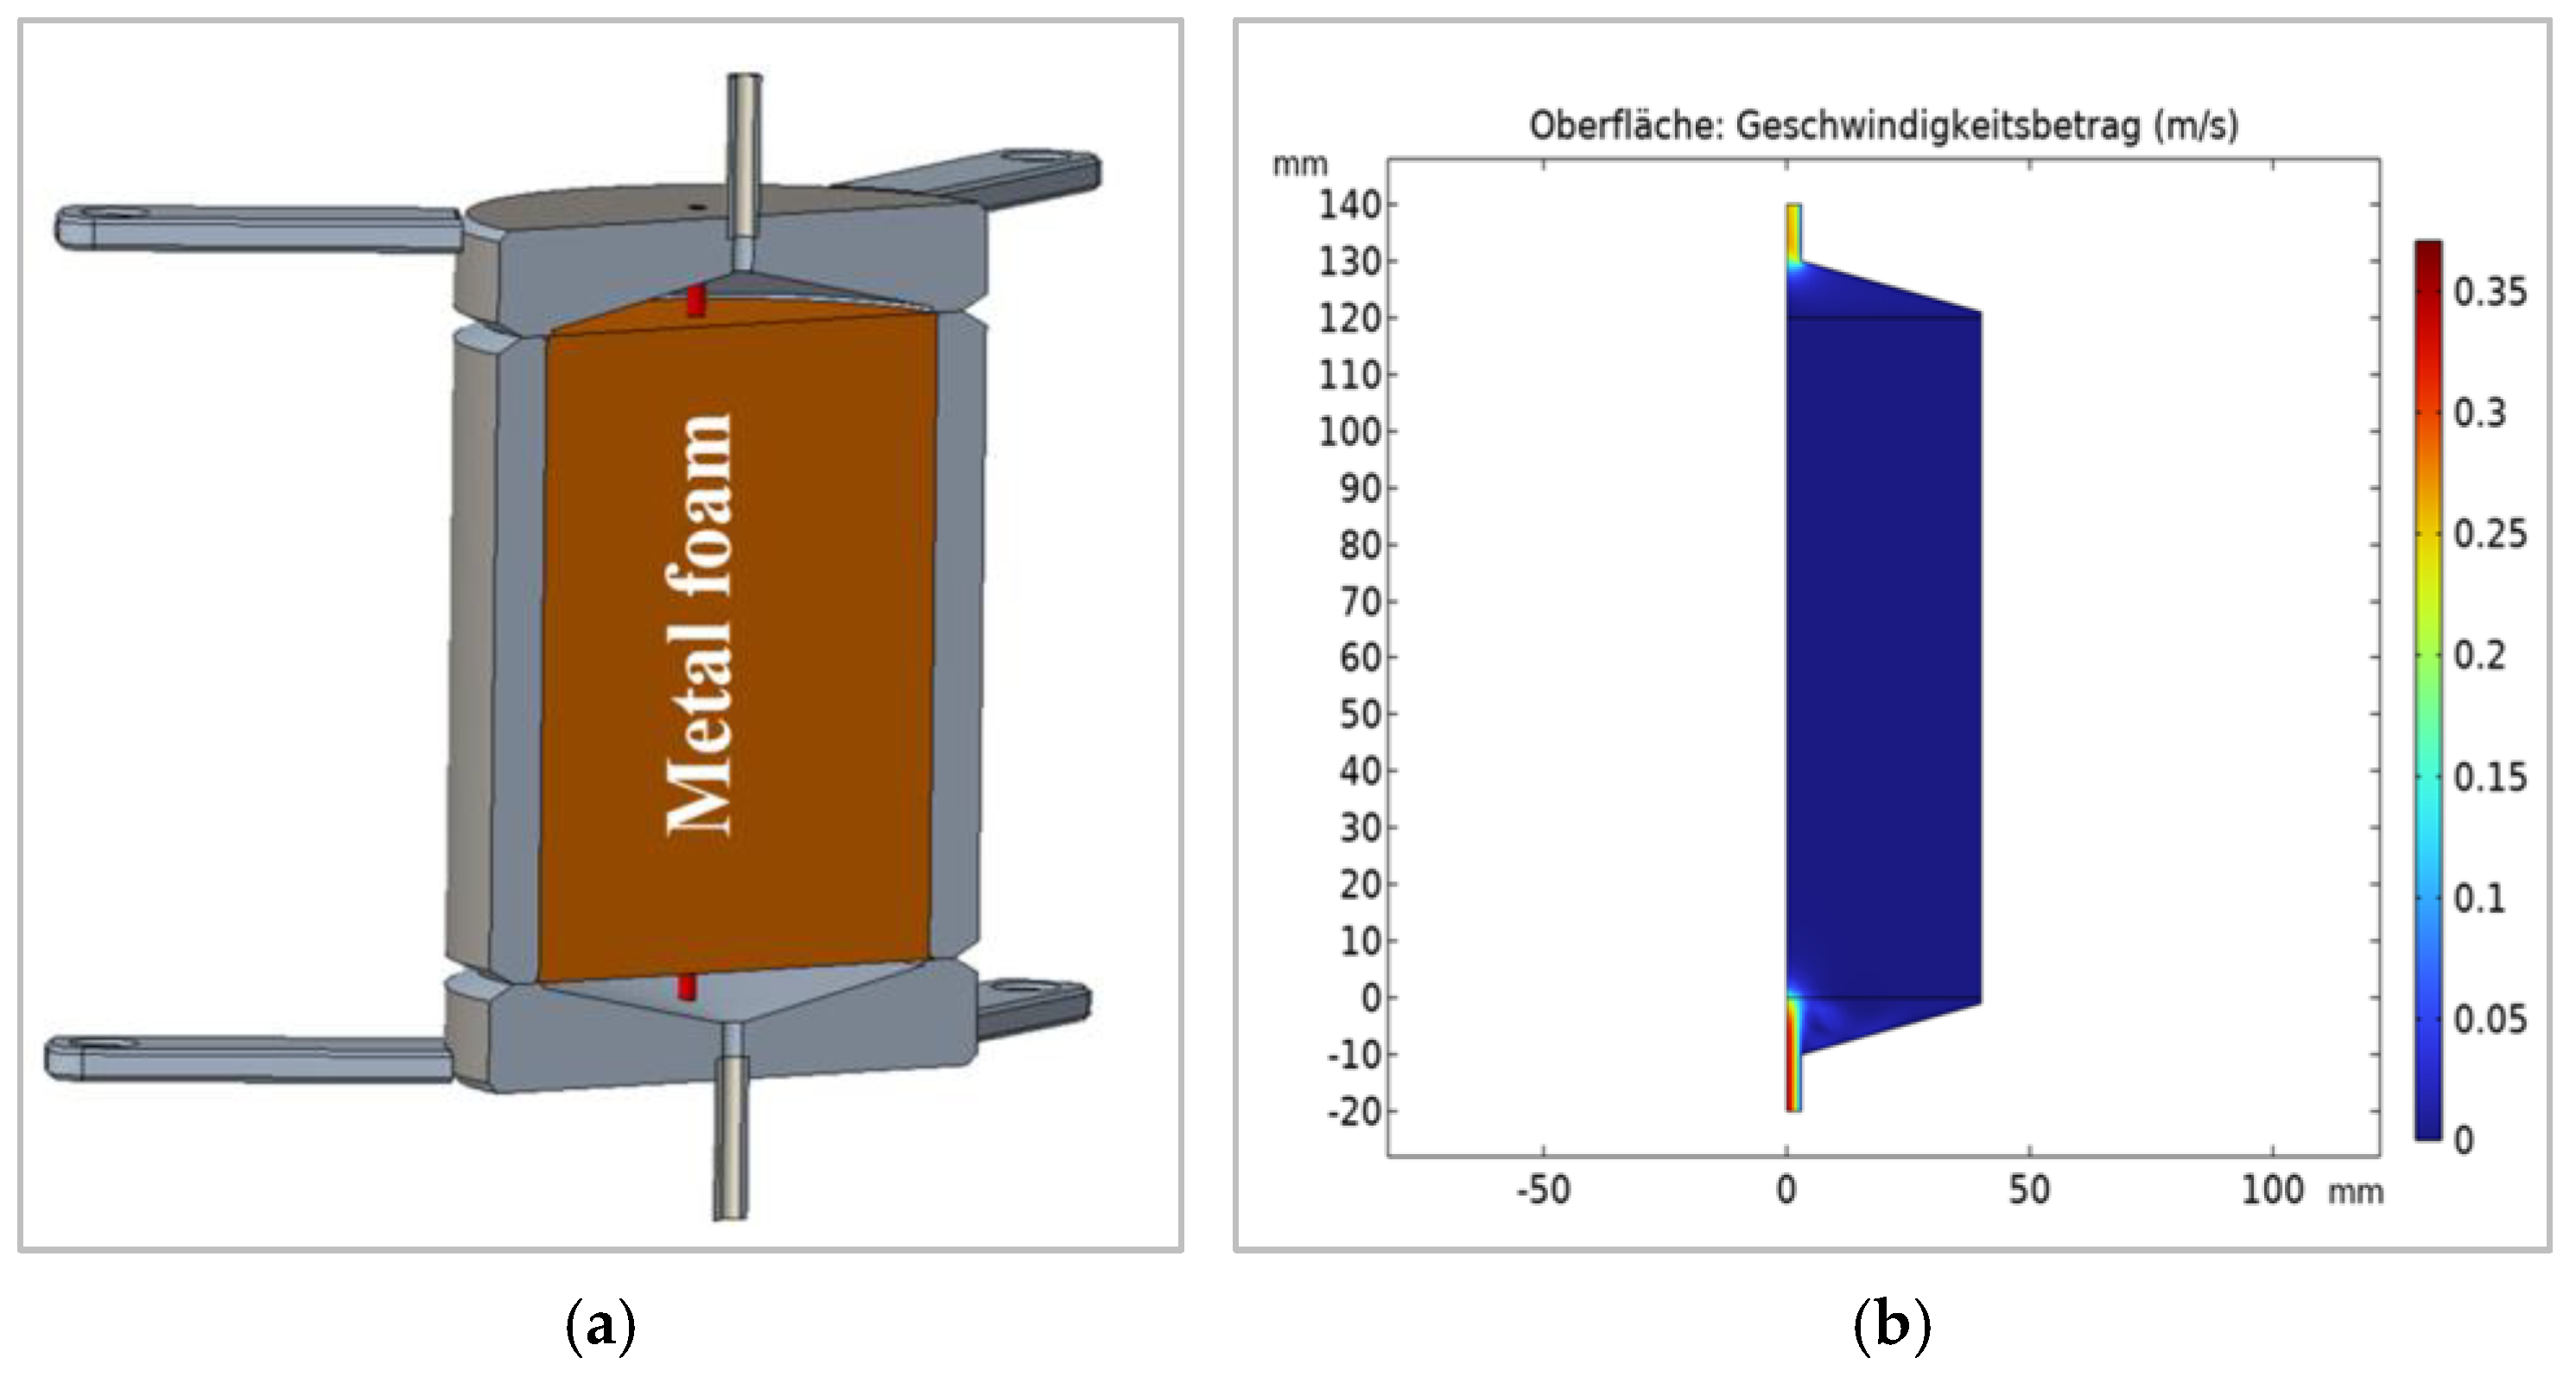
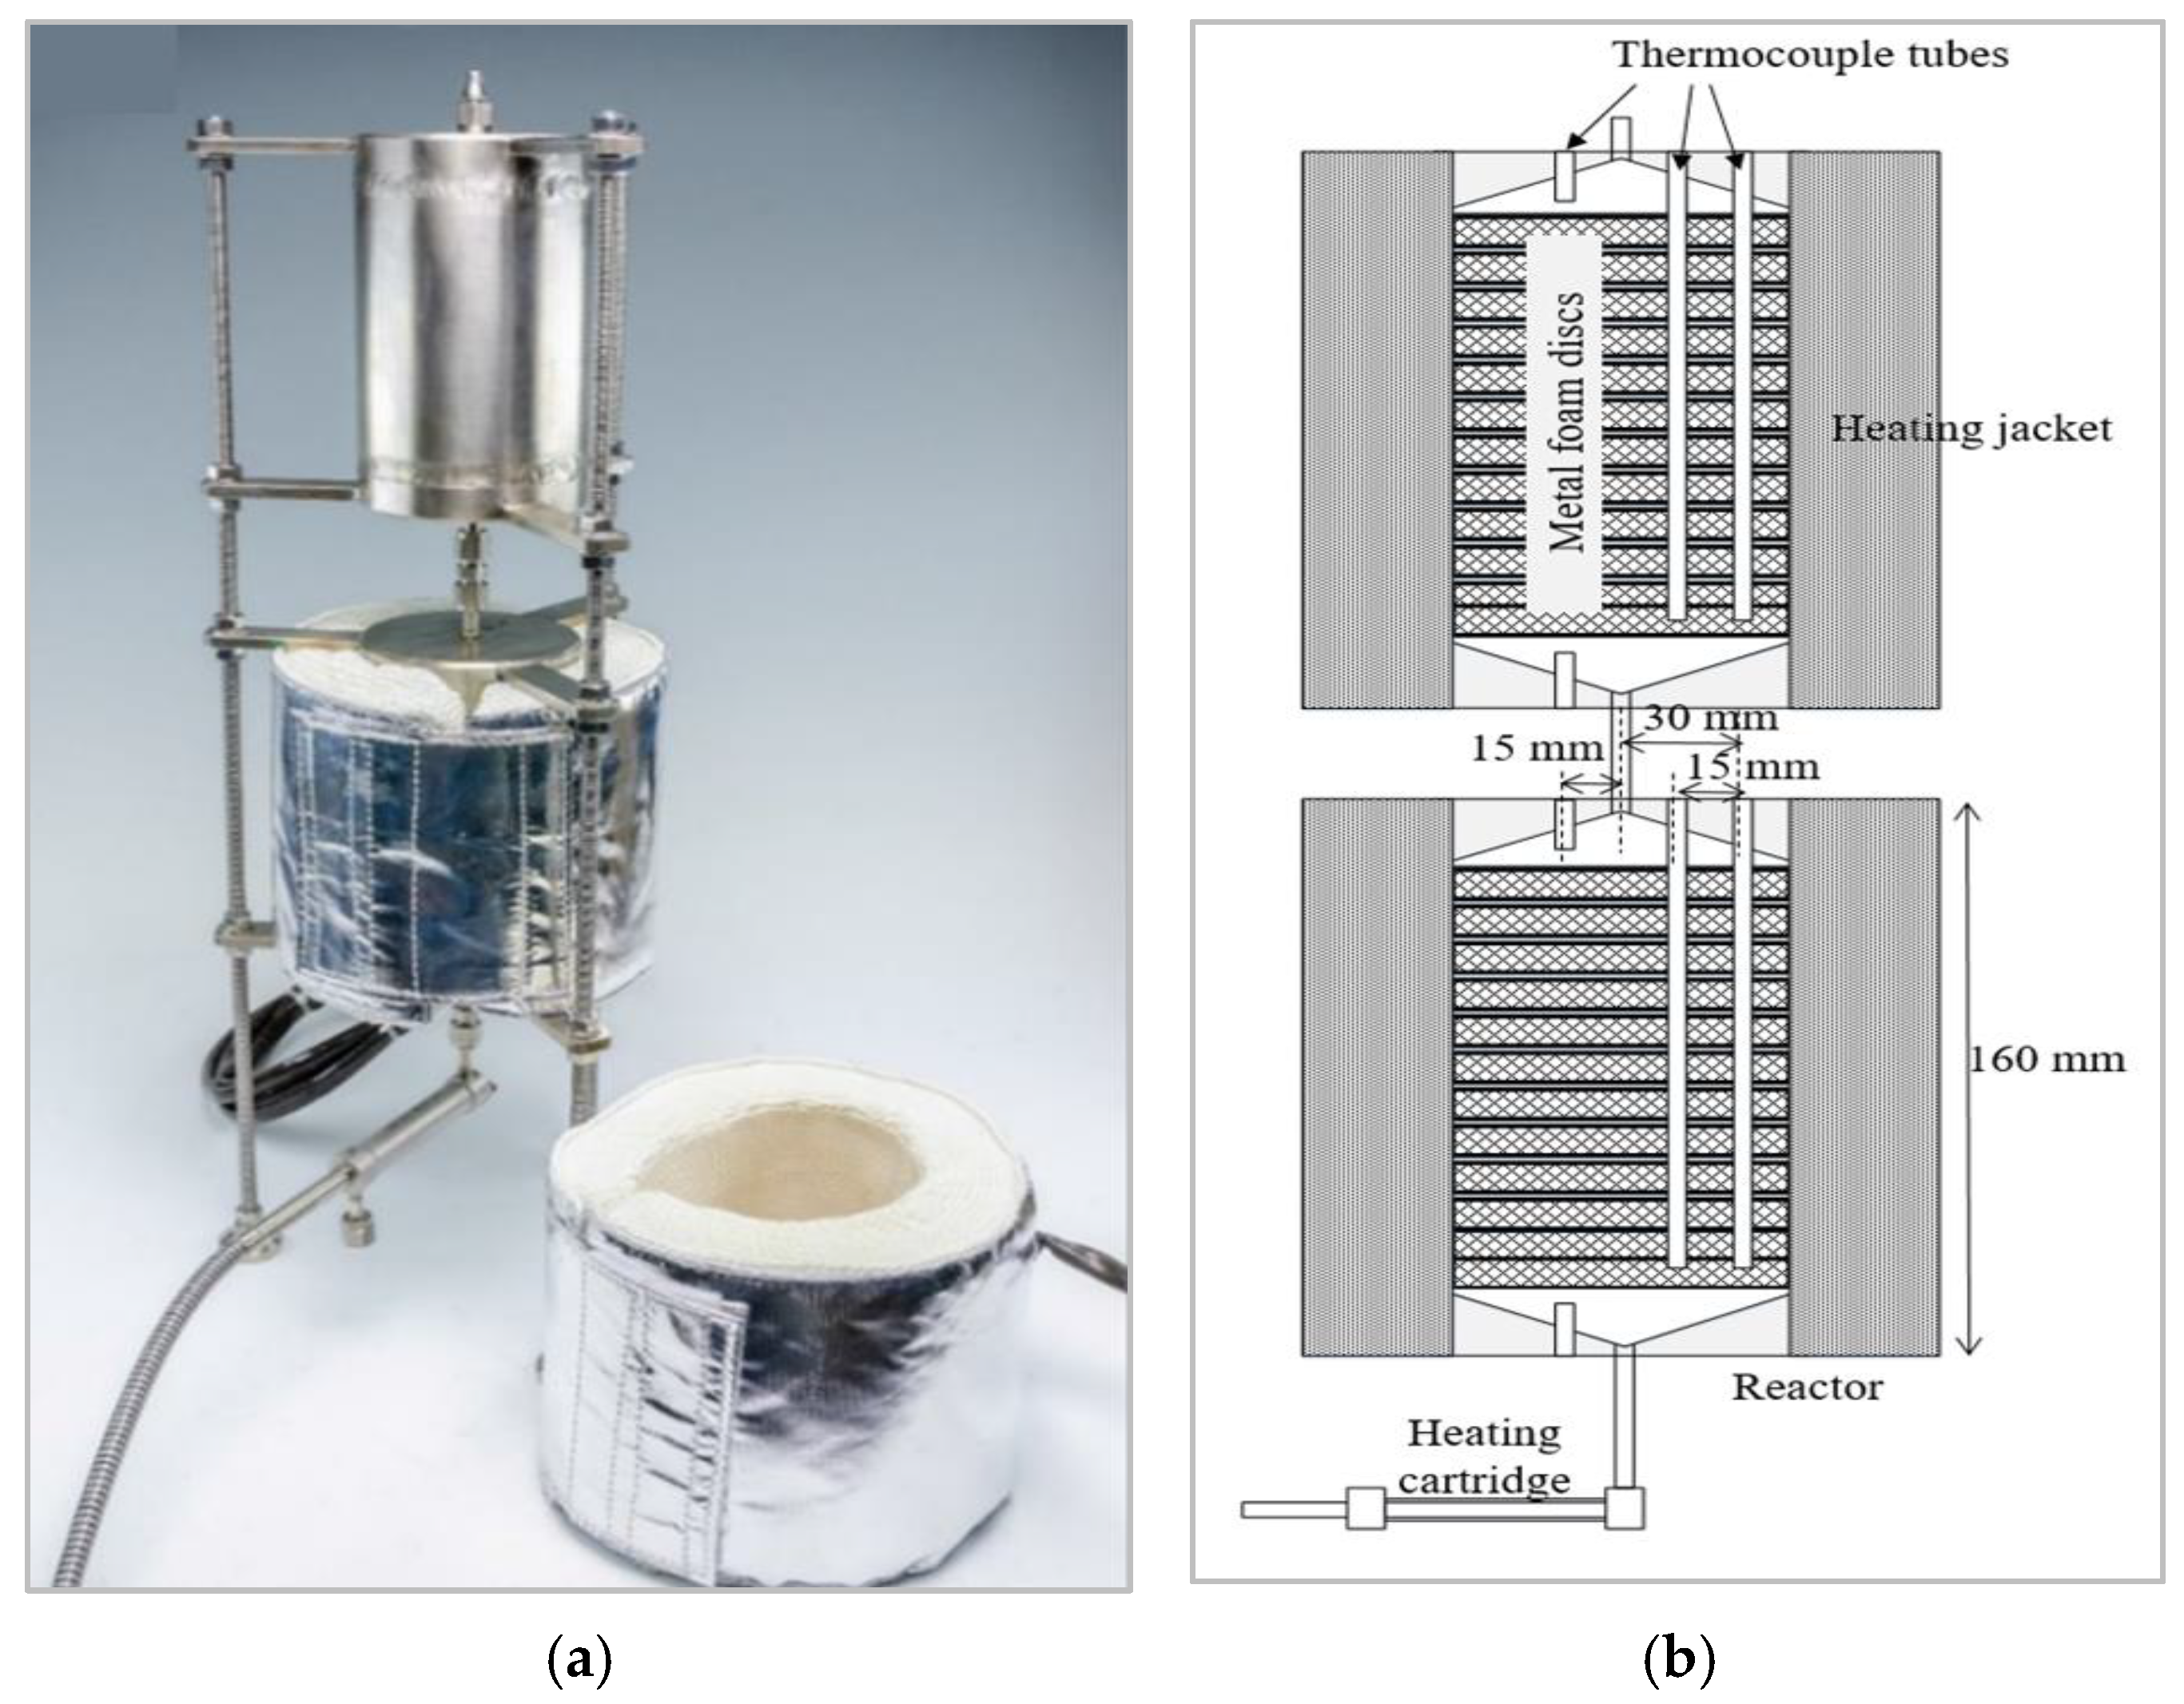
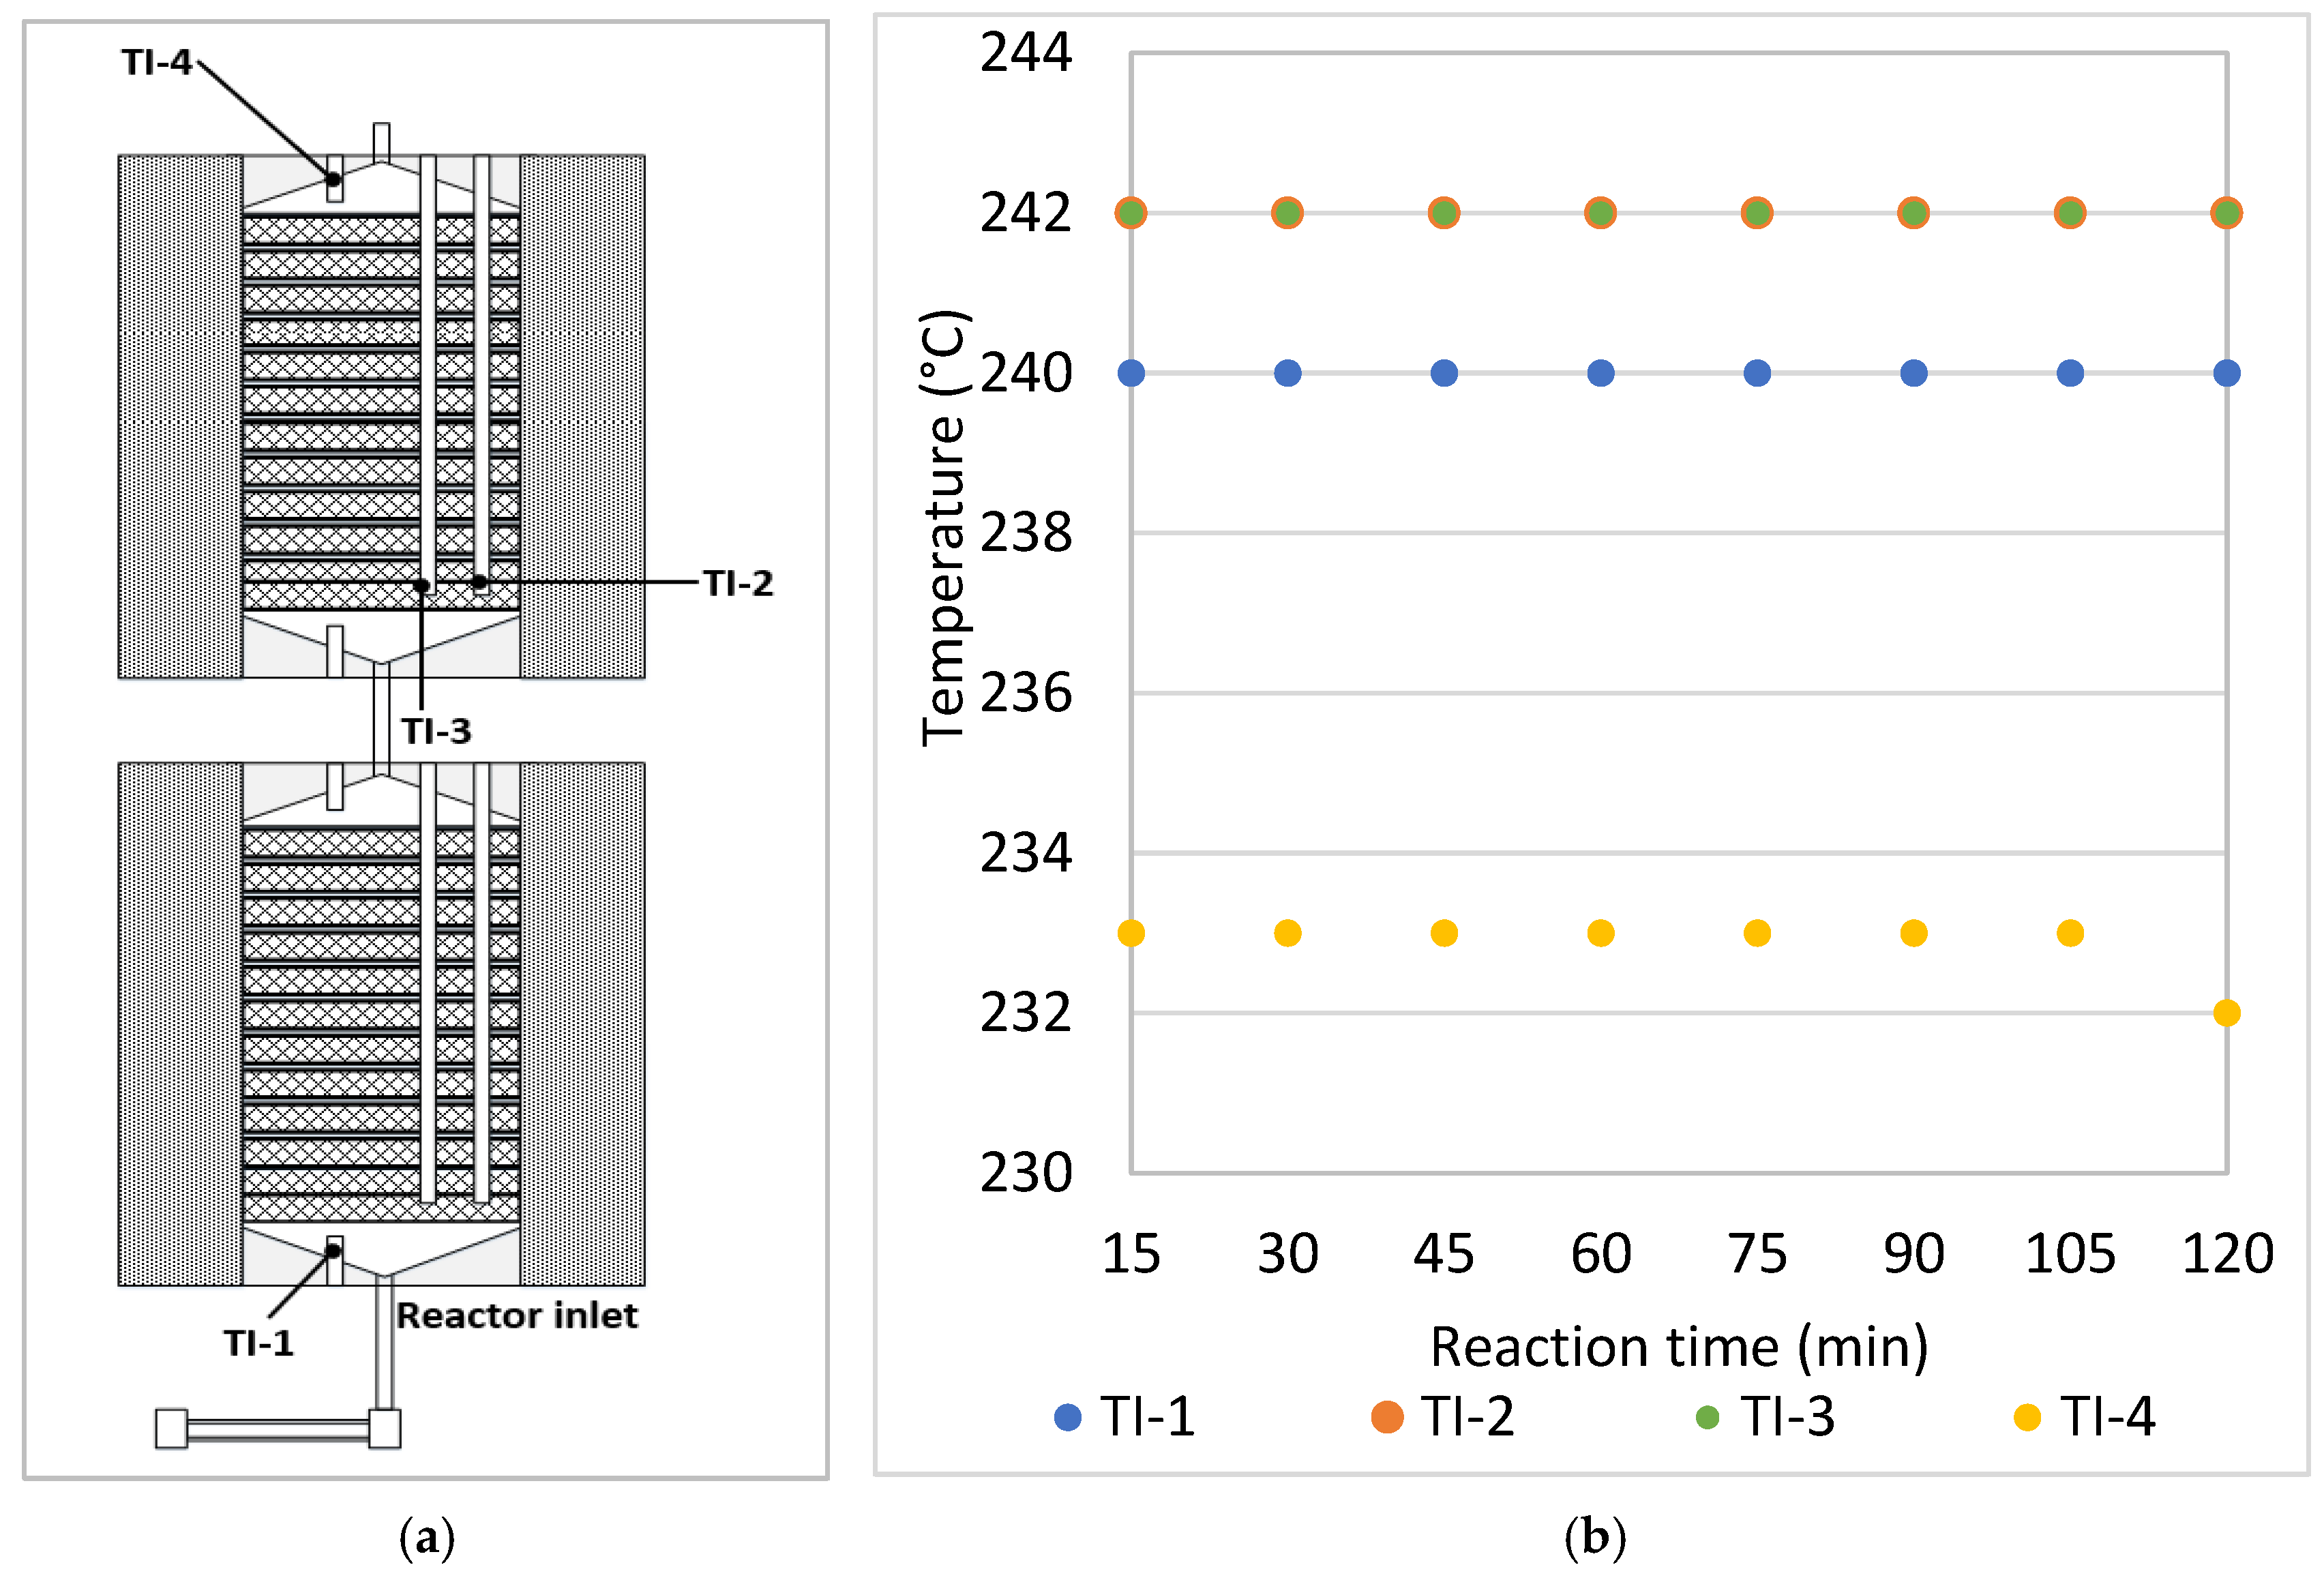
2.2. Experimental Reactor

The MeOH synthesis reactor was designed as a fixed-bed reactor (Fraunhofer IMM, Mainz, Germany) to contain a Cu foam structure, washcoated with 160 g of a commercial Cu/ZnO/Al2O3 catalyst supplied by an original equipment manufacturer. Some basic textural properties of the catalyst are summarised in Sections 1–4 in Supplementary Materials. According to the required operating conditions (up to 350 °C and 50 bar), the reactor had to be designed regarding the requirements of the European guideline for pressure equipment (Directive 2014/68/EU) [34]. To avoid external inspection leading to higher costs and delays, the reactor was divided into two equal vessels (0.54 L each) connected with a ¼ in stainless steel pipe to reduce the pressurised volume of each module (Figure 2a and Figure 3a). As a consequence, all realisation steps and the inspection procedure were allowed to be performed in-house. Figure 2a illustrates the longitudinal section of a single reactor module. The inner inlet and outlet sections of each module were devoid of a foam-supported catalyst in order to maintain homogeneous flow distribution in the catalytic bed. Computational simulation results confirmed the uniformity of flow distribution within the reactor modules (Figure 2b).
Three radially spaced ports (ID: 1.8 mm) for thermocouples were incorporated in the top of each module (Figure 3b). Each module contained 12 washcoated disc-shaped foams (Figure 4c) which fitted tightly to the reactor walls in order to avoid the occurrence of preferential paths and formation of dead zones. The heating cartridge, described in Section 2.1 as a feed pre-heater, is visible in Figure 3a. The reactor was operated near-isothermally with two 130 W heating jackets (SAF Wärmetechnik GmbH, Mörlenbach, Germany). The surface temperatures of each reactor module could be measured at the inlet, the outlet and at two other radially spaced positions (Figure 3b) within the reactor.

2.3. Characterisation of the Catalyst Support Structure

In each of the reactor vessels, the catalyst support structure consisted of a set of 12 Cu disc-shaped foams (Figure 4a), prepared using Fraunhofer IMM (Mainz, Germany). Each Cu foam disc was 80 mm in diameter and 10 mm thick. The Cu foams were cleaned with isopropanol in an ultrasonic bath for 30 min. The samples were then annealed at 350 °C for 6 h in order to generate an oxide layer and improve the adhesive properties of the Cu foam surface (Figure 4b). The foam structures were coated by applying a suspension of a commercial Cu/ZnO/Al2O3 catalyst which was prepared according to a procedure described by O’Connell et al. [35]. The applied catalyst suspension contained a binder (polyvinyl alcohol), deionized water and the commercial catalyst powder (10 wt.%). The coated copper foams (Figure 4c) were dried in air at room temperature in order to remove excess liquid, and ultimately calcined at 350 °C for 6 h. The coating process was repeated three times to achieve the desired amount of catalyst. The adhesion of the catalyst washcoat was tested by subjecting the coated foam to a 45 min ultrasound sonication. This operation resulted in a catalyst loss of less than 0.3%.
The gravimetric surface area, pore density, and the pore and strut diameters of an original uncoated and a catalyst washcoated metal foam were determined with computed tomography using a Phoenix Nanotom S system (General Electric Sensing and Inspection Technologies, Wunstorff, Germany) located at the Central Analytical Facilities of Stellenbosch University, South Africa [36]. Both samples were scanned at a voxel size (resolution) of 52 μm. X-rays were generated at 100 kV and 80 μA. A total of 3000 and 3600 images were captured, respectively, during a 360 degree rotation of the samples. These images were used to reconstruct a volumetric dataset with system-supplied Datos reconstruction software. Visualisation and quantitative analyses were performed in VGSTUDIO MAX 3.5 (Volume Graphics, Heidelberg, Germany).
The morphology of the catalyst and its support structure were observed using scanning electron microscopy (SEM) using a FEI Quanta 250 field emission gun scanning electron microscope (ThermoFisher Scientific, Waltham, MA, USA) and the elemental composition was determined using energy dispersive X-ray spectroscopy (EDS). EDS data analysis was carried out using the Oxford Inca software. To achieve conduction between the sample and the beam of electrons, all samples were coated with carbon, using magnetron sputtering. Subsequently, a resin was used as a suitable material for imbedding the samples to be analysed (conditions: 121 °C, 290 bar, 20 min), using a PR-10 mounting press (Leco, St Joseph, MI, USA). Line point samples were taken at an equidistance of 40 μm.

2.4. Experimental Design for the Evaluation of the Reactor

Prior to the experiments, the catalyst was reduced in a mixture of H2/N2 gas at 230 °C for 30 min. The reduction temperature was obtained from the H2-temperature reduction profile (Figure S5, Section 5 in Supplementary Materials). MeOH synthesis was carried out under nearly isothermal and steady-state conditions. A one-factor-at-a-time approach was used to understand each parameter’s effect on the performance of the reactor. Table 1 summarises the operating conditions in a matrix of seven reactor temperatures, two pressures and three WHSVs. Throughout this study, the WHSV is defined as the ratio of the feed gas flow rate (NL h−1) to the catalyst mass (gcat) [8,37]. It should be noted that the highest WHSV (2.925 NL gcat−1 h−1) was used exclusively for the 50-bar reactor pressure condition, since this reactor pressure was expected to support the highest MeOH synthesis reaction rate (high throughput). CO2 and H2 were fed to the reactor in a stoichiometric ratio of 1:3. Each experiment was carried out for 2 h and the product gas was analysed every 15 min. The product gas consisted of a mixture of CO2, H2 and CO. No CH4 was detected at any of the experimental operating conditions. The liquid product consisted of a mixture of MeOH and H2O. No other by-product was detected in the chromatographs. The average error on carbon balance for all experiments was <5%.
The performance of the reactor was assessed considering the CO2 conversion (Equation (3)), MeOH selectivity (Equation (4)) and MeOH WTY (Equation (5)) [19]. The CO2 conversion and MeOH selectivity were compared to equilibrium data calculated by simulating a Gibbs reactor in ASPEN Plus v8.6 software (see Section 6 in Supplementary Materials). The non-random two-liquid method fluid property package was used [38]. The reactants were also considered as possible products.
X CO 2 = n CO 2 in n CO 2 out n CO 2 in × 100 %
S CH 3 OH = n CH 3 OH out n CH 3 OH out +   n CO out × 100 %
WTY CH 3 OH =   m CH 3 OH out m catalyst   ×   time   on   stream

3. Results and Discussion

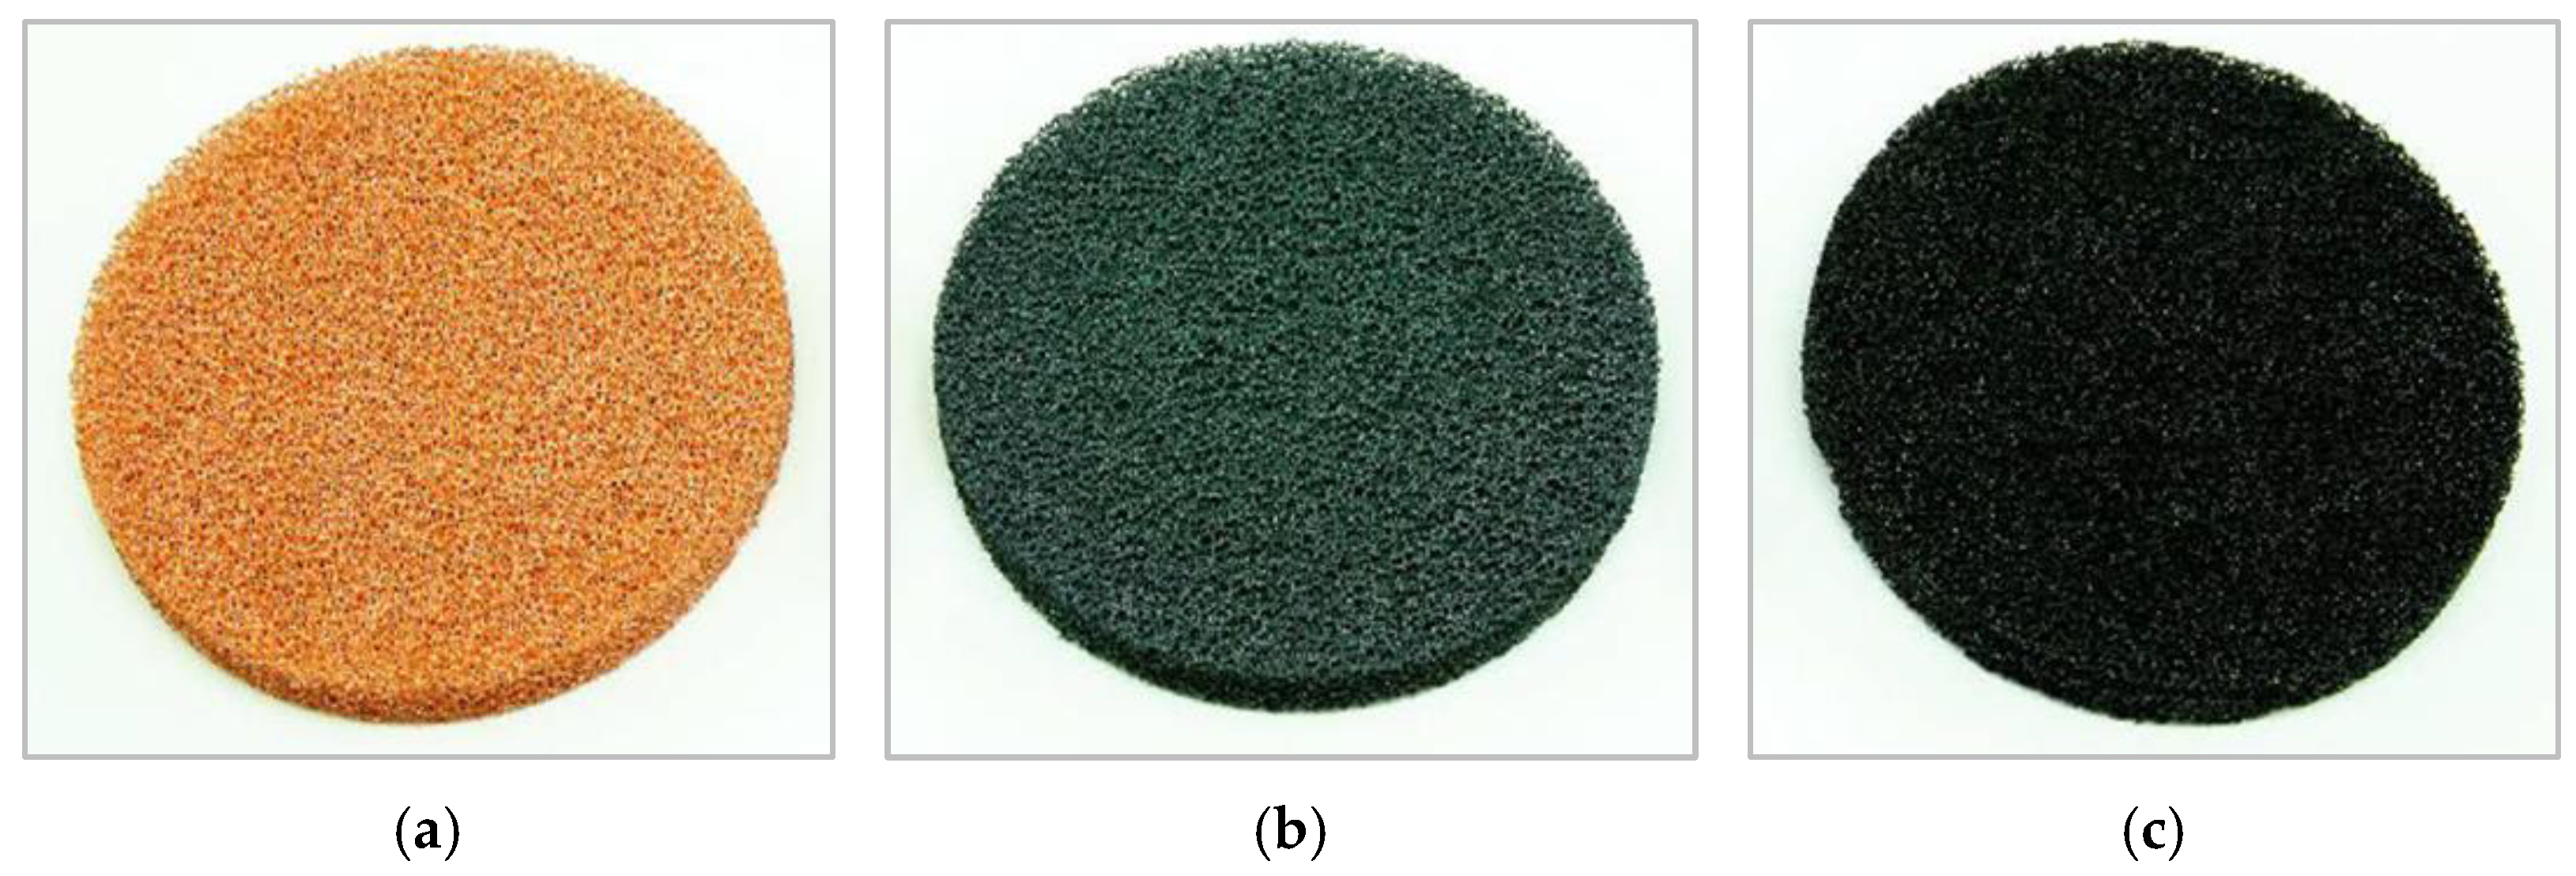
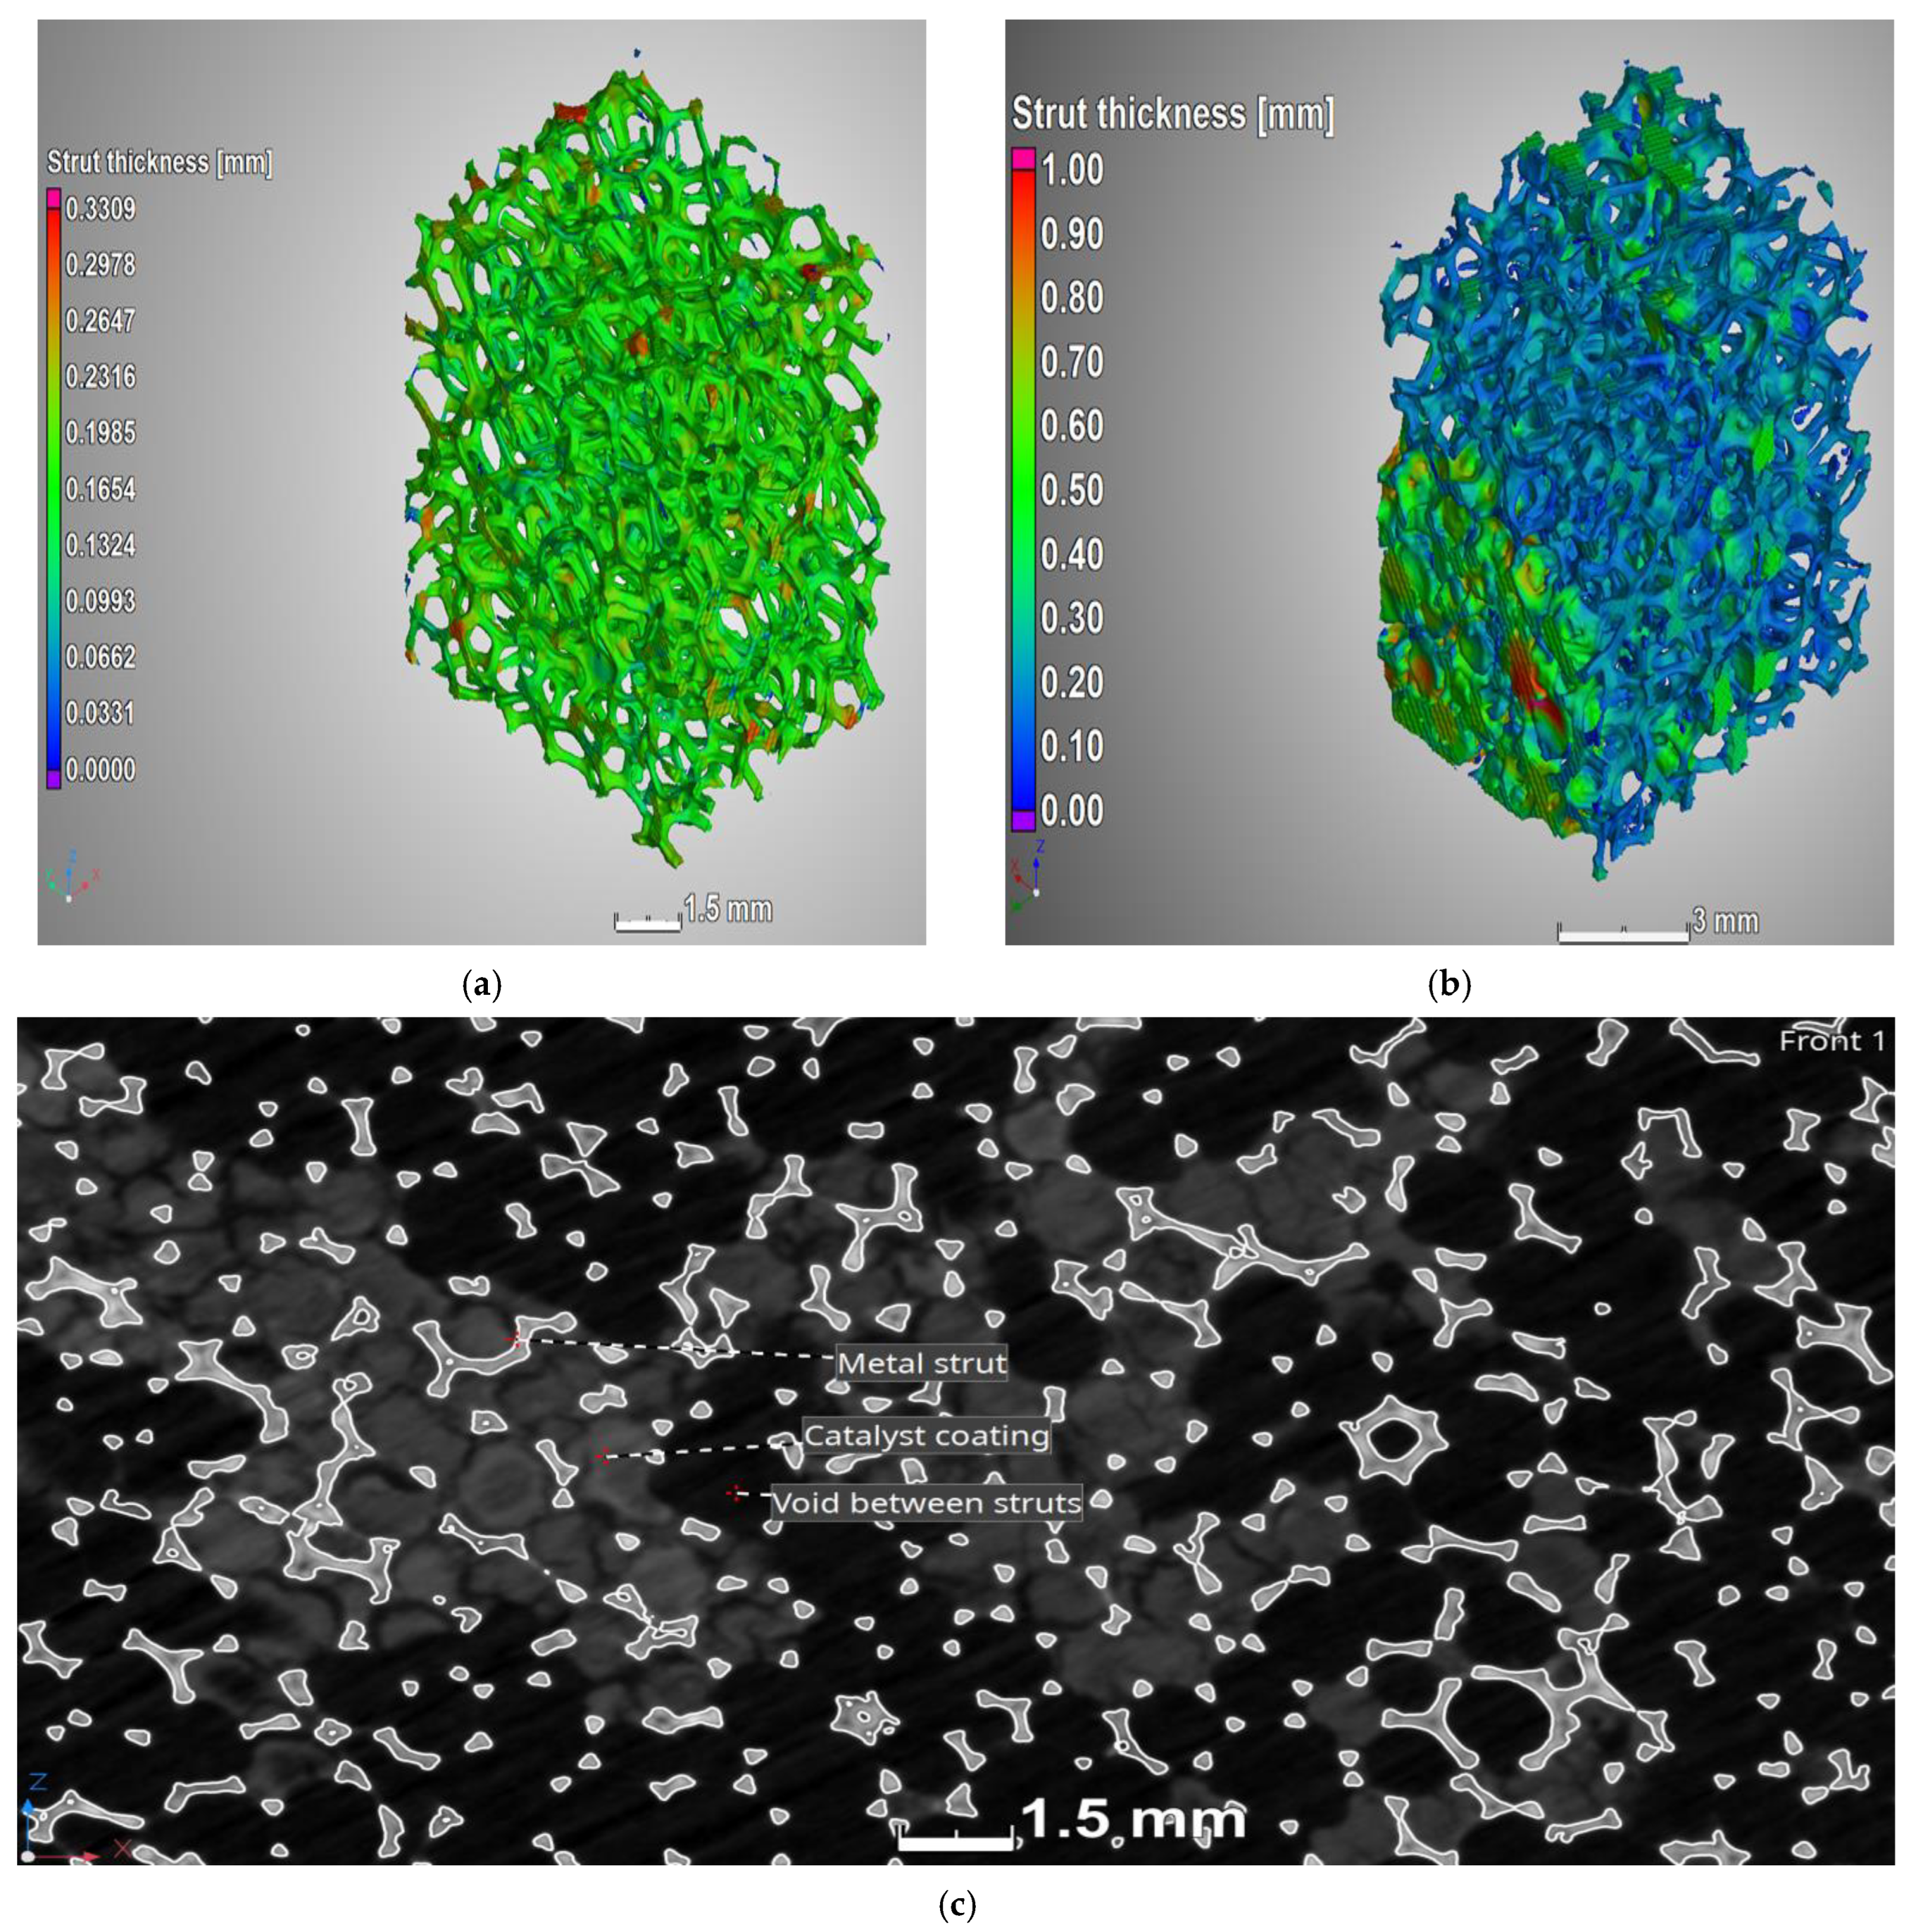
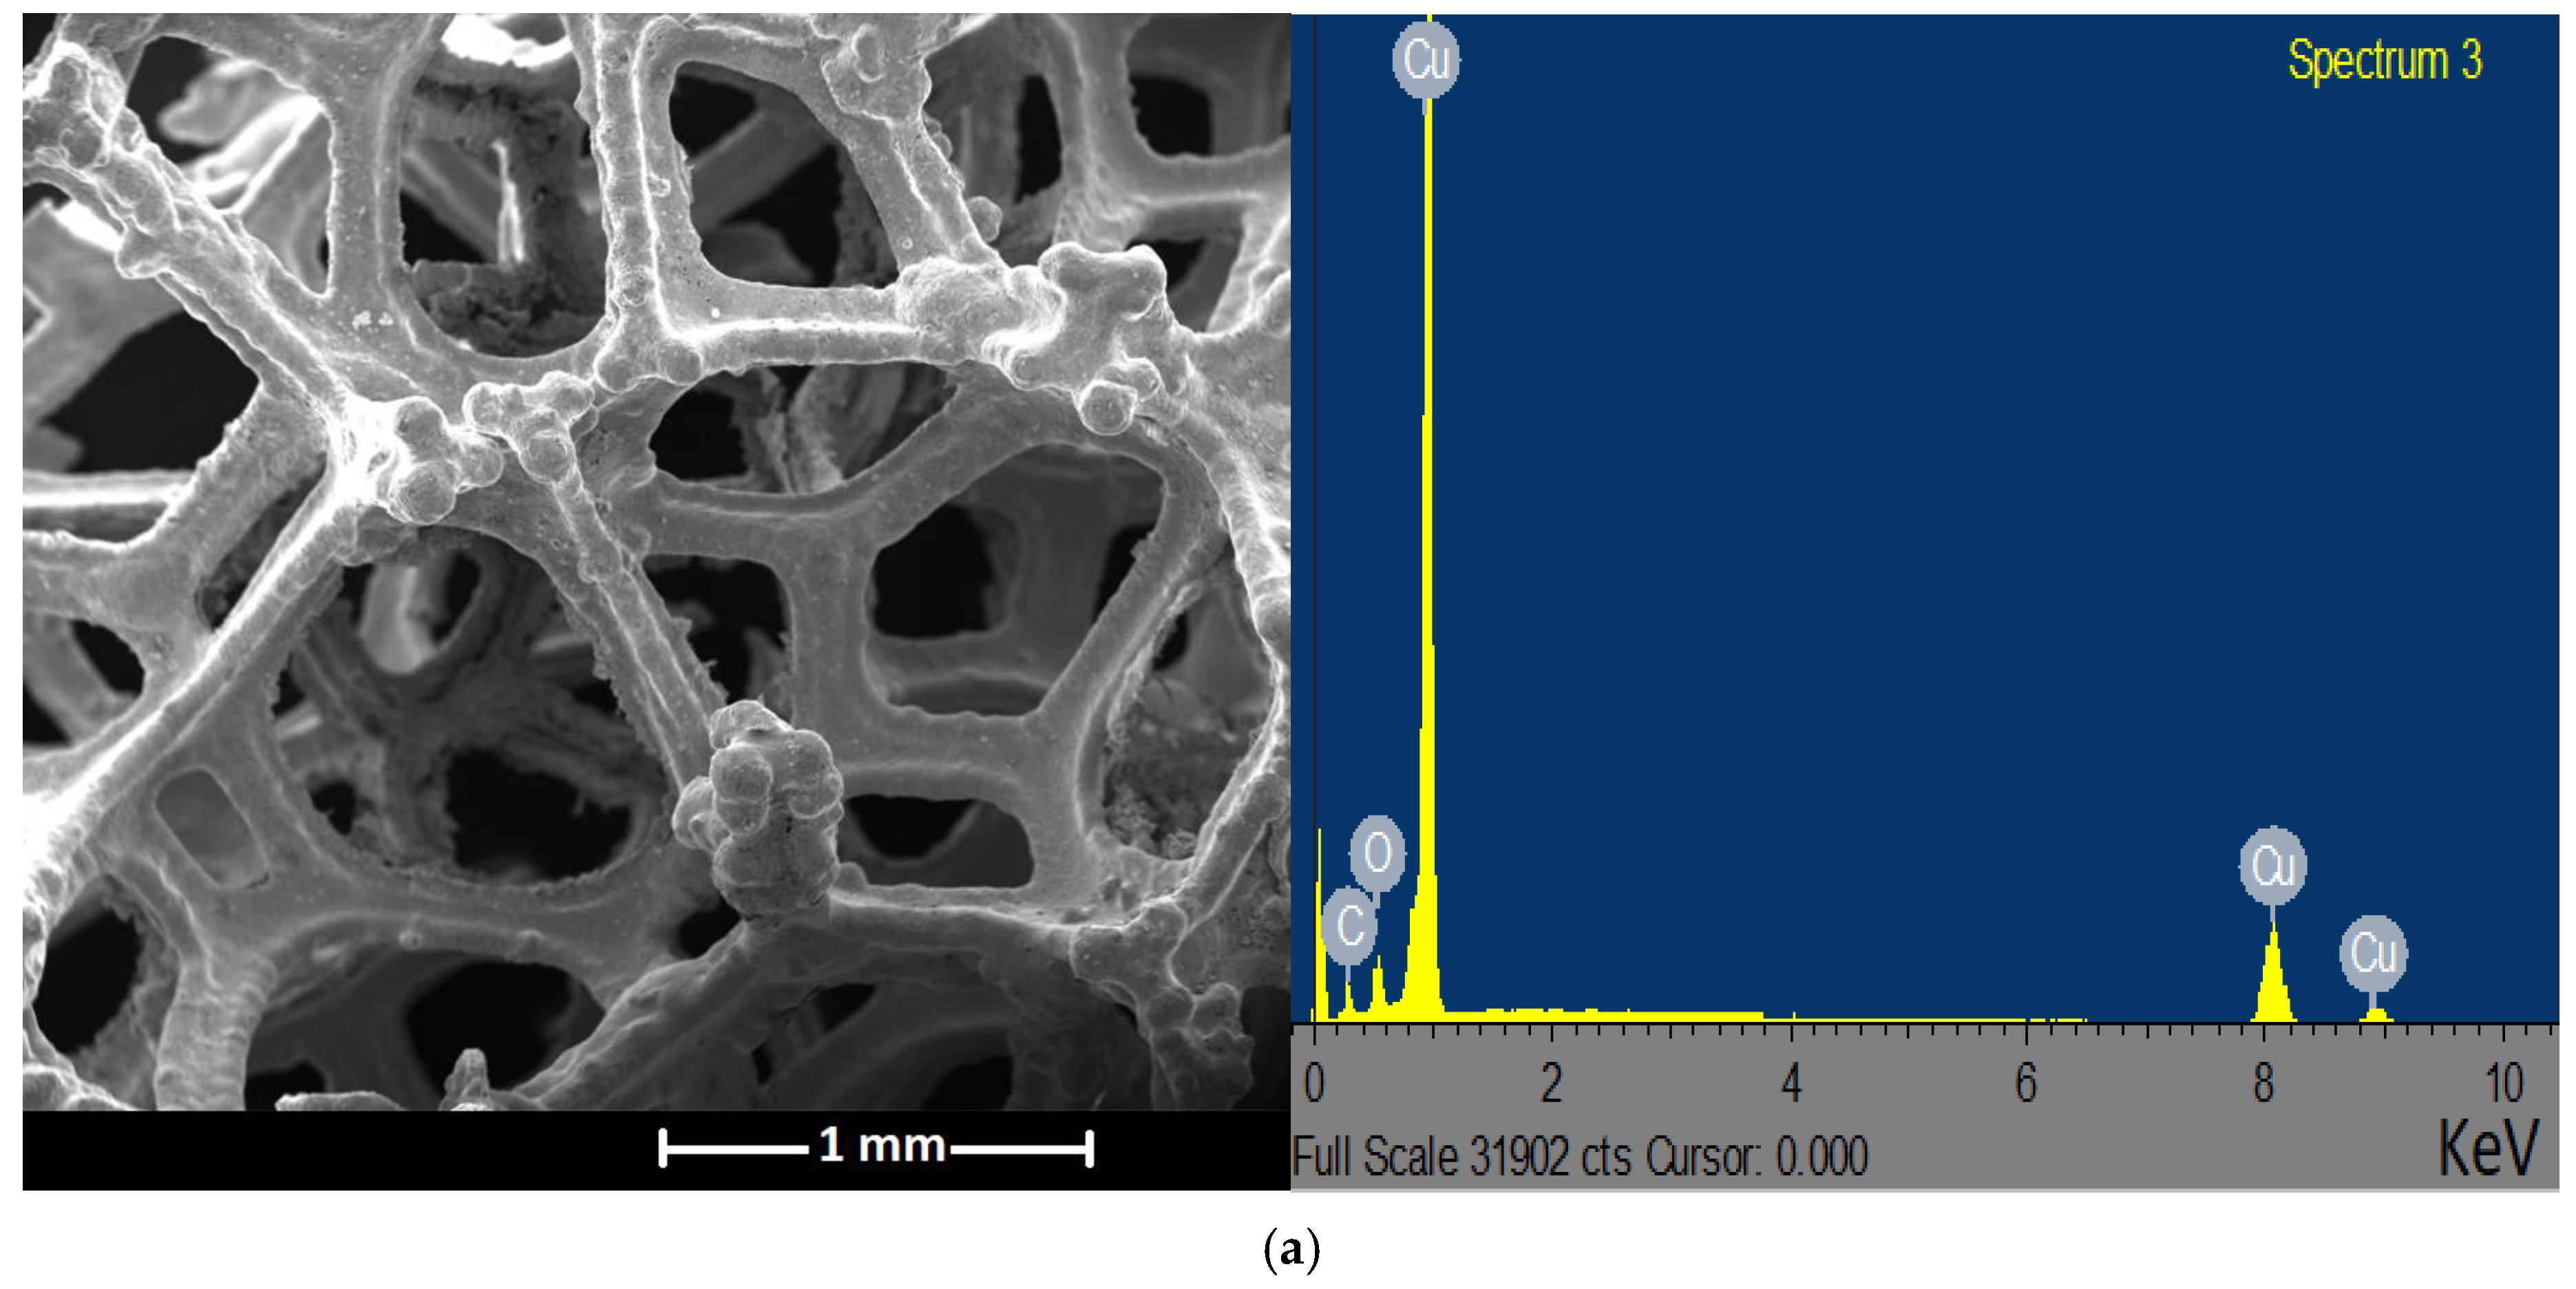
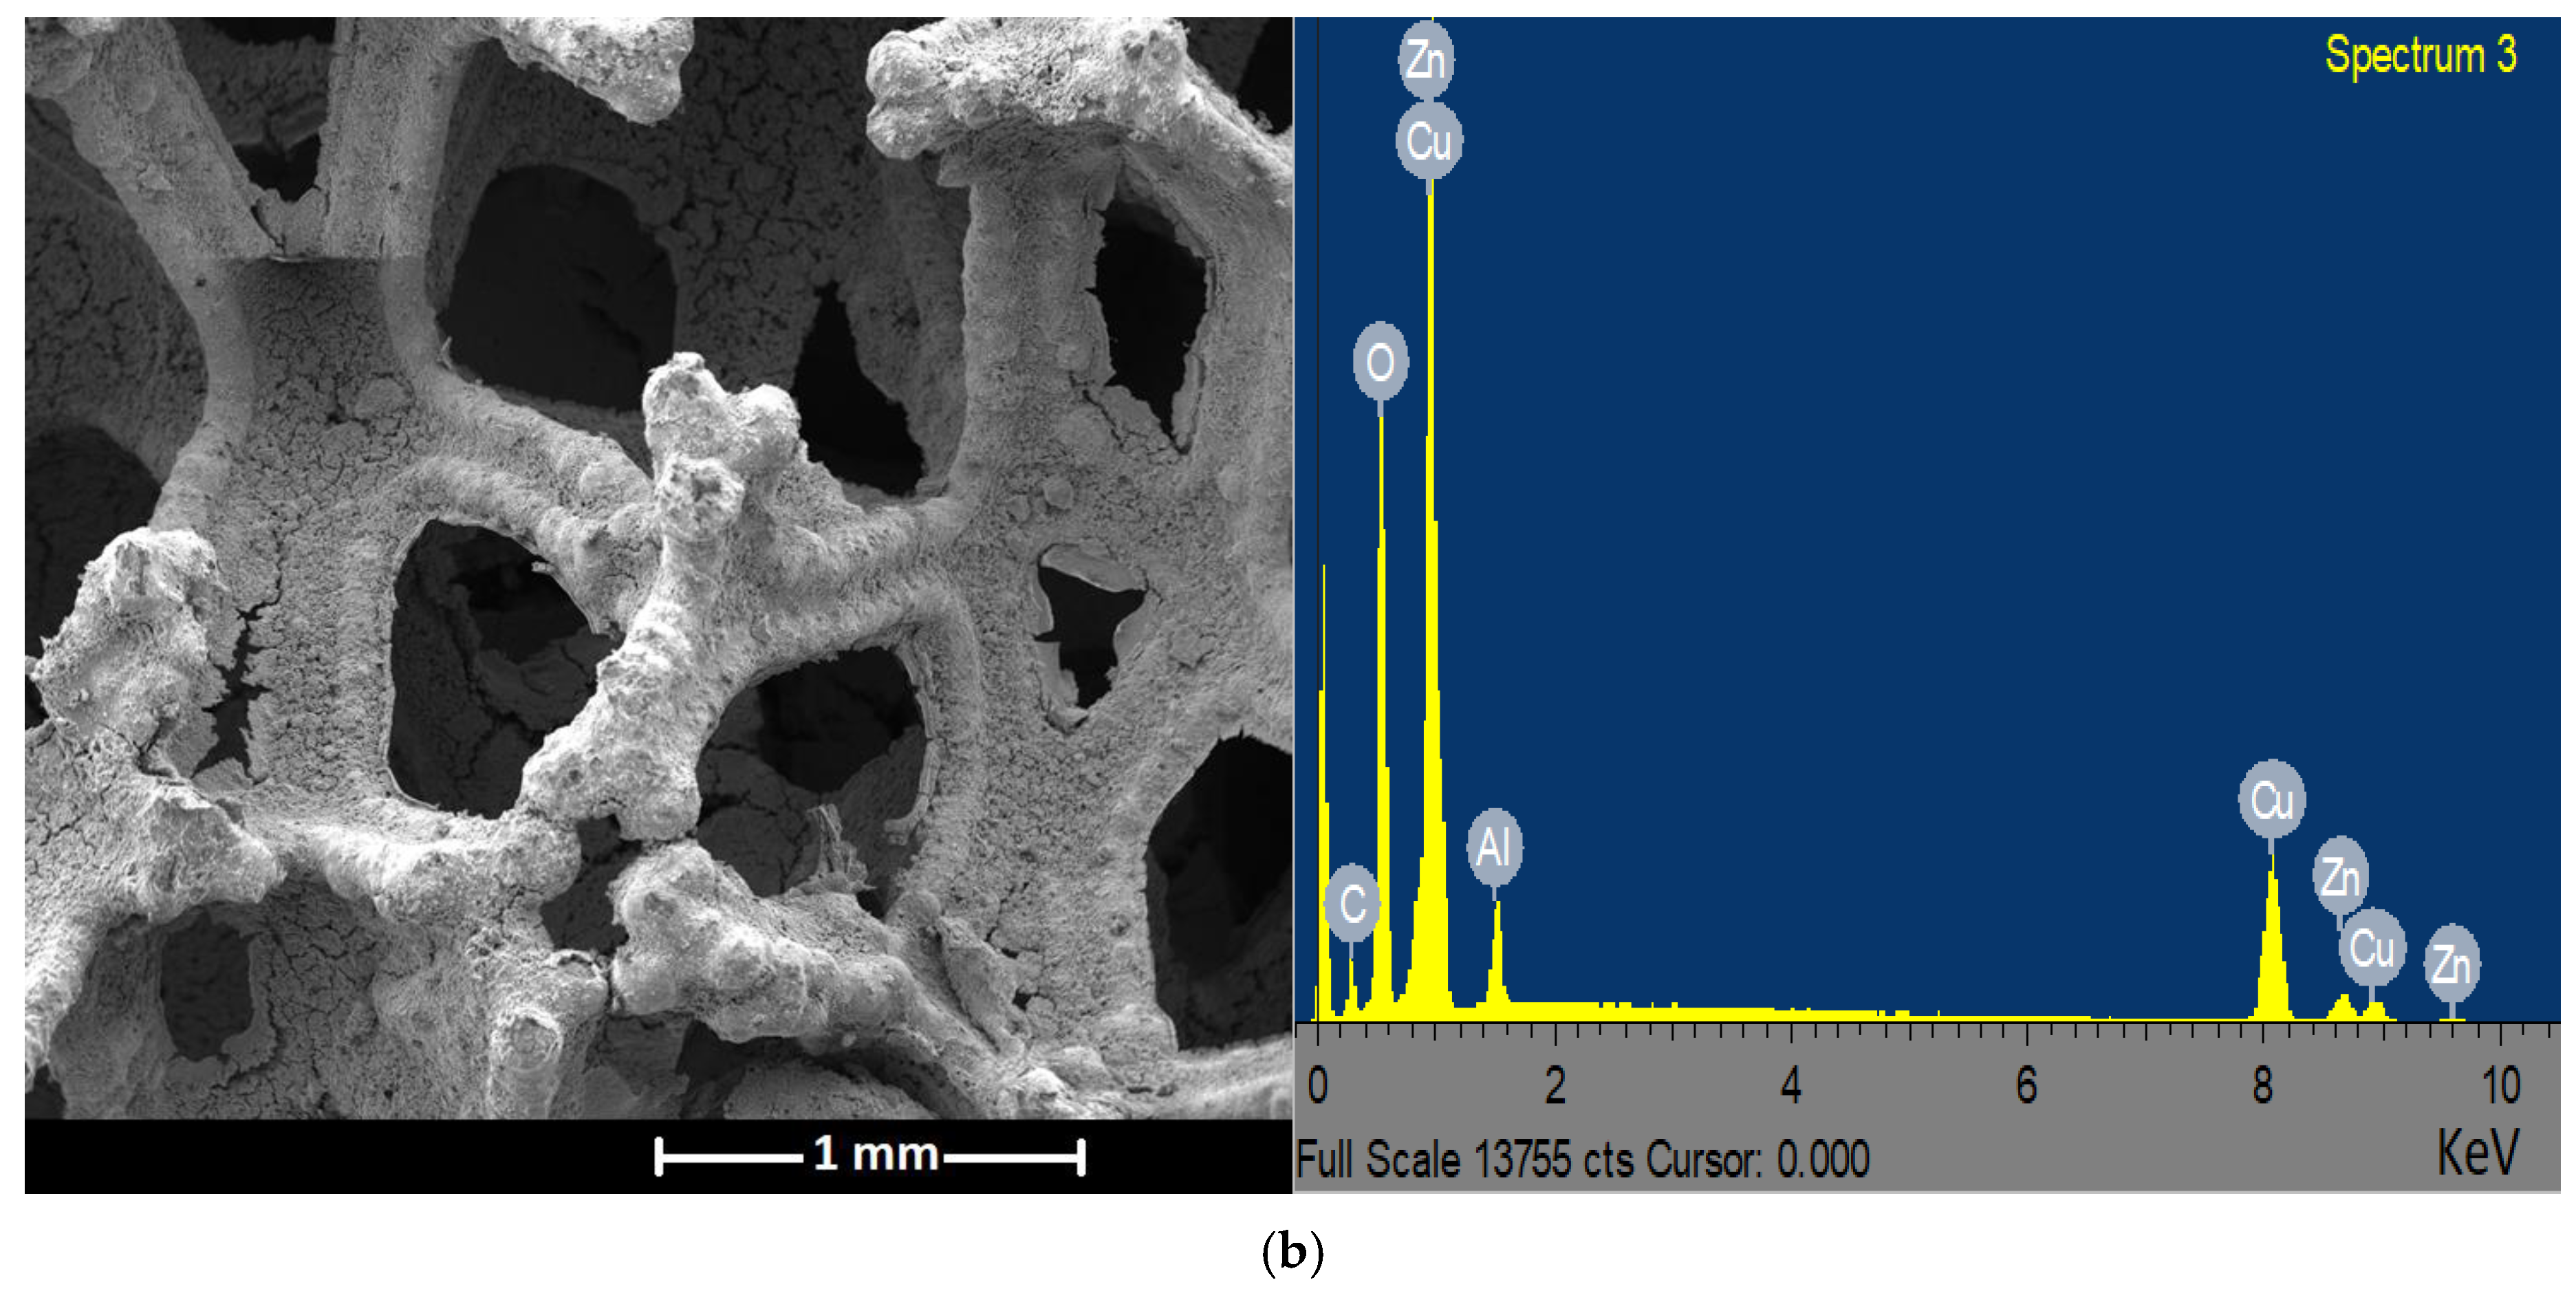
3.1. Structural Properties of the Foam

Computed tomography images (Figure 5) show the difference between samples of uncoated and coated foam. It is evident that the coating method resulted in uneven catalyst distribution on the foam. Despite an increase in the average thickness of the struts and the blocking of some of the pores (Figure 5b,c), the open porosity only decreased by 8%; it remained relatively high at 81.6%. This high porosity of foam supports minimises the pressure drop in foam reactors [26,28]. The choice of the coating method is therefore essential in order to achieve high porosity. For example, Ambrosetti et al. [39] found spin coating to be more suitable than dip coating for minimising clogging of their foam samples.
Catalytic coating naturally increased the relative density of the foam as more material is added without a noticeable increase in volume. The low relative density of the coated foam (551.35 kg m−3) substantiates the ability of foam supports to minimise the weight of the catalyst bed. Catalyst coating increased the surface area to volume ratio by 19.2%. Although the gravimetric surface area is much lower than for conventional catalysts (50–200 m2 g−1 [40]), the high surface-area-to-volume ratio here (2178.1 m2 m−3), which compares with that of finely crushed catalysts powders, will ensure high performance of the catalytic system. Table 2 summarises differences in the geometrical characteristics of the uncoated and coated foam samples.
Using ImageJ software, the average pore density was estimated to be 40 PPI, which is similar to the 45 PPI catalyst support structure used by Montebelli et al. [21] for MeOH synthesis from syngas. The pore density of the Cu foam used in our study is not the highest reported in the literature. It is argued that higher pore densities (e.g., 100 PPI) increase the residence time via highly tortuous flows, which then improves mixing and heat transfer of gaseous species [32,41,42]. However, improvements in catalyst coating become more challenging on such foams because of the increased probability of pore blockage [39].
The SEM analysis revealed the monolithic three-dimensional structure of the uncoated Cu foam (Figure 6a). The SEM micrograph shows the irregular and interconnected struts of homogeneous Cu substrate, with clear and unblocked pores. The struts show no apparent cracks. On the other hand, Figure 6b illustrates the coated metal foam structure, in which the washcoat completely covers the struts. The pore diameters are reduced, leading to a decrease in the open porosity (confirmed with computed tomography results). The observed surface roughness of the washcoat is desirable, as it contributes to an increase in the specific surface area of the foam-supported catalyst [43].

3.2. Catalytic Activity Tests

The results reported in this section illustrate the effects of the selected operating parameters (reaction temperature, pressure, WHSV) on the performance of the reactor for CO2 hydrogenation to MeOH. Figure 7 and Figure 8 illustrate the respective experimental results at 30 bar (Figure 7) and 50 bar (Figure 8) for the following: (a) CO2 conversion, (b) MeOH selectivity, (c) MeOH WTY and (d) CO outlet concentration. The CO2 conversion as well as the MeOH selectivity are compared to equilibrium data calculated using ASPEN Plus v8.6. To ensure reproducibility of the data, selected experiments were repeated at least five times. The standard deviations of the results calculated for the CO2 conversion and MeOH selectivity were <3%. Some data points in Figure 7a,b and Figure 8a,b were observed to be above the calculated equilibrium lines. These deviations could be due to the fact that the equilibrium curves were not plotted from experimental data. Additionally, experiments were not conducted under ideal theoretical conditions in which no heat losses or mass transfer limitations are considered.
Despite the low gravimetric surface area of the foam-supported catalyst, the modular MeOH synthesis reactor demonstrated a high catalytic activity for MeOH synthesis through CO2 hydrogenation at 30 and 50 bar. In the selected temperature range (190–250 °C), the thermodynamic equilibrium limited CO2 conversion to a range decreasing from 28–21% at 30 bar and 37–25% at 50 bar. CO2 and H2 were converted to MeOH, CO and H2O only. In the chosen range of experimental conditions, the commercial Cu/ZnO/Al2O3 is only active for CO2 hydrogenation to MeOH and for the RWGS reaction. No CH4 or other hydrocarbons were detected.

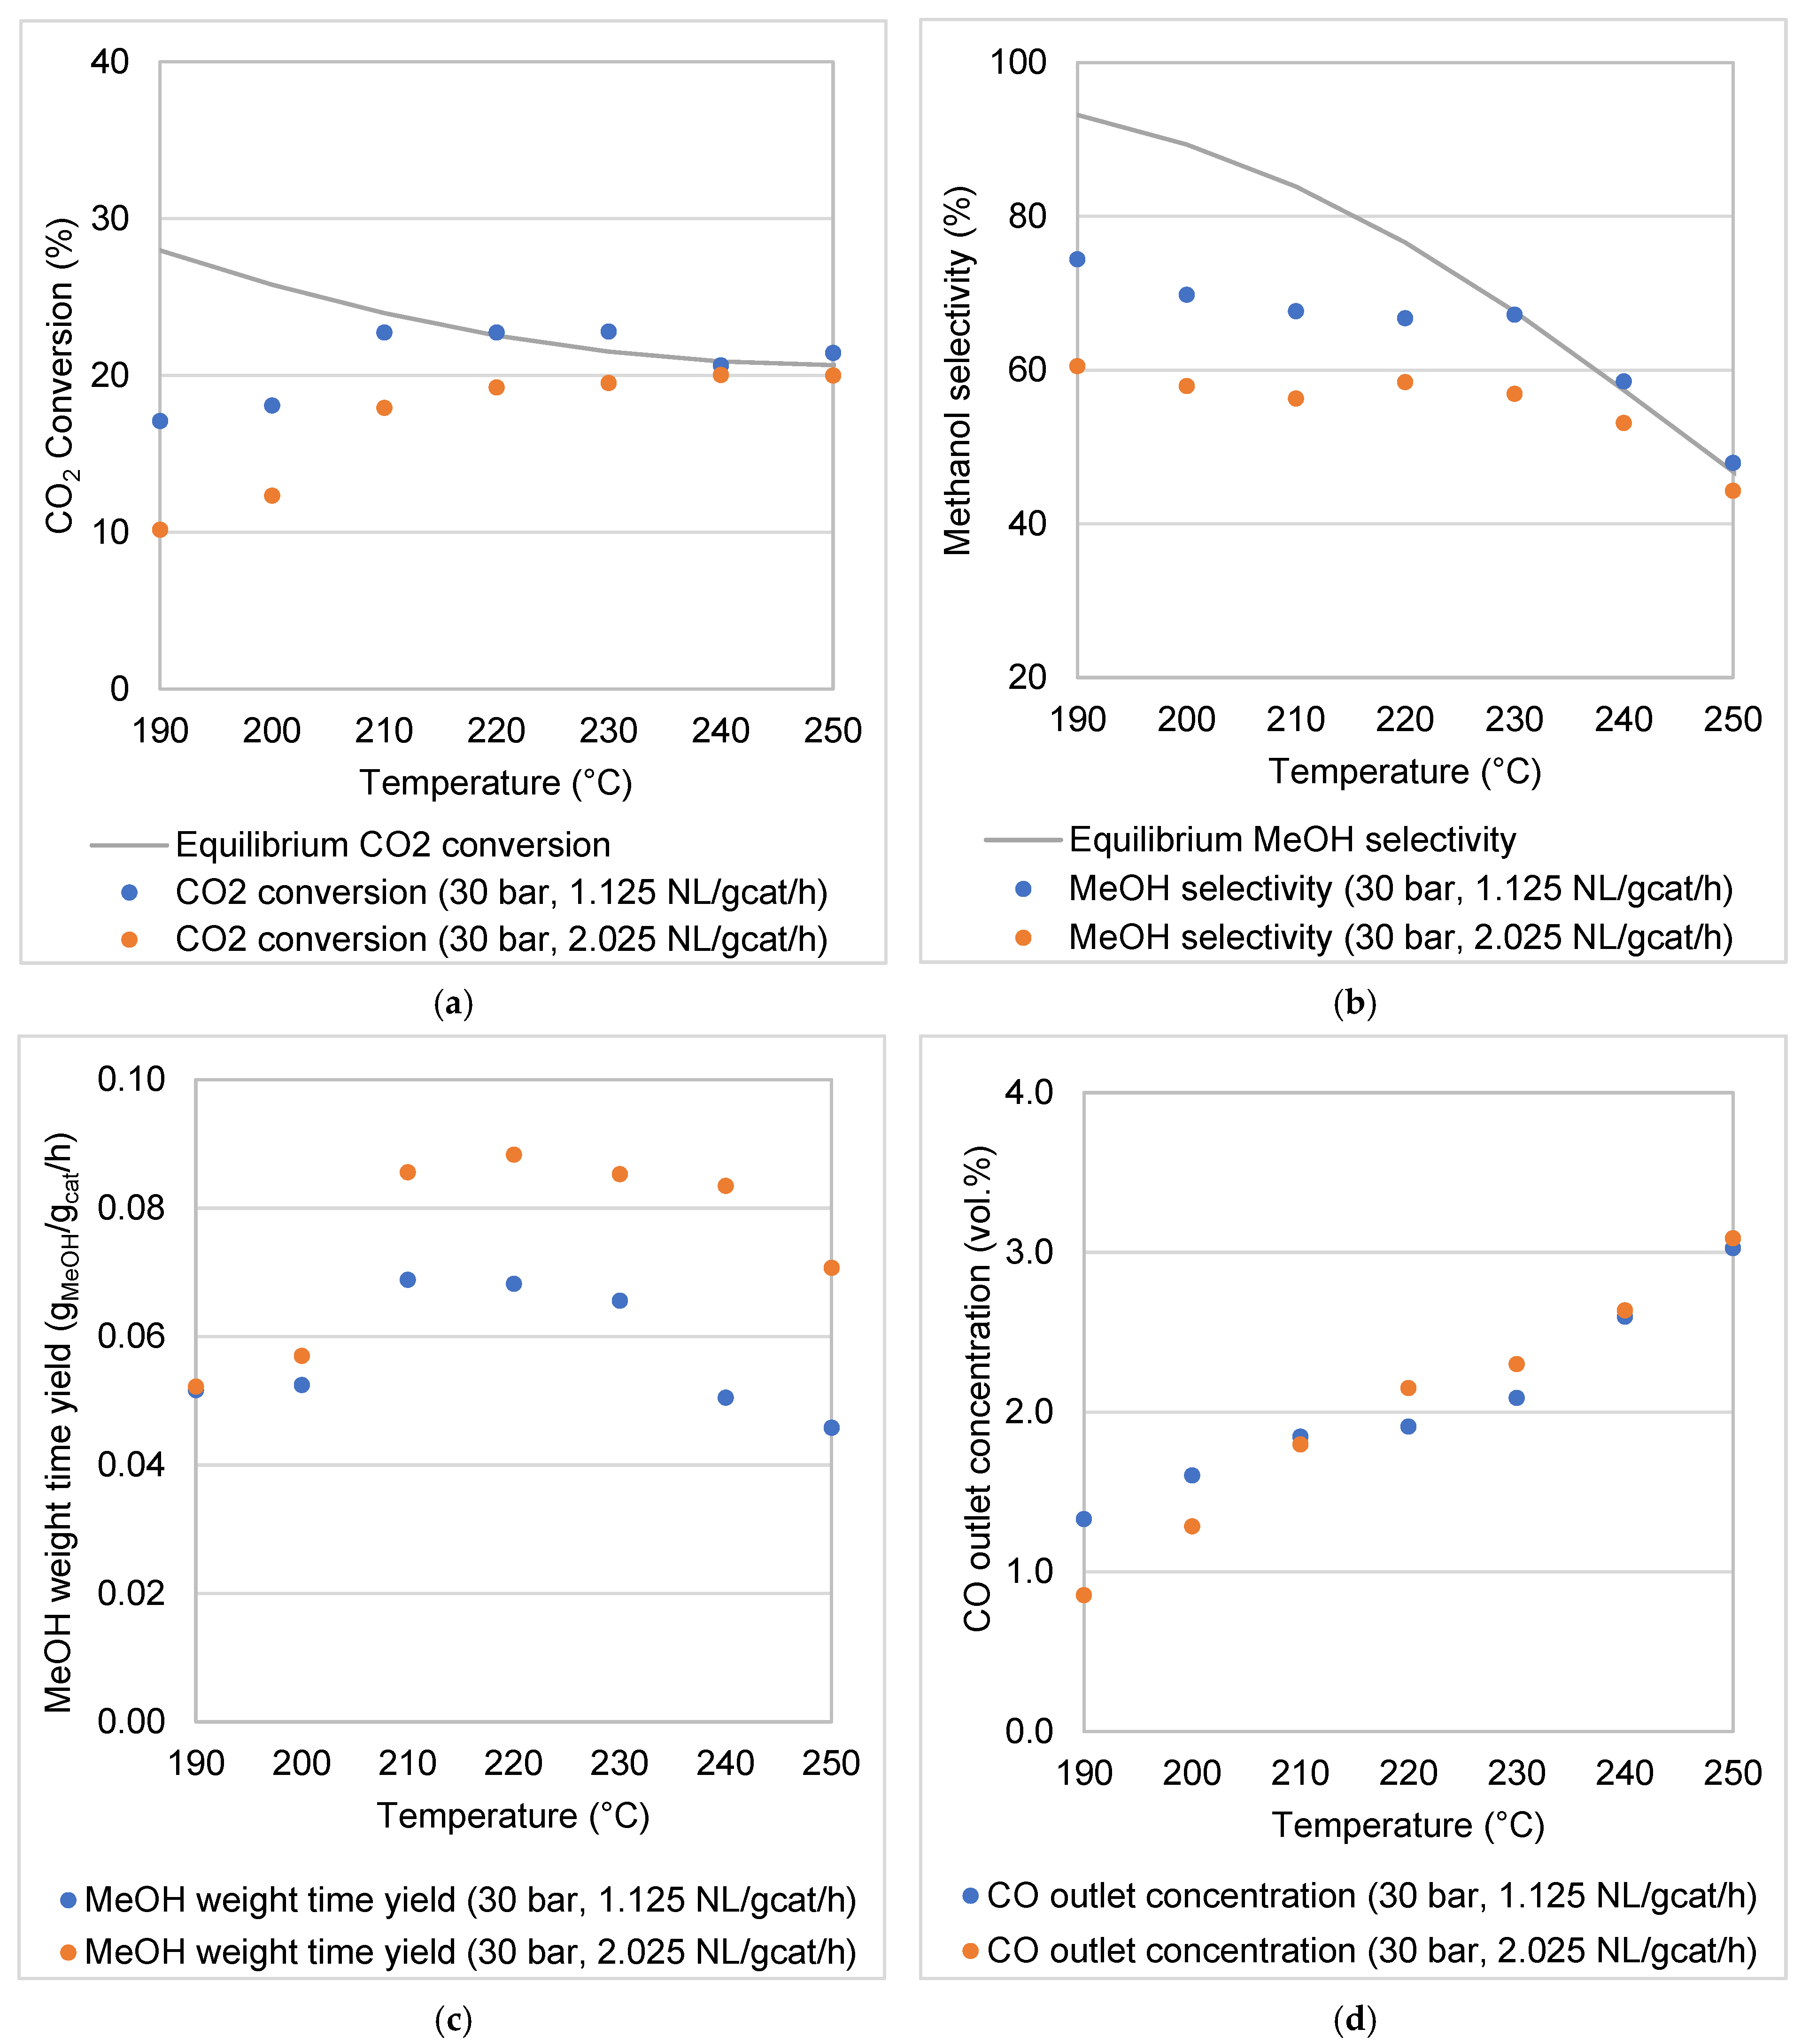
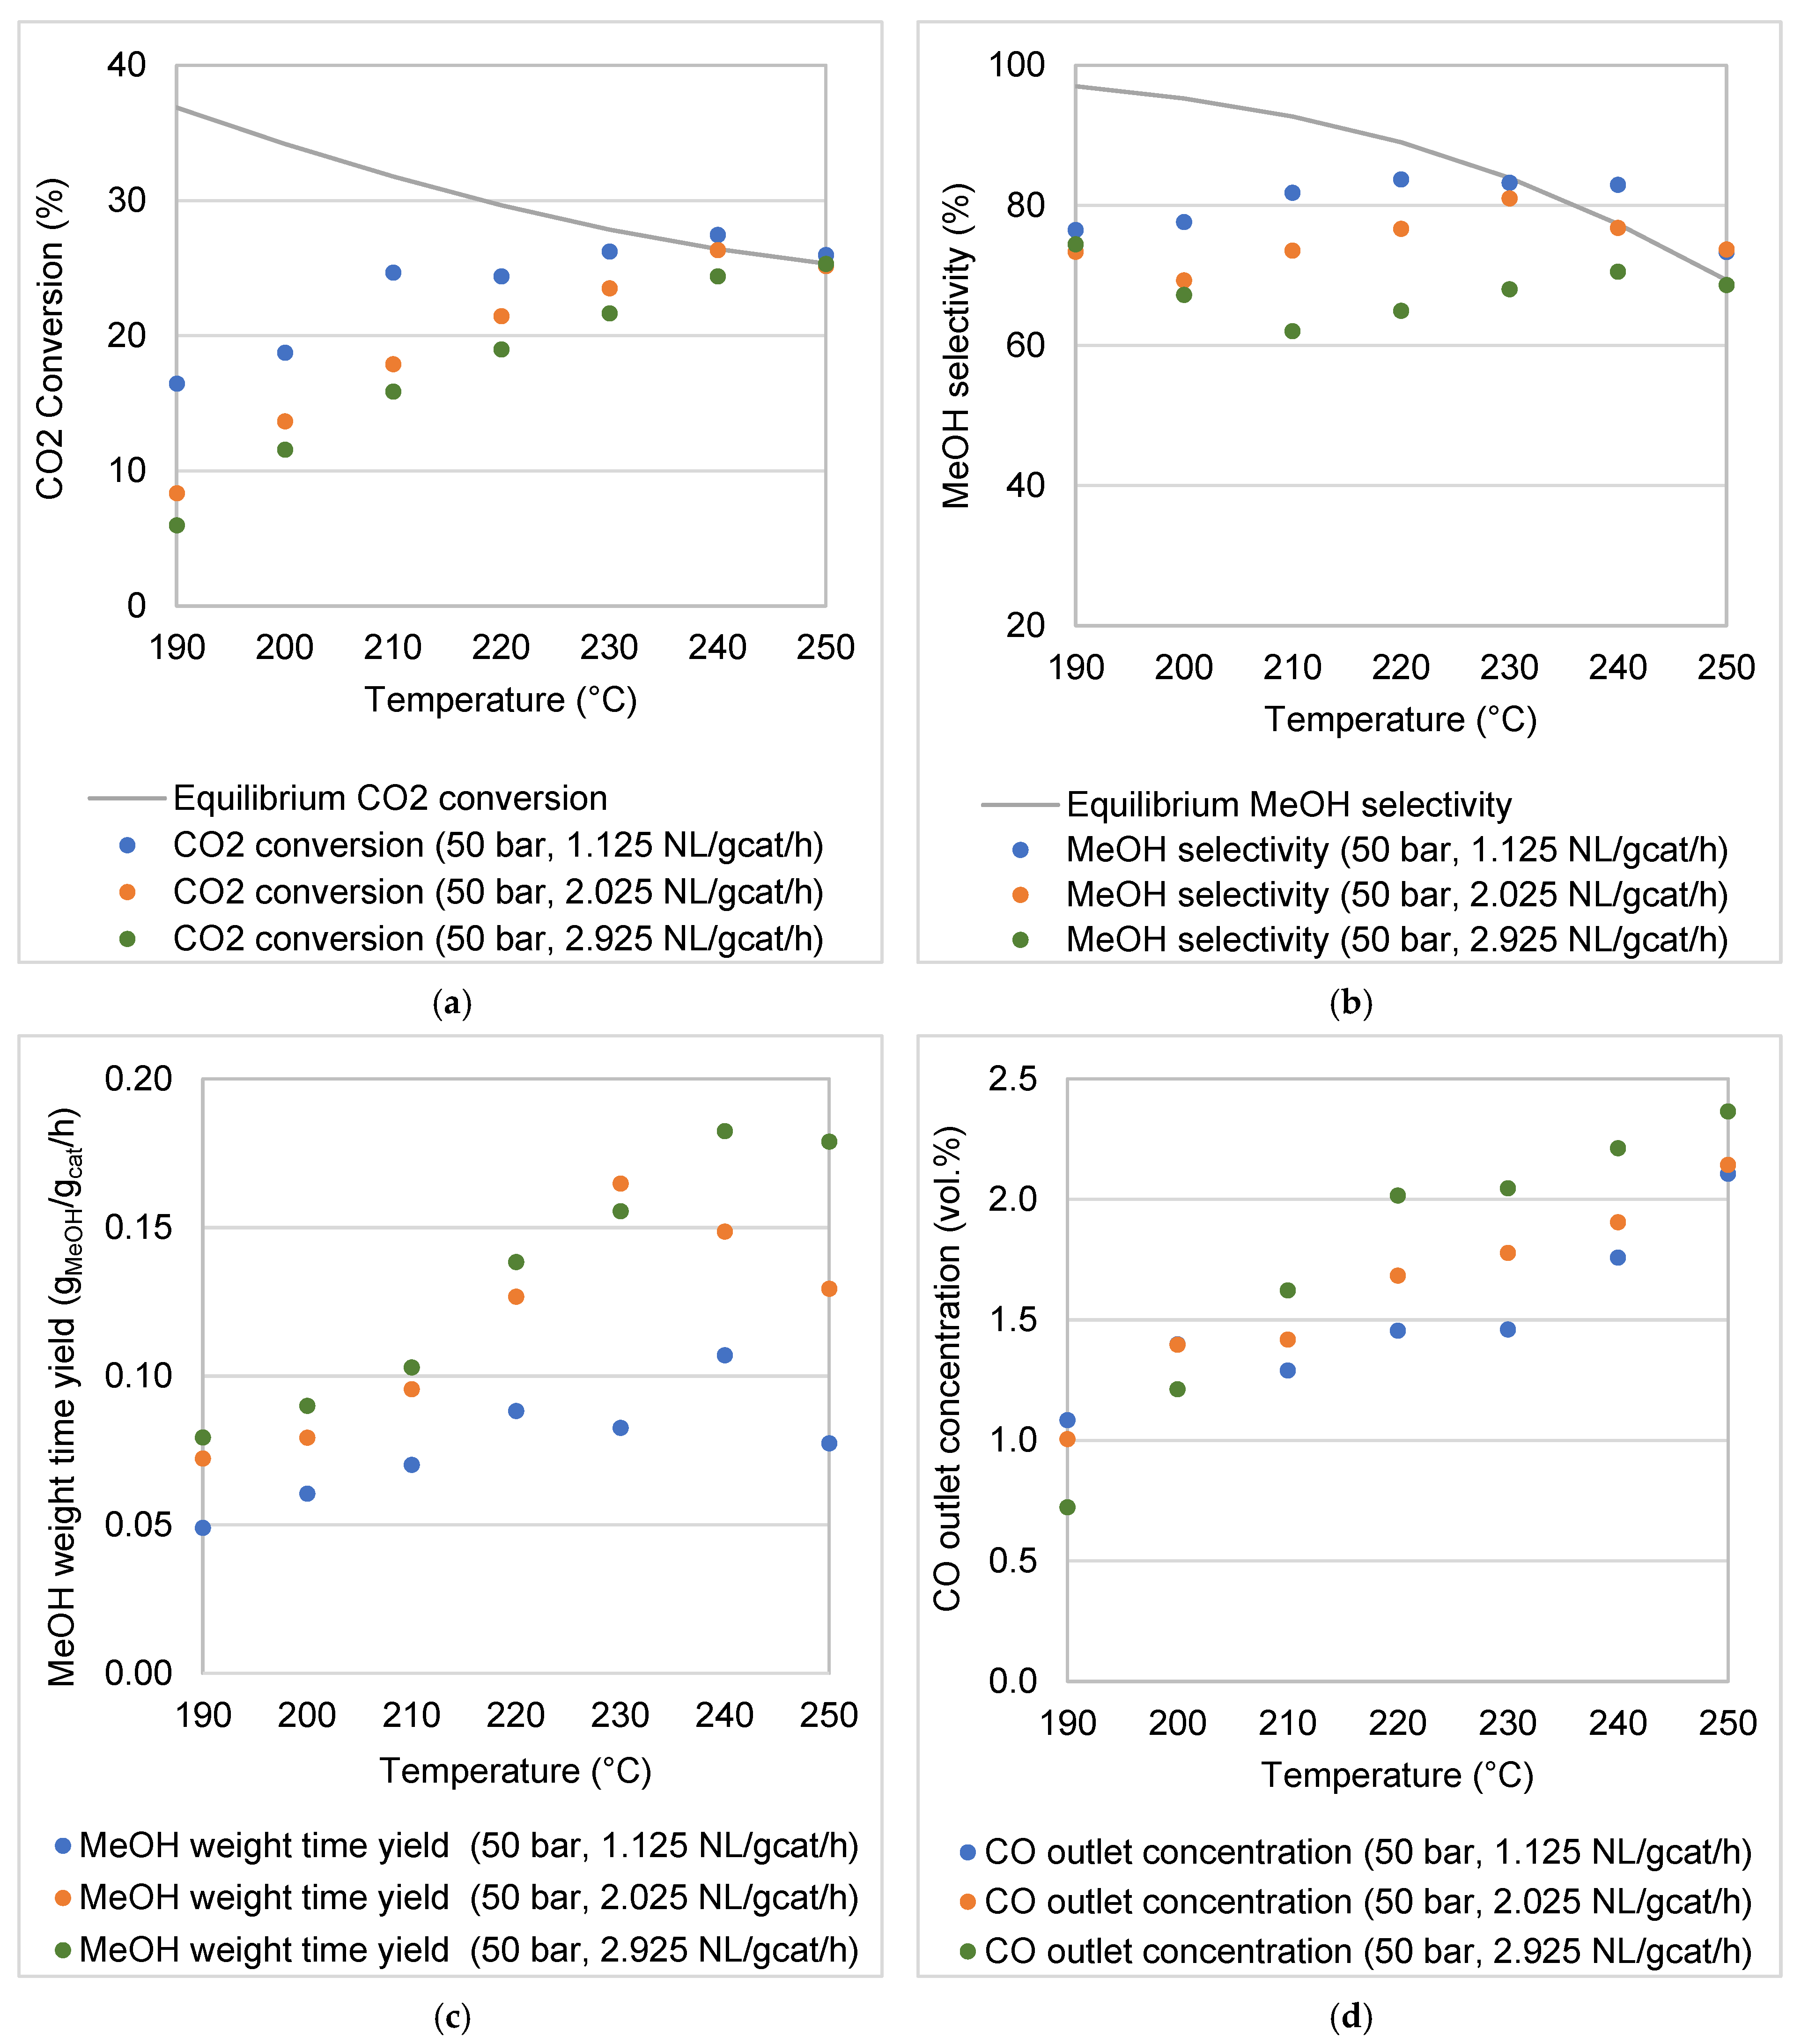
3.2.1. Effect of Reaction Temperature

CO2 hydrogenation is an exothermic reaction; it is favoured at low temperatures, as the equilibrium CO2 conversion curves show (Figure 7a and Figure 8a). The high stability of the CO2 molecule is evident in the magnitude of its enthalpy of formation (ΔHf-298K = –393.5 kJ mol−1) [13]. The CO2 conversion increased with an increase in the reaction temperature, from the low point of the temperature range (190 °C) until equilibrium CO2 conversions were reached. For example, at a pressure of 30 bar and a WHSV of 1.125 NL gcat−1 h−1, the CO2 conversion increased from 17.10% to 22.74% when the reaction temperature was increased from 190 to 220 °C. However, a further increase in the reaction temperature to 250 °C resulted in a decrease in the CO2 conversion to 21.44% due to thermodynamic constraints. It is obvious that the low temperature range is kinetically limited, with an increase in the reaction temperature resulting in a faster reaction rate (improved CO2 conversion), while in the higher temperature range, the CO2 conversions followed the decreasing trends of the thermodynamic equilibrium.
The molar ratio between MeOH and CO produced was not constant over the temperature range considered. This is confirmed by a variation in MeOH selectivity with temperature for both the reaction pressures investigated (Figure 7b and Figure 8b). Thermodynamic equilibrium data show that at low temperature the CO production via RWGS is less favoured than MeOH formation. Therefore, with sufficient residence time, it is possible to produce MeOH at low temperature, while minimising CO formation. For example, at both pressures (30 and 50 bar) and for a WHSV of 1.125 NL gcat−1 h−1, the highest selectivities were obtained below the reaction temperature of 230 °C.
At higher WHSV, especially at a pressure of 50 bar, it is interesting to note the initial decreasing trend in MeOH selectivity below 210 °C, which is then reversed as the temperature increases up to the point at which equilibrium selectivity is reached. CO formation via RWGS has a higher activation energy than CO2 hydrogenation to MeOH (110–135 and 38–77 kJ mol−1, respectively [44]) and it is thermodynamically favoured at higher temperatures (Equations (1) and (2)). This could result in higher MeOH/CO product ratios at 190–200 °C, which would first decrease with temperature (due to faster increase in CO formation [7]) before increasing with higher MeOH productivities from 210 to 230 °C. The subsequent decrease in MeOH selectivity from 230 to 250 °C is due to thermodynamic limitations of CO2 hydrogenation and a simultaneous increase in CO formation via RWGS. It is also possible that, to a lesser extent, increased water formation (Equations (1) and (2)) with higher reaction temperature inhibits the adsorption of CO2 on the catalyst surface [7], although experimental validation cannot be provided.
Unlike the formation of CO, the productivity of MeOH (MeOH WTY) follows the CO2 conversion trends (Figure 7c and Figure 8c). MeOH formation is also kinetically favoured as the reaction temperature increases, up to the point where thermodynamic limitations begin to dominate CO2 conversion. Of course, as a secondary carbon-containing product to MeOH, CO formation contributes to the overall CO2 conversion in a lesser fashion (Figure 7d and Figure 8d). In this study, it was observed that some CO formation took place due to the RWGS reaction under the reaction conditions investigated (Figure 7d and Figure 8d). The amount of CO in the product increased monotonously with reaction temperature. CO formation via RWGS has a higher dependency on increases in reaction temperature due to the RWGS reaction’s greater activation energy compared with that of MeOH formation [7,44]. The direct CO2-to-MeOH synthesis process is thus best carried out at moderate reaction temperatures (210–240 °C), which favour high MeOH turnover rates to achieve thermodynamic equilibrium, while suppressing undesired CO formation.

3.2.2. Effect of Weight Hourly Space Velocity

The WHSV is inversely proportional to the residence time of the gaseous reactants in the reactor. In Figure 7a,b and Figure 8a,b it is clear that a higher WHSV leads to decreased CO2 conversion and MeOH selectivity. For example, at 50 bar, with an increase in the WHSV from 1.125 to 2.925 NL gcat−1 h−1, the average CO2 conversion and MeOH selectivity decreased by almost 6% and 12%, respectively. The effects of the WHSV on CO2 conversions and MeOH selectivities are more noticeable in the temperature range 190–230 °C than at the higher temperatures of 240 and 250 °C (the equilibrium-controlled region).
Although increases in the WHSV lead to decreases in the CO2 conversion, the total throughput of the reactor increases, which then correlates with a higher MeOH WTY (Figure 7c and Figure 8c). At 50 bar, as the WHSV increased from 1.125 to 2.925 NL gcat−1 h−1, the average MeOH WTY increased by 73.41%. CO2 conversion and an increase in MeOH production rate have been observed to result from an increase in WHSV [7,37]. Despite the increase in MeOH WTY, the increase in WHSV resulted in a decrease in MeOH selectivity. Figure 7d and Figure 8d show CO outlet concentrations either remaining nearly constant or increasing at higher space velocities. The MeOH selectivity depends on the ratio between the flow rates of CO and MeOH at the reactor outlet (Equation (5)). The relationship between the WHSV and the MeOH selectivity is not straightforward because of the unclear interplay between competing reactions (Equations (1) and (2)) at different reaction conditions. Previous studies show that increasing MeOH selectivities have been associated with increasing WHSV [45,46]. However, Ghosh et al. [37] observed a slight decrease in MeOH selectivity with a nearly threefold increase in WHSV. Bukhtiyarova et al. [7] found that the MeOH selectivity remained almost constant at temperatures of 200 °C and between 250–260 °C while increasing with a decrease in WHSV between 210 and 240 °C. In this case, the increase in selectivity with decreasing WHSV was attributed to the potential of steam—especially when formed in relatively large amount—to decrease CO formation via the water gas shift reaction [7]. Further investigation needs to be conducted in order to understand the impact of the reaction conditions on the kinetics of each of the reactions involved in the process.
It is important to note that the range of space velocities used in this investigation (1.125–2.925 NL gcat−1 h−1) is relatively low compared to similar works in the literature (Table 3). The reactor’s WHSV can be increased up to a certain point where differential operating conditions are reached, at which point the MeOH WTY will remain constant with further increases in the WHSV [7]. However, operation of the reactor at such high WHSVs is questionable, as the once-through conversion of gaseous substrates is very low and the associated operating costs are high. Therefore, a trade-off is required between a high MeOH WTY and the costs of separation and recycling the unreacted gas to the reactor to maintain a high overall CO2 conversion.
CO outlet concentrations were barely affected at 30 bar by the WHSV (Figure 7d), while slightly increasing with WHSV at 50 bar (Figure 8d). At the same pressures, the CO2 conversion and MeOH selectivity were observed to decrease when the WHSV was increased from 1.125 to 2.925 NL gcat−1 h−1 (Figure 8a,b), suggesting that the CO2 hydrogenation to MeOH is more susceptible to changes in the WHSV than the undesired RWGS reaction [7]. Generally, RWGS is known for being a catalytic reaction associated with millisecond contact time operation—thus emphasising the requirement for highly selective catalysts when CO2 hydrogenation is the objective.

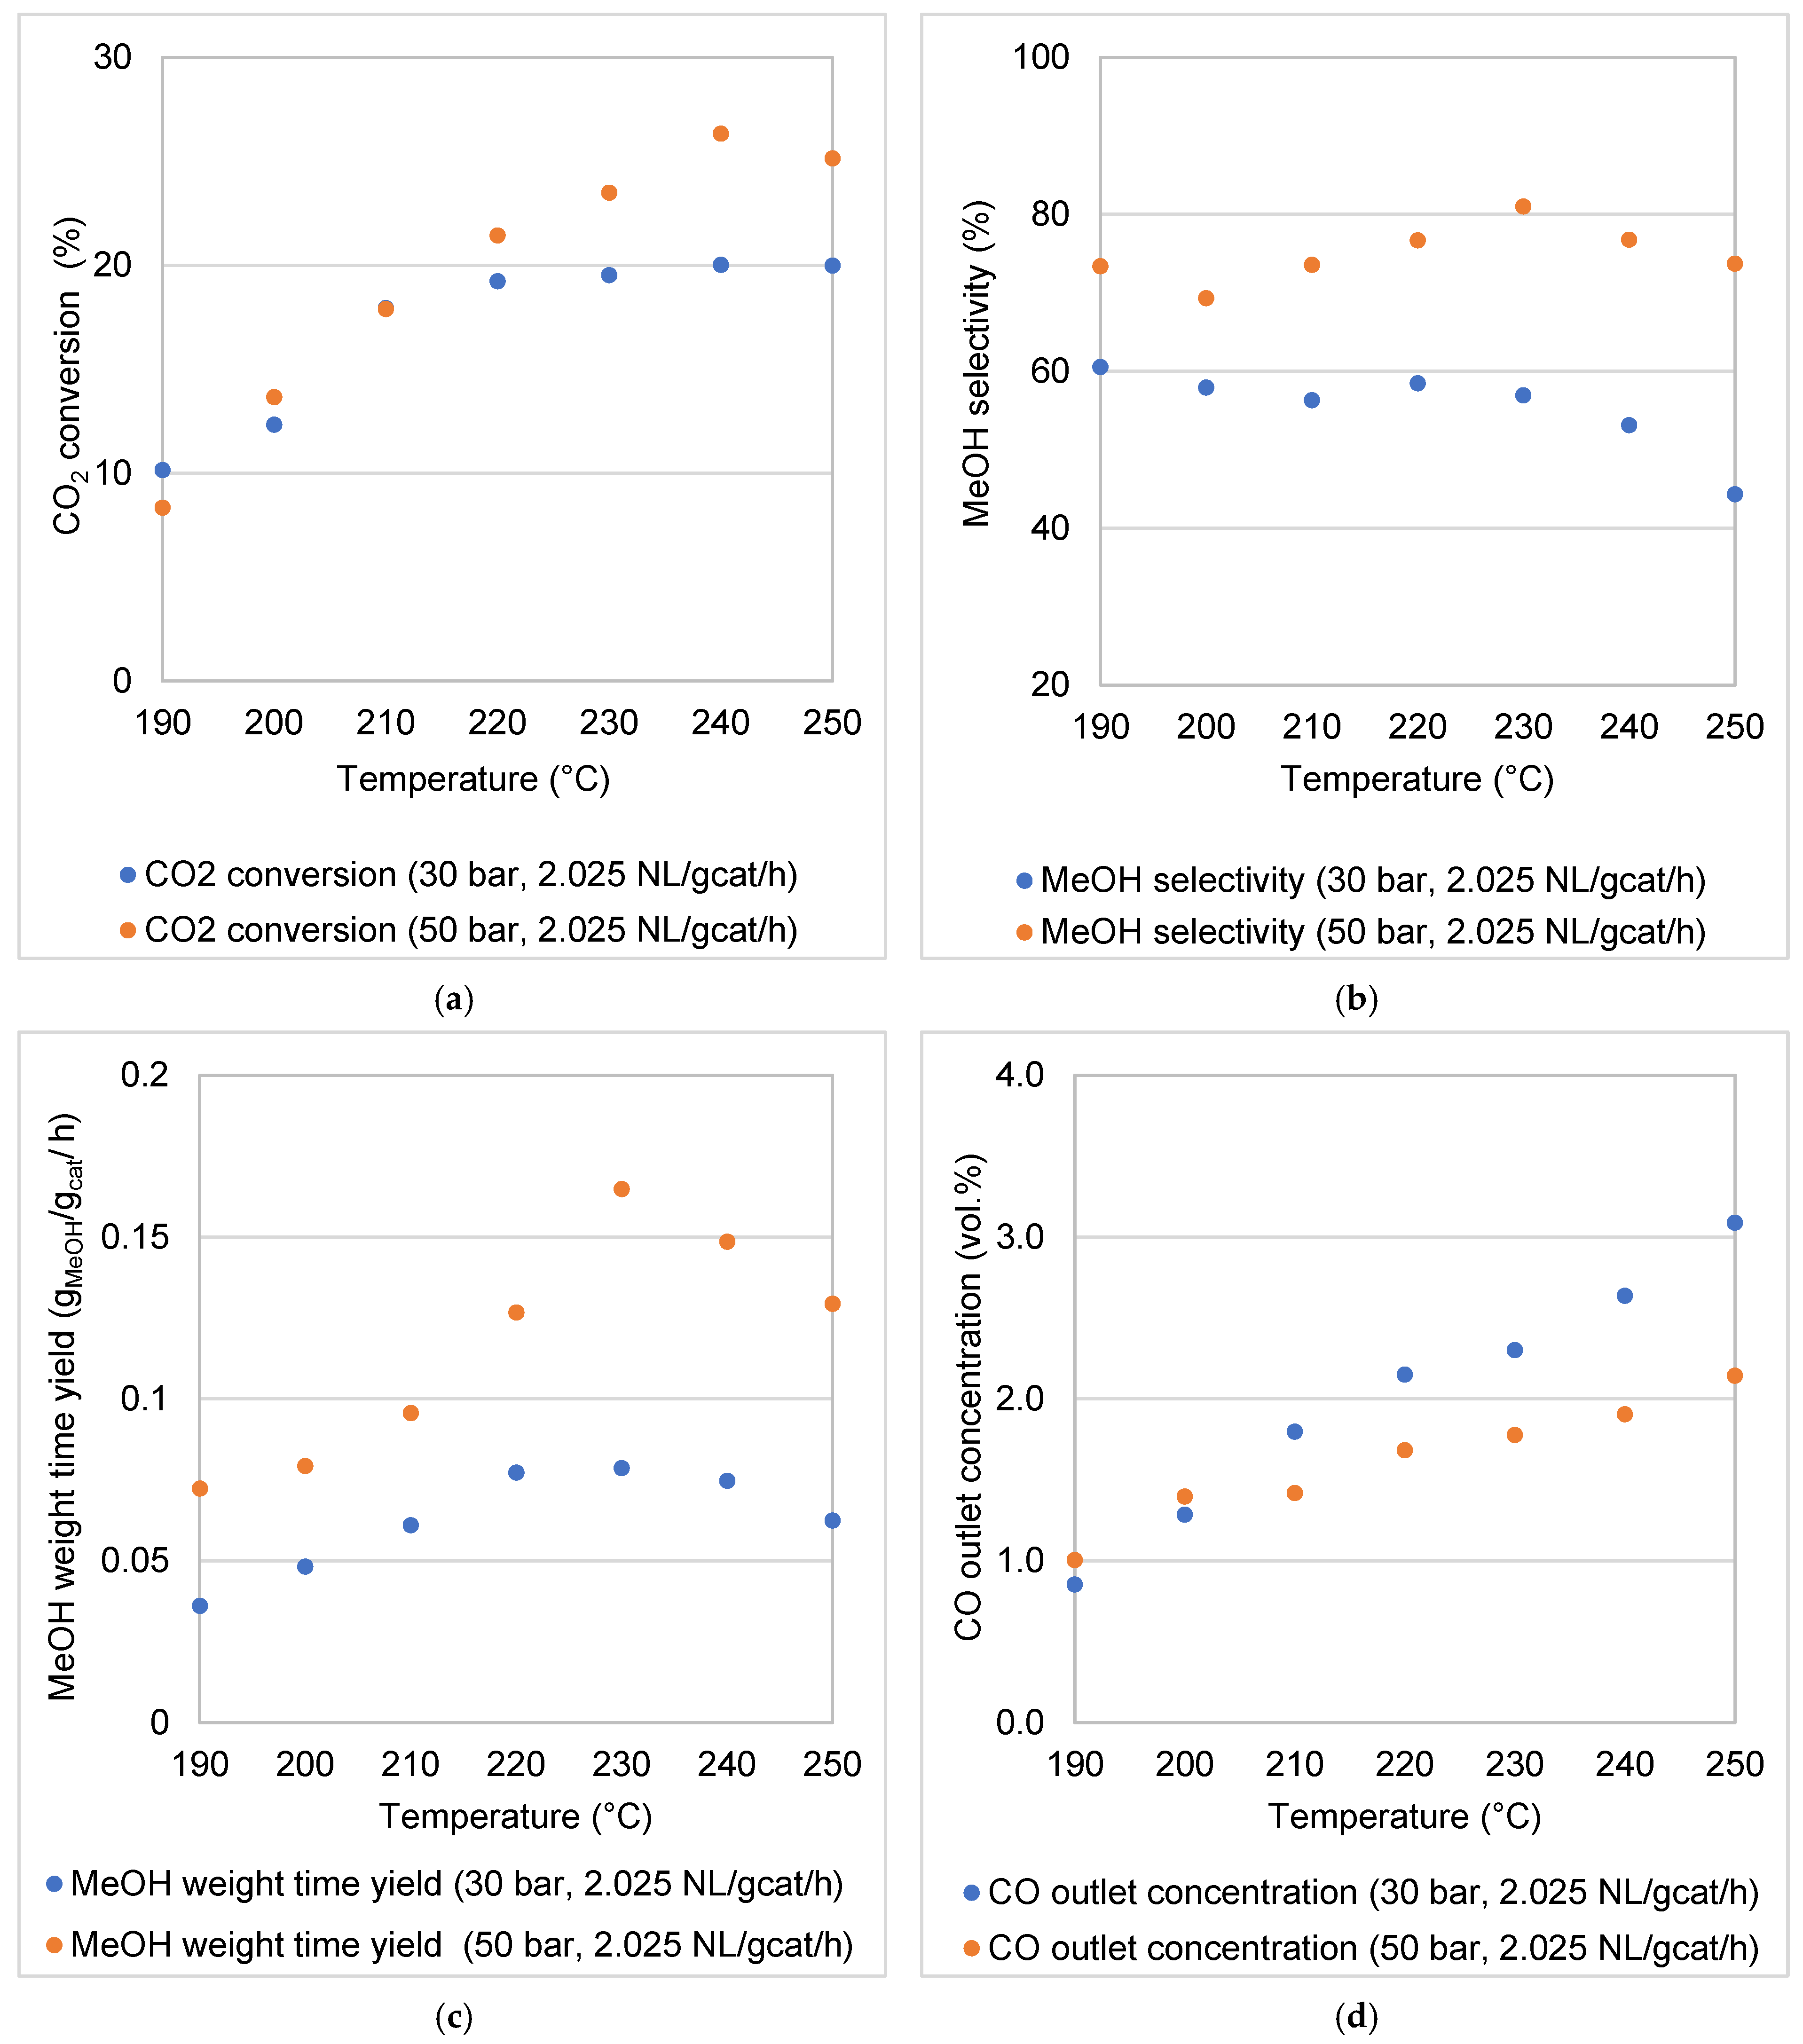
3.2.3. Effect of Reaction Pressure

The MeOH reactor performance is enhanced by a higher reaction pressure (Figure 7 and Figure 8). For example, CO2 conversions, MeOH selectivities and MeOH WTY at 240 °C and 1.125 NL gcat−1 h−1 were 27.46%, 82.97% and 0.11 gMeOH gcat−1 h−1, respectively, at 50 bar, compared to 20.65%, 58.56% and 0.05 gMeOH gcat−1 h−1 at 30 bar. According to Le Chatelier’s principle, increasing pressure (50 bar) favours a reaction that proceeds under volume contraction, as in the case in CO2 hydrogenation to MeOH (Equation (1)). In contrast, the RWGS reaction is favoured at the lower pressure condition (30 bar), although Equation (2) shows that no volume contraction or expansion takes place [47]. This can be deduced from Figure 7d and Figure 8d, which show higher CO outlet concentrations at 30 bar. Trifan et al. [6] also reported that lower reaction pressure assists the RWGS reaction, in comparison to the hydrogenation of CO2.
Furthermore, Le Chatelier’s principle applies to processes that tend towards thermodynamic equilibrium. It is interesting to note that the reaction pressure had a pronounced effect in the equilibrium-controlled region, compared to the kinetically controlled region (Figure 9). For example, at a WHSV of 2.025 NL gcat−1 h−1, the average CO2 conversions obtained at 190–210 °C were 13.31% and 13.48% (50 and 30 bar, respectively) while the average values obtained at 220–250 °C were 24.11% and 19.70% (50 and 30 bar, respectively). A similar trend was observed for the MeOH selectivity, WTY and CO outlet concentration. At higher temperatures, the formation of CO approaches the thermodynamic equilibrium, especially at the lower reaction pressure of 30 bar.

3.2.4. Measurement of the Reactor Temperature

Steady state was achieved within the first 5 min of each experiment. Figure 10a shows the reactor temperature measurement points. Throughout the reactor, the nearly isothermal conditions were attributed to rapid dissipation of the net heat of reaction. For all experiments, the maximum difference between the temperatures at the modules inlets (TI-1, TI-2 and TI-3) was 2 °C (Figure 10b). Temperature variation in the radial direction was negligible. The temperatures at levels TI-2 and TI-3 (points radially separated by 15 mm) were found to be nearly equal (maximum difference 1 °C) in all experiments conducted in this investigation. The difference between the reactor inlet and outlet temperatures (TI-1 and TI-4) was the highest recorded during all experiments (8–10 °C). This difference is due to the rapid heat loss at the outlet (TI-4). It was important to include a feed gas pre-heater at the reactor inlet, ensuring that the gas enters at the desired reaction temperature (TI-1), whereas no special arrangement was required at the reactor outlet.

4. Select Direct-CO2-to-Methanol Synthesis Experiments Reported in the Literature

Reported experimental data on the performance of Cu/ZnO/Al2O3 catalysts for direct CO2-to-MeOH synthesis in open literature are scarce. This synthesis route offers a unique advantage over the traditional syngas route as CO2 from polluting industries is used for the production of valuable chemicals (carbon recycling). H2 can be supplied from a non-fossil origin, such as by water electrolysis with renewable energy. Table 3 presents results reported in the literature for selected Cu/ZnO/Al2O3-catalysed systems and two metal foam reactors created in this study, as used for CO2 hydrogenation towards MeOH production, together with the reactor conditions. In all cases, a stoichiometric H2:CO2 ratio of 3:1 was used.
A comparison between the performance of the reactor used in this study and microreactors reported in the literature is not simple. Most investigations reported in the literature were conducted at high space velocities, justifying the high MeOH STY achieved. The high space velocities used also suggest that reactions were carried out with negligible mass transfer limitations. Nevertheless, the benefits of the bench-scale reactor include the once-through CO2 conversions close to equilibrium and high reactor productivity of nearly 15 and 30 gMeOH h−1 at 30 and 50 bar.
The present investigation is therefore considered a significant contribution in terms of achievable reactor performance with a bench-scale coated foam reactor, supporting a total mass of 160 g of commercial Cu/ZnO/Al2O3 catalyst. It demonstrates a direct CO2-to-MeOH synthesis process that is much closer to what can be expected of significantly larger reactors.

5. Conclusions

A coated Cu-foam reactor was evaluated experimentally for the direct CO2-to-MeOH synthesis process. Despite the low gravimetric surface area of the coated metal foam (0.0041 m2 g1), the reactor’s performance was satisfactory. The coated metal foam can enhance mass transport through tortuous mixing, providing limited gas diffusional resistance. The coated Cu foam supported nearly isothermal operations through rapid heat dissipation.
A critical evaluation of the reaction temperature, pressure and WHSV provided insight into the kinetic and thermodynamic operating regimes associated with CO2 hydrogenation towards MeOH production. Generally, the highest CO2 conversions and MeOH selectivities (up to 27.46% and 83.73%, respectively) were obtained at the highest pressure considered here, 50 bar. Increasing the WHSV resulted in an increase in MeOH yields (up to 0.18 gMeOH gcat−1 h−1) but a decrease in MeOH selectivities. The rate of the CO2 hydrogenation reaction increased with temperature, but it was limited by the thermodynamic equilibrium. CO formation, as a result of RWGS, also gradually increased with temperature. Noticeably high MeOH selectivities were obtained, especially at temperatures in the range 210–240 °C.
Future work could address a comparison of the performance of this foam-based reactor and that of a conventional reactor using the same catalyst at the same operation conditions. Further investigation could also study the feasibility of foam-based reactors, at least at a pilot scale—comparing reactor performance, and then considering investment and operating costs compared to conventional fixed beds for MeOH synthesis.

Supplementary Materials

The following supporting information can be downloaded at: https://www.mdpi.com/article/10.3390/chemengineering7020016/s1, Figure S1: SEM-EDS micrographs of the Cu/ZnO/Al2O3 catalyst; Figure S2: N2 adsorption/desorption profile on the Cu/ZnO/Al2O3 catalyst; Figure S3: XRD diffractogram of the Cu/ZnO/Al2O3; Figure S4: Micrographs generated from transmission-electron microscopy of the Cu/ZnO/Al2O3 catalyst; Figure S5: H2-TPR profile of the Cu/ZnO/Al2O3 catalyst. References [9,14,18,39,48,49,50] are cited in the Supplementary Materials.

Author Contributions

Conceptualization, N.E., R.C.E. and D.B.; data curation, K.C.M. and N.E.; formal analysis, K.C.M., P.M., R.C.E. and N.E.; funding acquisition, D.B.; investigation, K.C.M.; methodology, K.C.M., R.C.E. and N.E.; project administration, K.C.M., R.C.E., P.M. and N.E.; resources, G.K., R.Z., C.H., N.E. and D.B.; supervision, N.E., R.C.E., P.M. and D.B.; writing—original draft, K.C.M.; writing—review and editing, N.E., P.M., R.C.E., G.K., R.Z. and C.H. All authors have read and agreed to the published version of the manuscript.

Funding

This research was funded by the Department of Science and Innovation (DSI), HySA Infrastructure Centre of Competence in South Africa [KP5 program].

Data Availability Statement

Not applicable.

Acknowledgments

The authors also express their gratitude to René Bekker, Innocent Shuro and Gregory Okolo (North-West University), Rémy Bucher (iThemba LABS, NRF), Anton Du Plessis, Muofhe Tshibalanganda and Carlyn Wells (CAF, Stellenbosch University) for their assistance in the analysis of our liquid products and characterization of our catalyst and metal foam samples.

Conflicts of Interest

The authors declare no conflict of interest.

Nomenclature

The following abbreviations are used in the manuscript:
EDSEnergy dispersive X-ray spectroscopy
FBRFixed-bed reactor
IDInternal diameter, mm
NLNormal litre
ODOutside diameter, mm
PPIPores per inch
RWGSReverse water gas shift
SEMScanning electron microscopy
vol.Volume
WHSVWeight hourly space velocity, NL gcat−1 h−1
WTYWeight time yield, gMeOH gcat−1 h−1
The following symbols are used in the manuscript:
mMass, g
n i Molar flow rate of component i, mol h−1
NijNumber of moles of component i in reaction j
S i Selectivity of component i, %
X i Conversion of component i, %
TReaction temperature, °C
The following subscripts are used in the manuscript:
inReactor inlet
outReactor outlet

References

  1. Lee, B.; Lee, H.; Lim, D.; Brigljević, B.; Cho, W.; Cho, H.S.; Kim, C.H.; Lim, H. Renewable methanol synthesis from renewable H2 and captured CO2: How can power-to-liquid technology be economically feasible? Appl. Energy 2020, 279, 115827. [Google Scholar] [CrossRef]
  2. Ruland, H.; Song, H.; Laudenschleger, D.; Stürmer, S.; Schmidt, S.; He, J.; Kähler, K.; Muhler, M.; Schlögl, R. CO2 hydrogenation with Cu/ZnO/Al2O3: A benchmark study. ChemCatChem 2020, 12, 3216–3222. [Google Scholar] [CrossRef]
  3. Engelbrecht, N.; Everson, R.C.; Bessarabov, D.; Kolb, G. Microchannel reactor heat-exchangers: A review of design strategies for the effective thermal coupling of gas phase reactions. Chem. Eng. Process. Process Intensif. 2020, 157, 108164. [Google Scholar] [CrossRef]
  4. Chiuta, S.; Engelbrecht, N.; Human, G.; Bessarabov, D.G. Techno-economic assessment of power-to-methane and power-to-syngas business models for sustainable carbon dioxide utilization in coal-to-liquid facilities. Biochem. Pharmacol. 2016, 16, 399–411. [Google Scholar] [CrossRef]
  5. Methanol Institute. The Methanol Industry. Available online: https://www.methanol.org/the-methanol-industry (accessed on 21 January 2022).
  6. Trifan, B.; Lasobras, J.; Soler, J.; Herguido, J.; Menéndez, M. Modifications in the composition of CuO/ZnO/Al2O3 catalyst for the synthesis of methanol by CO2 hydrogenation. Catalysts 2021, 11, 774. [Google Scholar] [CrossRef]
  7. Bukhtiyarova, M.; Lunkenbein, T.; Kähler, K.; Schlögl, R. Methanol synthesis from industrial CO2 sources: A contribution to chemical energy conversion. Catal. Lett. 2017, 147, 416–427. [Google Scholar] [CrossRef] [Green Version]
  8. Dang, S.; Yang, H.; Gao, P.; Wang, H.; Li, X.; Wei, W. A review of research progress on heterogeneous catalysts for methanol synthesis from carbon dioxide hydrogenation. Catal. Today 2019, 330, 61–75. [Google Scholar] [CrossRef]
  9. Kasatkin, I.; Kurr, P.; Kniep, B.; Trunschke, A.; Schlögl, R. Role of lattice strain and defects in copper particles on the activity of Cu/ZnO/Al2O3 catalysts for methanol synthesis. Angew. Chemie Int. Ed. 2007, 46, 7324–7327. [Google Scholar] [CrossRef] [Green Version]
  10. Nielsen, N.D.; Jensen, A.D.; Christensen, J.M. The roles of CO and CO2 in high pressure methanol synthesis over Cu-based catalysts. J. Catal. 2021, 393, 324–334. [Google Scholar] [CrossRef]
  11. Sun, J.T.; Metcalfe, I.S.; Sahibzada, M. Deactivation of Cu/ZnO/Al2O3 methanol synthesis catalyst by sintering. Ind. Eng. Chem. Res. 1999, 38, 3868–3872. [Google Scholar] [CrossRef]
  12. Huang, C.; Chen, S.; Fei, X.; Liu, D.; Zhang, Y. Catalytic hydrogenation of CO2 to methanol: Study of synergistic effect on adsorption properties of CO2 and H2 in CuO/ZnO/ZrO2 system. Catalysts 2015, 5, 1846–1861. [Google Scholar] [CrossRef] [Green Version]
  13. Wang, D.; Zhao, J.; Song, H.; Chou, L. Characterization and performance of Cu/ZnO/Al2O3 catalysts prepared via decomposition of M(Cu, Zn)-ammonia complexes under sub-atmospheric pressure for methanol synthesis from H2 and CO2. J. Nat. Gas Chem. 2011, 20, 629–634. [Google Scholar] [CrossRef]
  14. Dasireddy, V.D.B.C.; Likozar, B. The role of copper oxidation state in Cu/ZnO/Al2O3 catalysts in CO2 hydrogenation and methanol productivity. Renew. Energy 2019, 140, 452–460. [Google Scholar] [CrossRef]
  15. Qi, T.; Zhao, Y.; Chen, S.; Li, W.; Guo, X.; Zhang, Y.; Song, C. Bimetallic metal organic framework-templated synthesis of a Cu-ZnO/Al2O3 catalyst with superior methanol selectivity for CO2 hydrogenation. Mol. Catal. 2021, 514, 111870. [Google Scholar] [CrossRef]
  16. Tada, S.; Watanabe, F.; Kiyota, K.; Shimoda, N.; Hayashi, R.; Takahashi, M.; Nariyuki, A.; Igarashi, A.; Satokawa, S. Ag addition to CuO-ZrO2 catalysts promotes methanol synthesis via CO2 hydrogenation. J. Catal. 2017, 351, 107–118. [Google Scholar] [CrossRef]
  17. Ay, S.; Ozdemir, M.; Melikoglu, M. Effects of magnesium and chromium addition on stability, activity and structure of copper-based methanol synthesis catalysts. Int. J. Hydrog. Energy 2021, 46, 12857–12873. [Google Scholar] [CrossRef]
  18. Ay, S.; Ozdemir, M.; Melikoglu, M. Effects of metal promotion on the performance, catalytic activity, selectivity and deactivation rates of Cu/ZnO/Al2O3 catalysts for methanol synthesis. Chem. Eng. Res. Des. 2021, 175, 146–160. [Google Scholar] [CrossRef]
  19. Phongamwong, T.; Chantaprasertporn, U.; Witoon, T.; Numpilai, T.; Poo-arporn, Y.; Limphirat, W.; Donphai, W.; Dittanet, P.; Chareonpanich, M.; Limtrakul, J. CO2 hydrogenation to methanol over CuO–ZnO–ZrO2–SiO2 catalysts: Effects of SiO2 contents. Chem. Eng. J. 2017, 316, 692–703. [Google Scholar] [CrossRef]
  20. Li, C.; Yuan, X.; Fujimoto, K. Development of highly stable catalyst for methanol synthesis from carbon dioxide. Appl. Catal. A Gen. 2014, 469, 306–311. [Google Scholar] [CrossRef]
  21. Montebelli, A.; Visconti, C.G.; Groppi, G.; Tronconi, E.; Kohler, S.; Venvik, H.J.; Myrstad, R. Washcoating and chemical testing of a commercial Cu/ZnO/Al2O3 catalyst for the methanol synthesis over copper open-cell foams. Appl. Catal. A Gen. 2014, 481, 96–103. [Google Scholar] [CrossRef]
  22. Kapteijn, F.; Moulijn, J.A. Structured catalysts and reactors—Perspectives for demanding applications. Catal. Today 2022, 383, 5–14. [Google Scholar] [CrossRef]
  23. Balzarotti, R.; Ambrosetti, M.; Beretta, A.; Groppi, G.; Tronconi, E. Investigation of packed conductive foams as a novel reactor configuration for methane steam reforming. Chem. Eng. J. 2020, 391, 123494. [Google Scholar] [CrossRef]
  24. Porsin, A.V.; Kulikov, A.V.; Rogozhnikov, V.N.; Serkova, A.N.; Salanov, A.N.; Shefer, K.I. Structured reactors on a metal mesh catalyst for various applications. Catal. 2016, 273, 213–220. [Google Scholar] [CrossRef]
  25. Razza, S.; Heidig, T.; Bianchi, E.; Groppi, G.; Schwieger, W.; Tronconi, E. Heat transfer performance of structured catalytic reactors packed with metal foam supports: Influence of wall coupling. Catal. Today 2016, 273, 187–195. [Google Scholar] [CrossRef]
  26. Giani, L.; Groppi, G.; Tronconi, E. Mass-transfer characterization of metallic foams as supports for structured catalysts. Ind. Eng. Chem. Res. 2005, 44, 4993–5002. [Google Scholar] [CrossRef]
  27. Kolaczkowski, S.T.; Awdry, S.; Smith, T.; Thomas, D.; Torkuhl, L.; Kolvenbach, R. Potential for metal foams to act as structured catalyst supports in fixed-bed reactors. Catal. Today 2016, 273, 221–233. [Google Scholar] [CrossRef]
  28. Gancarczyk, A.; Sindera, K.; Iwaniszyn, M.; Piatek, M.; Wojciech, M.; Jodlowski, P.; Wronski, S.; Sitarz, M.; Lojewska, J.; Kolodziej, A. Metal foams as novel catalyst support in environmental processes. Catalysts 2019, 9, 587. [Google Scholar] [CrossRef] [Green Version]
  29. Badakhsh, A.; Kwak, Y.; Lee, Y.J.; Jeong, H.; Kim, Y.; Sohn, H.; Nam, S.W.; Yoon, C.W.; Park, C.W.; Jo, Y.S. A compact catalytic foam reactor for decomposition of ammonia by the joule-heating mechanism. Chem. Eng. J. 2021, 426, 130802. [Google Scholar] [CrossRef]
  30. Aguirre, A.; Chandra, V.; Peters, E.A.J.F.; Kuipers, J.A.M.; Neira D’Angelo, M.F. Open-cell foams as catalysts support: A systematic analysis of the mass transfer limitations. Chem. Eng. J. 2020, 393, 124656. [Google Scholar] [CrossRef]
  31. Wang, Y.; Hong, Z.; Mei, D. A thermally autonomous methanol steam reforming microreactor with porous copper foam as catalyst support for hydrogen production. Int. J. Hydrog. Energy 2021, 46, 6734. [Google Scholar] [CrossRef]
  32. Zhou, W.; Ke, Y.; Wang, Q.; Wan, S.; Lin, J.; Zhang, J.; Hui, K.S. Development of cylindrical laminated methanol steam reforming microreactor with cascading metal foams as catalyst support. Fuel 2017, 191, 46–53. [Google Scholar] [CrossRef]
  33. Yu, H.; Chen, H.; Pan, M.; Tang, Y.; Zeng, K.; Peng, F.; Wang, H. Effect of the metal foam materials on the performance of methanol steam micro-reformer for fuel cells. Appl. Catal. A Gen. 2007, 327, 106–113. [Google Scholar] [CrossRef]
  34. European Union. PED 2014/68/EU European Union pressure equipment directive. Off. J. Eur. Union 2014, 189, 164–259. Available online: http://data.europa.eu/eli/dir/2014/68/oj (accessed on 28 March 2022).
  35. O’Connell, M.; Kolb, G.; Schelhaas, K.P.; Wichert, M.; Tiemann, D.; Pennemann, H.; Zapf, R. Towards mass production of microstructured fuel processors for application in future distributed energy generation systems: A review of recent progress at IMM. Chem. Eng. Res. Des. 2012, 90, 11–18. [Google Scholar] [CrossRef]
  36. Du Plessis, A.; le Roux, S.G.; Guelpa, A. The CT scanner facility at Stellenbosch University: An open access X-ray computed tomography laboratory. Nucl. Instruments Methods Phys. Res. Sect. B Beam Interact. Mater. Atoms 2016, 384, 42–49. [Google Scholar] [CrossRef] [Green Version]
  37. Ghosh, S.; Sebastian, J.; Olsson, L.; Creaser, D. Experimental and kinetic modeling studies of methanol synthesis from CO2 hydrogenation using In2O3 catalyst. Chem. Eng. J. 2021, 416, 129120. [Google Scholar] [CrossRef]
  38. Shi, C.; Elgarni, M.; Mahinpey, N. Process design and simulation study: CO2 utilization through mixed reforming of methane for methanol synthesis. Chem. Eng. Sci. 2021, 233, 116364. [Google Scholar] [CrossRef]
  39. Ambrosetti, M.; Balzarotti, R.; Cristiani, C.; Groppi, G.; Tronconi, E. The influence of the washcoat deposition process on high pore density open cell foams activation for CO catalytic combustion. Catalysts 2018, 8, 510. [Google Scholar] [CrossRef] [Green Version]
  40. Twigg, M.V.; Richardson, J.T. Theory and applications of ceramic foam catalysts. Chem. Eng. Res. Des. 2002, 80, 183–189. [Google Scholar] [CrossRef]
  41. Bianco, N.; Iasiello, M.; Mauro, G.M.; Pagano, L. Multi-objective optimization of finned metal foam heat sinks: Tradeoff between heat transfer and pressure drop. Appl. Therm. Eng. 2021, 182, 116058. [Google Scholar] [CrossRef]
  42. Inayat, A.; Freund, H.; Zeiser, T.; Schwieger, W. Determining the specific surface area of ceramic foams: The tetrakaidecahedra model revisited. Chem. Eng. Sci. 2011, 66, 1179–1188. [Google Scholar] [CrossRef]
  43. Walther, G.; Gaitzsch, U.; Büttner, T.; Kieback, B.; Weißgärber, T.; Kolvenbach, R.; Lincke, M. Applications of Metal Foam as Catalyst Carrier. 2017. Available online: https://www.researchgate.net/profile/Bernd-Kieback/publication/325343745_Applications_of_Metal_Foam_as_Catalyst_Carrier/links/5b06cc3ba6fdcc8c2523c290/Applications-of-Metal-Foam-as-Catalyst-Carrier.pdf (accessed on 28 March 2022).
  44. Jun, K.W.; Shen, W.J.; Rama Rao, K.S.; Lee, K.W. Residual sodium effect on the catalytic activity of Cu/ZnO/Al2O3 in methanol synthesis from CO2 hydrogenation. Appl. Catal. A Gen. 1998, 174, 231–238. [Google Scholar] [CrossRef]
  45. Bonura, G.; Cordaro, M.; Cannilla, C.; Arena, F.; Frusteri, F. The changing nature of the active site of Cu-Zn-Zr catalysts for the CO2 hydrogenation reaction to methanol. Appl. Catal. B Environ. 2014, 152–153, 152–161. [Google Scholar] [CrossRef]
  46. Lee, J.S.; Lee, K.H.; Lee, S.Y.; Kim, Y.G. A comparative study of methanol synthesis from CO2/H2 and CO/H2 over a Cu/ZnO/Al2O3 catalyst. J. Catal. 1993, 144, 414–424. [Google Scholar] [CrossRef]
  47. Sahki, R.; Benlounes, O.; Chérifi, O.; Thouvenot, R.; Bettahar, M.M.; Hocine, S. Effect of pressure on the mechanisms of the CO2/H2 reaction on a CO-precipitated CuO/ZnO/Al2O3 catalyst. React. Kinet. Mech. Catal. 2011, 103, 391–403. [Google Scholar] [CrossRef] [Green Version]
  48. Zhao, F.; Gong, M.; Cao, K.; Zhang, Y.; Li, J.; Chen, R. Atomic layer deposition of Ni on Cu nanoparticles for methanol synthesis from CO2 hydrogenation. ChemCatChem 2017, 9, 3772–3778. [Google Scholar] [CrossRef]
  49. Azizan, T.M.; Ahmad, K.; Husainni, M.; Ameen, M. Thermodynamic equilibrium analysis of triolein hydrodeoxygenation for green diesel production. Procedia Eng. 2016, 148, 1369–1376. [Google Scholar] [CrossRef] [Green Version]
  50. Lwin, Y. Chemical Equilibrium by Gibbs Energy Minimization on Spreadsheets. Int. J. Eng. 2000, 16, 335–339. Available online: https://www.ijee.ie/articles/Vol16-4/Ijee1157.pdf (accessed on 9 February 2022).
Figure 1. PID diagram of the set-up used in the direct CO2-to-MeOH synthesis process. (BPR: back pressure regulator; C: condenser, CF: auto-draining coalescing filter; CV: check valve; GC; gas chromatograph; FI: flow indicator; H: temperature-controlled heater; HJ: heating jacket; MFCV: mass flow control valve; NV: needle valve; PC: computer; PI: pressure indicator; QTV: quarter-turn valve; R: reactor; TI: temperature indicator).
Chemengineering 07 00016 g001
Figure 2. Illustration of (a) the longitudinal section a single reactor module and (b) CO2 flow simulation results (boundary conditions: WHSV = 2.925 NL g h−1, Pressure = 50 bar, Temperature = 250 °C).
Chemengineering 07 00016 g002
Figure 3. (a) The reactor with its two modules. (b) Schematic depicting of the foam arrangement and radially and axially spaced thermocouple ports.
Chemengineering 07 00016 g003
Figure 4. Images of Cu foams at different processing steps: (a) original Cu foam; (b) Cu foam after cleaning and annealing and (c) Cu foam after washcoating with the commercial Cu/ZnO/Al2O3 catalyst.
Chemengineering 07 00016 g004
Figure 5. Images obtained through computed tomography, illustrating the strut diameters of (a) the uncoated Cu foam, (b) the Cu foam coated with Cu/ZnO/Al2O3 and (c) a cross-section of the coated foam with the distribution of the catalyst.
Chemengineering 07 00016 g005
Figure 6. SEM micrographs and EDS spectra of samples: (a) uncoated Cu foam and (b) Cu foam coated with Cu/ZnO/Al2O3 catalyst.
Chemengineering 07 00016 g006aChemengineering 07 00016 g006b
Figure 7. Experimental results of the coated foam reactor at 30 bar and temperatures of 190–250 °C: (a) CO2 conversion, (b) MeOH selectivity, (c) MeOH weight time yield and (d) CO outlet concentration.
Chemengineering 07 00016 g007
Figure 8. Experimental results for the coated foam reactor at 50 bar and temperatures of 190–250 °C: (a) CO2 conversion, (b) MeOH selectivity, (c) MeOH weight time yield and (d) CO outlet concentration.
Chemengineering 07 00016 g008
Figure 9. Effect of operating pressure on (a) CO2 conversion, (b) MeOH selectivity, (c) MeOH WTY and (d) CO outlet concentration at temperatures of 190–250 °C and a WHSV of 2.025 NL gcat−1 h−1.
Chemengineering 07 00016 g009
Figure 10. (a) Reactor temperature measurement points. (b) Temperature profiles at the selected measurement points at 240 °C, 50 bar and WHSV 2.925 NL gcat−1 h−1.
Chemengineering 07 00016 g010
Table 1. Experimental design for the direct CO2-to-MeOH synthesis process in a foam-based reactor.
Operating ParameterRange
Temperature (°C)190–250 (in increments of 10 °C)
Operating pressure (bar)30 and 50
WHSV (NL gcat−1 h−1)1.125, 2.025 and 2.925
Table 2. Geometrical characteristics of the uncoated and coated foam samples.
CharacteristicUncoated Foam SampleCoated Foam Sample
Average pore diameter (mm)1.611.46
Average strut diameter (mm)0.180.34
Gravimetric surface area (m2 g−1)0.00340.0041
Open porosity (%)89.6081.60
Relative density (kg m−3)426.25551.35
Surface area to volume ratio (m2 m−3)1827.22178.1
Table 3. Performances of the bench-scale reactor used in this investigation and that of small-scale Cu/ZnO/Al2O3-catalysed systems reported in the literature.
ReactorCatalyst ConfigurationExperimental ConditionsCO2 Conversion (%)MeOH Selectivity (%)MeOH WTY (gMeOH gcat −1 h−1)Ref.
FBR (ID: 10.2 mm)Catalyst powder diluted in SiO2Catalyst mass: 0.5 g
Temperature: 230 °C
Pressure: 30 bar
WHSV: 7.2 NL gcat−1 h−1
19.3054.700.15 **[4]
FBR (ID: 15 mm; catalyst length: 0.28 cm)Catalyst powder diluted in SiO2Catalyst mass *: 0.65 g
Temperature: 240 °C
Pressure: 30 bar
WHSV *: 9.2 NL gcat−1 h−1
12.0042.000.16 **[13]
FBR (ID: 13.5 mm; length: 53.3 cm)Catalyst powder diluted in SiO2Catalyst mass: 1.0 g
Temperature: 240 °C
Pressure: 30 bar
WHSV *: 28.46 NL gcat−1 h−1
11.0045.000.77[7]
FBR (OD: 10 mm)Bimetallic organic frameworksCatalyst mass: 0.1 g
Temperature: 240 °C
Pressure: 30 bar
WHSV: 14.40 NL gcat−1 h−1
9.1086.900.41[15]
FBR (ID: 80 mm; length: 16 cm)Catalyst coated on Cu foamCatalyst mass: 160 g
Temperature: 240 °C
Pressure: 30 bar
WHSV: 2.025 NL gcat−1 h−1
20.0455.910.08This study
FBR (ID: 80 mm; length: 16 cm)Catalyst coated on Cu foamCatalyst mass: 160 g
Temperature: 240 °C
Pressure: 50 bar
WHSV: 2.925 NL gcat−1 h−1
24.4070.550.18This study
FBR: fixed bed reactor; * Calculated assuming a Cu/ZnO/Al2O3 density of 1300 kg m−3; ** Calculated assuming MeOH density of 792 kg m−3.
Disclaimer/Publisher’s Note: The statements, opinions and data contained in all publications are solely those of the individual author(s) and contributor(s) and not of MDPI and/or the editor(s). MDPI and/or the editor(s) disclaim responsibility for any injury to people or property resulting from any ideas, methods, instructions or products referred to in the content.

