Article

Effects of Lithium Source and Content on the Properties of Li-Rich Layered Oxide Cathode Materials

1
Research Unit of Sustainable Chemistry, University of Oulu, 90014 Oulu, Finland
2
Kokkola University Consortium Chydenius, University of Jyvaskyla, 67100 Kokkola, Finland
*
Author to whom correspondence should be addressed.
ChemEngineering 2023, 7(1), 15; https://doi.org/10.3390/chemengineering7010015
Submission received: 1 November 2022 / Revised: 31 December 2022 / Accepted: 30 January 2023 / Published: 14 February 2023

Abstract

:
Lithium-rich layered oxide (LLO) are considered high-capacity cathode materials for next-generation lithium-ion batteries. In this study, LLO cathode materials were synthesized via the hydroxide coprecipitation method followed by a two-step lithiation process using different lithium contents and lithium sources. The effects of lithium content and lithium source on structure and electrochemical performance were investigated. This study demonstrated the clear impact of Li/TM ratio on electrochemical performance. Lower Li/TM ratio reduced the irreversible capacity loss in the first cycle and provided better cycling stability among all samples. The best results exhibited an initial discharge capacity of 279.65 mAh g−1 and reached a discharge capacity of 231.9 mAh g−1 (82.9% capacity retention) after 30 cycles. The sample using Li2CO3 as lithium source exhibits better electrochemical performance than the sample using LiOH as lithium source. Therefore, it is important to choose the appropriate lithium source and optimal lithium content for improving structural properties and electrochemical performance of LLO.

1. Introduction

Nowadays, exhaustion of fossil fuel, climate change, and environmental pollution are global challenges facing mankind. Sustainable and affordable energies have attracted much attention in the past decades [1,2]. Rechargeable lithium-ion batteries (LIBs) are considered to be the key technology to reduce carbon dioxide emissions from transportation, power, and industry sectors, and to enable low-carbon or zero-carbon society [3,4]. However, the energy density of commercialized cathode materials still limits large-scale application of electric vehicles and grid-scale energy storage. To meet the demands, advanced LIBs with high energy density, long cycle life, good thermal stability, low-cost and environmental compatibility are needed [5,6,7]. Lithium-rich layered oxide (LLO) are considered one of the most promising cathode materials for next-generation LIBs [3,8,9]. LLO cathode materials can deliver a specific capacity of over 250 mAh g−1 and an energy density of approximately 1000 Wh kg−1 at room temperature [4,5,10]. Currently, commercialized cathode materials have layered LiCoO2, spinel LiMn2O4, olivine LiFePO4, and layered mixed transition-metal oxides LiNixCoyMn1-x-yO2 and LiNi1-x-yCoxAlyO2 [6,10]. These conventional cathode materials are limited to their practical capacities of around 120–200 mAh g−1 [4,5,10]. Compared with these common cathode materials, LLO has the advantages of high discharge capacity, a wide operating voltage plateau, cost-effectiveness, and environmental friendliness [7,11].
The history of the development of LLO cathode materials goes back to the 1990s. Thackeray et al. [12] demonstrated that lithium manganese oxide Li2−xMnO3−x/2 serves as cathode material in LIBs. The electrochemically active Li1.09Mn0.91O2 was synthesized via chemical leaching of Li2O from Li2MnO3 under the acid treatment method. In 1997, Numata et al. [13,14] identified a layered solid solution of the LiCoO2-Li2MnO3 system as cathode material. In 1999, Kalyani et al. [15] first demonstrated that Li2MnO3 could be electrochemically activated at a voltage of approximately 4.5 V without acid treatment. In 2001, Lu et al. [16] synthesized layered Li[NixLi(1/3−2x/3)Mn(2/3−x/3)]O2 using the hydroxide coprecipitation method, which provided a discharge capacity of about 200 mAh g−1 in the range of 2.0–4.6 V. From 2001 to 2004, many studies reported that LLO cathode materials provided a high discharge capacity over 200 mAh g−1 in the range of 2.0–4.8 V [7,10,17,18]. In 2005, Thackeray et al. [8] introduced the concept of Li- and Mn-rich layered oxides as high-capacity cathode materials for next-generation LIBs. Since that time, LLO cathode materials have attracted much attention; many studies have focused on revealing their crystal structure and reaction mechanisms and developed modification strategies for improving electrochemical performance [8,19,20,21,22,23].
Generally, LLO cathode materials can be presented as xLi2MnO3⋯(1-x)LiMO2 or Li1+xM1-xO2, where M is transition metals, 0 < x < 1 [5,8,24]. The studied M includes single transition metals or a combination of several transition metals, such as Mn, Co, Cr, Ti, Zr, Mn-Cr, Mn-Fe, Mn-Co, Ni-Mn, Ni-Co-Mn, etc. [9,13,14,16,17,18]. The common LLO cathode materials have Ni-Mn oxides, such as Li1.2Ni0.2Mn0.6O2, and Ni-Mn-Co oxides, such as Li1.2Mn0.54Ni0.13Co0.13O2 [6,10]. LLO cathode materials consist of a monoclinic layered Li2MnO3 phase with the space group C2/m and a trigonal layered LiMO2 phase with the space group R 3 ¯ m [10,22]. The synergistic effects of Li2MnO3 and LiMO2 deliver a high discharge capacity over 250 mAh g−1 within a wide voltage range of 2.0–4.8 V [6,10]. The high-capacity LLO cathode materials result from TM ion redox reactions and oxygen anion redox reactions [11]. Lithium ions are extracted from LiMO2 accompanied by the oxidation of Ni2+/Ni3+ to Ni4+ and Co3+ to Co4+ in the range of 2.0–4.4 V [10,25]. In this region, Li2MnO3 can stabilize the structure but does not contribute to capacities [26]. The Li2MnO3 component will be activated in the range of 4.4–4.8 V, leading to irreversible removal of Li+ and O2- to form Li2O and electrochemically active MnO2 [8]. Therefore, LLO cathode materials suffer from a high irreversible capacity loss of 40–100 mAh g−1 and a low Coulombic efficiency of approximately 80% during the initial charge–discharge cycle [6,10]. Moreover, LLO cathode materials have the drawbacks of voltage and capacity fading due to irreversible layered-to-spinel structural changes and undesirable side reactions on the electrode interface [5,7,10]. The poor rate capability of LLO cathode materials is related to the low kinetic diffusion of Li+ ions and the low electronic conductivity of Li2MnO3 [7,10]. To overcome these challenges and improve electrochemical performance, various modification strategies have been employed, such as chemical activation, optimizing the synthesis method, surface coating, ion doping, and the use of nanosized materials [7,10,27,28]. It is also necessary to better understand the properties and electrochemical performance of LLO cathode materials.
In this study, LLO cathode materials were synthesized using the hydroxide coprecipitation method followed by a two-step lithiation process. The impacts of different lithium contents and lithium sources on structure and electrochemical performance were examined. This study provides a new understanding of the relationship between synthesis conditions and the electrochemical performance of LLO cathode materials.

2. Materials and Methods

2.1. Material Synthesis

As Figure 1 shows, the LLO cathode materials were synthesized using a two-step process: (i) the synthesis of Mn0.675Ni0.1625Co0.1625(OH)2 precursors via coprecipitation and (ii) the blending of the precursors with lithium sources (LiOH or Li2CO3) to synthesize final products via calcination at high temperature [29,30].
The synthesis of Mn0.675Ni0.1625Co0.1625(OH)2 precursors was conducted in a batch process. Distilled water (800 mL) containing a concentration of 10 g/L NH3·H2O as the starting solution was fed into a continuous stirred-tank reactor with a capacity of 4 L. Stoichiometric amounts of MnSO4·H2O, NiSO4·6H2O, and CoSO4·7H2O (molar ratio of Mn/Ni/Co = 0.675:0.1625:0.1625) were dissolved in distilled water to prepare a 2M TM solution. Then, the 2M TM solution, with a feed rate of 4 mL/min, and 2M NaOH as a precipitant, with a feed rate of 7.4 mL/min, were continuously pumped into the reactor. Simultaneously, 2M NH3·H2O as a chelating agent was pumped into the reactor at a feed rate of 1.2 mL/min. The pH was controlled with the addition of 2M NaOH to maintain the pH of the solution system at 11.5. The process was conducted at 55 °C and with a stirring speed of 800 rpm for 4 h under an N2 atmosphere. After the coprecipitation process, the mixture solution was filtered, washed with distilled water a few times, and dried in a vacuum at 60 °C overnight under N2. Then, the obtained hydroxide precursors were blended with a stoichiometric amount of the lithium source, Li2CO3 or LiOH. The final products were obtained by preheating at 500 °C for 5 h and then by calcination at 850 °C for 12 h with a heating rate of 5 °C min−1 under an air atmosphere. A 10 wt% excess of Li2CO3 or LiOH was added to compensate for lithium loss during the lithiation process.

2.2. Material Characterization

The particle size distributions were analyzed using a Mastersizer 3000 (Malvern Panalytical, Almelo, The Netherlands) particle analyzer with an attached Hydro EV sample 100 dispersion unit. The refractive-index and absorption-index values were 1.7 and 0.006 for the precursors and 3.0 and 0.02 for the LLO cathode materials, respectively. The tapped density of the precursors and LLO cathode materials was measured using an Erweka SVM222 tapped density device following the ISO EN 787/11 standard. The chemical composition of Li, Ni, Mn, and Co in the synthesized materials was measured via inductively coupled plasma-optical emission spectroscopy (ICP-OES; Agilent 5110 VDV). ICP-OES analysis was performed on solid precipitates, and the corresponding Li:Ni:Co:Mn ratio was confirmed. Microwave digestion was used to dissolve these samples completely without any leaching residue. This was performed using nitric acid based on the EPA3051A standard: hydrochloric acid as a solvent with a ratio of 3:1. The morphology of the cathode materials was characterized using Zeiss Sigma field emission scanning electron microscopy (Carl Zeiss Microscopy GmbH, Jena, Germany) at the Centre for Material Analysis, University of Oulu. X-ray diffraction (XRD) patterns were recorded with a PANalytical X’Pert Pro XRD diffractometer (Malvern Panalytical, Almelo, The Netherlands) using monochromatic CuKα1 radiation (λ = 1.5406 Å) at 45 kV and 40 mA. Diffractograms were collected in the 2θ range of 15–90° at 0.017° intervals. The crystalline phases and structures were analyzed using HighScore Plus software version 4.0 (PANalytical B. V., Almelo, The Netherlands) using the Rietveld analysis method.

2.3. Electrochemical Measurements

The slurry of cathode materials was prepared by 80 wt% cathode materials, 10 wt% carbon black (Timcal Super C45), and 10 wt% polyvinylidene fluoride (Kureha #1100). The mixture was dissolved in the appropriate amount of N-methyl-2-pyrrolidone (Alfa Aesar, anhydrous 99.5%) and was mixed in a slurry mixer to obtain a uniform slurry. The slurry consisted of approximately 40 wt% solid matter. The uniform slurry was coated on the aluminum foil current collector with 100-μm applicators and dried in a vacuum at 120 °C overnight. The dried cathode material was pressed via calendering pressing. The coin cells (type 2016) were assembled with cathode material, a lithium metal reference electrode, a separator, and an electrolyte under dry room conditions. The electrolyte consisted of 1 M lithium hexafluorophosphate (LiPF6; Novolyte Technologies) dissolved in ethylene carbonate (EC), diethyl carbonate (DEC), and dimethyl carbonate (DMC) (1:1:1 vol% ratio) (EC: Sigma-Aldrich, anhydrous 99%; DEC: Sigma-Aldrich, anhydrous 99%; DMC: Novolyte Technologies, 99% sealed under nitrogen). The active material loading of electrodes was maintained at around 5.0 mg cm−2. The electrochemical performance of the assembled coin cells was tested using a Maccor battery tester in constant-current mode at 25 °C. The testing program was performed on the first cycle at 0.03 C and following 30 cycles at 0.1 C in the range of 2.0–4.8 V. The theoretical capacity used to calculate the C-rate was 200 mAh g−1.

3. Results and Discussion

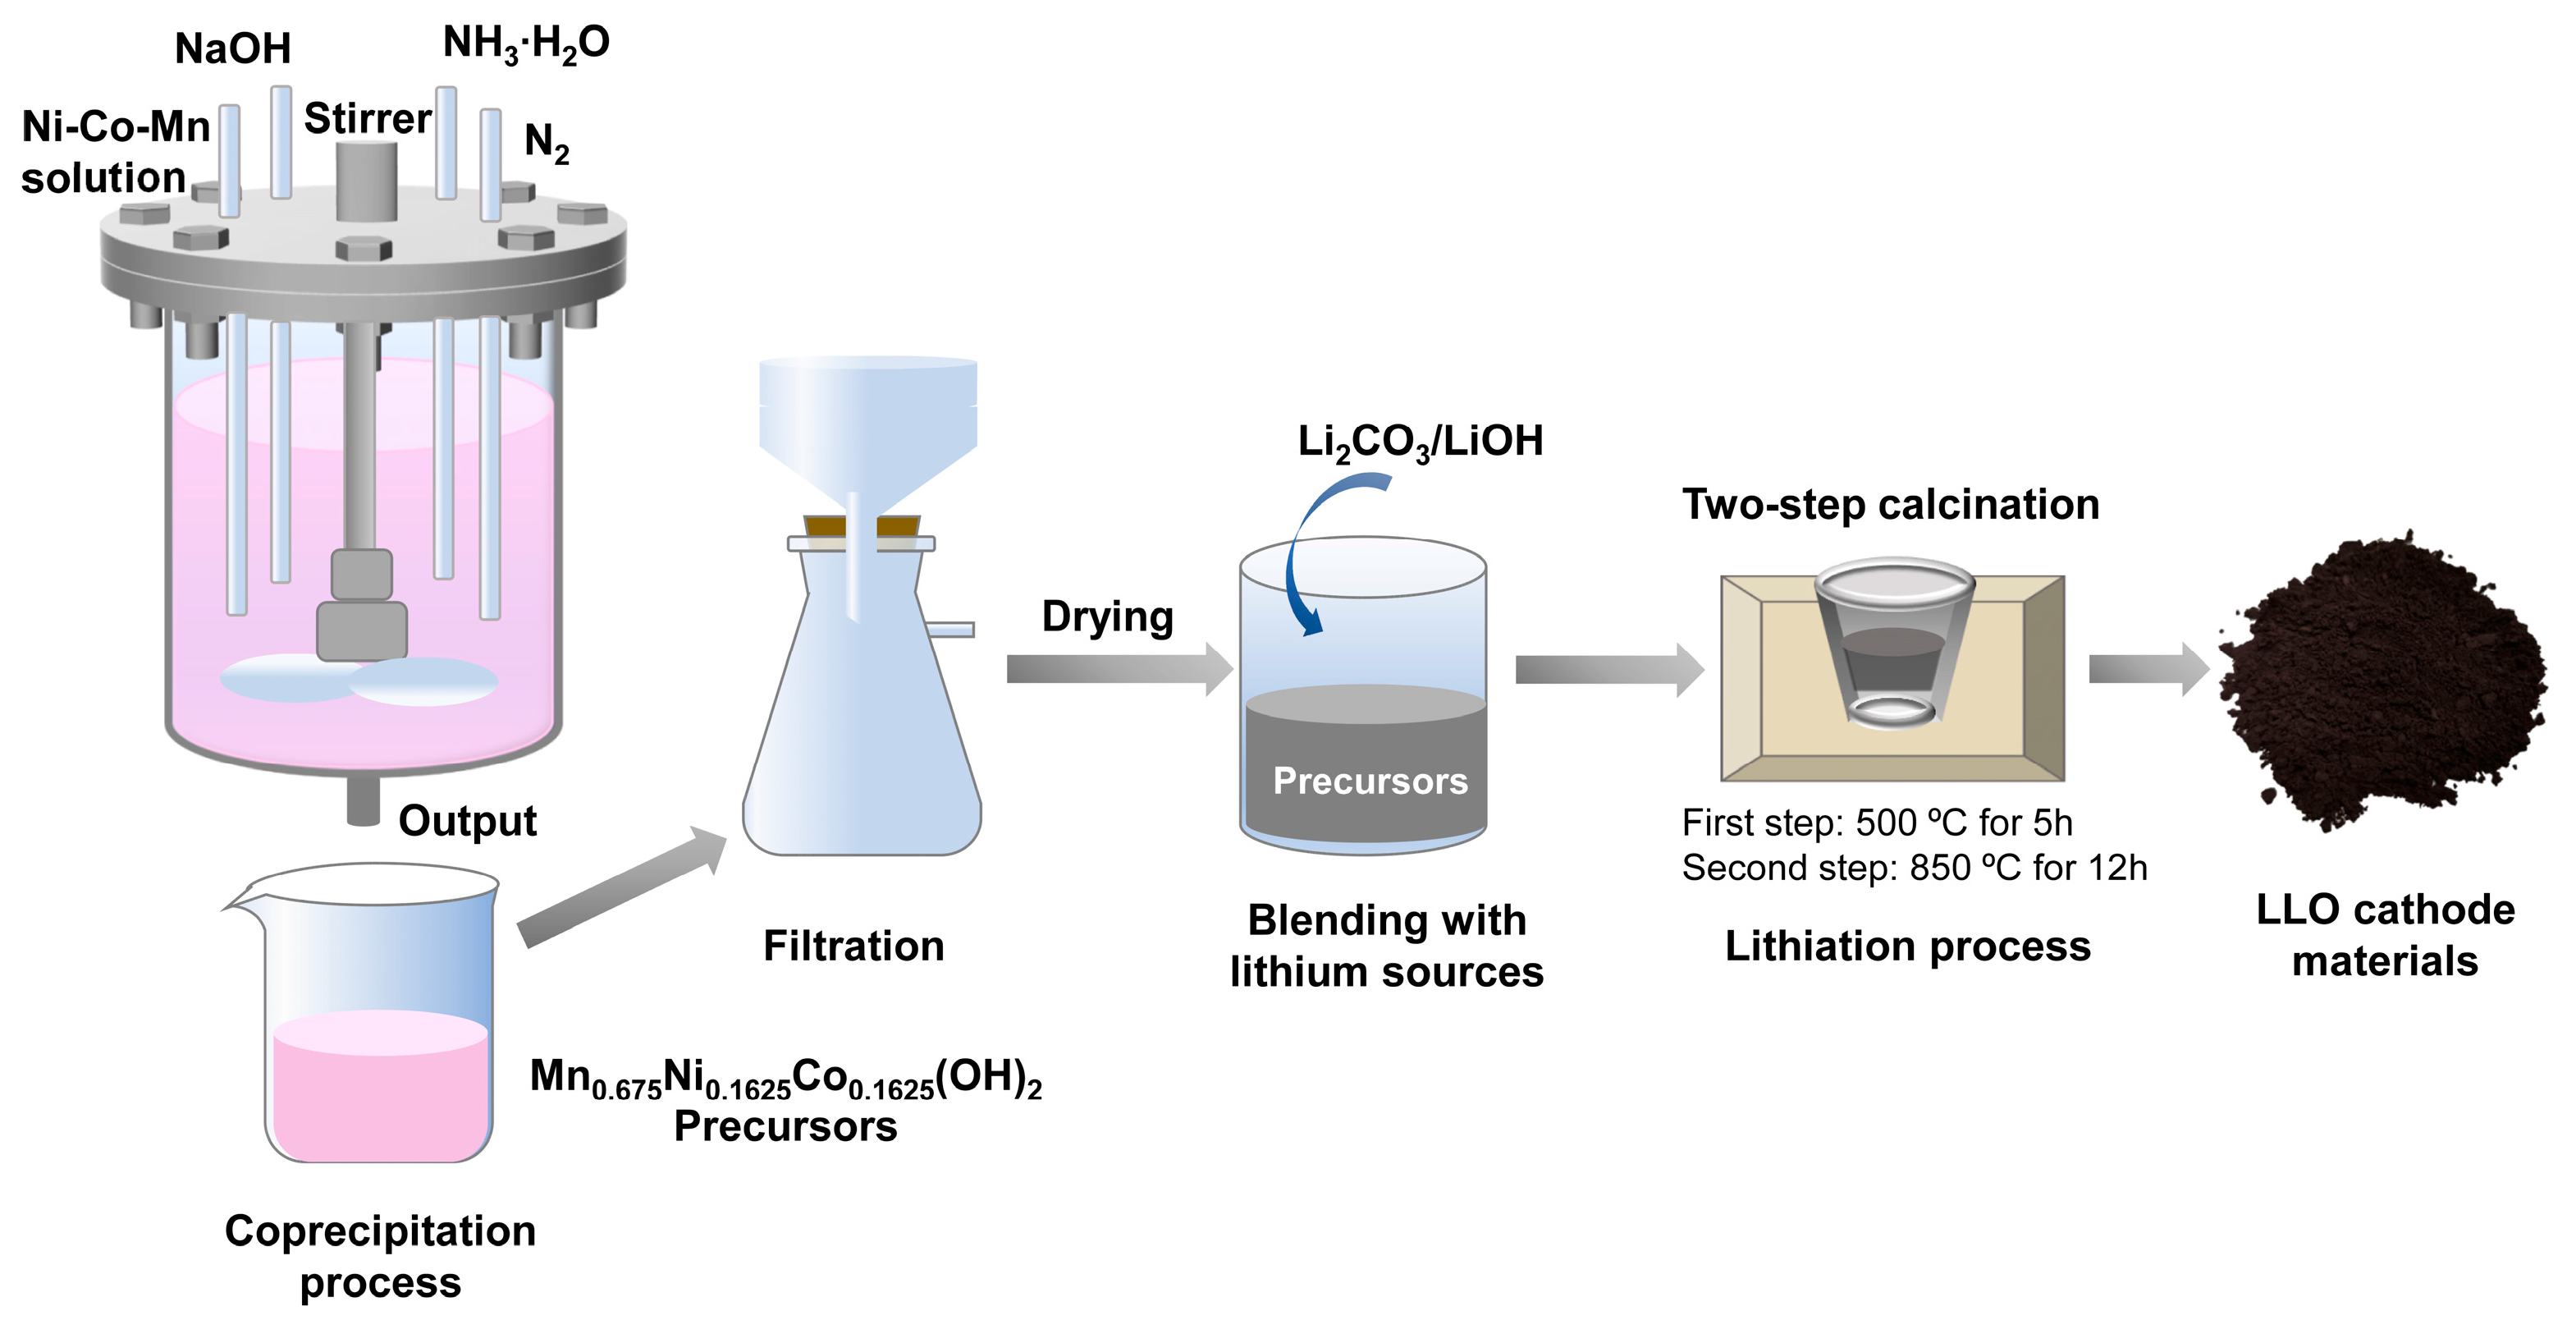
3.1. Effect of Lithium Content on Structure and Electrochemical Performance

Lithium is one of the most essential elements in LLO cathode materials. Lithium content affects the structure and electrochemical performance of LLO cathode materials [5,10,31]. The theoretical lithium content used in the synthesis of typical LLO cathode materials is Li1.2Mn0.54Ni0.13Co0.13O2 with an Li/TM ratio of 1.5:1 [29]. In this study, the LLO cathode materials were synthesized with a variety of Li/TM ratios. Table 1 presents the chemical composition of samples L10–L13. The impacts of various Li/TM ratios on structure and electrochemical performance were investigated.
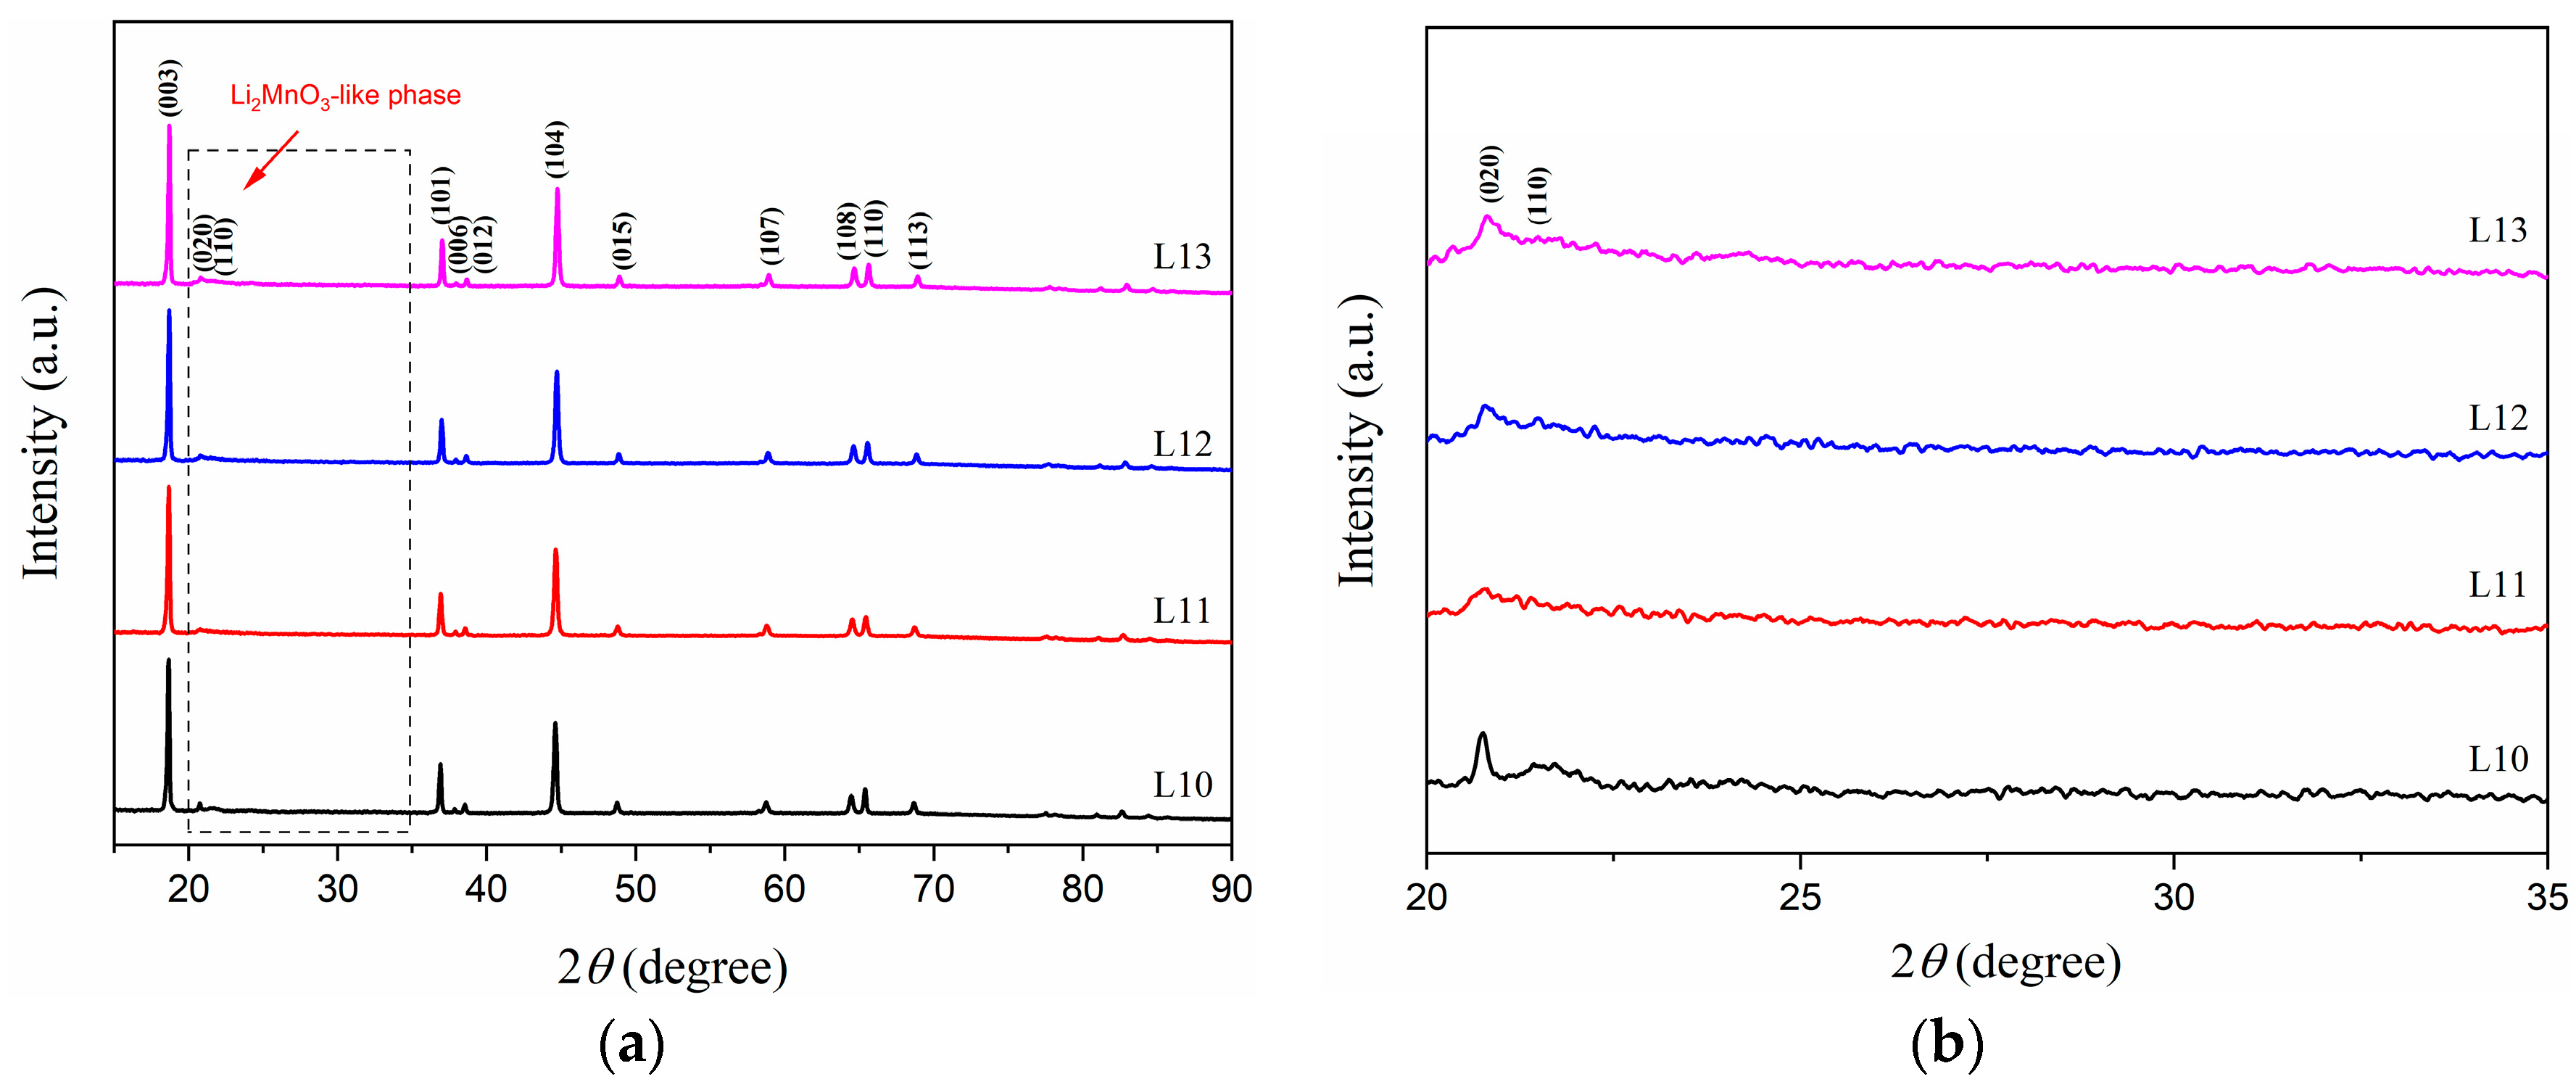
Figure 2a shows the XRD patterns of samples L10–L13. All the major peaks were well indexed to a hexagonal α-NaFeO2 layered structure with the R 3 ¯ m space group (ICDD file 04-023-1600), except for the small peaks between 20° and 25°, which are characteristic of Li2MnO3 with the C2/m space group (ICDD file 01-082-2663) [19]. In L10–L13, the clear splitting peaks of (006)/(012) and (018)/(110) were sharp and intense, which indicated that well-layered structure materials were successfully synthesized [31]. In addition, the weak peaks between 20° and 25° provided evidence of existing Li2MnO3 phases in the synthesized materials. These characteristic peaks of Li2MnO3 were indexed to a monoclinic structure with the C2/m space group [19,26]. No other impurities or spinel-phase peaks were observed in the prepared materials. The XRD results demonstrated that the prepared samples L10–L13 had good crystallinity, a well-layered structure, and a high-purity phase.
However, samples L10–L13 exhibited slight differences in peak intensity between 20° and 25°, as Figure 2b shown. The superlattice peaks of (020) and (110) for L10 were sharper and more intense than those of L11, L12, and L13. Broad peaks were observed in L11, L12, and L13, which may have been associated with the presence of less Mn content in the samples, resulting in insufficient Mn to form the LiMn6 superstructure in the Li2MnO3 phase [32]. Moreover, the refined lattice parameters of the monoclinic Li2MnO3 phase in samples L10–L13 are compared in Table 2. The ideal lattice parameters of monoclinic Li2MnO3 with the C2/m space group are a = 4.937 Å, b = 8.532 Å, c = 5.030 Å, α = γ = 90°, and β = 109.46° [19]. It can be seen that the values of L10 were the closest to the ideal lattice parameter of Li2MnO3, which indicated that L10 had a higher crystallinity than L11, L12, and L13. Different degrees of broadening peaks between 20° and 25° were observed in L10–L13. The existence of defects and stacking faults usually leads to the weakening and broadening of superlattice peaks [33,34,35]. L11 had weaker peak intensities of (020) and (110), which may have been caused by the smaller c value of 5.017 Å than that of L10, L12 and L13. It was found that the disordered stacking ordering along the c-axis may have resulted in weak or broad superlattice peaks, even if the arrangement of Li+ and Mn4+ in TM layers was ordered [33,34]. Furthermore, the stacking faults may have been due to the existence of Ni2+ and Co3+ in TM layers [35]. Boulineau et al. [34] suggested that different levels of stacking faults can be roughly estimated by comparing the intensity ratios of (110) and (020) peaks (I(110)/I(020)) in Li2MnO3. The experimental results indicated that increasing the synthesis temperature during calcination may have decreased the degree of stacking faults but that it could not entirely eliminate them [34].
Figure 3a presents the initial charge–discharge curves of samples L10–L13 at 0.03 C in the range of 2.0–4.8 V. All the samples had charge characteristics typical of LLO cathode materials: the first sloping plateau extended from 3.8 to 4.4 V, and the second plateau was above 4.4 V. The first plateau was associated with the extraction of lithium ions from the LiMO2 component corresponding to Ni2+/Ni3+ to Ni4+ and Co3+ to Co4+ [10,25]. All the samples delivered a TM redox capacity of approximately 70–120 mAh g−1 in the first plateau. The second plateau region exhibited a long plateau above 4.4 V that provided additional charge capacities due to the extraction of lithium ions accompanied by O2 loss from the Li2MnO3 component [10,25]. Therefore, a large, irreversible loss of capacities in the initial cycle was observed in the prepared samples, which resulted mainly from the irreversible removal of Li2O from the Li2MnO3 component. Inactive Li2MnO3 then became electrochemically active MnO2 (Li2MnO3 → Li2O + MnO2). As Table 3 shows, the initial charge/discharge capacities of L10, L11, L12, and L13 were 337.8/279.7 mAh g−1, 325.7/255.2 mAh g−1, 311.8/241.3 mAh g−1, and 348.28/221.44 mAh g−1, respectively. L10, L11, and L12 had an irreversible capacity loss of around 20% in the first cycle, whereas L13 had an irreversible capacity loss of approximately 40% in the first cycle. L10 delivered the highest initial Coulombic efficiency (82.8%), with an irreversible capacity loss of 58.12 mAh g−1. L13 exhibited the highest initial charge capacity (348.28 mAh g−1) but had the lowest initial Coulombic efficiency (63.6%), with an irreversible capacity loss of 126.84 mAh g−1. The oxygen-loss plateau above 4.4 V disappeared in the second cycle, which implied an irreversible structural evolution for the synthesized materials, as shown in Figure 3b [8,10,25]. Figure 3c compared the voltage profiles of L10–L13 for the 3rd discharge and 31st discharge. All samples exhibited continuous voltage fading during cycling, whereas L13 display the most obvious voltage drop, shown in Figure 3d. It implied that the structural changes from layered to spinel phases were due to lattice oxygen release and transition metal migration during Li2MnO3 activation process [10,36].
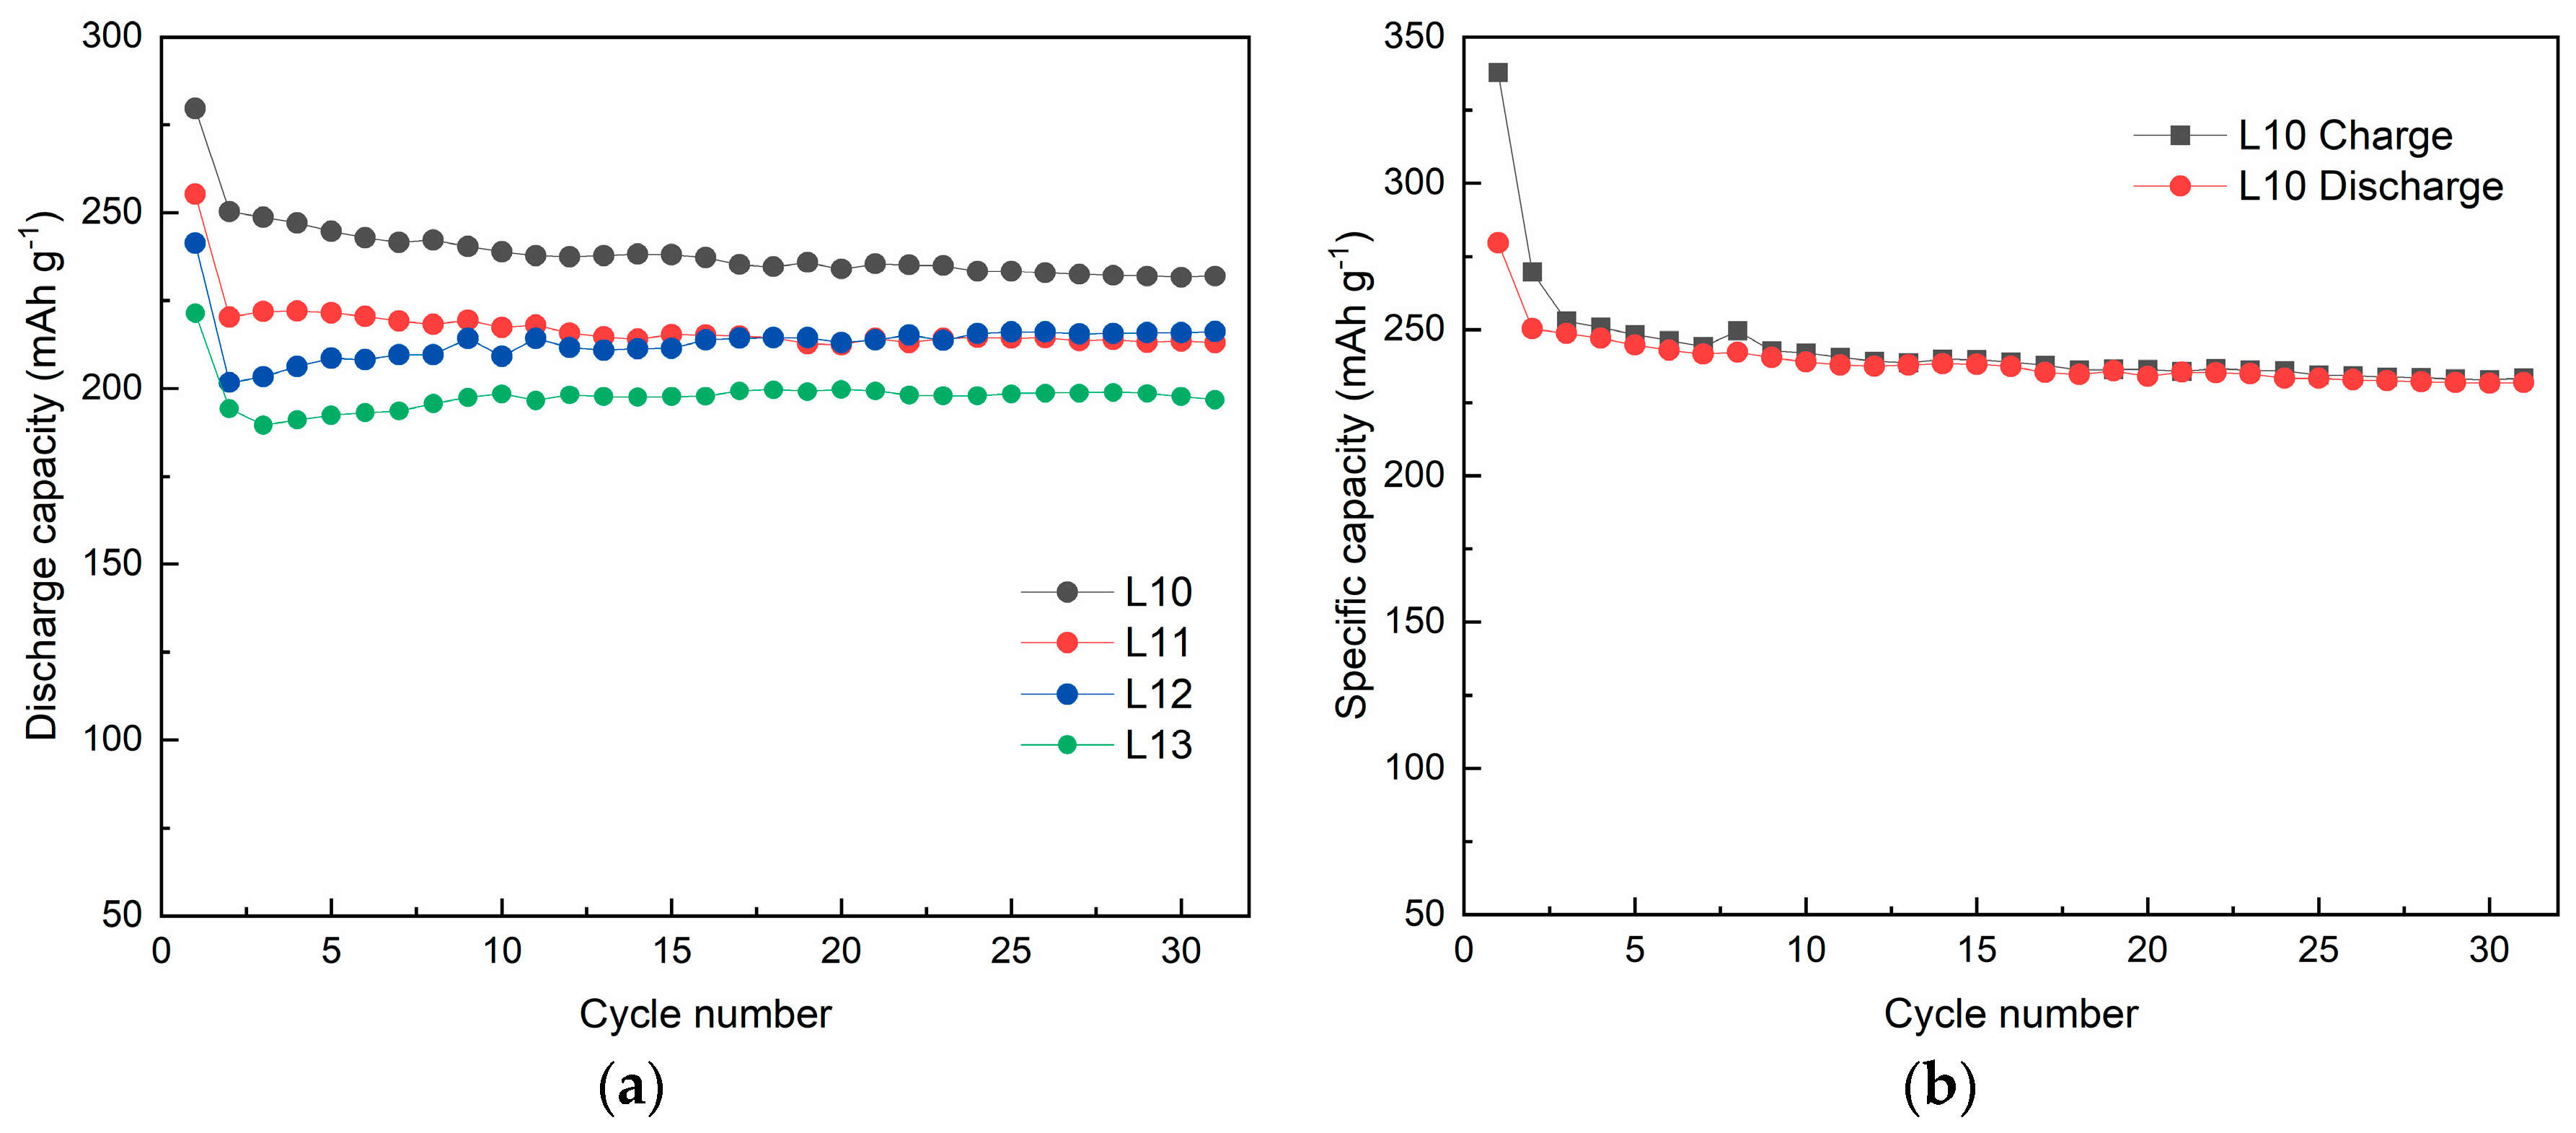
Figure 4a shows the cycling performance of samples L10–L13 for 30 cycles in the range of 2.0–4.8 V. During the second cycle, all samples decreased the discharge capacities of 30–40 mAh g−1 when the current rates changed from 0.03 C to 0.1 C. L10 displayed better cycling performance than L11, L12 and L13. L12 has slightly fluctuated and slowly increased the discharge capacity during cycling. The Li2MnO3 component in L12 may not be entirely activated in the first cycle, which led to the discharge capacity’s continuous increase with increasing cycle numbers. In addition, sample L13 had lower discharge capabilities than those of L10, L11, and L12 for 30 cycles. This is probably related to the presence of lower lithium and TM content in sample L13, which increased metal vacancies and lithium vacancies in the crystal structure, resulting in L13’s decreased structural stability and poor cycling performance [31,37]. Moreover, these results suggested that coin cells could be tested for three cycles under low current density to fully activate Li2MnO3 component. This could help to improve the cycling stability of LLO cathode materials.
After 30 cycles, the discharge capacities of L10, L11, L12, and L13 were 231.9 mAh g−1, 213.1 mAh g−1, 216.2 mAh g−1, and 196.7 mAh g−1, respectively. Overall, given L10’s low Li/TM ratio, it exhibited the highest discharge capacity, lowest initial irreversible capacity loss, and good cycling stability among the four samples, as Figure 4b shown. This was in good agreement with the XRD results for L10, which indicated a good crystalline structure and fewer defects in the Li2MnO3 structure. With increasing lithium content and TM content, the discharge capacities and cycling stability of samples L10–L13 increased. As the lithium content and TM content decreased in L13, the charge and discharge capacities decreased, and more vacancies were generated in the structure of the material. These vacancies may have increased the diffusion rate of lithium ions and led to an unstable structure and reduced cycling stability [31]. The results suggested that lithium content can optimize electrochemical performance by adjusting the proportion of Li2MnO3 in LLO cathode materials [10,31]. For example, Shunmugasundaram et al. [38] confirmed that a lower Li/TM ratio could reduce irreversible capacity loss in the first cycle. A suitable Li2MnO3 proportion can stabilize the crystal structure and cycling performance. In addition, excessive lithium content causes a large initial irreversible capacity loss, increased residual lithium on the surface, and deterioration of electrochemical performance [10,31].

3.2. Effect of Lithium Sources on Structure and Electrochemical Performance

Different lithium sources exert different effects on the structure and electrochemical properties of LLO cathode materials. Li2CO3 and LiOH, the most common lithium sources, are used in cathode material for LIBs [30]. The effects of lithium sources on structure and electrochemical performance were investigated. The LLO cathode materials L12 and L15 were prepared using different lithium sources (Li2CO3 and LiOH, respectively). Table 4 presents the chemical composition of L12 and L15.
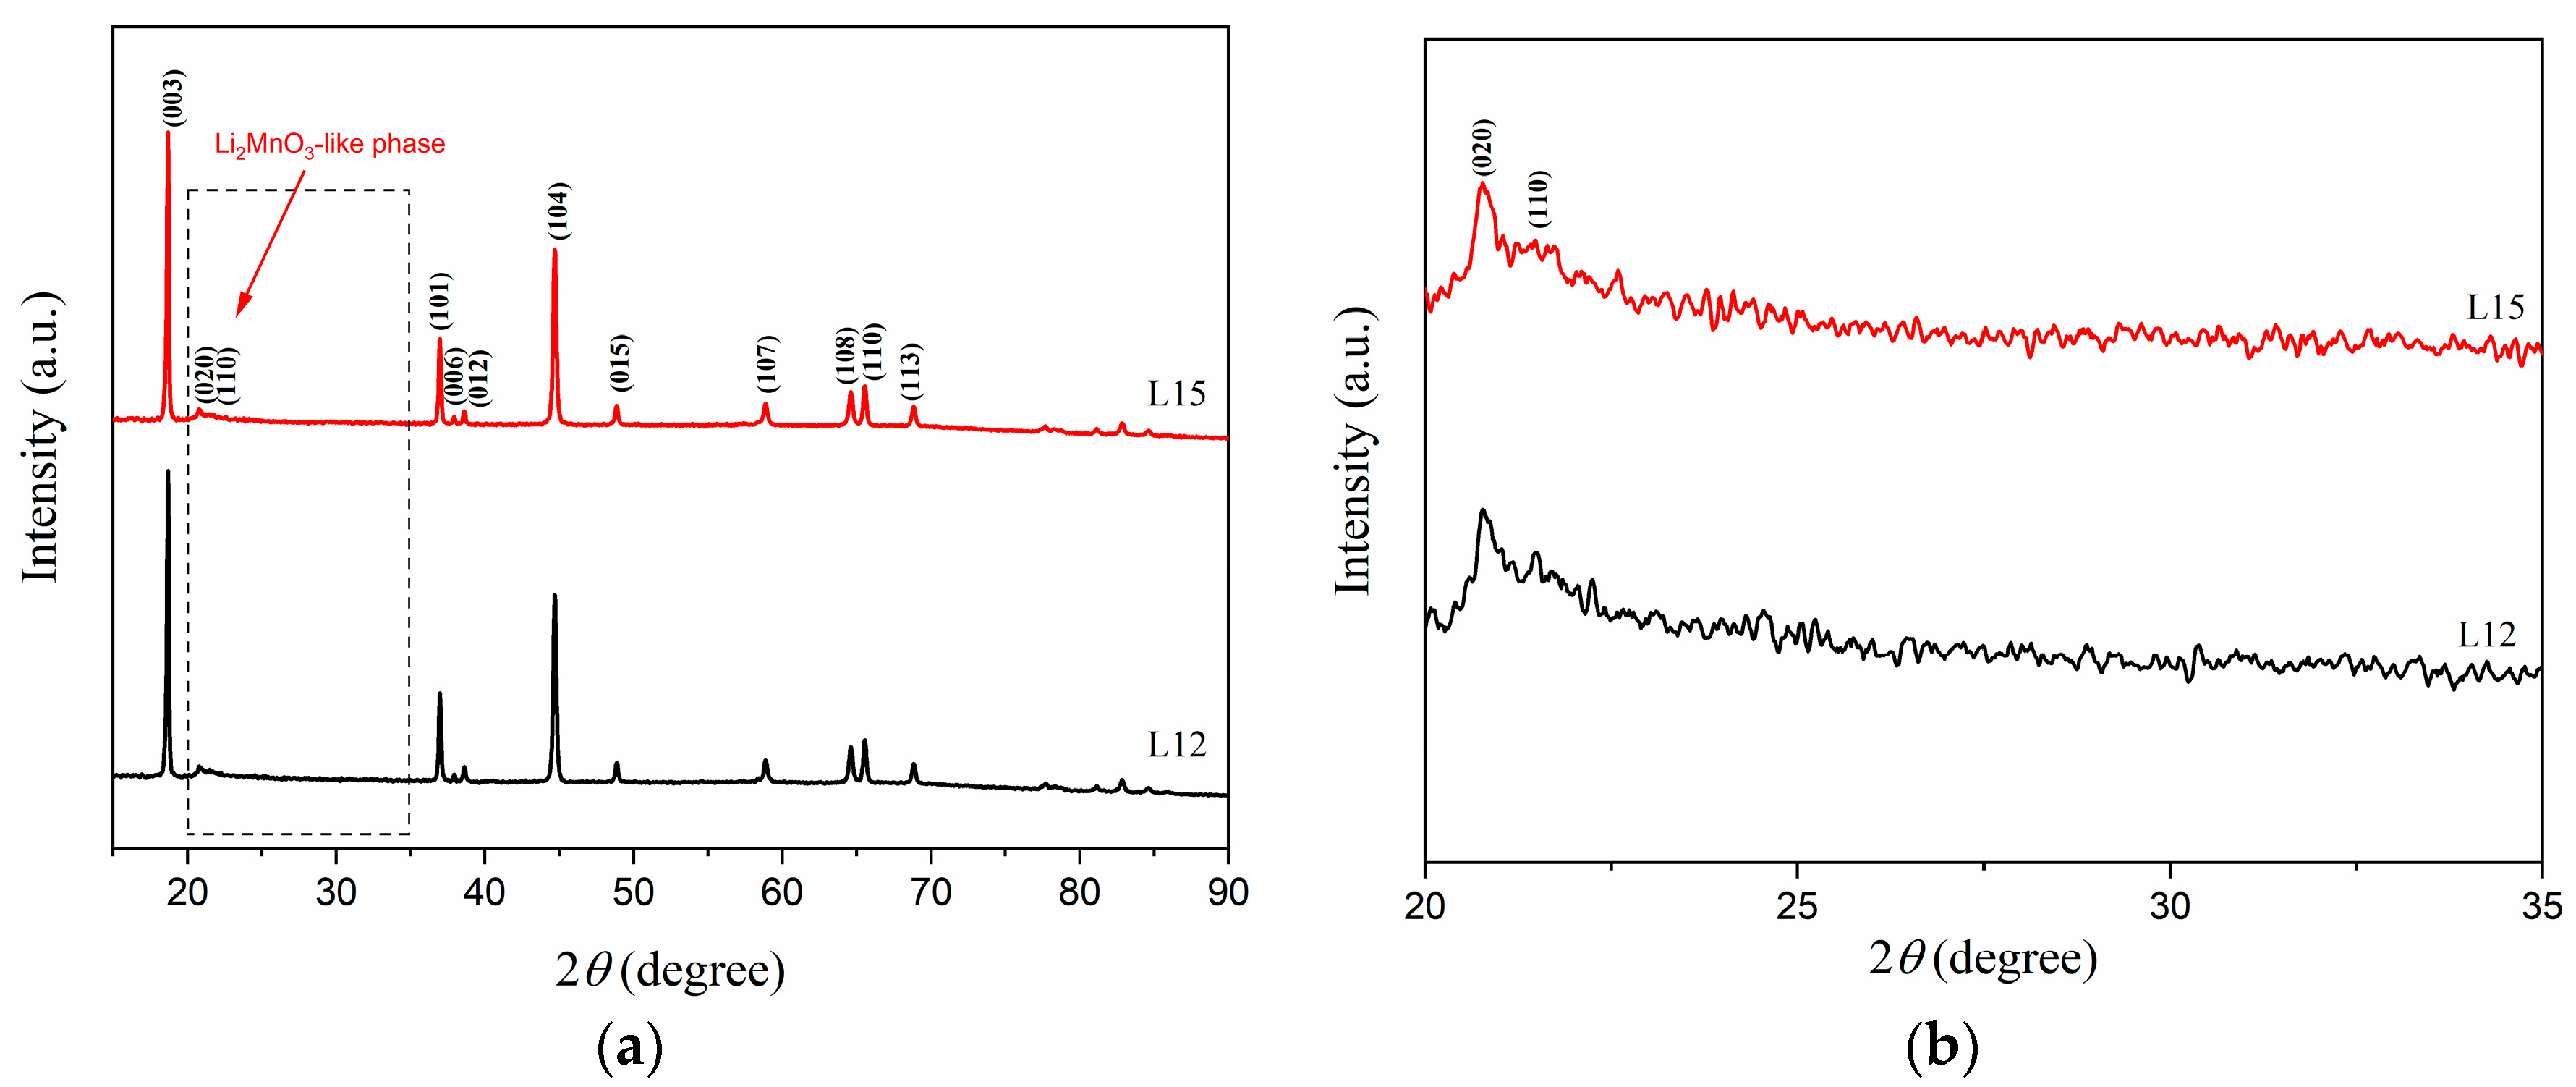
Figure 5a shows the XRD patterns of L12 (using Li2CO3 as a lithium source) and L15 (using LiOH as a lithium source). For samples L12 and L15, all the major peaks could be indexed to a hexagonal α-NaFeO2 layered structure with the R 3 ¯ m space group (ICDD file 04-023-1600) [19]. Superlattice peaks between 20° and 25° were observed in the two samples, which could be indexed to monoclinic Li2MnO3 with the C2/m space group (ICDD file 01-082-2663) [19,26]. The materials synthesized by Li2CO3 and LiOH had a similar peak intensity of (020) and (110), as Figure 5b shows. The refined lattice parameter of the Li2MnO3 phase in these two samples is described in Table 5. L12 and L15 had a crystallinity similar to that of the Li2MnO3 phase. The two samples exhibited certain defects in the crystal structure of the Li2MnO3 phase compared to the ideal lattice parameters of monoclinic Li2MnO3. The lattice parameters of monoclinic Li2MnO3 are a = 4.937 Å, b = 8.532 Å, c = 5.030 Å, α = γ = 90°, and β = 109.46° [19]. Clear splitting peaks, of (006)/(012) and (018)/(110), and no impurity peaks were observed. The XRD results indicated that the two samples synthesized by Li2CO3 and LiOH had good crystallinity, a well-layered structure, and a high-purity phase [30,31]. In addition, the SEM images of L12 and L15 are compared in 
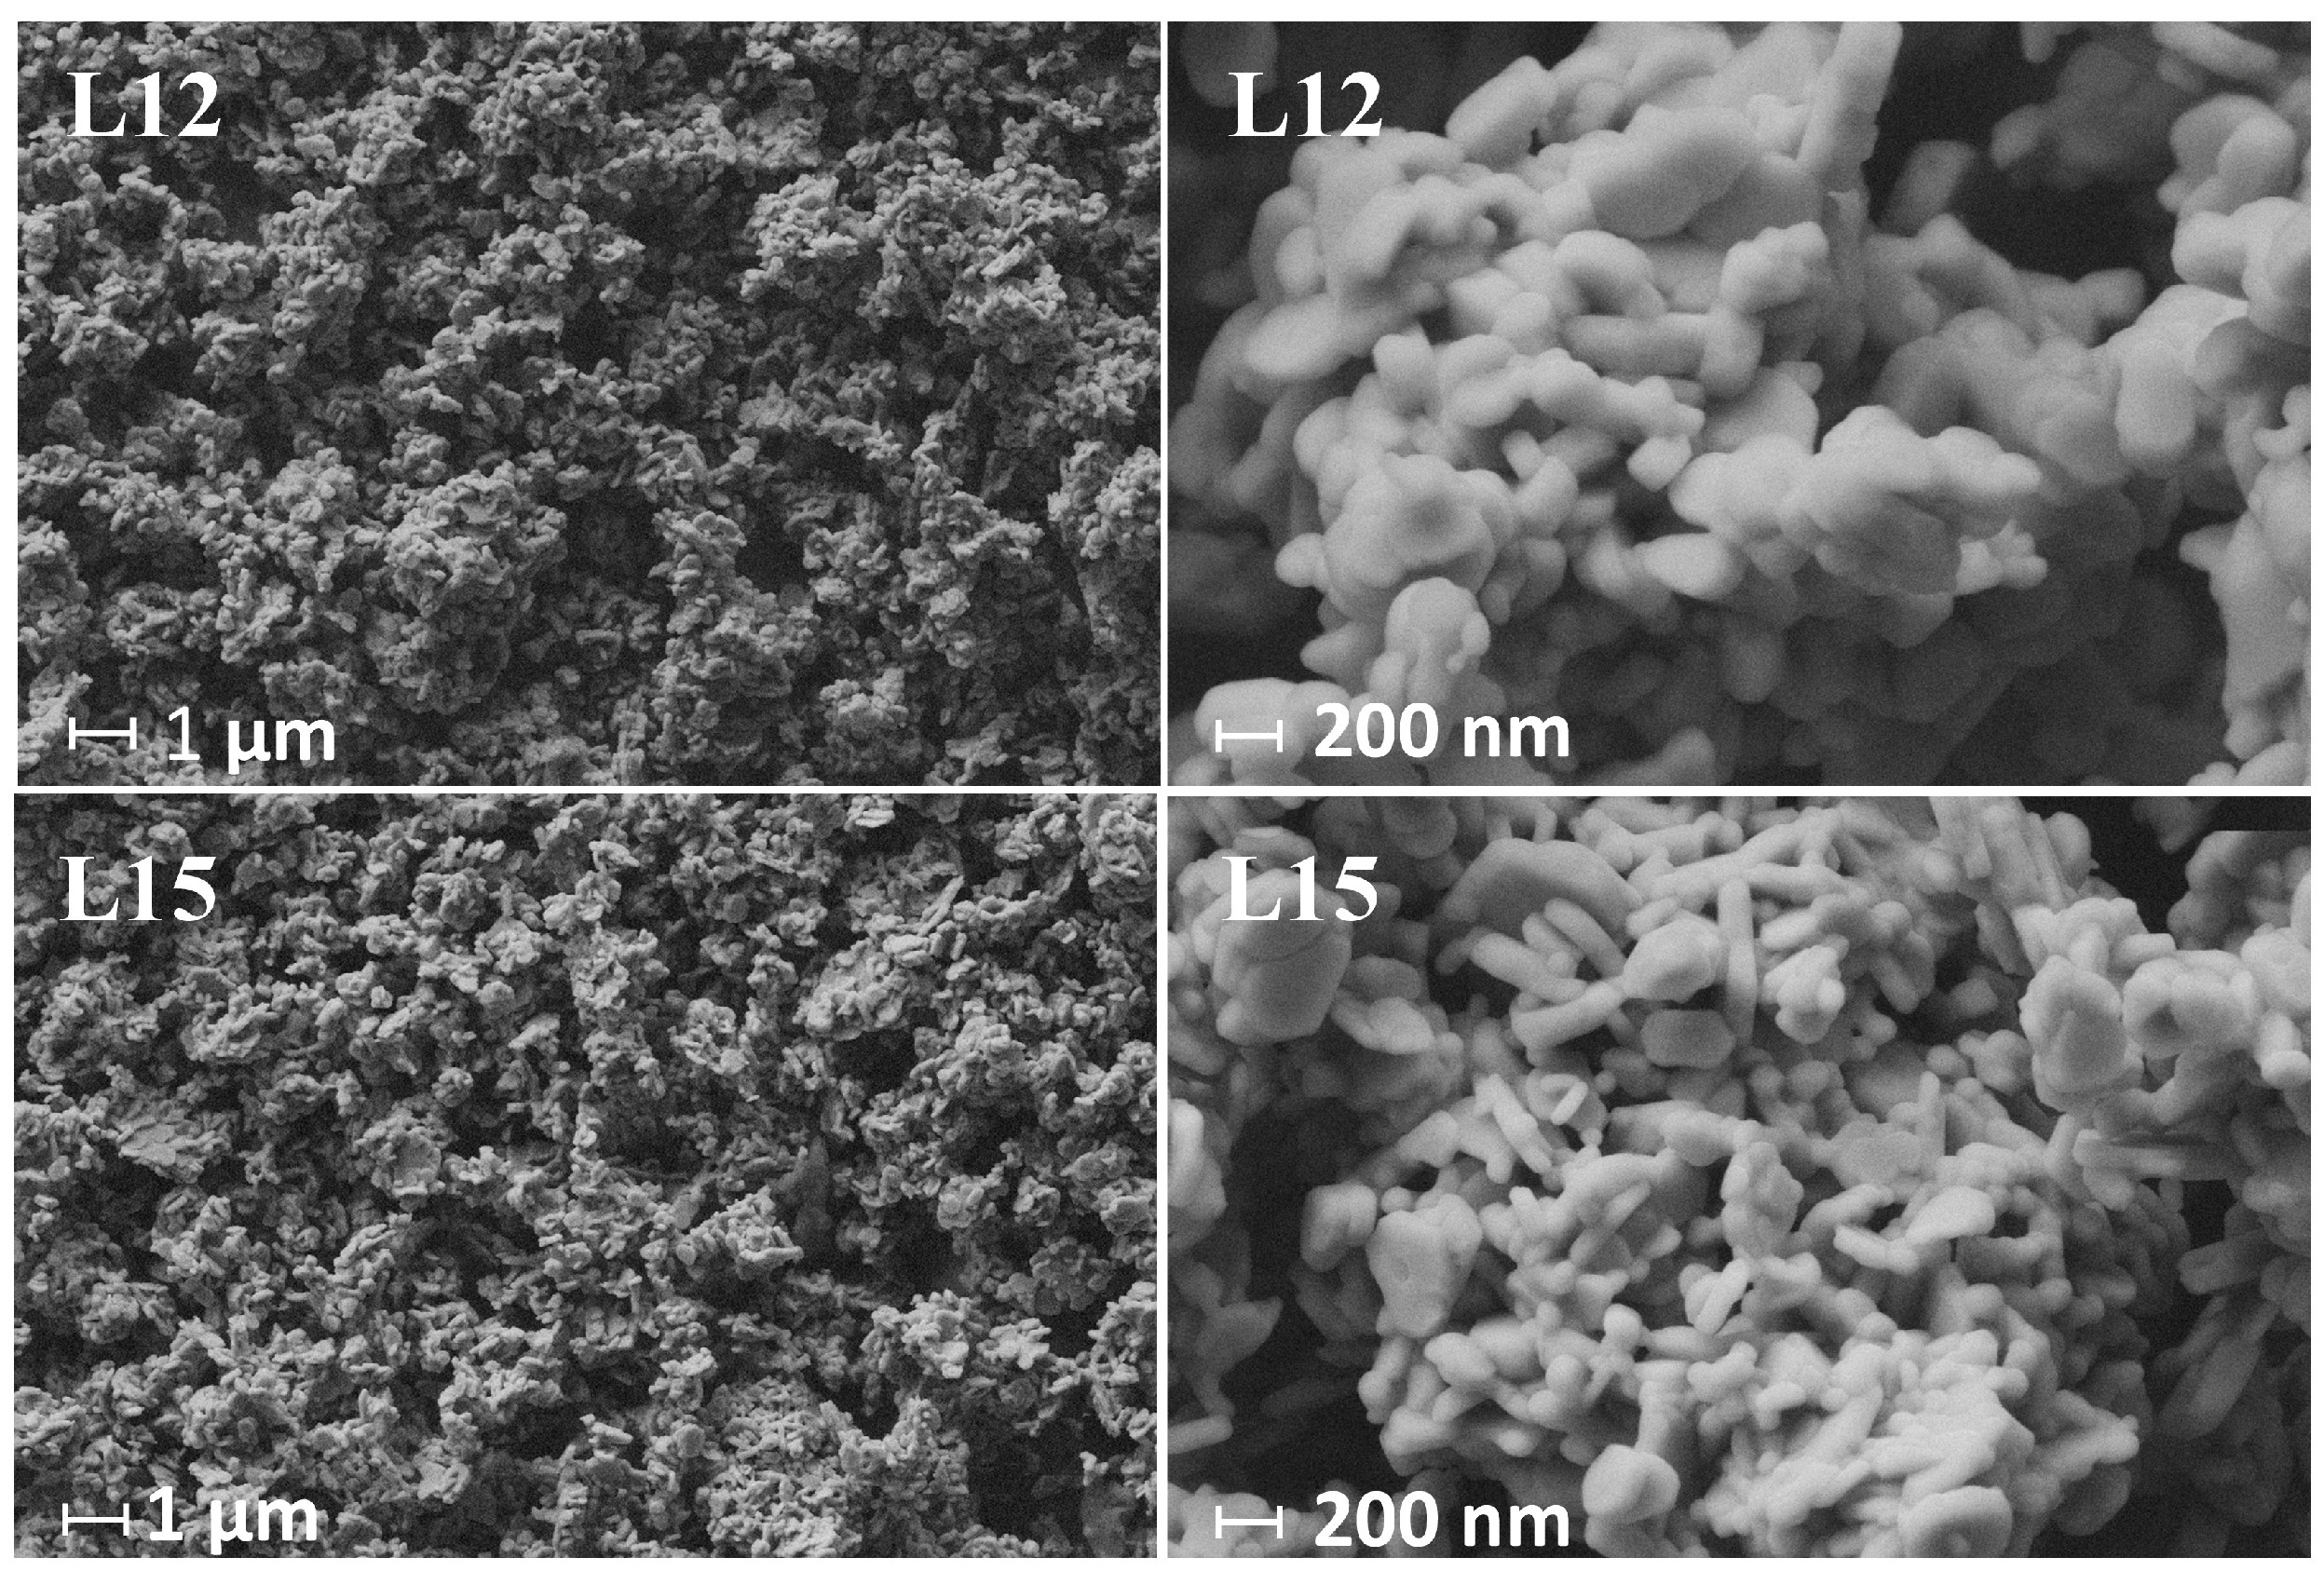
Figure 6. Both samples exhibited irregular morphology and small, round-edged primary particles, which contained a substantial agglomeration of particles. The morphology of the two samples was unaffected by the lithium source with which they were prepared.
Figure 7a shows the initial charge–discharge curves of L12 and L15, prepared using the lithium sources of Li2CO3 and LiOH, respectively, in the range of 2.0–4.8 V. The two typical plateaus of LLO cathode material were observed in the initial charging curves for L12 and L15. During the initial charging process, the first plateau, from 3.8 to 4.4 V, was related to the reversible extraction of Li+ from the LiMO2 component corresponding to the oxidation of Ni2+/Ni3+ to Ni4+ and Co3+ to Co4+ [10,25]. At the first plateau, L12 and L15 had a similar TM redox capacity of around 90 mAh g−1. The second long plateau, above 4.4 V, corresponded to the irreversible extraction of Li+ and O2− as Li2O from the Li2MnO3 component. The electrochemically active MnO2 was formed and the long plateau disappeared after the first cycle, which implied irreversible changes of structure for the synthesized materials [8,30]. In the range of 2.0–4.8 V, the initial charge and discharge capacities of L12, prepared using Li2CO3 as a lithium source, were 311.8 mAh g−1 and 241.3 mAh g−1, respectively. L15, prepared using LiOH as a lithium source, exhibited an initial charge capacity of 311.7 mAh g−1 and an initial discharge capacity of 230.9 mAh g−1. As Table 6 shows, the irreversible capacity losses of L12 and L15 were 70.4 mAh g−1 and 80.8 mAh g−1, respectively. The initial Coulombic efficiency of L12 was 77.4%, whereas that of L15 was 74.1%. Also, L12 and L15 exhibited similar voltage profiles by comparison of the 1st discharge, 3rd discharge, and 31st discharge, as shown in Figure 7b.
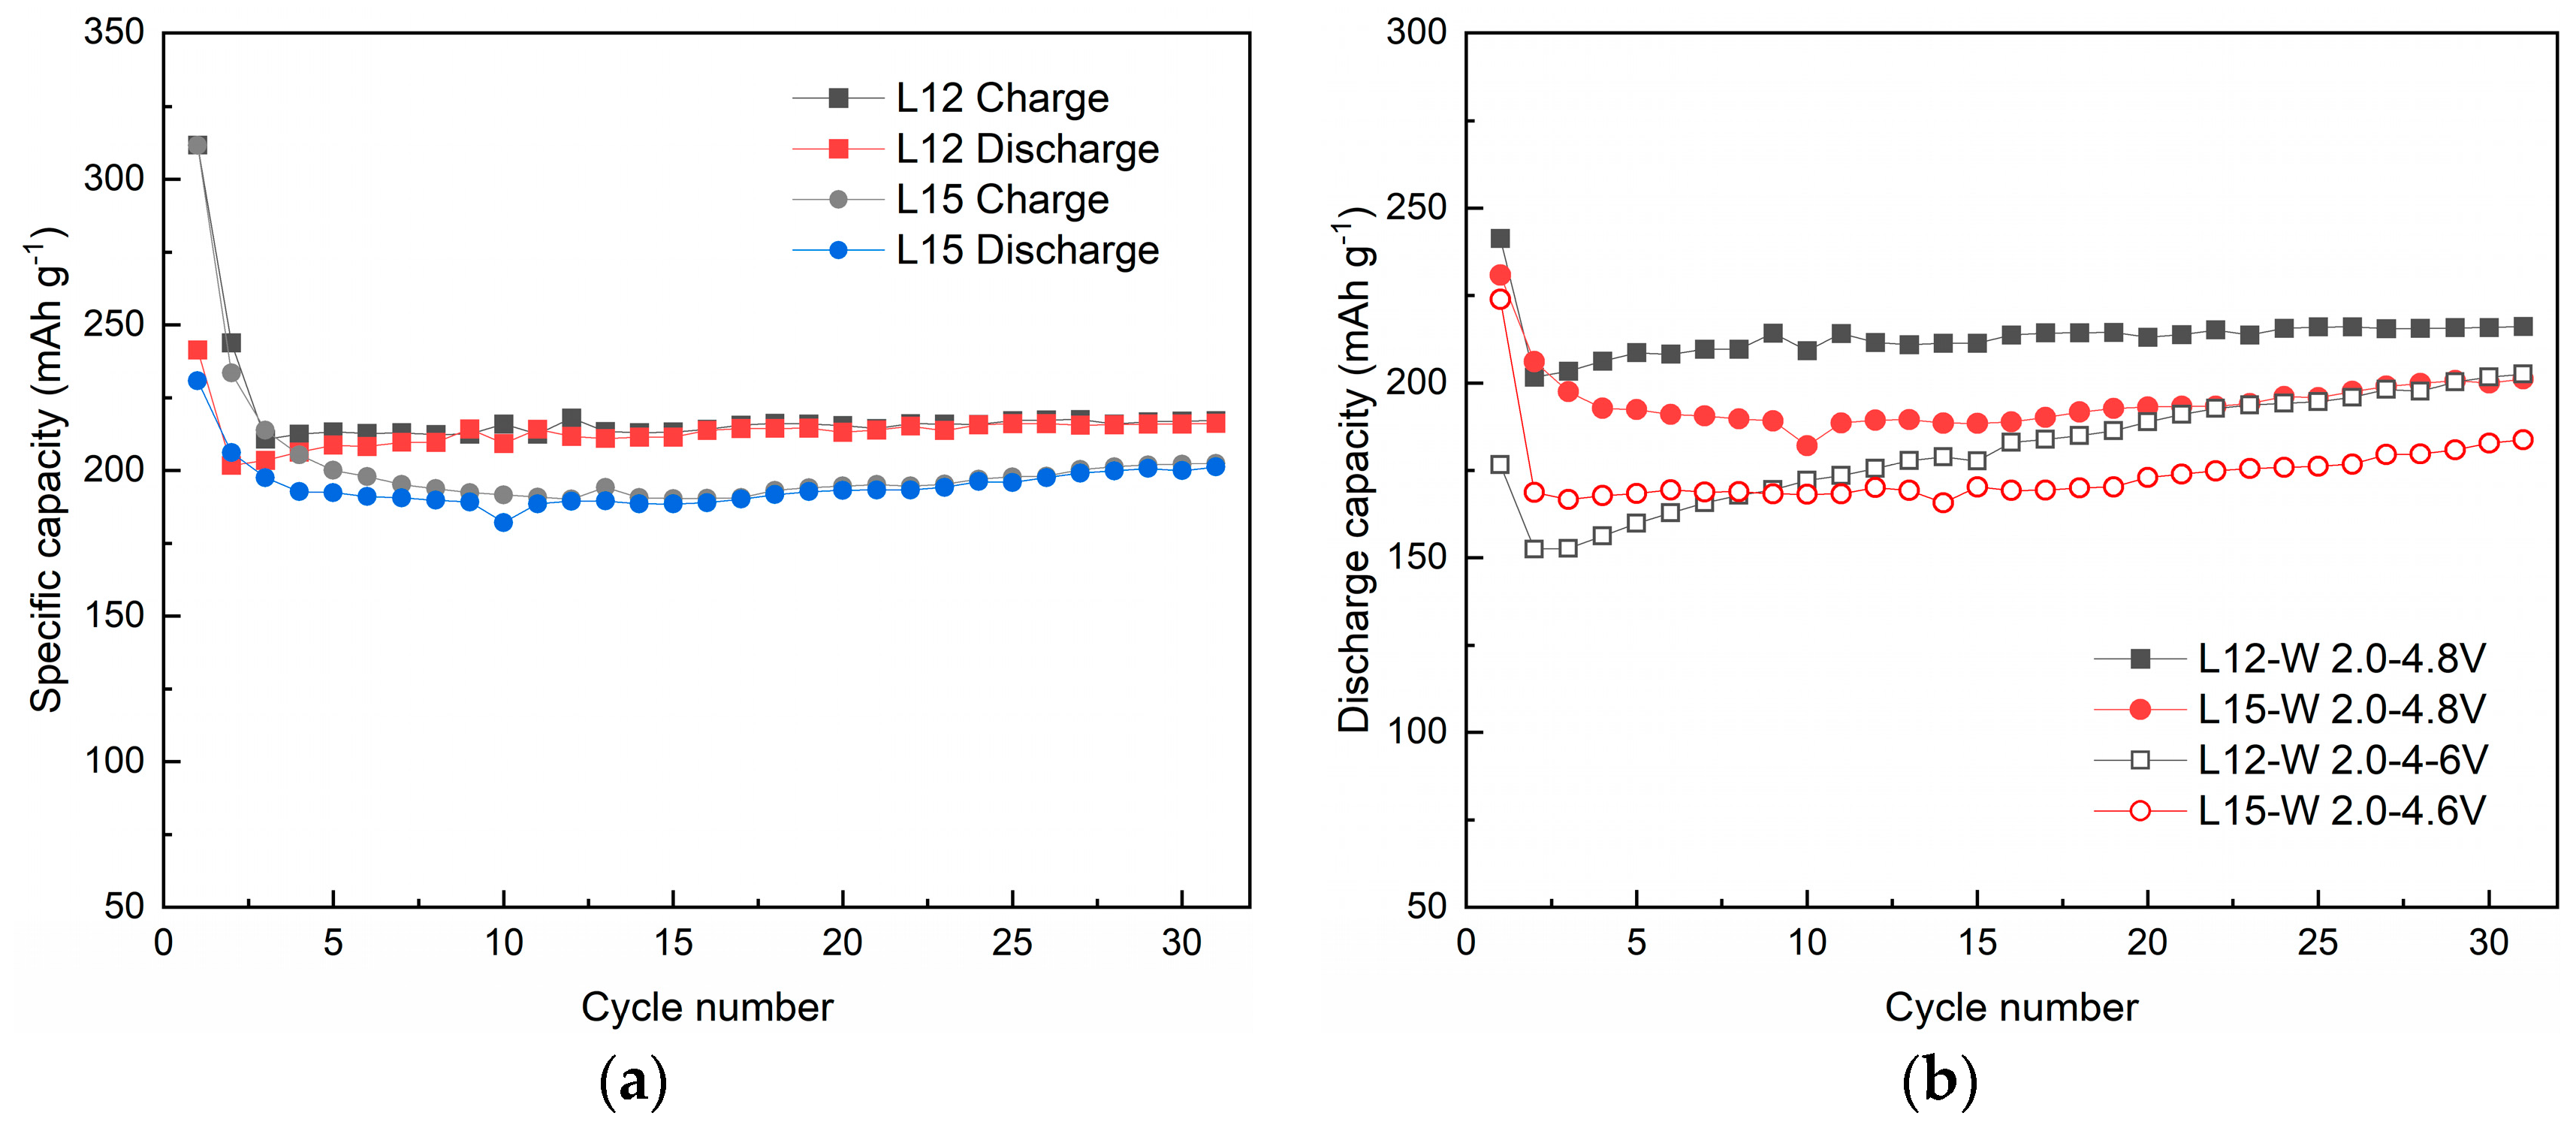
Figure 8a shows the cycling performance of L12 and L15 in the range of 2.0–4.8 V. These samples had a similar capacity loss for charge–discharge curves in the first and second cycles. This process may be related to oxygen release during Li2MnO3 activation in the first cycle and may lead to structural rearrangement at 0.1 C during the second cycle [8,39]. The charge–discharge curves of L12 and L15 gradually became stable with increasing cycle numbers. However, L12 exhibited a more stable cycling performance and a higher capacity retention after 30 cycles. L12 maintained a discharge capacity of 216 mAh g−1 and a capacity retention of 89.6%, whereas L15 had a discharge capacity of 201.2 mAh g−1 and a capacity retention of 87.1%. In addition, the cycling performance of L12 and that of L15 were compared in the two ranges of 2.0–4.8 V and 2.0–4.6 V, as Figure 8b shows. In the range between 2.0 and 4.6 V, L12 and L15 delivered lower initial charge/discharge capacities of 240.31/176.63 mAh g−1 and 277.96/223.99 mAh g−1, respectively. After the first cycle, the discharge capacity of both samples, but especially of L12, gradually increased with increasing cycle numbers. This revealed that a range of 2.0–4.6 V could not entirely active Li2MnO3 during the first cycle. The continuous activation of the Li2MnO3 component increased discharge capacity in the subsequent cycles. However, the discharge capacity of L12 and L15 after 30 cycles in the range of 2.0–4.6 V was still lower than that in the range of 2.0–4.8 V. Therefore, an optimized range of 2.0–4.8 V was used to effectively activate the Li2MnO3 component and improve cycling stability in the subsequent studies. L12 exhibited a higher capacity retention than L15 in both the 2.0–4.8 V and 2.0–4.6 V ranges. These results suggested that the material prepared using Li2CO3 as a lithium source exhibited better electrochemical performance.

4. Conclusions

The precursors of lithium-rich manganese-based cathode materials were prepared using hydroxide coprecipitation. A two-step calcination process was used to synthesize LLO cathode materials. The first stage consisted of preheating at 500 °C for 5 h to ensure a homogenous lithiation of precursors and lithium sources. The second step consisted of calcination at 850 °C for 12 h, which completed the lithiation reaction. The XRD results confirmed that the selected calcination temperature and time enabled the synthesis of well-layered materials and ensured that the materials had no impurities. The crystal structure of the prepared LLO cathode materials exhibited certain defects or stacking faults. Furthermore, the material prepared using the lithium source Li2CO3 and that prepared using LiOH had similar structural properties. The material associated with Li2CO3 exhibited better electrochemical performance than that associated with LiOH. Lithium content had a significant impact on the structure and electrochemical performance of LLO cathode materials. In this study, L10 had a good crystalline structure and delivered the best electrochemical performance. L10 reached the highest initial discharge capacity (279.65 mAh g−1) and initial Coulombic efficiency (82.8%) at 0.03 C. It delivered a discharge capacity of 231.9 mAh g−1 and a capacity retention of 82.9% at 0.1 C after 30 cycles. All samples had an irreversible capacity loss of approximately 20% in the first cycle and could reach a discharge capacity of over 200 mAh g−1 after 30 cycles.
In summary, the synthesized LLO cathode materials had some drawbacks, including undesired morphology, low tap density, irreversible capacity loss in the first cycle, and voltage fading during cycling. To improve electrochemical performance, further work on the optimization of synthesis conditions in coprecipitation and chemical composition is necessary. Research needs to provide advanced characterization techniques for in-depth understanding of the relationship of synthesis conditions/composition/structure/electrochemical behaviors. Moreover, research work focused on improvement of LLO cathode materials to accelerate industrialization, but also giving consideration to both cost-effectiveness and environmental compatibility, is significant.

Author Contributions

Conceptualization, Y.W., M.H. and P.T.; methodology, Y.W., M.H., J.V. and T.H.; investigation, Y.W., M.H., J.V., T.H. and P.T.; writing—original draft preparation, Y.W. and M.H.; writing—review and editing, J.V., T.H., P.T. and U.L.; visualization, Y.W. and J.V.; supervision, U.L. and P.T.; project administration, U.L.; funding acquisition, U.L. All authors have read and agreed to the published version of the manuscript.

Funding

This research was funded by Business Finland for research funding in 2021–2024 (University of Oulu, BATCircle2.0, Dnro 44612/31/2020).

Data Availability Statement

Not applicable.

Conflicts of Interest

The authors declare no conflict of interest.

References

  1. Zuo, W.; Luo, M.; Liu, X.; Wu, J.; Liu, H.; Li, J.; Winter, M.; Fu, R.; Yang, W.; Yang, Y. Li-rich cathodes for rechargeable Li-based batteries: Reaction mechanisms and advanced characterization techniques. Energy Environ. Sci. 2020, 13, 4450–4497. [Google Scholar] [CrossRef]
  2. Li, W.; Song, B.; Manthiram, A. High-voltage positive electrode materials for lithium-ion batteries. Chem. Soc. Rev. 2017, 46, 3006–3059. [Google Scholar] [CrossRef]
  3. Yan, J.; Liu, X.; Li, B. Recent progress in Li-rich layered oxides as cathode materials for Li-ion batteries. RSC Adv. 2014, 4, 63268–63284. [Google Scholar] [CrossRef]
  4. Yu, H.; Zhou, H. High-Energy Cathode Materials (Li2MnO3-LiMO2) for Lithium-Ion Batteries. J. Phys. Chem. Lett. 2013, 4, 1268–1280. [Google Scholar] [CrossRef]
  5. Manthiram, A.; Knight, J.C.; Myung, S.-T.; Oh, S.-M.; Sun, Y.-K. Nickel-Rich and Lithium-Rich Layered Oxide Cathodes: Progress and Perspectives. Adv. Energy Mater. 2016, 6, 1501010. [Google Scholar] [CrossRef]
  6. Zheng, J.; Myeong, S.; Cho, W.; Yan, P.; Xiao, J.; Wang, C.; Cho, J.; Zhang, J.G. Li- and Mn-Rich Cathode Materials: Challenges to Commercialization. Adv. Energy Mater. 2016, 7, 1601284. [Google Scholar] [CrossRef]
  7. Lei, Y.; Ni, J.; Hu, Z.; Wang, Z.; Gui, F.; Li, B.; Ming, P.; Zhang, C.; Elias, Y.; Aurbach, D.; et al. Surface Modification of Li-Rich Mn-Based Layered Oxide Cathodes: Challenges, Materials, Methods, and Characterization. Adv. Energy Mater. 2020, 10, 2002506. [Google Scholar] [CrossRef]
  8. Thackeray, M.M.; Johnson, C.S.; Vaughey, J.T.; Li, N.; Hackney, S.A. Advances in manganese-oxide ‘composite’ electrodes for lithium-ion batteries. J. Mater. Chem. 2005, 15, 2257–2267. [Google Scholar] [CrossRef]
  9. Hy, S.; Liu, H.; Zhang, M.; Qian, D.; Hwang, B.-J.; Meng, Y.S. Performance and design considerations for lithium excess layered oxide positive electrode materials for lithium ion batteries. Energy Environ. Sci. 2016, 9, 1931–1954. [Google Scholar] [CrossRef]
  10. Pan, H.; Zhang, S.; Chen, J.; Gao, M.; Liu, Y.; Zhu, T.; Jiang, Y. Li- and Mn-rich layered oxide cathode materials for lithium-ion batteries: A review from fundamentals to research progress and applications. Mol. Syst. Des. Eng. 2018, 3, 748–803. [Google Scholar] [CrossRef]
  11. He, W.; Guo, W.; Wu, H.; Lin, L.; Liu, Q.; Han, X.; Xie, Q.; Liu, P.; Zheng, H.; Wang, L.; et al. Challenges and Recent Advances in High Capacity Li-Rich Cathode Materials for High Energy Density Lithium-Ion Batteries. Adv. Mater. 2021, 33, e2005937. [Google Scholar] [CrossRef]
  12. Rossouw, M.H.; Thackeray, M.M. Lithium manganese oxides from Li2MnO3 for rechargeable lithium battery applications. Mater. Res. Bull. 1991, 26, 463–473. [Google Scholar] [CrossRef]
  13. Numata, K.; Sakaki, C.; Yamanaka, S. Synthesis of Solid Solutions in a System of LiCoO2-Li2MnO3 for Cathode Materials of Secondary Lithium Batteries. Chem. Lett. 1997, 26, 725–726. [Google Scholar] [CrossRef]
  14. Numata, K.; Sakaki, C.; Yamanaka, S. Synthesis and characterization of layer structured solid solutions in the system of LiCoO2–Li2MnO3. Solid State Ion. 1999, 117, 257–263. [Google Scholar] [CrossRef]
  15. Kalyani, P.; Chitra, S.; Mohan, T.; Gopukumar, S. Lithium metal rechargeable cells using Li2MnO3 as the positive electrode. J. Power Sources 1999, 80, 103–106. [Google Scholar] [CrossRef]
  16. Lu, Z.; MacNeil, D.D.; Dahn, J.R. Layered Cathode Materials Li[NixLi(1/3−2x/3)Mn(2/3−x/3)]O2 for Lithium-Ion Batteries. Electrochem. Solid-State Lett. 2001, 4, A191. [Google Scholar] [CrossRef]
  17. Lu, Z.; Dahn, J.R. Structure and Electrochemistry of Layered Li[CrxLi(1/3−x/3)Mn(2/3−2x/3)]O2. J. Electrochem. Soc. 2002, 149, A1454. [Google Scholar] [CrossRef]
  18. Kim, J.-S.; Johnson, C.S.; Vaughey, J.T.; Thackeray, M.M.; Hackney, S.A.; Yoon, W.; Grey, C.P. Electrochemical and Structural Properties of xLi2M‘O3·(1−x)LiMn0.5Ni0.5O2 Electrodes for Lithium Batteries (M‘ = Ti, Mn, Zr; 0 ≤ x ⩽ 0.3). Chem. Mater. 2004, 16, 1996–2006. [Google Scholar] [CrossRef]
  19. Jarvis, K.A.; Deng, Z.; Allard, L.F.; Manthiram, A.; Ferreira, P.J. Atomic Structure of a Lithium-Rich Layered Oxide Material for Lithium-Ion Batteries: Evidence of a Solid Solution. Chem. Mater. 2011, 23, 3614–3621. [Google Scholar] [CrossRef]
  20. Koga, H.; Croguennec, L.; Mannessiez, P.; Ménétrier, M.; Weill, F.; Bourgeois, L.; Duttine, M.; Suard, E.; Delmas, C. Li1.20Mn0.54Co0.13Ni0.13O2 with Different Particle Sizes as Attractive Positive Electrode Materials for Lithium-Ion Batteries: Insights into Their Structure. J. Phys. Chem. C 2012, 116, 13497–13506. [Google Scholar] [CrossRef]
  21. Shukla, A.K.; Ramasse, Q.M.; Ophus, C.; Duncan, H.; Hage, F.; Chen, G. Unravelling structural ambiguities in lithium- and manganese-rich transition metal oxides. Nat. Commun. 2015, 6, 8711. [Google Scholar] [CrossRef]
  22. Song, Y.; Zhao, X.; Wang, C.; Bi, H.; Zhang, J.; Li, S.; Wang, M.; Che, R. Insight into the atomic structure of Li2MnO3 in Li-rich Mn-based cathode materials and the impact of its atomic arrangement on electrochemical performance. J. Mater. Chem. A 2017, 5, 11214–11223. [Google Scholar] [CrossRef]
  23. Yabuuchi, N.; Yoshii, K.; Myung, S.T.; Nakai, I.; Komaba, S. Detailed studies of a high-capacity electrode material for rechargeable batteries, Li2MnO3-LiCo(1/3)Ni(1/3)Mn(1/3)O2. J. Am. Chem. Soc. 2011, 133, 4404–4419. [Google Scholar] [CrossRef]
  24. Johnson, C.S.; Kim, J.S.; Lefief, C.; Li, N.; Vaughey, J.T.; Thackeray, M.M. The significance of the Li2MnO3 component in ‘composite’ xLi2MnO3·(1−x)LiMn0.5Ni0.5O2 electrodes. Electrochem. Commun. 2004, 6, 1085–1091. [Google Scholar] [CrossRef]
  25. Johnson, C.S.; Li, N.; Lefief, C.; Thackeray, M.M. Anomalous capacity and cycling stability of xLi2MnO3·(1−x)LiMO2 electrodes (M=Mn, Ni, Co) in lithium batteries at 50 °C. Electrochem. Commun. 2007, 9, 787–795. [Google Scholar] [CrossRef]
  26. Thackeray, M.M.; Kang, S.-H.; Johnson, C.S.; Vaughey, J.T.; Benedek, R.; Hackney, S.A. Li2MnO3-stabilized LiMO2 (M = Mn, Ni, Co) electrodes for lithium-ion batteries. J. Mater. Chem. 2007, 17, 3112–3125. [Google Scholar] [CrossRef]
  27. Zheng, J.; Gu, M.; Genc, A.; Xiao, J.; Xu, P.; Chen, X.; Zhu, Z.; Zhao, W.; Pullan, L.; Wang, C.; et al. Mitigating voltage fade in cathode materials by improving the atomic level uniformity of elemental distribution. Nano Lett. 2014, 14, 2628–2635. [Google Scholar] [CrossRef]
  28. Fu, F.; Yao, Y.; Wang, H.; Xu, G.L.; Amine, K.; Sun, S.; Shao, M. Structure dependent electrochemical performance of Li-rich layered oxides in lithium-ion batteries. Nano Energy 2017, 35, 370–378. [Google Scholar] [CrossRef]
  29. Pimenta, V.; Sathiya, M.; Batuk, D.; Abakumov, A.M.; Giaume, D.; Cassaignon, S.; Larcher, D.; Tarascon, J.-M. Synthesis of Li-Rich NMC: A Comprehensive Study. Chem. Mater. 2017, 29, 9923–9936. [Google Scholar] [CrossRef]
  30. Cao, K.; Shen, T.; Wang, K.; Chen, D.; Wang, W. Influence of different lithium sources on the morphology, structure and electrochemical performances of lithium-rich layered oxides. Ceram. Int. 2017, 43, 8694–8702. [Google Scholar] [CrossRef]
  31. Gao, S.; Zhang, Y.; Zhang, H.; Song, D.; Shi, X.; Zhang, L. The effect of lithium content on the structure, morphology and electrochemical performance of Li-rich cathode materials Li1+x(Ni1/6Co1/6Mn4/6)1−xO2. New J. Chem. 2017, 41, 10048–10053. [Google Scholar] [CrossRef]
  32. Yang, X.; Wang, X.; Wei, Q.; Shu, H.; Liu, L.; Yang, S.; Hu, B.; Song, Y.; Zou, G.; Hu, L.; et al. Synthesis and characterization of a Li-rich layered cathode material Li1.15[(Mn1/3Ni1/3Co1/3)0.5(Ni1/4Mn3/4)0.5]0.85O2 with spherical core–shell structure. J. Mater. Chem. 2012, 22, 19666–19672. [Google Scholar] [CrossRef]
  33. Meng, Y.S.; Ceder, G.; Grey, C.P.; Yoon, W.S.; Jiang, M.; Bréger, J.; Shao-Horn, Y. Cation Ordering in Layered O3 Li[NixLi1/3-2x/3Mn2/3-x/3]O2 (0 ≤ x ≤ 1/2) Compounds. Chem. Mater. 2005, 17, 2386–2394. [Google Scholar] [CrossRef]
  34. Boulineau, A.; Croguennec, L.; Delmas, C.; Weill, F. Structure of Li2MnO3 with different degrees of defects. Solid State Ion. 2010, 180, 1652–1659. [Google Scholar] [CrossRef]
  35. Shunmugasundaram, R.; Arumugam, R.S.; Dahn, J.R. A Study of Stacking Faults and Superlattice Ordering in Some Li-Rich Layered Transition Metal Oxide Positive Electrode Materials. J. Electrochem. Soc. 2016, 163, A1394–A1400. [Google Scholar] [CrossRef]
  36. Wang, M.-J.; Shao, A.-F.; Yu, F.-D.; Sun, G.; Gu, D.-M.; Wang, Z.-B. Simple Water Treatment Strategy To Optimize the Li2MnO3 Activation of Lithium-Rich Cathode Materials. ACS Sustain. Chem. Eng. 2019, 7, 12825–12837. [Google Scholar] [CrossRef]
  37. Xiang, Y.; Yin, Z.; Zhang, Y.; Li, X. Effects of synthesis conditions on the structural and electrochemical properties of the Li-rich material Li[Li0.2Ni0.17Co0.16Mn0.47]O2 via the solid-state method. Electrochim. Acta 2013, 91, 214–218. [Google Scholar] [CrossRef]
  38. Shunmugasundaram, R.; Senthil Arumugam, R.; Dahn, J.R. High Capacity Li-Rich Positive Electrode Materials with Reduced First-Cycle Irreversible Capacity Loss. Chem. Mater. 2015, 27, 757–767. [Google Scholar] [CrossRef]
  39. Wenfeng, R.; Zhao, Y.; Hu, X.; Xia, M. Preparation-microstructure-performance relationship of Li-rich transition metal oxides microspheres as cathode materials for lithium ion batteries. Electrochim. Acta 2016, 191, 491–499. [Google Scholar] [CrossRef]
Figure 1. Schematic diagram of the synthesis of LLO cathode materials.
Chemengineering 07 00015 g001
Figure 2. (a) XRD patterns of samples L10–L13; (b) Magnified rectangle region in (a): superlattice peaks of C2/m Li2MnO3 in the 2θ range of 20–25°.
Chemengineering 07 00015 g002
Figure 3. (a) Initial charge–discharge profiles of L10–L13 at 0.03 C within 2.0–4.8 V; (b) charge-discharge profiles of L10–L13 for the 31st cycle at 0.1C within 2.0–4.8 V; (c) Voltage profiles of L10–L13 for comparison of 3rd discharge and 31st discharge; (d) Voltage profiles of L10 for comparison of the 1st discharge, 3rd discharge and 31st discharge.
Chemengineering 07 00015 g003
Figure 4. (a) Cycling performance of samples L10–L13 for 30 cycles in the range of 2.0–4.8 V; (b) Charge–discharge curves of sample L10 for 30 cycles in the range of 2.0–4.8 V.
Chemengineering 07 00015 g004
Figure 5. (a) XRD pattern of synthesized material with different lithium sources: LiOH and Li2CO3; (b) Magnified rectangle region in (a): superlattice peaks of C2/m Li2MnO3 in the 2θ range of 20–25°.
Chemengineering 07 00015 g005
Figure 6. SEM images of samples L12 and L15 under different degrees of magnification.
Chemengineering 07 00015 g006
Figure 7. (a) Initial charge–discharge profiles of L12 and L15 at 0.03C within 2.0–4.8 V; (b) Voltage profiles of L12 and L15 for comparison of the 1st discharge, 3rd discharge and 31st discharge.
Chemengineering 07 00015 g007
Figure 8. (a) Charge–discharge curves of L12 and L15 for 30 cycles within 2.0–4.8 V; (b) Cycling performance of L12 and that of L15 were compared in 2.0–4.8 V and 2.0–4.6 V for 30 cycles.
Chemengineering 07 00015 g008
Table 1. Chemical composition of samples L10–L13 prepared by various Li/TM ratios.
SampleExperimental Li/Mn/Ni/Co Molar RatioLi/TM RatioChemical Formula
LiMnNiCo
L101.310.570.150.151.52Li1.31Mn0.57Ni0.15Co0.15O2
L111.310.530.140.141.64Li1.31Mn0.53Ni0.14Co0.14O2
L121.230.470.120.121.73Li1.23Mn0.47Ni0.12Co0.12O2
L130.890.320.080.081.86Li0.89Mn0.32Ni0.08Co0.08O2
Table 2. Lattice parameters of samples L10–L13 for existence of the monoclinic Li2MnO3 phase.
Samplea/Åb/Åc/ÅAlpha/°Gamma/°Beta/°
L104.9378.5345.0289090109.64
L114.9288.5275.0179090109.31
L124.9168.5185.0339090109.46
L134.9168.5115.0279090109.41
Table 3. Initial charge–discharge performance of samples L10–L13 at 0.03 C within 2.0–4.8 V.
SampleInitial Charge Capacity/mAh g−1Initial Discharge Capacity/mAh g−1Irreversible Capacity/mAh g−1Initial Coulumbic Efficiency/%
L10337.77279.6558.1282.8
L11325.66255.2370.4378.4
L12311.75241.3470.4177.4
L13348.28221.44126.8463.6
Table 4. Chemical composition of samples L12 and L15 prepared by different lithium sources.
SampleLithium SourceExperimental Li/Mn/Ni/Co Molar RatioChemical Formula
LiMnNiCo
L12Li2CO31.230.470.120.12Li1.23Mn0.47Ni0.12Co0.12O2
L15LiOH1.240.490.120.12Li1.24Mn0.49Ni0.12Co0.12O2
Table 5. Lattice parameters of samples L12 and L15 for existence of the monoclinic Li2MnO3 phase.
SampleLithium Sourcea/Åb/Åc/ÅAlpha/°Gamma/°Beta/°
L12Li2CO34.9168.5185.0339090109.46
L15LiOH4.9208.5165.0359090109.41
Table 6. Initial charge–discharge performance of L12 and L15 at 0.03 C in the range of 2.0–4.8 V.
SampleLithium SourceInitial Charge Capacity/mAh g−1Initial Discharge Capacity/mAh g−1Irreversible Capacity/mAh g−1Initial Coulumbic Efficiency/%
L12Li2CO3311.75241.3470.4177.4
L15LiOH311.66230.8680.8074.1
Disclaimer/Publisher’s Note: The statements, opinions and data contained in all publications are solely those of the individual author(s) and contributor(s) and not of MDPI and/or the editor(s). MDPI and/or the editor(s) disclaim responsibility for any injury to people or property resulting from any ideas, methods, instructions or products referred to in the content.

