Article

Development of an Environmentally Friendly Technology for the Treatment of Aqueous Solutions with High-Purity Plasma for the Cultivation of Cotton, Wheat and Strawberries

by
Mukhsindjan Kh. Ashurov
1,*,
Erkindjan M. Ashurov
2,
Maxim E. Astashev
3,
Ilya V. Baimler
3,
Sergey V. Gudkov
3,4,5,
Evgeny M. Konchekov
3,
Vasily N. Lednev
3,
Natalya A. Lukina
3,
Tatyana A. Matveeva
3,
Anatoly G. Markendudis
2,
Andrey V. Onegov
6,
Dilbar K. Rashidova
7,
Ruslan M. Sarimov
3,
Konstantin F. Sergeichev
3,
Shukhrat T. Sharipov
7,
Alexander V. Simakin
3,
Igor G. Smirnov
4,
Sergey Y. Smolentsev
6,
Muzzafar M. Yakubov
7,
Denis V. Yanykin
3 and
Ivan A. Shcherbakov
3
add Show full author list remove Hide full author list
1
Institute of Nuclear Physics of the Academy of Sciences of the Republic of Uzbekistan, Tashkent 100214, Uzbekistan
2
Limited Liability Company “Souvenir”, Tashkent 100117, Uzbekistan
3
Prokhorov General Physics Institute of the Russian Academy of Sciences, Moscow 119991, Russia
4
Federal Scientific Agroengineering Center VIM, Moscow 109428, Russia
5
The Institute of Biology and Biomedicine, Lobachevsky State University of Nizhny Novgorod, Nizhny Novgorod 603105, Russia
6
Mari State University, Yoshkar-Ola 424001, Russia
7
Research Institute of Breeding, Seed Production and Agricultural Technology of Cotton Growing, Tashkent 100140, Uzbekistan
*
Author to whom correspondence should be addressed.
ChemEngineering 2022, 6(6), 91; https://doi.org/10.3390/chemengineering6060091
Submission received: 16 September 2022 / Revised: 16 October 2022 / Accepted: 11 November 2022 / Published: 23 November 2022
(This article belongs to the Special Issue Catalytic Systems for Biomass Valorization)

Abstract

:
The microwave setup for obtaining plasma-activated water (PAW) has been created. PAW contains significant concentrations of H2O2 and NO3, has a reduced content of O2, high conductivity, a high redox potential and low pH. Likewise, the specific electrical conductivity and concentration of H2O2 and NO3 linearly depend on the treatment time. These parameters are simple and convenient markers for controlling the preparation of PAW. It has been established that PAW solutions with a concentration of 0.5–1.0% increase the germination energy, protect against fusarium and hyperthermia in cotton, wheat and strawberry seeds. In addition, PAWs have a positive effect on the growth rate of plants in the early stages of development. The use of PAW provides significant benefits over the chemical preparations Dalbron and Bakhor, so-called seed germination stimulators (SDS).

1. Introduction

Currently, there are a large number of ways to obtain low-temperature plasma [1]. Such plasma is widely used in natural sciences, such as chemistry, physics, biology, medicine and agriculture [2,3,4]. It is known that low-temperature plasma interacts with various molecules, including biological ones [5]. For the first time, low-temperature plasma was used towards the end of the last century for the inactivation of bacteria [6]. After that, a huge number of original articles appeared in world literature describing new applications in the life sciences. A number of modern works are summarized in specialized review articles [7,8,9]. In addition to phenomenology, numerous articles have been devoted to the mechanisms mediating the interaction of plasma with the body, including practical applications in agriculture [10] and the food industry [11]. It is now known that the biological effects of low temperature plasma are mediated by reactive oxygen species (ROS) and reactive nitrogen species (RNS) [12]. Quite often, these two classes of compounds are combined into one [13]. The nature of plasma chemical reactions is quite complex. Most studies mention the superoxide anion radical, hydroxyl radical, hydroperoxide radical, singlet oxygen, nitric oxide and peroxynitrite [14]. The lifetime of most of these compounds is short; for example, the lifetime of the hydroxyl radical is on the order of 1 ns, while the lifetime of the superoxide anion radical is on the order of 10 μs [15]. In general, typical lifetimes vary from tens of nanoseconds to several seconds, depending on the experimental conditions [13]. It is obvious that these compounds are registered only at the moment of plasma interactions with matter. Usually, the model of plasma interaction with biological tissues is aqueous solutions [16]. This is due to two reasons, firstly, living matter consists mainly of water, and secondly, water is the medium in which most radical reactions and interactions take place. After the interaction of plasma with water, a change in such physicochemical characteristics of water as the hydrogen index, redox potential, electrical conductivity and others is observed [17]. Stable compounds are formed in water, namely, H2O2, O3 and nitrogen oxides (NOx) [18]. When reacting with water, nitrogen oxides form nitric and nitrous acids; when reacting with H2O2, peroxynitrite (ONOO) [19]. It is the formed stable compounds that are responsible for a number of changes in the physicochemical characteristics of aqueous solutions. Another part of the changes is associated with changes in the concentration and composition of gases dissolved in water and aqueous solutions [20].
Today, there are a large number of original and review papers describing the changes occurring in plasma-activated water [21,22,23,24,25,26]. With a search query (PAW, plasma-activated water) in the Google Scholar system (https://scholar.google.com, accessed on 25 August 2022) in English, there are approximately 45 thousand works, of which almost 3.5 thousand are for the first half of 2022. When analyzing the data in these works, the following observations can be made. When comparing the changes observed in plasma-activated water, it can be argued that even under effects similar in intensity and other physical parameters, the measured changes in water can significantly differ. These differences are probably associated with the presence of microimpurities in the plasma. Microimpurities in plasma are also ionized and participate in all radical reactions [27]. An increase in the number of various types of radicals leads to a significant increase in the final products, some of which can lead to the termination of chain radical reactions, which leads to a significant change in the yields of various products. Another significant problem is the appearance in the plasma of metal ions of variable valence, such as iron, copper, nickel, cobalt, etc. It is known that metals of variable valence can catalyze the Fenton reaction, in which H2O2 decomposes [28]. Obviously, H2O2, on the one hand, is the final link in the interaction of ROS, on the other hand, it is necessary for generation in aqueous solutions of ONOO [29]. The appearance of even trace amounts of metals of variable valence in plasma-activated water can also lead to a significant change in the yields of various products [30]. The problem of impurities is observed not only in plasma, but also in activated water. Water of various degrees of purification is often used (technical water, drinking water, distillate, bidistillate, etc.).
It is known that, due to its unique properties, PAW significantly improves seed germination, and plants grown from these seeds are more resistant to various abiotic factors (drought, soil salinity, etc.). PAW obtained at our facility does not contain microimpurities, including metals, therefore, it is capable of maintaining a high concentration of H2O2 for a long time, which is an activator of a large number of biological processes. Hydrogen peroxide decomposes to release water and O2, which is why it is sometimes called an environmental stimulant. The use of such technologies will ultimately make it possible to obtain environmentally friendly agricultural products.

2. Materials and Methods

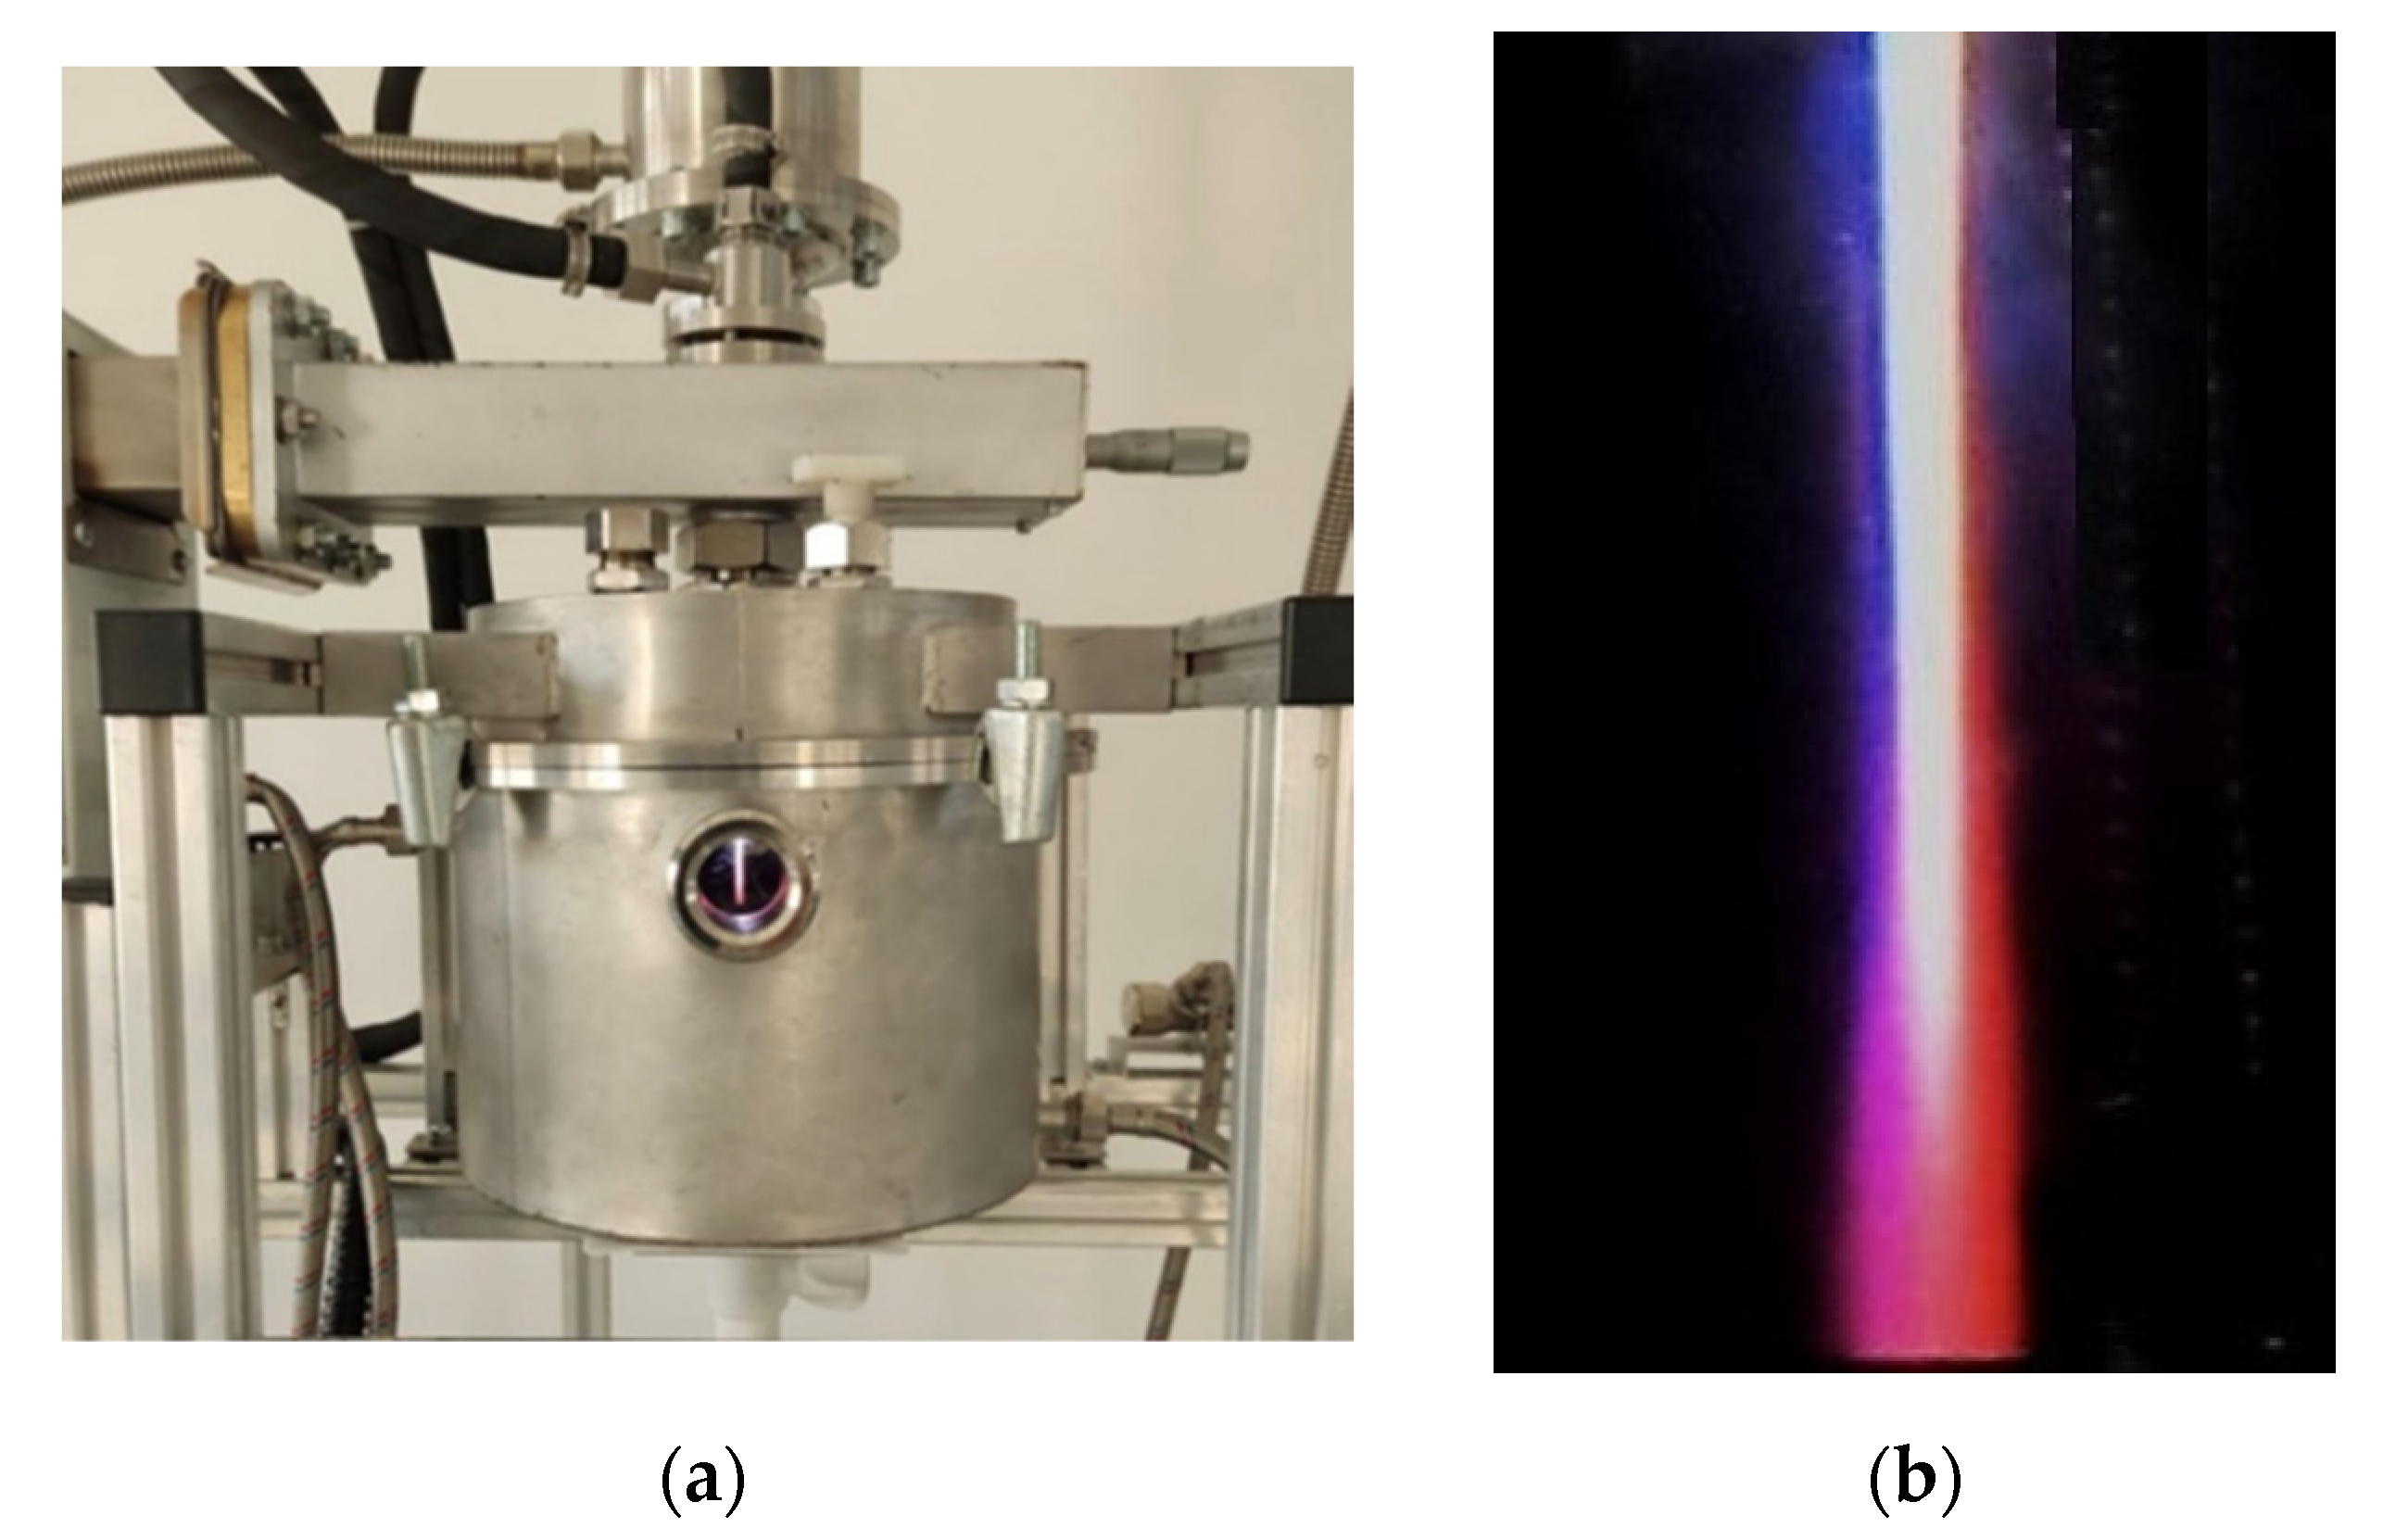
2.1. Installation for PAW Production

Figure 1a shows a general view of the industrial installation, on which we obtained solutions of plasma-activated water. The experiments used deionized water with a specific electrical resistance of 10 MΩ·cm. The installation diagram is shown in Figure 1b. The energy source of the torch microwave discharge is a magnetron from a household microwave oven (frequency 2.45 GHz, wavelength 12.24 cm, power 0.9 kW), used in the continuous generation mode. The lower type TE10 wave is excited by a magnetron antenna in a rectangular waveguide with a cross-section of 45 × 90 mm2, which is then converted into a TEM wave in a coaxial waveguide. The central conductor of the coaxial waveguide, which is a copper tube with an outer diameter of 6 mm, ends with a narrow nozzle with a hole with a diameter of 1.5 mm. The argon jet flows out of the nozzle at a high directed velocity of ~30–50 m/s (the flow rate of argon gas is approximately 3–4 L/min) at a pressure of just over 1 atm. The detachment of the plasma jet from the nozzle by a neutral argon flow is due to the fact that the velocity of the gas jet is greater than the velocity of propagation of the ionization front along the gas jet to the nozzle. Therefore, a gap of neutral argon is formed between the plasma jet and the nozzle. Since the nozzle does not have direct contact with the plasma jet, it does not heat up, and there is no evaporation of its parts, which allows us to consider the discharge electrodeless. The coaxial part of the plasma torch is hermetically isolated from the rectangular waveguide by a radio-transparent quartz insulator tube. The plasma torch is placed in a stainless-steel chamber to protect the plasma torch from microwave radiation and to isolate the reactor from the ambient air. Pure gases, such as, argon, nitrogen, and others, can be selectively supplied with a mixer through a tube into the chamber, which, in the presence of plasma, can enter into chemical reactions with water and its vapor. The exhaust gas and partly the water vapor, due to a slight overpressure, flow into the chemical exhaust ventilation through the exhaust pipe.
The flow of outgoing gases is regulated by AP-40P flow meters at the outlet of balloon reducers. The treated water in a vessel composed of heat-resistant glass or quartz is placed on a rod, which, when moving upwards, brings the water into contact with the torch (Figure 2). The gas-dynamic pressure of the jet forms a cavity on the surface of the water, in which energy is transferred from the torch to the liquid. In this case, the evaporation of water, the formation of molecular hydrogen and oxygen, hydrogen peroxide and other products are observed. The microwave power is transmitted along the coaxial waveguide to the plasma jet due to the capacitive coupling between the nozzle and the plasma. The diameter of the brightest “rod” of the plasma jet is no more than 0.2–0.3 cm. The length of the rod does not exceed a quarter of the wavelength of microwave radiation, λ/4 ≈ 3 cm, which is determined by the laws of electrodynamics. The electron temperature is ∼1.5 eV, and the gas temperature is ∼4000 K. The torch carries ions and excited argon atoms to the water’s surface at a high, directed velocity. Water is treated in a quartz cell placed on the lift, which allows you to vary the distance from the water surface to the nozzle. The gas-dynamic pressure of the argon jet creates a hole 1.5 cm in diameter and 1.5 cm deep on the water’s surface. Interaction with water of argon plasma containing a high concentration of metastably excited Ar atoms with an energy of 11.5–11.7 eV and a lifetime of >1.3 s is able to activate chemical reactions with water with the formation of atomic oxygen and hydrogen, hydroxyl radical, hydroperoxide radical, superoxidanion radical, hydrated electron, ozone, molecular hydrogen and oxygen and hydrogen peroxide.

2.2. Physicochemical Characterization of Plasma-Activated Water

Redox potential, pH and electrical conductivity were measured using a high-precision measuring station, the S470 SevenEx Cellence (Mettler Toledo, Columbus, OH, USA). Sensor electrodes recommended by the manufacturer, InLab Expert Pro-ISM and InLab731-ISM (Mettler Toledo, Columbus, OH, USA), were used. Using a magnetic stirrer, all aqueous solutions were mixed during measurements in a laminar mode (frequency of approximately 3 Hz). The details of experimental measurements were described earlier [31,32,33].
The concentration of molecular oxygen dissolved in aqueous solutions was recorded using an AKPM-1-02 polarograph (Bioanalytical Systems and Sensors, Moscow, Russia) [34]. The measurements took into account the atmospheric pressure measured by the PRX-7001t instrument (Casio, Tokyo, Japan), and the temperature of the samples was measured with a temperature compensator. The concentration of nitrate anions was determined using a LAQUAtwin B-741 (Horiba, Tokyo, Japan) nitrate meter. The content of free chlorine in solutions was measured using a 2,793,944 kit (Hach, Ames, IO, USA). Details of experimental measurements were described earlier [35].
For the quantitative determination of hydrogen peroxide in aqueous solutions, a highly sensitive method of enhanced chemiluminescence in luminol-4-iodophenol-horseradish peroxidase was used [36]. Luminescence intensity was determined on a Biotox-7A chemiluminometer (ANO Ecology, Moscow, Russia). Hydrogen peroxide solutions of known concentrations were used for calibration. The details of experimental measurements were described earlier [37]. The amount of hydroxyl radicals was determined using a fluorescent probe-coumarin-3carboxylic acid. Interacting with the hydroxyl radical, coumarin-3carboxylic acid is converted into 7-OH-coumarin-3carboxylic acid with strong fluorescence (λexem = 400/450 nm) [38].

2.3. Plant Cultivation Conditions

Seeds of the cotton variety C-8290, wheat Krasnodar-99 and garden strawberry varieties “Zenga Zengana” were used. The germination of seed and germination energy were studied. Seed moisture was determined according to [39], seed weight according to [40] and germination energy according to [41]. When working with cotton, the quality of cotton seeds for sowing and technical conditions were carried out according to [42,43,44,45]. For analysis, we used a Contador seed counter with a Contafill packaging device, an electric oven SESh-3M, a Memmert UFB 400 dry oven, an LP-113 thermostat (Labor Muszeripari Muvek Esztergom), a Kett FD 230 moisture meter, and a Sartorius LA230S analytical balance. In one experiment, 100 seeds were used in each group in four replications.
In the study of fusarium, healthy seeds (–) and seeds affected by fusarium (+) were used. The proportion of affected seeds was 85% for cotton, 98% for wheat, and 76% for strawberries. Fusarium was identified by the presence of the pathogen Fusarium sp. in plant tissues with the use of microscopy [33], fluorometry [46], and PCR analysis. Samples were provided by the All-Russian Phytopathology Research Institute (Russian Federation).

2.4. DNA Extraction and Real-Time PCR

To verify the results of microscopy and fluorometry, the diagnosis of Fusarium was performed with real-time PCR. Isolation of genomic DNA from the samples was performed using cetyltrimethylammonium bromide (CTAB method). A detailed description of the method is given in [47]. Primers specific to these pathogens were used to identify Fusarium avenaceum, Fusarium graminearum and Fusarium oxysporum in the respective samples (Table 1). All procedures are described in detail earlier in [33].

3. Results and Discussion

3.1. Physicochemical Characterization of PAW

It is shown that plasma activation of water leads to a significant increase in its electrical conductivity (Table 2). The specific electrical conductivity of water after placing it in the reactor was at a level of 0.003 mS/cm. In one minute of exposure to plasma, the electrical conductivity increased by 50 times. It is shown that the electrical conductivity of water depends linearly on the time of exposure to the plasma torch.
It has been shown that when a plasma torch acts on water, the concentration of O2 dissolved in water changes (Table 2). The concentration of O2 dissolved in water after placing it in the reactor was at the level of 268 μM. For one minute of exposure to water with a plasma torch, the concentration of O2 in it decreased by 9 μM. When a plasma torch is exposed to water for 5 min, the concentration of O2 decreases by more than 5%.
Likewise, when a plasma torch acts on water, its acidification occurs, and the values of the hydrogen index decrease (Table 2). The pH of water after placing it in the reactor was at the level of 5.2. For one minute of exposure to plasma, the pH of water decreases by 2.2 units, which corresponds to an increase in the concentration of protons by more than two orders of magnitude. With further processing, the pH of the water decreases by 0.1 units in 5 min.
Plasma activation also leads to an increase in the redox potential of water (Table 2). The redox potential of water after placing it in the reactor was at the level of 390 mV. For one minute of exposure to plasma, the redox potential of water increases by 15%. With further exposure to plasma, the redox potential of water does not change.
It has been shown that intense generation of NO3 occurs during plasma treatment of water (Table 2). NO3 in the water poured into the reactor chamber by the method used by us were not identified. In one minute of exposure a to plasma torch, the concentration of NO3 in water reached approximately 1 mM. During further water treatment, the concentration of NO3 linearly depended on the time of exposure of the plasma torch to water.
It has been shown that intense generation of OH occurs during plasma treatment of water (Table 2). OH was not present in the control water at a concentration possible for our measurement method. On the other hand, in one minute of exposure to a plasma torch, the concentration of OH in water reached approximately 13 mM. During further water treatment, the concentration of OH linearly depended on the time of exposure of the plasma torch to water.
It has been shown that the plasma treatment of water results in the intense generation of H2O2 (Table 2). The concentration of H2O2 in the water poured into the reactor chamber was at a level of 4–5 nM. In one minute of exposure to a plasma torch, the concentration of H2O2 molecules in water increases by six orders of magnitude. It has been established that the amount of H2O2 generated by the installation linearly depends on the time of plasma exposure.

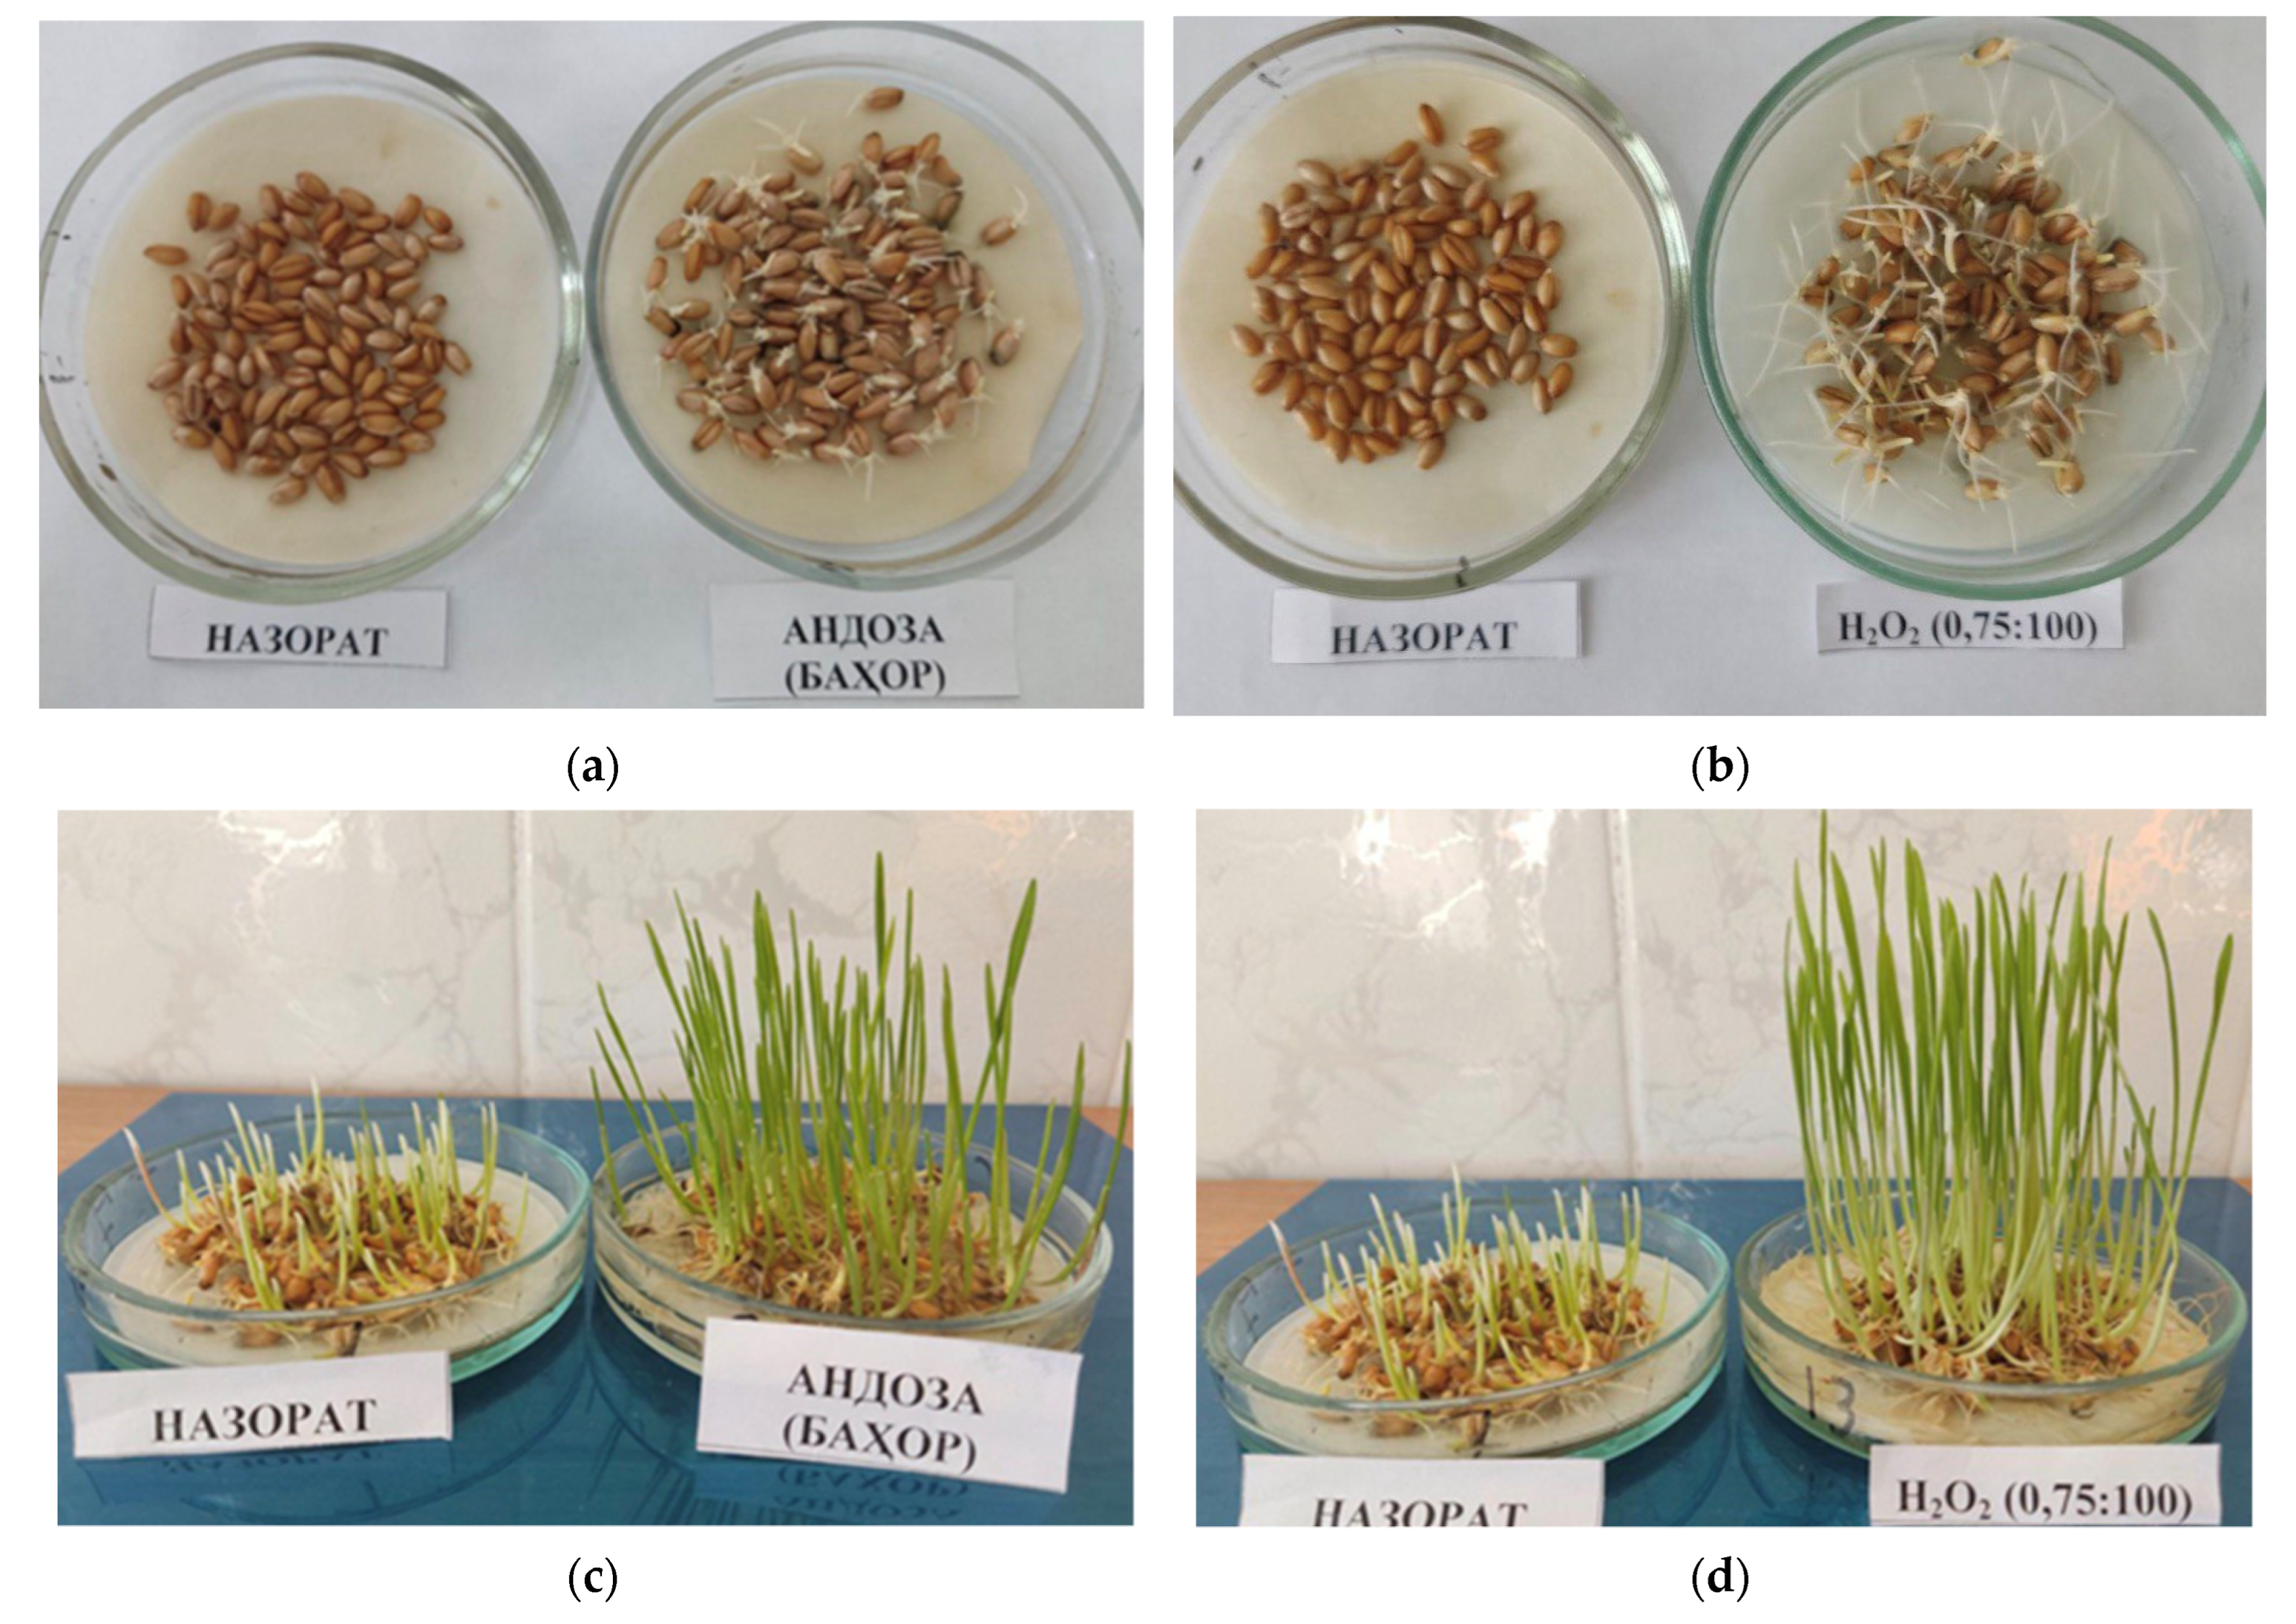
3.2. Germination Energy of Seeds Treated with PAW

Under laboratory conditions, the effect of PAW diluted to a concentration of 1.0%, 0.75% and 0.5% on the germination energy and germination of cotton, wheat and strawberry seeds was studied (Table 3). Untreated seeds were used as a control group. As a positive control, we used Dalbron, the most common in the real agriculture of Uzbekistan, for the treatment of cotton seeds, and Bakhor, the nonspecies-specific agent for seed treatment. In each experimental group, at least 100 seeds were used per experiment. Seed stratification took place at 3 °C under conditions of relatively high humidity for 4 weeks. The seeds had a moisture content of approximately 7%. Seed treatment with PAW solutions was carried out at the beginning of seed germination. Plant length was measured on the 14th day of experiments with an accuracy of 1 mm. From the data given in Table 3, it follows that a diluted PAW of 1.00, 0.75 or 0.50% has the greatest stimulating effect on the seeds. The germination energy of cotton seeds when treated with a seed germination stimulator increases by 4%. When treated with PAW, germination energy increased by 4% when treated with 1% PAW solution, by 6% when treated with 0.75% PAW solution, and by 5% when treated with 0.5% PAW solution. The germination energy of wheat seeds when treated with a seed germination stimulator increases by 2%. When treated with PAW, the germination energy increased by 3% when treated with 1% and 0.75% PAW solutions and by 2% when treated with a 0.5% solution. The germination energy of strawberry seeds, when treated with a seed germination stimulator, increases only by 1%. When treated with PAW, the germination energy increases by 5% when treated with a 1% PAW solution, by 6–7% when treated with 0.5% or 0.75% PAW solutions. The percentage of seed germination also changes in a similar way. In general, seeds treated with PAW at various concentrations have an advantage over untreated seeds and those treated with growth stimulants Dalbron and Bakhor.

3.3. Development of Plants Grown from Seeds Treated with PAW

Strawberry seeds showed the best germination and germination energy. In general, strawberry seeds treated with PAW developed the most actively. For example, strawberry plants grown from PAW-treated seeds had an average length of approximately 13 mm by day 25, while control plants had an average length of approximately 9 mm. That is, the difference between the processed PAW and the control is more than 30%.
The growth and development of cotton plants grown from seeds treated with PAW were studied (Table 4). To do this, the length of the aboveground and underground parts of the seedlings were measured on days 4, 7, 9 and 11 after germination. It is shown that plants grown from seeds treated with a growth stimulator by the 4th day have an advantage, the total length of plants is 25% longer compared to the control group. By the 11th day, the advantage in length is already approximately 10%. When treating seeds with PAW, diluted to a concentration of 1%, by the 4th day, the total length exceeded the control values by 40%, by the 11th day by more than 25%. When treating seeds with PAW, diluted to a concentration of 0.75%, by the 4th day, the total length exceeded the control values by 25%, by the 11th day by more than 30%. When treating seeds with PAW, diluted to a concentration of 0.5%, by the 4th day the total length exceeded the control values by more than 35%, by the 11th day by more than 35%. It should be noted that during the treatment of PAW seeds, the most active development of the aboveground part of the plant is observed, compared with the underground part of the plant. For example, by day 11, plants grown from seeds treated with PAW at a concentration of 0.5% had an increase in the aboveground part of approximately 45% compared to the control, while the underground part of the plant was only 25% ahead of the control values in terms of development. The worst results in terms of seed germination and seed germination energy were obtained for wheat. In this regard, a more detailed study of the developmental history of PAW-treated seeds was carried out. The best lengths were obtained from seedlings treated with PAW. Figure 3 shows representative photographs of the experiment.
The growth and development of wheat plants grown from seeds treated with PAW were studied (Table 5). For this, the length of the aboveground and underground parts of the seedlings was measured on days 7 and 10 after germination. It is shown that plants grown from wheat seeds treated with a growth stimulator have an advantage by the 7th day. The total length of the plants was 30% longer than the control values. By day 10, the length advantage was only 20% compared to the control values. When treating seeds with PAW, diluted to a concentration of 1%, by the 7th day, the total length exceeded the control values by almost 60%, by the 10th day by more than 45%. When seeds were treated with PAW, diluted to a concentration of 0.75%, by the 7th day the total length exceeded the control values by 60%, by the 10th day only by 50%. When treating seeds with PAW, diluted to a concentration of 0.5%, by the 7th day the total length of wheat plants exceeded the control values by more than 55%, by the 10th day by more than 45%. It should be noted that during the treatment of PAW seeds, the most active development of the above-ground part of the plant is observed, compared with the underground part of the plant. For example, by the 10th day, plants grown from seeds treated with PAW at a concentration of 0.5% had an increase in the aboveground part of approximately 90% compared to the control, while the underground part of the plant was only 10% ahead of the control values in development.

3.4. Influence of PAW on Seed Infestation with Fusarium

To study the fungicidal properties of PAW, healthy (–) and Fusarium-affected (+) seeds of cotton, wheat, and strawberries were used. The proportion of affected seeds, according to microscopy data, was 85, 92 and 76% for cotton, wheat and strawberries, respectively. Fusarium was identified with microscopy by the presence of the pathogen Fusarium sp. In plant tissues. (Table 6). It was shown that soaking the seeds in SDS significantly reduced the presence of fungus on the surface of the seeds. Soaking seeds in PAW led to a significant reduction in the degree of seed infection. It should be noted that PAW at a concentration of 1% had a more significant effect in all groups compared to PAW at concentrations of 0.75% and 0.5%. It should be noted that using microscopy after PAW treatment is often difficult to distinguish the degree of infection of seeds, as well as to reliably identify the type of phytopathogen. Moreover, the microscopy method we used confirms only the presence of cells on the surface, but does not allow for determining the ratio of living cells to dead cells.
Fusarium was also identified by fluorometry. The method was based on the difference between the fluorescent signals of seed and Fusarium sp. (Table 6). It was found that seed treatment with SDS led to a decrease in the fluorescent signal. Seed soaking in PAW also led to a significant decrease in fluorescence intensity. It should be noted that PAW 1% had a more significant effect compared to the PAW 0.75% and PAW 0.5% groups. Most of the fluorometric techniques used in crop and animal husbandry are extremely fast and low-cost [48], however, they do not allow identification of the type of phytopathogen or its viability.
Additionally, the degree of infection of the seeds was investigated using the RT-PCR method (Table 6). In the samples of infected cotton (+) and wheat (+), the presence of Fusarium DNA was confirmed (Ct ~ 13 and 19). F. oxysporum DNA (Ct ~ 27) was confirmed on infected strawberry seeds. At the same time, no (−) fungal DNA was detected in the samples of all reference seeds. Soaking seeds in SGS significantly affected the concentration of fungal DNA, the number of cycles increased significantly (from 30 to 190%). After soaking the seeds in PAW, 1% of the phytopathogen DNA was not detected. When seeds were soaked in PAW, 0.75% of the phytopathogen DNA was found only in wheat. Seed soaking in PAW 0.5% significantly affected the concentration of fungal DNA, the number of cycles increased significantly (from 40 to 140%).
By analyzing the data obtained by three different methods, it can be argued that the best results in the fight against fungal infection using PAW were achieved on cotton and strawberry seeds (Table 7). Somewhat less effective is the use of PAW in the treatment of wheat seeds. All methods used by us cannot confirm the viability of the phytopathogen, therefore, the germination of infected seeds was carried out after treatment with GHS or PAW. It was shown that among all the studied crops, the largest percentage of PAW-treated seeds infected with Fusarium sprouts was in cotton, and slightly less in strawberries and wheat. Thus, PAW can be used as a real tool to combat Fusarium in seeds.

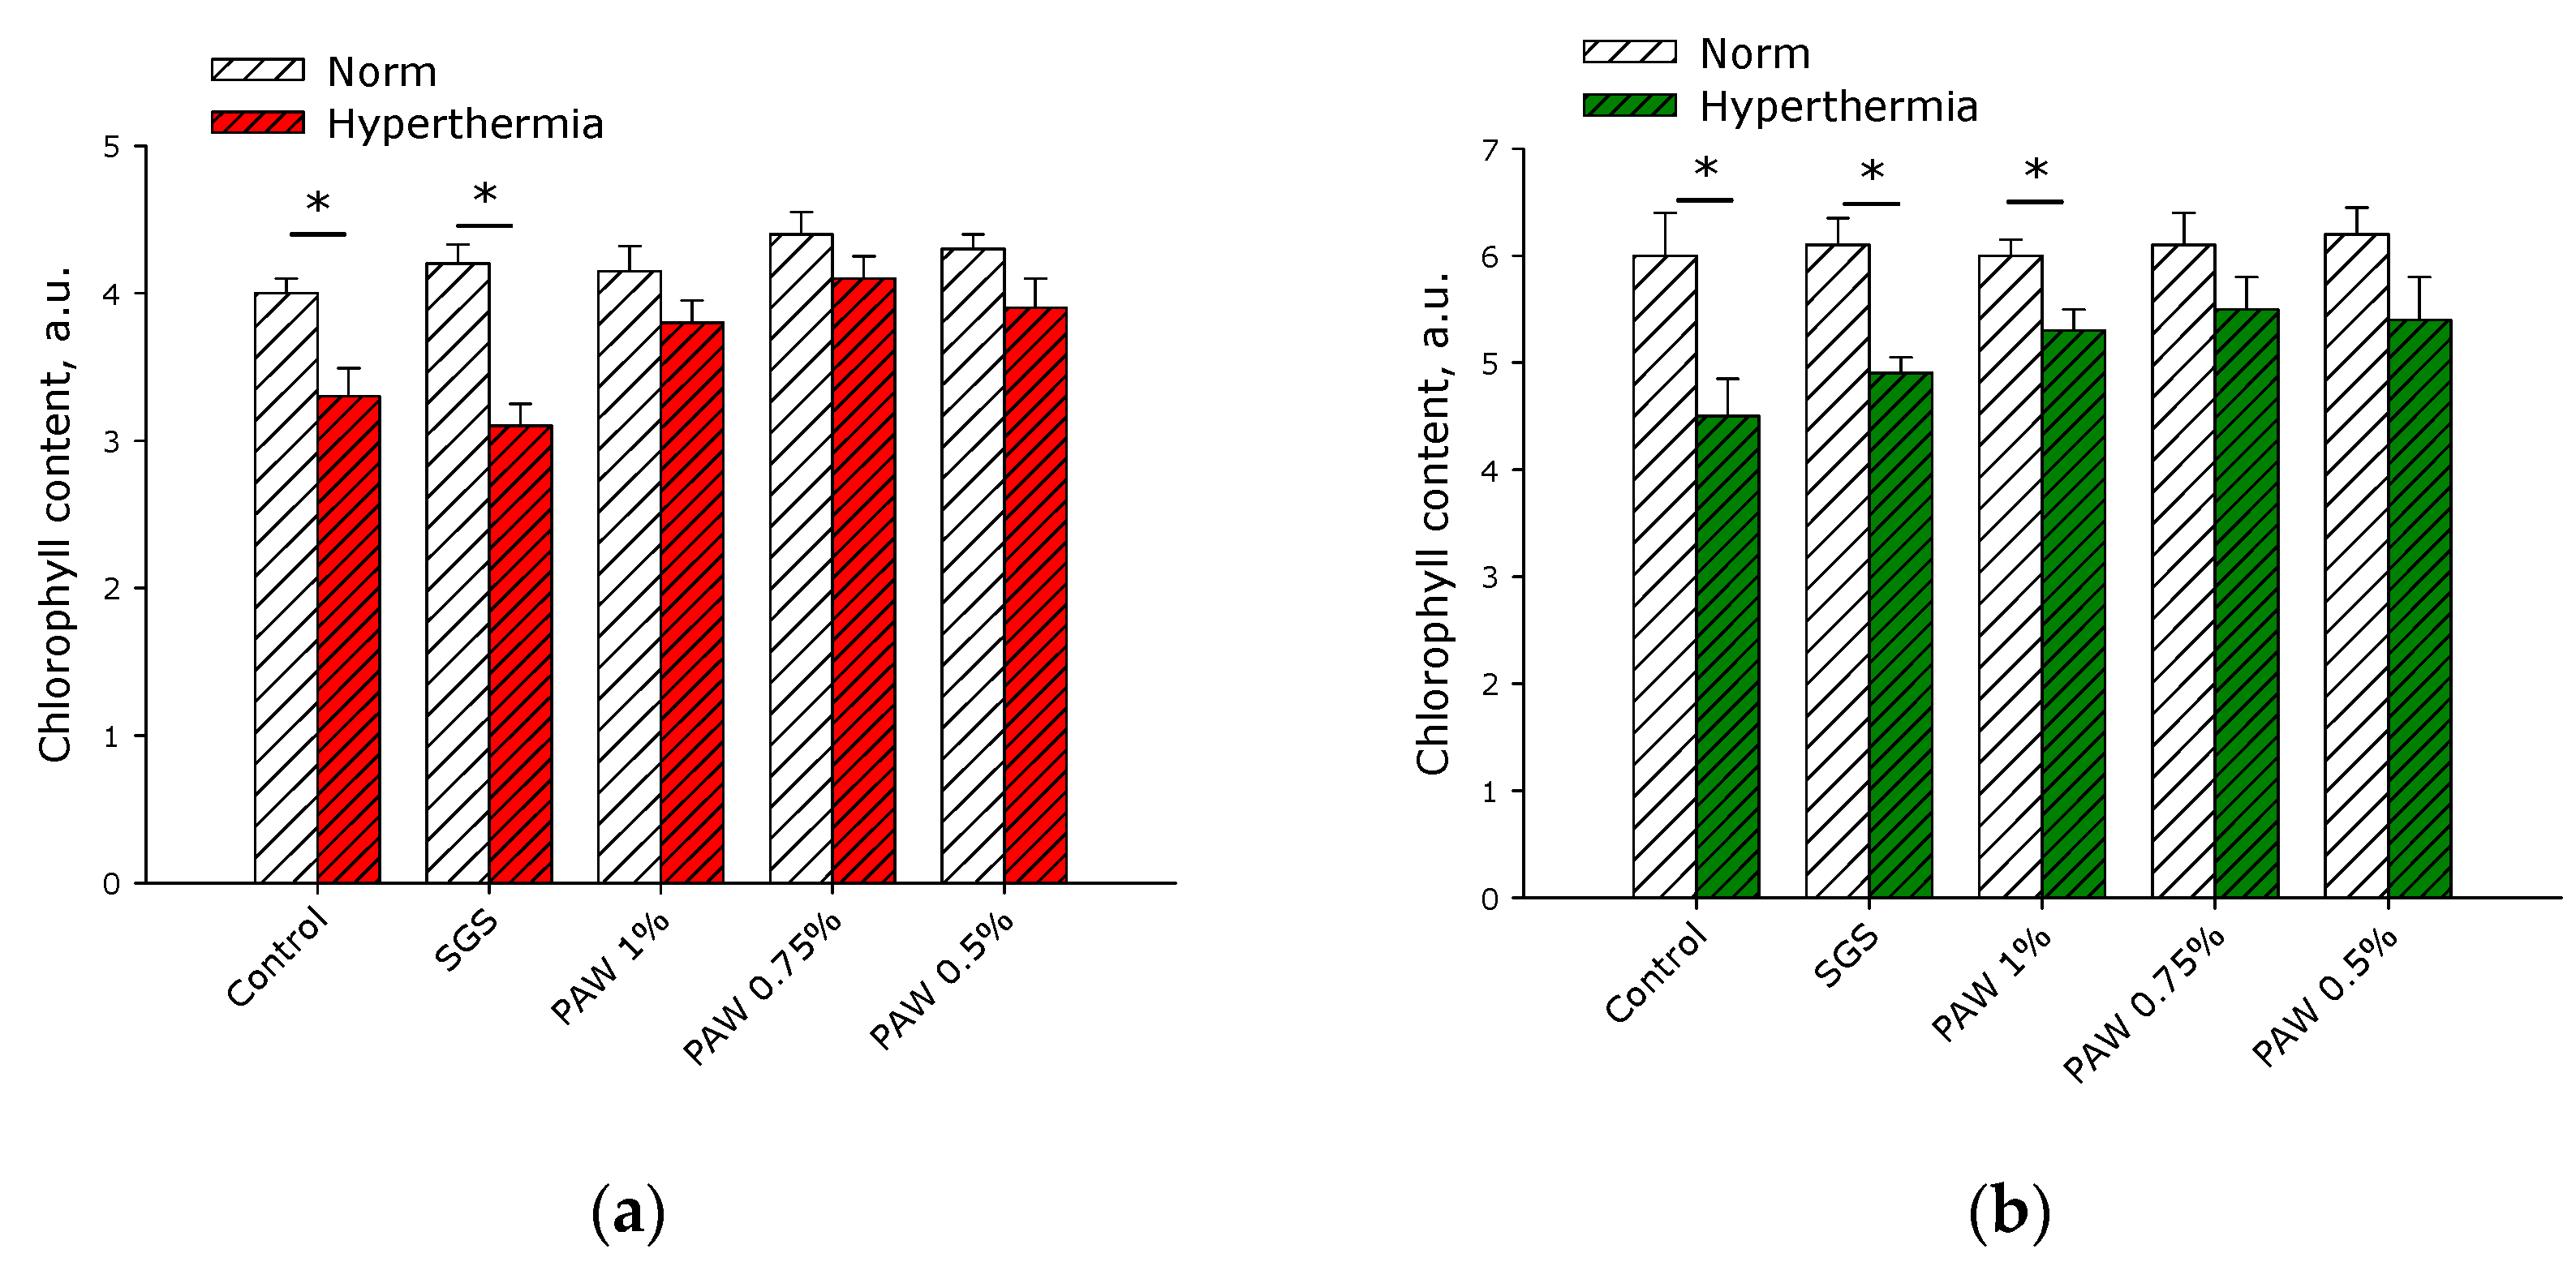
3.5. Influence of PAW on Plant Development under Conditions of Hyperthermia

Previously, it was suggested in the literature that the use of PAW could neutralize the negative effect of hyperthermia on plant tissues [49]. We have experimentally verified this assumption. Hyperthermia was simulated using a climate chamber. The plants were kept for 3 days at a temperature of 42 °C. Since such conditions are not unusual for cotton plants, the experiments were carried out only on adult wheat and strawberry plants (Table 8). It is shown that adult plants, under normal conditions, slightly increase their weight in 3 days. Plants treated with PAW increase their weight more actively. Under conditions of hyperthermia, both wheat and strawberry plants reduced their weight by 4–5%, while PAW-treated plants lost noticeably less weight.
The change in the content of chlorophylls in the leaves of adult wheat and strawberry plants watered with water for irrigation, water containing a growth stimulator and surfactant under normal conditions and hyperthermia conditions was studied (Figure 4). It was found that, under normal conditions, the content of chlorophyll in the leaves did not differ significantly in different groups. At the same time, there was a tendency to increase the amount of chlorophyll in wheat plants treated with a growth stimulator and PAW. It is known that under conditions of hyperthermia, a decrease in the number of photosynthetic pigments is observed [50]. In this study, in the control group, there is a decrease in the amount of chlorophyll after hyperthermia by approximately 20–25%. Additionally, the amount of chlorophyll in hyperthermia conditions decreases in the group treated with SGS, and, in the case of strawberry plants, also in the group treated with PAW 1%. The plants treated with PAW 0.75% and 0.5% showed no decrease in the amount of chlorophyll after exposure to hyperthermia.

4. Conclusions

Thus, the plant for obtaining PAW has been improved. After plasma treatment, water acquires new physical and chemical properties. Significant concentrations of H2O2 and NO3 appear in the water. In the formation of H2O2, O2 dissolved in water is also consumed, which is reflected in the redox potential of the solution. The appearance of the nitrate anion leads to acidification of the solution (decrease in pH) and an increase in electrical conductivity. It should be noted that the specific electrical conductivity and concentration of NO3 linearly depend on the treatment time. At the same time, there are currently cheap and fast means of controlling the specific electrical conductivity and the concentration of NO3. This means that simple and convenient ways to control the preparation of PAW have been found. It has been established that the use of PAW solutions with a concentration of 0.5–1.0% increases germination energy, protects against fusarium and hyperthermia in cotton plants, wheat and strawberries. The use of PAW provides significant advantages over the SDS Dalbron and Bakhor, which are widely used today in Uzbekistan.

Author Contributions

Conceptualization, M.K.A. and S.V.G.; methodology, K.F.S.; investigation, E.M.A., A.G.M., D.K.R., M.M.Y., S.T.S., I.V.B., V.N.L., A.V.O., R.M.S., S.Y.S., D.V.Y., I.G.S., K.F.S., N.A.L., M.E.A., A.V.S., E.M.K. and T.A.M.; writing—original draft preparation, M.K.A.; writing—review and editing, K.F.S., T.A.M. and I.A.S.; funding acquisition, S.V.G. All authors have read and agreed to the published version of the manuscript.

Funding

This research was funded by the Ministry of Science and Higher Education of the Russian Federation for large scientific projects in priority areas of scientific and technological development, grant number 075-15-2020-774.

Data Availability Statement

Not applicable.

Acknowledgments

The authors are grateful to the collective center of the GPI RAS for the provided equipment.

Conflicts of Interest

The authors declare no conflict of interest.

References

  1. Adamovich, I.; Baalrud, S.D.; Bogaerts, A.; Bruggeman, P.J.; Cappelli, M.; Colombo, V.; Czarnetzki, U.; Ebert, U.; Eden, J.G.; Favia, P.; et al. The 2017 Plasma Roadmap: Low temperature plasma science and technology. J. Phys. D Appl. Phys. 2017, 50, 323001. [Google Scholar] [CrossRef]
  2. Mildaziene, V.; Sera, B. Effects of Non-Thermal Plasma Treatment on Plant Physiological and Biochemical Processes. Plants 2022, 11, 1018. [Google Scholar] [CrossRef] [PubMed]
  3. Judickaitė, A.; Lyushkevich, V.; Filatova, I.; Mildažienė, V.; Žūkienė, R. The Potential of Cold Plasma and Electromagnetic Field as Stimulators of Natural Sweeteners Biosynthesis in Stevia rebaudiana Bertoni. Plants 2022, 11, 611. [Google Scholar] [CrossRef] [PubMed]
  4. Morabit, Y.; Hasan, M.I.; Whalley, R.D.; Robert, E.; Modic, M.; Walsh, J.L. A review of the gas and liquid phase interactions in low-temperature plasma jets used for biomedical applications. Eur. Phys. 2021, 75, 32. [Google Scholar] [CrossRef]
  5. Tanaka, H.; Mizuno, M.; Ishikawa, K.; Toyokuni, S.; Kajiyama, H.; Kikkawa, F.; Hori, M. Cancer Treatments Using Low-Temperature Plasma. Curr. Med. Chem. 2021, 28, 8549–8558. [Google Scholar] [CrossRef] [PubMed]
  6. Chau, T.T.; Kao, K.C.; Blank, G.; Madrid, F. Microwave plasmas for low-temperature dry sterilization. Biomaterials 1996, 17, 1273–1277. [Google Scholar] [CrossRef] [PubMed]
  7. Laroussi, M. Effects Plasma Medicine: A Brief Introduction. Plasma 2018, 1, 47–60. [Google Scholar] [CrossRef] [Green Version]
  8. Von Woedtke, T.; Schmidt, A.; Bekeschus, S.; Wende, K.; Weltmann, K.-D. Plasma Medicine: A Field of Applied Redox Biology. In Vivo 2019, 650, 3–10. [Google Scholar] [CrossRef] [Green Version]
  9. Setsuhara, Y. Low-temperature atmospheric-pressure plasma sources for plasma medicine. Arch. Biochem. Biophys. 2016, 605, 3–10. [Google Scholar] [CrossRef] [PubMed]
  10. Attri, P.; Ishikawa, K.; Okumura, T.; Koga, K.; Shiratani, M. Plasma Agriculture from Laboratory to Farm: A Review. Processes 2020, 8, 1002. [Google Scholar] [CrossRef]
  11. Misra, N.N.; Schlüter, O.; Cullen, P.J. Chapter 1—Plasma in Food and Agriculture. In Cold Plasma in Food and Agriculture; Academic Press: Cambridge, MA, USA, 2016; pp. 1–16. [Google Scholar] [CrossRef]
  12. Reuter, S.; Tresp, H.; Wende, K.; Hammer, M.U.; Winter, J.; Masur, K. From RONS to ROS: Tailoring Plasma Jet Treatment of Skin Cells. IEEE Trans. Plasma Sci. 2012, 40, 2986–2993. [Google Scholar] [CrossRef]
  13. Sharapov, M.G.; Gudkov, S.V.; Lankin, V.Z. Hydroperoxide Reducing Enzymes in the Regulation of Free Radical Processes. Biochemistry 2021, 86, 1256–1274. [Google Scholar] [CrossRef] [PubMed]
  14. Shaparov, M.G.; Gudkov, S.V.; Lankin, V.Z.; Novoselov, V.I. Role of Glutathione Peroxidases and Peroxiredoxins in Free RadicalInduced Pathologies. Biochemistry 2021, 86, 1418–1433. [Google Scholar] [CrossRef]
  15. Shlapakova, T.I.; Kostin, R.K.; Tyagunova, E.E. Reactive Oxygen Species: Participation in Cellular Processes and Progression of Pathology. Russ. J. Bioorg. Chem. 2020, 46, 657–674. [Google Scholar] [CrossRef]
  16. Gorbanev, Y.; Privat-Maldonado, A.; Bogaerts, A. Analysis of Short-Lived Reactive Species in Plasma–Air–Water Systems: The Dos and the Do Nots. Anal. Chem. 2018, 90, 13151–13158. [Google Scholar] [CrossRef] [PubMed] [Green Version]
  17. Piskarev, I.M. Water Activated by Air Spark Plasma Radiation. High Energy Chem. 2019, 53, 82–86. [Google Scholar] [CrossRef]
  18. Piskarev, I.M. Features of the Impact of Pulsed Radiation of Hot Plasma on Water and Aqueous Solutions. Plasma Chem. Plasma Process. 2021, 41, 1347–1361. [Google Scholar] [CrossRef]
  19. Carreras, M.C.; Pargament, G.A.; Catz, S.D.; Poderoso, J.J.; Boveris, A. Kinetics of nitric oxide and hydrogen peroxide production and formation of peroxynitrite during the respiratory burst of human neutrophils. FEBS Lett. 1994, 341, 65–68. [Google Scholar] [CrossRef] [PubMed] [Green Version]
  20. Sergeichev, K.F.; Lukina, N.A.; Sarimov, R.M.; Smirnov, I.G.; Simakin, A.V.; Dorokhov, A.S. Physicochemical Properties of Pure Water Treated by Pure Argon Plasma Jet Generated by Microwave Discharge in Opened Atmosphere. Front. Phys. 2021, 8, 614684. [Google Scholar] [CrossRef]
  21. Belov, S.V.; Lobachevsky, Y.P.; Danilejko, Y.K.; Egorov, A.B.; Simakin, A.B.; Maleki, A.; Temnov, A.A.; Dubinin, M.V. The Role of Mitochondria in the Dual Effect of Low-Temperature Plasma on Human Bone Marrow Stem Cells: From Apoptosis to Activation of Cell Proliferation. Appl. Sci. 2020, 10, 8971. [Google Scholar] [CrossRef]
  22. Starič, P.; Vogel-Mikuš, K.; Mozetič, M.; Junkar, I. Effects of Nonthermal Plasma on Morphology, Genetics and Physiology of Seeds: A Review. Plants 2020, 9, 1736. [Google Scholar] [CrossRef]
  23. Artem’ev, K.V.; Bogachev, N.N.; Gusein-zade, N.G.; Dolmatov, T.V.; Kolik, L.V.; Konchekov, E.M.; Andreev, S.E. Study of Characteristics of the Cold Atmospheric Plasma Source Based on a Piezo Transformer. Russ. Phys. J. 2020, 62, 2073–2080. [Google Scholar] [CrossRef]
  24. Konchekov, E.M.; Kolik, L.V.; Danilejko, Y.K.; Belov, S.V.; Artem’ev, K.V.; Astashev, M.E.; Pavlik, T.I.; Lukanin, V.I.; Kutyrev, A.I.; Smirnov, I.G.; et al. Enhancement of the Plant Grafting Technique with Dielectric Barrier Discharge Cold Atmospheric Plasma and Plasma-Treated Solution. Plants 2022, 11, 1373. [Google Scholar] [CrossRef] [PubMed]
  25. Konchekov, E.M.; Glinushkin, A.P.; Kalinitchenko, V.P.; Artem’ev, K.V.; Burmistrov, D.E.; Kozlov, V.A.; Kolik, L.V. Properties and Use of Water Activated by Plasma of Piezoelectric Direct Discharge. Front. Phys. 2021, 8, 616385. [Google Scholar] [CrossRef]
  26. Pavlik, T.I.; Gusein-zade, N.G.-o.; Kolik, L.V.; Shimanovskii, N.L. Comparison of the Biological Properties of Plasma-Treated Solution and Solution of Chemical Reagents. Appl. Sci. 2022, 12, 3704. [Google Scholar] [CrossRef]
  27. Baimler, I.V.; Lisitsyn, A.B.; Gudkov, S.V. Water decomposition occurring during laser breakdown of aqueous solutions containing individual gold, zirconium, molybdenum, iron or nickel nanoparticles. Front. Phys. 2020, 8, 620938. [Google Scholar] [CrossRef]
  28. Fenton, H.J.H. Oxidation of tartaric acid in presence of iron. J. Chem. Soc. 1894, 65, 899–910. [Google Scholar] [CrossRef] [Green Version]
  29. Belovolova, L.V. Reactive Oxygen Species in Aqueous Media (A Review). Opt. Spectrosc. 2020, 128, 932–951. [Google Scholar] [CrossRef]
  30. Baimler, I.V.; Simakin, A.V.; Uvarov, O.V.; Volkov, M.Y. Generation of Hydroxyl Radicals during Laser Breakdown of Aqueous Solutions in the Presence of Fe and Cu Nanoparticles of Different Sizes. Phys. Wave Phenom. 2020, 28, 107–110. [Google Scholar] [CrossRef]
  31. Shcherbakov, I.A.; Baimler, I.V.; Gudkov, S.V.; Lyakhov, G.A.; Mikhailova, G.N.; Pustovoy, V.I.; Sarimov, R.M.; Simakin, A.V.; Troitsky, A.V. Influence of a Constant Magnetic Field on Some Properties of Water Solutions. Dokl. Phys. 2020, 65, 9–11. [Google Scholar] [CrossRef]
  32. Sarimov, R.M.; Simakin, A.V.; Matveeva, T.A.; Gudkov, S.V.; Lyakhov, G.A.; Pustovoy, V.I.; Troitskii, A.V.; Shcherbakov, I.A. Influence of Magnetic Fields with Induction of 7 T on Physical and Chemical Properties of Aqueous NaCl Solutions. Appl. Sci. 2021, 11, 11466. [Google Scholar] [CrossRef]
  33. Danilejko, Y.K.; Belov, S.V.; Egorov, A.B.; Lukanin, V.I.; Sidorov, V.A.; Apasheva, L.M.; Dushkov, V.Y.; Budnik, M.I.; Belyakov, A.M.; Kulik, K.N.; et al. Increase of Productivity and Neutralization of Pathological Processes in Plants of Grain and Fruit Crops with the Help of Aqueous Solutions Activated by Plasma of High-Frequency Glow Discharge. Plants 2021, 10, 2161. [Google Scholar] [CrossRef] [PubMed]
  34. Gudkov, S.V.; Lyakhov, G.A.; Pustovoy, V.I.; Shcherbakov, I.A. Influence of Mechanical Effects on the Hydrogen Peroxide Concentration in Aqueous Solutions. Phys. Wave Phenom. 2019, 27, 141–144. [Google Scholar] [CrossRef]
  35. Baimler, I.V.; Lisitsyn, A.B.; Gudkov, S.V. Influence of Gases Dissolved in Water on the Process of Optical Breakdown of Aqueous Solutions of Cu Nanoparticles. Front. Phys. 2020, 8, 622775. [Google Scholar] [CrossRef]
  36. Astashev, M.E.; Bolotskova, P.N.; Bunkin, N.F.; Kozlov, V.A.; Okuneva, M.A. Swelling of Polymer Membrane in an Aqueous Protein Suspension: Photoluminescence Spectroscopy Experiments. Phys. Wave Phenom. 2021, 29, 123–130. [Google Scholar] [CrossRef]
  37. Baymler, I.V.; Simakin, A.V.; Gudkov, S.V. Investigation of the laser-induced breakdown plasma, acoustic vibrations and dissociation processes of water molecules caused by laser breakdown of colloidal solutions containing Ni nanoparticles. Plasma Sources Sci. Technol. 2021, 30, 125015. [Google Scholar] [CrossRef]
  38. Shtarkman, I.N.; Gudkov, S.V.; Chernikov, A.V.; Bruskov, V.I. Effect of amino acids on X-ray-induced hydrogen peroxide and hydroxyl radical formation in water and 8-oxoguanine in DNA. Biochemistry 2008, 73, 470–478. [Google Scholar] [CrossRef]
  39. GOST 12041-82; Seeds of Agricultural Crops. Methods for Determining Humidity. Moscow, Russian, 1982. Available online: https://docs.cntd.ru/document/1200023369 (accessed on 21 September 2022).
  40. GOST 10842-89; Grain of Cereals and Bean Crops and Seeds of Oil Crops. Method for Determining the Mass of 1000 Grains or 1000 Seeds. Moscow, Russian, 1989. Available online: https://docs.cntd.ru/document/1200023854 (accessed on 21 September 2022).
  41. GOST 12038-84; Seeds of Agricultural Crops. Methods for Determination of Germination. Moscow, Russian, 1984. Available online: https://docs.cntd.ru/document/1200023365 (accessed on 21 September 2022).
  42. O’zDSt 663: 2017; Cotton Seeds. Tashkent, Uzbekistan, 2017. Available online: https://lex.uz/docs/4989877 (accessed on 21 September 2022).
  43. O’zDSt 1080:2005; Raw Cotton Seed and Cottonseed. Sampling Methods. Tashkent, Uzbekistan, 2005. Available online: https://lex.uz/ru/docs/4997162 (accessed on 21 September 2022).
  44. O’zDSt 1128:2006; Cotton Seeds. Methods for Determining Germination. Tashkent, Uzbekistan, 2006. Available online: https://lex.uz/docs/4939205 (accessed on 21 September 2022).
  45. O’zDSt 2823:2014; Seeds of Agricultural Crops. Varietal and Sowing Qualities. Specifications. Tashkent, Uzbekistan, 2014. Available online: https://lex.uz/ru/docs/4993911 (accessed on 21 September 2022).
  46. Sarimov, R.M.; Lednev, V.N.; Sibirev, A.; Gudkov, S.V. The use of fluorescence spectra for the detection of scab and rot in fruit and vegetable crops. Front. Phys. 2021, 9, 640887. [Google Scholar] [CrossRef]
  47. Aboul-Maaty, N.A.-F.; Oraby, H.A.-S. Extraction of high-quality genomic DNA from different plant orders applying a modified CTAB-based method. Bull. Natl. Res. Cent. 2019, 43, 25. [Google Scholar] [CrossRef]
  48. Burmistrov, D.E.; Pavkin, D.Y.; Khakimov, A.R.; Ignatenko, D.N.; Nikitin, E.A.; Lednev, V.N.; Lobachevsky, Y.P. Application of Optical Quality Control Technologies in the Dairy Industry: An Overview. Photonics 2021, 8, 551. [Google Scholar] [CrossRef]
  49. Zambon, Y.; Contaldo, N.; Laurita, R. Plasma activated water triggers plant defence responses. Sci. Rep. 2020, 10, 19211. [Google Scholar] [CrossRef] [PubMed]
  50. Kosakivska, I.B.; Yarotska, K.M.; Voytenko, L.V.; Babenko, L.M. Effect of hyperthermia on cytokinin and pigments content of Glycine max (L.) Merr. varieties differed in thermotolerance. Fiziol. Rast. Genet. 2016, 48, 56–64. [Google Scholar] [CrossRef]
Figure 1. (a) Photography of the installation during operation; (b) the installation diagram; 1 magnetron, 2 rectangular waveguides, 3 coaxial waveguides, 4 copper tubes, 5 plasma torchs, 6 pistons for adjusting the microwave path, 7 circulators, 8 quartz tubes, 9 reactor chambers, 10 mixers, 11 containers with water, 12 movable rods, 13 spectrometers, 14 outlet pipes.
Chemengineering 06 00091 g001
Figure 2. Argon microwave discharge torch, which leads to the activation of aqueous solutions placed in the reactor chamber: (a) In general view, the torch is visible in the viewing window of the reactor; (b) magnified photography of the torch (real scale).
Chemengineering 06 00091 g002
Figure 3. Representative photographs of control wheat plants, plants treated with PAW and plants treated with Bakhor germination promoter. (a) Control wheat seeds on the left, seeds treated with the preparation “Bakhor” (4 days) on the right; (b) control wheat seeds on the left, seeds treated with PAW 0.75% solution (4 days) on the right; (c) control wheat seeds on the left, wheat seeds treated with the preparation “Bakhor” (7 days) on the right; (d) control wheat seeds on the left, right, seeds treated with PAW solution 0.75% (7 days) on the right.
Chemengineering 06 00091 g003
Figure 4. Changes in the content of chlorophylls in the leaves of adult plants of wheat (a) and strawberries (b) watered with water for irrigation, water containing a growth stimulator and surfactants under normal and hyperthermia conditions. *-statistically significant difference between the norm and hyperthermia in one experimental group (p < 0.05).
Chemengineering 06 00091 g004
Table 1. Primers used to identify Fusariun sp. [33].
Species and TargetPrimers (F and R)
Intergenic Spacer of rDNA (IGS region)
(F. graminearu)
5′-GTTGATGGGTAAAAGTGTG-3′
5′-CTCTCATATACCCTCCG-3′
Gene translation elongation
factor 1-alpha (F. avenaceum)
5′-ATGGGTAAGGARGACAAGAC-3′
5′-GGARGTACCAGTSATCATG-3′
Specific fragment between the transcription factors Han and Skippy (F. oxysporum)5′-CAGACTGGGGTGCTTAAAGTT-3′
5′-AACGCTAGGGTCGTAACAAA-3′
Table 2. Changes in the physicochemical parameters of aqueous solutions after exposure to plasma.
Exposure Time (min)Measured Parameters
EC 1 (mS/cm)O2 (μM)pHRedox (mV)NO3 (mM)OH (mM)H2O2 (μM)
00.0032685.2390<0.1<0.1<0.1
10.1502593.04501.113.74.3
30.3522562.94603.442.513.3
50.5452542.84605.772.922.8
1-EC—Electrical conductivity.
Table 3. Determination of laboratory germination energy of seeds of cotton, wheat and strawberries treated with various dilutions of PAW.
Experimental GroupsCottonWheatStrawberry
GE 1, %ΔGE 3, %G 2, %ΔG 4, %GE 1, %ΔGE 3, %G 2, %ΔG 4, %GE 1, %ΔGE 3, %G 2, %ΔG 4, %
Control85 ± 2091088 ± 1093089 ± 30920
SGS 589 ± 1+495+490 ± 2+293+290 ± 2+1920
PAW 1%89 ± 2+494+391 ± 2+396+394 ± 1+596+4
PAW 0.75%91 ± 3+697+691 ± 2+397+496 ± 3+797+5
PAW 0.5%90 ± 2+596+590 ± 1+297+495 ± 2+697+5
1-GE—Germination energy; 2-G—Germination; 3GE—relative changes compared to the control group GE; 4G—relative changes compared to the control group G. 5-SGS—treatment with a seed germination stimulator Dalbron (cotton) or Bakhor (wheat and strawberries).
Table 4. Development of cotton plants grown from seeds treated with PAW.
Experimental GroupsDuration of the Experiment (Days)
479114791147911
Total Length (mm)Stem Length (mm)Root Length (mm)
Control5.8 ± 0.69.4 ± 0.89.5 ± 0.712.3 ± 0.91.7 ± 0.24.9 ± 0.45.0 ± 0.46.8 ± 0.64.2 ± 0.44.5 ± 0.44.5 ± 0.45.5 ± 0.5
SGS 17.4 ± 0.512.1 ± 0.912.6 ± 0.913.6 ± 1.42.4 ± 0.36.9 ± 0.57.0 ± 0.67.8 ± 0.75.0 ± 0.45.2 ± 0.55.5 ± 0.45.8 ± 0.6
PAW 1%8.1 ± 0.314.0 ± 0.914.2 ± 0.815.6 ± 0.62.6 ± 0.48.0 ± 0.87.9 ± 0.69.2 ± 0.85.6 ± 0.56.0 ± 0.66.3 ± 0.56,4 ± 0.6
PAW 0.75%7.4 ± 0.513.3 ± 1.214.2 ± 1.116.4 ± 0.92.2 ± 0.37.1 ± 0.78.1 ± 0.710.2 ± 0.95.2 ± 0.66.2 ± 0.66.1 ± 0.66.2 ± 0.5
PAW 0.5%8.0 ± 0.714.3 ± 1.515.0 ± 1.516.8 ± 1.62.3 ± 0.38.1 ± 0.78.5 ± 0.69.9 ± 0.75.7 ± 0.66.2 ± 0.56.5 ± 0.66.9 ± 0.7
1-SGS—treatment with a seed germination stimulator Dalbron.
Table 5. Development of wheat plants grown from seeds treated with PAW.
Experimental GroupsDuration of the Experiment (Days)
710710710
Total Length (mm)Stem Length (mm)Root Length (mm)
Control9.4 ± 0.812.3 ± 1.24.8 ± 0.45.2 ± 0.54.6 ± 0.57.1 ± 0.7
SGS 112.3 ± 0.915.0 ± 1.46.4 ± 0.67.5 ± 0.65.9 ± 0.57.5 ± 0.7
PAW 1%14.9 ± 1.217.7 ± 1.48.8 ± 0.89.1 ± 0.86.1 ± 0.68.6 ± 0.9
PAW 0.75%15.0 ± 1.418.3 ± 1.58.6 ± 0.99.7 ± 1.06.4 ± 0.78.6 ± 0.6
PAW 0.5%14.7 ± 1.317.9 ± 1.88.0 ± 0.99.9 ± 0.86.7 ± 0.68.0 ± 0.8
1-SGS—treatment with a seed germination stimulator Bakhor.
Table 6. Influence of PAW on seed infestation with fusarium.
Microscopy, Seed Contamination Level, %
Cotton-PlantWheatStrawberry
+++
Control850920760
SGS 1270400360
PAW 1%150110100
PAW 0.75%220250140
PAW 0.5%350290270
Fluorometry, seed contamination level, a.u.
Control0.960.020.980.010.850.02
SGS 10.050.010.320.030.320.03
PAW 1%0.090.030.110.020.160.01
PAW 0.75%0.120.020.220.030.190.02
PAW 0.5%0.190.010.270.010.260.02
RT-PCR, seed infection rate, Ct
Control13>4019>4027>40
SGS 138>4029>4035>40
PAW 1%>40>40>40>40>40>40
PAW 0.75%>40>4034>40>40>40
PAW 0.5%32>4035>4038>40
1-SGS—treatment with a seed germination stimulator Dalbron (cotton) or Bakhor (wheat and strawberries).
Table 7. Determination of laboratory germination energy of Fusarium-infected seeds of cotton plants, wheat and strawberries treated with various dilutions of PAW.
Experimental GroupsGE 1, %
CottonWheatStrawberry
Control35 ± 217 ± 129 ± 3
SGS 270 ± 552 ± 661 ± 5
PAW 1%83 ± 281 ± 374 ± 3
PAW 0.75%74 ± 469 ± 366 ± 3
PAW 0.5%69 ± 463 ± 356 ± 6
1-GE—Germination energy; 2-SGS—treatment with a seed germination stimulator Dalbron (cotton) or Bakhor (wheat and strawberries).
Table 8. Influence of surfactants on the change in the mass of the ground part of the plant in the norm and under hyperthermia.
Experimental GroupsChange in the Mass of the Ground Part of the Plant, %
WheatStrawberry
NormHyperthermiaNormHyperthermia
Control+1 ± 1−4 ± 1+3 ± 1−5 ± 2
SGS 1+1 ± 1−5 ± 1+3 ± 1−4 ± 2
PAW 1%+3 ± 1−1 ± 2+5 ± 10 ± 2
PAW 0.75%+2 ± 2+2 ± 2+4 ± 2+3 ± 1
PAW 0.5%+1 ± 10 ± 1+4 ± 1+1 ± 1
1-SGS—treatment with a seed germination stimulator Bakhor (wheat and strawberries).
Publisher’s Note: MDPI stays neutral with regard to jurisdictional claims in published maps and institutional affiliations.

