Article

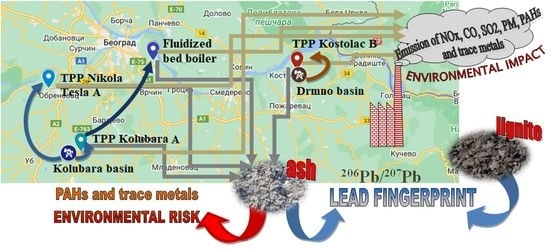
Risk Evaluation of Pollutants Emission from Coal and Coal Waste Combustion Plants and Environmental Impact of Fly Ash Landfilling

by
Jovana Z. Buha Marković
1,*,
Ana D. Marinković
1,
Jasmina Z. Savić
1,
Milica R. Mladenović
1,
Milić D. Erić
1,
Zoran J. Marković
1 and
Mirjana Đ. Ristić
2
1
Vinča Institute of Nuclear Sciences—National Institute of the Republic of Serbia, University of Belgrade, Mike Petrovića Alasa 12–14, 11351 Belgrade, Serbia
2
Faculty of Technology and Metallurgy, University of Belgrade, Karnegijeva 4, 11120 Belgrade, Serbia
*
Author to whom correspondence should be addressed.
Toxics 2023, 11(4), 396; https://doi.org/10.3390/toxics11040396
Submission received: 14 March 2023 / Revised: 6 April 2023 / Accepted: 15 April 2023 / Published: 21 April 2023
(This article belongs to the Section Air Pollution and Health)

Abstract

:
Emission factors (EFs) of gaseous pollutants, particulate matter, certain harmful trace elements, and polycyclic aromatic hydrocarbons (PAHs) from three thermal power plants (TPPs) and semi-industrial fluidized bed boiler (FBB) were compared. EFs of particulate matter, trace elements (except Cd and Pb), benzo[a]pyrene, and benzo[b]fluoranthene exceed the upper limits specified in the EMEP inventory guidebook for all combustion facilities. The comparison of trace elements and PAHs content in fly ashes (FAs) from lignite and coal waste combustion in TPPs and FBB, respectively, as well as the potential environmental impact of FAs disposal, was performed by employing a set of ecological indicators such as crustal enrichment factor, risk assessment code, risk indices for trace elements, and benzo[a]pyrene equivalent concentration for PAHs. Sequential analysis shows that the trace elements portion is the lowest for water-soluble and exchangeable fractions. The highest enrichment levels in FAs are noticed for As and Hg. Based on toxic trace elements content, FAs from TPPs represent a very high ecological risk, whereas fly ash from FBB poses a moderate ecological risk but has the highest benzo[a]pyrene equivalent concentration, indicating its increased carcinogenic potential. Lead isotope ratios for Serbian coals and FAs can contribute to a lead pollution global database.

Graphical Abstract

1. Introduction

Coal combustion is both the primary energy source in many countries and one of the major anthropogenic sources of atmospheric, water, and soil pollution. It induces a variety of environmental and health issues due to the release of gaseous pollutants such as sulfur dioxide (SO2), nitrogen oxide (NOx), carbon monoxide (CO), and solid particulate matter (PM) [1]. Millions of tons of coal are burned in different power plants worldwide [2], resulting in enormous quantities of combustion residues, such as fly and bottom ashes. Branch TPP Nikola Tesla (TPPs Nikola Tesla A and B, Kolubara A and Morava) generates more than 50% of electricity, while TPPs Kostolac A and B produce around 17% of overall electricity in Serbia [3]. Approximately 40 million tons of lignite from the Kolubara and Drmno basins are burned in thermal power plants, producing 6 million tons of FAs [4]. Since coal resources are limited [5], using alternative fuels such as coal waste in various combustion technologies is increasingly important. Fluidized bed combustion has proven to be an efficient and environmentally acceptable technique for producing energy from low quality coals because it operates at a lower temperature (850°C) and has the possibility of efficient in-bed desulphurization, resulting in lower NOx and SO2 emissions [6,7].
Coal combustion is a significant source of gaseous pollutants (SO2, NOx, CO), PM, as well as trace elements and organic pollutants emissions [8]. Emission measurements of SO2, NOx, CO, and PM are needed due to their impact on air pollution and given emission limits [9]. The trace elements are categorized into three groups based on their partitioning behavior during coal combustion [10,11]: extremely volatile (such as Hg), prone to condense on fly ash particles (As, Pb, Cd), and uniformly distributed among BAs and FAs (Cu, Ni and Cr). In addition, some portions of these element compounds are discharged into the atmosphere along with flue gases. Therefore, their monitoring is significant since these fine particles can travel long distances. Although the partitioning of PAHs in flue gasses along with emitted particles has been studied [12,13], investigations on the PAHs emission characteristics from different boilers and combustion technologies are still scarce.
Ash content depends on coal type and combustion conditions, such as temperatures, air flow, type of combustion, etc. [14,15]. Many potentially hazardous substances, such as certain trace element compounds and/or semi-volatile and volatile organic compounds, can be concentrated in bottom ash (BA), FA, and fine particles, posing a significant threat to the environment [16,17]. The factors that have the greatest influence on the content of these compounds include their initial content in feed fuel, combustion conditions, and the effectiveness of the particulate control device used [18,19,20].
Sequential extraction is a method for assessing the chemical form, mobility, and physicochemical and biological availability of trace elements [21,22]. Different tools such as the crustal enrichment factor (CEF), the risk assessment code (RAC), and the risk index (RI) can be applied to calculate the specific element enrichment, prospective leachability of a particular pollutant, and overall ecological risk [23,24,25].
PAHs belong to persistent hazardous organic compounds, and the United States Environmental Protection Agency classifies 16 of them as priority pollutants [26]. Additionally, benzo[a]pyrene-based toxic equivalent factor (BaPeq) and benzo[a]pyrene-based equivalent carcinogenic power (BaPE) are widely used to assess the potential harm of PAHs to the environment [27,28]. These values enable the estimation of the overall environmental risk of investigated fly ashes.
Among many toxic elements, lead is a major global pollutants. Natural lead is normally composed of four stable isotopes with masses of 204, 206, 207, and 208 [29]. To trace back and identify the source of lead pollution, such as mining, industry, and coal combustion [30,31], it is essential to know the lead fingerprint (the isotope ratios). The isotopic composition of Pb is usually expressed by the following ratios 206Pb/204Pb, 206Pb/207Pb, 208Pb/206Pb, 208Pb/207Pb, with the 206Pb/207Pb being the most commonly used. There are studies on lead isotope ratios in coals and other pollution sources [30,32,33], but there is a lack of information concerning lead isotopes in Serbian coals and FAs.
In this study, the overall environmental impact from electricity production in TPPs Kolubara A, Kostolac B, Nikola Tesla A, and semi-industrial FBB, as combustion facilities with different combustion regimes, fuel types, and capacities were compared. The purpose of this research was to determine the emission of SO2, NOx, CO, and total PM to estimate emission factors of the most harmful trace elements and PAHs, as well as to evaluate their values with the EMEP/EEA permissible limits. Furthermore, the goal was to assess the potential environmental risk posed by the most harmful substances if ash is disposed on landfills and to update a broad database on lead isotope ratios for Serbian coals and FAs.

2. Materials and Methods

2.1. Ash Sample Collection and Storage

In this study, bulk fly ashes from TPPs Kolubara A (TPPKb), Kostolac B (TPPKs), Nikola Tesla A (TPPNT), and from the cyclone of fluidized bed boiler (CFB) were collected and examined. For lead isotopic measurements, representative coal samples (4), as well as FAs from TPPs and FBB (8 samples) were analyzed. Sampling and sample preparation followed a previously described methodology [34]. Table S1 in Section S1 (Supplementary) contains the details about sampling locations.

2.2. Emission of NOx, CO, SO2 and Total PM from TPPs and FBB

The content of flue gas pollutants was determined according to the standards [35,36,37,38,39,40]. The flue gases sampling was carried out at the stack or at the flue gas line in front of the stack. Multicomponent gas analyzer Horiba PG 350E (O2, CO2, CO, NOx, and SO2), gas conditioning unit PSS5 M&C Tech group and heated hose JCT Analysentechnik GmbH were used. Utilized gas sampling equipment was in accordance with standards [35,36,37,39,40]. Flue gas flows for all TPPs and FBB are shown in Table 1.
Particulate matter sampling was performed by the isokinetic sampling system Heated Paul Gothe gas sample probe with a fine filter and pre-filter [38]. Total PM included all particulate matter with diameters higher than 0.3 µm. Sampling flow range: 0.5–4.0 m3/h.

2.3. Determination of Trace Elements and Lead Isotopic Ratios

2.3.1. Sequential Extraction of FAs

The sequential extraction of trace elements (As, Be, Cd, Co, Cr, Cs, Cu, Ga, Ge, Hg, Mn, Mo, Ni, Pb, Sb, Sr, U, and V) was performed as described in the literature [41] with a modified last step. Details are explained in Section S2 (Supplementary).

2.3.2. ICP-MS Analysis

Trace elements concentrations were determined by the inductively coupled plasma mass spectrometry (ICP-MS) using Agilent 7500ce instrument equipped with Octopole Reaction System in FullQuant mode. ICP-MS calibration was performed by Agilent Multi-Element Calibration Standards. Standard solutions and blanks were prepared in 2% HNO3. The analyses of each fraction (F1–F6) were performed in 3 replicates. The isotope analysis mode was used for lead isotopic measurements. The accuracy of the isotope ratio measurements was evaluated by analyzing a certified isotopic standard NIST SRM 981. External corrections due to a mass bias of the ICP-MS were performed by measuring a 5 g/L solution of NIST SRM 981. Mass bias correction factors were automatically calculated for the ratios 207Pb/206Pb (0.9925) and 208Pb/207Pb (0.9968). Other details about the ICP-MS analysis are described in Section S3 (Supplementary).

2.4. Analysis of PAHs Content in FAs

2.4.1. PAHs Extraction

The extraction of PAHs from FAs was performed by a solid–liquid extraction. More details about PAHs extraction are provided in [34].

2.4.2. HPLC Analysis

A Thermo Fisher Scientific Dionex UltiMate 3000 HPLC system with a diode array detector was applied to determine 16 priority PAHs along with two naphthalene substituted derivatives (1-methyl naphthalene and 2-methyl naphthalene). The details of the modified HPLC analysis are provided in [34].

2.5. Data Analysis

2.5.1. Estimation of EFs for Selected Trace Elements and PAHs

Literature data [10,11,18,42,43,44] and data acquired from the field measurements (flue gas velocity, cross-sectional area, coal consumption, and ash production) were employed to estimate As, Cd, Cr, Cu, Hg, Ni, and Pb emission factors, as well as EFs for benzo[b]fluoranthene (BbF), benzo[k]fluoranthene (BkF), benzo[a]pyrene (BaP), and indeno [1,2,3-cd]pyrene (IP). The calculated EFs were compared with representative values provided in the EMEP/EEA guidebook [45].

2.5.2. Crustal Enrichment Factor (CEF)

CEF specifies the degree to which each trace element in fly ash is enriched relative to its content crustal core. To reduce the alterations among diverse samples, CEF values are estimated in relation to a reference element with low occurrence variability. In this paper, Mn is used as a reference element. CEFn/Mn is calculated using the following formula:
C E F n / M n = C n C M n f l y   a s h C n C M n c r u s t a l   c o r e
where Cn is the concentration of each investigated trace element and CMn is the concentration of manganese, both in fly ash samples and crustal core, respectively.

2.5.3. Risk Assessment Code (RAC)

Usually, RAC defines the potential environmental risk of trace elements leaching from complex matrices, such as ashes [24,46]. It is calculated as the ratio of the sum of the water-soluble fraction (F1), the exchangeable fraction (F2), and the carbonate bound fraction (F3) to the total element concentration in a representative sample, expressed in percentage.

2.5.4. Pollution Index (PI)

PI identifies the pollution level of all investigated trace elements that can pose harm to the soil [47]. PI is calculated by the following equation:
P I i = C n C b
where PIi is the single pollution index; and Cn and Cb are the elemental concentration in fly ash and crustal core, respectively.

2.5.5. Risk Index (RI)

RI estimates the individual ecological risk level for the most hazardous trace elements (As, Cd, Co, Cr, Cu, Hg, Ni, and Pb), while RIsum evaluates the overall ecological risk of the investigated sample. It is calculated by the following equations:
R I i = T r   i × P I i
R I s u m = i = 1 n R I i
where Tr represents the toxic response for each potentially toxic trace element [23].

2.5.6. BaPeq and BaPE Values for FAs

BaPeq is used to estimate the PAHs overall toxic potency in investigated samples. BaPeq is determined according to the following equation:
B a P e q = i = 1 18 T E F i × c i
where ci is the individual PAH concentration, and TEFi represents the toxic equivalency factor of each PAH [48].
BaPE is calculated according to the following equation [20]:
BaPE   = BaA × 0.06 + BbF   × 0.07 + BkF   × 0.06 + BaP + DahA   × 0.6 + +   IP   × 0.08

3. Results and Discussion

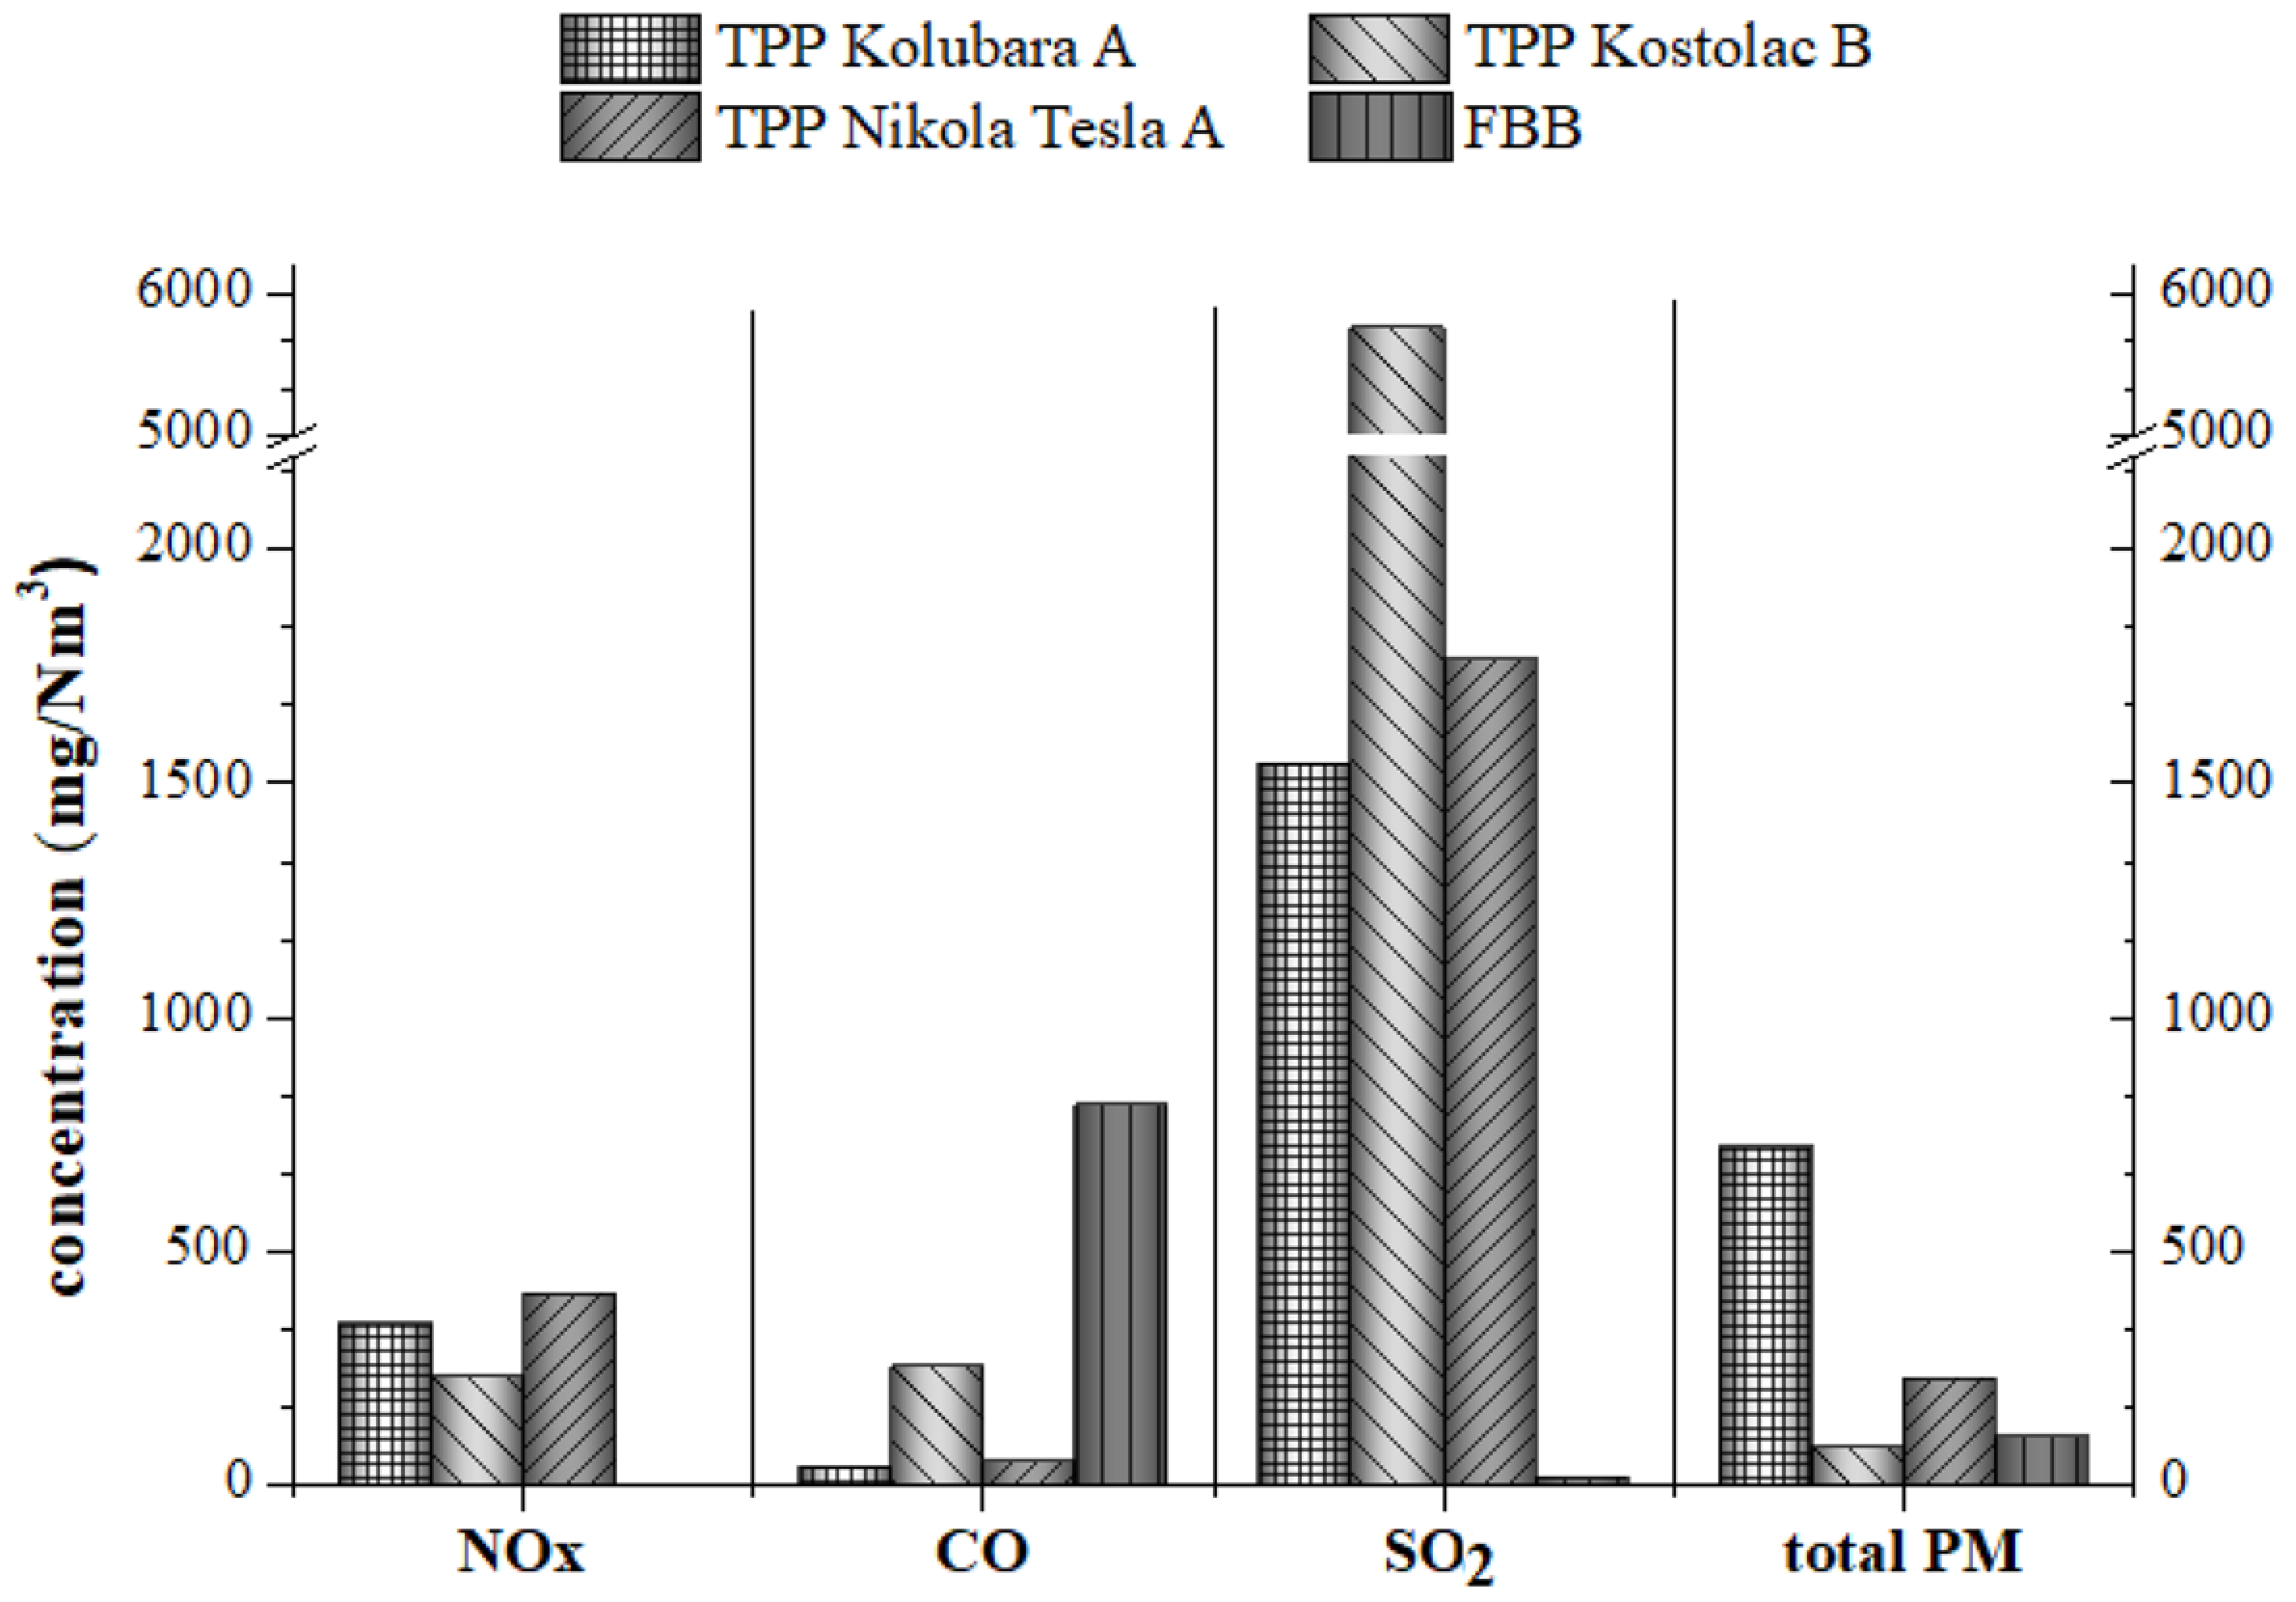
3.1. NOx, CO, SO2 and Total PM Emission from TPPs and FBB

The highest NOx concentration was noticed for TPP Nikola Tesla A, while total PM concentration was the highest for TPP Kolubara A (Figure 1). The increased content of SO2 in TPP Kostolac B surpasses its corresponding limit value (listed in Table S2) [49]. Higher sulfur content in lignite utilized in TPP Kostolac B most likely leads to elevated SO2 content in the flue gas. CO is higher in FBB than in other combustion facilities, possibly due to incomplete combustion and lower combustion temperature in FBB (Figure 1). The electrostatic precipitators installed in TPPs have high efficiency (more than 99%) in collecting particulate matter, but they are usually inefficient for capturing fine and/or ultrafine particles [50,51].
The EF values of all investigated pollutants are listed in Table 2, along with their corresponding lower and upper limits and the average value obtained from the EMEP inventory guidebook. EFs for total particulate matter (Table 2A) in flue gases for all combustion facilities exceed their representative EMEP PM10 upper limits fivefold (for TPP Kolubara A). The highest values of EFs for other pollutants were observed for CO in TPPs Nikola Tesla A and Kostolac B, as well as for FBB and NOx in TPP Kolubara A, and SOx in TPPs Kostolac B and Kolubara A.

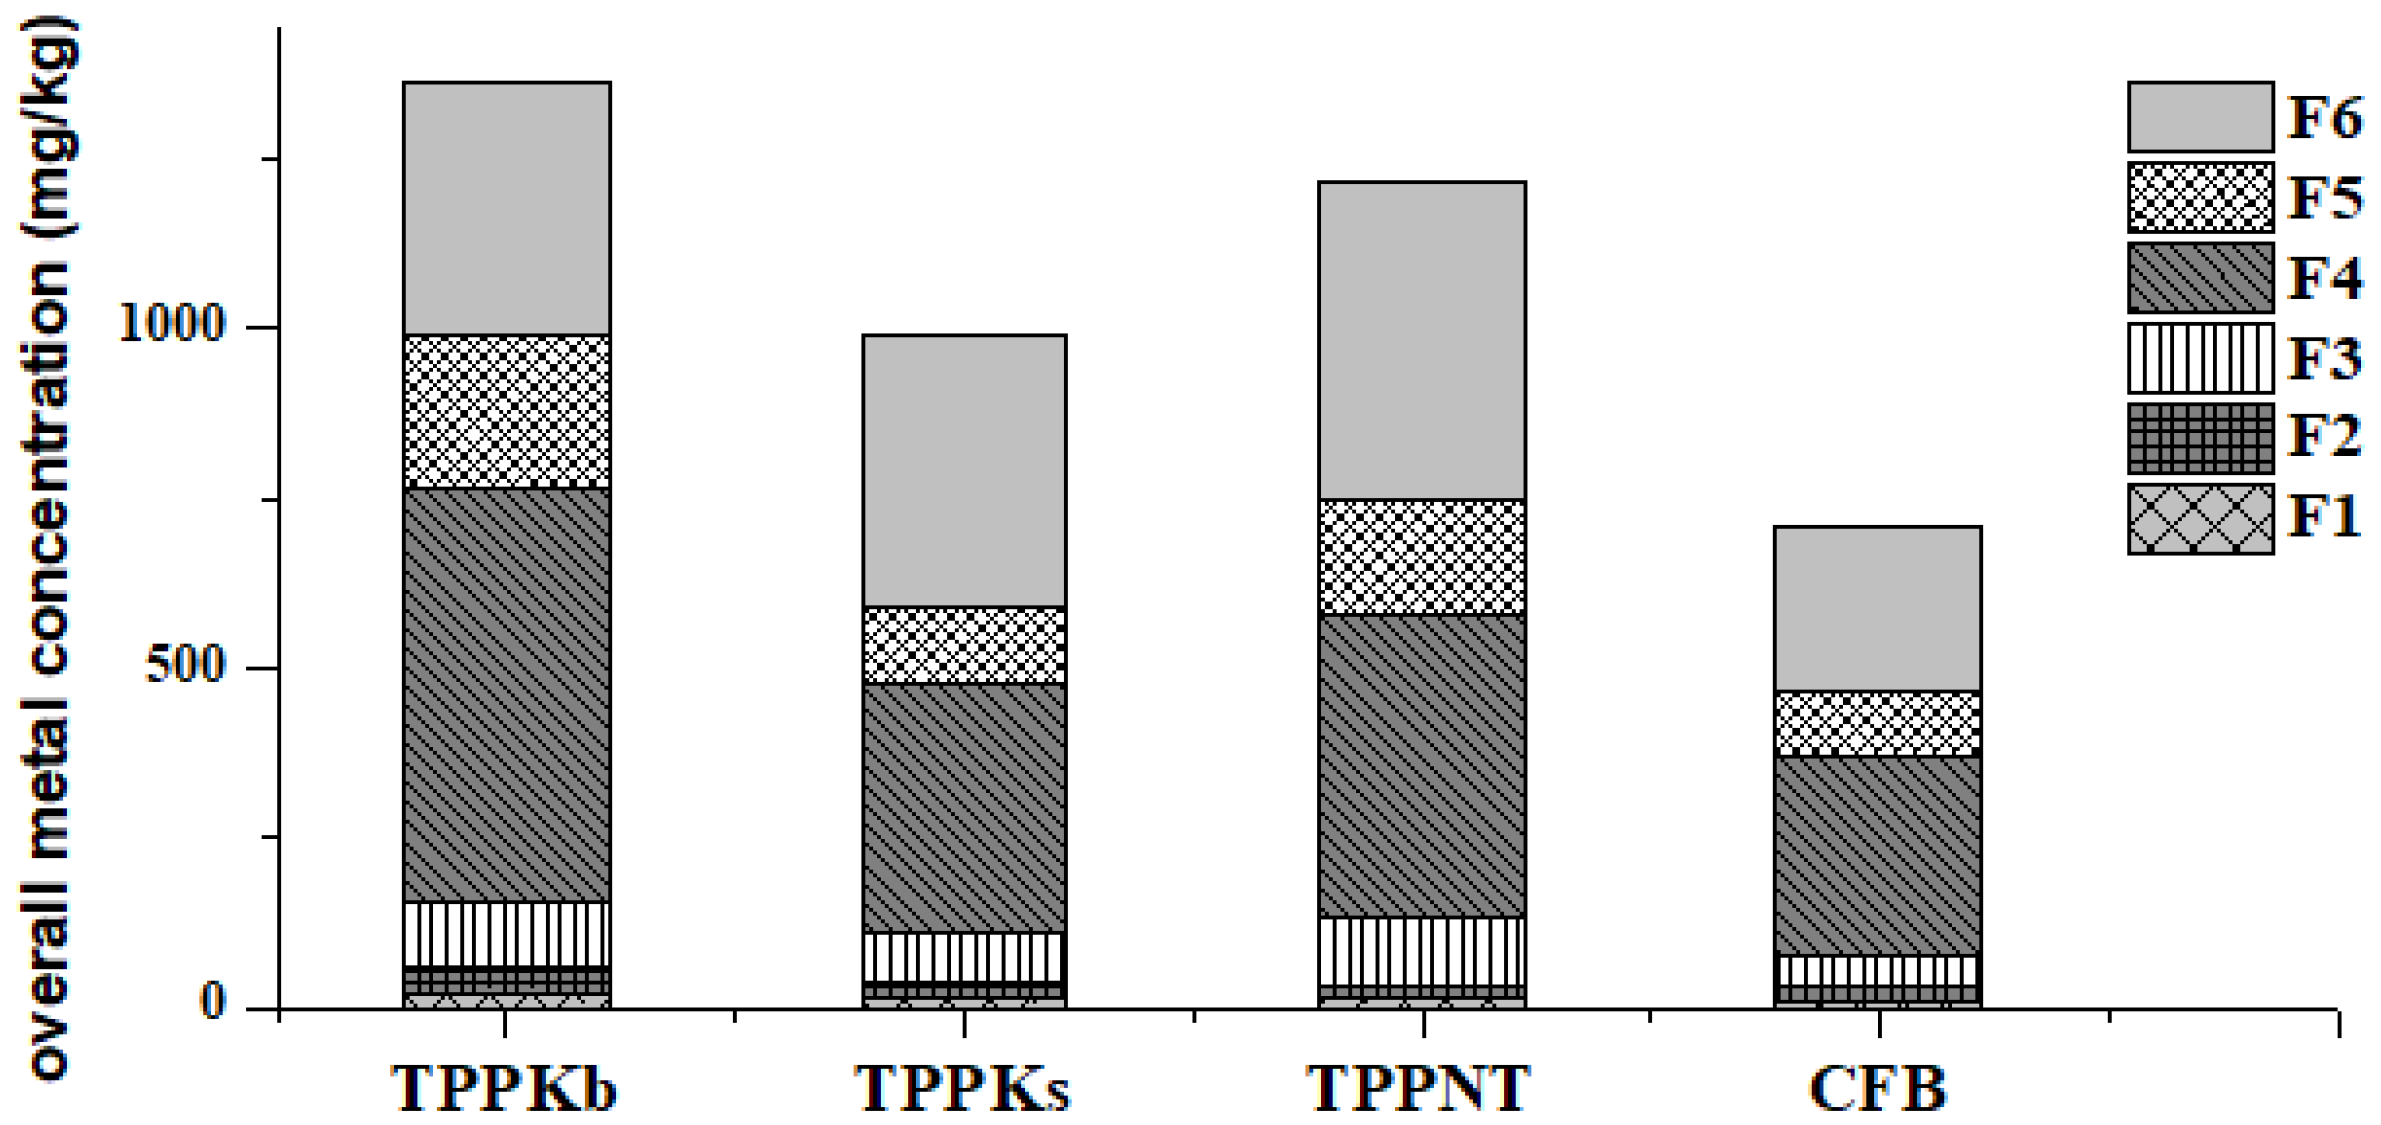
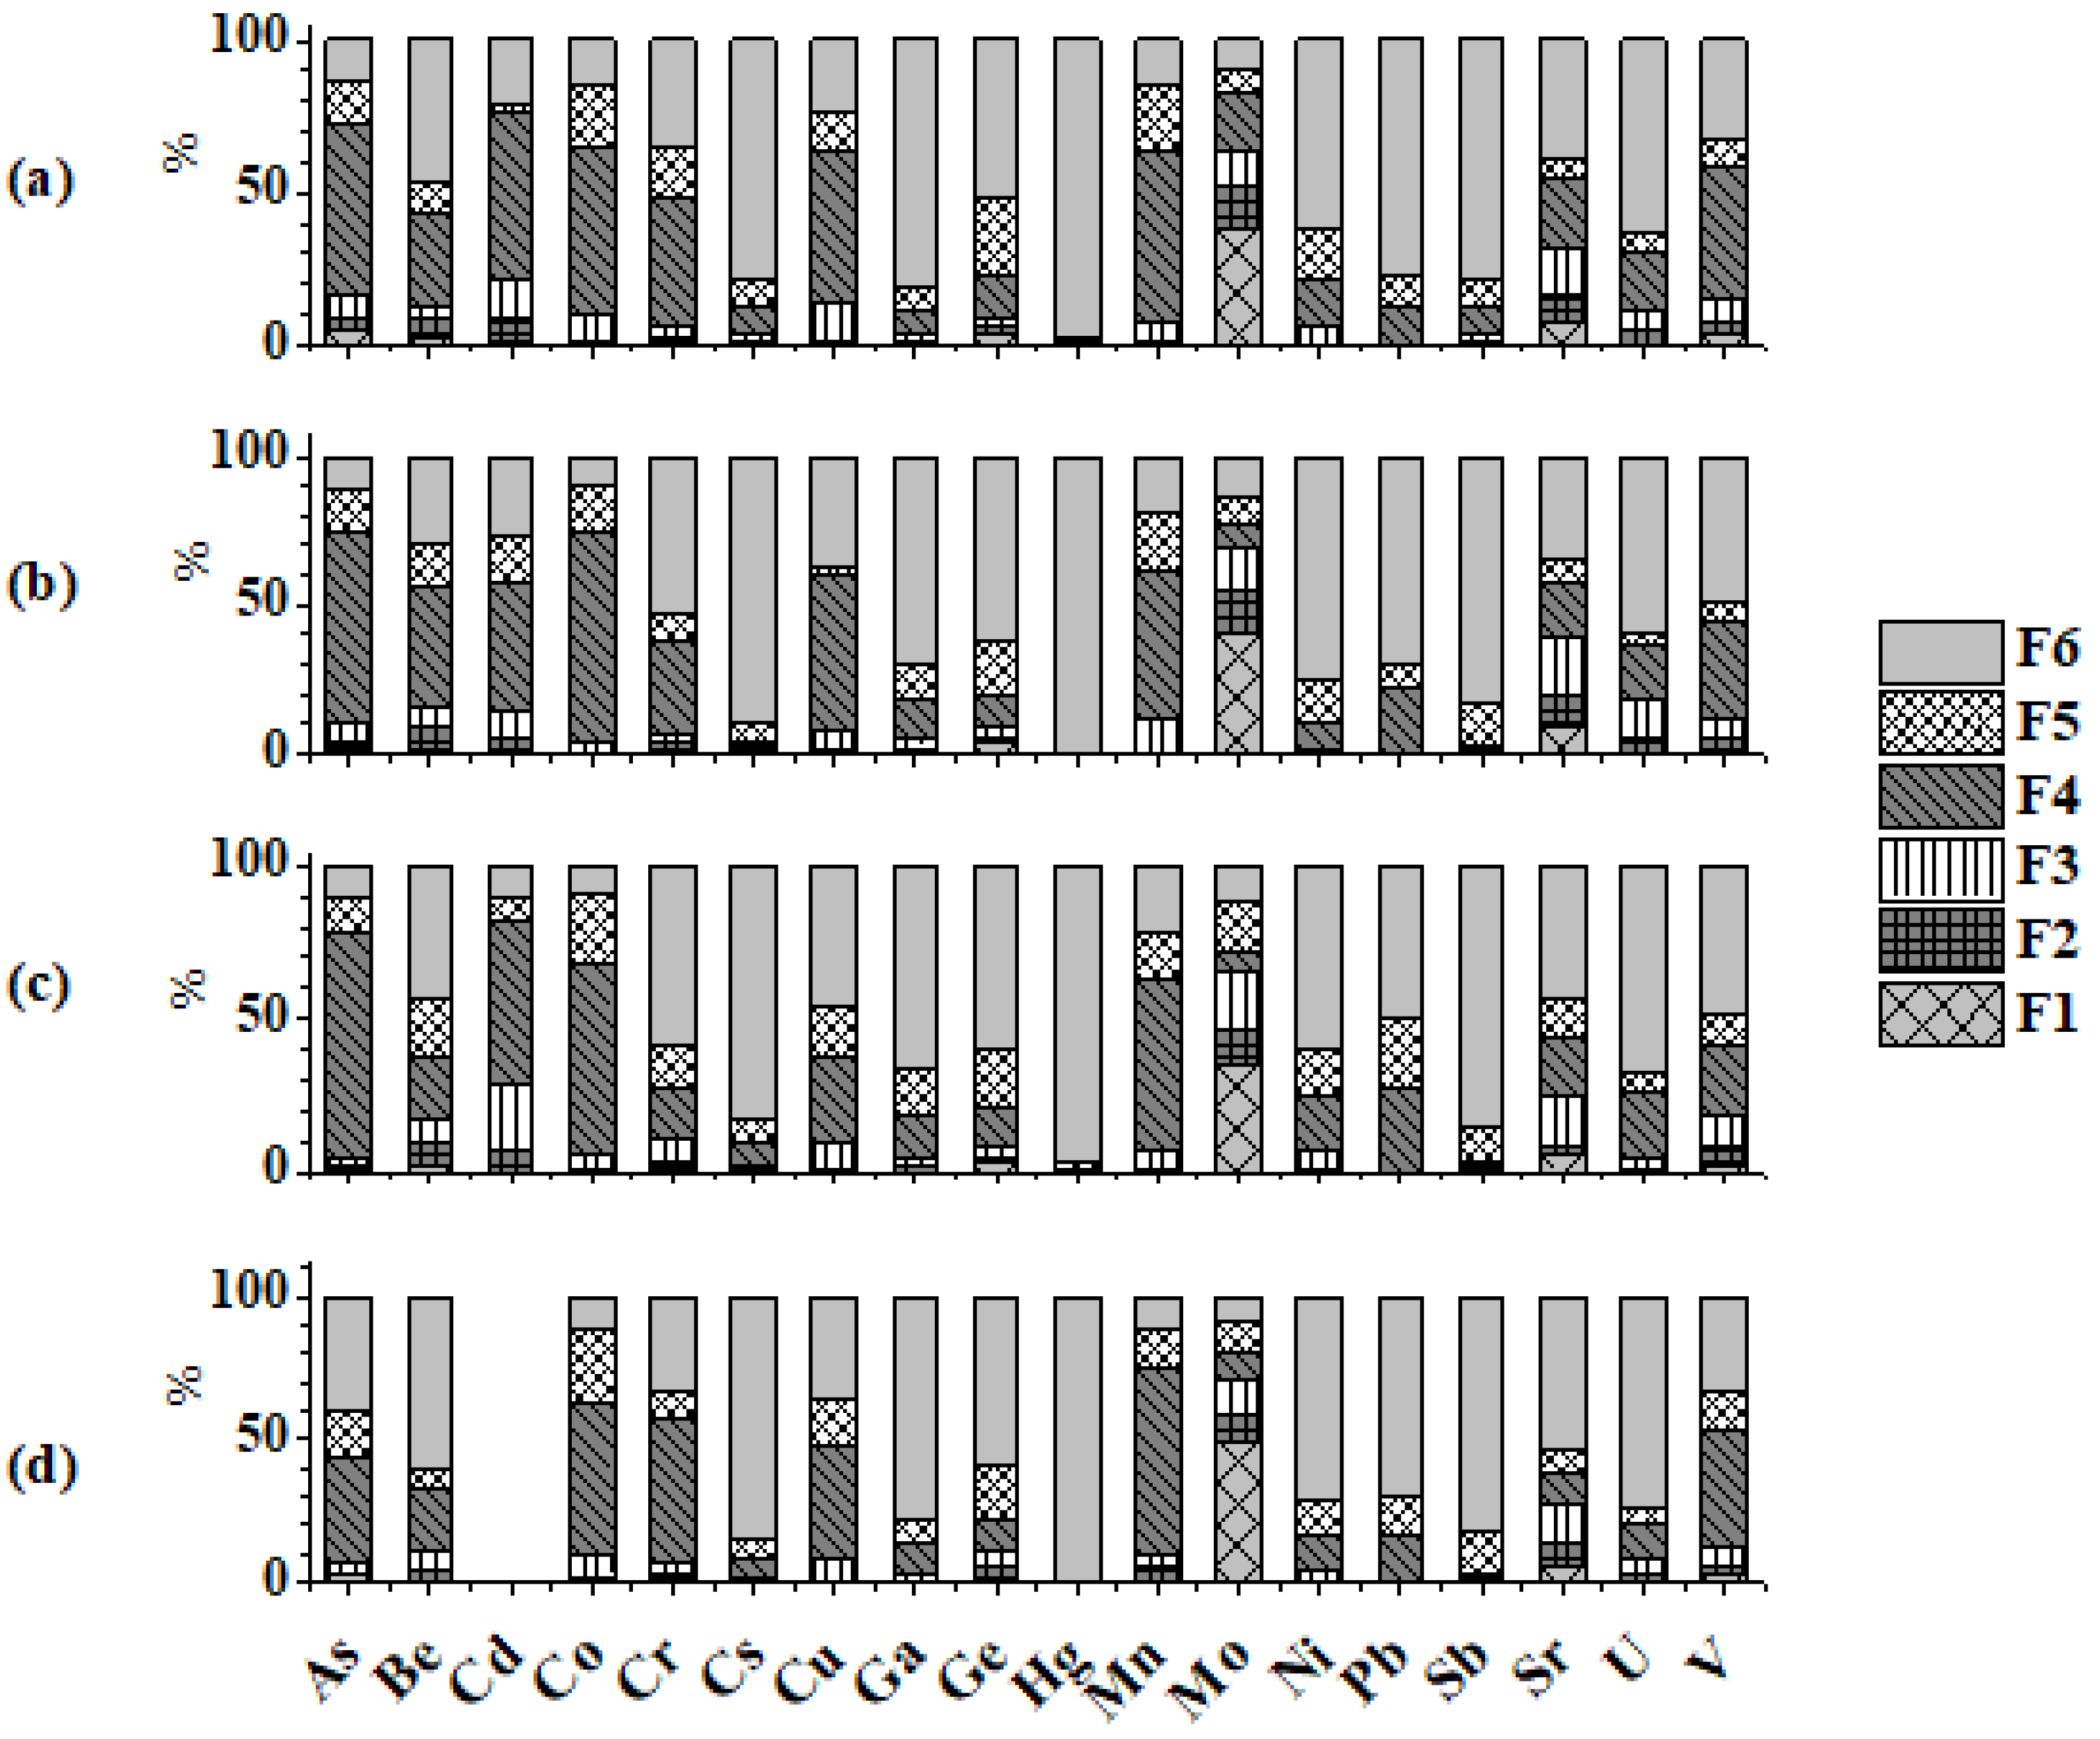
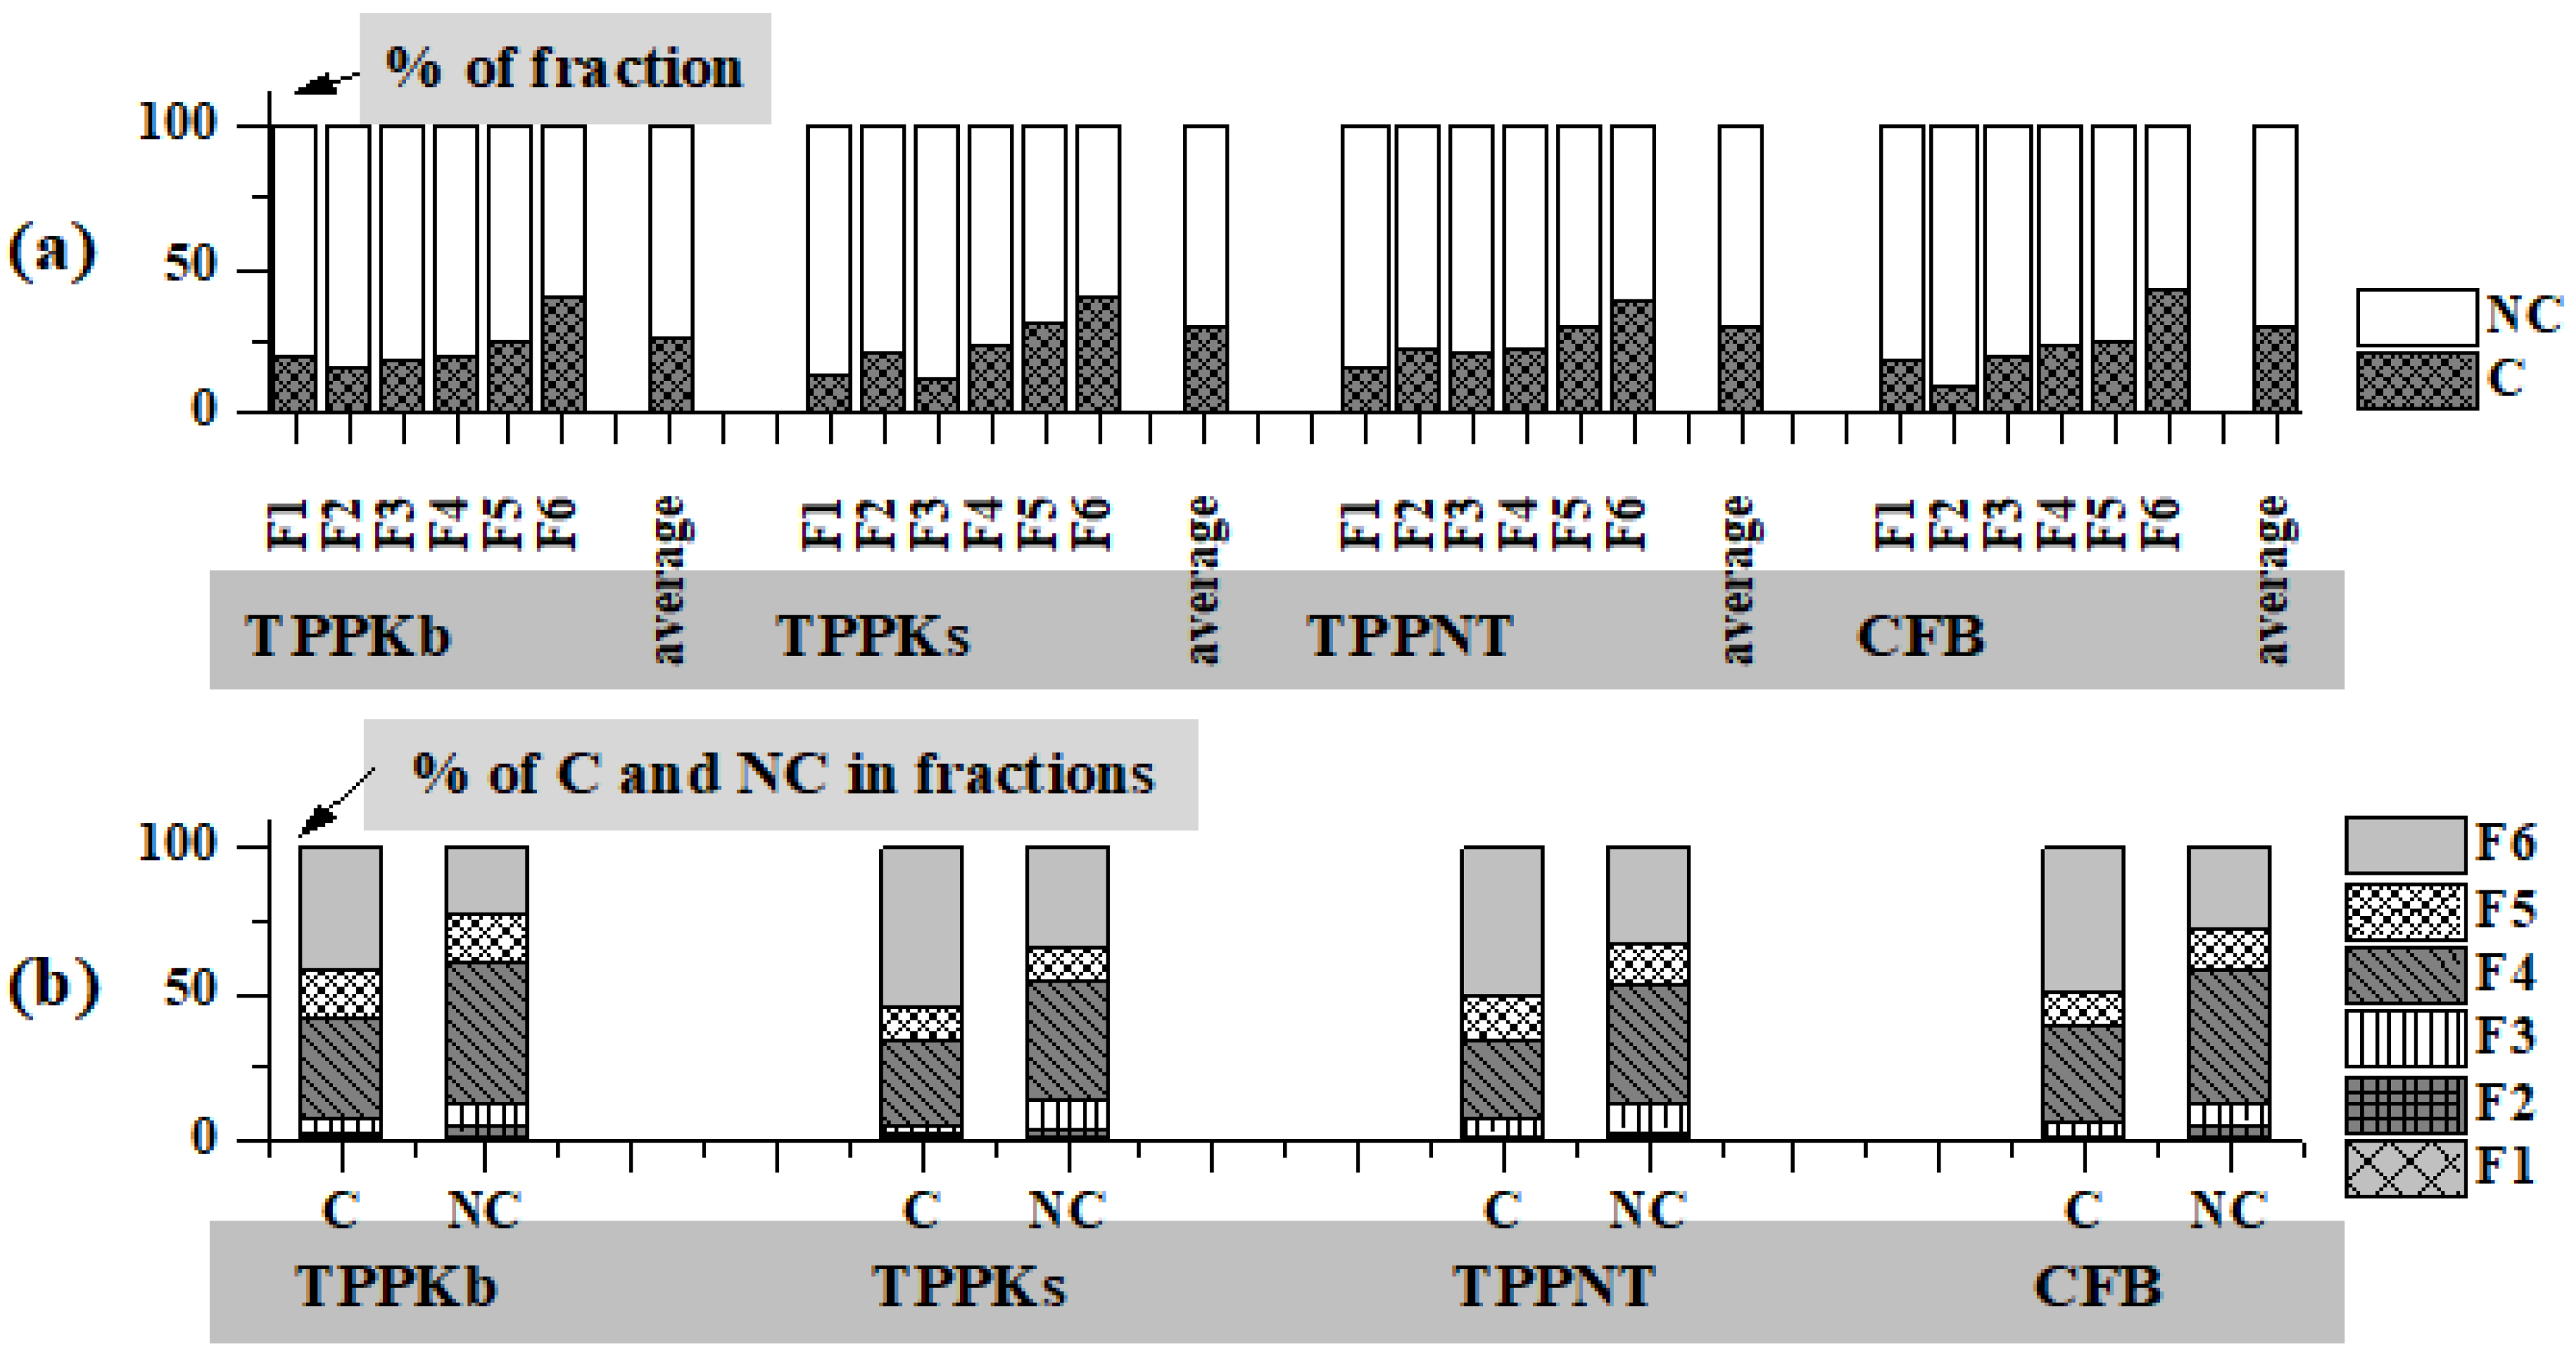
3.2. Sequential Extraction of Trace Elements from FAs

The chemical speciation of 18 trace elements in FAs between the water-soluble fraction (F1), the exchangeable fraction (F2), the carbonate bound fraction (F3), the metal oxide bound fraction (F4), the organic bound fraction (F5), and the residual fraction (F6) was performed. Overall trace element concentrations within six fractions (Figure 2) range from 709.81 mg/kg in CFB to 1360.90 mg/kg in TPPKb. The lowest concentrations are within F1 fractions for all FAs, going from 9.35 mg/kg in CFB to 22.45 mg/kg in TPPKb. The highest concentrations are noticed for F4 fractions in TPPKb and CFB and F6 fractions in TPPKs and TPPNT.
The distribution of all investigated elements among fractions (F1–F6) is shown in Figure 3. The water-soluble fraction is of major environmental concern since anions, such as chlorides and sulfates, are easily available for plant and soil uptake [54]. According to Figure 3, most compounds of the studied trace elements are not water-soluble, so portions of their F1 fractions are low. The exception is molybdenum, which can easily form water-soluble species [15].
In addition, some of the investigated elements (Figure 3) in all FAs (Cs, Ga, Ge, Hg, Ni, Sb, and U) have low levels in F1 and F2 fractions as shown in the literature [46]. Among previously mentioned elements, germanium prevails in the water-soluble phase up to 3.33% in TPPKs, probably due to the presence of GeO2 and GeS2 [55]. In F2 fractions, the proportions of Mo and Sr are the highest (from 3.0% for Sr in TPPNT to 15.42% for Mo in TPPKs). Sr solubility is likely due to its cationic leaching pattern and removal of the exchangeable cation sorbed on the ash particles surface [56]. F3 fraction mainly consists of elements as carbonates or oxides/hydroxides (Cd, Cu, Mn, Mo, V, and Sr) [57,58]. pH reduction increases the mobility of the carbonate form of these trace elements [59]. Trace elements in the F4 extraction step are moderately mobile and sensitive to redox potential changes [21]. The investigated elements proportion in F4 fractions ranges from 0.74% for Hg (TPPKb) to 73.62% for As (TPPNT). Elements of the F5 fraction can occur as oxidizable minerals, e.g., sulfides [22], and their mobility is relatively low unless they undergo the oxidation process. Co has a maximal portion of 26.45% in CFB among all elements within F5 fractions. The majority of elements have the highest distributions in residual fractions in all FAs (Cs, Ga, Ge, Hg, Ni, Pb, Sb, Sr, and U) or are evenly distributed between F4 and F6 fractions (As, Cr, Cu, and V). Since elements from the residual fractions have strong bonds with the mineral crystal lattice, their mobility is low, and they are not considered to be of environmental concerns.
Among investigated elements, As, Cd, Cr, Hg, Ni, and Pb are carcinogenic (C), while Be, Co, Cs, Cu, Ga, Ge, Mn, Mo, Sb, Sr, U, and V are considered to be non-carcinogenic (NC). The carcinogenic element prevails in F6 fractions and goes from 39.52% in TPPNT to 42.92% in CFB, while the non-carcinogenic portion is up to 91.31% in the F2 fraction of CFB (Figure 4a). Figure 4b displays the distributions of the C and NC elements among the six fractions with the overall content set to be 100%. Carcinogenic element portions in the environmentally significant fractions (F1–F3) range from 5.07% in TPPKs to 7.76% in TPPKb, while non-carcinogenic element distributions vary from 12.23% in TPPNT to 13.50% in TPPKs (Figure 4b).

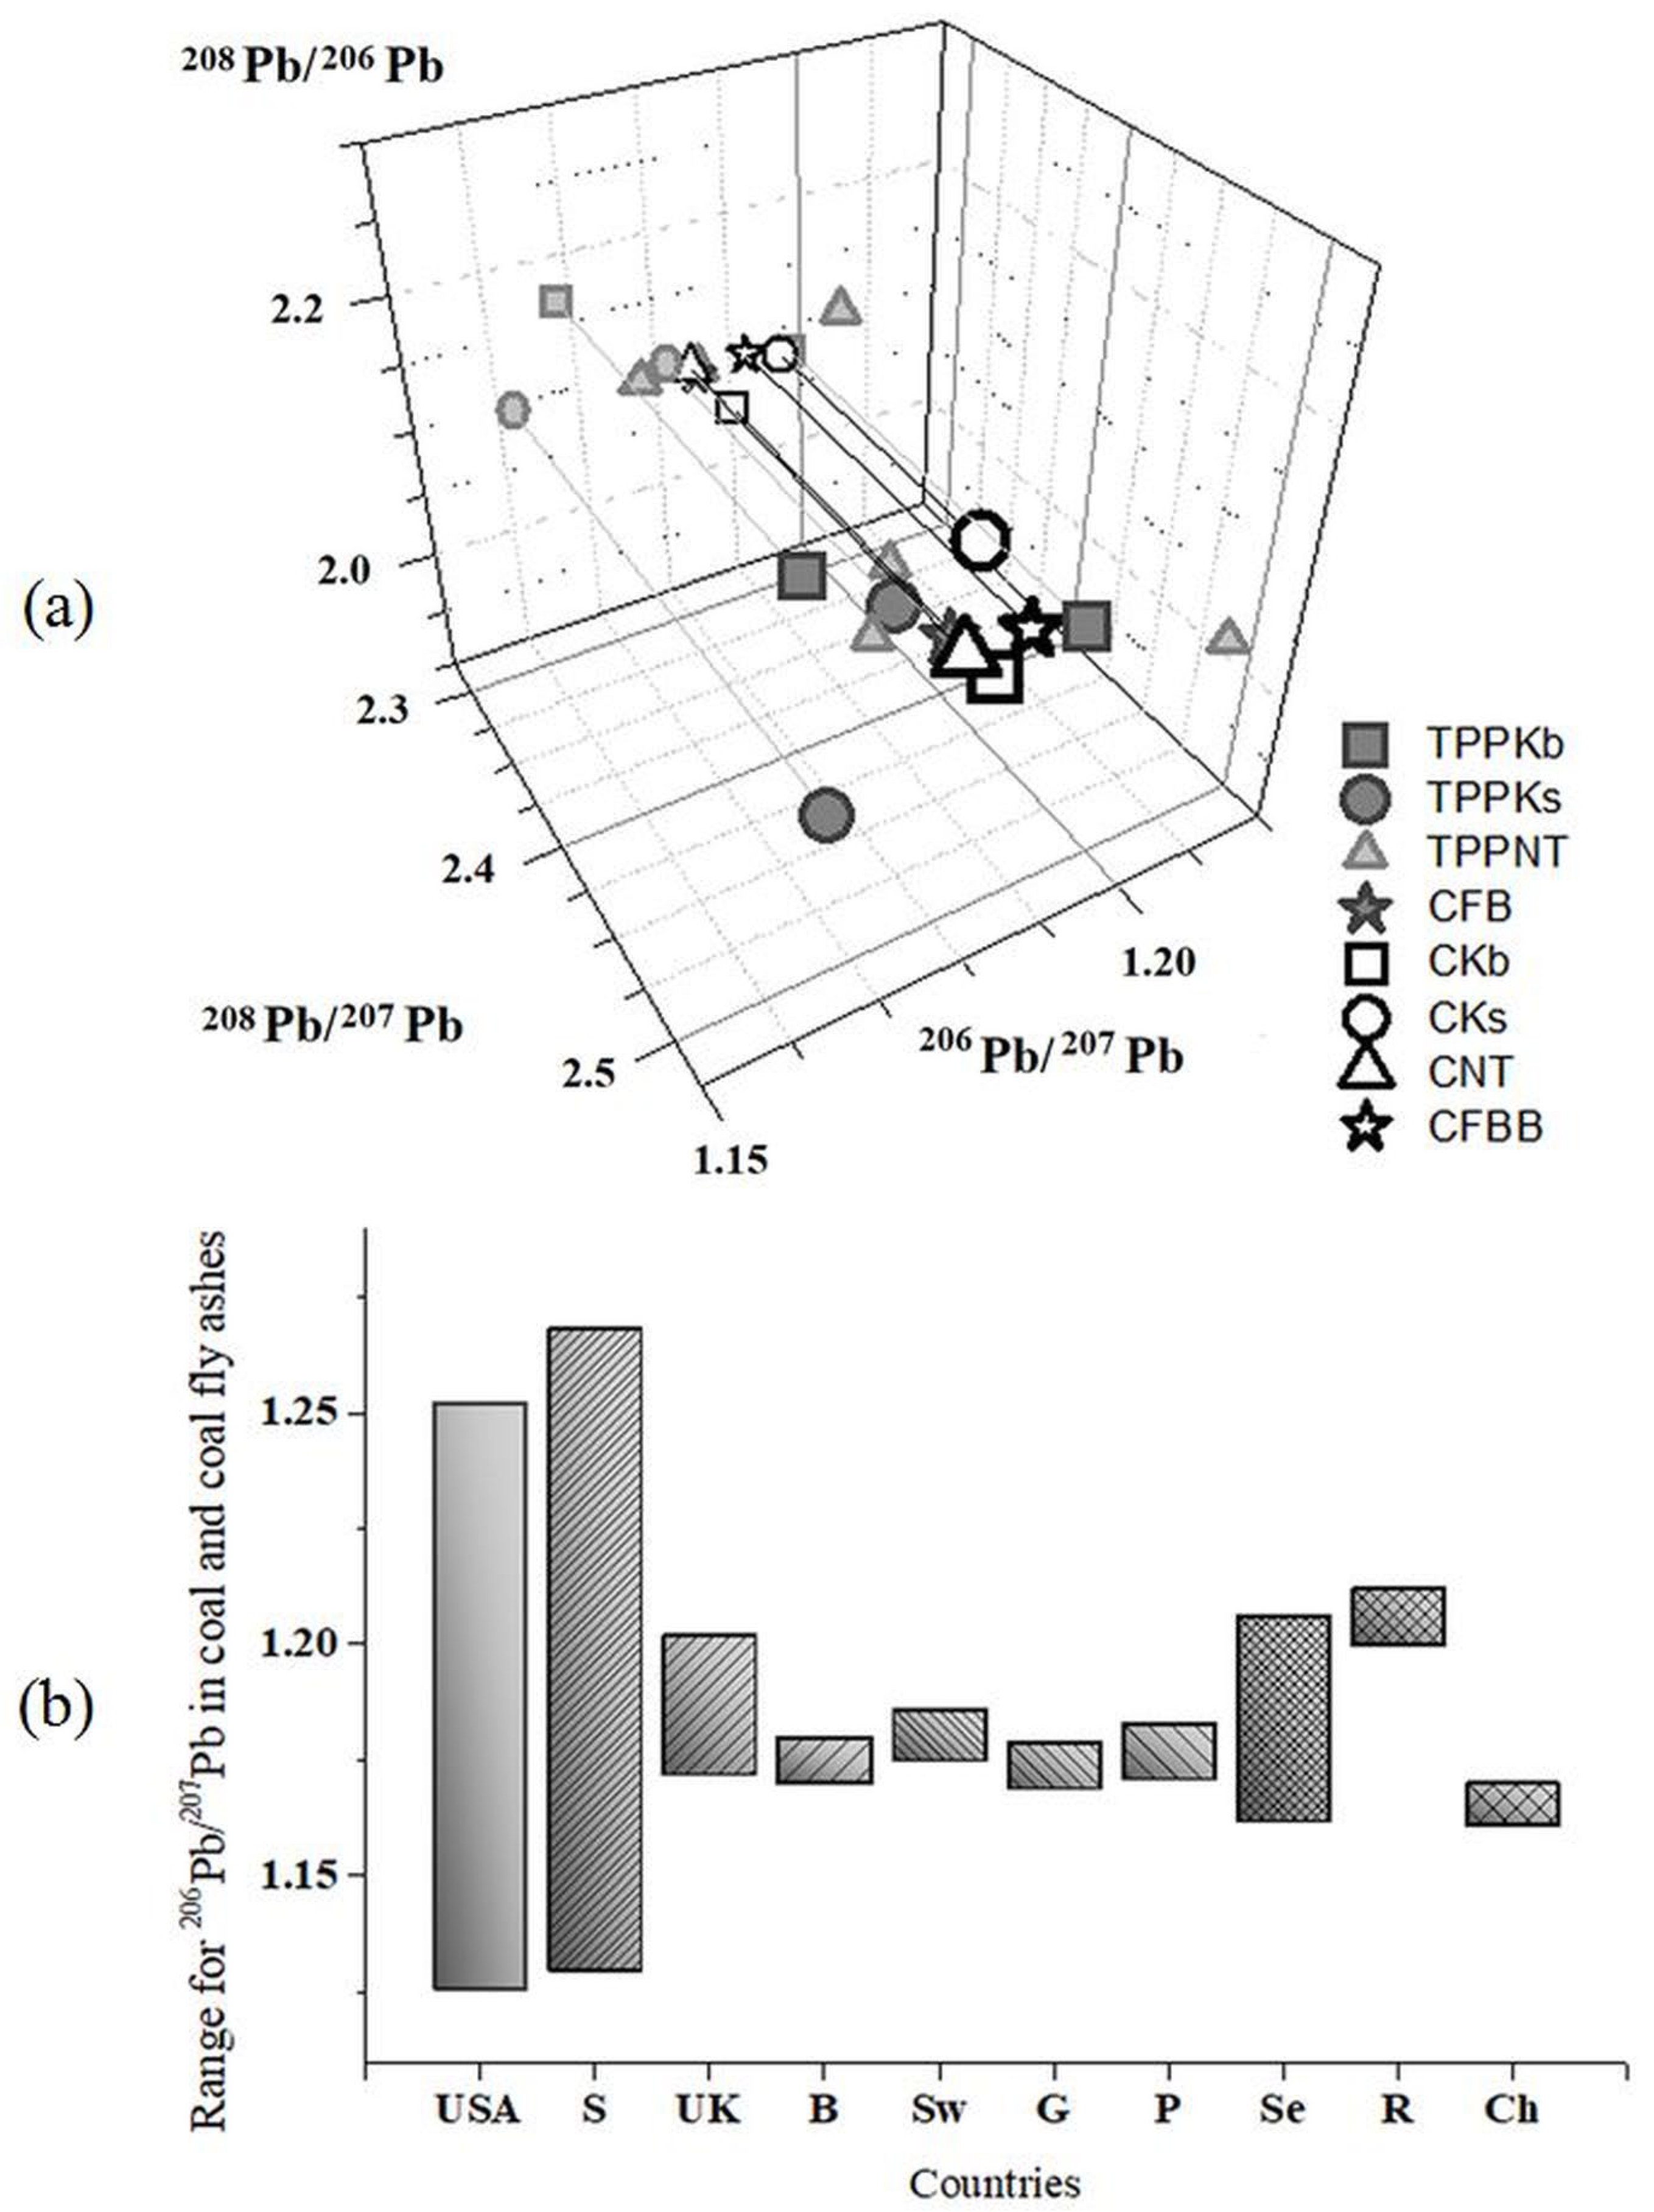
3.3. Lead Isotope Ratios

Coal combustion is a predominant source of lead pollution, and because of that lead isotopic composition in FAs and coals has a major influence on total Pb isotopic fingerprint [29]. Figure S1a demonstrates the ranges of lead isotope ratios among investigated fly ashes and coals for 206Pb/207Pb (from 1.162 to 1.206), 208Pb/207Pb (from 2.434 to 2.533), and 208Pb/206Pb (2.045 to 2.167). In addition, Figure S1b shows the values of 208Pb/206Pb and 206Pb/207Pb from available literature data [29,30,32,33]. The 3D diagram of all determined Pb isotope ratios for Serbian coals and fly ashes are shown in Figure 5a. Figure 5b compares 206Pb/207Pb literature data for coal combustion worldwide [29,33] with data obtained in this study. The mean value of 206Pb/207Pb ratio for Serbian coals and FAs is 1.186 ± 0.012, and it highly correlates with the United Kingdom (1.187), Switzerland (1.181), and the USA (1.189). Therefore, identifying the lead pollution fingerprint for Serbian coals and FAs contributes to lead pollution studies.

3.4. Trace Elements EFs

Table 2B also summarizes the EF values of trace elements, as well as their lower and upper limits along with the average value obtained from the EMEP inventory manual. Among investigated elements, EFs are considerably higher for As (FBB and TPP Kolubara A), Cr (FBB), Cu (TPP Kostolac B), Hg (TPPs Kostolac B and Nikola Tesla A), and Ni (TPP Kostolac B). Much higher EF values for some trace elements in all TPPs than their representative EFs [52,53] can be explained by the poorer quality of lignite utilized in all TPPs compared with coal provided in EMEP.
Despite having different powers, the EFs of Cr, Cu, Hg, and Pb in TPPs Kolubara A and Nikola Tesla A are comparable, at the same time TPP Kolubara A exhibits EFs higher from around 40% for As and Ni to 106% for Cd. Higher temperatures, better process optimization, and better air pollution management in TPPs, combined with lower feed fuel quality in FBB, result in much higher EFs of all trace elements (aside from Hg) for FBB than for TPPs (Table 2B).
Table S3 compares As, Cr, Hg, and Pb emission concentrations, ranging from 4.02 μg/m3 for Hg in FBB to 42.68 μg/m3 for Pb in TPP Kostolac B, to their respective emission limits for coal-fired units [60,61]. Arsenic emission concentrations from all combustion facilities exceed limit values compared with both standards (Table S3), while only Hg emission from FBB meets US EPA criteria.

3.5. Environmental Concerns of Investigated Trace Elements from FAs

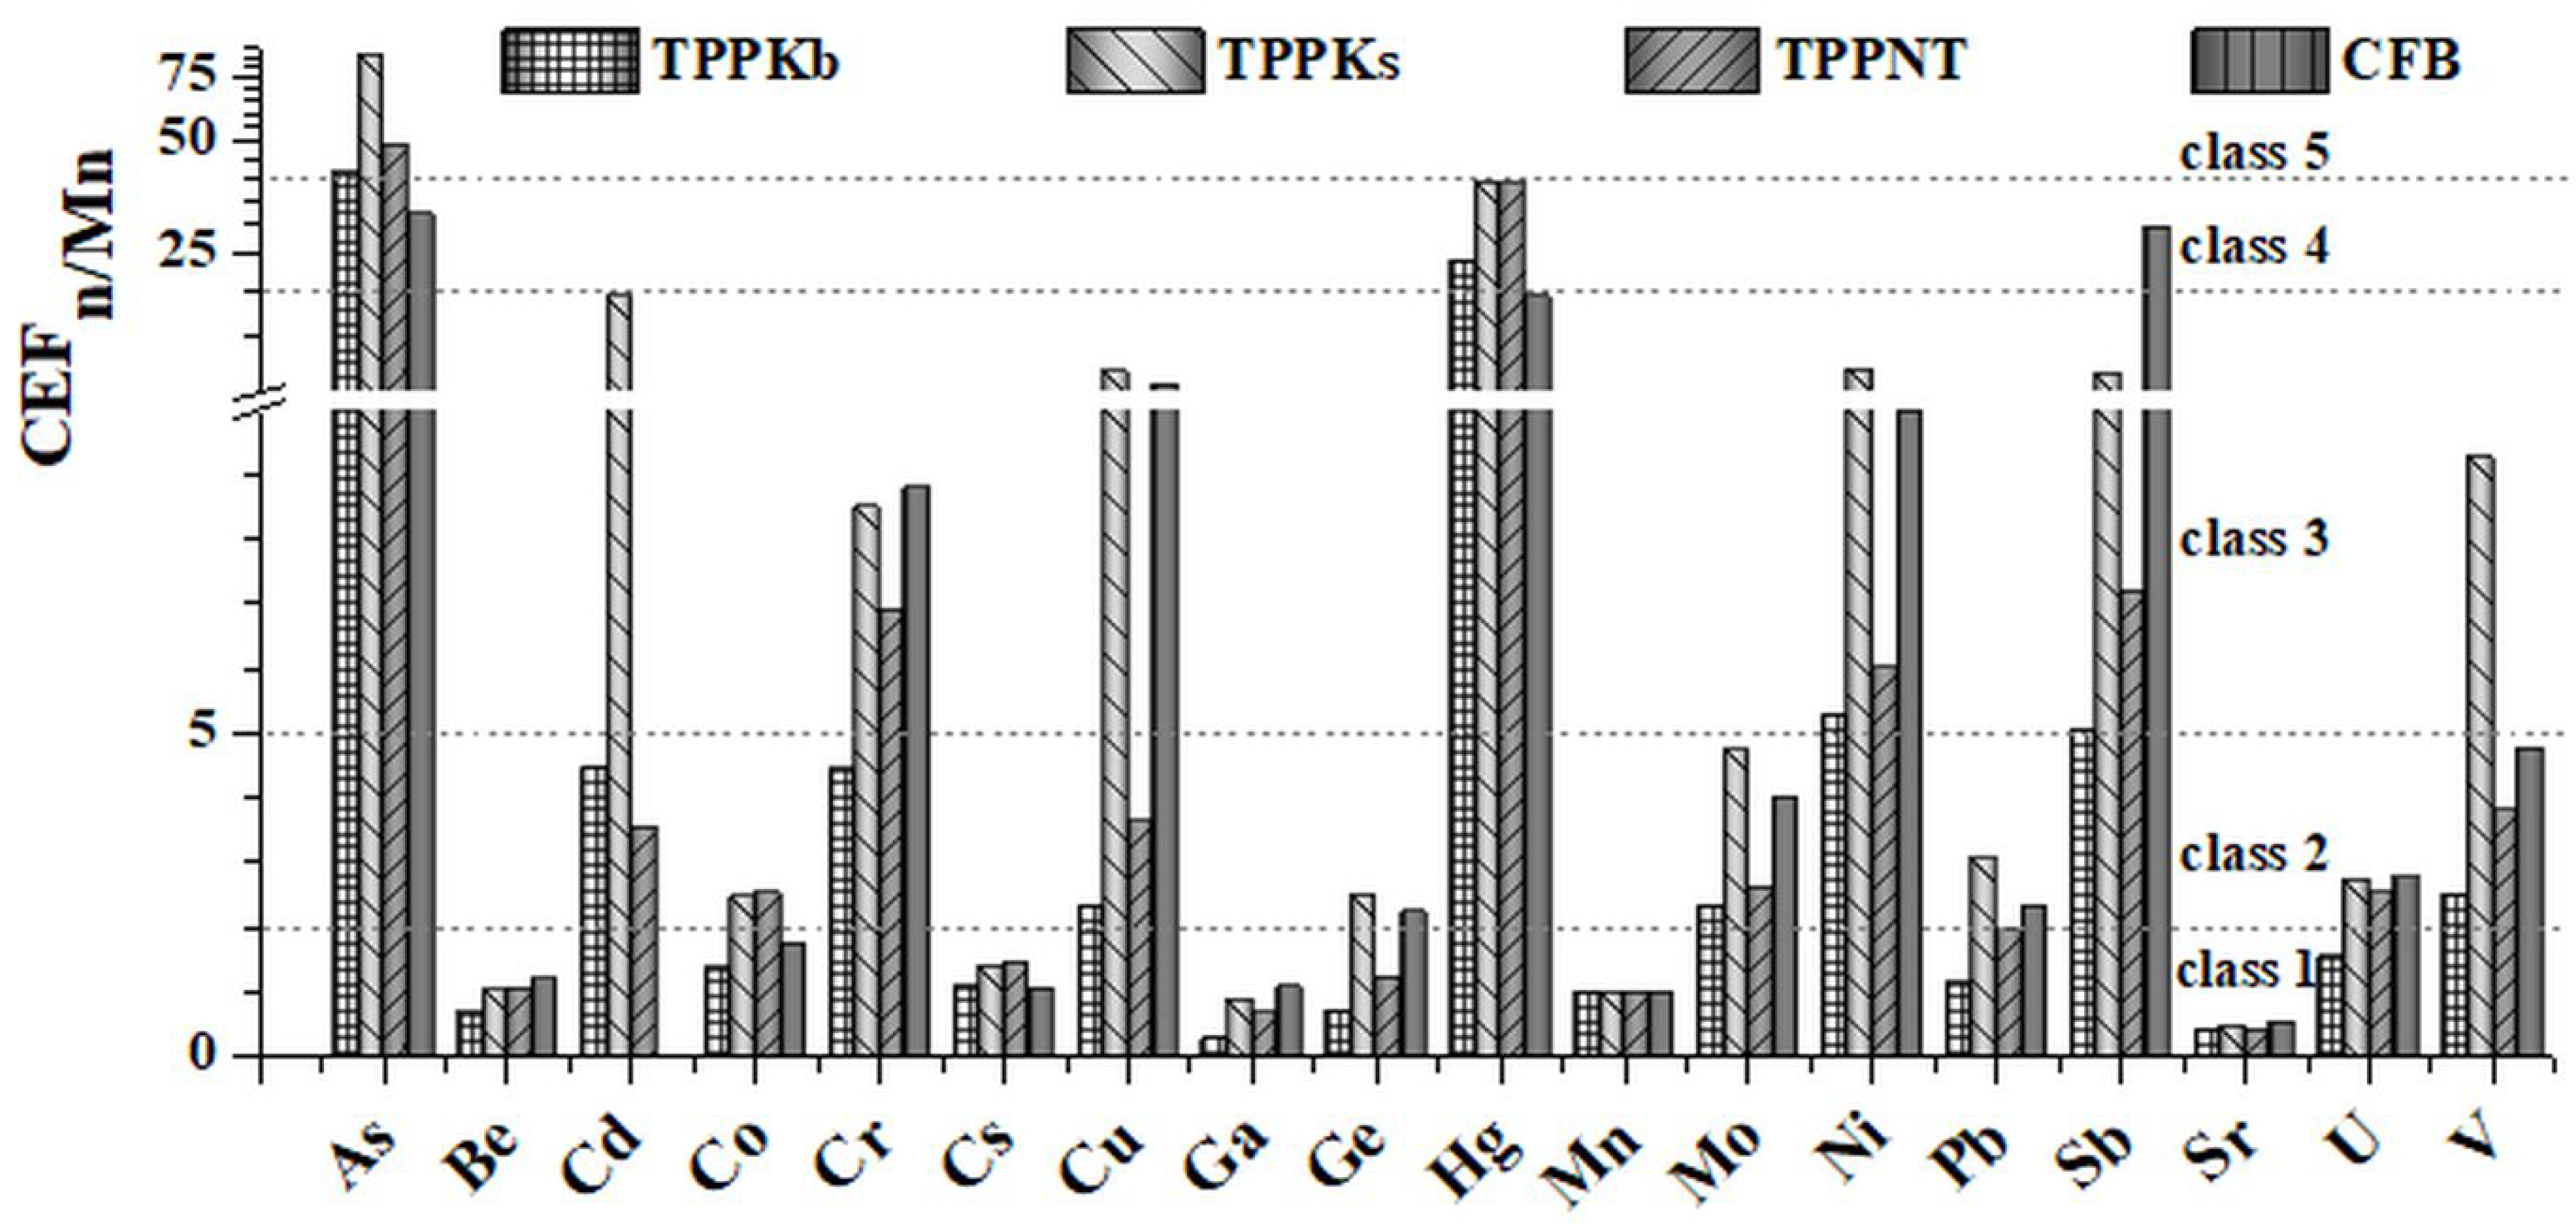
3.5.1. Crustal Enrichment Factor Normalized to Mn (CEFn/Mn)

CEFn/Mn values for all investigated elements were determined and presented in Figure 6. To comprehensively evaluate the pollution level of elements for examined FAs, five classes for CEF [62] were displayed in Table S4. Among investigated trace elements, As and Hg show the highest enrichment, which is more pronounced for all FAs from TPPs compared with CFB. CFB, on the other hand, has the greatest CEFn/Mn values among all FAs for Be, Cr, Ga, Sb, Sr, and U. No enrichment is observed for Be, Cs, Ga, and Sr.

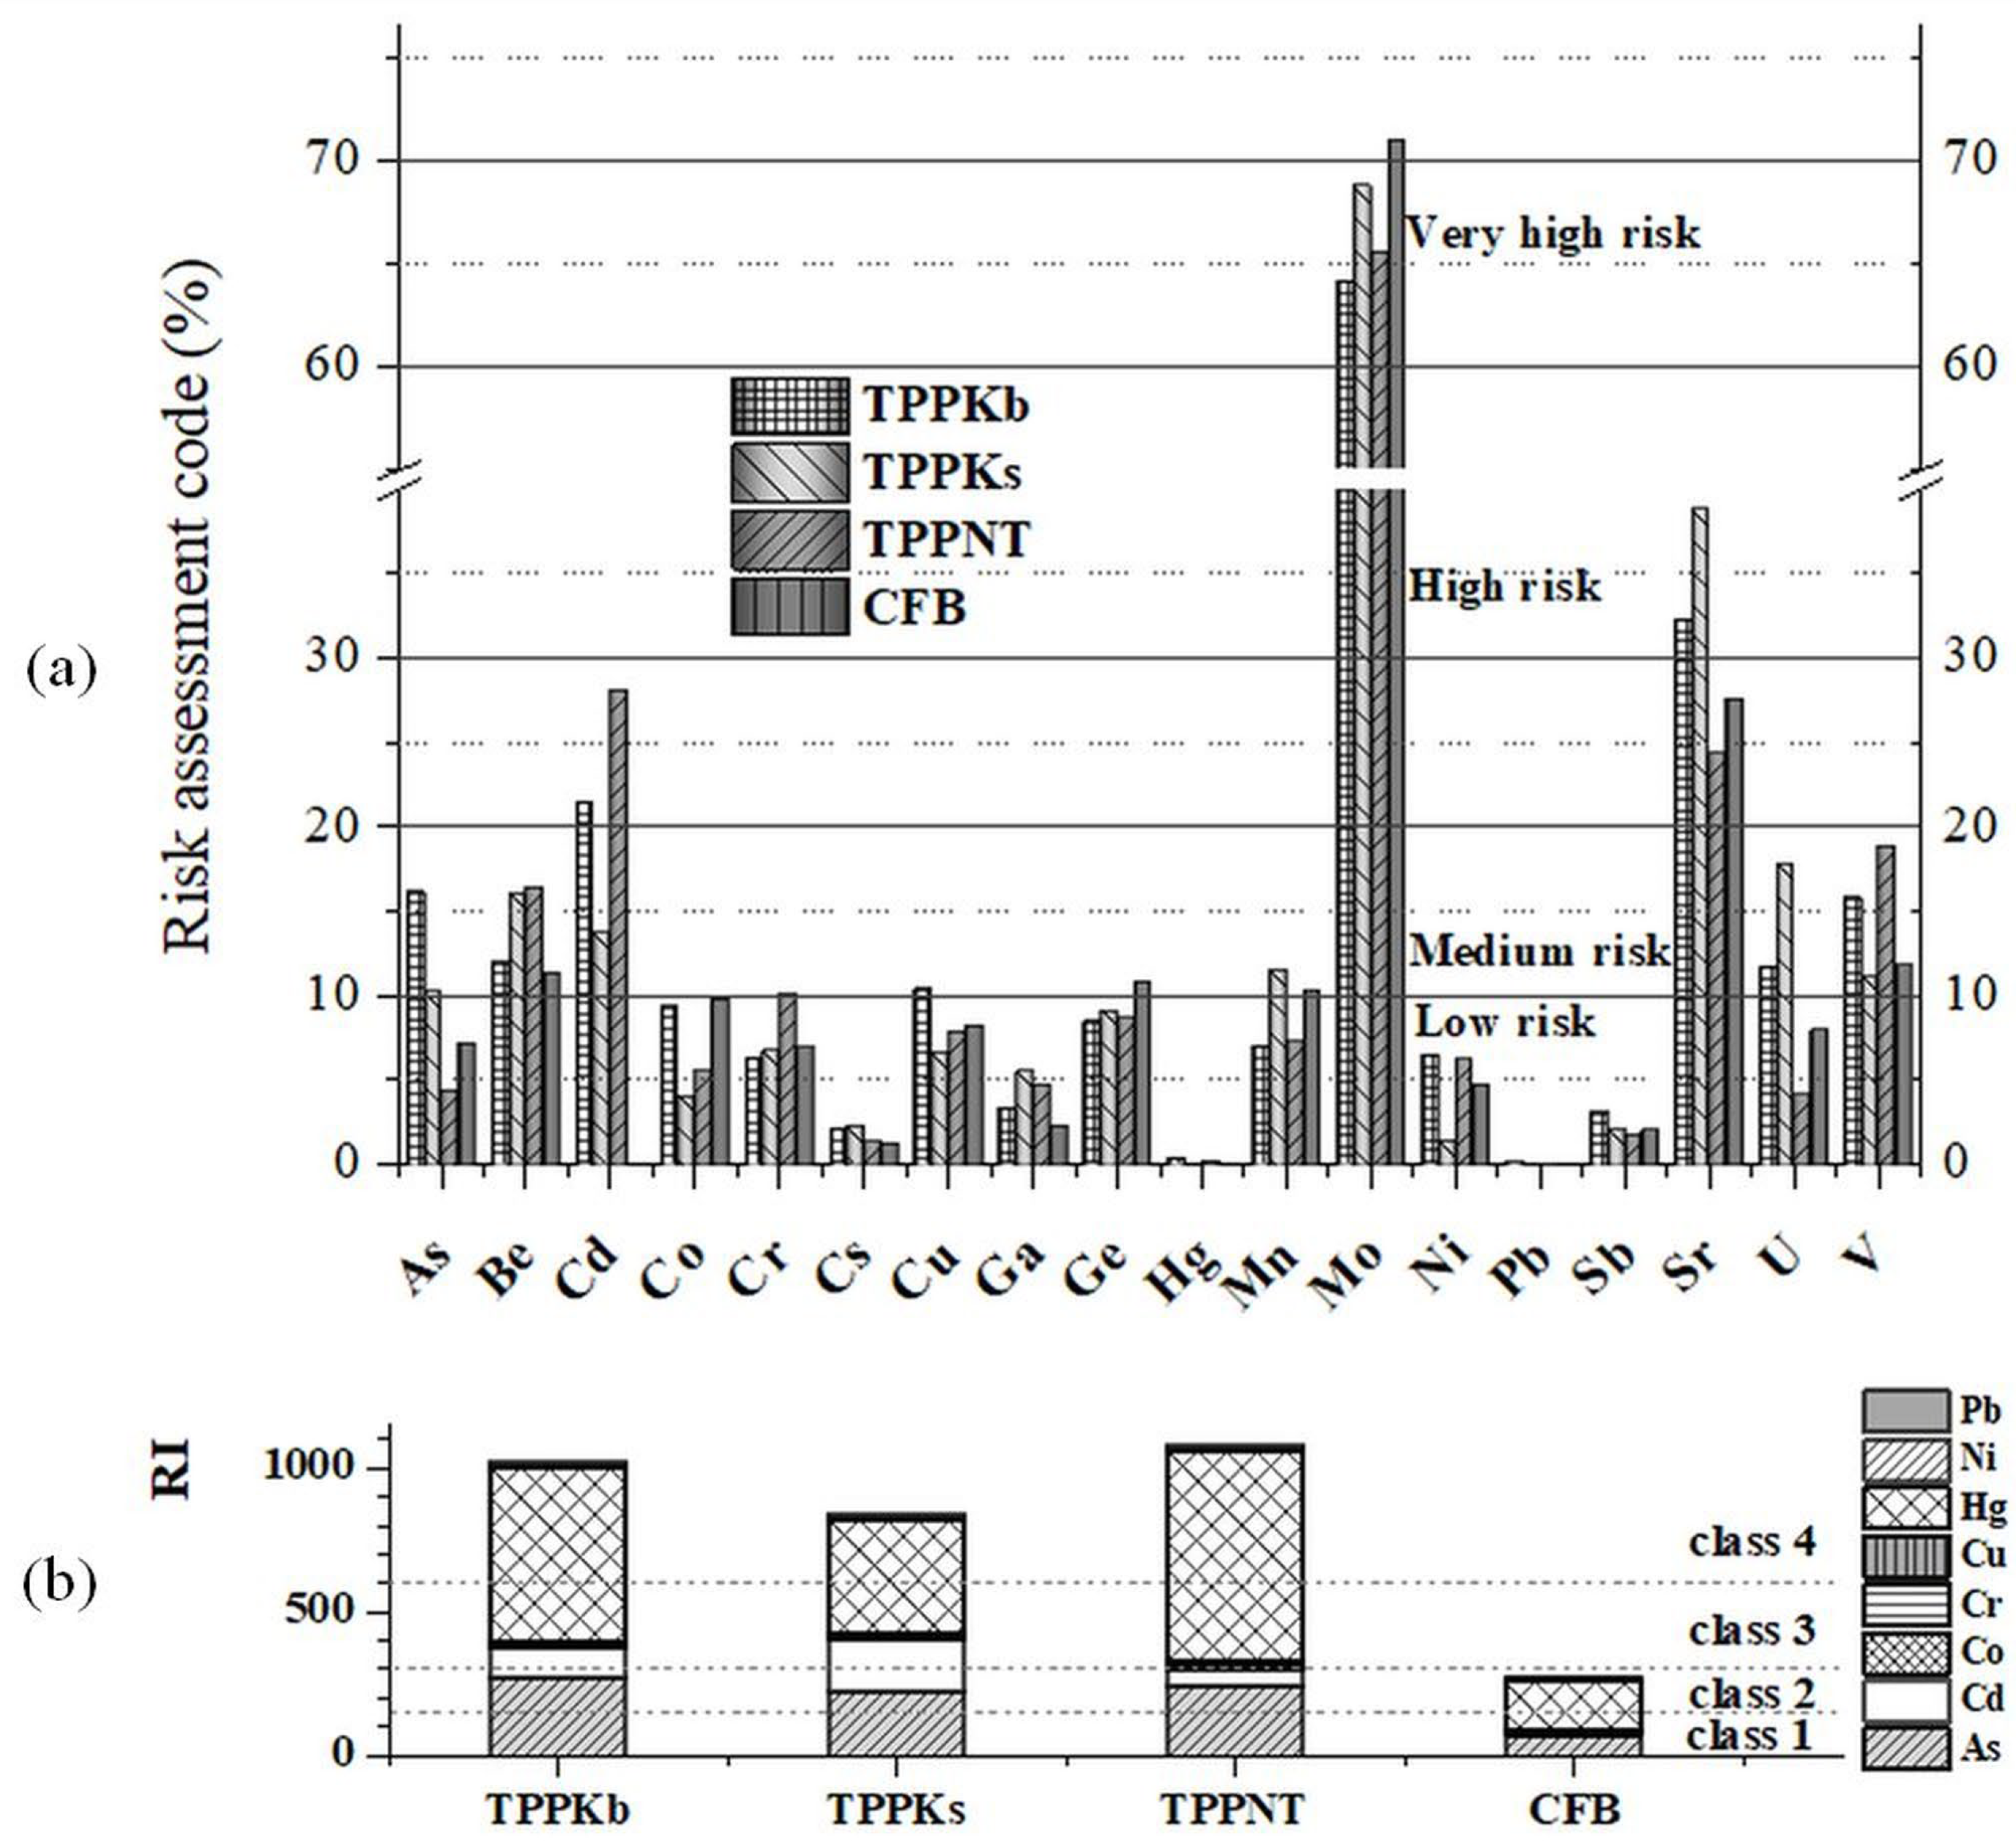
3.5.2. Risk Assessment Code

The toxic trace elements content in various matrices is typically expressed as total or water leaching concentrations. The content and leaching patterns of potentially toxic substances in coal combustion residues can provide valuable information for landfilling or be a limiting factor for application [63]. Table S5 compares the content of the most toxic elements in the investigated fly ashes with the European countries’ legislation. According to the Canadian Environmental Protection Act, six elements (As, Cd, Hg, Ni, Cr, and Pb) are defined as toxic substances [64]. As and Hg for all FAs from TPPs, as well as Pb for all FAs, are above limit values [65], while other potentially hazardous elements are below these limits. The trace elements from F1 fractions can be defined as non-hazardous [66], as shown in Table S5.
RAC classification (Table S4) is important for estimating the potential leachability of elements from the sample matrix to the environment. The results for RAC (Figure 7a) suggest that Mo presents the highest risk. Sr displays medium risk of TPPNT and CFB, while values for TPPKb and TPPKs are above 30%. Be (up to 16.47%) and V (up to 18.93%) in all FAs, as well as Cd (up to 28.10%) for FAs from TPPs, pose a medium risk to the environment. Among investigated trace elements, only Co, Ge, and Mo have higher RAC values for CFB compared with the other FAs from TPPs. Although RAC values for some trace elements (Figure 7a) indicate a high environmental risk, some of them, such as Mo, are not considered environmentally relevant [14,65].

3.5.3. Pollution Indices and Risk Indices

Table S6 summarizes PI values for all investigated trace elements along with their pollution levels [67]. PIs indicate very high pollution levels for As (from 11.25 in CFB to 42.17 in TPPKb) and Hg (from 6.71 in CFB to 29.35 in TPPNT), while Cr, Ni, and Sb show a high level of pollution (Table S6). Among investigated FAs, Be, Ga, and Sr do not pose any pollution (class 1), while only Sb shows the highest pollution in CFB compared with other FAs.
The potential ecological risk index (RI) categorizes different matrices based on the degree of contamination (Table S4 shows ecological risk limits). Figure 7b depicts RIs for the most toxic elements (As, Cd, Co, Cr, Cu, Hg, Ni, and Pb) in investigated fly ashes. Since the RI values for all FAs from TPPs are higher than 600, they represent a very high ecological risk, while CFB shows a moderate ecological risk [68,69].

3.6. PAHs Content in FAs

Individual and total PAH concentrations are presented in Table 3. Overall PAH contents are from 286.69 ng/g (TPPNT) to 33,378.53 ng/g (CFB), which is in accordance with the literature [19,28,70,71]. Figure S2 shows PAHs distribution by ring number (a) and the total and carcinogenic PAH contents of the investigated FAs (b). The four ring PAHs have the highest yield in CFB (68.29%) and TPPKb (66.07%), while the sum of two and three ring PAHs predominates in TPPKs (75.44%) and TPPNT (68.16%). Flu and Fla are the most abundant among examined PAHs (Table 3), as expected, since they can be commonly found in products of incomplete combustion of fossil fuels [70].

3.7. PAH Emission Factors

PAHs belong to the most hazardous and persistent organic compounds, particularly BbF, BkF, BaP, and IP, and since they can easily reach the atmosphere, estimation of their EFs is important [72]. Additionally, Table 2C shows PAHs emission for the combustion of lignite in TPPs and coal waste in FBB, as well as their EMEP emission limits [45].
PAHs portion in the finest ash particles emitted along with flue gases ranges from 39.96% (TPPs Kostolac B and Nikola Tesla A) to 94.63% (FBB). TPPs Kostolac B and Nikola Tesla A have BaP emission that exceeds the upper limit specified by EMEP, most likely due to lower lignite quality than coal listed in the EMEP (Table 2C). BbF, BkF, BaP, and IP emissions from TPP Kolubara A are within permissible limits. The estimated EF values for FBB (Table 2C) are elevated probably due to reduced combustion temperature, poor coal quality, and low cyclone efficiency.

3.8. Potential Environmental Effects of PAHs from FAs

To assess the carcinogenic potential of studied FAs, calculated overall BaPeq and BaPE are shown in Table 3. The total BaPeq for PAHs ranges from 5.21 ng/g (TPPNT) to 876.73 ng/g (CFB), while BaPE varies from 3.66 ng/g to 632.15 ng/g for TPPKs and CFB, respectively. The calculated BaPeq and BaPE values are in accordance with the literature findings for different FAs [28,73]. Figure S3 shows BaPeq ratios for each PAH expressed relative to BaP (set as 100%). BaA proportions are the highest and range from 50.25% (TPPNT) to 150.83% (CFB).

4. Conclusions

The environmental impact of byproducts generated during coal combustion in various TPPs (Kolubara A, Kostolac B, and Nikola Tesla A) and coal waste burning in an experimental semi-industrial fluidized bed boiler was investigated in this study. The aim was to determine the emission of gaseous pollutants (NOx, CO, and SO2) and total PM, estimate trace elements and PAHs emission factors, assess the environmental risk of FAs landfilling, and establish lead isotope ratios for Serbian coals and FAs.
The general conclusions are:
  • Total PM emission factors exceed EMEP PM10 upper limits for all combustion facilities, while significantly higher EFs values are noticed for NOx and SO2 in TPP Kolubara A and CO in TPPs Nikola Tesla A and Kostolac B;
  • Arsenic emissions from all combustion facilities exceed the limit values specified in relevant standards, whereas only Hg emissions from FBB fulfill the criterion established by the US EPA;
  • FBB has much higher BbF, BkF, BaP, and IP EF values than TPPs due to the poor quality of coal waste and combustion conditions in FBB;
  • Water-soluble fractions have the lowest trace element concentrations, ranging from 9.35 mg/kg (CFB) to 22.45 mg/kg (TPPKb), whereas the highest carcinogenic trace element contents are in the residual fractions, varying from 39.52% (TPPNT) to 42.92% (CFB);
  • The CEFn/Mn and PIs for As and Hg imply higher enrichment and pollution levels, however their low RAC values indicate that they will not easily leach into the environment;
  • All TPP fly ashes have RI values that show a very high ecological risk, while CFB has a moderate ecological risk;
  • CFB has the highest BaPeq and BAPE values, suggesting a significant carcinogenic potential and thus high environmental risk;
  • The determined lead isotope fingerprint for investigated coals and FAs is within ranges of other countries and can be particularly useful in the source apportionment of lead pollution.
This paper provides comprehensive systematic research of the overall environmental impact of different combustion facilities from the emission and fly ash landfilling perspective. To reduce the environmental risk of ash disposal, it is important to monitor harmful trace elements, and persistent organic pollutants such as PAHs, as well as to enhance environmental pollution control in the Serbian energy sector.

Supplementary Materials

The following supporting information can be downloaded at https://www.mdpi.com/article/10.3390/toxics11040396/s1:, Figure S1: (a) Lead isotope ratios (206Pb/207Pb and 208Pb/207Pb vs. 208Pb/206Pb) for all investigated samples from Serbia (8 fly ashes and 4 coals); (b) Lead isotope ratios (206Pb/207Pb vs. 208Pb/206Pb) depending on originating country; Figure S2: (a) PAHs proportions by their ring number (R2-R6); (b) The total and carcinogenic PAHs content for fly ashes (TPPKb, TPPKs, TPPNT and CFB); Figure S3: The individual BaPeq ratios relative to BaP (%); Table S1. Locations of combustion facilities and lignite mining basins; Table S2: Limit values of NOx, CO, SO2 and total PM concentrations (mg/Nm3) in flue gases of combustion facilities with different capacities; Table S3: Flue gas emissions of trace elements (μg/m3); Table S4: Adjusted indices of element enrichment degree, environmental risk and ecological risk; Table S5: Comparative view of total heavy metal concentrations and their water leachates with literature data; Table S6: Pollution indices (PIs) of investigated trace elements for all FAs.

Author Contributions

Conceptualization, J.Z.B.M., A.D.M. and J.Z.S.; Investigation, J.Z.B.M., A.D.M., J.Z.S., M.D.E., Z.J.M. and M.R.M..; Methodology, J.Z.B.M., A.D.M. and J.Z.S.; Validation, J.Z.B.M., A.D.M. and J.Z.S.; Writtin—original draft, J.Z.B.M. and A.D.M.; Writting—review & editing, J.Z.S. and M.Đ.R.; Funding acquisition, M.R.M., M.D.E. and Z.J.M.; Project administration, M.R.M..; Resources, M.D.E. and Z.J.M.; Supervision, J.Z.S. and M.Đ.R. All authors have read and agreed to the published version of the manuscript.

Funding

This work was supported by the Ministry of Science, Technological Development and Innovation of the Republic of Serbia; grant number 451-03-47/2023-01/200017.

Institutional Review Board Statement

Not applicable.

Informed Consent Statement

Not applicable.

Data Availability Statement

The data presented in this study are available on request from the corresponding author.

Acknowledgments

Special thanks to Slavica Dramićanin and Jelena Erić for their support in laboratory experiments.

Conflicts of Interest

The authors declare no conflict of interest.

Abbreviations

BAbottom ash
BaPbenzo[a]pyrene
BaPEbenzo[a]pyrene-based equivalent carcinogenic power
BaPeqbenzo[a]pyrene-based toxic equivalent factor
BbFbenzo[b]fluoranthene
BkFbenzo[k]fluoranthene
Ccarcinogenic elements
CEFcrustal enrichment factor
CFBfly ash from cyclone of fluidized bed boiler
CFBBcoal waste from fluidized bed boiler
CKbcoal from TPP Kolubara A
CKscoal from TPP Kostolac B
CNTcoal from TPP Nikola Tesla A
EFemission factor
EMEPEuropean monitoring and evaluation programme
F1water-soluble fraction
F2exchangeable fraction
F3carbonate bound fraction
F4metal oxide bound fraction
F5organic bound fraction
F6residual fraction
FAfly ash
FBBfluidized bed boiler
ICP-MSinductively coupled plasma mass spectrometry
IPindeno[1,2,3-cd]pyrene
NCnon-carcinogenic elements
PAHspolycyclic aromatic hydrocarbons
PIpollution index
PMparticulate matter
RACrisk assessment code
RIrisk index
TPPthermal power plant
TPPKbfly ash from TPP Kolubara A
TPPKsfly ash from TPP Kostolac B
TPPNTfly ash from TPP Nikola Tesla A

References

  1. Moroń, W.; Rybak, W. NOx and SO2 emissions of coals, biomass and their blends under different oxy-fuel atmospheres. Atmos. Environ. 2015, 116, 65–71. [Google Scholar] [CrossRef]
  2. Fdez-Ortiz de Vallejuelo, S.; Gredilla, A.; da Boit, K.; Teixeira, E.C.; Sampaio, C.H.; Madariaga, J.M.; Silva, L.F.O. Nanominerals and potentially hazardous elements from coal cleaning rejects of abandoned mines: Environmental impact and risk assessment. Chemosphere 2017, 169, 725–733. [Google Scholar] [CrossRef] [PubMed]
  3. EPI. Available online: http://www.eps.rs/eng/Documents/Kompanijski%20Profil%202018%20-%20ENG.pdf (accessed on 12 March 2023).
  4. EPI. Available online: https://www.eps.rs/eng/Documents/technicalreports/TEH_Godisnjak2018_web_en.pdf (accessed on 10 March 2023).
  5. IEA. Available online: https://iea.blob.core.windows.net/assets/c40f0317-f8e6-4f00-b183-27a24c7b6a8f/Coal_Information_2019_Overview.pdf (accessed on 10 March 2023).
  6. Repić, B.S.; Paprika, M.J.; Mladenović, M.R.; Nemoda, S.Đ.; Erić, A.M.; Dakić, D.V. Waste fuel combustion testing in a fluidized bed boiler. In Proceedings of the International Conference “Power Plants 2018”, Zlatibor, Serbia, 5 November 2018; pp. 318–329. [Google Scholar]
  7. Singh, S.; Ram, L.C.; Masto, R.E.; Verma, S.K. A comparative evaluation of minerals and trace elements in the ashes from lignite, coal refuse, and biomass fired power plants. Int. J. Coal Geol. 2011, 87, 112–120. [Google Scholar] [CrossRef]
  8. European Monitoring and Evaluation Programme. Available online: http://www.emep.int/ (accessed on 12 March 2023).
  9. Directive 2001/80/EC; Limitation of Emissions of Certain Pollutants into the Air from Large Combustion Plants. European Parliament: London, UK, 2001.
  10. Otero-Rey, J.R.; López-Vilariño, J.M.; Moreda-Piñeiro, J.; Alonso-Rodríguez, E.; Muniategui-Lorenzo, S.; López-Mahía, P.; Prada-Rodríguez, D. As, Hg, and Se flue gas sampling in a coal-fired power plant and their fate during coal combustion. Environ. Sci. Technol. 2003, 37, 5262–5267. [Google Scholar] [CrossRef]
  11. Zhao, S.; Duan, Y.; Chen, L.; Li, Y.; Yao, T.; Liu, S.; Liu, M.; Lu, J. Study on emission of hazardous trace elements in a 350 MW coal-fired power plant. Part 2. arsenic, chromium, barium, manganese, lead. Environ. Pollut. 2017, 226, 404–411. [Google Scholar] [CrossRef]
  12. Wang, R.; Liu, G.; Sun, R.; Yousaf, B.; Wang, J.; Liu, R.; Zhang, H. Emission characteristics for gaseous- and size-segregated particulate PAHs in coal combustion flue gas from circulating fluidized bed (CFB) boiler. Environ. Pollut. 2018, 238, 581–589. [Google Scholar] [CrossRef]
  13. Geng, C.; Chen, J.; Yang, X.; Ren, L.; Yin, B.; Liu, X.; Bai, Z. Emission factors of polycyclic aromatic hydrocarbons from domestic coal combustion in China. J. Environ. Sci. 2014, 26, 160–166. [Google Scholar] [CrossRef]
  14. Jambhulkar, H.P.; Shaikh, S.M.S.; Kumar, S.M. Fly ash toxicity, emerging issues and possible implications for its exploitation in agriculture; Indian scenario: A review. Chemosphere 2018, 213, 333–344. [Google Scholar] [CrossRef]
  15. Jankowski, J.; Ward, C.R.; French, D.; Groves, S. Mobility of trace elements from selected Australian fly ashes and its potential impact on aquatic ecosystems. Fuel 2006, 85, 243–256. [Google Scholar] [CrossRef]
  16. Das, S.; Raj, R.; Mangwani, N.; Dash, H.R.; Chakraborty, J. Heavy metals and hydrocarbons: Adverse effects and mechanism of toxicity. In Microbial Biodegradation and Bioremediation; Das, S., Ed.; Elsevier: Oxford, UK, 2014; pp. 23–54. [Google Scholar]
  17. Shaheen, S.M.; Hooda, P.S.; Tsadilas, C.D. Opportunities and challenges in the use of coal fly ash for soil improvements—A review. J. Environ. Manag. 2014, 145, 249–267. [Google Scholar] [CrossRef]
  18. Nalbandian, H. Trace Element Emissions from Coal; IEA Clean Coal Center: London UK, 2012. [Google Scholar]
  19. Arditsoglou, A.; Petaloti, C.; Terzi, E.; Sofoniou, M.; Samara, C. Size distribution of trace elements and polycyclic aromatic hydrocarbons in fly ashes generated in Greek lignite-fired power plants. Sci. Total Environ. 2004, 323, 153–167. [Google Scholar] [CrossRef] [PubMed]
  20. Kong, S.; Shi, J.; Lu, B.; Qiu, W.; Zhang, B.; Peng, Y.; Zhang, B.; Bai, Z. Characterization of PAHs within PM10 fraction for ashes from coke production, iron smelt, heating station and power plant stacks in Liaoning Province, China. Atmos. Environ. 2011, 45, 3777–3785. [Google Scholar] [CrossRef]
  21. Pöykiö, R.; Mäkelä, M.; Watkins, G.; Nurmesniemi, H.; Dahl, O. Heavy metals leaching in bottom ash and fly ash fractions from industrial-scale BFB-boiler for environmental risks assessment. Trans. Nonferrous Met. Soc. China 2016, 26, 256–264. [Google Scholar] [CrossRef]
  22. Van Herck, P.; Vandecasteele, C. Evaluation of the use of a sequential extraction procedure for the characterization and treatment of metal containing solid waste. Waste Manag. 2001, 21, 685–694. [Google Scholar] [CrossRef]
  23. Dauvalter, V.; Kashulin, N. Assessment of the ecological state of the arctic freshwater system based on concentrations of heavy metals in the bottom sediments. Geochem. Int. 2018, 56, 842–856. [Google Scholar] [CrossRef]
  24. Pan, Y.; Wu, Z.; Zhou, J.; Zhao, J.; Ruan, X.; Liu, J.; Qian, G. Chemical characteristics and risk assessment of typical municipal solid waste incineration (MSWI) fly ash in China. J. Hazard. Mater. 2013, 261, 269–276. [Google Scholar] [CrossRef]
  25. Yue, Y.; Liu, Z.; Liu, Z.; Zhang, J.; Lu, M.; Zhou, J.; Qian, G. Rapid evaluation of leaching potential of heavy metals from municipal solid waste incineration fly ash. J. Environ. Manag. 2019, 238, 144–152. [Google Scholar] [CrossRef]
  26. U.S. EPA. Priority Pollutant List. Available online: https://www.epa.gov/sites/production/files/2015-09/documents/priority-pollutant-list-epa.pdf (accessed on 12 March 2023).
  27. Wang, D.; Ma, J.; Li, H.; Zhang, X. Concentration and potential ecological risk of PAHs in different layers of soil in the petroleum-contaminated areas of the Loess Plateau, China. Int. J. Environ. Res. Public Health 2018, 15, 1785. [Google Scholar] [CrossRef]
  28. Ruwei, W.; Jiamei, Z.; Jingjing, L.; Liu, G. Levels and patterns of polycyclic aromatic hydrocarbons in coal-fired power plant bottom ash and fly ash from Huainan, China. Arch. Environ. Contam. Toxicol. 2013, 65, 193–202. [Google Scholar] [CrossRef]
  29. Díaz-Somoano, M.; Suárez-Ruiz, I.; Alonso, J.I.G.; Ruiz Encinar, J.; López-Antón, M.A.; Martínez-Tarazona, M.R. Lead isotope ratios in Spanish coals of different characteristics and origin. Int. J. Coal Geol. 2007, 71, 28–36. [Google Scholar] [CrossRef]
  30. Cheng, H.; Hu, Y. Lead (Pb) isotopic fingerprinting and its applications in lead pollution studies in China: A review. Environ. Pollut. 2010, 158, 1134–1146. [Google Scholar] [CrossRef] [PubMed]
  31. Krachler, M.; Le Roux, G.; Kober, B.; Shotyk, W. Optimising accuracy and precision of lead isotope measurement (206Pb, 207Pb, 208Pb) in acid digests of peat with ICP-SMS using individual mass discrimination correction. J. Anal. At. Spectrom. 2004, 19, 354–361. [Google Scholar] [CrossRef]
  32. Diaz-Somoano, M.; Kylander, M.; Weiss, D.J.; Lopez-Anton, M.A.; Suarez-Ruiz, I.; Martinez-Tarazona, M.R.; Research, I.E.A.C. Lead isotope variability in different world wide coal deposits. In Proceedings of the International Conference on Coal Science and Technology, Nottingham, UK, 1 July 2007. [Google Scholar]
  33. Komárek, M.; Ettler, V.; Chrastný, V.; Mihaljevič, M. Lead isotopes in environmental sciences: A review. Environ. Int. 2008, 34, 562–577. [Google Scholar] [CrossRef]
  34. Buha-Marković, J.Z.; Marinković, A.D.; Nemoda, S.Đ.; Savić, J.Z. Distribution of PAHs in coal ashes from the thermal power plant and fluidized bed combustion system; estimation of environmental risk of ash disposal. Environ. Pollut. 2020, 266, 115282. [Google Scholar] [CrossRef] [PubMed]
  35. ISO SRPS EN 14792; Stationary Source Emissions—Determination of the Mass Concentration of Nitrogen Oxides—Standard Reference Method: Chemiluminescence. ISO: Geneva, Switzerland, 2017.
  36. SRPS ISO 7935; Stationary Source Emissions—Determination of the Mass Concentration of Sulfur Dioxide—Performance Characteristics of Automated Measuring Methods. ISO: Geneva, Switzerland, 2010.
  37. SRPS EN 15058; Stationary Source Emissions—Determination of the Mass Concentration of Carbon Monoxide—Standard Reference Method: Non-Dispersive Infrared Spectrometry. ISO: Geneva, Switzerland, 2017.
  38. SRPS ISO 9096; Stationary Source Emissions—Manual Determination of Mass Concentration of Particulate Matter. ISO: Geneva, Switzerland, 2019.
  39. EN 14789; Stationary Source Emissions—Determination of Volume Concentration of Oxygen. Standard Reference Method: Paramagnetism. European Standard: Brussels, Belgium, 2017.
  40. SRPS ISO 12039; Stationary Source Emissions—Determination of the Mass Concentration of Carbon Monoxide, Carbon Dioxide and Oxygen in Flue Gas—Performance Characteristics of Automated Measuring Systems. ISO: Geneva, Switzerland, 2021.
  41. Masto, R.E.; Sarkar, E.; George, J.; Jyoti, K.; Dutta, P.; Ram, L.C. PAHs and potentially toxic elements in the fly ash and bed ash of biomass fired power plants. Fuel Process. Technol. 2015, 132, 139–152. [Google Scholar] [CrossRef]
  42. Reddy, M.S.; Basha, S.; Joshi, H.V.; Jha, B. Evaluation of the emission characteristics of trace metals from coal and fuel oil fired power plants and their fate during combustion. J. Hazard. Mater. 2005, 123, 242–249. [Google Scholar] [CrossRef]
  43. Han, D.; Wu, Q.; Wang, S.; Xu, L.; Duan, L.; Wen, M.; Li, G.; Li, Z.; Tang, Y.; Liu, K. Distribution and emissions of trace elements in coal-fired power plants after ultra-low emission retrofitting. Sci. Total Environ. 2021, 754, 142285. [Google Scholar] [CrossRef]
  44. Chen, G.; Sun, Y.; Wang, Q.; Yan, B.; Cheng, Z.; Ma, W. Partitioning of trace elements in coal combustion products: A comparative study of different applications in China. Fuel 2019, 240, 31–39. [Google Scholar] [CrossRef]
  45. EMEP. Emission Inventory Guidebook, An Approach to Estimation of PAH Emissions. Available online: https://www.eea.europa.eu/publications/EMEPCORINAIR5/BPAH.pdf (accessed on 10 March 2023).
  46. Zhou, Y.; Ning, X.-a.; Liao, X.; Lin, M.; Liu, J.; Wang, J. Characterization and environmental risk assessment of heavy metals found in fly ashes from waste filter bags obtained from a Chinese steel plant. Ecotoxicol. Environ. Saf. 2013, 95, 130–136. [Google Scholar] [CrossRef]
  47. Kowalska, J.B.; Mazurek, R.; Gąsiorek, M.; Zaleski, T. Pollution indices as useful tools for the comprehensive evaluation of the degree of soil contamination-A review. Environ. Geochem. Health 2018, 40, 2395–2420. [Google Scholar] [CrossRef]
  48. U.S. EPA. Provisional Guidance for Quantitative Risk Assessment of Polycyclic Aromatic Hydrocarbons (PAH); EPA/600/R-93/089; US EPA: Washington DC, USA, 1993. [Google Scholar]
  49. Government of the Republic of Serbia. Regulation on Emission Limit Values for Gaseous Pollutans from the Combustion Plants; 110-13947/2015-1; Government of the Republic of Serbia: Belgrade, Serbia, 2016. [Google Scholar]
  50. Wang, R.; Liu, G.; Zhang, J. Variations of emission characterization of PAHs emitted from different utility boilers of coal-fired power plants and risk assessment related to atmospheric PAHs. Sci. Total Environ. 2015, 538, 180–190. [Google Scholar] [CrossRef]
  51. Mastral, A.M.; Callén, M.S.; Garcia, T. Toxic organic emissions from coal combustion. Fuel Process. Technol. 2000, 67, 1–10. [Google Scholar] [CrossRef]
  52. Nielsen, O.-K.; Plejdrup, M.S.; Dore, C.; Nielsen, M.; Kubica, K.; Paradiz, B.; Dilara, P.; Klimont, Z.; Kakareka, S.; Debsk, B.; et al. EMEP/EEA Air Pollutant Emission Inventory Guidebook 2019, 1.A.4 Small Combustion; EEA: Copenhagen, Denmark, 2019. [Google Scholar]
  53. Nielsen, O.-K.; Plejdrup, M.; Rentz, O.; Oertel, D.; Woodfield, M.; Stewart, R. EMEP/EEA Air Polluutant Emission Inventory Guidebool 2019, 1.A.4 Small Combustion; EEA: Copenhagen, Denmark, 2019. [Google Scholar]
  54. Izquierdo, M.; Querol, X. Leaching behaviour of elements from coal combustion fly ash: An overview. Int. J. Coal Geol. 2012, 94, 54–66. [Google Scholar] [CrossRef]
  55. Haghighi, H.K.; Irannajad, M.; Fortuny, A.; Sastre, A.M. Recovery of germanium from leach solutions of fly ash using solvent extraction with various extractants. Hydrometallurgy 2018, 175, 164–169. [Google Scholar] [CrossRef]
  56. Komonweeraket, K.; Cetin, B.; Benson, C.H.; Aydilek, A.H.; Edil, T.B. Leaching characteristics of toxic constituents from coal fly ash mixed soils under the influence of pH. Waste Manag. 2015, 38, 174–184. [Google Scholar] [CrossRef]
  57. Nurmesniemi, H.; Poykio, R.; Kuokkanen, T.; Ramo, J. Chemical sequential extraction of heavy metals and sulphur in bottom ash and in fly ash from a pulp and paper mill complex. Waste Manag. Res. 2008, 26, 389–399. [Google Scholar] [CrossRef]
  58. Brubaker, T.M.; Stewart, B.W.; Capo, R.C.; Schroeder, K.T.; Chapman, E.C.; Spivak-Birndorf, L.J.; Vesper, D.J.; Cardone, C.R.; Rohar, P.C. Coal fly ash interaction with environmental fluids: Geochemical and strontium isotope results from combined column and batch leaching experiments. Appl. Geochem. 2013, 32, 184–194. [Google Scholar] [CrossRef]
  59. Wang, H.; Fan, X.; Wang, Y.-n.; Li, W.; Sun, Y.; Zhan, M.; Wu, G. Comparative leaching of six toxic metals from raw and chemically stabilized MSWI fly ash using citric acid. J. Environ. Manag. 2018, 208, 15–23. [Google Scholar] [CrossRef]
  60. U.S. EPA. National Emission Standards for Hazardous Air Pollutants: Coal- and Oil-Fired Electric Utility Steam Generating Units; Subcategory of Certain Existing Electric Utility Steam Generating Units Firing Eastern Bituminous Coal Refuse for Emissions of Acid Gas Hazardous Air Pollutants; US EPA: Durham, NC, USA, 2020. [Google Scholar]
  61. Ministry of Environmental Protection of China (MEPC). Emission Standard of Air Pollutants for Coal-Fired Power Plants; Ministry of Environmental Protection of China (MEPC): Beijing, China, 2011. [Google Scholar]
  62. Zhu, H.-N.; Yuan, X.-Z.; Zeng, G.-M.; Jiang, M.; Liang, J.; Zhang, C.; Yin, J.; Huang, H.-J.; Liu, Z.-F.; Jiang, H.-W. Ecological risk assessment of heavy metals in sediments of Xiawan Port based on modified potential ecological risk index. Trans. Nonferrous Met. Soc. China 2012, 22, 1470–1477. [Google Scholar] [CrossRef]
  63. Yang, D.; Zhu, H.; Liu, J.; Zhang, Y.; Wu, S.; Xiong, J.; Wang, F. Risk Assessment of Heavy Metals in Soils from Four Different Industrial Plants in a Medium-Sized City in North China. Toxics 2023, 11, 217. [Google Scholar] [CrossRef]
  64. CCME. Canadian Soil Quality Guidelines for the Protection of Environmental and Human Health: Summary Tables; Canadian Council of Ministers of the Environment: Winnipeg, MB, Canada, 2007. [Google Scholar]
  65. Dahl, O.; Nurmesniemi, H.; Pöykiö, R.; Watkins, G. Heavy metal concentrations in bottom ash and fly ash fractions from a large-sized (246MW) fluidized bed boiler with respect to their Finnish forest fertilizer limit values. Fuel Process. Technol. 2010, 91, 1634–1639. [Google Scholar] [CrossRef]
  66. ECD. Council decision of 19 December 2002 establishing criteria and procedures for the acceptance of waste at landfills pursuant to Article 16 of and Annex II to Directive 1999/31/EC. Off. J. Eur. Communities 2002, 16, 27–49. [Google Scholar]
  67. Turhan, Ş. Evaluation of agricultural soil radiotoxic element pollution around a lignite-burning thermal power plant. Radiochim. Acta 2020, 108, 77–85. [Google Scholar] [CrossRef]
  68. Usmani, Z.; Kumar, V. Characterization, partitioning, and potential ecological risk quantification of trace elements in coal fly ash. Environ. Sci. Pollut. Res. 2017, 24, 15547–15566. [Google Scholar] [CrossRef] [PubMed]
  69. Hakanson, L. An ecological risk index for aquatic pollution control. A sedimentological approach. Water Res. 1980, 14, 975–1001. [Google Scholar] [CrossRef]
  70. Ribeiro, J.; Silva, T.F.; Filho, J.G.M.; Flores, D. Fly ash from coal combustion—An environmental source of organic compounds. Appl. Geochem. 2014, 44, 103–110. [Google Scholar] [CrossRef]
  71. Liu, S.; Wang, Y.; Zhang, Z.; Li, Z.; Chen, C.; Guo, T.; Mei, Y.; Dong, J. Distribution of PAHs and trace elements in coal fly ash collected from a 5-stage electrostatic precipitator. J. Electrost. 2018, 96, 144–150. [Google Scholar] [CrossRef]
  72. Jakovljević, I.; Smoljo, I.; Sever Štrukil, Z.; Pehnec, G. Carcinogenic Activity and Risk Assessment of PAHs in Ambient Air: PM10 Particle Fraction and Bulk Deposition. Toxics 2023, 11, 228. [Google Scholar] [CrossRef]
  73. Li, Y.; Liao, Y.; He, Y.; Xia, K.; Qiao, S.; Zhang, Q. Polycyclic aromatic hydrocarbons concentration in straw biochar with different particle size. Procedia Environ. Sci. 2016, 31, 91–97. [Google Scholar] [CrossRef]
Figure 1. NOx, CO, SO2, and total PM concentrations (all in mg/Nm3) in flue gases from TPP Kolubara A, TPP Kostolac B, TPP Nikola Tesla A, and FBB.
Toxics 11 00396 g001
Figure 2. Overall trace element concentrations in F1-F6 fractions of fly ashes (TPPKb, TPPKs, TPPNT, and CFB).
Toxics 11 00396 g002
Figure 3. Distribution of investigated trace elements in fly ashes: TPPKb (a), TPPKs (b), TPPNT (c), and CFB (d) among the water-soluble fraction (F1), the exchangeable fraction (F2), the carbonate bound fraction (F3), the metal oxide bound fraction (F4), the organic bound fraction (F5), and the residual fraction (F6).
Toxics 11 00396 g003
Figure 4. (a) Portions for carcinogenic (C) and non-carcinogenic elements (NC) and average values in each fraction for all fly ashes (TPPKb, TPPKs, TPPNT, and CFB); (b) overall distribution of C and NC elements among six fractions.
Toxics 11 00396 g004
Figure 5. (a) Three-dimensional diagram of Pb isotope ratios in fly ashes (TPPKb, TPPKs, TPPNT, and CFB) and correspondent coals (CKb, CKs, CNT, and CFBB); (b) range for 206Pb/207Pb in different countries worldwide from west to east, i.e., USA: United States of America; S: Spain; UK: United Kingdom; B: Belgium; Sw: Switzerland; G: Germany; P: Poland; Se: Serbia; R: Russia; and Ch: China.
Toxics 11 00396 g005
Figure 6. Crustal enrichment factor (CEFn/Mn) for fly ashes (TPPKb, TPPKs, TPPNT, and CFB).
Toxics 11 00396 g006
Figure 7. (a) Risk assessment code (RAC) and (b) risk index (RI) for fly ashes (TPPKb, TPPKs, TPPNT, and CFB).
Toxics 11 00396 g007
Table 1. Flue gas flows for TPPs and FBB under working conditions (fW), under standard conditions and dry flue gas (fst), and under standard conditions for dried flue gas and oxygen content of 6% (fR).
TPPKolubara AKostolac BNikola Tesla AFBB
fW (m3/h)509,642.33,260,671.32,429,662.3820
fst (Nm3/h)254,751.31,596,911.01,201,327.3434
fR (Nm3/h)187,123.31,535,411.3850,350.0315
Table 2. Comparison of EF values for NOx, CO, SO2, and PM (A), EF values for As, Cd, Cr, Cu, Hg, Ni, and Pb (B) and EF values for BaP, BbF, BkF, and IP (C) determined for the combustion of lignite and coal waste with literature data.
ABC
Details about boiler EFs (g/GJ)EFs (mg/GJ)EFs (mg/GJ)
PollutantNOxCOSOxPM *AsCdCrCuHgPbNiBbFBkFBaPIP
Small non-
residential sources 50 kW–1 MW; coal fuels [52]
Value16020009001905315307200201305010040
lower150200450760.51185802178136
upper2003000100024085205093003018010015080
Fluidized bed boiler; 500 kW; coal waste (this paper)9.8370374.6841.731.8/40.556.77.472.233.4306.433.4210.779.8
Details about boiler EFs (g/GJ)EFs (mg/GJ)EFs (mg/GJ)
PollutantNOxCOSOxPM *AsCdCrCuHgPbNiBbFBkFBaPIP
Medium size
non-residential sources; 1–50 MW; coal fuels [52]
Value18020090076411510910010179136
lower150150450600.50.5185802108105
upper20030001000240532030102002018010015080
Thermal power plant Kolubara A; 32 MW; lignite (this paper)597.266.72675.01225.611.70.419.27.912.712.927.70.40.10.10.1
Details about boiler EFs (g/GJ)EFs (mg/GJ)EFs (µg/GJ)
PollutantNOxCOSOxPM *AsCdCrCuHgPbNiBbFBkFBaPIP
Public power combustion plants
(≥300 MW or 50–300 MW); brown coal/lignite [53]
Value2478.716807.914.31.89.11.02.9159.737291.32.1
lower1436.7330110.31.36.60.22.110.67.13.72.90.30.4
upper57160.550007924.1315.354.924.716.53702906.510.5
Thermal power plant Kostolac B; 350 MW; lignite (this paper)233.3305.67436.1105.612.60.818.820.710.617.832.922.568.415.14.1
Thermal power plant Nikola Tesla A; 210 MW; lignite (this paper)66.7533.32311.1300.08.50.218.27.512.613.419.38.07.617.51.0
* PM stands for PM10 [52,53] or for total PM (this paper).
Table 3. PAHs content in fly ashes (TPPKb, TPPKs, TPPNT, and CFB).
PAHAbbreviationFly Ashes (ng/g)
TPPKbTPPKsTPPNTCFB
NaphthaleneNap23.5410.887.3321.80
1-methyl naphthalene1mNap55.563.906.60274.10
2-methyl naphthalene2mNap10.780.001.14555.77
AcenaphthyleneAcy2.7749.3638.05745.23
AcenaphtheneAce6.568.293.25104.70
FluoreneFlu150.06144.7692.011576.70
PhenanthrenePhe385.87129.2644.904993.90
AnthraceneAnt17.201.872.141159.98
FluorantheneFla795.8955.3150.249509.68
PyrenePyr410.3513.0114.176999.46
Benz[a]anthraceneBaA84.3720.3915.323838.38
ChryseneChry77.258.894.092445.81
Benzo[b]fluorantheneBbF25.052.501.39491.95
Benzo[k]fluorantheneBkF4.327.611.3353.56
Benzo[a]pyreneBaP5.591.683.05338.25
Dibenz[a,h]anthraceneDahA0.040.020.0025.29
Benzo[g,h,i]peryleneBghiP10.663.541.49115.92
Indeno[1,2,3-cd]pyreneIP4.510.460.17128.05
Total PAHs2070.38461.72286.6933,378.53
Sum of 10 PAHs *1434.26242.38131.4623,097.28
Total BaPeq20.355.365.21876.73
Total BAPE13.103.664.17632.15
* The sum of ten hazardous PAHs (Ant, BaA, BbF, BkF, BaP, Chry, Phe, Fla, IP, and BghiP) that have soil guideline limits in Serbia.
Disclaimer/Publisher’s Note: The statements, opinions and data contained in all publications are solely those of the individual author(s) and contributor(s) and not of MDPI and/or the editor(s). MDPI and/or the editor(s) disclaim responsibility for any injury to people or property resulting from any ideas, methods, instructions or products referred to in the content.

