
Complex Mixtures: Array PBPK Modeling of Jet Fuel Components

Abstract
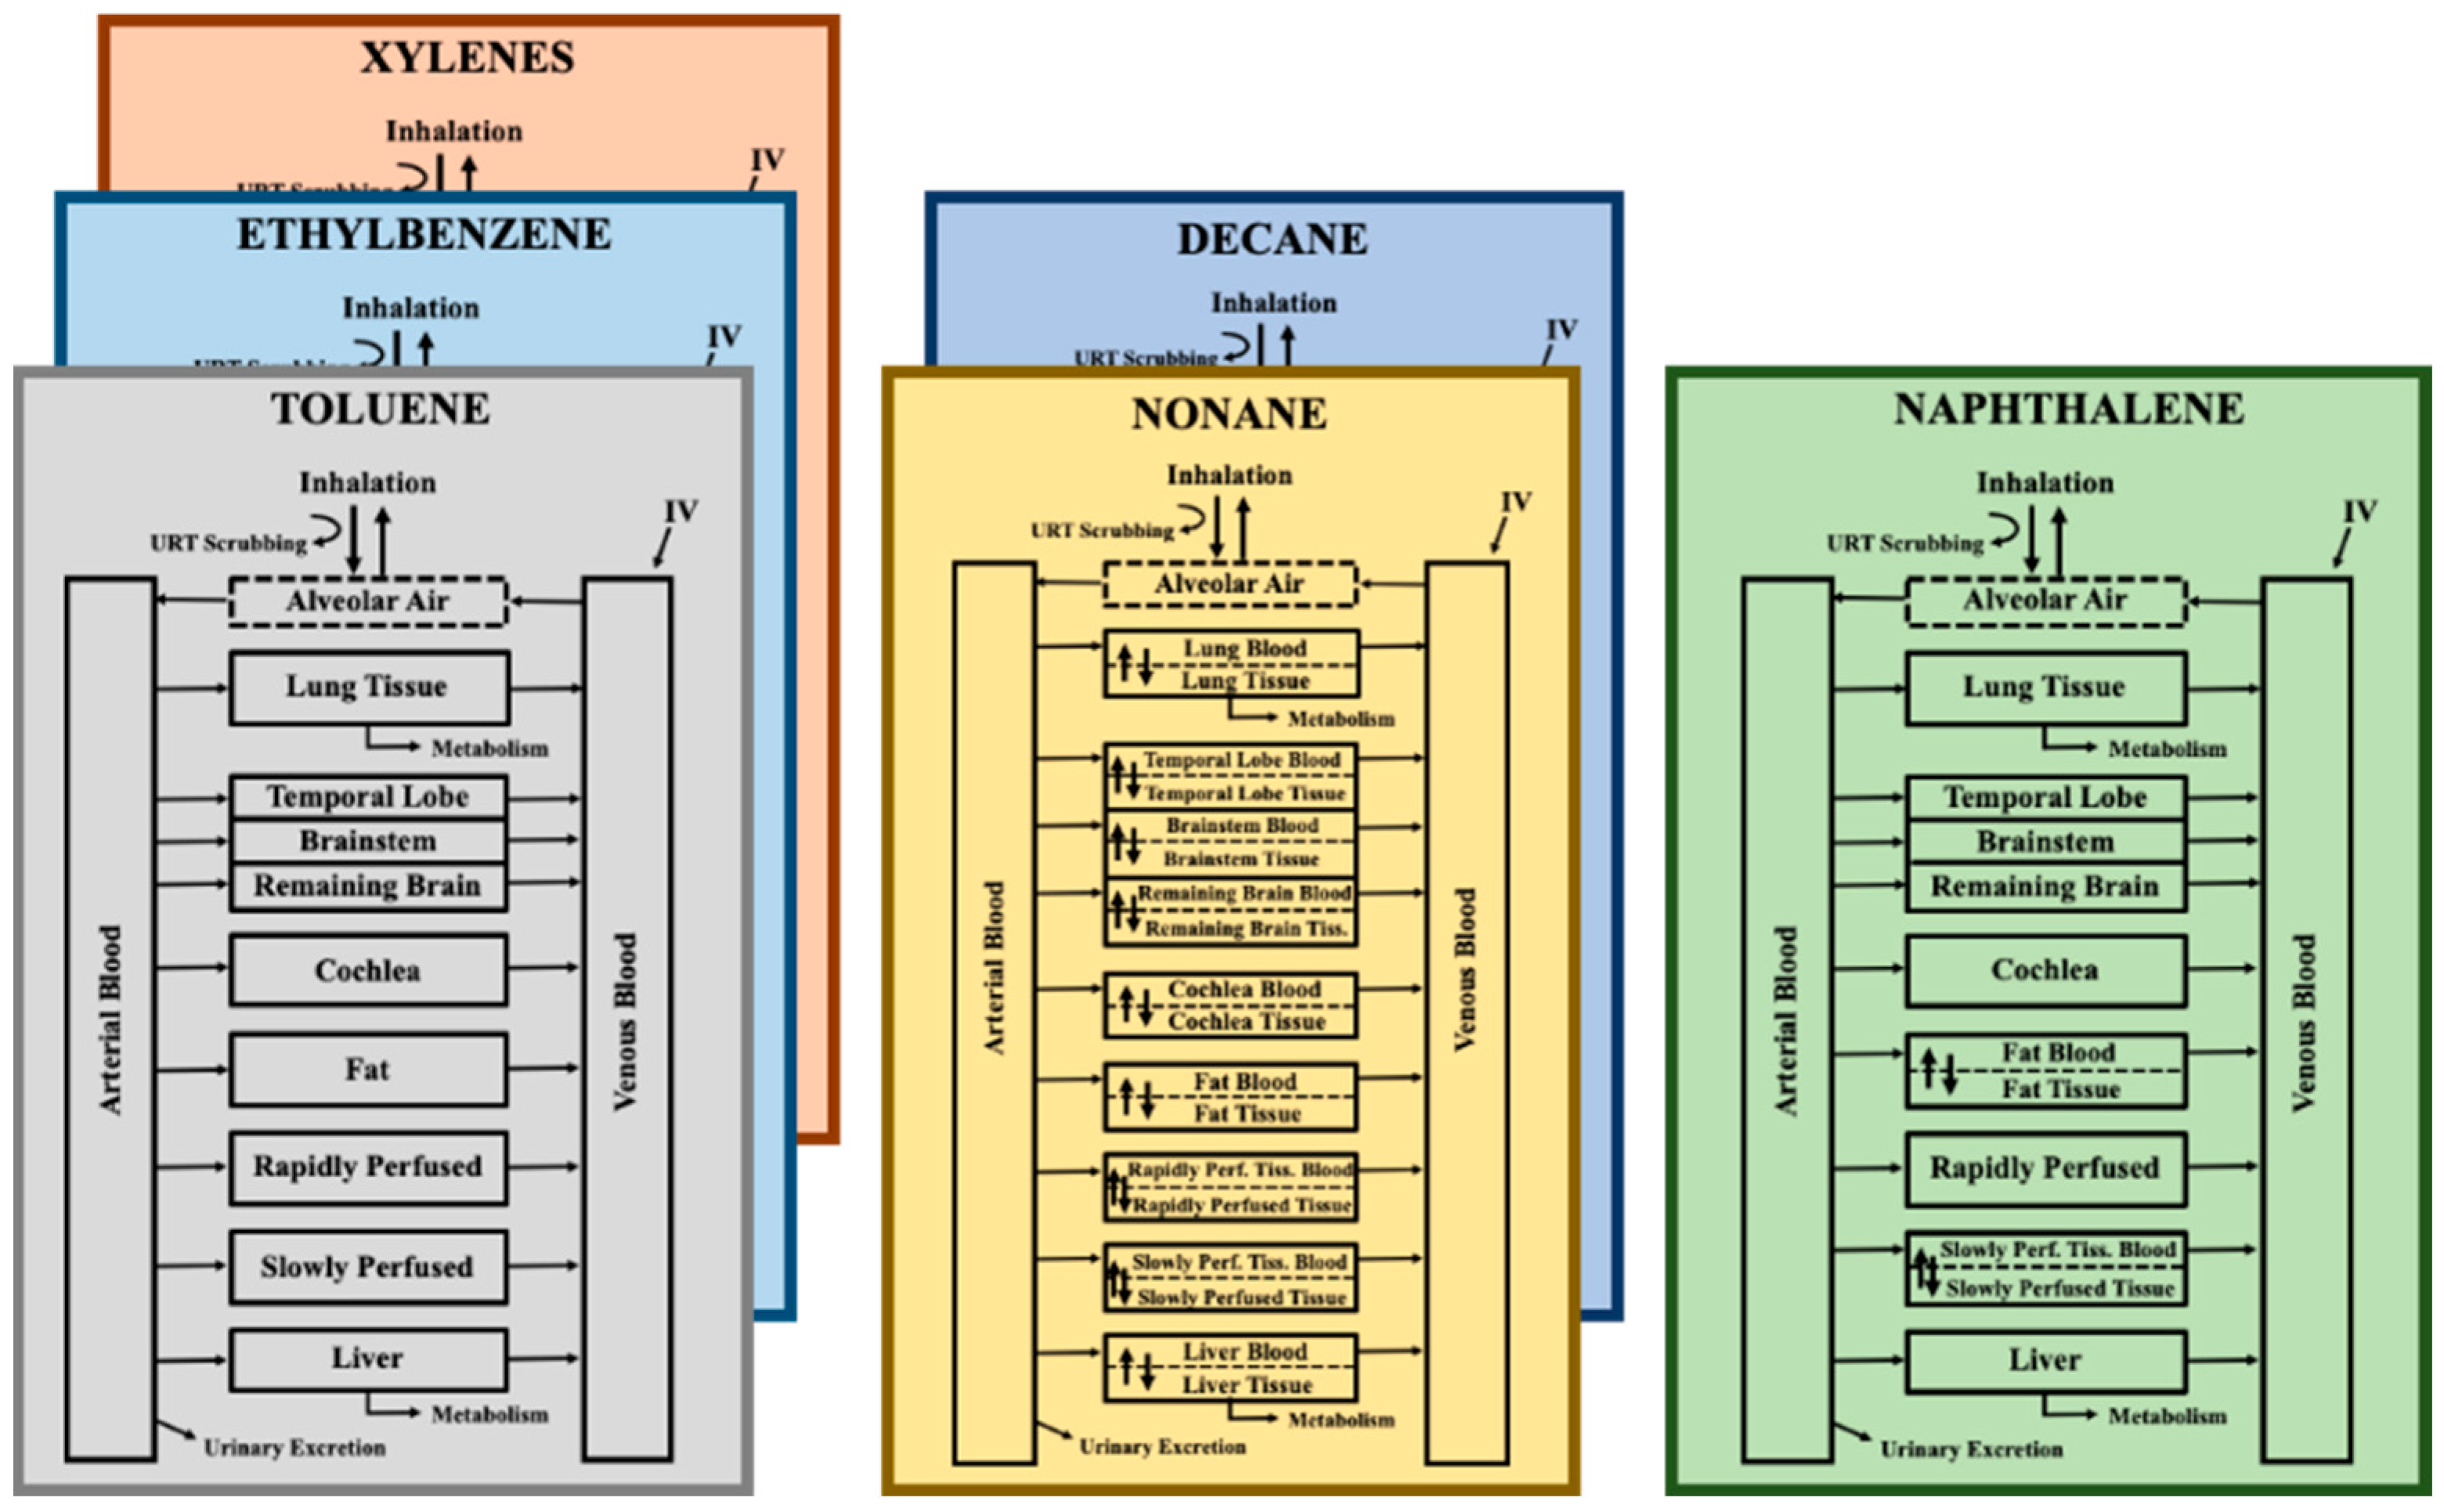
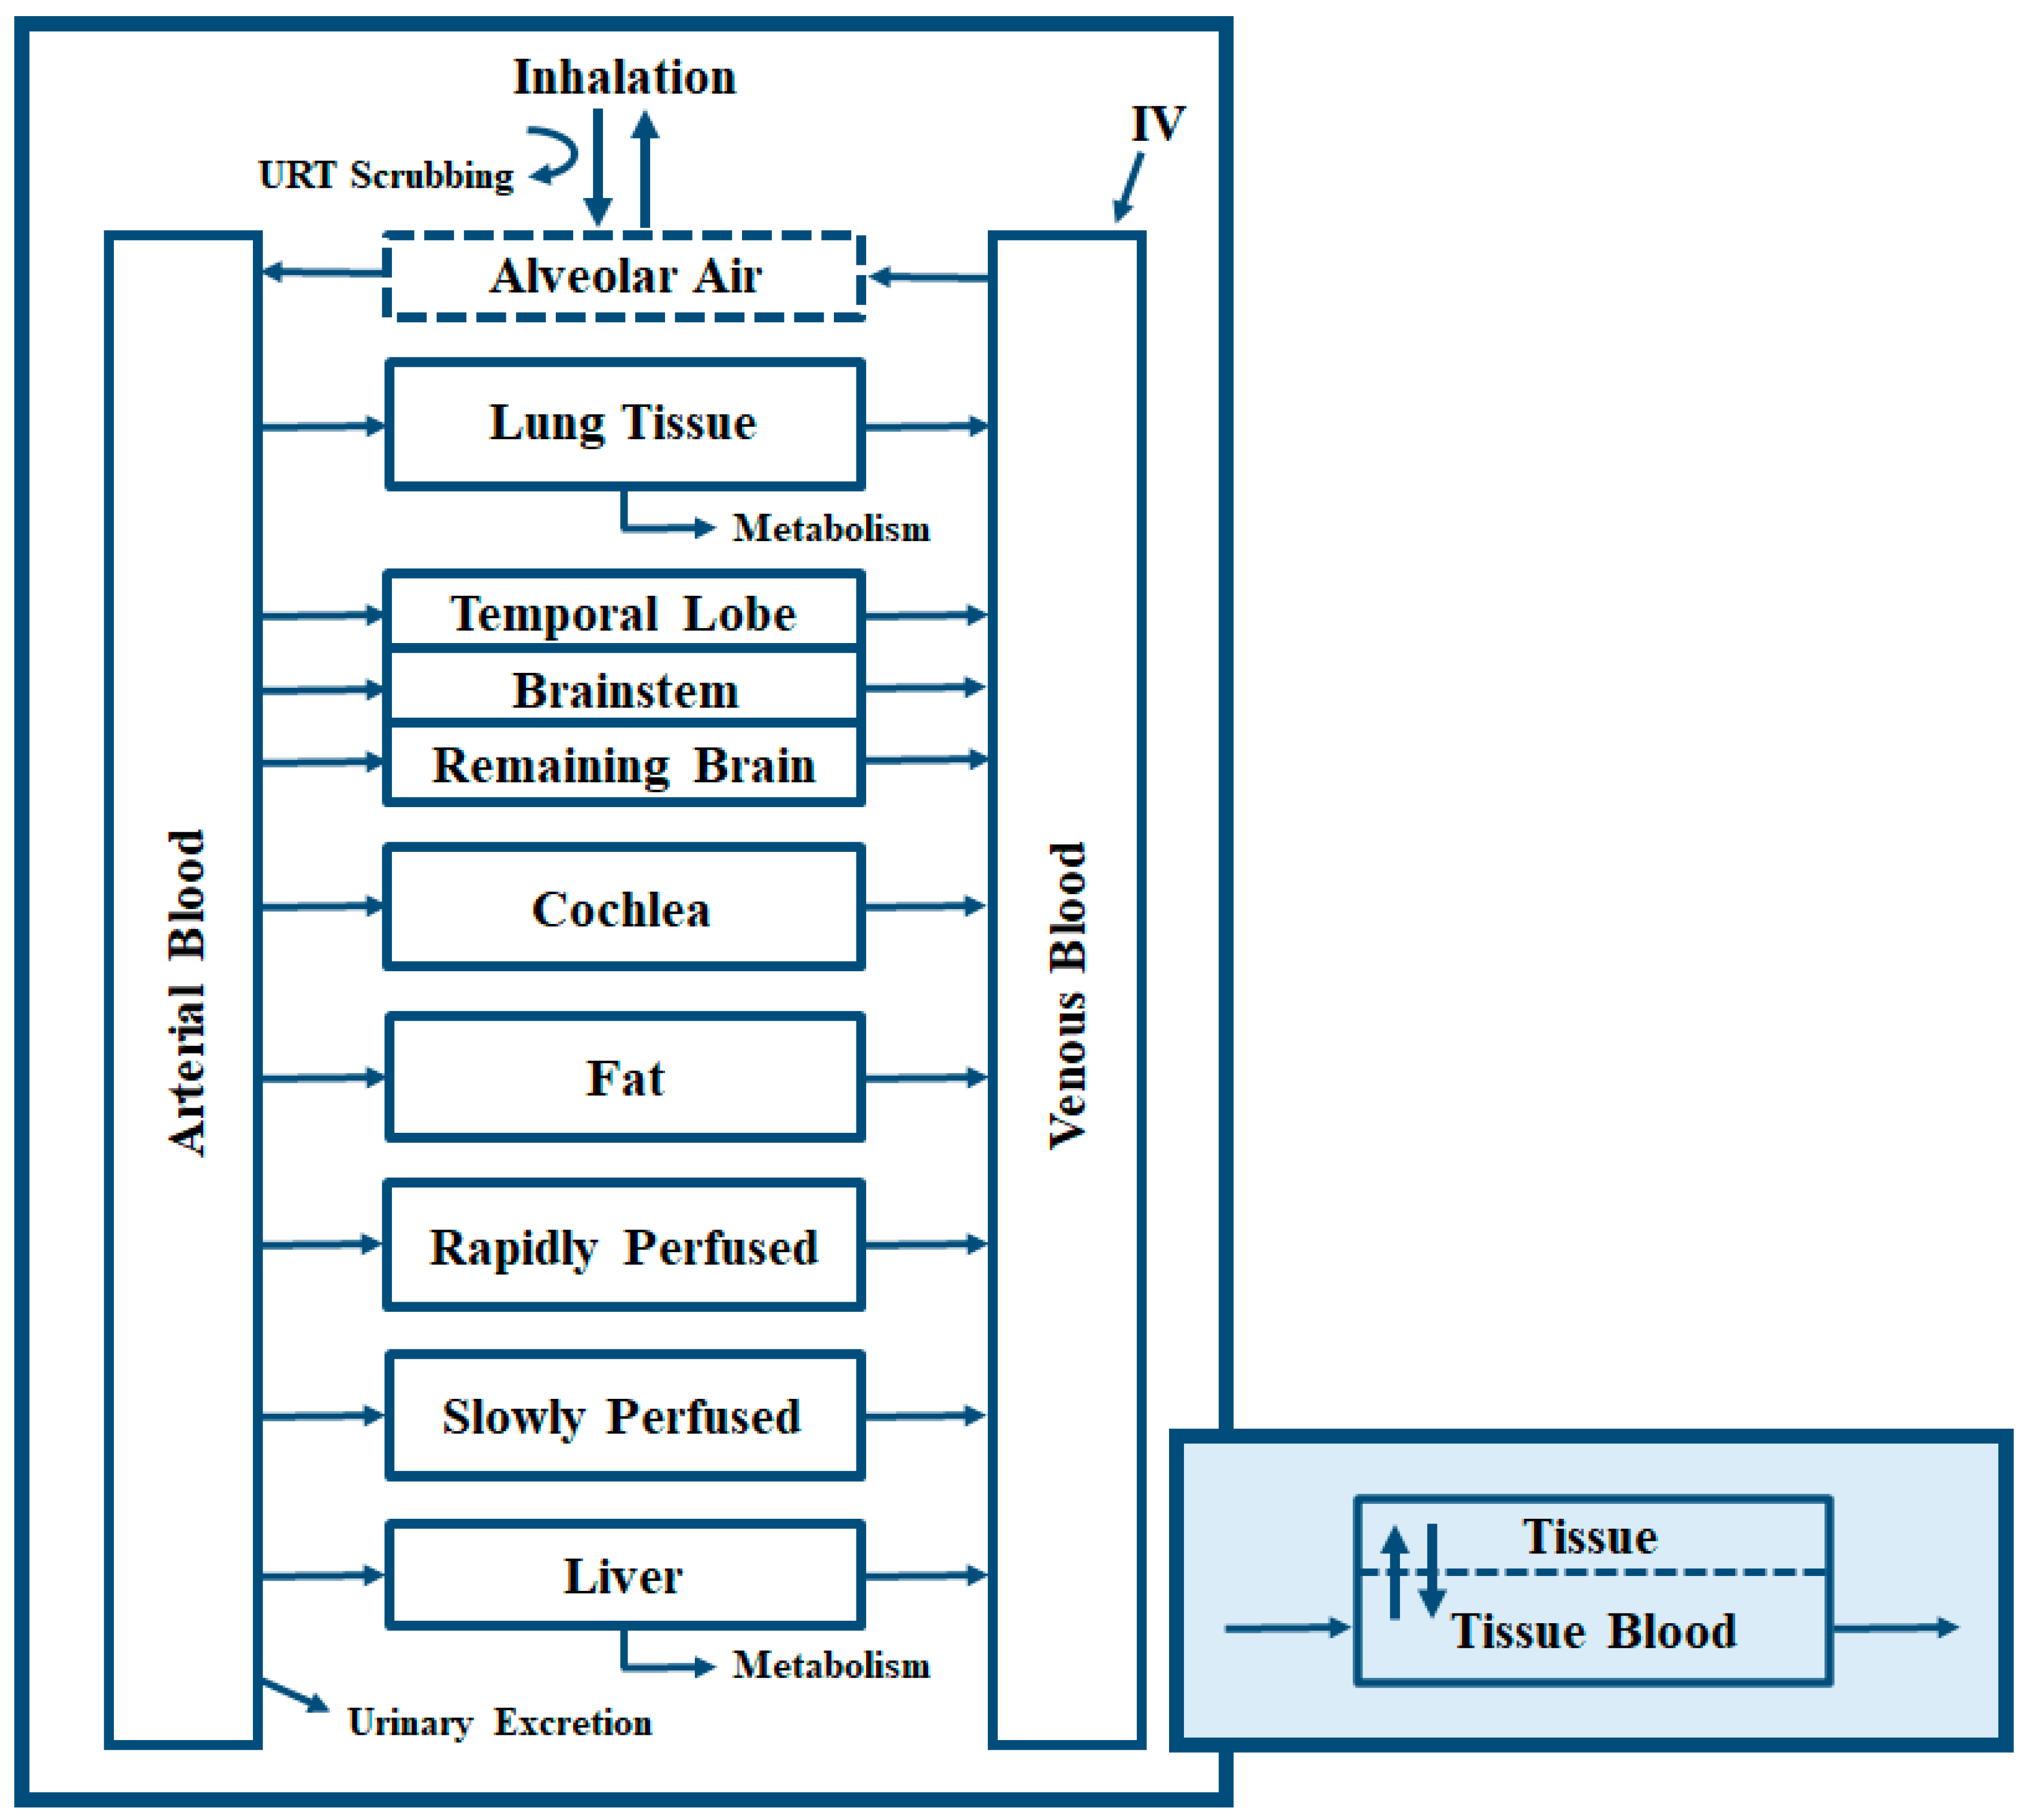
:1. Introduction
2. Materials and Methods
3. Results
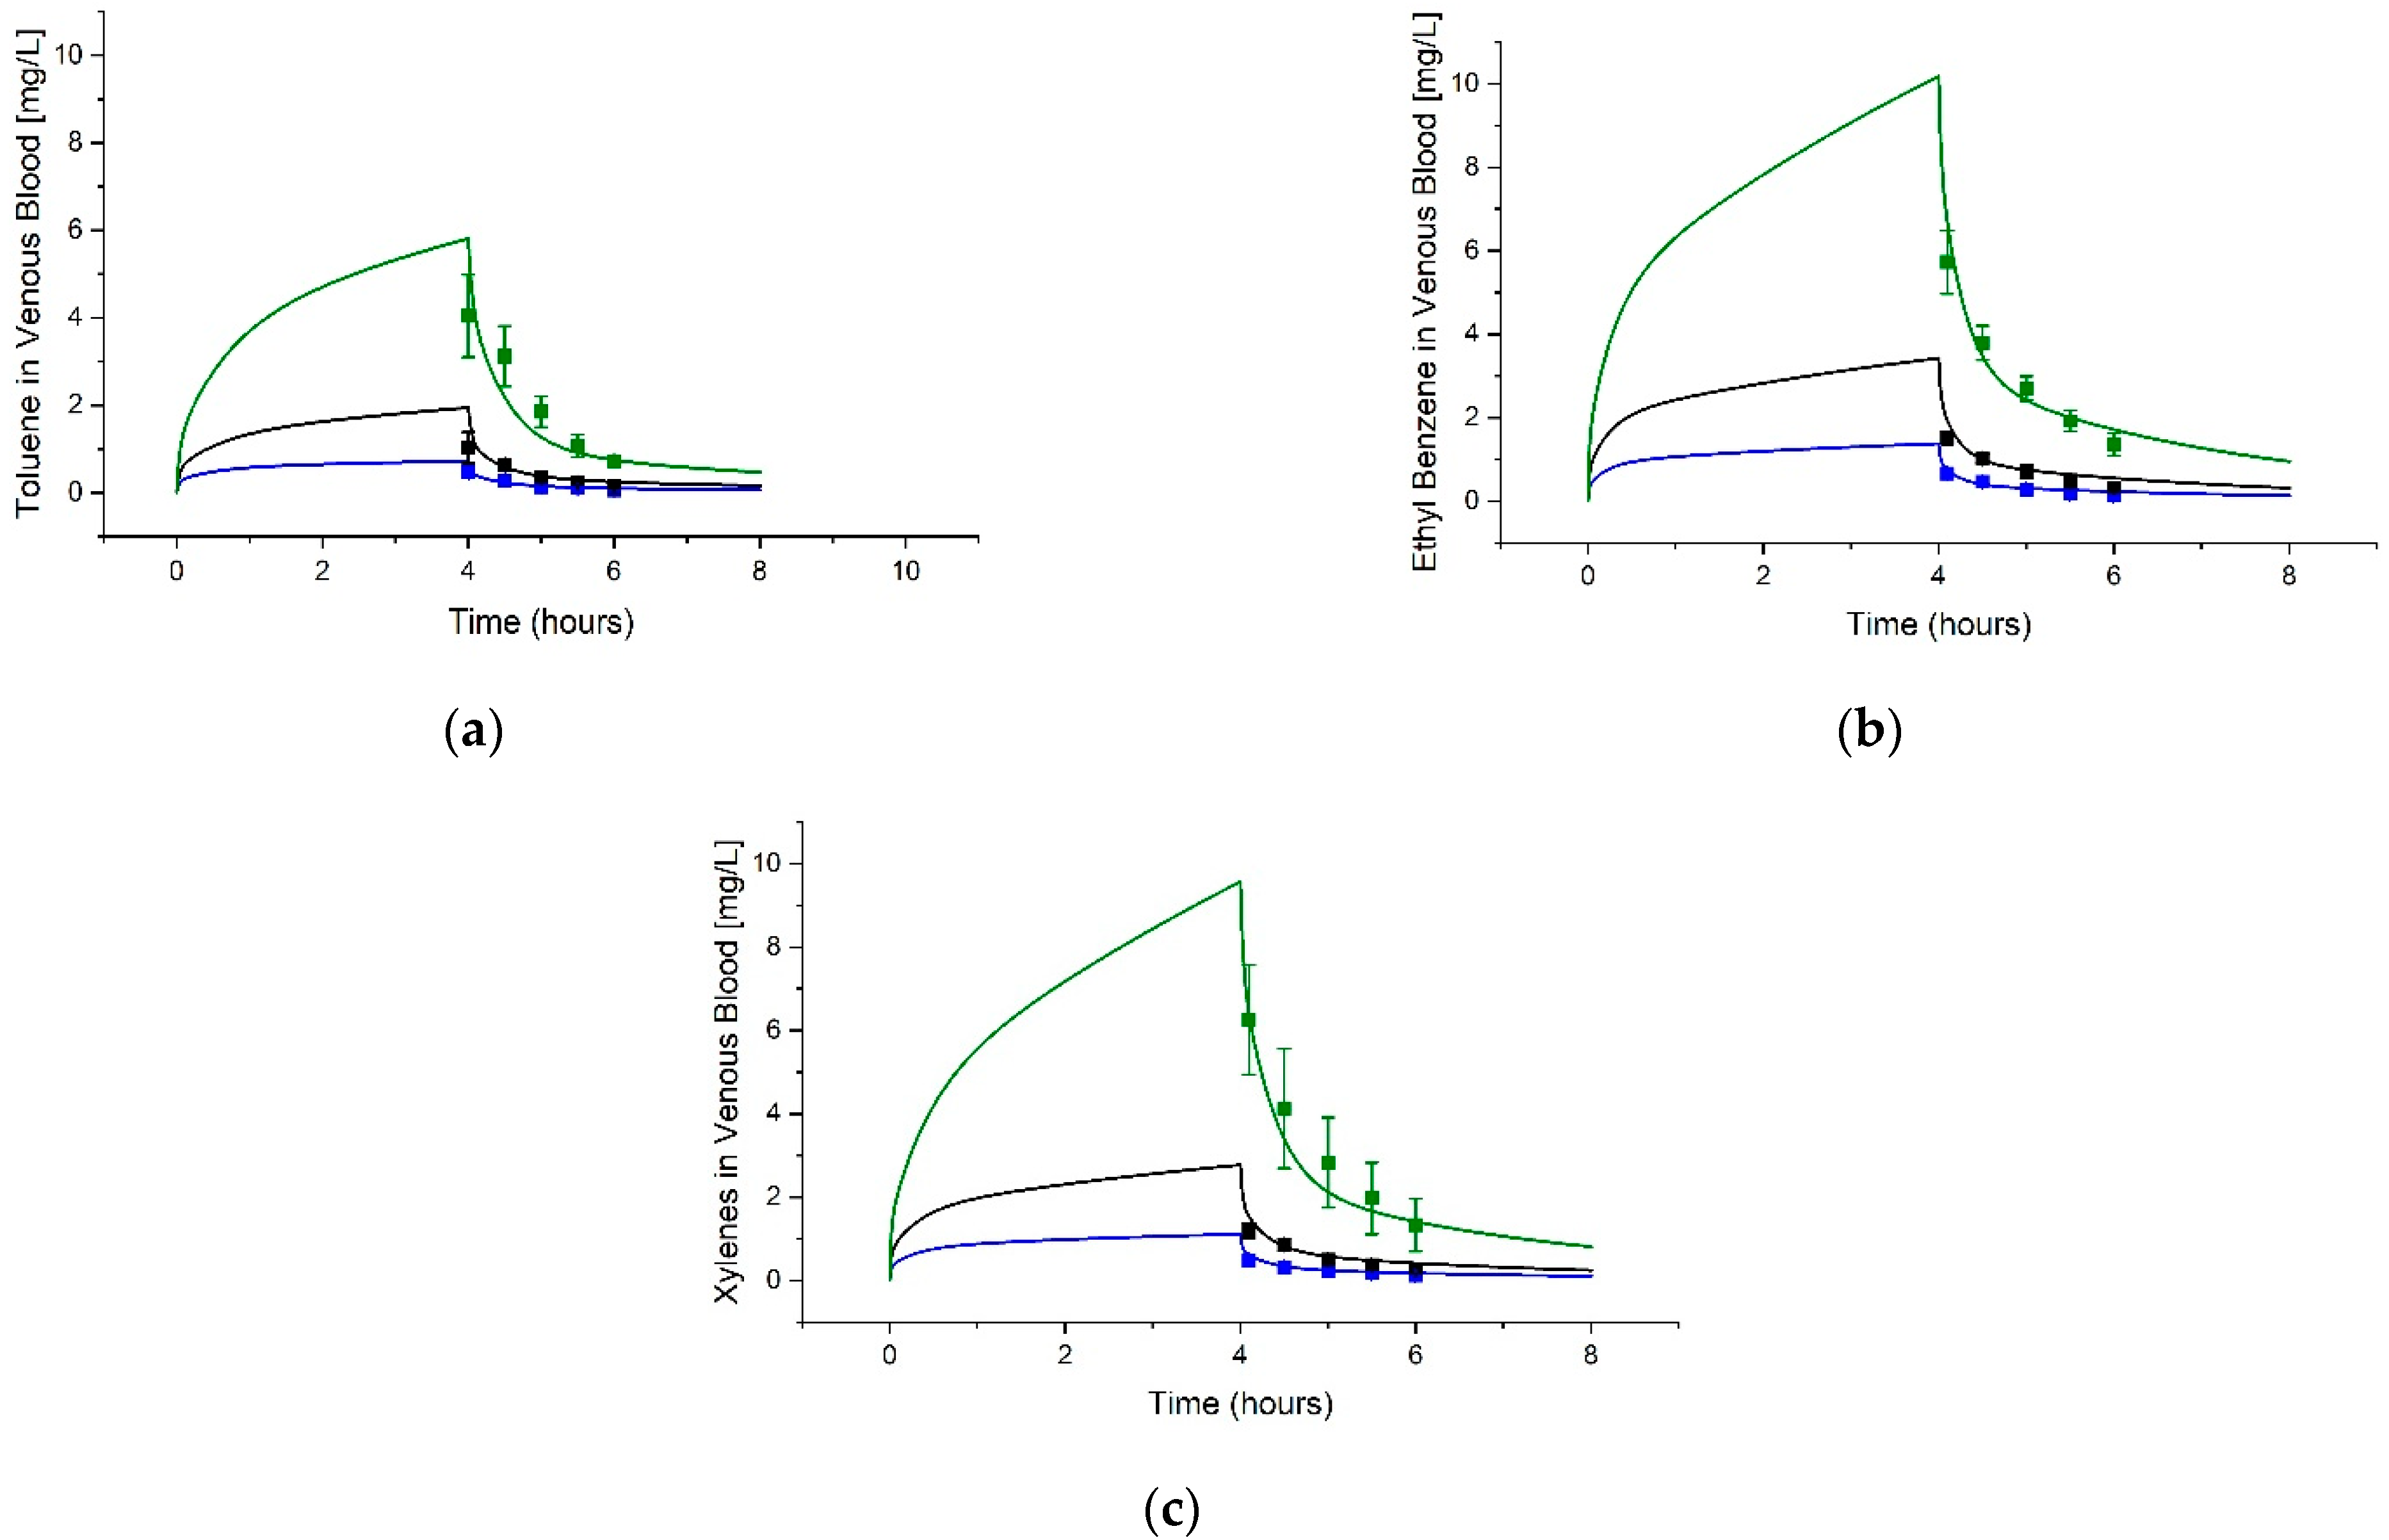
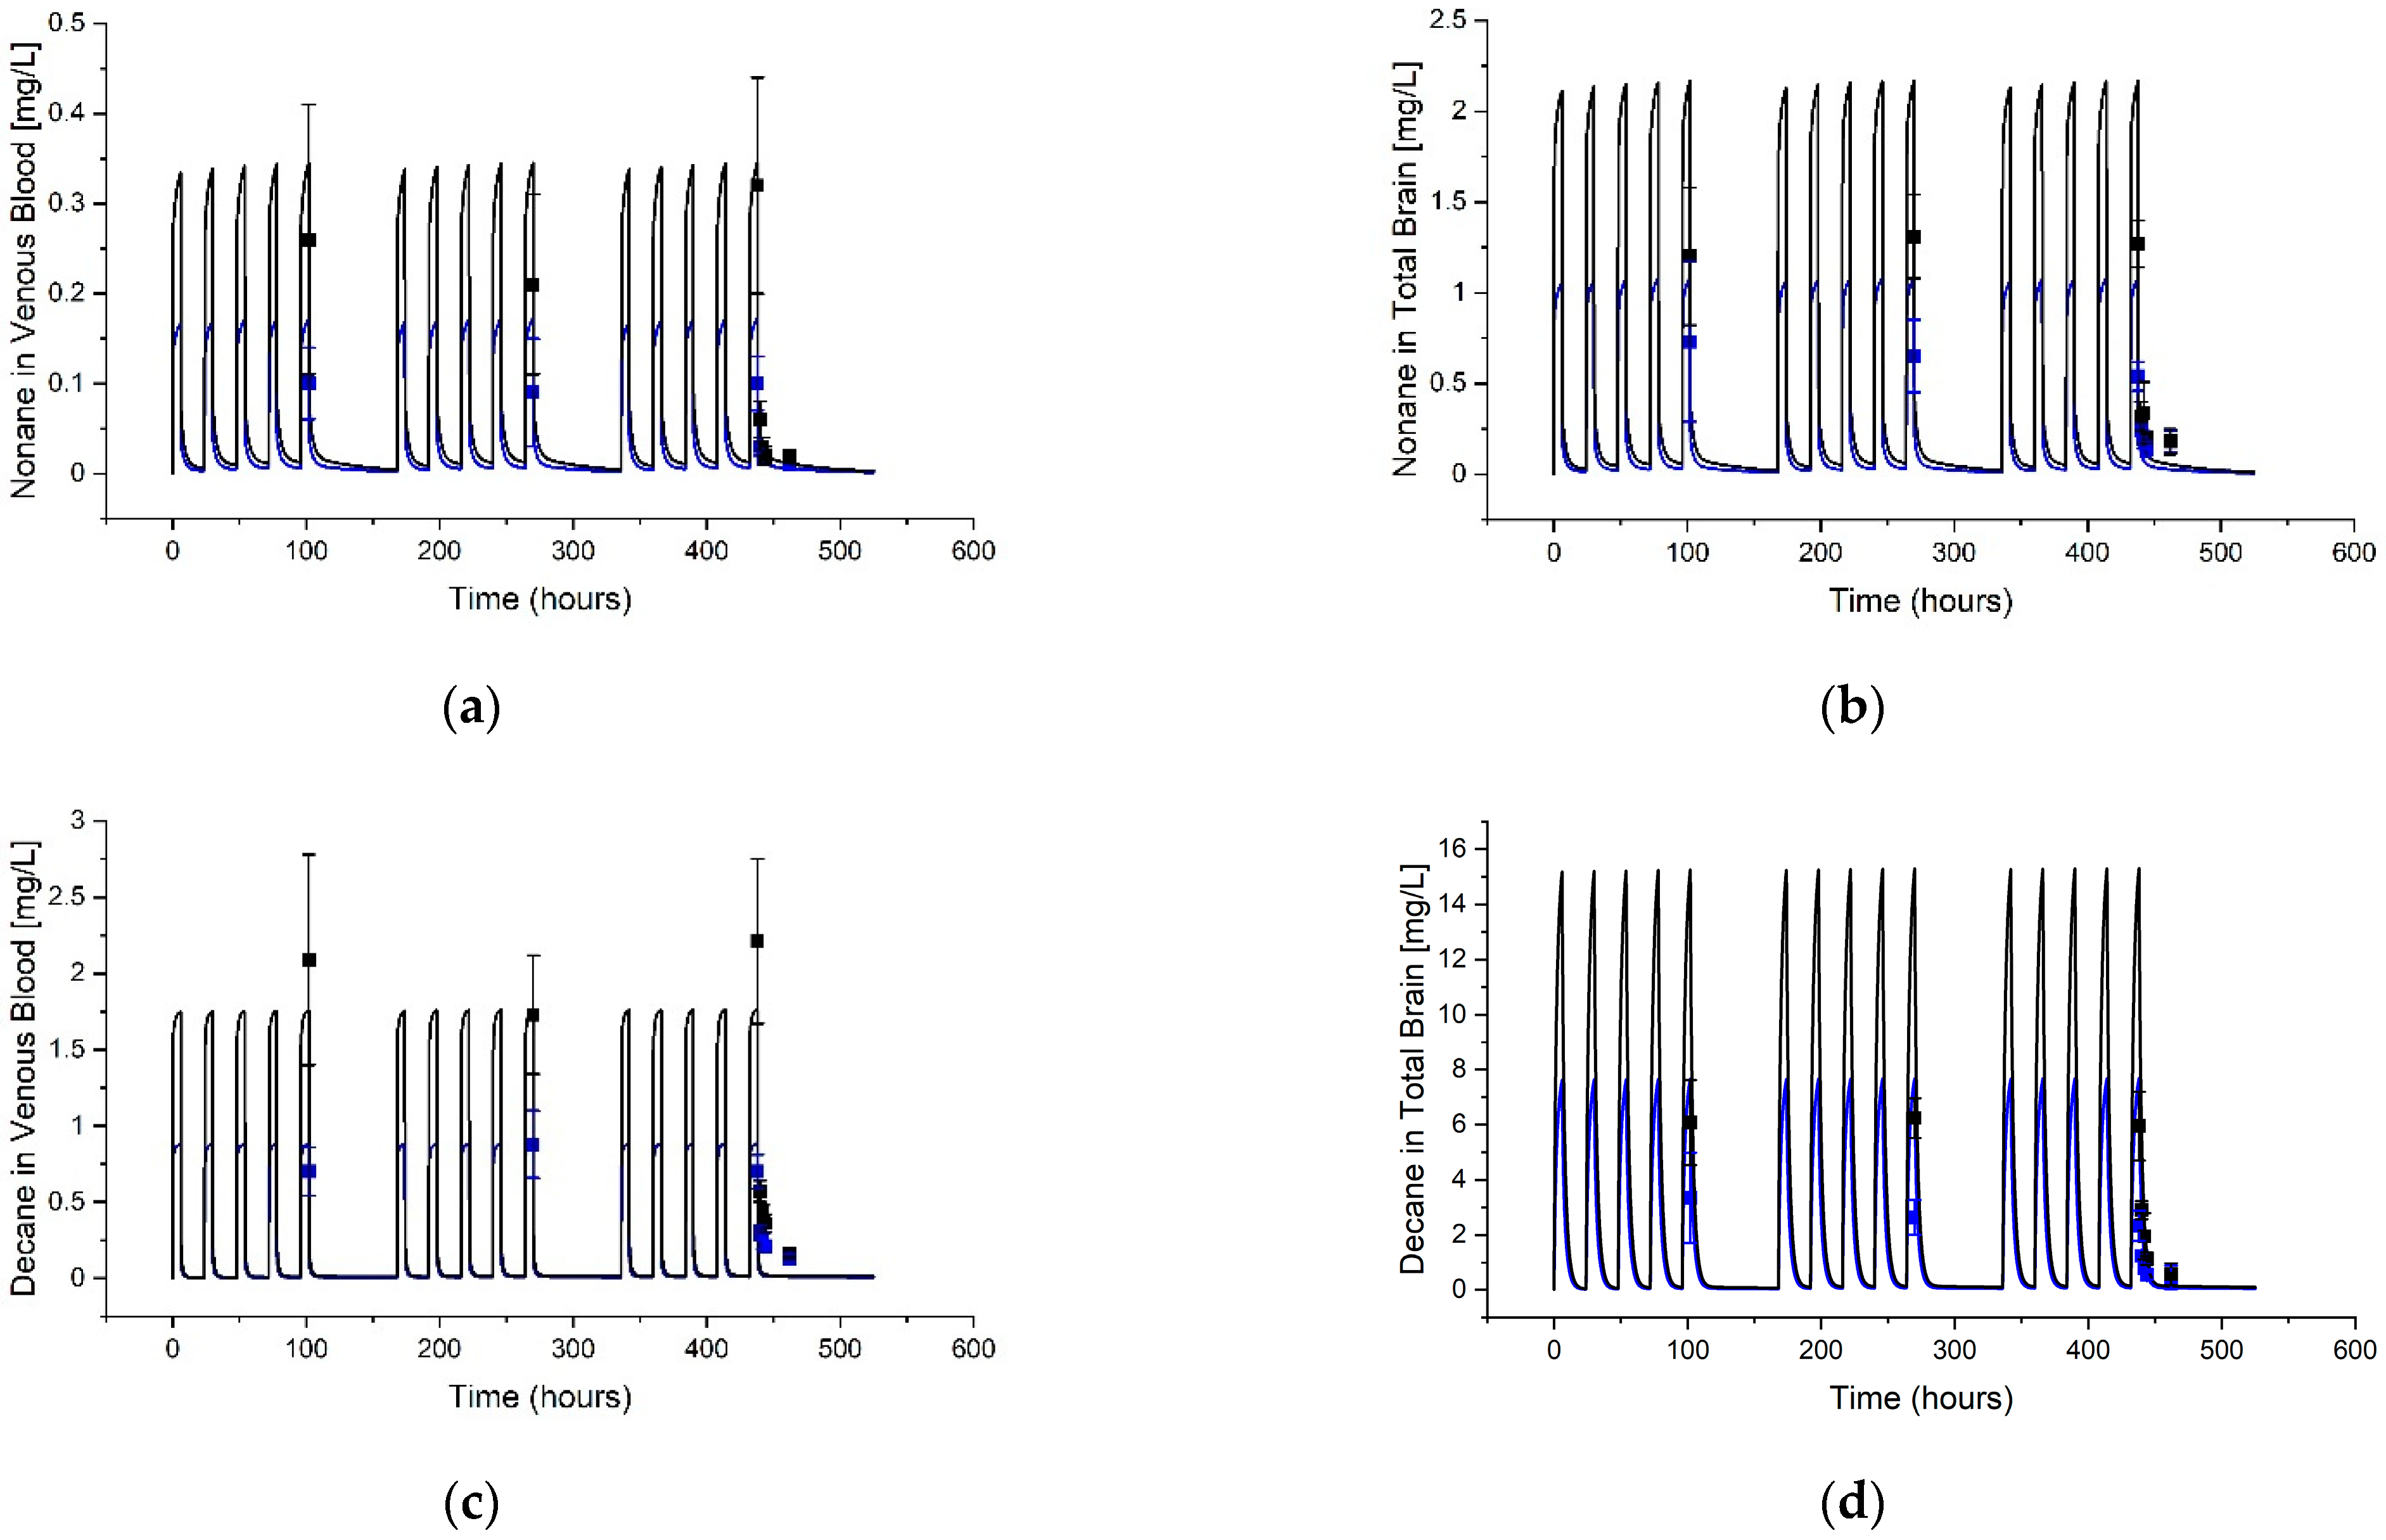
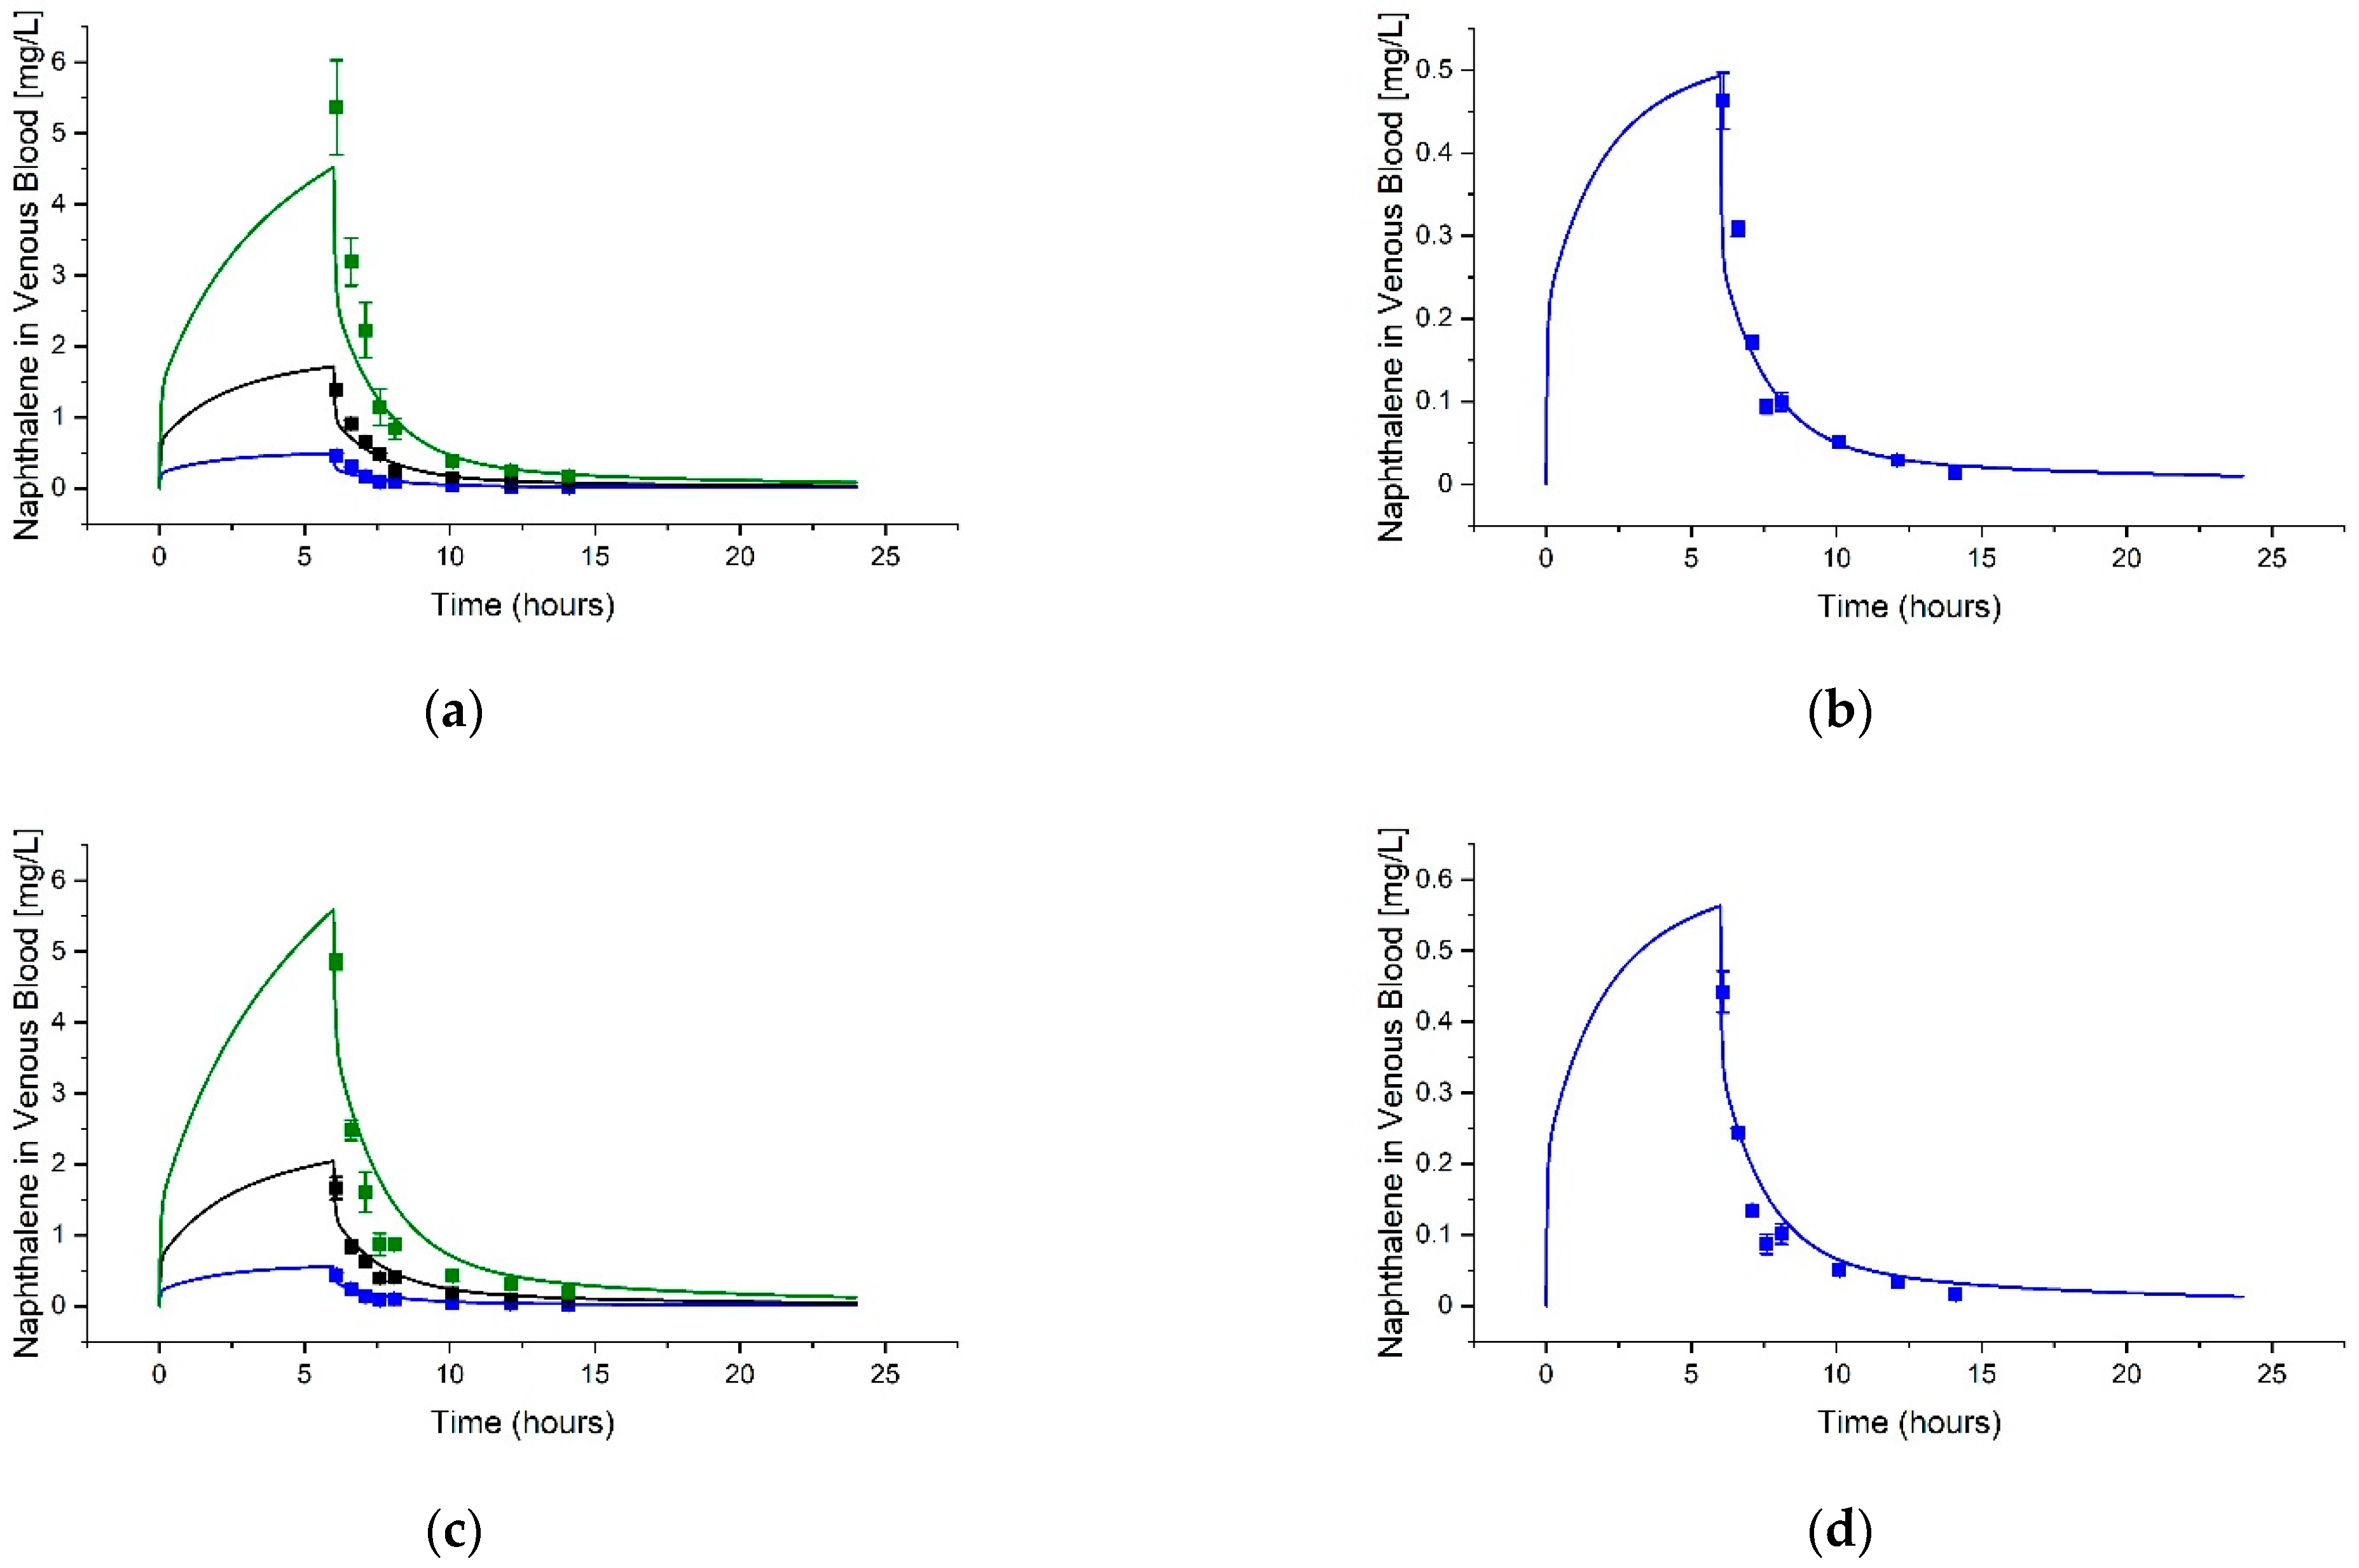
3.1. Model Usefulness and Validation
3.2. Guthrie et al. (2014) [14] Tissue Predictions
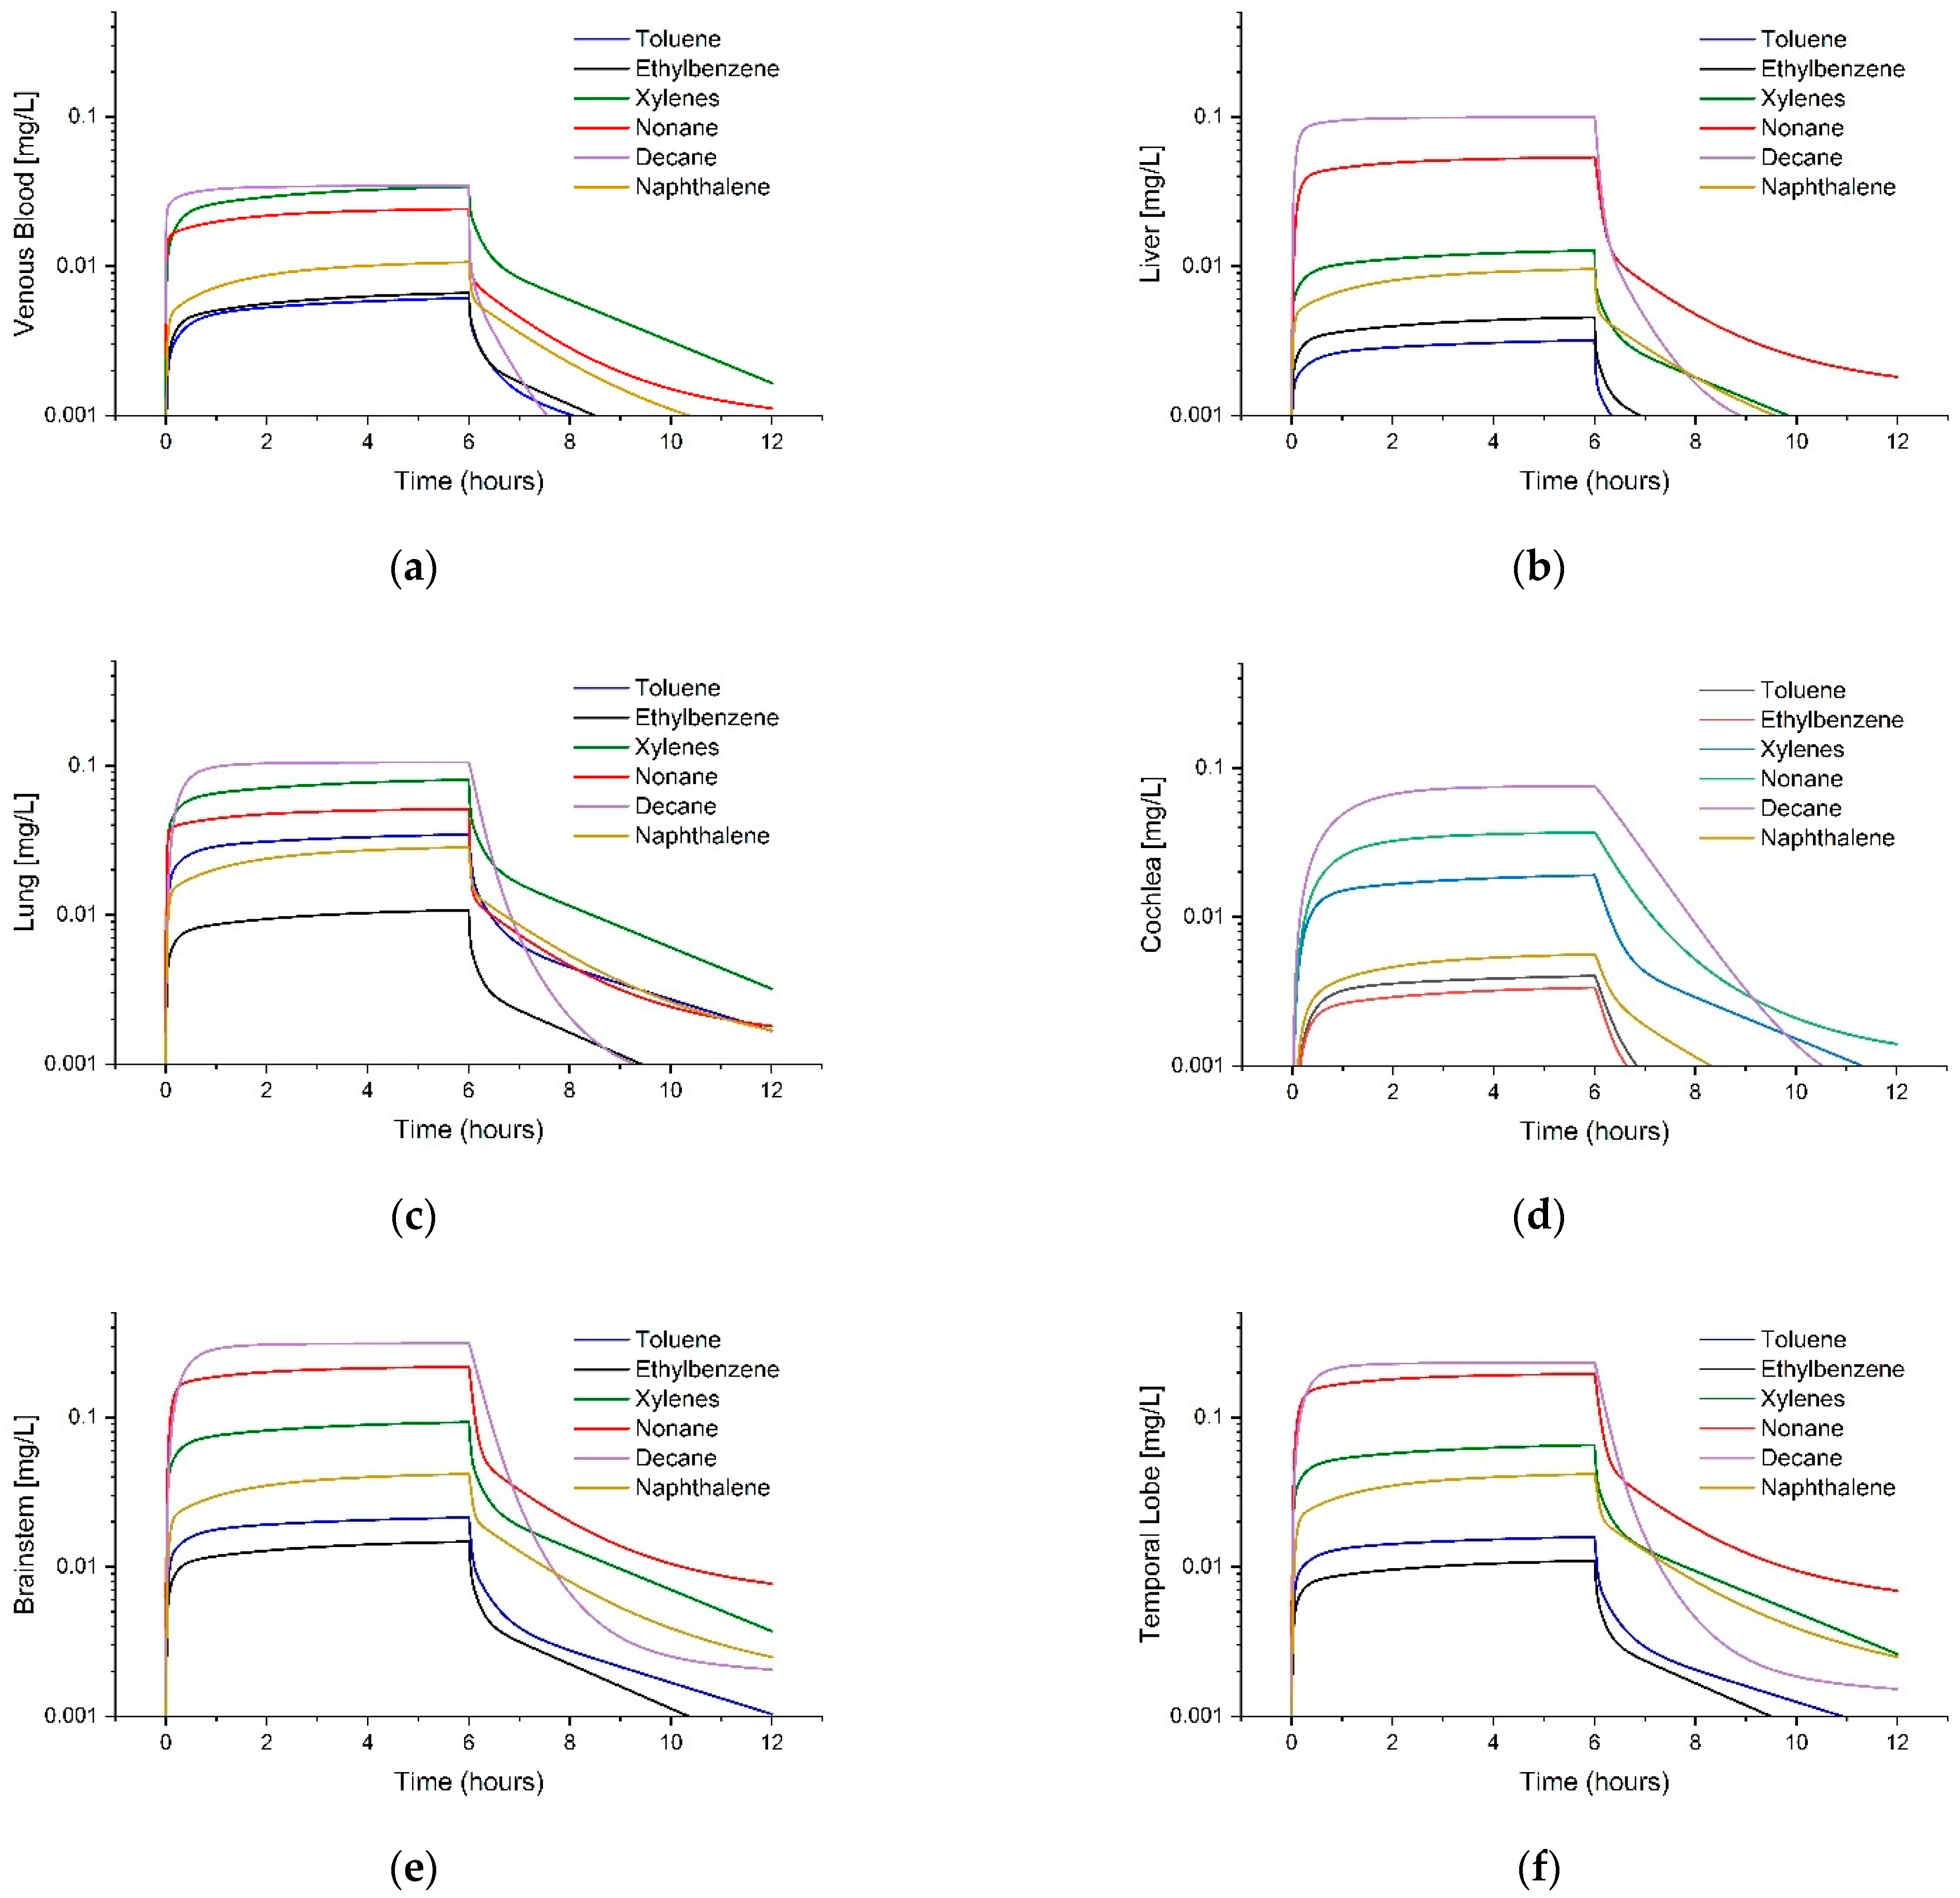
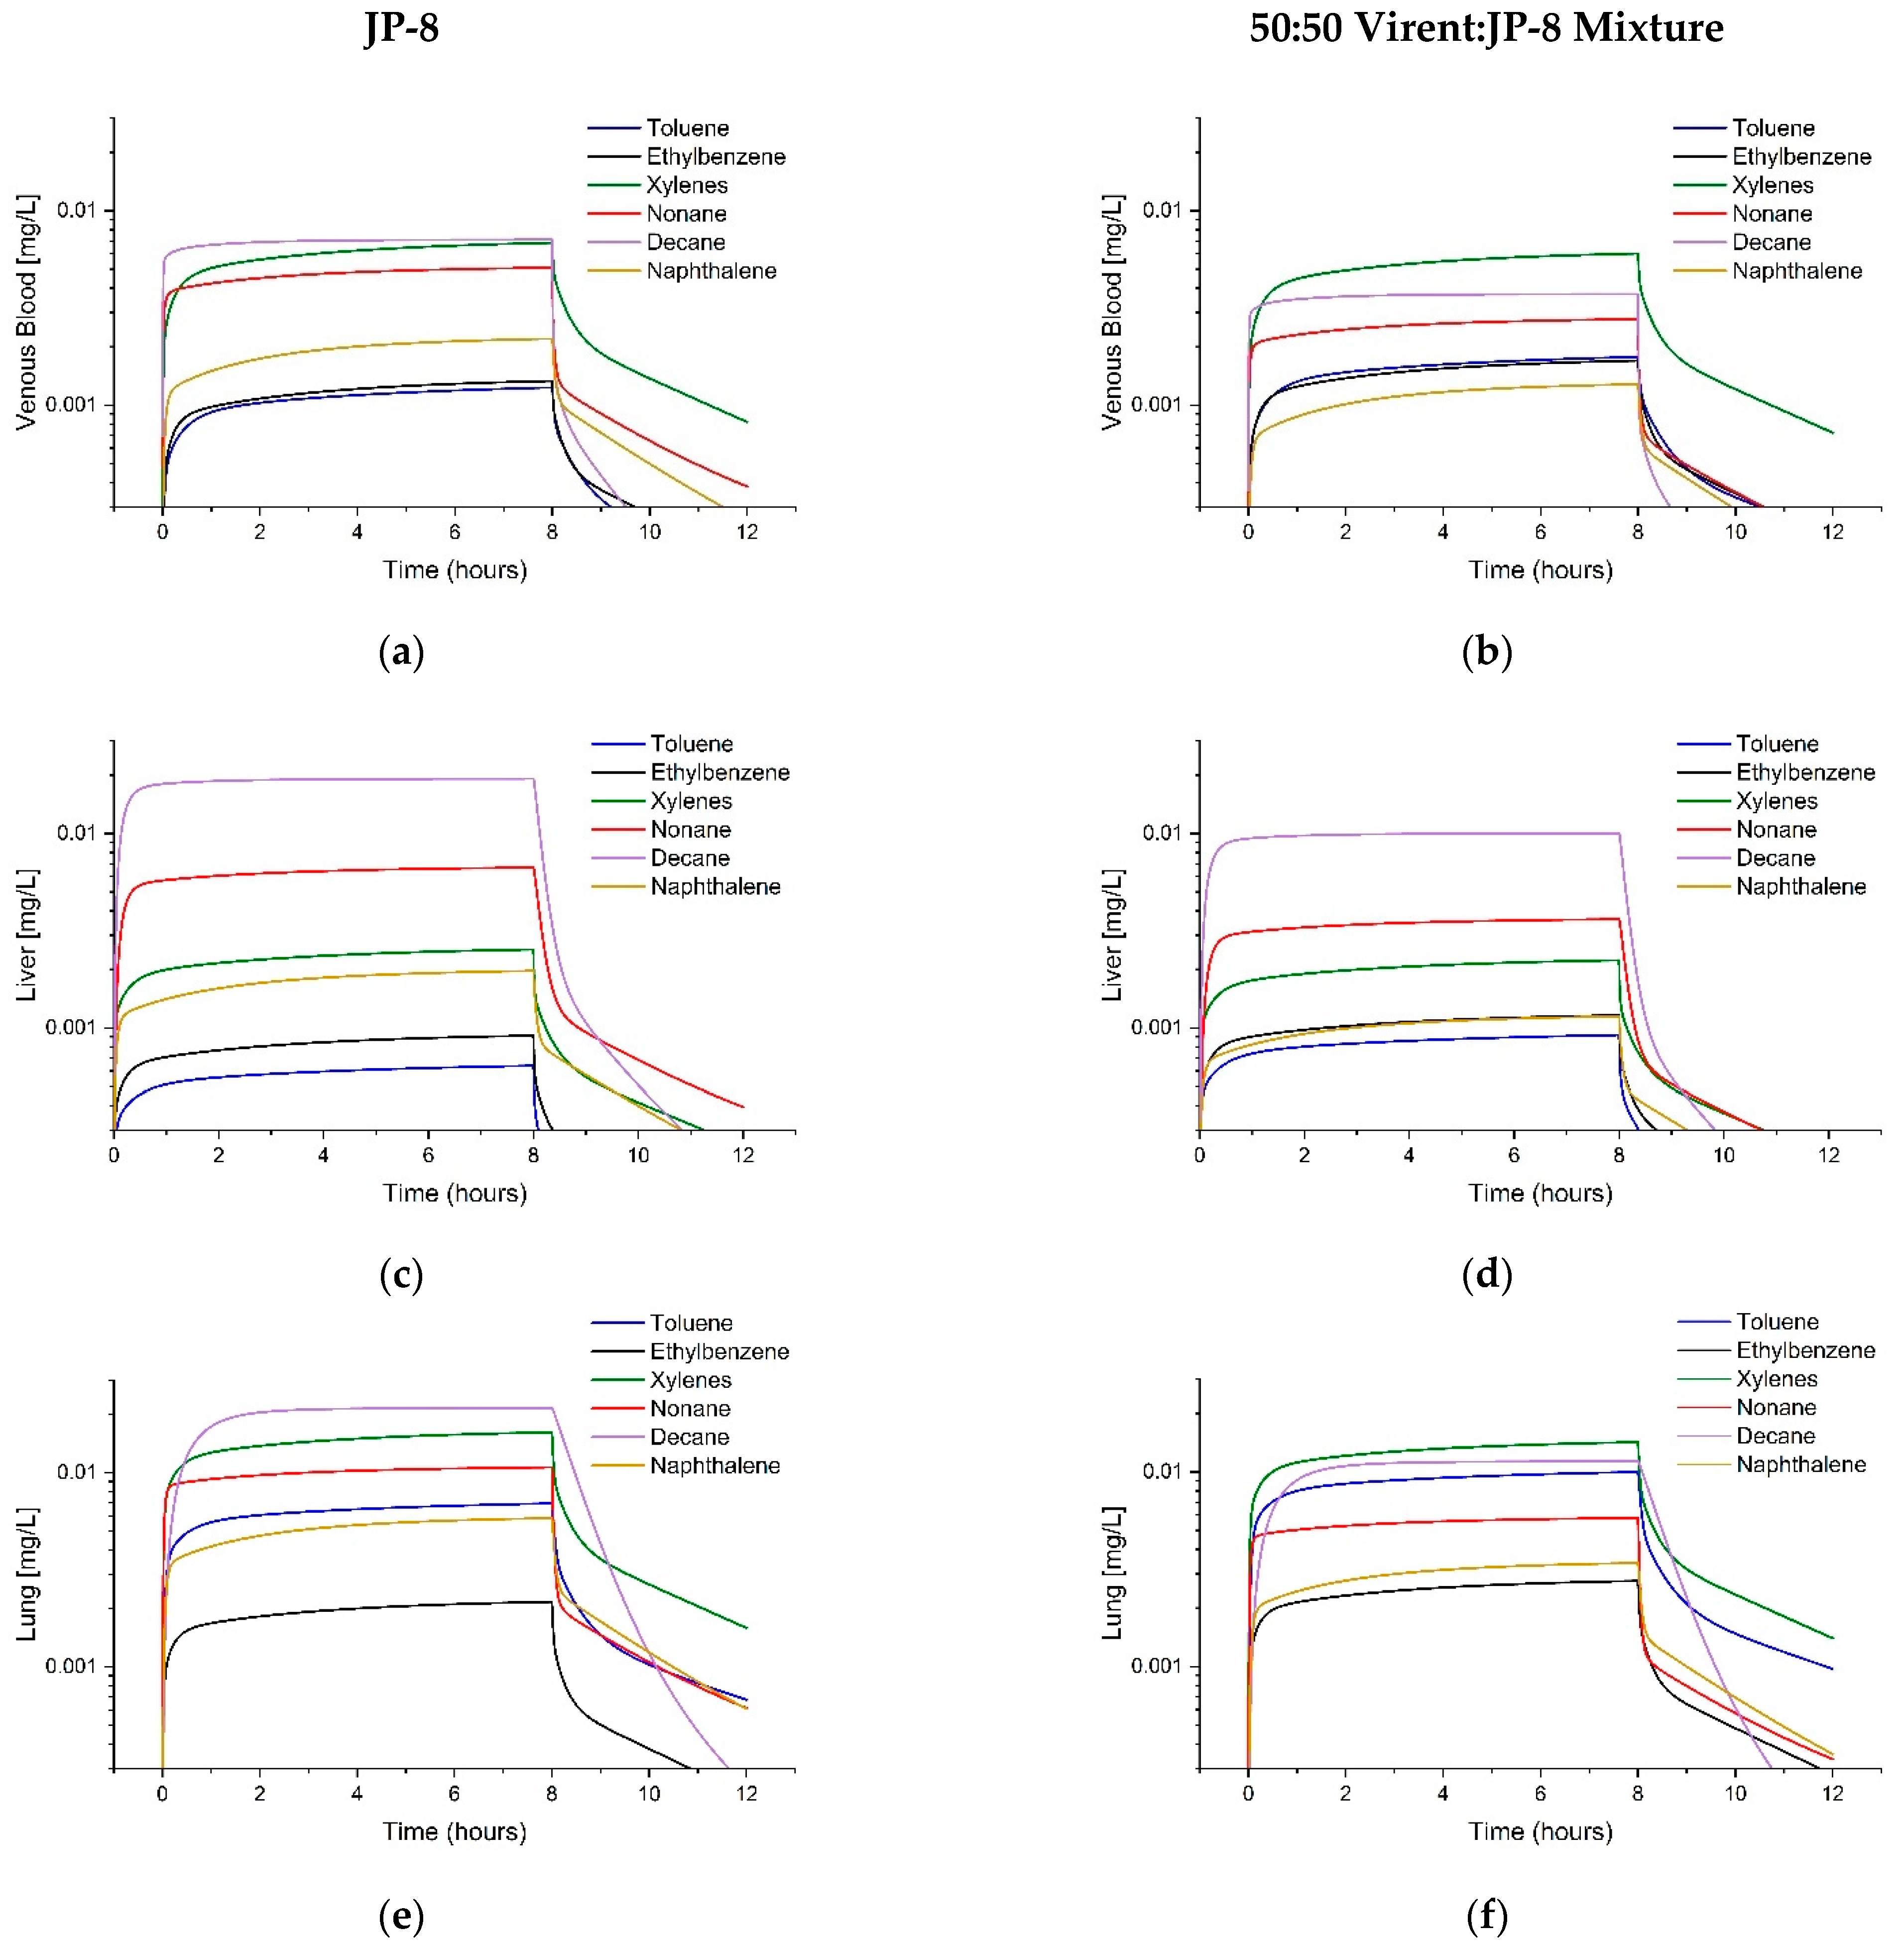
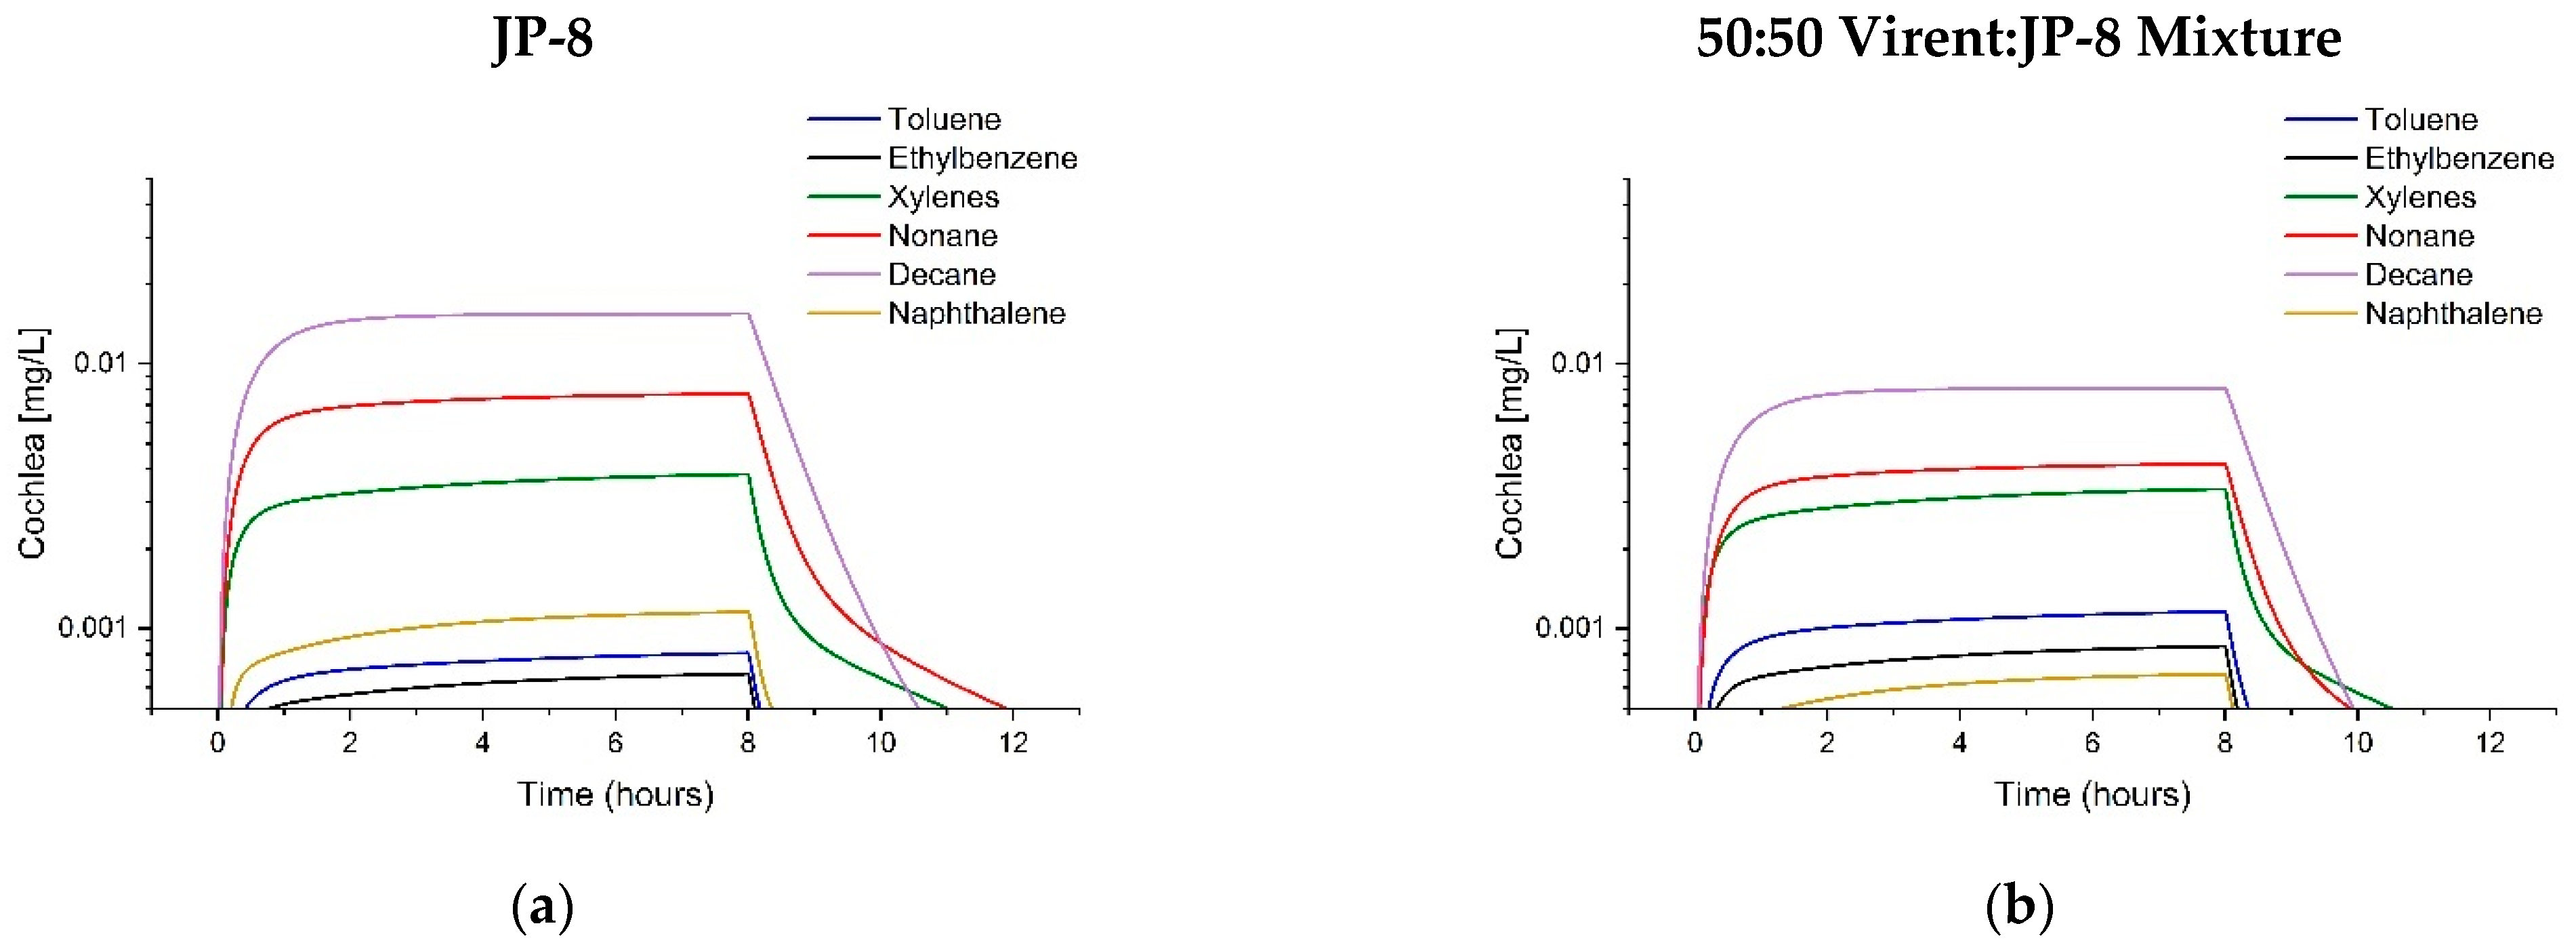
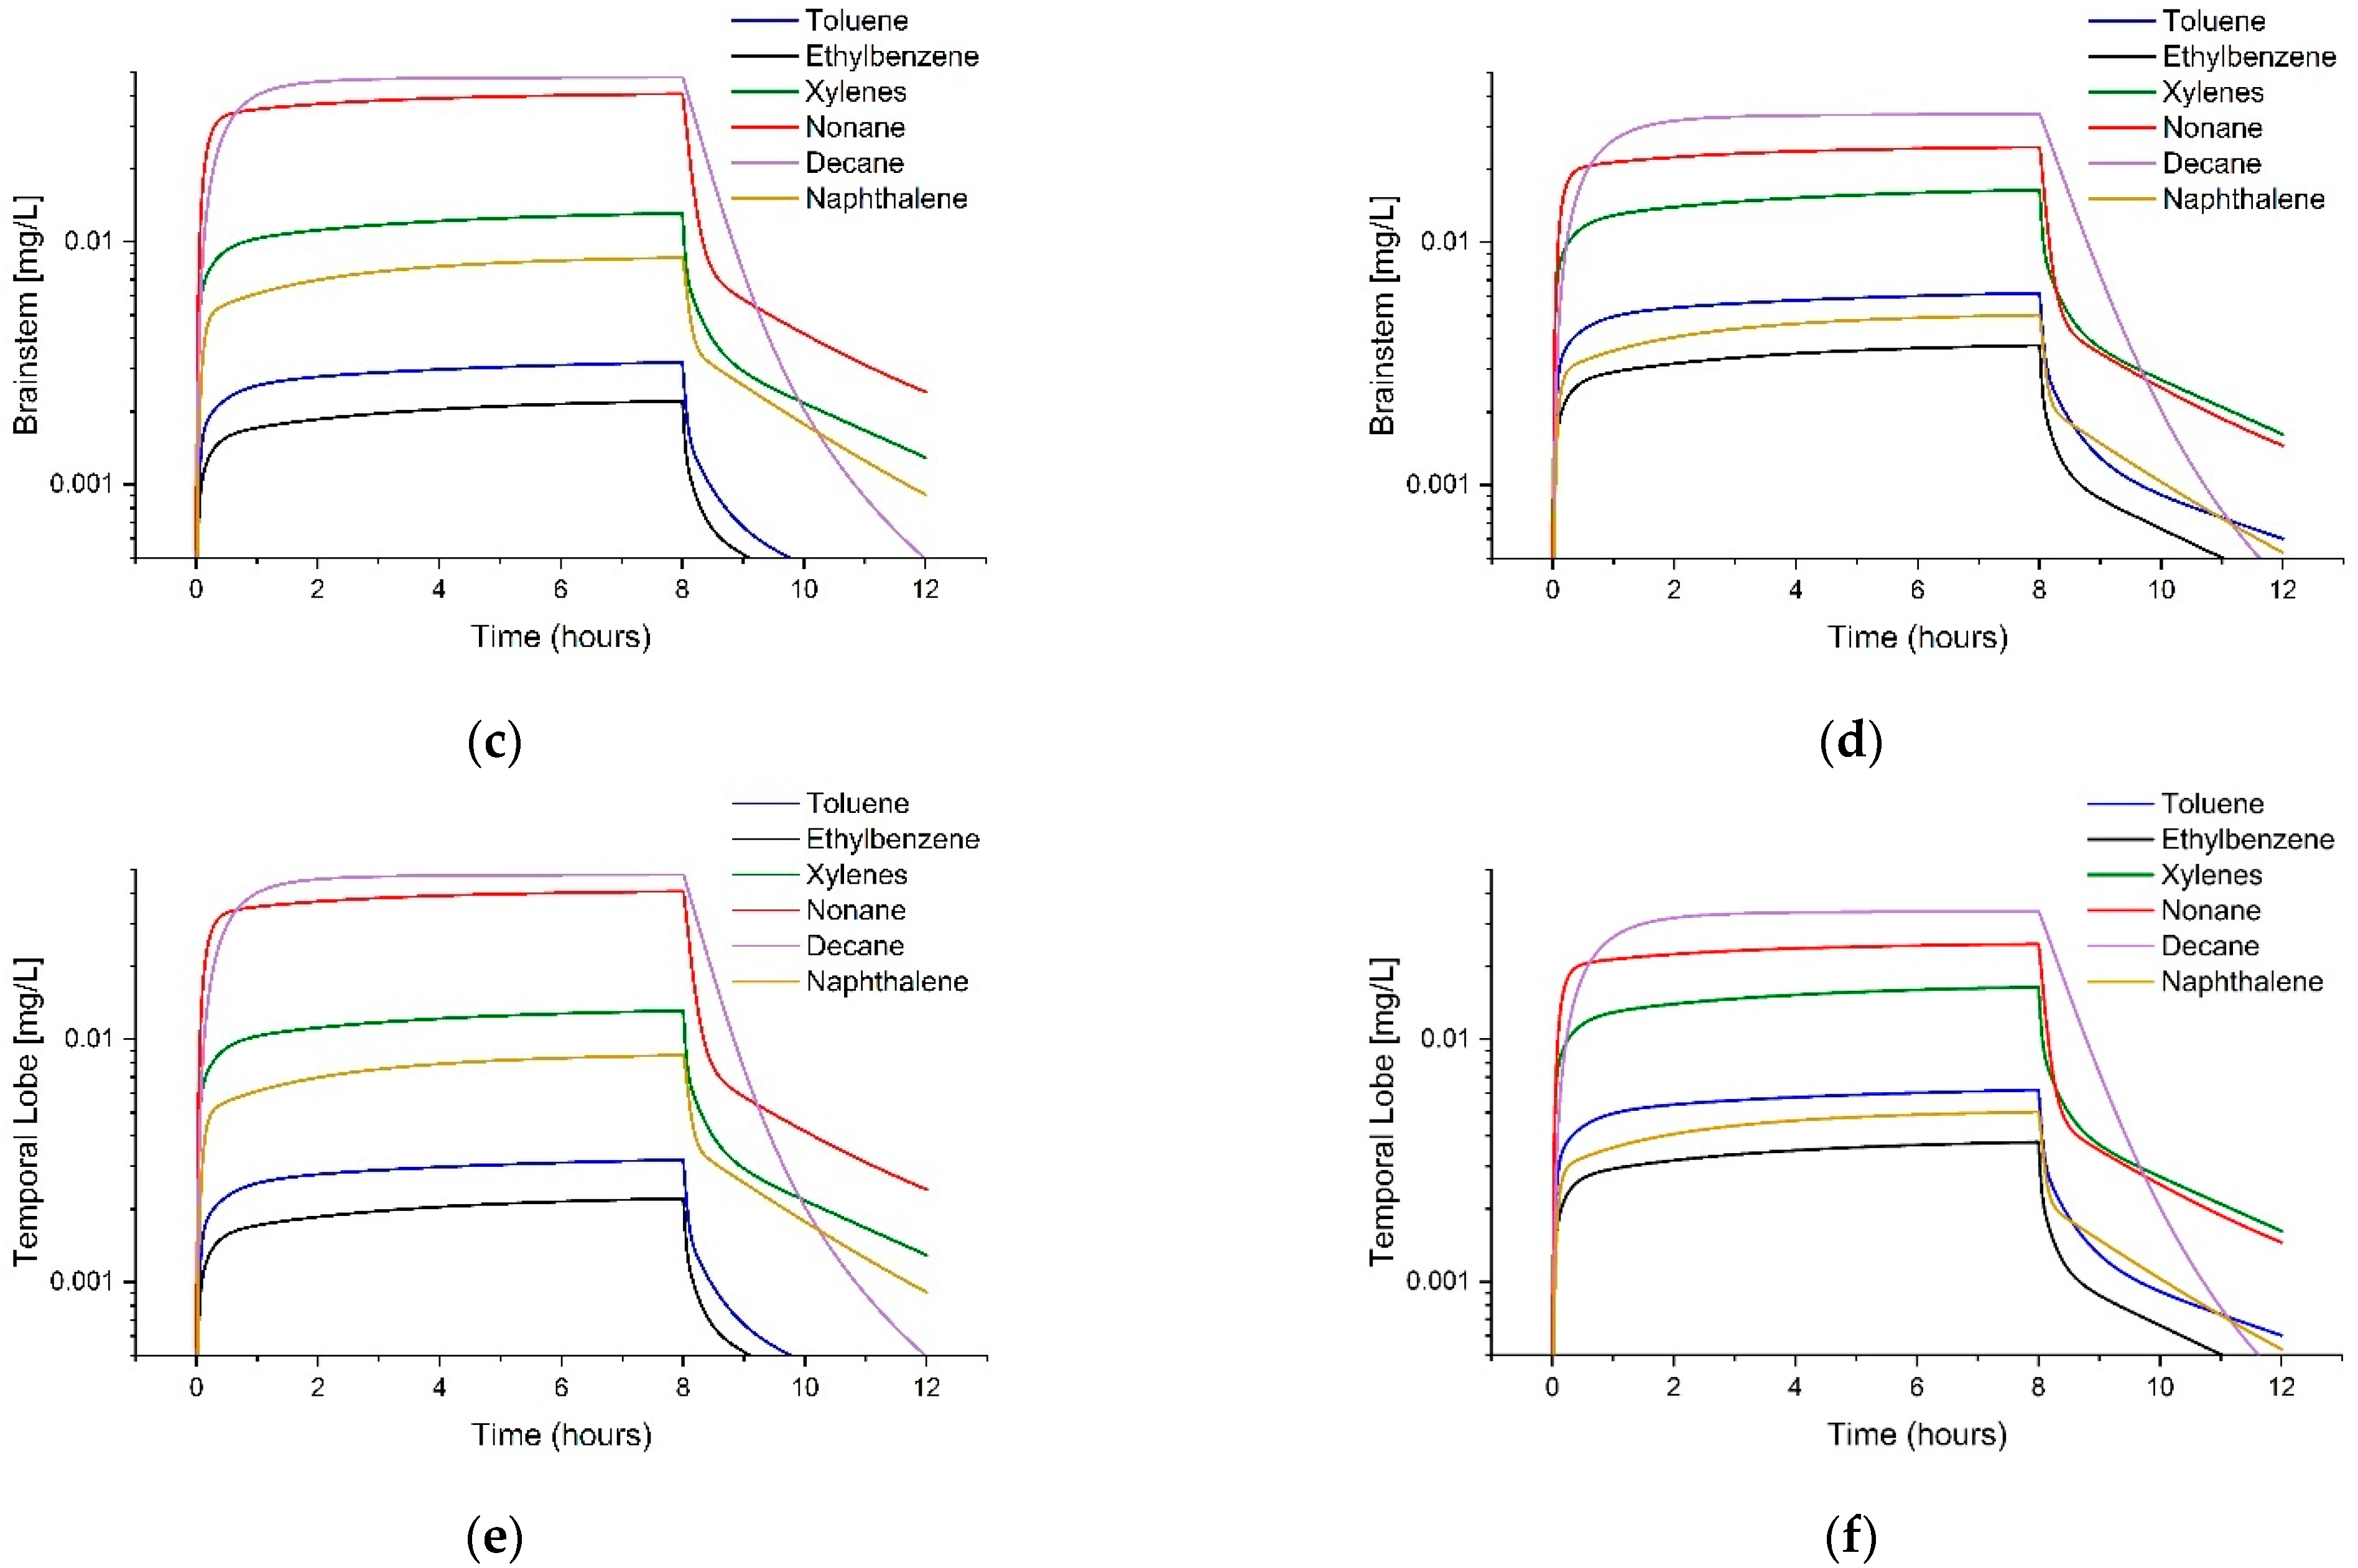
3.3. Comparison of Tissue Concentrations between Fuels
3.4. Sensitivity Analysis
4. Discussion
5. Conclusions
Supplementary Materials
Author Contributions
Funding
Institutional Review Board Statement
Informed Consent Statement
Data Availability Statement
Acknowledgments
Conflicts of Interest
Disclaimer
References
- Stucker, J.P.; Schank, J.F.; Dombey-Moore, B. Assessment of DoD Fuel Standardization Policies; RAND National Defense Research Institute: Santa Monica, CA, USA, 1994. [Google Scholar]
- Work, F. Development of multi-fuel, power dense engines for maritime combat craft. J. Mar. Eng. Technol. 2011, 10, 37–46. [Google Scholar] [CrossRef]
- National Research Council. Toxicologic Assessment of Jet-Propulsion Fuel 8; The National Academies Press: Washington, DC, USA, 2003. [Google Scholar]
- Smedje, G.; Lunden, M.; Gartner, L.; Lundgren, H.; Lindgren, T. Hearing status among aircraft maintenance personnel in a commercial airline company. Noise Health 2011, 13, 364–370. [Google Scholar] [CrossRef] [PubMed]
- Raynal, M.; Kossowski, M.; Job, A. Hearing in military pilots: One-time audiometry in pilots of fighters, transports, and helicopters. Aviat. Space Environ. Med. 2006, 77, 57–61. [Google Scholar] [PubMed]
- Jaruchinda, P.; Thongdeetae, T.; Panichkul, S.; Hanchumpol, P. Prevalence and an analysis of noise--induced hearing loss in army helicopter pilots and aircraft mechanics. J. Med. Assoc. Thai. 2005, 88 (Suppl. 3), S232–S239. [Google Scholar] [PubMed]
- Kaufman, L.R.; LeMasters, G.K.; Olsen, D.M.; Succop, P. Effects of concurrent noise and jet fuel exposure on hearing loss. J. Occup. Environ. Med. 2005, 47, 212–218. [Google Scholar] [CrossRef]
- Prasher, D.; Al-Hajjaj, H.; Aylott, S.; Aksentijevic, A. Effect of exposure to a mixture of solvents and noise on hearing and balance in aircraft maintenance workers. Noise Health 2005, 7, 31–39. [Google Scholar] [CrossRef]
- Guest, M.; Boggess, M.; Attia, J.; D’Este, C.; Brown, A.; Gibson, R.; Tavener, M.; Gardner, I.; Harrex, W.; Horsley, K.; et al. Hearing impairment in F-111 maintenance workers: The study of health outcomes in aircraft maintenance personnel (SHOAMP) general health and medical study. Am. J. Ind. Med. 2010, 53, 1159–1169. [Google Scholar] [CrossRef]
- Warner, R.; Fuente, A.; Hickson, L. Jet Fuel, Noise, and the Central Auditory Nervous System: A Literature Review. Mil. Med. 2015, 180, 950–955. [Google Scholar] [CrossRef] [Green Version]
- Fechter, L.D.; Gearhart, C.; Fulton, S.; Campbell, J.; Fisher, J.; Na, K.; Cocker, D.; Nelson-Miller, A.; Moon, P.; Pouyatos, B. JP-8 jet fuel can promote auditory impairment resulting from subsequent noise exposure in rats. Toxicol. Sci. 2007, 98, 510–525. [Google Scholar] [CrossRef] [Green Version]
- Fechter, L.D.; Gearhart, C.A.; Fulton, S. Ototoxic potential of JP-8 and a Fischer-Tropsch synthetic jet fuel following subacute inhalation exposure in rats. Toxicol. Sci. 2010, 116, 239–248. [Google Scholar] [CrossRef]
- Fechter, L.D.; Fisher, J.W.; Chapman, G.D.; Mokashi, V.P.; Ortiz, P.A.; Reboulet, J.E.; Stubbs, J.E.; Lear, A.M.; McInturf, S.M.; Prues, S.L.; et al. Subchronic JP-8 jet fuel exposure enhances vulnerability to noise-induced hearing loss in rats. J. Toxicol. Environ. Health A 2012, 75, 299–317. [Google Scholar] [CrossRef]
- Guthrie, O.W.; Xu, H.; Wong, B.A.; McInturf, S.M.; Reboulet, J.E.; Ortiz, P.A.; Mattie, D.R. Exposure to low levels of jet-propulsion fuel impairs brainstem encoding of stimulus intensity. J. Toxicol. Environ. Health A 2014, 77, 261–280. [Google Scholar] [CrossRef]
- Guthrie, O.W.; Wong, B.A.; McInturf, S.M.; Reboulet, J.E.; Ortiz, P.A.; Mattie, D.R. Inhalation of Hydrocarbon Jet Fuel Suppress Central Auditory Nervous System Function. J. Toxicol. Environ. Health A 2015, 78, 1154–1169. [Google Scholar] [CrossRef]
- Guthrie, O.W. Abnormal neural adaptation consequent to combined exposure to jet fuel and noise. J. Toxicol. Environ. Health A 2022, 85, 671–684. [Google Scholar] [CrossRef]
- Guthrie, O.W.; Wong, B.A.; McInturf, S.M.; Mattie, D.R. Degenerate brainstem circuitry after combined physiochemical exposure to jet fuel and noise. J. Toxicol. Environ. Health A 2022, 85, 175–183. [Google Scholar] [CrossRef]
- Shafer, L.M.; Striebich, R.C.; Gomach, J.; Edwards, T. Chemical Class Composition of Commercial Jet Fuels and Other Specialty Kerosene Fuels. In 14th AIAA/AHI Space Planes and Hypersonic Systems and Technologies Conference, AIAA 2006-7972; American Institute of Aeronautics and Astronautics: Reston, VA, USA, 2006. [Google Scholar]
- Fechter, L.D.; Gearhart, C.; Fulton, S.; Campbell, J.; Fisher, J.; Na, K.; Cocker, D.; Nelson-Miller, A.; Moon, P.; Pouyatos, B. Promotion of noise-induced cochlear injury by toluene and ethylbenzene in the rat. Toxicol. Sci. 2007, 98, 542–551. [Google Scholar] [CrossRef]
- Johnson, A.-C.; Morata, T.C. The Nordic Expert Group for Criteria Documentation of Health Risks from Chemicals. 142. Occupational Exposure to Chemicals and Hearing Impairment; Arbete och Halsa: Gothenburg, Sweden, 2010; p. 177. [Google Scholar]
- Lund, S.P.; Simonsen, L.; Hass, U.; Ladefoged, O.; Lam, H.R.; Ostergaard, G. Dearomatized white spirit inhalation exposure causes long-lasting neurophysiological changes in rats. Neurotoxicol. Teratol. 1996, 18, 67–76. [Google Scholar] [CrossRef]
- SCOEL. Recommendation from the Scientific Committee on Occupational Exposure Limits for “White Spirit”; SCOEL/SUM/87; Scientific Committee on Occupational Exposure Limits, European Commission: Brussels, Belgium, 2007. [Google Scholar]
- Egeghy, P.P.; Hauf-Cabalo, L.; Gibson, R.; Rappaport, S.M. Benzene and naphthalene in air and breath as indicators of exposure to jet fuel. Occup. Environ. Med. 2003, 60, 969–976. [Google Scholar] [CrossRef] [Green Version]
- IRIS. Chemical Assessment Summary: Naphthalene; CASRN 91-20-3; Integrated Risk Information System, U.S. Environmental Protection Agency: Cincinnati, OH, USA, 1998. [Google Scholar]
- Chao, Y.C.; Kupper, L.L.; Serdar, B.; Egeghy, P.P.; Rappaport, S.M.; Nylander-French, L.A. Dermal exposure to jet fuel JP-8 significantly contributes to the production of urinary naphthols in fuel-cell maintenance workers. Environ. Health Perspect. 2006, 114, 182–185. [Google Scholar] [CrossRef] [Green Version]
- Serdar, B.; Egeghy, P.P.; Gibson, R.; Rappaport, S.M. Dose-dependent production of urinary naphthols among workers exposed to jet fuel (JP-8). Am. J. Ind. Med. 2004, 46, 234–244. [Google Scholar] [CrossRef]
- Lin, Z.; Fisher, J.W. A history and recent efforts of selected physiologically based pharmacokinetic modeling topics. In Physiologically Based Pharmacokinetic (PBPK) Modeling: Methods and Applications in Toxicology and Risk Assessment; Fisher, J.W., Gearhart, J.M., Eds.; Academic Press: Cambridge, MA, USA, 2020; pp. 1–26. [Google Scholar]
- Martin, S.A.; Campbell, J.L.; Tremblay, R.T.; Fisher, J.W. Development of a physiologically based pharmacokinetic model for inhalation of jet fuels in the rat. Inhal. Toxicol. 2012, 24, 1–26. [Google Scholar] [CrossRef] [PubMed]
- Ruiz, P.; Emond, C.; McLanahan, E.D.; Joshi-Barr, S.; Mumtaz, M. Exploring Mechanistic Toxicity of Mixtures Using PBPK Modeling and Computational Systems Biology. Toxicol. Sci. 2020, 174, 38–50. [Google Scholar] [CrossRef] [PubMed]
- Clewell, H.J., 3rd; Gentry, P.R.; Gearhart, J.M.; Covington, T.R.; Banton, M.I.; Andersen, M.E. Development of a physiologically based pharmacokinetic model of isopropanol and its metabolite acetone. Toxicol. Sci. 2001, 63, 160–172. [Google Scholar] [CrossRef] [PubMed] [Green Version]
- Merrill, E.A.; Gearhart, J.M.; Sterner, T.R.; Robinson, P.J. Improved predictive model for n-decane kinetics across species, as a component of hydrocarbon mixtures. Inhal. Toxicol. 2008, 20, 851–863. [Google Scholar] [CrossRef] [PubMed]
- IPCS. Characterization and Application of Physiologically Based Pharmacokinetic Models in Risk Assessment; International Programme on Chemical Safety, World Health Organization: Lyon, France, 2010. [Google Scholar]
- Quick, D.J.; Shuler, M.L. Use of in vitro data for construction of a physiologically based pharmacokinetic model for naphthalene in rats and mice to probe species differences. Biotechnol. Prog. 1999, 15, 540–555. [Google Scholar] [CrossRef]
- Willems, B.A.; Melnick, R.L.; Kohn, M.C.; Portier, C.J. A physiologically based pharmacokinetic model for inhalation and intravenous administration of naphthalene in rats and mice. Toxicol. Appl. Pharmacol. 2001, 176, 81–91. [Google Scholar] [CrossRef] [Green Version]
- Campbell, J.L.; Andersen, M.E.; Clewell, H.J. A hybrid CFD-PBPK model for naphthalene in rat and human with IVIVE for nasal tissue metabolism and cross-species dosimetry. Inhal. Toxicol. 2014, 26, 333–344. [Google Scholar] [CrossRef]
- Merrill, E.A.; Sterner, T.R.; Robinson, P.J.; Hulla, J.E.; Proctor, S.P. Modeling Real-Time Occupational Naphthalene Exposures to Predict Urinary Biomarkers; AFRL-RH-WP-TR-2019-0091; Air Force Research Laboratory, 711th Human Performance Wing, Airman Systems Directorate: Wright-Patterson AFB, OH, USA, 2019. [Google Scholar]
- Sterner, T.R.; Robinson, P.J.; Hack, C.E.; Qi, L.; Narayanan, L.; Law, S.T.; Covington, T.R.; Merrill, E.A.; Grobe, N.; Brown, D.N.; et al. Jet Fuel Exacerbated Noise-Induced Hearing Loss: Focus on Prediction of Central Auditory Processing Dysfunction; AFRL-RH-WP-TR-2017-0079; Air Force Research Laboratory, 711th Human Performance Wing, Airman Systems Directorate: Wright-Patterson AFB, OH, USA, 2017. [Google Scholar]
- Arms, A.D.; Travis, C.C. Reference Physiological Parameters in Phannacokinetic Modeling; EPA/600/6-88/004; U.S. Environmental Protection Agency: Washington, DC, USA, 1988. [Google Scholar]
- Brown, R.P.; Delp, M.D.; Lindstedt, S.L.; Rhomberg, L.R.; Beliles, R.P. Physiological parameter values for physiologically based pharmacokinetic models. Toxicol. Ind. Health 1997, 13, 407–484. [Google Scholar] [CrossRef]
- Robinson, P.J.; Sterner, T.R.; Merrill, E.A.; Gearhart, J.M.; Mattie, D.R. Preliminary Mathematical Model for Jet Fuel Exacerbated Noise-Induced Hearing Loss; AFRL-RH-WP-TR-2013-0044; Air Force Research Laboratory, 711th Human Performance Wing, Human Effectiveness Directorate: Wright-Patterson AFB, OH, USA, 2013. [Google Scholar]
- Delp, M.D.; Manning, R.O.; Bruckner, J.V.; Armstrong, R.B. Distribution of cardiac output during diurnal changes of activity in rats. Am. J. Physiol. 1991, 261, H1487–H1493. [Google Scholar] [CrossRef]
- Morizono, T.; Johnstone, B.M.; Kaldor, I. Cochlear blood volume in the guinea pig measured with Cr51 labelled red blood cells. Otol. Fukuoka 1968, 14, 82–89. [Google Scholar]
- Sterner, T.R.; Robinson, P.J.; Reddy, G.; Mattie, D.R.; Merrill, E.A. Expanded Development and Application of an Array-Based Mathematical Model for Fuels Exposure and Dosimetry; AFRL-RH-WP-TR-2022-0051; Air Force Research Laboratory, 711th Human Performance Wing, Airman Systems Directorate: Wright-Patterson AFB, OH, USA, 2022. [Google Scholar]
- Ruark, C.D.; Hack, C.E.; Robinson, P.J.; Mahle, D.A.; Gearhart, J.M. Predicting passive and active tissue:plasma partition coefficients: Interindividual and interspecies variability. J. Pharm. Sci. 2014, 103, 2189–2198. [Google Scholar] [CrossRef]
- Grobe, N.; Narayanan, L.; Brown, D.N.; Law, S.T.; Sibomana, I.; Shiyanov, P.; Reo, N.V.; Hack, C.E.; Sterner, T.R.; Mattie, D.R. Lipid, water, and protein composition to facilitate kinetic modeling of the auditory pathway. Toxicol. Mech. Methods 2019, 29, 53–59. [Google Scholar] [CrossRef]
- Lof, A.; Lam, H.R.; Gullstrand, E.; Ostergaard, G.; Ladefoged, O. Distribution of dearomatised white spirit in brain, blood, and fat tissue after repeated exposure of rats. Pharmacol. Toxicol. 1999, 85, 92–97. [Google Scholar] [CrossRef]
- Haddad, S.; Tardif, R.; Charest-Tardif, G.; Krishnan, K. Physiological modeling of the toxicokinetic interactions in a quaternary mixture of aromatic hydrocarbons. Toxicol. Appl. Pharmacol. 1999, 161, 249–257. [Google Scholar] [CrossRef]
- ACGIH. TLVs and BEIs; ACGIH: Cincinnati, OH, USA, 2022. [Google Scholar]
- Virent. Sustainable Aviation Fuel (SAF). Available online: https://www.virent.com/products/sustainable-aviation-fuel/ (accessed on 14 February 2023).
- Lam, C.W.; Galen, T.J.; Boyd, J.F.; Pierson, D.L. Mechanism of transport and distribution of organic solvents in blood. Toxicol. Appl. Pharmacol. 1990, 104, 117–129. [Google Scholar] [CrossRef]
- Tardif, R.; Charest-Tardif, G.; Brodeur, J. Comparison of the influence of binary mixtures versus a ternary mixture of inhaled aromatic hydrocarbons on their blood kinetics in the rat. Arch. Toxicol. 1996, 70, 405–413. [Google Scholar] [CrossRef]
- Perleberg, U.R.; Keys, D.A.; Fisher, J.W. Development of a physiologically based pharmacokinetic model for decane, a constituent of jet propellent-8. Inhal. Toxicol. 2004, 16, 771–783. [Google Scholar] [CrossRef]
- NTP. NTP Technical Report on the Toxicology and Carcinogenesis Studies of Naphthalene (CAS No. 91-20-3) in F344/N Rats (Inhalation Studies); National Toxicology Program: Research Triangle Park, NC, USA, 2000. [Google Scholar]
- Robinson, P.J.; Merrill, E.A. A Harmonized Physiologically-Based Pharmacokinetic Model for Nonane as a Component of Jet Fuel; AFRL-RH-WP-TR-2008-0067; Air Force Research Laboratory, Human Effectiveness Directorate: Wright-Patterson AFB, OH, USA, 2008. [Google Scholar]
- Chavko, M.; Nemoto, E.M.; Melick, J.A. Regional lipid composition in the rat brain. Mol. Chem. Neuropathol. 1993, 18, 123–131. [Google Scholar] [CrossRef]
- Abbott, N.J.; Patabendige, A.A.; Dolman, D.E.; Yusof, S.R.; Begley, D.J. Structure and function of the blood-brain barrier. Neurobiol. Dis. 2010, 37, 13–25. [Google Scholar] [CrossRef]
- Banks, W.A. Characteristics of compounds that cross the blood-brain barrier. BMC Neurol. 2009, 9 (Suppl. 1), S3. [Google Scholar] [CrossRef] [Green Version]
- Romer, K.G.; Federsel, R.J.; Freundt, K.J. Rise of inhaled toluene, ethyl benzene, m-xylene, or mesitylene in rat blood after treatment with ethanol. Bull. Environ. Contam. Toxicol. 1986, 37, 874–876. [Google Scholar] [CrossRef] [PubMed]
- RTI. The Toxicokinetics of Naphthalene: Protocol RTI-518: The Toxicokinetics of Intravenously Administered Naphthalene (NAP) in Male and Female B6C3F1 Mice and F344 Rats; Research Triangle Institute: Research Triangle Park, NC, USA, 1996. [Google Scholar]
- Marchand, A.; Aranda-Rodriguez, R.; Tardif, R.; Nong, A.; Haddad, S. Human inhalation exposures to toluene, ethylbenzene, and m-xylene and physiologically based pharmacokinetic modeling of exposure biomarkers in exhaled air, blood, and urine. Toxicol. Sci. 2015, 144, 414–424. [Google Scholar] [CrossRef] [PubMed] [Green Version]
- Marchand, A.; Aranda-Rodriguez, R.; Tardif, R.; Nong, A.; Haddad, S. Evaluation and modeling of the impact of coexposures to VOC mixtures on urinary biomarkers. Inhal. Toxicol. 2016, 28, 260–273. [Google Scholar] [CrossRef] [PubMed]
- Dennison, J.E.; Andersen, M.E.; Yang, R.S. Characterization of the pharmacokinetics of gasoline using PBPK modeling with a complex mixtures chemical lumping approach. Inhal. Toxicol. 2003, 15, 961–986. [Google Scholar] [CrossRef]
- Gustafson, J.B.; Griffith Tell, J.; Orem, D. Total Petroleum Hydrocarbon Criteria Working Group Series: Volume 3: Selection of Representative TPH Fractions Based on Fate and Transport Considerations; Amherst Scientific Publications: Amherst, MA, USA, 1997; p. 109. [Google Scholar]


| Constant | Constant Name | Value a |
|---|---|---|
| BW | Body weight (kg) | 0.25 b |
| QCC | Cardiac output (L/(h·kg0.75)) | 14.6 |
| QPC | Alveolar/pulmonary flow (L/(h·kg0.75)) | 24.75 |
| Tissue Blood Flows [fraction of cardiac output] | ||
| QBrC | Remainder of brain tissues | 0.013 |
| QBrnStmC | Brainstem | 0.004 |
| QBrnTLC | Temporal lobe | 0.003 |
| QCocC | Cochlea | 0.00004 d |
| QFatC | Fat | 0.07 |
| QLivC | Liver | 0.183 |
| QLngC | Lung | 0.021 c |
| QRapC | Rapidly perfused | 0.536 |
| QSlwC | Slowly perfused | 0.17 |
| Tissue Volumes [fraction of BW] e | ||
| VAlvC | Alveolar blood | 0.007 |
| VBrnC | Remainder of brain tissue | 0.004 f |
| VBrnStmC | Brainstem | 0.001 f |
| VBrnTLC | Temporal lobe | 0.001 g |
| VFatC | Fat | 0.10 |
| VLivC | Liver | 0.034 |
| VLngC | Lung | 0.005 c |
| VRapC | Rapidly perfused | 0.039 |
| VSlwC | Slowly perfused | 0.65 |
| Tissue Blood Volumes [fraction of tissue volume] | ||
| VBrnBldC | Remainder of brain tissue | 0.03 c |
| VBrnStmBldC | Brainstem | 0.03 c |
| VBrnTLBldC | Temporal lobe | 0.03 c |
| VCocBldC | Cochlea | 0.0183 h |
| VFatBldC | Fat | 0.0154 c |
| VLivBldC | Liver | 0.21 c |
| VLngBldC | Lung | 0.36 c |
| VRapBC | Rapidly perfused | 0.2075 c |
| VSlwBldC | Slowly perfused | 0.0333 i |
| Constant | Constant Name | Toluene | Ethylbenzene | Xylenes | Nonane | Decane | Naphthalene |
|---|---|---|---|---|---|---|---|
| MW | Molecular weight | 92.14 a | 106.16 a | 106.16 a | 128.25 a | 142.28 a | 128.17 a |
| PB | Blood:air PC | 18.0 b | 42.7 b | 46.0 b | 5.2 c | 5.0 c | 571.0 g |
| Tissue:Blood Partition Coefficients (unitless) | |||||||
| PBrn | Brain | 2.0 c | 1.22 c | 1.38 c | 5.0 c | 10.0 c | 3.5 h |
| PStm | Brainstem | 2.87 c | 1.93 c | 2.29 c | (2.9/1.7) × PBrn f | (1.56/1.75) × PBrn f | 3.5 h |
| PTL | Temporal lobe | 2.13 c | 1.44 c | 1.61 c | (2.6/1.7) × PBrn f | (1.16/1.75) × PBrn f | 3.5 h |
| PCoc | Cochlea | 0.54 c | 0.44 c | 0.47 c | 1.45 c | 2.15 c | 0.47 h |
| PFat | Fat | 56.7 b | 36.4 b | 40.4 b | 282.0 c | 328.0 c | 49.0 g |
| PLiv | Liver | 4.64 b | 1.96 b | 1.98 b | 8.0 c | 3.0 c | 1.6 g |
| PLng | Lung | 4.64 d | 1.41 d | 1.98 d | 2.0 d | 3.0 d | 3.5 g |
| PRap | Rapidly perfused | 4.64 c | 1.41 c | 1.98 b | 2.0 c | 3.0 c | 3.5 g |
| PSlw | Slowly perfused | 1.54 b | 0.61 b | 0.91 b | 4.0 3 | 0.85 c | 3.5 g |
| Permeability Coefficients (L/h) | |||||||
| PABrn | Brain | 10,000 e | 10,000 e | 10,000 e | 0.5 c | 0.005 c | 10,000 e |
| PAStm | Brainstem | 10,000 e | 10,000 e | 10,000 e | 0.5 c | 0.005 c | 10,000 e |
| PATL | Temporal lobe | 10,000 e | 10,000 e | 10,000 e | 0.5 c | 0.005 c | 10,000 e |
| PACoc | Cochlea | 10,000 e | 10,000 e | 10,000 e | l.0 c | 1.0 c | 10,000 e |
| PAFat | Fat | 10,000 e | 10,000 e | 10,000 e | 0.5 c | 0.07 c | (0.2 × BW0.75) h |
| PALiv | Liver | 10,000 e | 10,000 e | 10,000 e | 0.07 c | 0.15 c | 10,000 e |
| PALng | Lung | 10,000 e | 10,000 e | 10,000 e | 1.0 c | 0.005 c | 10,000 e |
| PARap | Rapidly perfused | 10,000 e | 10,000 e | 10,000 e | l.0 c | 0.005 c | 10,000 e |
| PASlw | Slowly perfused | 10,000 e | 10,000 e | 10,000 e | 0.5 c | 0.14 c | (2.0 × BW0.75) h |
| Constant | Constant Name | Toluene | Ethylbenzene | Xylenes | Nonane | Decane | Naphthalene |
|---|---|---|---|---|---|---|---|
| VmaxC | Maximal rate of reaction–liver (mg/(h kg0.75)) | 3.44 a | 6.39 a | 6.49 a | 0.1 e | 0.005 e | ((8.28 × BW)/ BW0.75) g |
| Km | Affinity constant–liver (mg/L) | 0.13 a | 1.04 e | 0.45 a | 0.1 e | 0.1 e | 2.18 g |
| VmaxLngC | Maximal rate of reaction–lung (mg/(h kg0.75)) | 0 b | 0 b | 0 b | 0 b | 0 b | ((0.45 × BW)/ BW0.75) g |
| KmLng | Affinity constant–lung (mg/L) | 1 b | 1 b | 1 b | 1 b | 1 b | 2.18 g |
| ClUrC | Urinary clearance (L/(h kg0.75)) | 0.004 c | 0.04 e | 0.004 c | 0.4 e | 0.004 c | 0 h |
| Scrub | Upper respiratory tract scrubbing (fraction) | 0 d | 0 d | 0 d | 0.4 e | 0.7 f | 0 d |
| Compound | Compound Percent by Volume | % Difference | ||
|---|---|---|---|---|
| JP-8 | Virent SAK | 50-50 Blend | Blend vs. JP-8 | |
| Toluene | 0.16 | 0.30 | 0.23 | 144 |
| Ethylbenzene | 0.11 | 0.17 1 | 0.14 2 | 127 2 |
| Xylenes | 0.67 | 0.50 1 | 0.59 2 | 87 2 |
| Nonane | 1.14 | 0.09 | 0.62 | 54 |
| Decane | 2.55 | 0.13 | 1.34 | 53 |
| Naphthalene | 0.12 | 0.02 | 0.07 | 58 |
| Sensitivity Category 1 | Toluene | Ethyl Benzene | Xylenes | Nonane | Decane | Naphthalene |
|---|---|---|---|---|---|---|
| Arterial Blood Concentration (Peak and AUC) | ||||||
| High | QCC-, QPC+, QLivC- | QCC-, QPC+ | QCC-, QPC+, QLivC- | PB+, Scrub- | PB+, Scrub- | QPC+ |
| Medium | QRapC+, PB+ | QLivC-, QRapC+, VMaxC-, Km+ | QRapC+ | QPC+ | QCC-, QLivC-, QRapC+, VMaxC-, Km+ | |
| Low | QSlwC+ | PB+ | QSlwC+, PB+, VMaxC-, Km+ | |||
| Brainstem Concentration (Peak and AUC) | ||||||
| High | QCC-, QPC+, QLivC-, PBrnStm+ | QCC-, QPC+, PBrnStm+ | QCC-, QPC+, QLivC-, PBrnStm+ | PB+, PBrnStm+, Scrub- | PB+, PBrnStm+, Scrub- | QPC+, PBrnStm+ |
| Medium | QRapC+, PB+ | QLivC-, QRapC+, VMaxC-, Km+ | QRapC+ | QPC+ | QCC-, QLivC-, QRapC+, VMaxC-, Km+ | |
| Low | QSlwC+ | PB+ | QSlwC+, PB+, VMaxC-, Km+ | |||
| Liver Concentration (Peak and AUC) | ||||||
| High | QPC+, PLiv+, VMaxC-, Km+ | QPC+, PLiv+, VMaxC-, Km+ | QPC+, PLiv+, VMaxC-, Km+ | BW-, PB+, PLiv+, PALiv+, VMaxC-, Km+, Scrub- | PB+, PLiv+, Scrub- | QPC+, PLiv+, VMaxC-, Km+ |
| Medium | QCC+, QLivC+, PB+ | QPC+ | ||||
| Low | QRapC- | QCC+, QLivC+, QRapC-, PB+ | QCC+, QLivC+, PB+ | VMaxC-, Km+ | ||
Disclaimer/Publisher’s Note: The statements, opinions and data contained in all publications are solely those of the individual author(s) and contributor(s) and not of MDPI and/or the editor(s). MDPI and/or the editor(s) disclaim responsibility for any injury to people or property resulting from any ideas, methods, instructions or products referred to in the content. |
© 2023 by the authors. Licensee MDPI, Basel, Switzerland. This article is an open access article distributed under the terms and conditions of the Creative Commons Attribution (CC BY) license (https://creativecommons.org/licenses/by/4.0/).
Share and Cite
Sterner, T.R.; Covington, T.R.; Mattie, D.R. Complex Mixtures: Array PBPK Modeling of Jet Fuel Components. Toxics 2023, 11, 187. https://doi.org/10.3390/toxics11020187
Sterner TR, Covington TR, Mattie DR. Complex Mixtures: Array PBPK Modeling of Jet Fuel Components. Toxics. 2023; 11(2):187. https://doi.org/10.3390/toxics11020187
Chicago/Turabian StyleSterner, Teresa R., Tammie R. Covington, and David R. Mattie. 2023. "Complex Mixtures: Array PBPK Modeling of Jet Fuel Components" Toxics 11, no. 2: 187. https://doi.org/10.3390/toxics11020187