Article

An Integrated Methodology for Enhancing Reverse Logistics Flows and Networks in Industry 5.0

by
Al-Amin Abba Dabo
* and
Amin Hosseinian-Far
Department of Business Systems & Operations, University of Northampton, Northampton NN1 5PH, UK
*
Author to whom correspondence should be addressed.
Logistics 2023, 7(4), 97; https://doi.org/10.3390/logistics7040097
Submission received: 31 August 2023 / Revised: 27 November 2023 / Accepted: 7 December 2023 / Published: 11 December 2023

Abstract

:
Background: This paper explores the potential of Industry 5.0 in driving societal transition to a circular economy. We focus on the strategic role of reverse logistics in this context, underlining its significance in optimizing resource use, reducing waste, and enhancing sustainable production and consumption patterns. Adopting sustainable industrial practices is critical to addressing global environmental challenges. Industry 5.0 offers opportunities for achieving these goals, particularly through the enhancement of reverse logistics processes. Methods: We propose an integrated methodology that combines binary logistic regression and decision trees to predict and optimize reverse logistics flows and networks within the Industry 5.0 framework. Results: The methodology demonstrates effective quantitative modeling of influential predictors in reverse logistics and provides a structured framework for understanding their interrelations. It yields actionable insights that enhance decision-making processes in supply chain management. Conclusions: The methodology supports the integration of advanced technologies and human-centered approaches into industrial reverse logistics, thereby improving resource sustainability, systemic innovation, and contributing to the broader goals of a circular economy. Future research should explore the scalability of this methodology across different industrial sectors and its integration with other Industry 5.0 technologies. Continuous refinement and adaptation of the methodology will be necessary to keep pace with the evolving landscape of industrial sustainability.

1. Introduction

Sustainability and efficiency are key to long-term performance in modern industries [1]. Organizations understand the strategic and environmental significance of managing reverse logistics flows and networks effectively [1]. Through efficient handling of product returns, repairs, remanufacturing, and recycling, organizations can cut costs, improve customer satisfaction, and support environmental stewardship [1].
Industry 4.0, known as the fourth industrial revolution, integrates digital technologies like the Internet of Things (IoT), cloud computing, and Artificial Intelligence (AI) into manufacturing [2]. This period introduced the development of smart factories with interconnected systems, enhancing automation and offering real-time data for improved operations [3].
Advancing from Industry 4.0, Industry 5.0 integrates cutting-edge technologies like the Internet of Things (IoT), Artificial Intelligence (AI), and data analytics with traditional industrial processes. It focuses on the synergy between humans and intelligent systems and fostering a collaborative industrial environment [3]. In reverse logistics, Industry 5.0 uses IoT, AI, and data analytics to streamline and optimize processes. Such advancements align with corporate sustainability goals, addressing essential aspects like product returns, remanufacturing, recycling, and waste reduction [4]. Embracing Industry 5.0 is essential for organizations aiming to achieve efficient and sustainable operations [3].
Current research on reverse logistics optimization employs diverse methodologies, ranging from mathematical models to qualitative approaches to provide insights into crucial aspects inherent to the design of efficient closed-loop supply chains and reverse logistics systems. Among the more notable methodologies is System Dynamics (SD) [5]. This simulation-based approach captures the complexities of feedback loops and time delays inherent in reverse logistics processes, providing insights into how complex systems evolve and behave over time. Another common methodology used in the extant literature is Life Cycle Assessment (LCA). LCA has been used for evaluating the environmental effects associated with every stage of a product’s lifecycle [6]. Within the purview of reverse logistics, LCA aids organizations in determining the environmental footprints and benefits stemming from reverse logistics processes.
Another methodology, the Multi-criteria Decision Analysis (MCDA), has been adopted in the extant literature for evaluating and ranking diverse reverse logistics scenarios grounded in multiple criteria. MCDA is effective particularly when there are trade-offs to be made between criteria, such as cost implications versus environmental impact [7]. Other methodologies used include the application of Simulation Optimization and numerous Artificial Intelligence and machine learning techniques. From neural networks to clustering, these methodologies have been instrumental in optimizing routing, predicting returns, and ascertaining the most effective strategies for product disassembly or recycling.
In this study, we propose a quantitative approach that integrates binary logistics regression with decision trees to conduct the optimization of the reverse logistics network. The proposed integrated methodology for optimization leverages the probabilistic capabilities of logistics regression with the visualization and analytical utility of decision trees.
The paper is structured as follows: Section 2 provides a review of the pertinent extant literature. Section 3 includes the study context and the framework in which the proposed integrated methodology can be useful. Section 4 entails a detailed step by step guide to the integrated methodology. Section 5 includes an outline of the application of the proposed integrated methodology. Section 6 embraces the implications of the proposed integrated methodology, discusses its limitations, and makes suggestions on future research directions. Section 7 discusses a case study of the applied integrated methodology. The paper concludes with Section 8.

2. Key Literature

Reverse logistics (RL) represents the process of collecting used products from customers for the purpose of reuse, repair, remanufacture, recycling, or disposal [6]. Over the years, research and industrial interest and focus on reverse logistics has grown. This is reflective of the increasing organizational and societal awareness, responsibility and commitment towards environmental concerns, legislation, and sustainable competitiveness and development.
A key enabler of reverse logistics is industrial symbiosis. This is the collaboration between different industries to share resources and exchange waste, leading to enhanced economic and environmental performance [8]. The practice supports the circular economy by optimizing resource use and minimizing waste. Examples of industrial symbiosis include the exchange of waste heat between companies and the use of by-products as inputs in production processes [9]. Reverse logistics supports industrial symbiosis by offering channels for waste collection and redistribution, thus facilitating efficient material flow between industries [10,11].
Notable reverse logistics channels identified in the extant literature (Table 1) include product returns, product recalls, end-of-life product management, and refurbishment, each contributing significantly to eco-efficiency in Green Supply Chain Management [12].
A review of the extant literature indicates research in the field of RL has evolved rapidly over the last 20 years covering key phases and issues pertaining to adoption and implementation of reverse logistics, understanding and forecasting product returns, outsourcing, development and optimization of reverse logistics networks, and development of decision-support mechanisms to improve product recovery, transportation, and processing.
Numerous authors have worked on providing an overview of the research developments in the reverse logistics field through systematic literature reviews. Some of the latest systematic reviews are identified in Table 2. These reviews offer insights into the key developments and trends in the reverse logistics field and outline areas for future research.
Another key area covered by the extant literature is the integration of emerging technologies in supply chain management (SCM) and reverse logistics, with blockchain and machine learning (ML) at the forefront of this development. A systematic review conducted on blockchain in SCM by [27] highlights its potential to significantly enhance transparency, traceability, efficiency, and information security within the supply chain. The study underscores the pivotal role of blockchain, particularly when integrated with Internet of Things (IoT) and smart contracts, in automating and streamlining supply chain processes. However, the review also highlights a gap in empirical research, suggesting that real-world applications and case studies are relatively scarce, pointing towards a rich area for future investigation.
Similarly, Tian et al. [28] focus on multi-criteria decision-making (MCDM) techniques in the context of low-carbon transport and green logistics. They produce a systematic review of over 190 papers spanning from 2010 to 2022 providing a comprehensive understanding of how MCDM techniques are being applied in this specific area, filling a significant gap in the existing literature. In addition, Moosavi et al. [29] conducted a systematic review which discussed the complex nature of SCs of many industries such as food, health-related SCs, and explored how technology-aided tools (including AI, IoT, and blockchain) can be leveraged to manage SC disruptions effectively, incorporating both technological solutions and sector-specific strategies.
Overall, these systematic reviews are critical to providing an overview of the state of research and effectively capture and elucidate areas of future research activities.
The focus of our study is on the optimization of reverse logistics networks and enhancing product recovery, reuse, remanufacture and recycling. The literature on that application can be broadly categorized into two (2) main themes, namely (i) developing multi-objective decision-making models with a focus on improving reverse logistics processes such as product recovery and vehicle routing (ii) and developing models for managing and optimizing waste disposal processes across different industries. Some of the latest developments under these two broad categories are outlined in the succeeding paragraphs.
Reverse logistics is a critical success factor in achieving sustainability and the societal transition to a circular economy. The first theme reviews studies that have outlined the importance of data-driven decisions in determining recovery options in closed-loop systems, and their impact on sustainability outcomes. Recent key publications in this area include [30,31], where simulation models were constructed to analyze diverse product recovery strategies and routing optimization and time window scheduling. These studies assess diverse reverse logistics scenarios, integrating algorithms to optimize vehicle routing and scheduling, thus promoting sustainability. Similarly, Giallanza and Puma [32] presented a multi-objective optimization model, employing simulation to evaluate its performance and contrast it with alternative techniques. Özkır and Başlıgil [33] and Homayouni et al. [34] developed models to address uncertainty in reverse logistics processes, with the latter developing a novel heuristic optimization approach that supports decision makers in managing and balancing carbon emission policies in supply chains in complex settings of uncertainty in terms of demand and variable vehicle types. These two studies exemplify the industry’s gravitation towards marrying sustainability with advanced analytical techniques.
The second theme focuses on studies that have developed models to optimize waste management and collection in specific sectors. Most of these studies have focused on the solid waste management, medical and e-waste sectors, with the aim of curbing environmental degradation while optimizing waste management processes in these key sectors. Recent developments in this regard include Ferri et al. [35], who developed a mathematic model for sustainable solid waste management in Brazil and proposed a solid waste handling that involved waste pickers. More recently, Alos et al. [36] conducted assessments of reverse logistics as a strategy within the sustainable solid waste management sector and proffered comprehensive overviews, with the former tackling municipal solid waste management holistically, and the latter dissecting the innovative modes and practices.
Under the same category of waste management, other studies have developed methodologies to enhance medical waste management, underscoring the importance of innovating efficient medical waste management systems. Key developments in this regard include Mantzaras et al. [37] who developed an optimization model to minimize the cost of a collection, haul, transfer, treatment, and disposal system for infectious medical waste (IMW). In a similar regard, Kargar et al. [38] pioneered a linear programming model that embeds multi-objective uncertainty, especially targeting sustainability and environmental criteria. The outbreak of COVID-19 further underscored the need for tailored solutions, leading Tirkolaee et al. [39,40] to present a sustainable fuzzy multi-trip location-routing framework and MILP model tailored to the pandemic’s exigencies.
Other key developments in this area include the introduction of a two-stage stochastic programming model designed to accommodate uncertainties inherent in medical waste management [41]; developing a two-stage optimization model that integrates economic, environmental, and social dimensions into designing a reverse logistics network [42]; and developing mixed-integer models to reduce vehicle dispatch and management costs inherent in medical waste management [1].
Overall, the extant literature on reverse logistics optimization involves the exploration of multifaceted domains such as product recovery options, return policies, inventory control strategies, and the integration of economic and environmental goals. This body of scholarly work gives prominence to the relationships fundamental to decision making within a context where the tenets of sustainability, efficiency, and profitability are intricately interlinked.

3. Research Context and Framework

Reverse logistics optimization plays a pivotal role in facilitating the transition to a circular economy by efficiently recovering resources, minimizing waste, and enhancing sustainability throughout the product lifecycle. However, effectively optimizing reverse logistics, particularly in the context of Industry 5.0, is influenced by the following range of technological, organizational, and decision-making factors [4]. These factors need to be adequately understood to ensure informed strategies are developed and implemented, fostering the seamless integration of advanced technologies, human-centric innovation, and sustainable practices, and thus driving the successful transition to a circular economy.
Technological Advancements: Industry 5.0 is characterized by rapid advancements in technologies such as AI, IoT, and automation. These technologies have the potential to transform reverse logistics processes, enabling real-time tracking, data-driven decision making, and enhanced visibility across the supply chain. However, the ever-evolving nature of these technologies poses challenges in predicting their impact on reverse logistics optimization [43].
Complex and Interconnected Networks: Industry 5.0 fosters highly interconnected and dynamic supply chain networks, involving various stakeholders such as suppliers, manufacturers, distributors, and consumers [44]. The intricate nature of these networks introduces uncertainties and complexities in optimizing reverse logistics, as factors like supply chain structure, collaboration mechanisms, and information exchange play a critical role.
Data Availability and Utilization: Industry 5.0 generates vast amounts of data from various sources, enabling more informed decision making. Leveraging these data for reverse logistics optimization requires advanced data analytics and predictive modeling techniques. However, extracting meaningful insights from big data and translating them into actionable strategies pose challenges [45].
Multi-dimensional Decision Factors: Optimizing reverse logistics entails considering a multitude of factors, including technological feasibility, economic viability, regulatory compliance, stakeholder engagement, and environmental considerations. The interplay and relative importance of these factors vary across industries and supply chains, making it complex to develop a standardized optimization model.
Shift in Mindset and Culture: The Industry 5.0 paradigm emphasizes innovation, efficiency, and sustainability. Achieving effective reverse logistics optimization may require organizations to shift their mindset and embrace circular economy principles, moving away from linear approaches. Predicting the extent to which this shift occurs and influences reverse logistics poses an additional layer of complexity.
In order to address some of the above-mentioned challenges posed by Industry 5.0 [45,46,47], organizations need to pivot towards a more holistic approach. Recognizing the connected nature of technological advancements and human-centric processes, it is clear that there is a pressing need to adapt and evolve. Therefore, emphasis needs to be placed on the reshaping of logistics and operational strategies, with sustainability and efficiency at the forefront.
As identified in Section 1, researchers and practitioners have explored a variety of holistic methodologies to both understand and optimize reverse logistics processes. However, Industry 5.0 supply chains introduce intricate challenges that can hinder effective decision making. The rapid technological advancements, intricate supply chain configurations, and diverse decision factors require a sophisticated approach to optimize reverse logistics flows. Traditional methods fall short in capturing nuanced relationships among variables. Traditional methods, often linear in nature or based on simplified assumptions, may not be suitable for examining the dependencies that exist among the numerous variables in reverse logistics systems. Whether it is the effect of a specific return policy on overall profitability, the ripple effects of an inventory control measure on the entire supply chain, or the symbiotic relationship between product returns and inventory levels, the dynamics are multifaceted. For instance, when considering return policies, the direct relationship between a policy change and profitability might be evident, but there could be secondary or even tertiary effects that can impact the relationship. A stricter return policy might lead to fewer returns and increased short-term profitability, but it could also result in decreased customer satisfaction and, subsequently, reduced long-term customer loyalty. Traditional models might focus only on the immediate financial implications and overlook the longer-term customer relationship dynamics.
Similarly, if we explore inventory control within reverse logistics, the balance between holding costs, restocking, recycling, or disposal, and customer satisfaction is difficult to achieve [48,49]. Traditional methods might provide a snapshot based on current conditions but could miss predicting shifts due to external market changes, technological advancements, or shifts in consumer behavior. In essence, while traditional methods have their merits and have provided foundational insights, the increasing complexity of today’s reverse logistics operations demands more advanced and integrative methodologies. These newer approaches aim to capture the nuanced relationships among variables, offering a more holistic understanding and, thereby, more informed decision-making capabilities.
Against this backdrop, this paper introduces an integrated methodology that synergizes binary logistic regression with decision trees. Binary logistic regression has been widely used to predict binary outcomes based on categorical or binary predictors, offering insights into the relationship between predictors and optimization outcomes [50,51]. Additionally, decision trees have been employed to capture complex patterns and interactions among predictors, providing a comprehensive understanding of decision-making processes [52,53,54]. However, the standalone use of binary logistic regression or decision trees may not fully capture the intricacies of reverse logistics optimization in the Industry 5.0 context. Binary logistic regression may struggle to account for nonlinear relationships among predictors, while decision trees might encounter challenges such as overfitting or limited interpretability. To overcome these limitations and provide a comprehensive framework for predicting and optimizing reverse logistics flows and networks within the Industry 5.0 landscape, the proposed methodology combines binary logistic regression and decision trees in order to harness the strengths of both methods and offer a robust and interpretable framework for researchers and practitioners aiming to enhance reverse logistics practices in the Industry 5.0 era.
The key research questions of the study are as follows:
  • Can a combination of binary logistic regression and decision trees provide a more robust and efficient framework for predicting and optimizing reverse logistics flows? This question seeks to examine the effectiveness of integrating these two methodologies to handle the intricacies of reverse logistics data.
  • What are the practical implications of the proposed integrated methodology in real-world industrial settings? This includes evaluating the methodology’s adaptability, scalability, and effectiveness in different industrial sectors.
Figure 1 represents the conceptual framework for this study. The key variables of the framework are described as follows.
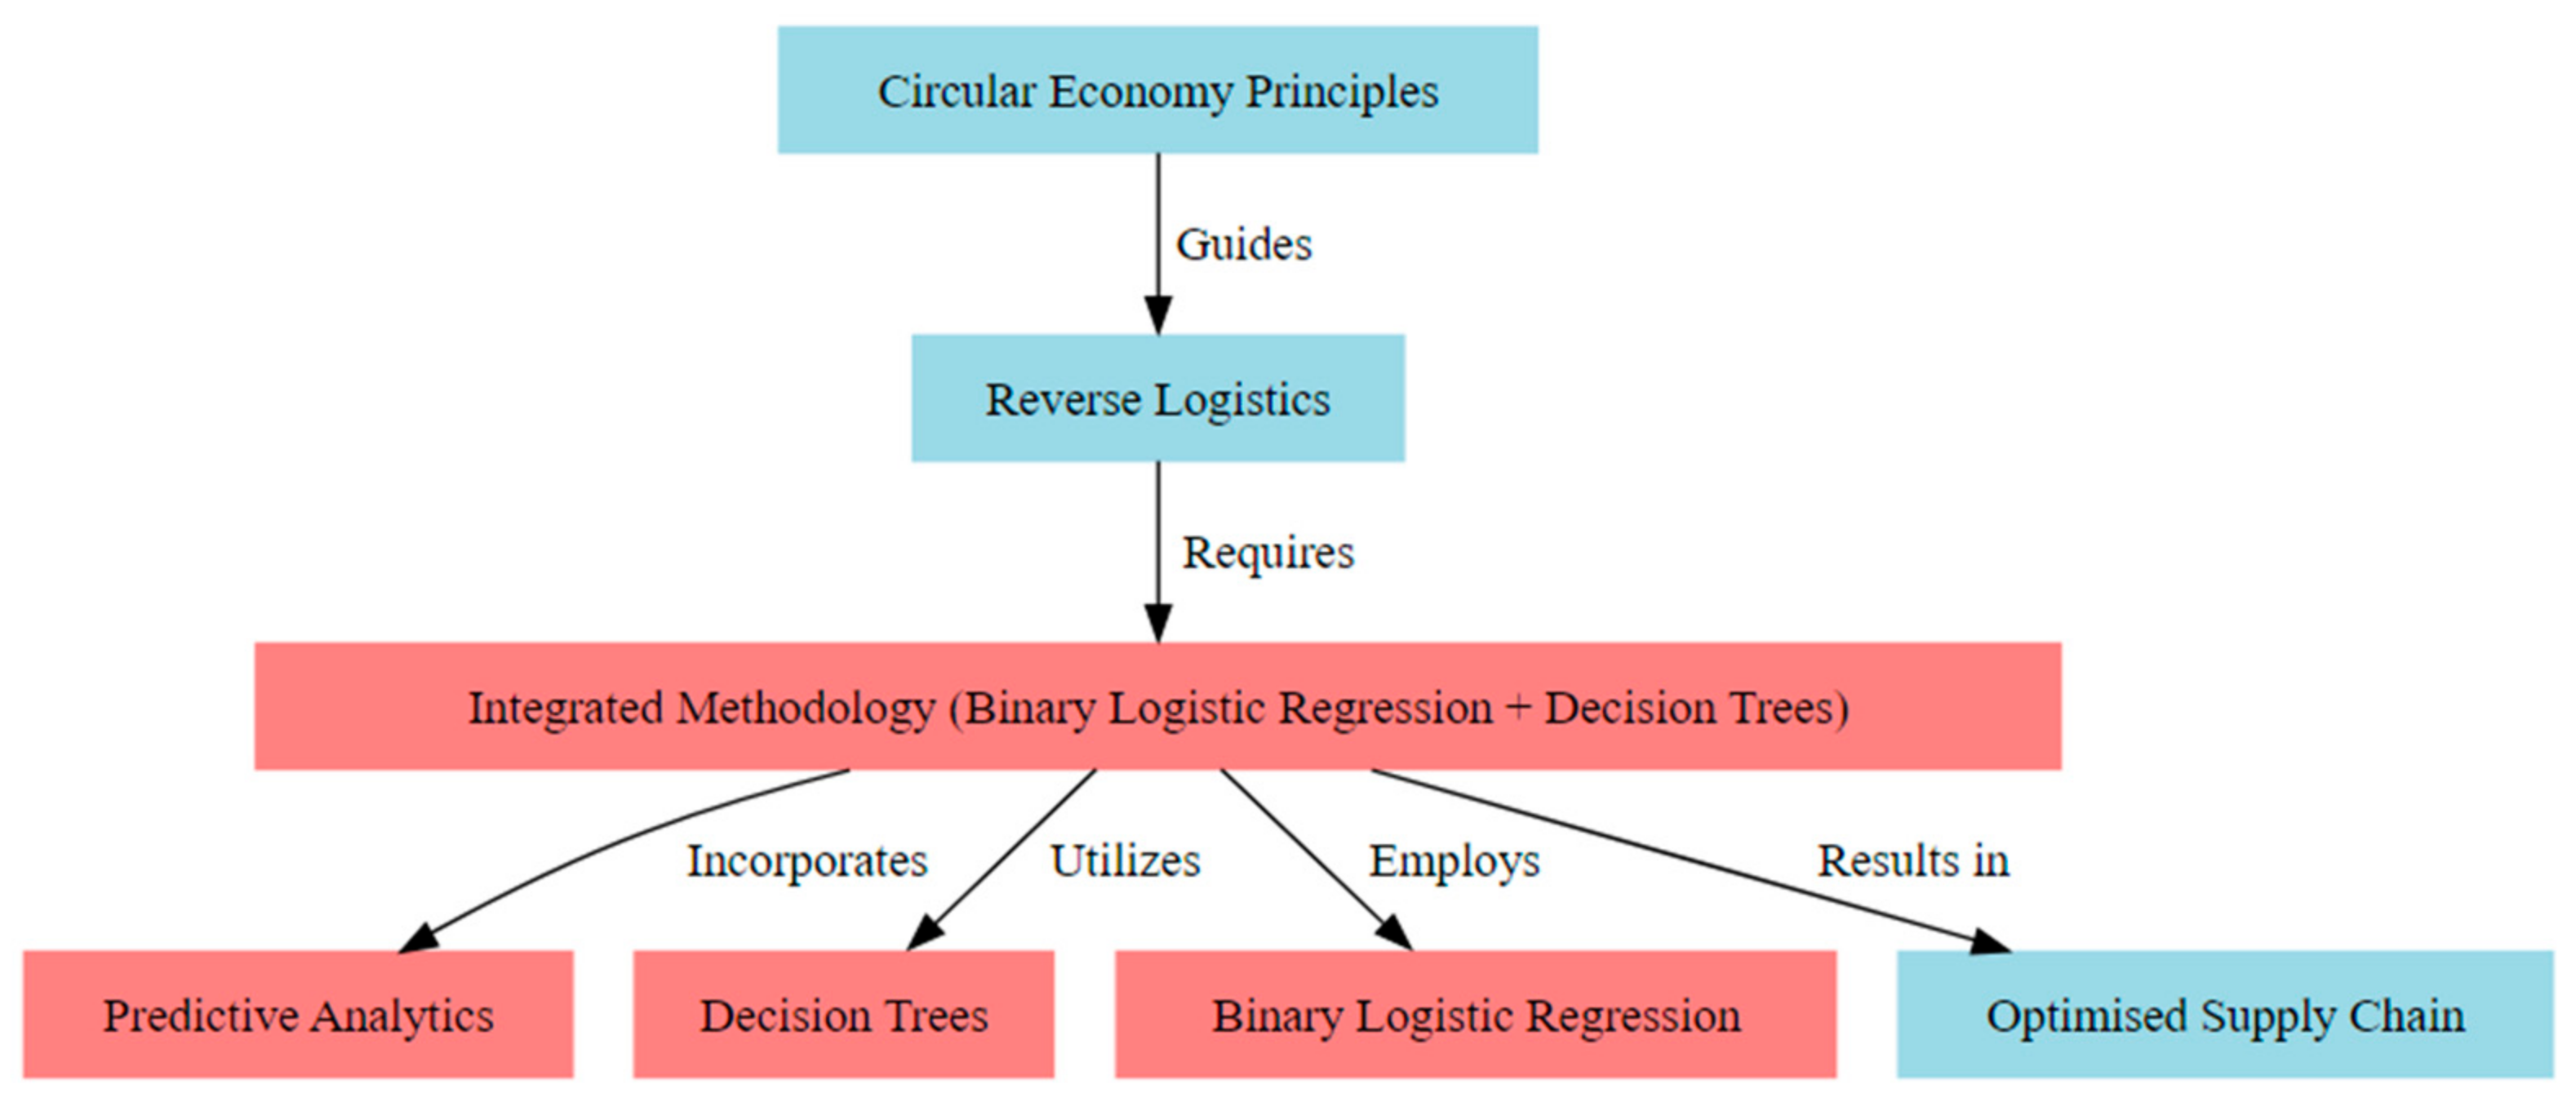
  • Circular Economy Principles (CE): These are the guiding principles that emphasize the importance of resource efficiency, waste reduction, and sustainability in industrial operations. They guide the reverse logistics processes.
  • Reverse Logistics (RL): Central to achieving a circular economy, it addresses product returns, remanufacturing, recycling, and waste reduction. It requires an integrated methodology for optimization.
  • Integrated Methodology (IM): This is the core of the research, combining binary logistic regression and decision trees to predict and optimize reverse logistics flows and networks. It incorporates predictive analytics, utilizes decision trees, and employs binary logistic regression.
  • Predictive Analytics (PA): Leveraging data analytics to forecast returns, optimize inventory management, and reduce waste.
  • Decision Trees (DT): Used to capture complex patterns and interactions among predictors, providing a comprehensive understanding of decision-making processes.
  • Binary Logistic Regression (BLR): Widely used to predict binary outcomes based on categorical or binary predictors, offering insights into the relationship between predictors and optimization outcomes.
  • Optimized Supply Chain (OS): The result of applying the integrated methodology, leading to enhanced operational efficiency and sustainability in the circular economy landscape.
This framework provides a structured overview of how the research integrates various components to enhance reverse logistics flows and networks in the context of the circular economy.
In this paper, the term “optimization” is employed to describe the process of improving the efficiency and effectiveness of reverse logistics within the framework of Industry 5.0. This improvement is not about achieving an absolute extremum (maximum or minimum) in a mathematical sense, but rather enhancing the decision-making process in reverse logistics through more accurate predictions and actionable insights. The key points of clarification are:
  • Probabilistic Decision Making: The logistic regression component of the methodology provides probabilistic predictions based on the input data. This aspect enhances the decision-making process by quantifying the likelihood of different outcomes, thereby aiding organizations in making informed choices about their reverse logistics strategies.
  • Improvement over Extremization: The goal of employing logistic regression in this context is to improve the predictability and reliability of the reverse logistics process. It is about enhancing the accuracy of predicting the optimal pathways for returned products (recycle, refurbish, dispose), rather than seeking to extremize any variable or outcome.
  • Comprehensive Approach to Optimization: The integrated methodology aims at a holistic improvement of reverse logistics processes. This encompasses not just predictive accuracy but also encompasses aspects like resource allocation efficiency, waste reduction, and alignment with sustainability goals, which are crucial in the context of a circular economy.
  • Practical Application: The focus of the methodology is on practical application in the real world. The term “optimization” is therefore used in a more applied and pragmatic sense, referring to the enhancement of operational processes in reverse logistics, rather than a strict mathematical optimization process.
  • Adaptability and Evolution: The methodology is designed to be adaptable and evolve over time. As new data become available or as the dynamics of the reverse logistics process change, the models can be updated and refined, leading to continuous improvement or “optimization” in their application.

4. Methodology

The integrated methodology combines decision tree analysis and binary logistic regression to enhance data-driven decision making in reverse logistics. This approach aims to address the complexity of decision making in reverse logistics in context of Industry 5.0 by identifying influential predictors, capturing nonlinear relationships, and providing quantifiable insights. The synergy of decision tree analysis—discerning key predictors—and binary logistic regression—quantifying and predicting relationships—empowers practitioners and decision makers with a comprehensive toolkit. Therefore, it is pertinent to examine how these methodologies, both individually and in combination, have been previously utilized across different fields. The standalone applications and the combined approach offer a rich background against which the novel application in reverse logistics can be evaluated.
Binary logistic regression, a staple in predictive modeling where the outcome is binary, is used across various sectors. Its application in reverse logistics has been explored by [55] in studying customer behavior towards purchasing remanufactured goods and by [56] in understanding factors that predict recycling behavior in Malaysia. More recent studies focus on predicting product returns as is suggested by the study of Tüylü and Eroğlu [57], which explores the use of machine learning algorithms for forecasting product return rates in the textile industry. While their study did not specifically employ logistic regression, the methodology’s relevance in predicting binary outcomes, such as the likelihood of product returns, is implicit.
On the other hand, decision trees have been recognized for their robustness in handling complex and nonlinear relationships in datasets. This attribute was highlighted in the study by Lickert et al. [58], which examined the selection of suitable machine learning algorithms for classification tasks in reverse logistics. Here, decision trees were presented as a viable option among other machine learning techniques, showcasing their applicability in managing the complexities and unpredictabilities inherent in reverse logistics processes.
The integration of binary logistic regression and decision trees has been utilized largely in the banking sector. The study by Dumitrescu et al. [59] serves as a prime example of this integration. Their work on enhancing logistic regression with decision-tree-based nonlinear effects in credit scoring illustrates the synergistic potential of combining these two methodologies. The resulting Penalized Logistic Tree Regression (PLTR) method demonstrated a marked improvement in predictive accuracy over traditional logistic regression models, underlining the effectiveness of this integrated approach.
Despite the success in banking applications, the adoption of this combined methodology in reverse logistics remains novel. This gap in application presents an opportunity for future research. Reverse logistics, characterized by its complex and uncertain data, stands to benefit significantly from an integrated approach that combines the predictive clarity of logistic regression with the nuanced data segmentation capabilities of decision trees. The proposed study aims to leverage this combined methodology to tackle key challenges in reverse logistics, such as predicting return rates and optimizing return processes.
The potential impact of this application is numerous. By enhancing predictive accuracy, this integrated approach could improve how businesses plan and manage their reverse logistics operations, leading to more efficient resource allocation and potentially significant cost reductions. Furthermore, the ability to capture and analyze nonlinear relationships in reverse logistics data could highlight new insights, leading to more informed decision making and strategic planning.
Combining logistic regression and decision trees can be performed in various ways, but one common approach is to use decision trees for feature transformation and then apply logistic regression on the transformed features [60]. This methodology has previously been used and validated by Szymasnki [61].
Feature transformation refers to the process of modifying and engineering the raw data attributes (features) to enhance the performance of the predictive models of the binary logistic regression and decision trees. Table 3 provides a breakdown of feature transformation in the context of the proposed integrated methodology.
The proposed method of utilizing feature transformation and then applying logistic regression on the transformed features is often referred to as model stacking or ensemble learning and is developed as follows.
  • Decision Trees for Feature Transformation
Given a dataset with features X = { x 1 ,   x 2 ,   ,   x n } and target variable y, the decision tree (or a set of decision trees) is trained on the data. For each instance in the dataset, the decision tree will assign it to a particular leaf node. The leaf node assignments can be used as new binary features. If an instance ends up in a particular leaf, the corresponding feature is set to 1; otherwise, it is set to 0. Let us say we have m leaf nodes in the decision tree. Our transformed dataset will then have m binary features Z = { z 1 ,   z 2 ,   ,   z m } .
b.
Logistic Regression on Transformed Features
Once the dataset is transformed with features Z, a logistic regression model is trained on it. The logistic regression model is given by:
P ( y = 1 Z = 1 1 + e ( β 0 + β 1 z 1 + β 2 z 2 + + β m z m ) ) ,
where:
  • P(y = 1∣Z) is the probability of the target variable y being 1 given the features Z. β0, β1, …, βm are the parameters of the logistic regression model.
c.
Final Model
The final model first applies the decision tree to transform the original features X into the binary features Z. Then, it applies the logistic regression model on Z to get the probability P(y = 1∣Z).

4.1. Application Scenarios

To demonstrate the use and relevance of the proposed integrated methodology, we consider two hypothetical scenarios that can be encountered as part of reverse logistics within an Industry 5.0 context.

4.1.1. Technological Influence

This scenario aims to evaluate the impact of integrating different technological attributes on the optimization of reverse logistics flows.
  • IoT Integration: The Internet of Things (IoT) offers the real-time tracking and monitoring of products throughout their lifecycle. By embedding sensors and smart tags, companies can gain insights into when a product is nearing its end-of-life or when it is malfunctioning. This proactive approach can streamline the return process, ensuring timely refurbishment or recycling.
Equation Example: Let Pr be the probability of a product return. With IoT data, the logistic regression model might look as follows. Illustrating the methodology’s applicability, two hypothetical scenarios are explored:
P r = 1 1 + e a + b 1 × IoT _ data
where:
  • a is the intercept;
  • b1 is the coefficient for the IoT data;
  • e is the base of natural logarithms.
    • AI Utilization: Artificial Intelligence (AI) can predict return patterns by analyzing historical data. Machine learning models can forecast which products are more likely to be returned based on factors like purchase history, customer feedback, and product type.
    • Blockchain Adoption: Blockchain can enhance transparency and traceability in reverse logistics. By maintaining a decentralized ledger of all transactions, stakeholders can verify and audit product returns without intermediaries, ensuring authenticity and reducing fraudulent returns.

4.1.2. Joint Influences

Investigating how the joint effects of supply chain configuration (Decentralized SCC) and organizational characteristics (Proactive OC) influence the success of reverse logistics optimization.
This scenario considers the combined effects of supply chain configuration and organizational characteristics on reverse logistics optimization. The interaction between these factors can influence the efficiency and effectiveness of return processes.
  • Supply Chain Configuration (SCC): The design and structure of a supply chain can impact reverse logistics [62]. For instance, a centralized supply chain might have a single return center, which can be efficient for bulk processing but might be slower due to transportation times. On the other hand, a decentralized supply chain might have multiple return centers, offering quicker processing but potentially higher management complexity.
  • Organizational Characteristics (OC): The culture, policies, and strategies of an organization can influence its approach to reverse logistics. A proactive organization might invest in advanced return management systems, offer easy return policies to customers, and prioritize sustainability by promoting recycling and refurbishment.
By examining these joint influences, industries can make informed decisions on structuring their supply chains and shaping their organizational strategies to optimize reverse logistics in alignment with the principles of a circular economy.

4.2. Application Case Examples

Example 1: Electronics Manufacturer’s Reverse Logistics—An electronics manufacturer produces various products, including smartphones, laptops, and tablets. Over time, consumers return these products for various reasons: defects, end-of-life, upgrades, etc. The manufacturer aims to optimize its reverse logistics process to decide whether a returned product should be recycled, refurbished, or disposed of. These are the core steps that need to be taken to use the integrated methodology.
  • Data Collection
The manufacturer collects the following data on each returned product.
  • Product Type: Smartphone, Laptop, Tablet;
  • Return Reason: Defect, End-of-Life, Upgrade;
  • Product Age: In months;
  • Physical Condition: Graded from 1 (Poor) to 5 (Excellent);
  • Functional Condition: Working, Not Working;
  • Outcome: Recycled, Refurbished, Disposed.
  • Decision Trees for Feature Transformation
Using the collected data, a decision tree is trained. The tree might find patterns like:
  • Most end-of-life smartphones that are not working are recycled.
  • Laptops returned due to defects and are in excellent physical condition are often refurbished.
From the decision tree, binary features Z = { z 1 ,   z 2 , ,   z m } are derived based on leaf node assignments.
  • Logistic Regression on Transformed Features
For simplicity, we consider predicting the probability of a product being recyclable. Using the transformed features
Z, the logistic regression model is:
P ( Recycled Z = 1 1 + e ( β 0 + β 1 z 1 + β 2 z 2 + + β m z m ) )
Application instance is provided below:
A consumer returns a 24-month-old smartphone due to an upgrade. The phone is in good physical condition (Grade 4) but is not working.
  • The decision tree assigns this instance to a particular leaf node, say z5;
  • Using the logistic regression model, the probability of this smartphone being recyclable is calculated. If P(Recycled∣Z = 1) is high, the manufacturer will opt to recycle the smartphone.
This scenario demonstrates how the integrated methodology can be applied to real-life settings. By combining decision trees and logistic regression, the electronics manufacturer can make informed decisions about the optimal pathways for returned products, leading to sustainable and cost-effective operations.

5. Application

The schematic in Figure 2 provides a step-by-step visual representation of the integrated methodology’s workflow. It emphasizes the sequential and iterative nature of the process, highlighting the relationships between different steps and the importance of continuous feedback and improvement.
In Figure 2, solid arrows represent the sequential flow of the process. They indicate the order in which each step should be executed. Dashed arrows indicate feedback loops or iterative processes. They show that the outcome of one step can influence the beginning of another, leading to continuous improvement and refinement.
The relationship between the variables in Figure 2 is explained in the following 10-step process.
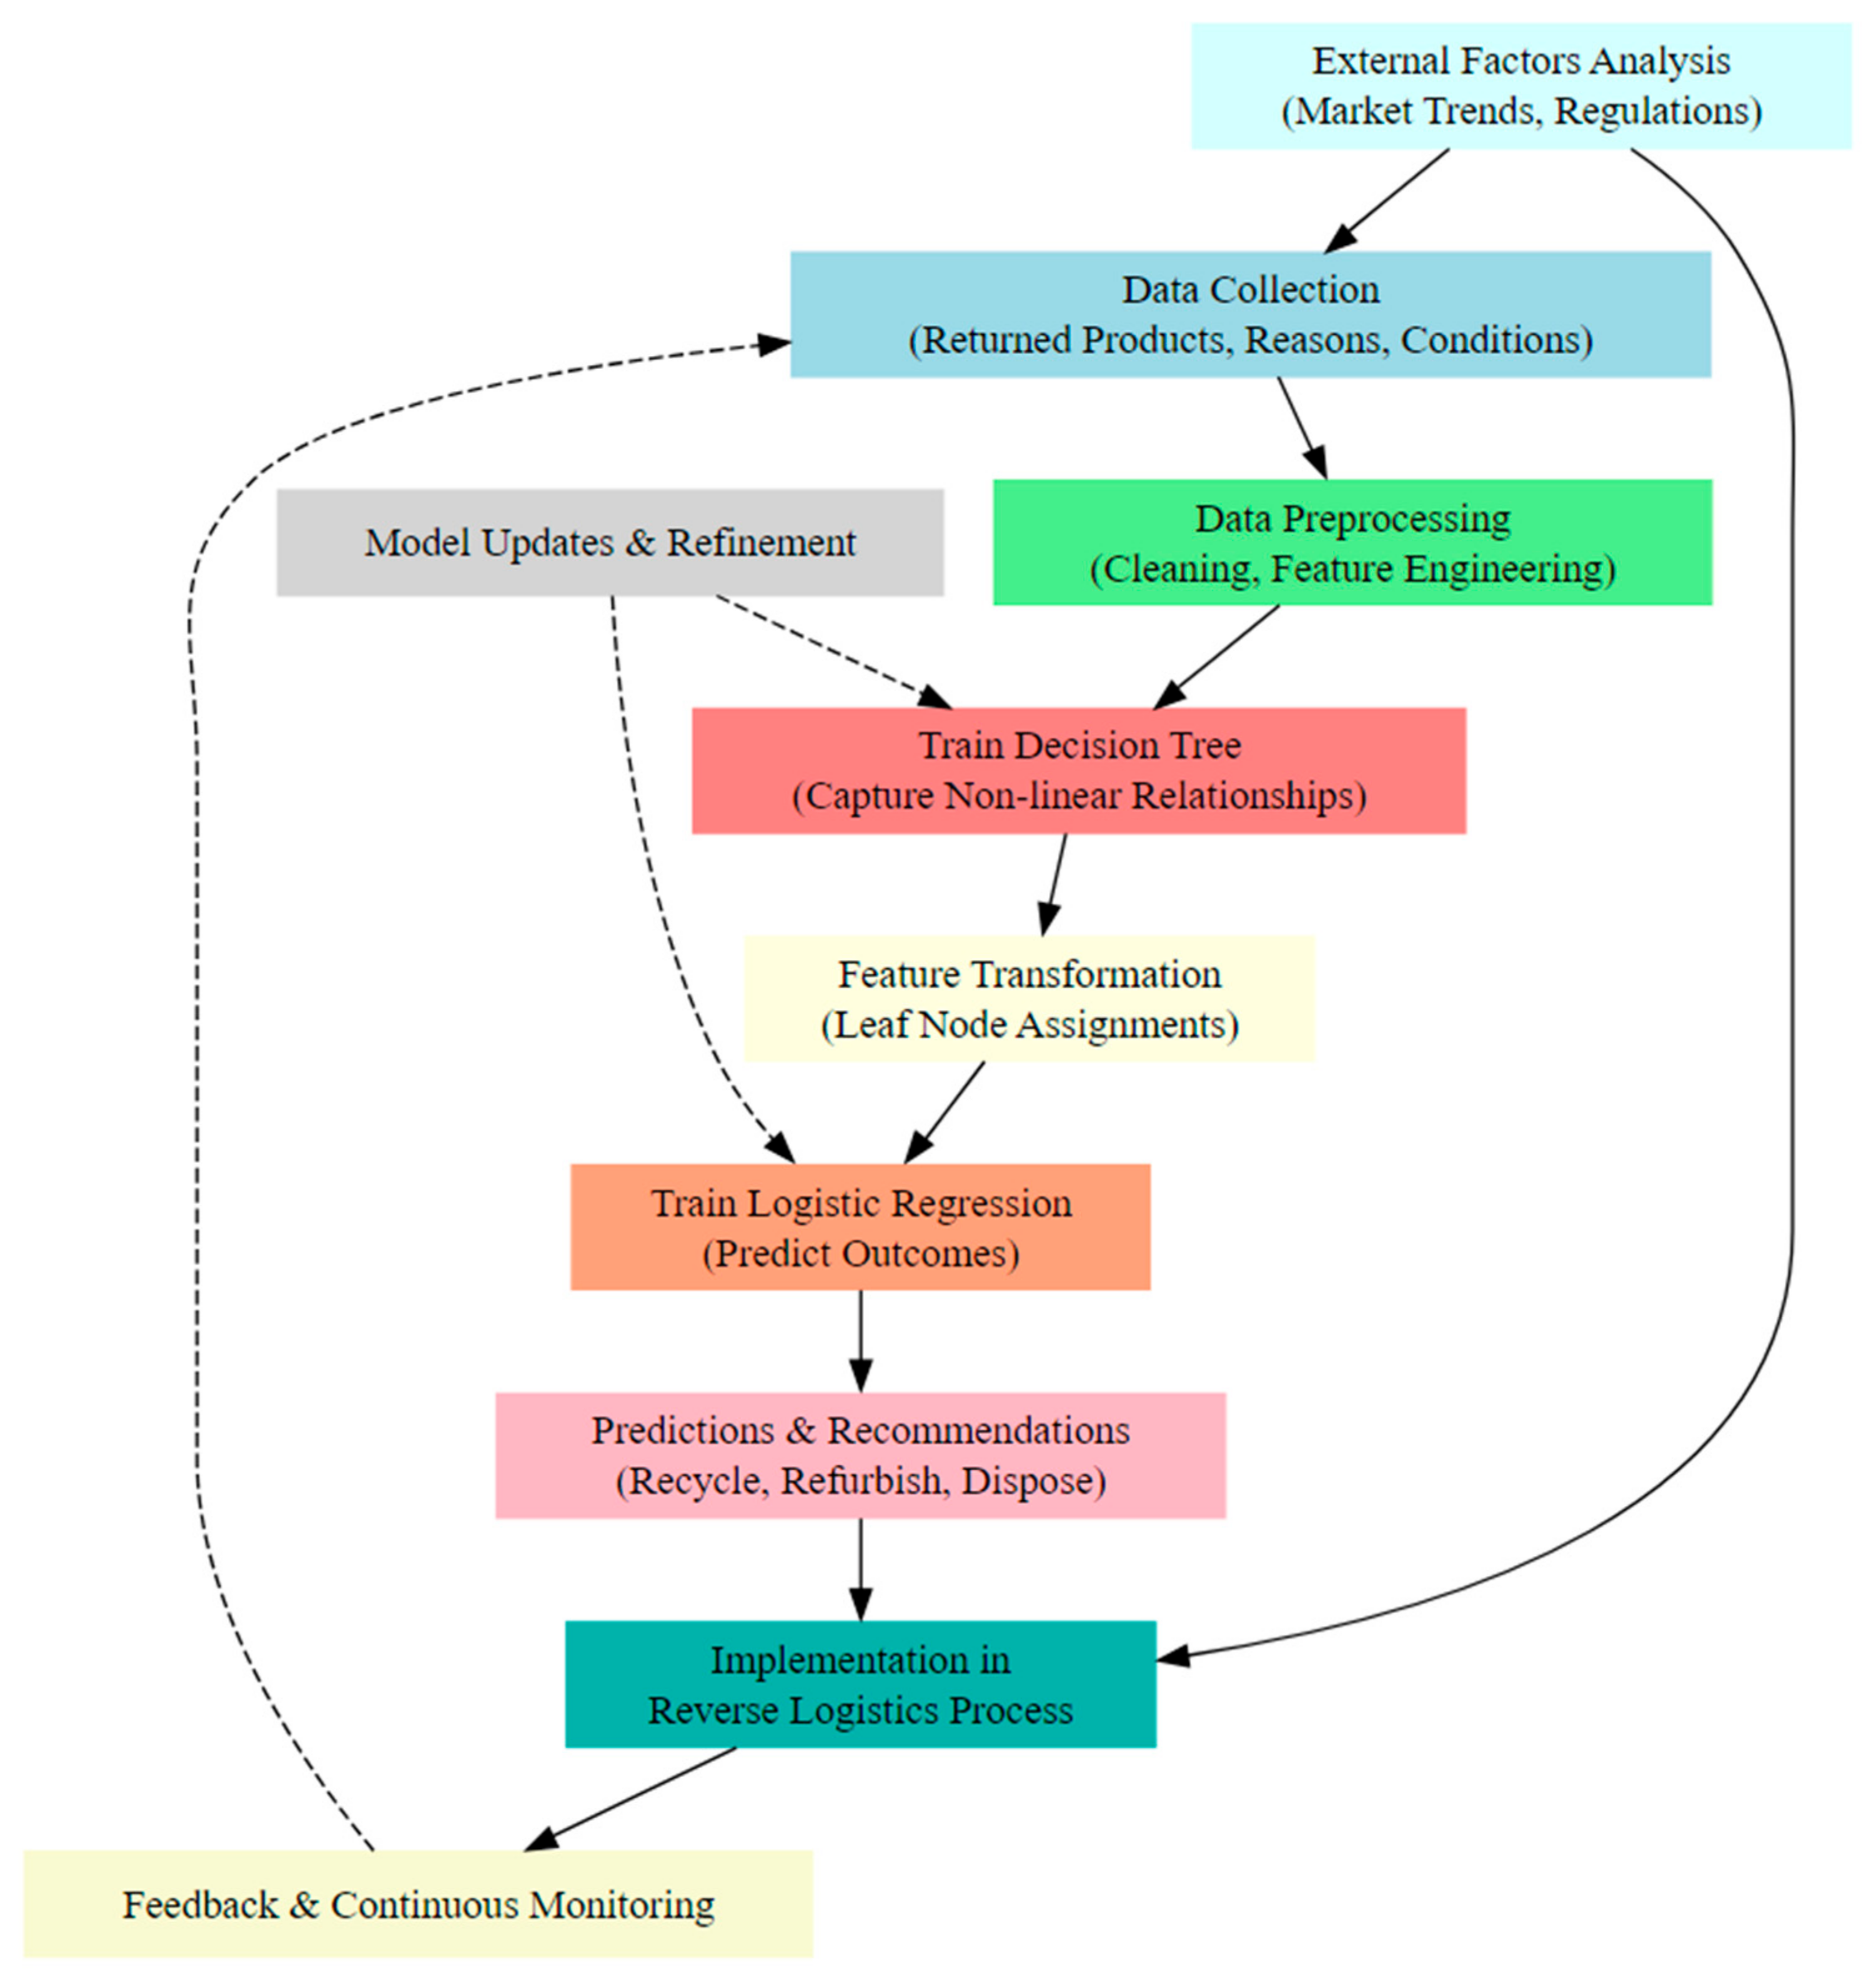
  • Data Collection → Data Pre-processing: After gathering the necessary data, the next step is to pre-process it. This relationship indicates that raw data need to be cleaned and transformed before they can be used for modeling.
  • Data Pre-processing → Train Decision Tree: Once the data are pre-processed, they are used to train a decision tree. This relationship emphasizes the importance of clean data for effective modeling.
  • Train Decision Tree → Feature Transformation: The decision tree’s structure and leaf node assignments are used to transform the original features. This relationship highlights the integration of decision tree outcomes into the next modeling step.
  • Feature Transformation → Train Logistic Regression: The transformed features serve as inputs for the logistic regression model. This relationship shows the sequential nature of the integrated methodology.
  • Train Logistic Regression → Predictions and Recommendations: After training, the logistic regression model is used to make predictions and provide recommendations. This relationship underscores the model’s practical application.
  • Predictions and Recommendations → Implementation in Reverse Logistics Process: The model’s recommendations are then implemented in the reverse logistics process. This relationship emphasizes the action-oriented nature of the model’s outcomes.
  • Implementation in Reverse Logistics Process → Feedback and Continuous Monitoring: After implementing the recommendations, the outcomes are continuously monitored, and feedback is gathered. This relationship indicates the importance of tracking the effectiveness of the implemented decisions.
  • Feedback and Continuous Monitoring → Data Collection (Dashed Arrow): Feedback from the monitoring process can lead to new data collection, refining the initial data set and improving model accuracy. This relationship represents the iterative nature of the process.
  • External Factors Analysis → Data Collection and Implementation in Reverse Logistics Process: External factors can influence both the data collection process and the implementation of decisions. These relationships highlight the importance of considering external market trends, regulations, and other factors.
  • Model Updates and Refinement (Dashed Arrows to Train Decision Tree and Train Logistic Regression): The model is regularly updated and refined based on new data and feedback. These relationships emphasize the iterative nature of model training and the importance of continuous improvement.

6. Case Study

This section demonstrates a practical application of our integrated methodology in a service-based case. Generally, publicly available datasets are very difficult to obtain and often have too few variables. However, we’ve obtained an open-source dataset from an online banking campaign. The dataset had already been cleansed, sorted and oversampled (due to small frequency) using the SMOTE technique [61]. This makes it appropriate for this application.
Case study 1—Optimizing Returns Management in Online Banking Services: An online banking institution is facing challenges in managing customer returns or cancellations of their financial products (such as loans, credit cards, or investment products). These returns/cancellations are costly and affect the bank’s profitability. The institution aims to predict the likelihood of a return/cancellation to optimize its reverse logistics process, which includes handling customer inquiries, processing returns, and managing inventory of financial products.
Objective: The bank seeks to develop and implement a predictive model capable of accurately identifying customers who are at a higher risk of returning or canceling their subscribed financial products. By achieving this, the bank aims to proactively address customer concerns, thereby improving satisfaction levels and concurrently reducing the costs and operational challenges associated with reverse logistics.
Data Utilization: The data utilized capture various customer-related and economic features. This includes demographics (like age), previous banking interactions, and economic indicators (Euribor 3-month rate, consumer confidence index, etc.). The target variable y represents whether a customer has returned/cancelled a product (1) or not (0).
Methodology: The bank applies the integrated methodology combining binary logistic regression and decision trees. This approach leverages the strengths of both methods in predicting customer behavior and segmenting the customer base effectively.
Application and Testing: The methodology is applied in the following 3 steps. Details of the model coding are provided in the Appendix A.
  • Step 1—Feature Transformation Using Decision Trees: The decision tree algorithm is applied to the dataset to identify patterns and relationships within the features. Decision trees work by making sequential, hierarchical decisions about the data, effectively splitting it into branches and leaves based on feature values.
    • Leaf Node Assignments: Each data point (customer in this case) ends up in a leaf node, and these assignments become new features. Essentially, the path a data point takes through the tree (which leaf it ends up in) becomes a concise summary of its characteristics.
    • Purpose of step: This step simplifies complex relationships in the data, making it easier to identify unique groups or patterns that are significant for predicting returns or cancellations in banking products and services.
  • Step 2—Binary Logistic Regression on Transformed Features: The new features created from the decision tree (leaf node assignments) are used as input for a logistic regression model.
    • Predictive Modeling: The logistic regression model calculates the probability using the logistic function. This process assigns each instance in the dataset to a particular leaf node, which is then used as a new binary feature in the logistic regression model. The logistic regression model is then applied to these transformed features. The model learns the coefficients during the training process, which are used to calculate the probability of each class. For a given instance with features, the probability of it being in class “1” (i.e., return/cancellation) is calculated using the logistic function.
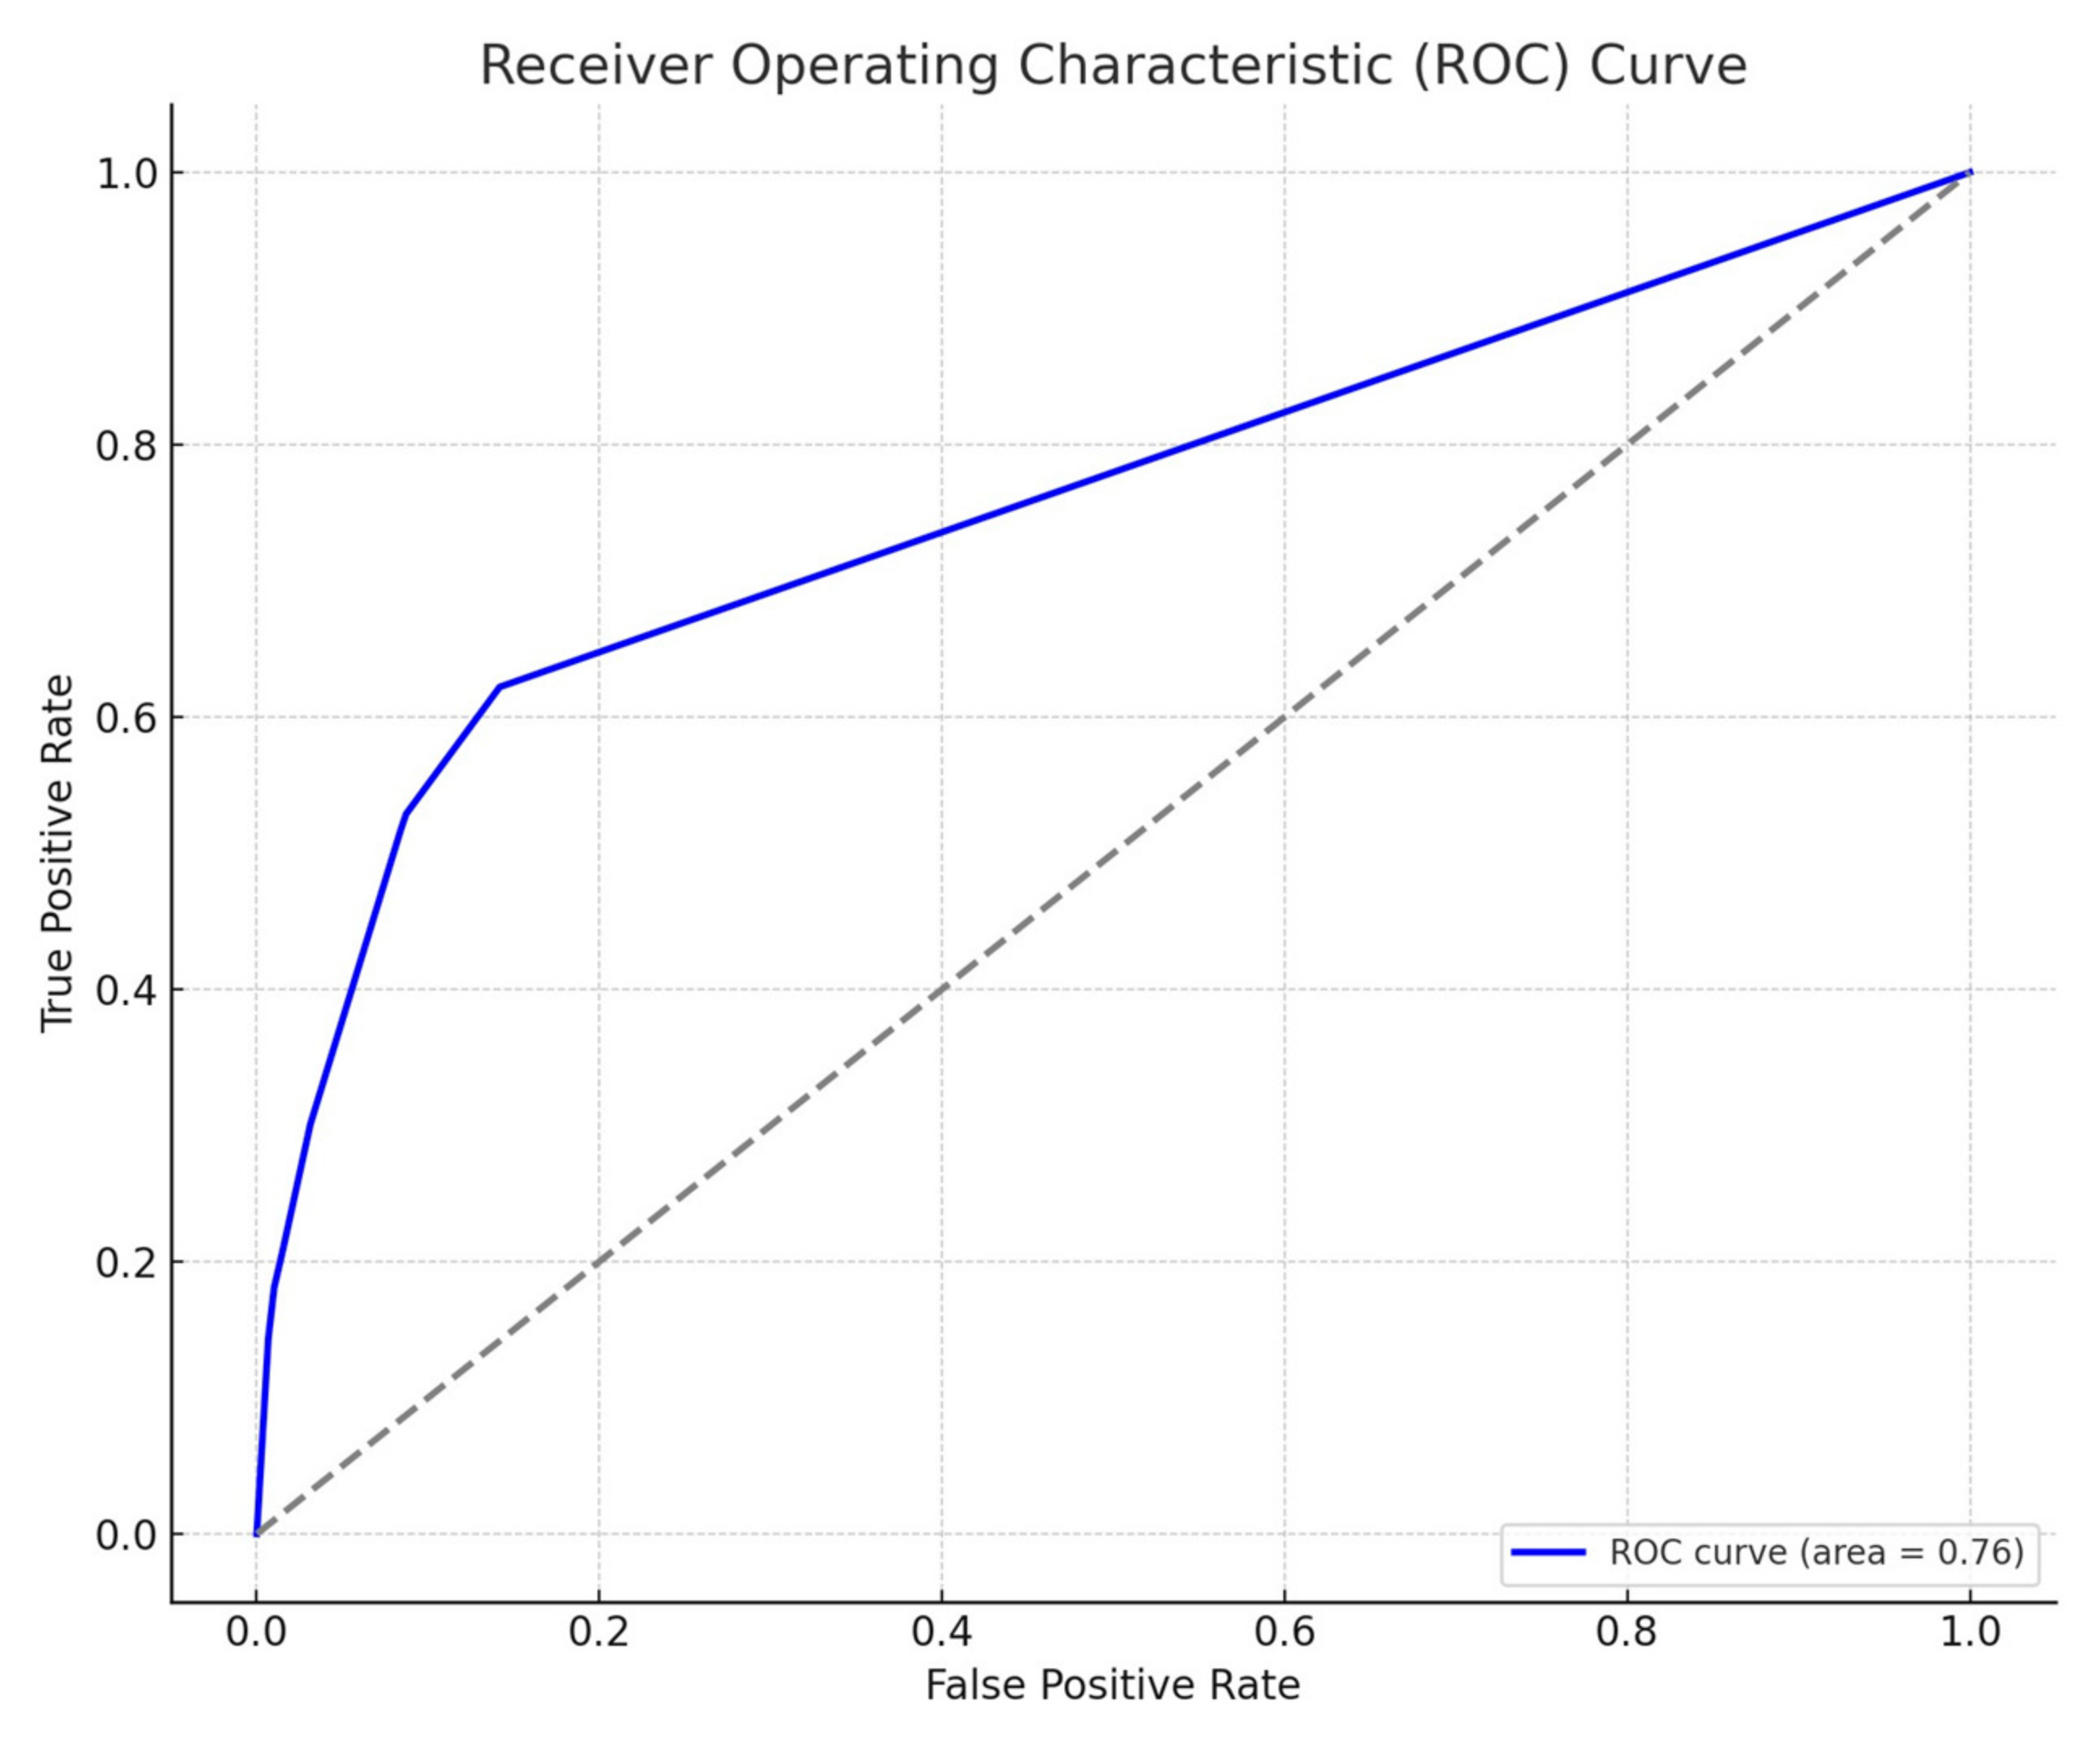
    • Model Evaluation: The Receiver Operating Characteristic (ROC) curve is a graphical plot that illustrates the diagnostic ability of a binary classifier system as its discrimination threshold is varied. It plots the true positive rate (TPR) against the false positive rate (FPR), providing insight into the trade-off between benefit (true positives) and cost (false positives).
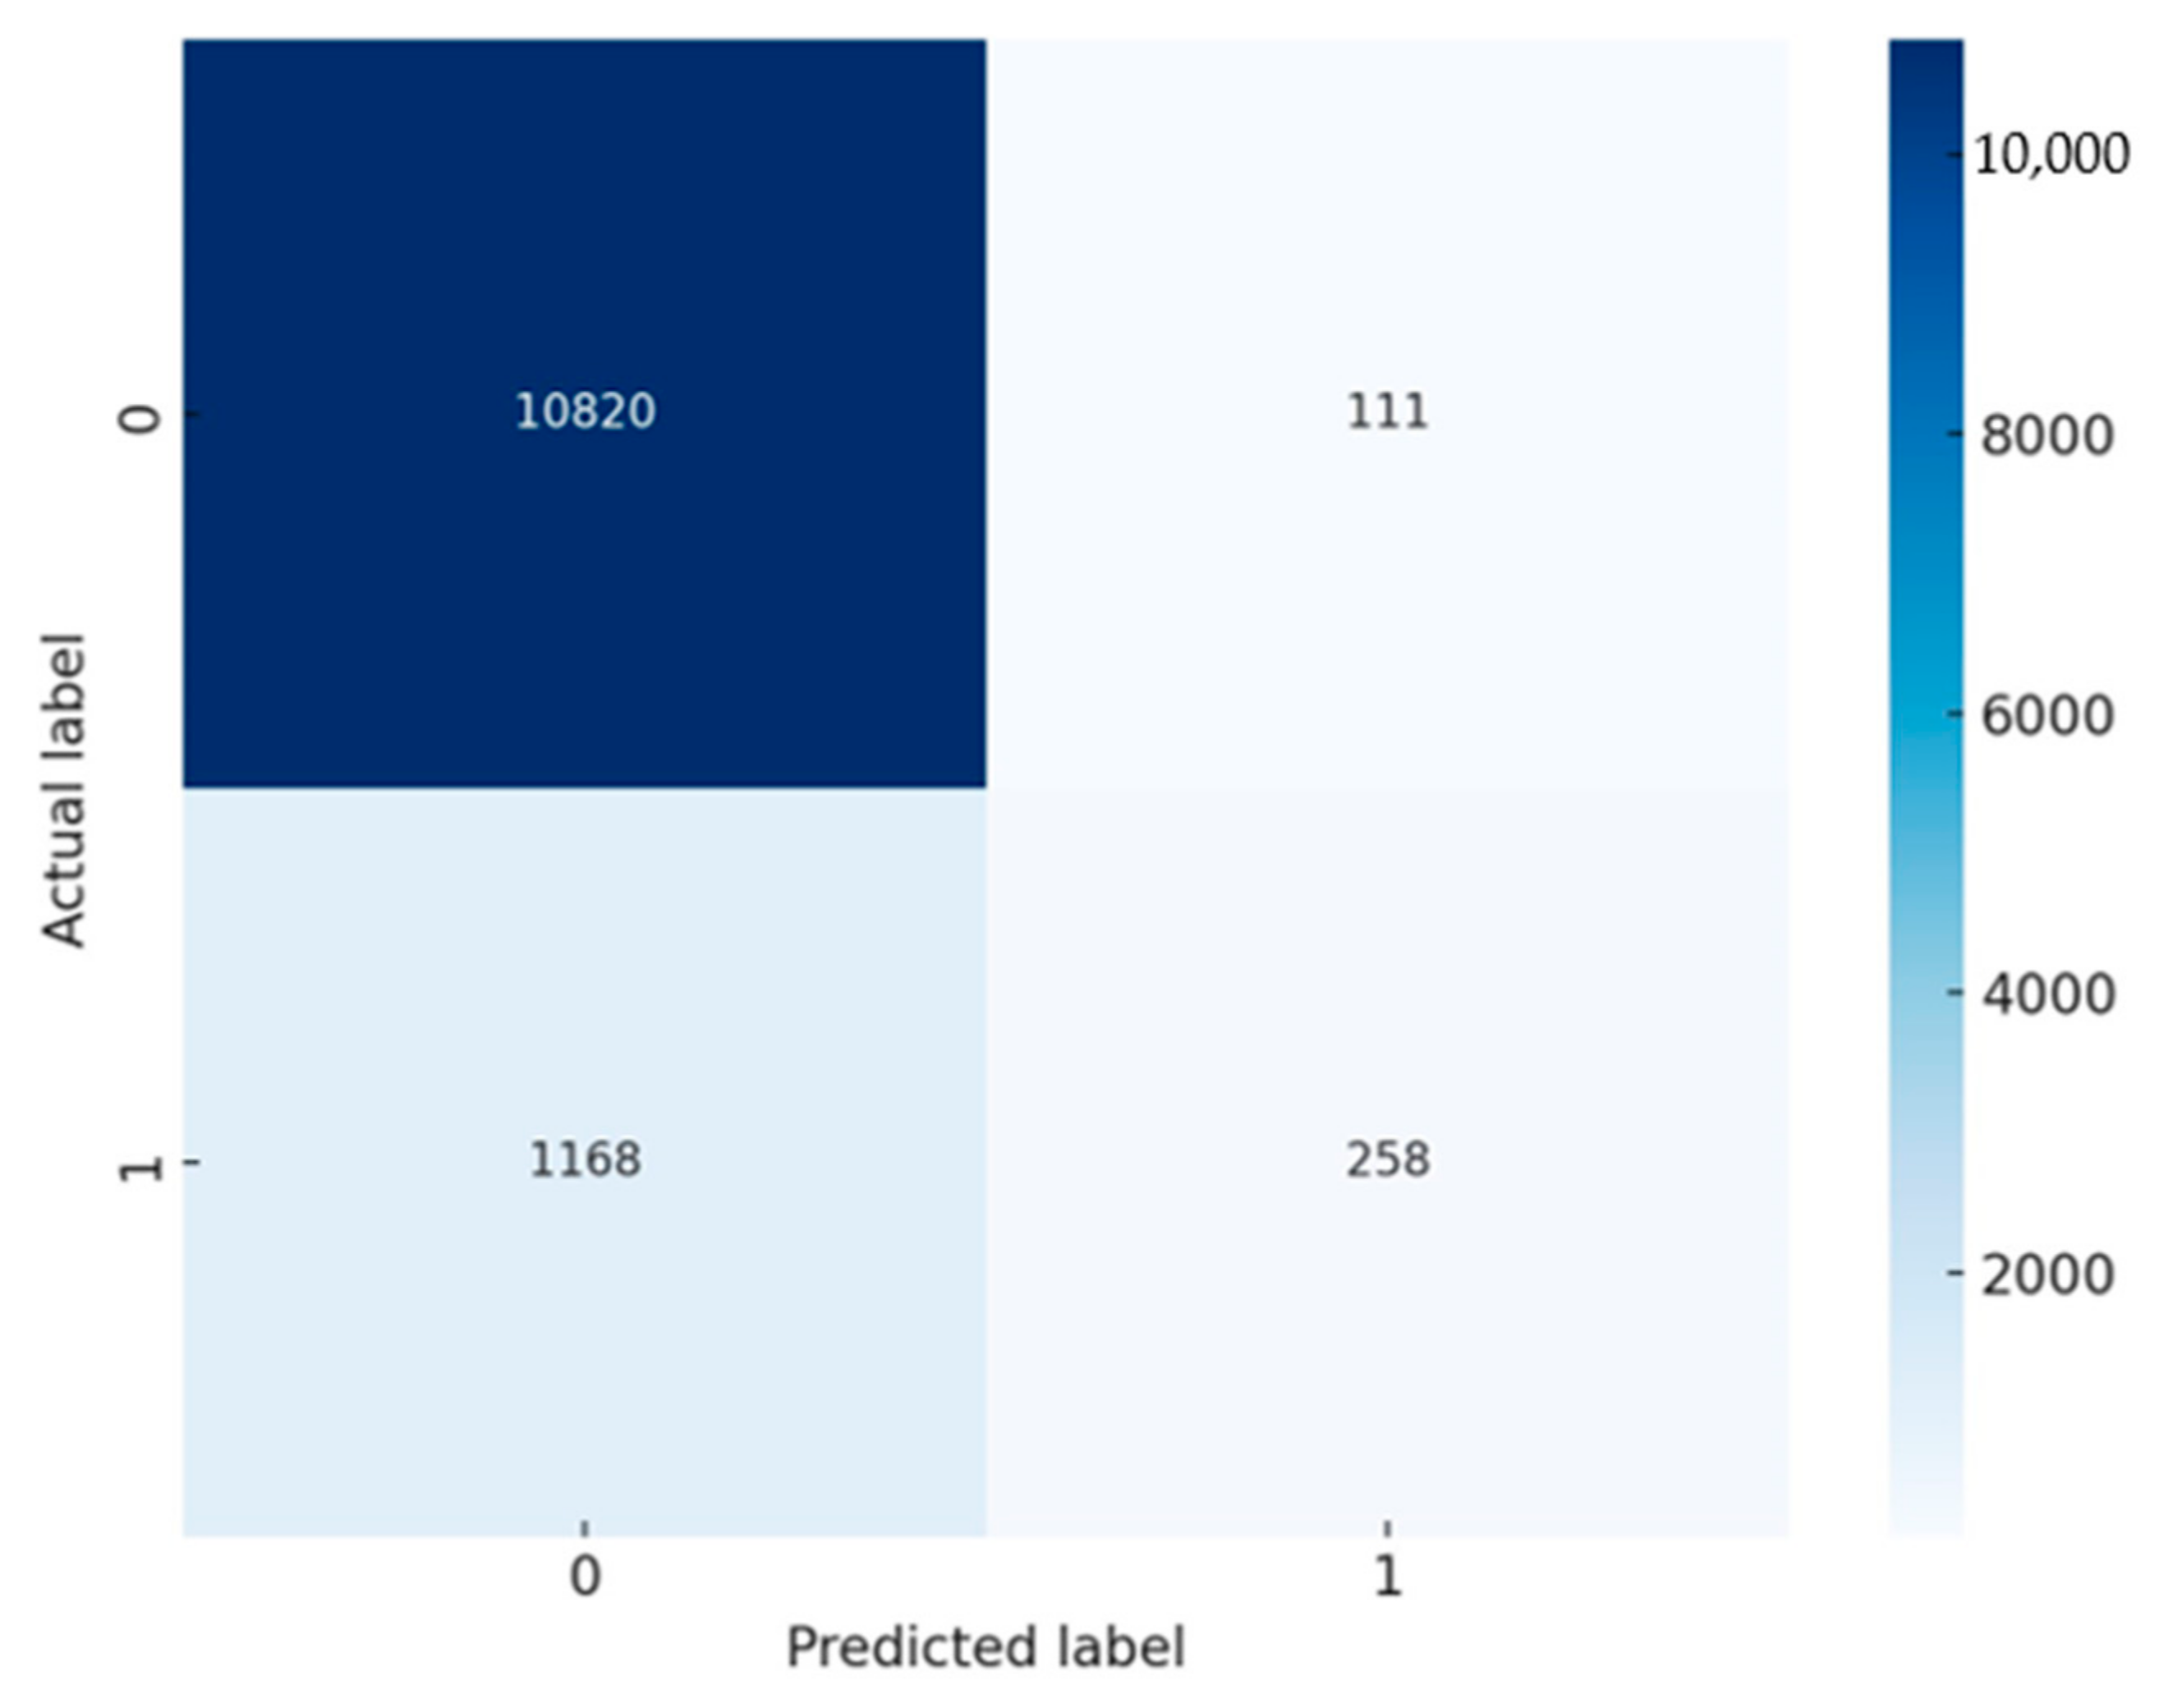
    • Confusion Matrices: A confusion matrix is a table used to describe the performance of a classification model on a set of test data for which the true values are known. It allows the visualization of the performance of an algorithm, showing the actual vs. predicted classifications.
  • Step 3—Interpretation for Reverse Logistics Optimization: By examining the ROC curve and confusion matrix, we can understand how well the model distinguishes between customers likely to return or cancel a product and those who are not. These insights can identify patterns or characteristics common among customers who return or cancel products.
    • Application: The bank can use these insights to proactively address issues leading to returns or cancellations, tailor their services to reduce such instances, and improve overall customer satisfaction and retention. It can also aid in the efficient allocation of resources for managing returns and cancellations, reducing operational costs, and improving profitability.
    • Continuous Improvement: The results from the model can be used to refine strategies continuously. For instance, understanding which features or customer segments are more prone to returns can guide more targeted customer engagement strategies or product improvements.
  • Results of applying the integrated methodology:
The ROC curve in Figure 3 illustrates the performance of the logistic regression model. The y-axis represents the true positive rate (also known as recall or sensitivity), which measures the proportion of actual positives (customers who did return/cancel a product) that are correctly identified by the model. The TPR is calculated as TP/(TP + FN), where TP is the number of true positives and FN is the number of false negatives.
The x-axis represents the false positive rate, which measures the proportion of actual negatives (customers who did not return/cancel a product) that are incorrectly identified as positives by the model. The FPR is calculated as FP/(FP + TN), where FP is the number of false positives and TN is the number of true negatives.
The area under the curve (AUC) is a measure of the model’s ability to distinguish between the two classes (in this case, whether a customer will return/cancel a product or not). An AUC close to 1 indicates a very good model, while an AUC close to 0.5 suggests no discriminative power. The AUC score in Figure 3 is 0.76, as indicated in the legend. This score is a single scalar value that summarizes the overall performance of the model regardless of the decision threshold. An AUC of 0.76 suggests that the model has good discriminative power and is much better than random guessing.
The implications for the ROC curve are as follows.
Model Discrimination: With an AUC of 0.76, the logistic regression model is considered to have a good ability to discriminate between customers who will return/cancel a product and those who will not. This level of performance is quite satisfactory for many practical applications.
Threshold Selection: The bank can use the ROC curve to select an appropriate threshold that balances the TPR and FPR according to their operational objectives. For example, if the bank wants to minimize the risk of missing returns/cancellations, they may choose a threshold that maximizes the TPR, even if it increases the FPR.
Risk Management: The ROC curve does not show the costs of false positives or false negatives, which are critical in the banking context. The bank must consider the cost–benefit trade-off of different thresholds to implement a cost-effective strategy.
Overall, the ROC curve suggests that the binary logistic regression model is a useful tool for the bank to predict product returns/cancellations. However, the bank must consider additional factors such as the cost of interventions and customer experience when deciding how to act on the model’s predictions.
Model Performance Evaluation: It is very important to evaluate the performance of the combined model. Performance is typically evaluated using metrics like accuracy, precision, recall, and the F1 score. In this case, confusion matrices were used to show the number of true positives, true negatives, false positives, and false negatives. Figure 4 shows the confusion matrix for the logistic regression model. The results are interpreted as follows.
True negatives (TNs, top-left, 10,820): The model correctly predicted “no return/cancellation” for 10,820 customers. This indicates that for a large majority, the logistic regression model successfully identified customers who continued with their banking product without cancellation.
False positives (FPs, top-right, 111): In 111 cases, the model incorrectly predicted that customers would cancel or return the product, but they did not. These are Type I errors that could lead to unnecessary follow-up actions by the bank, potentially wasting resources.
False negatives (FNs, bottom-left, 1168): The model failed to identify 1168 customers who actually did return or cancel their product. These Type II errors are particularly significant because they represent missed opportunities for the bank to intervene and potentially retain the customer.
True positives (TPs, bottom-right, 258): The model correctly identified 258 customers who returned or canceled their product. While this shows the model’s ability to detect true return/cancellation cases, it may also indicate room for improvement given the number of false negatives.
  • Step 4—Interpretation of Reverse Logistics Optimization
Analyzing the model’s performance, the ROC curve provided compelling evidence of its robust capability to distinguish between customers likely to return or cancel products and those who are not. The high AUC value underlined the model’s effectiveness in capturing high-risk customer profiles. Simultaneously, the confusion matrix offered a detailed breakdown of the model’s predictive accuracy. The high rates of true positives (TPs) and true negatives (TNs) gleaned from the matrix were particularly beneficial. The TPs enabled the bank to pinpoint at-risk customers for targeted intervention, while the TNs assured efficient resource allocation, avoiding unnecessary expenditure on low-risk customers.
The implications of the model extended beyond customer risk identification. Accurately pinpointing customers likely to return or cancel products allowed the bank to engage these customers proactively, offering tailored services or incentives to enhance satisfaction and retention. Moreover, addressing the false negatives, representing missed opportunities for customer engagement was crucial. These instances, if not managed properly, could lead to customer dissatisfaction, impacting the bank’s reputation and customer loyalty.
There are numerous other implications and actionable insights for the Bank. These include the following.
  • Resource Allocation: Understanding the model’s performance helps in strategically allocating resources. For instance, customers identified as high risk (TPs) can be targeted with personalized communication, loyalty programs, or customized financial advice to prevent churn.
  • Process Improvement: Patterns identified from TP and FN can shed light on specific product features or customer service aspects that may be leading to dissatisfaction. These insights are valuable for driving process improvements and product enhancements.
  • Customer Relationship Management: Accurate TN predictions allow the bank to maintain regular engagement strategies without additional investment, while FPs, though not ideal, can be seen as opportunities to strengthen customer relationships.
  • Risk Mitigation Strategies: The bank can develop specialized risk mitigation strategies for different customer segments based on the model’s findings, thereby enhancing the overall efficiency of its reverse logistics processes.
  • Continuous Monitoring and Model Refinement: The insights gained from the model’s current performance should feed into a cycle of continuous improvement, where the model is regularly updated and refined with new data and customer feedback.
The utility of this integrated methodology transcends the banking sector, proving beneficial in various reverse logistics scenarios across different industries. For instance, in the electronics manufacturing sector, it can predict product returns due to defects or obsolescence. This prediction enables manufacturers to refine product design, enhance quality control, and offer better post-purchase support. Similarly, in retail and e-commerce, the methodology could forecast product returns, and inform inventory management, return policy adjustments, and marketing strategies aimed at reducing return rates.
When compared to standalone methods like traditional logistic regression or decision trees, the integrated approach is better at capturing complex, nonlinear relationships in data. This synergy between decision trees and logistic regression leads to more nuanced customer behavior understanding and, consequently, more accurate predictions. Although some advanced machine learning techniques might offer higher accuracy, they often lack the interpretability crucial for making strategic business decisions. In this respect, the integrated methodology stands out, providing actionable insights along with a robust predictive performance. It is this balance of interpretability and accuracy, coupled with its scalability and adaptability to various sectors, that underscores the methodology’s versatility and potential to enhance operational efficiencies and customer satisfaction across many industries.
In summary, the model’s insights not only aid in immediate tactical decisions to manage returns and cancellations but also provide strategic value in enhancing customer satisfaction, optimizing operational processes, and ultimately contributing to the bank’s profitability and reputation.

7. Implications and Future Directions

The integrated methodology, as proposed in this paper, offers a new approach to understanding the complexities of reverse logistics in the context of a circular economy and Industry 5.0. The methodology possesses numerous merits, as outlined in the following points.
  • Complexity of Reverse Logistics Data: Reverse logistics data often encompass a multitude of variables, including product type, return reason, product condition, etc. A single model might not capture the intricate relationships and interactions among these variables. The combination of decision trees for feature transformation and logistic regression for prediction offers a robust approach to handle this complexity.
  • Nonlinear Relationships: Decision trees are adept at capturing nonlinear relationships and interactions between features. By transforming the original features into a format that highlights these relationships, the subsequent logistic regression model can make more accurate predictions.
  • Interpretability: Decision trees provide a visual and intuitive representation of the decision-making process. This makes it easier for stakeholders to understand and trust the model’s recommendations. On the other hand, logistic regression offers a probabilistic perspective, allowing decision makers to quantify the likelihood of different outcomes.
  • Flexibility: This integrated methodology is adaptable. As new data become available or as the dynamics of the reverse logistics process change, the models can be updated and refined to reflect these changes.
  • Optimization of Resources: By accurately predicting the optimal pathway for returned products (recycle, refurbish, dispose), resources can be allocated more efficiently, leading to cost savings and reduced environmental impact.
  • Ensemble Learning Benefits: Combining multiple models often results in better performance than relying on a single model. This ensemble approach can lead to improved predictive accuracy and generalization to new, unseen data.
  • Alignment with Circular Economy Principles: The circular economy emphasizes resource optimization, waste reduction, and sustainability. By optimizing reverse logistics processes, this methodology directly supports these principles, ensuring that products and materials are reused, recycled, or refurbished to the maximum extent possible.
  • Competitive Advantage: Implementing an advanced and integrated methodology can provide companies with a competitive edge. Efficient reverse logistics can lead to enhanced customer satisfaction, reduced costs, and a stronger brand image centered on sustainability.
  • Scalability: As the volume of returned products grows, traditional decision-making processes might become overwhelmed. This methodology offers a scalable solution that can handle large datasets and provide timely recommendations.
  • Risk Mitigation: By accurately predicting the best course of action for returned products, companies can mitigate risks associated with inventory build-up, environmental penalties, and customer dissatisfaction.
The key offering of the proposed integrated methodology is its predictive and explanatory capabilities. Using historical data, binary logistic regression can deliver a probabilistic understanding that aligns with past patterns and trends. Complimentary to this, decision trees can provide clear, hierarchical representation of decisions, resulting in transparent and applicable insights. Moreover, the adaptability and flexibility inherent in this approach make it applicable to diverse scenarios or evolving business objectives. From a computational standpoint, this methodology is also notably efficient, especially when juxtaposed against complex simulations or certain AI-driven techniques. Ultimately, by pinpointing influential predictors and adeptly modeling their relationships, this integrated methodology not only offers foresight into impending reverse logistics challenges but also equips organizations with actionable insights for strategic planning and realignment. Additionally, the proposed methodology can enable a deeper understanding of influential predictors and their impact, facilitate proactive decision making, and thereby enhance operational efficiency and sustainability. The key beneficiaries and the nature of these benefits include:
  • Businesses: Organizations engaged in manufacturing and supply chain operations stand to gain significantly from this methodology. By optimizing reverse logistics processes, businesses can achieve cost savings, enhance operational efficiency, and reduce environmental impact. The ability to predict the optimal pathway for returned products enables better resource allocation and waste management, directly contributing to bottom-line improvements and sustainability goals.
  • Customers and End-users: Customers benefit from more efficient and sustainable business practices. Efficient reverse logistics processes can lead to enhanced customer satisfaction, particularly when dealing with returns and recalls. Moreover, a commitment to sustainability and reduced environmental impact enhances brand perception, fostering customer loyalty.
  • Supply Chain Managers and Decision Makers: This group gains a powerful tool for strategic planning and risk mitigation. The methodology’s predictive capabilities offer valuable insights into future challenges and opportunities in reverse logistics, aiding in proactive decision making. This results in more effective management of inventory, reduced risks of environmental penalties, and improved customer relations.
  • Environmental Advocacy Groups and Regulatory Bodies: By aligning with the principles of the circular economy, the methodology supports global efforts towards sustainability. The reduction in waste and more efficient use of resources contribute to broader environmental goals, earning the support of environmental advocates and meeting regulatory standards.
  • Researchers and Academics: The methodology presents a fertile ground for further research, particularly in refining its application with real-world data and integrating advanced machine learning techniques. Academics can explore its scalability and adaptability across different industries and supply chain scenarios.
  • Technology Developers and Data Scientists: Professionals in these fields can explore the integration of more complex AI-driven techniques, enhancing the model’s performance. The methodology also presents opportunities for developing user-friendly interfaces and custom solutions tailored to specific industry needs.
  • Society at Large: As businesses adopt more sustainable practices, the broader societal benefits include reduced environmental degradation and a move towards a more sustainable circular economy model. This contributes to the overall well-being and health of communities and ecosystems.
  • Investors and Stakeholders: For investors and stakeholders in companies that adopt this methodology, the benefits include enhanced company valuation due to improved efficiency, sustainability practices, and potentially higher returns on investment due to cost savings and improved market position.
By understanding the implications and potential gains from the integrated methodology, stakeholders can better appreciate its value and integrate it into their strategic planning, operational processes, and sustainability initiatives. This approach not only drives economic gains but also aligns with the urgent need for sustainable business practices in the modern world. However, it is worth noting that the examples and applications of the integrated methodology given in the paper are oversimplified. In practice, there are many nuances and considerations, especially when it comes to tuning hyperparameters, handling overfitting, and ensuring model interpretability. As such, further research is needed to refine the methodology, incorporate real-world data, and validate its practical implementation. The following points suggest areas of future research.
  • Model Refinement with Real-World Data: While the proposed methodology offers a robust framework, its validation with diverse real-world datasets can further refine its predictive accuracy. Future research can focus on applying the methodology across various industries and geographies to understand its universal applicability.
  • Incorporation of Advanced Machine Learning Techniques: The integration of more advanced machine learning techniques, such as neural networks or support vector machines, can be explored to enhance the model’s performance, especially in capturing complex nonlinear relationships.
  • Temporal Analysis: Investigating the methodology’s performance over time, especially in rapidly changing supply chain environments, can provide insights into its adaptability and long-term relevance.
  • Comparative Studies: A comparative analysis of the integrated methodology with other predictive models can offer a deeper understanding of its strengths and potential areas of improvement.
  • Integration with Other Supply Chain Processes: Exploring the methodology’s applicability in other areas of the supply chain, beyond reverse logistics, can broaden its scope and utility.
  • Environmental and Social Impact Assessment: Future research can delve into quantifying the environmental and social benefits of optimized reverse logistics processes achieved through the methodology, aligning with the broader goals of the circular economy.
  • Stakeholder Engagement and Acceptance: Understanding the perceptions and acceptance levels of various stakeholders, from supply chain managers to end consumers, can provide insights into the methodology’s practical implementation challenges and strategies to overcome them.
  • Economic Impact Analysis: A detailed economic analysis can be conducted to quantify the cost savings, return on investment, and overall economic impact of implementing the integrated methodology in real-world scenarios.
  • Customization and Personalization: Exploring ways to customize the methodology based on specific industry needs or company sizes (e.g., SMEs vs. large corporations) can make it more versatile and user-friendly.
  • Regulatory and Ethical Considerations: As data-driven decision making becomes more prevalent, understanding the regulatory landscape and ethical considerations associated with data usage, especially in the context of reverse logistics, will be crucial.
By pursuing these directions, researchers can further enhance the integrated methodology’s relevance, applicability, and impact, driving forward the goals of efficient reverse logistics and a sustainable circular economy.

8. Conclusions

In the dynamic landscape of Industry 5.0, the successful management of reverse logistics flows require a robust approach that can extract insights from complex data interactions. The integration of decision tree analysis and binary logistic regression aims to empower data-driven decision making in Industry 5.0 reverse logistics. The methodology’s output—conceptual insights—has the potential to provide actionable recommendations for practitioners to optimize reverse logistics flows. The results can help prioritize key decision factors but also guide the allocation of resources and strategic planning. As such, this paper’s integrated methodology bridges the gap between intricate supply chain dynamics and informed decision making by offering a strategic tool to navigate the complexities of Industry 5.0 and achieve optimized reverse logistics flows, driving sustainability and operational excellence. The methodology’s alignment with sustainability goals and its potential for cost savings provide a strong justification for its adoption. A future study related to this research could entail the application of the proposed methodology to a series of real-world case studies, not only to further emphasize the validity of the proposed framework, but also to inform pertinent policy development and guidelines at the organizational, sectoral, and regional levels.

Author Contributions

Conceptualization, A.-A.A.D.; methodology, A.-A.A.D.; validation, A.-A.A.D. and A.H.-F.; formal analysis, A.-A.A.D.; investigation, A.-A.A.D.; resources, A.-A.A.D. and A.H.-F.; data curation, A.-A.A.D.; writing—original draft preparation, A.-A.A.D. and A.H.-F.; writing—review and editing, A.-A.A.D. and A.H.-F.; visualization, A.-A.A.D.; supervision, A.H.-F.; project administration, A.-A.A.D. and A.H.-F.; funding acquisition, A.H.-F. All authors have read and agreed to the published version of the manuscript.

Funding

This research received no external funding.

Data Availability Statement

Data available in a publicly accessible repository that does not issue DOIs. Publicly available datasets were analyzed in this study. This data can be found here: [https://github.com/AndrzejSzymanski/TDS/blob/master/banking.csv] (accessed on 6 December 2023).

Conflicts of Interest

The authors declare no conflict of interest.

Appendix A

Here is an explanation of each column and notation used in Table A1:
Node ID: This is a unique identifier for each node in the decision tree. Nodes are numbered starting from the root (0) and increasing as you move down the tree.
Feature: This column names the feature (variable) that is used to split the data at a particular node. It is the criterion for deciding which path to follow down the tree. For leaf nodes (end nodes where a prediction is made), this column indicates “Leaf node” because no further splitting occurs.
Threshold: This is the value of the feature at which the split is made. If the feature’s value for a sample is less than or equal to this threshold, the sample moves to the left child node; otherwise, it moves to the right child node. Leaf nodes do not have a threshold since no decision is required.
Left Child Node ID: This is the Node ID of the child node that a sample will move to if it meets the condition specified in the Feature/Threshold columns. For leaf nodes, this is indicated as NaN (Not a Number) because leaf nodes do not have children.
Right Child Node ID: This is the Node ID of the child node that a sample would move to if it does not meet the condition in the Feature/Threshold columns. Similar to the left child node, this is NaN for leaf nodes.
Leaf Node Prediction: This column shows the prediction made at a leaf node. In the context of a binary classification problem like ours, the predictions are typically 0 or 1, where 0 represents “No Return” (the customer is not predicted to return or cancel the product), and 1 represents “Return” (the customer is predicted to return or cancel the product). For non-leaf nodes, this column is NaN because predictions are only made at the leaf nodes.
NaN: Stands for “Not a Number” and is used to denote missing or undefined values, such as for the Threshold in leaf nodes or the child nodes for leaf nodes.
<= (less than or equal to): This is used in the decision rule at each node. If the sample’s feature value is less than or equal to the threshold, it follows the left branch.
> (greater than): If the sample’s feature value is greater than the threshold, it follows the right branch.
Table A1. Definition of variables.
NotationDefinition
XSet of independent variables or features in the dataset.
yDependent variable or target outcome to be predicted.
osOversampling technique (SMOTE) used for balancing the dataset.
X_train, X_testTraining and testing subsets of the independent variables X.
y_train, y_testTraining and testing subsets of the dependent variable y.
dtDecision tree model used for segmentation and prediction.
y_predPredicted outcomes of the model.
roc_auc_scorePerformance metric measuring the model’s ability to distinguish between classes.
PrProbability of a specific event occurring.
β0, β1, …, βmParameters or coefficients of the logistic regression model.
eBase of the natural logarithm, used in logistic regression formulas.
ZTransformed feature set derived from the decision tree’s leaf node assignments.
SMOTESynthetic Minority Over-sampling Technique for balancing an imbalanced dataset.
nodesNew categorical variable derived from the decision tree’s node assignments.
dfDataFrame representing the structured data table used for analysis.
df_nDataFrame containing dummy variables from the “nodes” categorical variable.
lr0, lr1Different logistic regression models: lr0 might exclude decision tree nodes; lr1 includes them.
InitList of initial features used in logistic regression before including decision tree node dummies.
ModelLift0, ModelLift1Results from model lift analysis for different models. ModelLift0 refers to the model without decision tree nodes; ModelLift1 refers to that with nodes.
Accordingly, Table A2 presents:
Table A2. Text-based representation of the decision tree’s logic, summarizing how the model makes decisions based on the input features to arrive at a prediction.
Node IDFeatureThresholdLeft Child Node IDRight Child Node IDLeaf Node Prediction
2euribor3m−1.67074934NaN
3Leaf nodeNaNNaNNaN0 (No Return)
4Leaf nodeNaNNaNNaN0 (No Return)
5nr_employed−2.02816067NaN
6Leaf nodeNaNNaNNaN1 (Return)
7Leaf nodeNaNNaNNaN1 (Return)
8cons_conf_idx−1.328265912NaN
9euribor3m−1.2988681011NaN
10Leaf nodeNaNNaNNaN0 (No Return)
11Leaf nodeNaNNaNNaN0 (No Return)
12pdays−5.0879161314NaN
13Leaf nodeNaNNaNNaN0 (No Return)
14Leaf nodeNaNNaNNaN0 (No Return)
  • Feature Transformation Using Decision Trees
  • Code Explanation:
We used a DecisionTreeClassifier to fit the model on the training data (X_train, y_train).
The decision tree model finds patterns in the data and uses these patterns to split the data into various “leaf nodes”.
After training, the apply method of the decision tree is used to transform the dataset. Each sample in the dataset is assigned to a leaf node, and these assignments are used as new features.
The python code for this step is as follows:
Logistics 07 00097 i001
Equations:
The decision tree internally makes decisions based on a series of inequalities, like ≤threshold xi ≤ threshold, where xi is a feature. Each leaf node represents a subset of the data satisfying these inequalities.
b.
Binary Logistic Regression on Transformed Features
  • Code Explanation:
The transformed features are one-hot encoded to convert them into a format suitable for logistic regression.
A Logistic Regression model is then trained on these encoded features.
The python code for this step is as follows:
Logistics 07 00097 i002
Equations:
The logistic regression model uses the equation: (=1∣) = 11 +− (0 + 11 + ⋯ +) P(y = 1∣X) = 1 + e − (β0 + β1 x1 + ⋯ + βn xn )1 where (=1∣) P(y = 1∣X) is the probability of the event occurring (return/cancellation in our case), and 0, 1, …, β0, β1, …, βn are the model parameters.
c.
Visualization—ROC Curve
  • Code Explanation:
We calculate the true positive rate (TPR) and false positive rate (FPR) for various thresholds.
These rates are then used to plot the ROC curve.
The python code for this step is as follows:
Logistics 07 00097 i003
Equations and Concepts:
TPR (sensitivity): +TP + FNTP
FPR: +FP + TNFP
The ROC curve plots TPR against FPR at different threshold settings.
d.
Visualization—Confusion Matrix
  • Code Explanation:
A confusion matrix is a table used to describe the performance of a classification model.
We use seaborn’s heatmap function to visualize the confusion matrix.
The python code for this stage is as follows:
Logistics 07 00097 i004
Concepts:
The matrix contains four types of outcomes: true positives (TPs), true negatives (TNs), false positives (FPs), and false negatives (FNs).
These steps and visualizations collectively offer a comprehensive understanding of the model’s performance and its practical implications in the context of the case study. The ROC curve provides insights into the model’s ability to distinguish between classes, and the confusion matrix offers a detailed breakdown of the model’s predictions.

References

  1. Zhang, X.; Zou, B.; Feng, Z.; Wang, Y.; Yan, W. A Review on Remanufacturing Reverse Logistics Network Design and Model Optimization. Processes 2022, 10, 84. [Google Scholar] [CrossRef]
  2. Ghobakhloo, M. Industry 4.0, digitization, and opportunities for sustainability. J. Clean. Prod. 2020, 252, 119869. [Google Scholar] [CrossRef]
  3. Ghobakhloo, M.; Iranmanesh, M.; Vilkas, M.; Grybauskas, A.; Amran, A. Drivers and barriers of Industry 4.0 technology adoption among manufacturing SMEs: A systematic review and transformation roadmap. J. Manuf. Technol. Manag. 2022, 33, 1029–1058. [Google Scholar] [CrossRef]
  4. Ghasemi, P.; Hemmaty, H.; Pourghader Chobar, A.; Heidari, M.R.; Keramati, M. A multi-objective and multi-level model for location-routing problem in the supply chain based on the customer’s time window. J. Appl. Res. Ind. Eng. 2023, 10, 412–426. [Google Scholar] [CrossRef]
  5. Schoenenberger, L.; Schmid, A.; Tanase, R.; Beck, M.; Schwaninger, M. Structural analysis of system dynamics models. Simul. Model. Pract. Theory 2021, 110, 102333. [Google Scholar] [CrossRef]
  6. Edwards-Jones, G.; Davies, B.; Hussain, S.S. Ecological Economics: An Introduction; John Wiley & Sons: Hoboken, NJ, USA, 2009. [Google Scholar]
  7. Stewart, T.J.; Durbach, I. Dealing with uncertainties in MCDA. In Multiple Criteria Decision Analysis: State of the Art Surveys; Springer: Berlin/Heidelberg, Germany, 2016; pp. 467–496. [Google Scholar] [CrossRef]
  8. Sellitto, M.A.; Murakami, F.K. Industrial symbiosis: A case study involving a steelmaking, a cement manufacturing, and a zinc smelting plant. Chem. Eng. Trans. 2018, 70, 211–216. [Google Scholar] [CrossRef]
  9. Green, K.W.; Zelbst, P.J.; Meacham, J.; Bhadauria, V.S. Green supply chain management practices: Impact on performance. Supply Chain Manag. Int. J. 2012, 17, 290–305. [Google Scholar] [CrossRef]
  10. Gupta, M.C. Environmental management and its impact on the operations function. Int. J. Oper. Prod. Manag. 1995, 15, 34–51. [Google Scholar] [CrossRef]
  11. Huscroft, J.R.; Hazen, B.T.; Hall, D.J.; Skipper, J.B.; Hanna, J.B. Reverse logistics: Past research, current management issues, and future directions. Int. J. Logist. Manag. 2013, 24, 304–327. [Google Scholar] [CrossRef]
  12. Sellitto, M.A.; Hermann, F.F.; Blezs, A.E., Jr.; Barbosa-Póvoa, A.P. Describing and organizing green practices in the context of Green Supply Chain Management: Case studies. Resour. Conserv. Recycl. 2019, 145, 1–10. [Google Scholar] [CrossRef]
  13. Fleischmann, M.; Krikke, H.R.; Dekker, R.; Flapper, S.D. A characterisation of logistics networks for product recovery. Omega 2000, 28, 653–666. [Google Scholar] [CrossRef]
  14. Daugherty, P.J.; Richey, R.G.; Genchev, S.E.; Chen, H. Reverse logistics: Superior performance through focused resource commitments to information technology. Transp. Res. Part E Logist. Transp. Rev. 2005, 41, 77–92. [Google Scholar] [CrossRef]
  15. Lippmann, S. Supply chain environmental management: Elements for success. Corp. Environ. Strategy 1999, 6, 175–182. [Google Scholar] [CrossRef]
  16. Wei, M.S.; Huang, K.H. Recycling and reuse of industrial wastes in Taiwan. Waste Manag. 2001, 21, 93–97. [Google Scholar] [CrossRef]
  17. Sasikumar, P.; Kannan, G. Issues in reverse supply chains, part I: End-of-life product recovery and inventory management–an overview. Int. J. Sustain. Eng. 2008, 1, 154–172. [Google Scholar] [CrossRef]
  18. Rogers, D.S.; Tibben-Lembke, R. An examination of reverse logistics practices. J. Bus. Logist. 2001, 22, 129–148. [Google Scholar] [CrossRef]
  19. Tibben-Lembke, R.S.; Rogers, D.S. Differences between forward and reverse logistics in a retail environment. Supply Chain Manag. Int. J. 2002, 7, 271–282. [Google Scholar] [CrossRef]
  20. Kim, K.; Song, I.; Kim, J.; Jeong, B. Supply planning model for remanufacturing system in reverse logistics environment. Comput. Ind. Eng. 2006, 51, 279–287. [Google Scholar] [CrossRef]
  21. King, A.M.; Burgess, S.C.; Ijomah, W.; McMahon, C.A. Reducing waste: Repair, recondition, remanufacture or recycle? Sustain. Dev. 2006, 14, 257–267. [Google Scholar] [CrossRef]
  22. Ding, L.; Wang, T.; Chan, P. Forward and reverse logistics for circular economy in construction: A systematic literature review. J. Clean. Prod. 2023, 388, 135981. [Google Scholar] [CrossRef]
  23. Ni, Z.; Chan, H.K.; Tan, Z. Systematic literature review of reverse logistics for e-waste: Overview, analysis, and future research agenda. Int. J. Logist. Res. Appl. 2023, 26, 843–871. [Google Scholar] [CrossRef]
  24. Mishra, A.; Dutta, P.; Jayasankar, S.; Jain, P.; Mathiyazhagan, K. A review of reverse logistics and closed-loop supply chains in the perspective of circular economy. Benchmark. Int. J. 2023, 30, 975–1020. [Google Scholar] [CrossRef]
  25. Mallick, P.K.; Salling, K.B.; Pigosso, D.C.; McAloone, T.C. Closing the loop: Establishing reverse logistics for a circular economy, a systematic review. J. Environ. Manag. 2023, 328, 117017. [Google Scholar] [CrossRef] [PubMed]
  26. Xin, C.; Wang, J.; Wang, Z.; Wu, C.H.; Nawaz, M.; Tsai, S.B. Reverse logistics research of municipal hazardous waste: A literature review. Environ. Dev. Sustain. 2022, 24, 1495–1531. [Google Scholar] [CrossRef]
  27. Moosavi, J.; Naeni, L.M.; Fathollahi-Fard, A.M.; Fiore, U. Blockchain in supply chain management: A review, bibliometric, and network analysis. Environ. Sci. Pollut. Res. 2021, 1–5. [Google Scholar] [CrossRef] [PubMed]
  28. Tian, G.; Lu, W.; Zhang, X.; Zhan, M.; Dulebenets, M.A.; Aleksandrov, A.; Fathollahi-Fard, A.M.; Ivanov, M. A survey of multi-criteria decision-making techniques for green logistics and low-carbon transportation systems. Environ. Sci. Pollut. Res. 2023, 30, 57279–57301. [Google Scholar] [CrossRef]
  29. Moosavi, J.; Fathollahi-Fard, A.M.; Dulebenets, M.A. Supply chain disruption during the COVID-19 pandemic: Recognizing potential disruption management strategies. Int. J. Disaster Risk Reduct. 2022, 75, 102983. [Google Scholar] [CrossRef]
  30. Liu, Z.; Li, Z.; Chen, W.; Zhao, Y.; Yue, H.; Wu, Z. Path optimization of medical waste transport routes in the emergent public health event of COVID-19: A hybrid optimization algorithm based on the immune–ant colony algorithm. Int. J. Environ. Res. Public Health 2020, 17, 5831. [Google Scholar] [CrossRef]
  31. Li, R.; Chen, Y.; Song, J.; Li, M.; Yu, Y. Multi-Objective Optimization Method of Industrial Workshop Layout from the Perspective of Low Carbon. Sustainability 2023, 15, 12275. [Google Scholar] [CrossRef]
  32. Giallanza, A.; Puma, G.L. Fuzzy green vehicle routing problem for designing a three echelons supply chain. J. Clean. Prod. 2020, 259, 120774. [Google Scholar] [CrossRef]
  33. Özkır, V.; Başlıgil, H. Multi-objective optimization of closed-loop supply chains in uncertain environment. J. Clean. Prod. 2013, 41, 114–125. [Google Scholar] [CrossRef]
  34. Homayouni, Z.; Pishvaee, M.S.; Jahani, H.; Ivanov, D. A robust-heuristic optimization approach to a green supply chain design with consideration of assorted vehicle types and carbon policies under uncertainty. Ann. Oper. Res. 2023, 324, 395–435. [Google Scholar] [CrossRef]
  35. Ferri, G.L.; Gisele de Lorena Diniz, C.; Glaydston Mattos, R. Reverse logistics network for municipal solid waste management: The inclusion of waste pickers as a Brazilian legal requirement. Waste Manag. 2015, 40, 173–191. [Google Scholar] [CrossRef]
  36. Alós, J.D.S.; Milan, G.S.; Eberle, L. The Reverse Logistics operation of solid waste pos-consumption of electronic products for domestic use in Brazil. Rev. Adm. UFSM 2023, 16, e2. [Google Scholar] [CrossRef]
  37. Mantzaras, G.; Voudrias, E.A. An optimization model for collection, haul, transfer, treatment and disposal of infectious medical waste: Application to a Greek region. Waste Manag. 2017, 69, 518–534. [Google Scholar] [CrossRef]
  38. Kargar, S.; Paydar, M.M.; Safaei, A.S. A reverse supply chain for medical waste: A case study in Babol healthcare sector. Waste Manag. 2020, 113, 197–209. [Google Scholar] [CrossRef] [PubMed]
  39. Tirkolaee, E.B.; Goli, A.; Ghasemi, P.; Goodarzian, F. Designing a sustainable closed-loop supply chain network of face masks during the COVID-19 pandemic: Pareto-based algorithms. J. Clean. Prod. 2022, 333, 130056. [Google Scholar] [CrossRef]
  40. Tirkolaee, E.B.; Abbasian, P.; Weber, G.W. Sustainable fuzzy multi-trip location-routing problem for medical waste management during the COVID-19 outbreak. Sci. Total Environ. 2022, 756, 143607. [Google Scholar] [CrossRef]
  41. Zhang, Y.; Li, Z.; Jiao, P.; Zhu, S. Two-stage stochastic programming approach for limited medical reserves allocation under uncertainties. Complex Intell. Syst. 2021, 7, 3003–3013. [Google Scholar] [CrossRef]
  42. Wang, Z.; Huang, L.; He, C.X. A multi-objective and multi-period optimization model for urban healthcare waste’s reverse logistics network design. J. Comb. Optim. 2021, 42, 785–812. [Google Scholar] [CrossRef]
  43. Samadhiya, A.; Kumar, A.; Agrawal, R.; Kazancoglu, Y.; Agrawal, R. Reinventing reverse logistics through blockchain technology: A comprehensive review and future research propositions. Supply Chain Forum Int. J. 2023, 24, 81–102. [Google Scholar] [CrossRef]
  44. Tiwari, S.; Bahuguna, P.C.; Walker, J. Industry 5.0: A macro-perspective approach. In Handbook of Research on Innovative Management Using AI in Industry 5.0; IGI Global: Hershey, PA, USA, 2022; pp. 59–73. [Google Scholar] [CrossRef]
  45. Adel, A. Future of industry 5.0 in society: Human-centric solutions, challenges and prospective research areas. J. Cloud Comput. 2022, 11, 40. [Google Scholar] [CrossRef] [PubMed]
  46. Xu, X.; Lu, Y.; Vogel-Heuser, B.; Wang, L. Industry 4.0 and Industry 5.0—Inception, conception and perception. J. Manuf. Syst. 2021, 61, 530–535. [Google Scholar] [CrossRef]
  47. Paschek, D.; Luminosu, C.T.; Ocakci, E. Industry 5.0 challenges and perspectives for manufacturing Systems in the Society 5.0. In Sustainability and Innovation in Manufacturing Enterprises: Indicators, Models and Assessment for Industry 5.0; Springer: Berlin/Heidelberg, Germany, 2022; pp. 17–63. [Google Scholar] [CrossRef]
  48. Teunter, R.H. A reverse logistics valuation method for inventory control. Int. J. Prod. Res. 2001, 39, 2023–2035. [Google Scholar] [CrossRef]
  49. Rachih, H.; Mhada, F.; Chiheb, R. Simulation optimization of an inventory control model for a reverse logistics system. Decis. Sci. Lett. 2022, 11, 43–54. [Google Scholar] [CrossRef]
  50. Bolis, S.; Maggi, R. Logistics strategy and transport service choices: An adaptive stated preference experiment. Growth Chang. 2003, 34, 490–504. [Google Scholar] [CrossRef]
  51. Huang, F.L. Alternatives to logistic regression models when analyzing cluster randomized trials with binary outcomes. Prev. Sci. 2023, 24, 398–407. [Google Scholar] [CrossRef]
  52. Lombardo, L.; Cama, M.; Conoscenti, C.; Märker, M.; Rotigliano, E.J.N.H. Binary logistic regression versus stochastic gradient boosted decision trees in assessing landslide susceptibility for multiple-occurring landslide events: Application to the 2009 storm event in Messina (Sicily, southern Italy). Nat. Hazards 2015, 79, 1621–1648. [Google Scholar] [CrossRef]
  53. Kotsiantis, S.B. Decision trees: A recent overview. Artif. Intell. Rev. 2013, 39, 261–283. [Google Scholar] [CrossRef]
  54. Gupta, S.K.; Khang, A.; Somani, P.; Dixit, C.K.; Pathak, A. Data Mining Processes and Decision-Making Models in the Personnel Management System. In Designing Workforce Management Systems for Industry 4.0: Data-Centric and AI-Enabled Approaches; CRC Press: Boca Raton, FL, USA, 2023; p. 85. [Google Scholar]
  55. Yilmaz, K.G.; Belbag, S. Prediction of consumer behavior regarding purchasing remanufactured products: A logistics regression model. Int. J. Bus. Soc. Res. 2016, 6, 1. [Google Scholar] [CrossRef]
  56. Mutang, J.A.; Haron, S.A. Factors predicting recycling behaviour among Malaysian. Southeast Asia Psychol. J. 2012, 31, 1. [Google Scholar]
  57. Tüylü, A.N.; Eroğlu, E. Using Machine Learning Algorithms for Forecasting Rate of Return Product in Reverse Logistics Process. Alphanumer. J. 2019, 7, 143–156. [Google Scholar] [CrossRef]
  58. Lickert, H.; Wewer, A.; Dittmann, S.; Bilge, P.; Dietrich, F. Selection of suitable machine learning algorithms for classification tasks in reverse logistics. Procedia CIRP 2021, 96, 272–277. [Google Scholar] [CrossRef]
  59. Dumitrescu, E.; Hué, S.; Hurlin, C.; Tokpavi, S. Machine learning for credit scoring: Improving logistic regression with non-linear decision-tree effects. Eur. J. Oper. Res. 2022, 297, 1178–1192. [Google Scholar] [CrossRef]
  60. Liu, H.; Setiono, R. Feature transformation and multivariate decision tree induction. In Lecture Notes in Computer Science, Proceedings of the International Conference on Discovery Science, Fukuoka, Japan, 14–16 December 1998; Springer: Berlin/Heidelberg, Germany, 1998. [Google Scholar] [CrossRef]
  61. Szymanski, A. Combining Logistic Regression and Decision Tree, Making Logistic Regression Less Linear. 2020. Available online: https://towardsdatascience.com/combining-logistic-regression-and-decision-tree-1adec36a4b3f (accessed on 26 November 2023).
  62. Govindan, K.; Soleimani, H.; Devika, K. Reverse logistics and closed-loop supply chain: A comprehensive review to explore the future. Eur. J. Oper. Res. 2015, 240, 603–626. [Google Scholar] [CrossRef]
Figure 1. Conceptual framework for this study.
Logistics 07 00097 g001
Figure 2. Visual representation of the integrated methodology’s workflow.
Logistics 07 00097 g002
Figure 3. ROC curve showing the performance of logistic regression model (the dashed line denotes Random Classifier).
Logistics 07 00097 g003
Figure 4. Confusion matrix for the logistic regression model.
Logistics 07 00097 g004
Table 1. List of notable reverse logistics channels identified in literature.
Reverse ChannelDescription
Product ReturnsThis channel deals with the return of products due to various reasons such as defects or customer dissatisfaction. Effective communication and cost-effective reverse logistics processes are crucial in this channel. Product returns offer opportunities for material and component recovery, adding value to the supply chain [12].
Product RecallsOccurring when products are found defective or unsafe, this channel emphasizes the need for timely and efficient recall processes. Collaboration and communication are key factors in managing product recalls effectively [12].
End-of-Life Product ManagementThis involves the recycling or disposal of products at the end of their useful life. Designing products for recyclability and ease of disassembly, coupled with effective collection and sorting processes, is essential in this channel [12].
ResaleA used product finds a new purpose but generally in a context where it holds lesser value compared to its original use. An example is repurposing an urban bus for agricultural activities. Studies elaborating on resale include [13,14].
ReuseThis process involves reassigning a used product to a new role without any repairs, maintaining its original value. An example is relocating a used vehicle to a different setting where it continues to function as intended. Key references discussing direct reuse include [15,16,17].
RefurbishmentRefurbishing involves cleaning and repairing failed components in products or machines. The focus is on restoring functionality rather than complete rebuilding [18].
RemanufacturingThis process involves the assembly of a new product by combining retrieved parts with new components. The new product meets the original specifications and delivers performance equivalent to the original. This approach is commonly applied in the refurbishment of industrial machinery, as highlighted in studies by [19,20,21].
Table 2. Some of the most recent systematic reviews on reverse logistics.
AuthorsReview Focus
Ding et al. (2023) [22]This review explores the extant literature on forward logistics and reverse logistics in the construction industry.
Ni et al. (2023) [23]This review conducted a content analysis of 162 papers from 1998 to 2021 and identified six main research themes on e-waste RL: (1) e-waste legislation and policy, (2) barriers, critical success factors, and solutions, (3) e-waste RL network design decisions, (4) e-waste RL system evaluations and frameworks, (5) consumer e-waste return behavior, (6) technology-based e-waste RL initiatives.
Mishra et al. (2023) [24]This review explores various aspects of reverse logistics and closed-loop supply chains in implementing and achieving circular economy (CE) initiatives.
Mallick et al. (2023) [25]This review explores 116 scholarly articles published between 2011 and 2021 to identify attributes related to the design and implementation of RL systems.
Xin et al. (2022) [26]This review focusses on the extant literature of reverse logistics of municipal hazardous waste (RLMHW) in the past three decades, and then establishes a framework of studies on RLMHW.
Table 3. Breakdown of feature transformation in the context of the proposed methodology.
ItemTransformation
Nature of DataReverse logistics data can be diverse, ranging from categorical data (like product type, return reason codes) to continuous data (like return quantities, time taken for a return).
Normalisation and ScalingGiven that logistic regression is sensitive to the scale of input features, it’s essential to normalize or scale the features so that they have a similar scale. For instance, transforming all numerical features to have values between 0 and 1.
Encoding Categorical VariablesDecision trees and logistic regression require numerical input features. Categorical data, like product types or return reasons, need to be converted into a numerical format. Techniques like one-hot encoding or label encoding can be used.
Feature EngineeringThis involves creating new features from the existing ones to capture intricate patterns in the data better. For instance, from the date of purchase and date of return, one can engineer a feature called ’days_to_return’.
Dimensionality ReductionIn cases where the dataset has a large number of features, it might be beneficial to reduce the dimensionality. Techniques like Principal Component Analysis (PCA) can transform the original features into a set of new features (principal components) that retain most of the data’s variance.
Temporal FeaturesGiven the dynamic nature of supply chains, time-based features can be crucial. For instance, features capturing seasonal trends, month of the year, or day of the week can be derived to understand periodic patterns in returns.
Disclaimer/Publisher’s Note: The statements, opinions and data contained in all publications are solely those of the individual author(s) and contributor(s) and not of MDPI and/or the editor(s). MDPI and/or the editor(s) disclaim responsibility for any injury to people or property resulting from any ideas, methods, instructions or products referred to in the content.

