Article

Effects of Parcel Delivery Service on Customer Satisfaction in the Saudi Arabian Logistics Industry: Does the National Culture Make a Difference?

by
Abu Elnasr E. Sobaih
1,2,* and
Ahmed AlSaif
1
1
Management Department, College of Business Administration, King Faisal University, Al-Ahsaa 31982, Saudi Arabia
2
Management Department, Faculty of Tourism and Hotel Management, Helwan University, Cairo 12612, Egypt
*
Author to whom correspondence should be addressed.
Logistics 2023, 7(4), 94; https://doi.org/10.3390/logistics7040094
Submission received: 14 September 2023 / Revised: 4 December 2023 / Accepted: 5 December 2023 / Published: 6 December 2023
(This article belongs to the Special Issue Sustainable Logistics in the New Era)

Abstract

:
Background: The logistics industry is keen to meet customer expectations, which in turn supports trade by enhancing business competitiveness and promoting economic development. Logistics companies realized that fulfillment of customer needs has a significant effect on their business survival, their sales and ultimately their profits. This research analyzes the variables that influence customer satisfaction with parcel delivery services in the Kingdom of Saudi Arabia (KSA), particularly the SERVQUAL dimensions: tangibility, reliability, responsiveness, assurance, and empathy. The research also examined whether national culture affects customer perceptions of parcel delivery services in KSA or not. Methods: The research collected data using a self-administered survey, which was directed at a sample of customers in the KSA, who had recent experience with parcel delivery services. Results: The results of statistical analysis showed that the best predicators of customer satisfaction are reliability, followed by the dimensions of empathy, then tangibility and finally responsiveness. In addition, the results showed significant differences in customers’ overall satisfaction between Saudis and non-Saudis. Saudis were more satisfied with the service than non-Saudis were. Conclusions: This research showed the key role of national culture in perceiving parcel delivery service quality in KSA. The findings provide important messages to the administrators of the logistics services in KSA, which have become crucial for the Saudi Vision 2030. They need to customize their service according to customer needs and provide regular training for their staff to be supportive, reliable and have the credibility to deliver services as promised.

1. Introduction

The logistics industry is vital for international trade. Hence, many countries are paying high attention to logistics services to support their economy, create job opportunities and attract foreign investments [1]. In that sense, Muneer [2] confirmed that when a logistics industry grows, it supplements international commerce by enhancing nations’ competitiveness, while fostering economic development. However, the success of the logistics industry relies heavily on customer perceptions of service quality provided by the logistics companies [3]. This is because customers hold the key to service industry survival [4]. Customer satisfaction is a valuation of how well the product and/or service is provided to the customer and meets his or her expectations [5,6]. It is an indication of how a customer feels about a product, service, and/or experience. This means that the customer can experience different kinds of satisfaction. For instance, if the product and/or service performance provided met or exceeded the expectations of the customer, then s/he becomes satisfied. However, if it did not meet the expectations, then dissatisfaction is more likely to occur [7]. The perceptions of post-purchase experience is the key to customer satisfaction, as it is often compared with his/her pre-purchase expectations [3,4].
Recent research studies [8,9,10] confirmed that customer satisfaction has become a key concern for e-business success and growth. It is widely known that retaining existing customers and expanding business with them would be significantly less costly than recruiting new customers [11,12,13,14]. By the same train of thought, Gitomer [15] claimed that the expense of attracting a new client is 10 times more than the cost of maintaining an existing one. As a result, most businesses would not save on endeavors to satisfy their customers to gain their loyalty and create long-term partnerships with them [16]. Certainly, satisfied and loyal clients boost company business and vice versa [17]. Hence, scholars and business administrators have become concerned about the variables that affect customer satisfaction and experience. On the other side, it has often been argued that aspects of national culture affect how customers perceive the level of service quality [18]. In that sense, Morgeson et al. [19] reported a scarcity in the number of studies that addressed the impact of culture on customer perceptions of service quality. Therefore, Tsoukatos and Rand [20] called for more studies that address this issue. Hence, like other businesses, parcel delivery companies should establish an organizational culture that essentially takes into consideration the national culture in which they operate [21]. Culture not only influences behaviors of customers [22] but also affects the rationalization process of the behavior [23] and customers’ behavioral intention regarding service or product choice [24]. Therefore, national culture could have an influence on the perceptions of service quality provided by the logistics industry; especially parcel delivery service, which is the focus of the current research.
Studies on customer perceptions of service quality in the logistics industry are increasing (e.g., [10,25,26,27]); however, a review of the published research confirms limited studies, if any, on customer satisfaction and their perceptions of service quality in logistics services in the Kingdom of Saudi Arabia (KSA) or countries of similar context. This is despite the importance of customer satisfaction for the Saudi logistics industry. KSA launched its Vision 2030 in April 2016 (https://www.vision2030.gov.sa/en/ (accessed on 4 September 2023)). One of the primary foundations of this Vision is to transform the KSA into the preferred logistics center in the region. KSA intends to capitalize on its strategic location and assets for being among the best and lowest-cost options for distribution to East Africa, Mashriq, the Levant and the Arabian Peninsula, all while enhancing logistics service quality. This research focuses on the service quality of parcel delivery provided by the logistics service companies in KSA. It concentrates on customer perceptions of service quality, particularly the SERVQUAL variables: tangibility, reliability, responsiveness, assurance, and empathy. It assesses the effects of the five SERVQUAL dimensions on customer satisfaction of parcel delivery in the KSA logistics service companies. This research draws on the SERVQUAL framework and adopts it as the theoretical framework for the current study [28]. It examines the role of national culture in perceiving the service quality of parcel delivery provided by the logistics service companies in KSA. The research answers the following questions.
  • What are the factors of SERVQUAL dimensions that affect customer satisfaction in selecting logistics service providers for parcel delivery in KSA?
  • What is the role of national culture in assessing parcel delivery services provided by logistics companies in KSA?
The current research attempts to provide a response to these questions. It adds to our understanding of consumer behavior in the logistics services in KSA, where logistics became a pillar of the Saudi Vision 2030. The current study is of value to both scholars and logistics service administrators in relation to the factors that affect customer satisfaction of parcel delivery in the KSA logistics industry. The study gives insight into the factors that shape customer perceptions of service quality regarding parcel delivery in KSA. Understanding these factors enables the development of services provided in this important industry and affects the country’s economy [2]. The study also advances our understanding in relation to the role of national culture in perceiving quality of parcel delivery.

2. Literature Review

2.1. Customer Satisfaction

According to Kotler and Keller [29], customer satisfaction is defined as an individual’s emotion or response, either pleasant or unpleasant, that came from comparing perceptions to expectations. More specifically, customer satisfaction is related to the quality of the service offered [30]. Boonlertvanich [31] added that the term customer satisfaction describes customers’ relative emotions, which result from the discrepancy between customer expectations and real experience. Customer satisfaction is crucial in a highly competitive market because there is a large variance in loyalty level between clients who are somewhat satisfied and clients who are truly satisfied [32]. To clarify, customers who are truly satisfied show high level of loyalty and positive behavioral intention toward a business, such as repeat purchases and encouraging their friends to do the same with positive word of mouth [33]. Customer satisfaction leads to loyal customers, which has a fateful impact on any company profit due to repeat purchasing and gaining new customers through positive word of mouth [12,34]. To conclude, customer satisfaction is an organizational asset such any other asset and should be measured, maintained and managed. As a result, organizations, whether service-oriented or product-oriented, that desire to succeed should recognize the significance of their customer satisfaction [35,36].

2.2. Customer Expectations

Customer expectations refer to feelings that customers should perceive related to a service provider [37]. Olson and Dover [38] argued that customer expectations are linked to prior experiences and preconceived ideas with a service or/and product. Nevertheless, expectations are not only formed by past experiences, but can be influenced by a variety of external variables, e.g., brand, word of mouth, promotion, and advertising [39,40]. Thus, logistics providers should understand what consumers truly expect, what drives their expectations, and how to meet their requirements and desires [39]. According to Haseki [41], there are three options in managing customer expectations: adapting them (fulfilling), changing them (shaping), and a departing customer if the first two possibilities fail. Given these considerations, firms should make every effort to keep customers satisfied and retain existing ones. Thus, a more thorough understanding of customer expectations assists in developing products and services that meet those expectations.

2.3. Service Quality

In a customer-centered policy, quality correlates with satisfaction, and certainly better quality represents better customer satisfaction [42]. Organizations have recognized that providing high-quality services to their customers creates a long-term competitive edge. Service quality and consumer satisfaction are essential success aspects for businesses, which ultimately influence market competitiveness, expansion, and growth [43]. According to Rauch et al. [44] and Miklós-Thal and Tucker [34], management should meet customers’ expectations to ensure the success of the company. The ability of businesses to meet or exceed consumer expectations is identified as service quality [7]. It was argued that cost management boosts profitability while service quality enhances customer satisfaction [42]. To conclude, customers’ assessments of service quality are formed when their pre-service expectations are compared to their actual service experience [3]. If perceptions exceed expectations, the service is described as outstanding. Moreover, if perceptions merely equal expectations, the service is considered acceptable or adequate. However, if perceptions do not match expectations, the service is classified as awful, poor, and/or inadequate [45].
Mauri et al. [46] argued that service quality is not a unidimensional variable, but that it is judged by customers according to several dimensions. Since services are perishable, intangible, inseparable and heterogeneous, measuring service quality has become a challenging task [47]. Therefore, Parasuraman et al. [7] and Parasuraman et al. [48] have established an instrument for assessing the quality of service, which is commonly known as SERVQUAL. This instrument has been altered in multiple studies undertaken in a wide range of cultural contexts, geographic locations, and service settings. According to Siddiqi [49], the SERVQUAL model is a suitable evaluation instrument for measuring service quality. SERVQUAL evaluates service quality through calculating the discrepancy between customer expectations and perceptions. In this regard, Yarimoglu [42] emphasized the features of services. For example, intangibility indicates that services certain characteristics that make it hard to assess their service quality as perceived by customers. The intangible side influences client satisfaction through service performance. Certainly, there are no two services with the same level, due to heterogeneity, which poses a challenge to the level of service quality. This is because service quality is established via the interaction of staff and clients.

2.4. Dimensions of Service Quality

Service quality is acknowledged as a determinant of customer satisfaction and the organization’s competitiveness [7,48]. In the service industry, service performance is regarded as a key concern for business that shapes customer satisfaction [50]. As a result, firms gain a competitive edge by providing high level of service quality [50]. According to Parasuraman et al. [48], customers evaluate service quality as the discrepancy between a customer’s expectations and perceptions. Hence, the SERVQUAL framework was developed to bridge the discrepancy between customer expectations and perceptions [7,48]. A review of the research on the dimensions of logistics service quality showed that studies adopt various dimensions to measure or assess logistics service quality. For example, the study of Mentzer et al. [25] included the following dimensions: the quality of service staff, amounts of orders, information quality, timeliness, order procedures, order status, order accuracy, and order handling. Another study [26] identified other dimensions, such as the ease of finding information, the availability of the product and special handling of orders by suppliers. Restuputri et al. [3] pointed to six dimensions of logistics service quality: the location of the warehouse, order condition, order information, staff attitude, speed of delivery and delivery services. Other studies (e.g., [27]) adopted SERVQAUL dimensions to assess and measure service quality. The current study draws on the SERVQUAL framework and adopts it as the theoretical framework for this research [28]. This study specifically considers the five dimensions of SERVQAUL that affect customer satisfaction (tangibility, responsiveness, empathy, assurance, and reliability) in the Saudi Arabian logistics industry.

2.4.1. Reliability

Lau [51] classified reliability as a top dimension of the SERVQUAL model. Reliability refers to the consistency and dependability of a product or service in delivering what is promised [48,52]. It relates to the ability of a product or service to perform consistently over time, without failures, breakdowns, or interruptions. A reliable product or service is one that can be trusted to meet customer expectations and needs consistently. Earlier studies (e.g., [7,53]) indicated that customer satisfaction is positively affected by the reliability aspect of service quality. According to Ennew et al. [54], reliability is described as the degree to which customers can depend on the company to provide the service it has promised. Parasuraman et al. [7] described reliability as the organization’s capacity to provide precise and dependent service. Customer satisfaction is affected significantly by reliability as a dimension of service quality [55]. Ennew et al. [54] described reliability as being capable of conducting and performing the essential service for clients dependably, precisely and in a timely manner. In addition, it includes the ability to handle customer complaints. Peng and Moghavvemi [56] confirmed that reliability is the supreme aspect in customer satisfaction and retention. Hence, the following hypothesis is proposed:
H1. 
Reliability has a positive effect on customer satisfaction in the Saudi logistics industry.

2.4.2. Tangibility

Tangibility is related to the appearance of equipment, physical facilities, workers, and material [7]. Similarly, Munusamy et al. [57] described tangibility as the perfect display of facilities required to serve customers, the appearance of professional staff, brochures and pamphlets, and other materials that have an effect on customer satisfaction. Earlier studies (e.g., [57,58,59]) have confirmed that tangibility positively affects client satisfaction. However, Ananth et al. [60] found that modern technology and an appealing atmosphere, as indicators of tangibility, affect customer satisfaction. In the setting of the logistics industry, the physical aspects of the service include the quality of packaging, condition of goods and staff appearance. Based on this consideration, it could be suggested:
H2. 
Tangibility has a positive effect on customer satisfaction in the Saudi logistics industry.

2.4.3. Responsiveness

Responsiveness refers to the willingness and capacity of the company to assist its customers and deliver quick service [7]. In this regard, Parasuraman et al. [48] added that employees’ desire to deliver the essential service at any time without trouble has an influence on customer satisfaction. Pakurár et al. [55] argued that the focus of responsiveness is on how service providers respond to customers through their employees. Customers will be more satisfied when they receive individualized attention, and personnel will be more attentive when it comes to the issues that customers confront. When this happens, customers’ contentment undergoes a dramatic change. Earlier studies (e.g., [51,58,59,61]) have confirmed that responsiveness positively influences client satisfaction. Arguably, when a logistics company is responsive, it demonstrates its ability to quickly reply to inquiries, provide accurate information, and adapt to changes or unexpected events in the supply chain. This level of responsiveness plays a vital role in ensuring the smooth flow of goods and services and ultimately leads to higher customer satisfaction. Based on this discussion, it could be proposed that the responsiveness as a dimension of service quality would have a significant influence on customer satisfaction in the logistics industry. As a result, the research puts forward the following hypothesis.
H3. 
Responsiveness has a positive effect on customer satisfaction in the Saudi logistics industry.

2.4.4. Assurance

The assurance aspect of service quality reveals an employee’s knowledge, courtesy, and skill as well as their capacity to create trusting relationships with clients [6]. Similarly, Kant and Jaiswal [61] described assurance as the good manners, knowledge, and courtesy of company staff. Additionally, Parasuraman et al. [48] described assurance as the capacity of employees to foster the kinds of belief and assurance that significantly affect the degree of client satisfaction. Many studies (e.g., [57,58,59,62]) have confirmed that assurance strongly correlates with and affects a customer’s overall satisfaction with the service provided. Hence, the study proposes that:
H4. 
Assurance has a positive effect on customer satisfaction in the Saudi logistics industry.

2.4.5. Empathy

According to Navaratnaseel and Periyathampy [63], empathy is paying attention to a client individually and having the capacity to take care of them, particularly during service time. Furthermore, Ennew et al. [54] illustrated that empathy means being attentive in communicative settings, recognizing customer requirements and desires, displaying friendly attitudes and manners, and taking care of a client’s needs personally. Additionally, research [48] confirmed that recognizing expectations of clients compared to competitors, as well as providing care and personalized attention to clients, had a strong impact on client satisfaction. Ananth et al. [60] confirmed that individualized attention, flexible operation hours, and an understanding of the client’s needs have a significant impact on the level of customer satisfaction. As a result, the current study formulates the following hypothesis:
H5. 
Empathy has a positive effect on customer satisfaction in the Saudi logistics industry.

2.5. Customer Satisfaction and Cultural Background
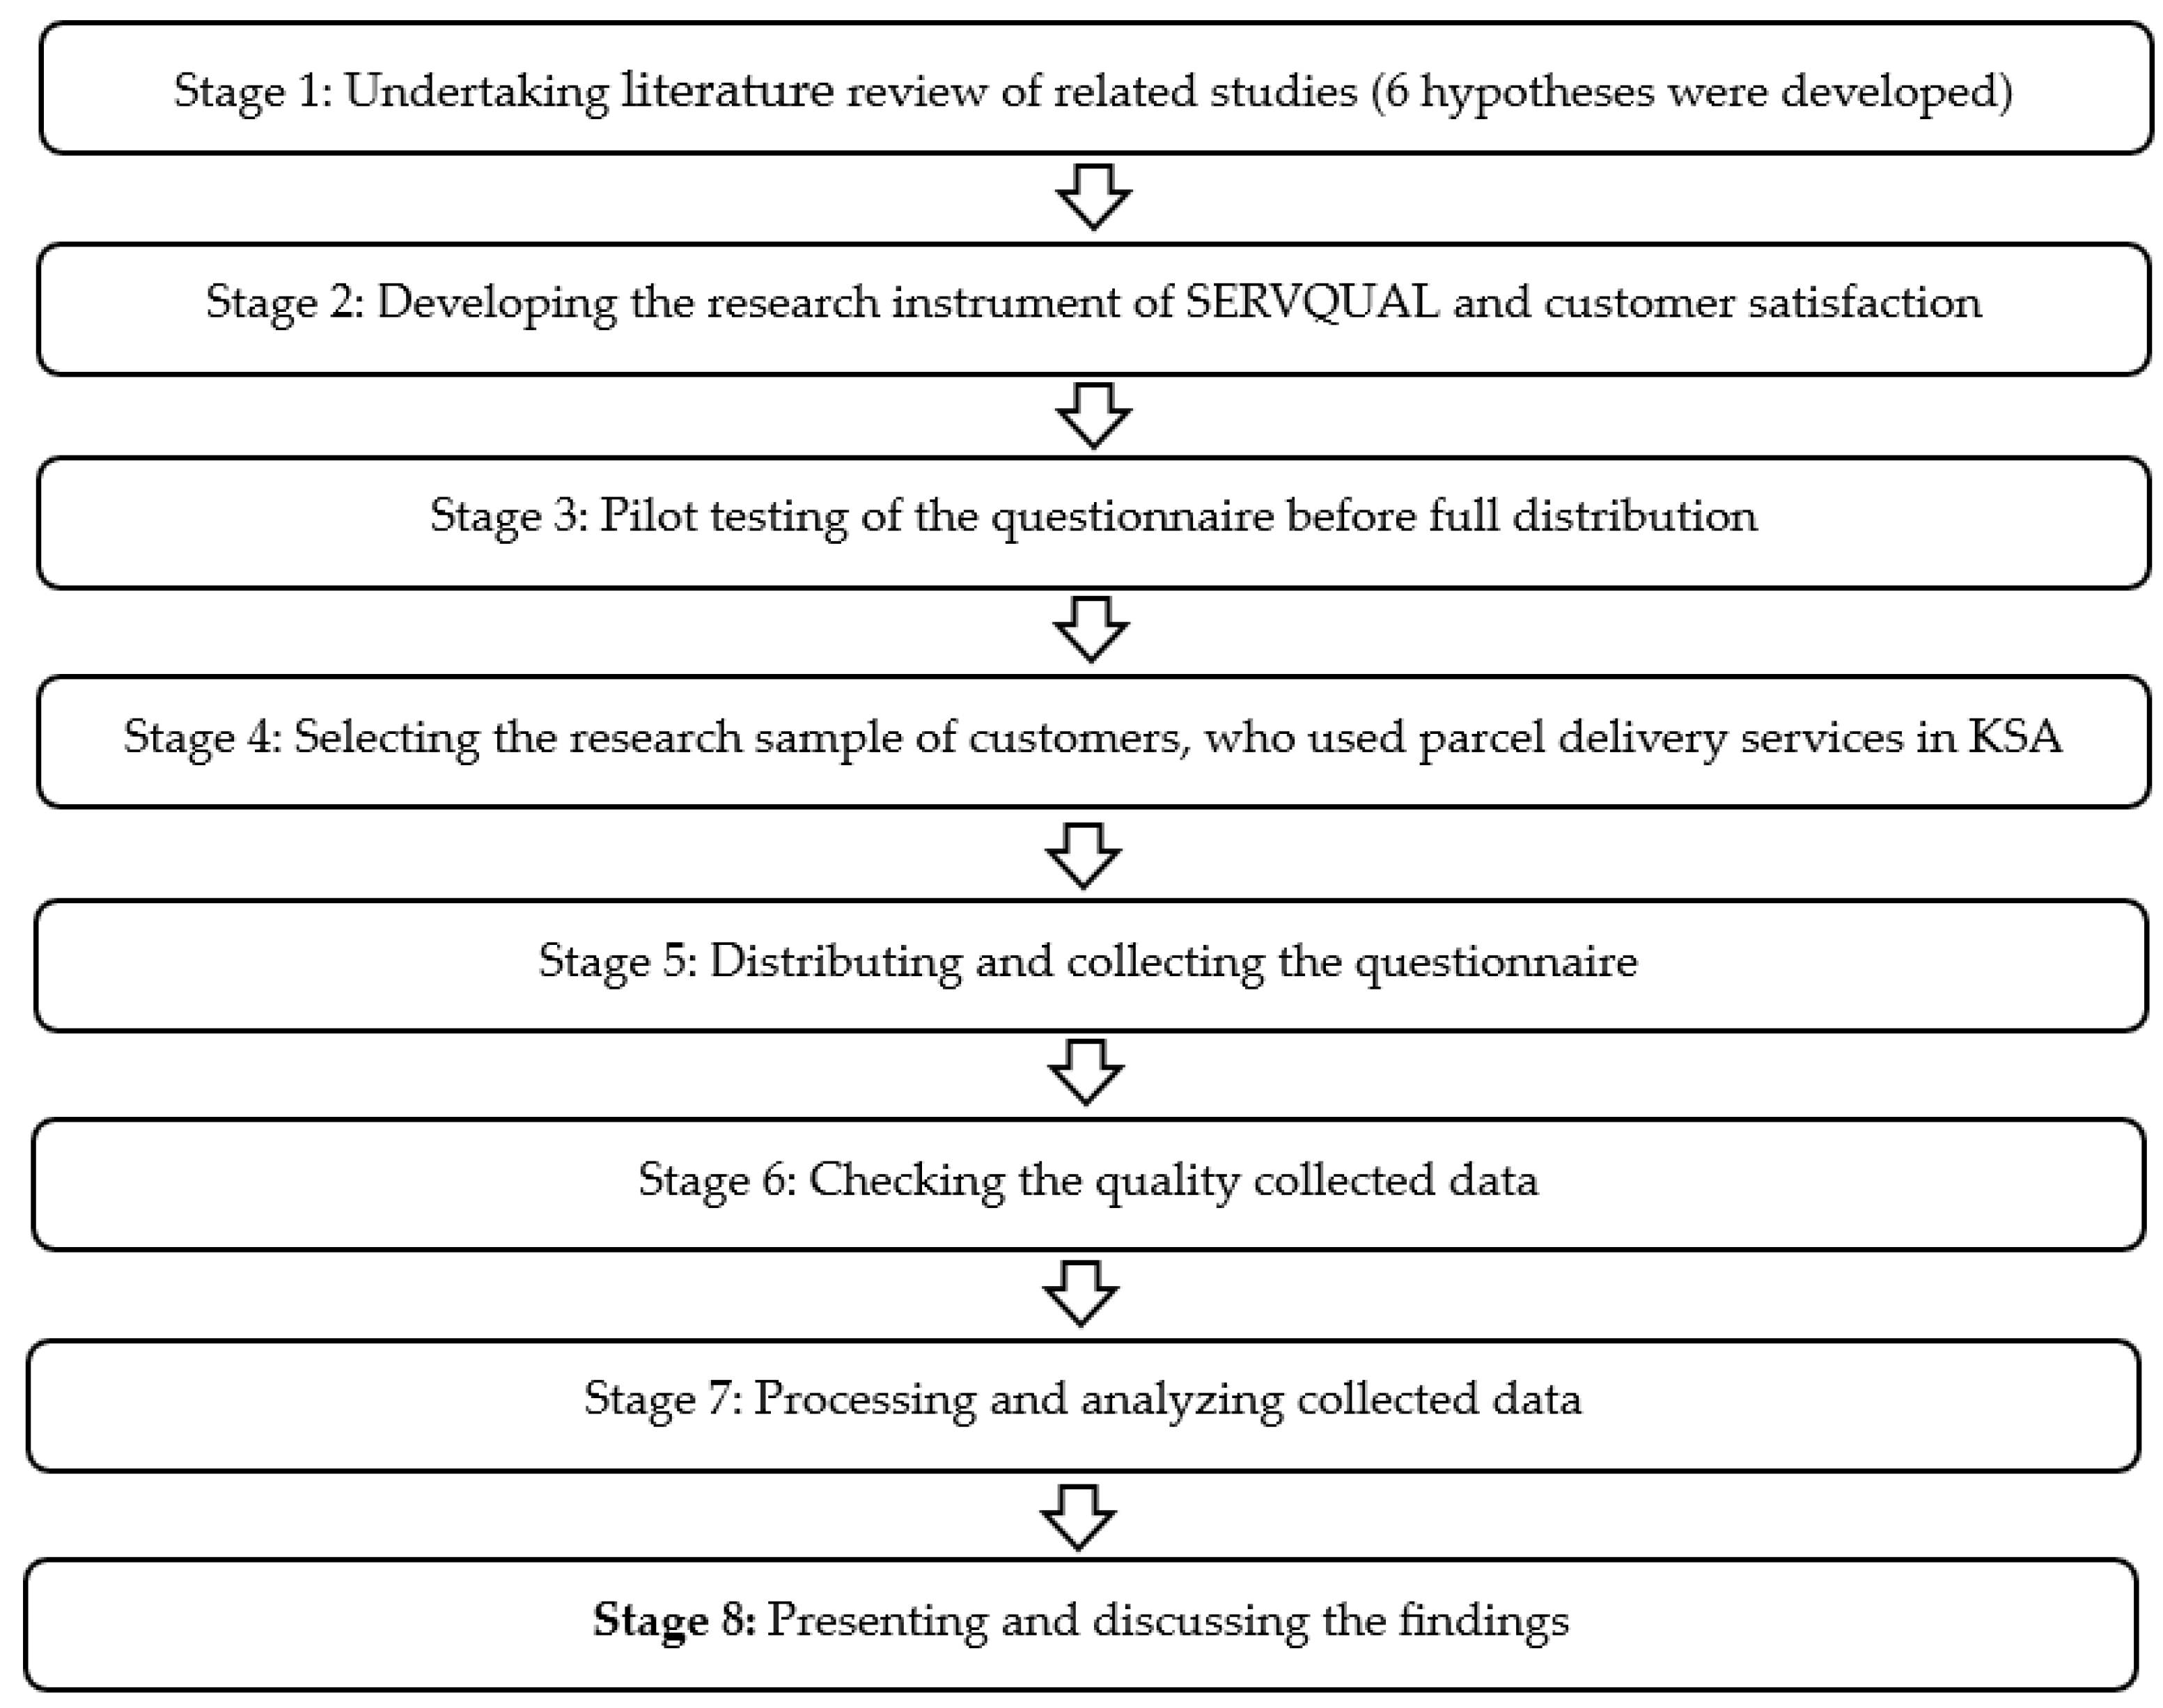
The cultural background of customers might have an impact on how they interact with the organization [64]. Culture has an influence on individuals’ buying intentions and behavior [65]. In other words, the national culture affects consumers’ choices of certain organizations for services [65]. As a result, companies should understand that each customer’s nation has unique cultural features that have to be considered. According to Sun et al. [65], culture has an impact on all human behavior, including consumption patterns and service choices. Dimensional models that identify behavioral patterns that explain how people behave are useful for understanding the impact of culture on consumer behavior [66]. Hofstede [22,67] established some national cultural dimensions that are related to consumer purchasing behavior, i.e., uncertainty avoidance, individualism–collectivism, and masculinity–femininity. These dimensions have become widely recognized and many marketing analysts utilize them to discover and compare nations (e.g., [68,69]). In general, collectivist cultures, such as KSA, predominate in the East, whereas individualist cultures predominate in the West [67]. Additionally, cultural backgrounds can influence communication styles and language preferences. Customers from different cultural backgrounds may have different expectations around the quality of service. A study on the context of KSA by Sobaih [24] showed significant differences in purchase intention and behavior regarding fast-food items with certain nutrition labels between Saudis and UK customers. Therefore, it could be argued that:
H6. 
There is a significant difference between Saudis and non-Saudis in their overall satisfaction with parcel delivery services in the Saudi logistics industry.

3. Methods

3.1. Collection Method and Procedures

The research used a quantitative framework for data collection and analysis (a summary of this framework is presented in Figure 1). The primary data were collected via a self-administered questionnaire. The questionnaire was distributed appropriately to a sample of customers, who recently engaged in a parcel delivery service in KSA. Respondents were recognized via the researchers’ networks. The questionnaire consisted of four parts. Part 1 is the personal profile of the participants. This part asked the respondents about gender, age, nationality, and how often they used logistics services, particularly a parcel delivery service. Part 2 asked about SERVQUAL. This part included questions that assess empathy, assurance, reliability, tangibility, and responsiveness. The questions were drawn from Saleh and Ryan [70] and Muneeb et al. [71]. Part 3 asked the respondents about their satisfaction with parcel delivery services in KSA. The questions in this part were drawn from Tsoukatos and Rand [20]. Part 4 asked the respondents if they would like to comment about their satisfaction with parcel delivery services in KSA.
The researchers double-checked the questionnaire after it was developed for completeness and accuracy. It was piloted with a sample of 25 post-graduate students to guarantee face and content validity. The aim of the research was explained at the beginning of the questionnaire. Participants were informed that this questionnaire is part of a study on customers’ perceptions of parcel delivery services and their relationship with their overall satisfaction. There were no financial incentives for participation in this study. The respondents were asked to participate in this study voluntarily. Their identity was confidential and participation was for study purposes only. The researchers’ contact details were added for any further information. A consistency coefficient (Cronbach’s alpha) was adopted to examine the consistency of the instrument. The outcomes of the Cronbach’s alpha for all dimensions were above 0.7 [72]. This confirms that a reliable instrument was used in this study.

3.2. Population and Sampling

The population of the current study is customers who used a parcel delivery service in KSA. Because the researchers are in the Eastern Province of KSA, the data were collected from consumers in this region of the country. To select a reasonable sample for the data analysis, the suggestion of Roussel [73] was followed. It was recommended that the sample size be more than five times the items and preferably 10 times the items or above. The scale items in the instrument were 25 items, and the responses received were 404 complete forms, which were valid for analysis. The size of the sample was acceptable, as recommended by Krejcie and Morgan [74] and Taherdoost [75].

3.3. Analysis of the Data

To test the research hypotheses, Statistical Packages for Social Sciences (SPSS) programming version 25, was adopted to perform the data analysis, including descriptive analysis, and examining the relationships and differences between Saudis and non-Saudis. Descriptive statistics adopted included frequencies, mean, standard deviation and measuring the perceptions of the sample members. The Pearson correlation was adopted to test the correlation coefficients between the variables. Simple linear regression analysis was used to test the influence of independent variables of the study (SERVQUAL) on the dependent variable (customer satisfaction). The independent sample t-test was adopted to identify the variances amongst the overall satisfaction level of Saudis and non-Saudis in relation to parcel delivery service in KSA.

4. Results

4.1. Participant Demographics

The mainstream of the participants in this study were males (90%), whereas only 10% of participants were females (See Table 1). Most respondents were quite young, as 74% were less than 40 years old. Only about 9% of participants were more than 50 years old. The participation was almost equal between Saudi (50.9%) and non-Saudi (49.1%). There is a growing use of parcel delivery services in KSA, as about 29% of participants were using the service two times every month, while about 17% were using parcel delivery service more than 10 times a month (Table 1).

4.2. Descriptive Results

As highlighted earlier, this study adopted a five-way Likert scale in the questionnaire to give more flexibility for the individuals to choose the most suitable answer for them. The value ranged between 1 and 5. The Likert scale was processed according to the following equation:
C a t e g o r y   l e n g t h = M a x i m u m   S u b s t i t u t e M i n i m u m   S u b s t i t u t e n u m b e r   o f   l e v e l = 5 1 3 = 4 3 = 1.33
Category length + less weight = 1.33 + 1 = 2.33
The first degree of agreement (1–2.33) becomes the lower level. The second category 1.33 + 2.33 = 3.66; then, the second degree of agreement (2.34–3.66) becomes the intermediate level. For the transition to the third category, 1.33 + 3.66 = 5; then, the third degree of agreement (3.67–5) becomes the high level. As Table 2 shows, the mean score varies between middle and high for all factors (tangibility, reliability, responsiveness, assurance, empathy, and overall customer satisfaction), which have at least a middle level of mean scores or above.

4.3. Correlation Matrix

The Bivariate Pearson’s correlation test suggested that there was a positive significant association between the dimensions of SERVQAUL (which ranged between 0.399 and 0.607, p < 0.01). There was also a significant positive medium association between SERVQUAL dimensions and overall service satisfaction. It ranged between 0.443 and 0.611 (p < 0.01) (see Table 3).

4.4. Examining the Effect of SERVQUAL Dimensions on Overall Customer Satisfaction

As Table 4 shows, tangibility, reliability, responsiveness and empathy have a positive and significant influence on overall satisfaction with parcel delivery service, which means assurance did not significantly affect overall service satisfaction. The R-square value of the model is 0.750, which means that 75% of overall service satisfaction is influenced by tangibility, reliability, responsiveness, and empathy.
Table 5 shows a significant difference in satisfaction with parcel delivery services between Saudi and non-Saudi, and the difference is attributed to the Saudi citizen, who showed more satisfaction with the quality of parcel delivery services than non-Saudis did.

5. Discussions and Implications

This research measures service quality of parcel delivery in KSA and assesses the effect of SERVQUAL variables on customers’ overall satisfaction with parcel delivery services in KSA. Furthermore, the research identifies whether there are significant differences between Saudis and non-Saudis in their overall satisfaction with the parcel delivery service provided. The results showed that the quality of parcel delivery service provided by the logistics service companies varies between medium and high. There is no low assessment of service quality dimensions, reflecting the quality of service provided by these companies.
The results supported H1, that reliability has a significant positive effect on overall satisfaction with parcel delivery service in the Saudi logistics industry. The results confirmed that reliability as a dimension of service quality has the prime effect on overall service satisfaction, which is in line with previous research that reliability has the top effect on customer satisfaction [76]. It is in line with other studies on the banking industry, which confirmed that reliability is the most important aspect of service quality in satisfying customers [56]. This means that customers are looking for supportive and dependable staff when they look for a parcel delivery service. In addition, customers need to find the service as promised in order to ensure reliability of service quality and ultimately to effect their satisfaction.
The results supported H2, that there is a significant positive effect of tangibility on overall satisfaction with parcel delivery service in the Saudi logistics industry. This confirms that when staff are well dressed, show decent manners, smile when they provide a service and provide packages in good condition, this leads to customer satisfaction. Hence, the service providers should properly ensure that they ensure the dimension of tangibility, including the packaging service and the appearances of service provision staff, since they have a significant impact on customers’ satisfaction [77,78].
The results reinforced H3, that responsiveness was found to have a significant positive effect on overall service satisfaction. This is in agreement with previous research [51,59,61], which confirmed a positive significant effect of responsiveness, as a dimension of service quality, on a customer’s overall satisfaction with parcel delivery services. This was achieved because staff are helpful, greet customers, provide prompt service and check if they are satisfied with the provided service. However, the results did not support H4, as assurance had a positive effect, albeit not significant, on customers’ overall satisfaction with parcel delivery services provided by the logistics companies. This result is not in agreement with previous research studies (e.g., [57,59,62]), which confirmed a significant positive effect of assurance on customer satisfaction. However, in the context of a logistics service, assurance could contribute to customer satisfaction by reducing uncertainties. The insignificant influence could be because customers were not assured of the quality of contact by staff. They have concerns about the safety and security of their goods during transportation and storage phase, as they commented. Hence, service providers should ensure the quality of a parcel delivery service through measures such as advanced security systems, tracking technologies, and insurance options. This alleviates these concerns and enhances customer satisfaction especially in the digital era, where e-service quality has become important for customer satisfaction [8]. To ensure a significant positive effect of assurance as a dimension of service quality on customer satisfaction, service delivery staff should be polite to customers, knowledgeable and share product details and information [7,48].
The results supported H5, that empathy positively and significantly influence client overall satisfaction with parcel delivery service in the Saudi logistics industry. This is in line with previous research [46] that showed that the service quality dimension “empathy” has a positive influence on customer satisfaction. This includes anticipating the needs of customers, respecting them, addressing them by name and paying individual attention to customers. Thus, companies that provide the services should fully understand the requirements of their customers and be able to modify the service as per the customer’s preference. In addition, being accessible, reflective, and trying to understand the customer’s needs is another aspect of the empathy dimension. The employees of the organization should regularly try to identify or understand the needs and requirements of their customers. The staff should be able to meet their customers’ needs.
The results show that there is a significant difference between Saudis and non-Saudis in their overall satisfaction with parcel delivery services provided by the Saudi logistics industry. This result confirms that the national culture plays a key role in customers’ assessment of service quality and their overall satisfaction. This finding supports the work of Khan et al. [64], who also found that the culture of customers plays a prime role in a customer’s choice of service, using McDonalds as a case study. It also in line with the work of Sobaih et al. [24], who found that customers from Saudi culture and non-Saudis (i.e., UK) culture have differences in purchase intention and behavior regarding fast food items with nutrition labels between Saudis and UK customers. The reason for the difference in overall satisfaction between Saudis and non-Saudis may be attributed to the difference in the language spoken by service providers in most Saudi logistics companies, which is Arabic, and the language of most foreigners are not Arabic. This requires logistics companies to consider the differences in customers’ wants and needs, including their languages. Understanding the needs of different customers with different cultures is vital for providing quality services that meet their needs and for ensuring their satisfaction.
This study has various implications, whether for practitioners or for academics. The study sends an important message to academics regarding the role of culture in shaping customer satisfaction with parcel delivery services. A proper understanding of culture should have a positive impact on providing service quality in the logistics industry. The current research highlighted the importance of cultural differences in perceiving the quality of parcel delivery services and its relationship with customer satisfaction. The significant differences in overall satisfaction between Saudis and non-Saudis suggest that national culture plays a key role in customer perceptions of parcel delivery services. Logistics companies should consider the language preferences of their customer base and strive to understand the needs and preferences of customers from different cultures to provide tailored services that meet their expectations and ensure their satisfaction. This research demonstrates the importance of four SERVQUAL dimensions on overall customer satisfaction with parcel delivery service in the Saudi logistics industry. The study confirmed the significance of reliability, tangibility, responsiveness, and empathy as dimensions that positively affect customer satisfaction.
Managerial implications of this research indicate the areas on which service providers should focus to improve their customers’ satisfaction. More specifically, logistics companies should pay attention to training their staff, ensuring staff members are well dressed, display appropriate manners, smile, and deliver packages in good condition. Additionally, they should prioritize responsiveness by training staff to be helpful, greet customers, provide prompt service, and check for customer satisfaction. Assuring customers of the safety and security of their goods during transportation and storage through advanced security systems, tracking technologies, and insurance options can also contribute to customer satisfaction. Finally, service providers should prioritize empathy by anticipating customer needs, respecting them, addressing them individually, and offering personalized attention.

6. Conclusions, Limitations and Future Research Venues

This study assessed the quality of parcel delivery services in KSA and examined the effect of the five dimensions of service quality: tangibility, responsiveness, empathy, assurance, and reliability on a customer’s overall satisfaction with parcel delivery services in the KSA logistics industry. The study concluded that the dimension of reliability has the highest effect on a customer’s overall satisfaction, followed by the dimension of empathy, then tangibility and responsiveness. The results of regression analysis showed there was a significant effect for the four dimensions of service quality on a customer’s overall satisfaction. However, the results did not confirm a significant effect of assurance on a customer’s overall satisfaction, although a positive effect was confirmed but insignificant. On the other side, the study showed the prime role of culture in customer satisfaction and assessment of service quality as statistically significant differences between Saudis and non-Saudis regarding their overall satisfaction with parcel delivery services. The results are important for the logistics companies, which aim to meet the needs of their customers.
This study relied on a self-reporting tool of data collection using a survey, which may have a limitation due to sample size and characteristics in the Eastern Province of KSA. It is therefore recommended that the study should be expanded to include a higher percentage of women, as well as persons from other KSA regions. Examinations of other variables such as a customer’s trust and behavioral intention could also be used in other studies. Another opportunity for further research is to adopt other methods, such as Multi-Criteria Decision Making (MCDM).

Author Contributions

Conceptualization, A.E.E.S. and A.A.; methodology, A.E.E.S. and A.A.; software, A.A.; validation, A.E.E.S. and A.A.; formal analysis, A.E.E.S. and A.A.; investigation, A.E.E.S. and A.A.; resources, A.E.E.S.; data curation, A.E.E.S. and A.A.; writing—original draft preparation, A.E.E.S. and A.A.; writing—review and editing, A.E.E.S.; visualization A.E.E.S.; super-vision, A.E.E.S.; project administration, A.E.E.S.; funding acquisition, A.E.E.S. All authors have read and agreed to the published version of the manuscript.

Funding

This work was supported by the Deanship of Scientific Research, Vice Presidency for Graduate Studies and Scientific Research, King Faisal University, Saudi Arabia [GRANT4229].

Data Availability Statement

Data is available upon request from researchers who meet the eligibility criteria. Kindly contact the first author privately through the e-mail.

Conflicts of Interest

The authors declare no conflict of interest.

References

  1. Khan, S.A.R.; Zhang, Y.; Kumar, A.; Zavadskas, E.; Streimikiene, D. Measuring the impact of renewable energy, public health expenditure, logistics, and environmental performance on sustainable economic growth. Sustain. Dev. 2020, 28, 833–843. [Google Scholar] [CrossRef]
  2. Muneer, S. The information system management and its infrastructure for supply chain management as antecedents of financial performance. J. Asian Financ. Econ. Bus. 2020, 7, 229–238. [Google Scholar] [CrossRef]
  3. Restuputri, D.P.; Fridawati, A.; Masudin, I. Customer Perception on Last-Mile Delivery Services Using Kansei Engineering and Conjoint Analysis: A Case Study of Indonesian Logistics Providers. Logistics 2022, 6, 29. [Google Scholar] [CrossRef]
  4. Kotler, P. Marketing Management, Millenium Edition; Prentice-Hall, Inc.: Hoboken, NJ, USA, 2001. [Google Scholar]
  5. Wulanjani, H.; Derriawan, D. Dampak utilitarian value dan experiential marketing terhadap customer satisfaction dan revisit intention. J. Ris. Manaj. Bisnis 2018, 2, 121–130. [Google Scholar] [CrossRef]
  6. Oliver, R.L. Satisfaction: A Behavioral Perspective on the Consumer: A Behavioral Perspective on the Consumer; Routledge: London, UK, 2014. [Google Scholar]
  7. Parasuraman, A.; Zeithaml, V.A.; Berry, L.L. A conceptual model of service quality and its implications for future research. J. Mark. 1985, 49, 41–50. [Google Scholar] [CrossRef]
  8. Al Hamli, S.S.; Sobaih, A.E.E. Factors influencing consumer behavior towards online shopping in Saudi Arabia amid COVID-19: Implications for E-businesses post pandemic. J. Risk Financ. Manag. 2023, 16, 36. [Google Scholar] [CrossRef]
  9. Rita, P.; Oliveira, T.; Farisa, A. The impact of e-service quality and customer satisfaction on customer behavior in online shopping. Heliyon 2019, 5, e02690. [Google Scholar] [CrossRef]
  10. Masudin, I.; Hanifah, Y.K.P.; Dewi, S.K.; Restuputri, D.P.; Handayani, D.I. Customer Perception of Logistics Service Quality Using SIPA and Modified Kano: Case Study of Indonesian E-Commerce. Logistics 2022, 6, 51. [Google Scholar] [CrossRef]
  11. Stone, M.; Woodcock, N.; Wilson, M. Managing the change from marketing planning to customer relationship management. Long Range Plan. 1996, 29, 675–683. [Google Scholar] [CrossRef]
  12. Li, M.L.; Green, R.D. A mediating influence on customer loyalty: The role of perceived value. J. Manag. Mark. Res. 2011, 7, 1. [Google Scholar]
  13. Anderson, R.E.; Swaminathan, S. Customer satisfaction and loyalty in e-markets: A PLS path modeling approach. J. Mark. Theory Pract. 2011, 19, 221–234. [Google Scholar] [CrossRef]
  14. Setó-Pamies, D. Customer loyalty to service providers: Examining the role of service quality, customer satisfaction and trust. Total Qual. Manag. Bus. Excell. 2012, 23, 1257–1271. [Google Scholar] [CrossRef]
  15. Gitomer, J. Customer Satisfaction Is Worthless, Customer Loyalty Is Priceless: How to Make Customers Love You, Keep Them Coming Back, and Tell Everyone They Know; Bard Press: Austin, TX, USA, 1998. [Google Scholar]
  16. Bayraktar, E.; Tatoglu, E.; Turkyilmaz, A.; Delen, D.; Zaim, S. Measuring the efficiency of customer satisfaction and loyalty for mobile phone brands with DEA. Expert Syst. Appl. 2012, 39, 99–106. [Google Scholar] [CrossRef]
  17. Leland, K.; Bailey, K. Customer Service for Dummies; IDG Books: Foster City, CA, USA, 1995. [Google Scholar]
  18. Kotze, T. The Effect of National Culture on Customer Satisfaction in Call Centres Across National Borders. Ph.D. Thesis, University of Pretoria, Pretoria, South Africa, 2012. Available online: http://hdl.handle.net/2263/23069 (accessed on 2 September 2023).
  19. Morgeson, F.V.; Mithas, S.; Keiningham, T.L.; Aksoy, L. An investigation of the cross-national determinants of customer satisfaction. J. Acad. Mark. Sci. 2011, 39, 198–215. [Google Scholar] [CrossRef]
  20. Tsoukatos, E.; Rand, G.K. Cultural influences on service quality and customer satisfaction: Evidence from Greek insurance. Manag. Serv. Qual. 2007, 17, 467–485. [Google Scholar] [CrossRef]
  21. Lagrosen, S. Exploring the impact of culture on quality management. Int. J. Qual. Reliab. Manag. 2003, 20, 473–487. [Google Scholar] [CrossRef]
  22. Hofstede, G. Culture and organizations. Int. Stud. Manag. Organ. 1980, 10, 15–41. [Google Scholar] [CrossRef]
  23. Patterson, P.G.; Mattila, A.S. An examination of the impact of cultural orientation and familiarity in service encounter evaluations. Int. J. Serv. Ind. Manag. 2008, 19, 662–681. [Google Scholar] [CrossRef]
  24. Sobaih, A.E.E.; Algezawy, M.; Elshaer, I.A. Adopting an Extended Theory of Planned Behaviour to Examine Buying Intention and Behaviour of Nutrition-Labelled Menu for Healthy Food Choices in Quick Service Restaurants: Does the Culture of Consumers Really Matter? Int. J. Environ. Res. Public Health 2023, 20, 4498. [Google Scholar] [CrossRef]
  25. Mentzer, J.T.; Flint, D.J.; Hult, G.T.M. Logistics service quality as a segment-customized process. J. Mark. 2001, 65, 82–104. [Google Scholar] [CrossRef]
  26. Bienstock, C.C.; Royne, M.B.; Sherrell, D.; Stafford, T.F. An expanded model of logistics service quality: Incorporating logistics information technology. Int. J. Prod. Econ. 2008, 113, 205–222. [Google Scholar] [CrossRef]
  27. Gulc, A. Models and Methods of Measuring the Quality of Logistic Service. Procedia Eng. 2017, 182, 255–264. [Google Scholar] [CrossRef]
  28. Parasuraman, A.; Berry, L.; Zeithaml, V. Refinement and reassessment of the SERVQUAL scale. J. Retail. 2002, 67, 114. [Google Scholar]
  29. Kotler, P.; Keller, K.L. Marketing Management, 14th ed.; Pearson Education: Upper Saddle River, NJ, USA, 2013. [Google Scholar]
  30. Asnawi, N.; Sukoco, B.M.; Fanani, M.A. The role of service quality within Indonesian customers satisfaction and loyalty and its impact on Islamic banks. J. Islam. Mark. 2019, 11, 192–212. [Google Scholar] [CrossRef]
  31. Boonlertvanich, K. Service quality, satisfaction, trust, and loyalty: The moderating role of mainbank and wealth status. Int. J. Bank Mark. 2019, 37, 278–302. [Google Scholar] [CrossRef]
  32. Agustiansyah, E.C.; Taufik, E.R. Mediasi Kepuasan Nasabah Pada Pengaruh Kualitas Pelayanan dan Citra Perusahaan Terhadap Loyalitas (Studi Pada PT. Bank Syariah Mandiri KCP Pandeglang). J. Ris. Bisnis Manaj. Tirtayasa 2019, 3, 1–19. [Google Scholar]
  33. Islam, R.; Ahmed, S.; Rahman, M.; Al Asheq, A. Determinants of service quality and its effect on customer satisfaction and loyalty: An empirical study of private banking sector. TQM J. 2020, 33, 1163–1182. [Google Scholar] [CrossRef]
  34. Miklós-Thal, J.; Tucker, C. Collusion by algorithm: Does better demand prediction facilitate coordination between sellers? Manag. Sci. 2019, 65, 1552–1561. [Google Scholar] [CrossRef]
  35. Sureshchander, G.S.; Rajendran, C.; Anatharaman, R.N. The relationship between service quality and customer satisfaction: A factor specific approach. J. Serv. Mark. 2002, 16, 363–379. [Google Scholar] [CrossRef]
  36. McColl-Kennedy, J.; Schneider, U. Measuring customer satisfaction: Why, what and how. Total Qual. Manag. 2000, 11, 883–896. [Google Scholar] [CrossRef]
  37. Marković, S.; Raspor, S.; Šegarić, K. Does restaurant performance meet customers’ expectations? An assessment of restaurant service quality using a modified DINESERV approach. Tour. Hosp. Manag. 2010, 16, 181–195. [Google Scholar] [CrossRef]
  38. Olson, J.C.; Dover, P.A. Disconfirmation of consumer expectations through product trial. J. Appl. Psychol. 1979, 64, 179. [Google Scholar] [CrossRef]
  39. Kim, M.G.; Mattila, A.S. Does a surprise strategy need words? The effect of explanations for a surprise strategy on customer delight and expectations. J. Serv. Mark. 2013, 27, 361–370. [Google Scholar]
  40. Johnston, R.; Kong, X. The customer experience: A road-map for improvement. Manag. Serv. Qual. 2011, 21, 5–24. [Google Scholar] [CrossRef]
  41. Haseki, M.I. Customer Expectations in Mall Restaurants: A Case Study. Int. J. Bus. Soc. 2013, 14, 41–60. [Google Scholar]
  42. Yarimoglu, E.K. A review on dimensions of service quality models. J. Mark. Manag. 2014, 2, 79–93. [Google Scholar]
  43. Angelova, B.; Zekiri, J. Measuring customer satisfaction with service quality using American Customer Satisfaction Model (ACSI Model). Int. J. Acad. Res. Bus. Soc. Sci. 2011, 1, 232–258. [Google Scholar] [CrossRef]
  44. Rauch, D.A.; Collins, M.D.; Nale, R.D.; Barr, P.B. Measuring service quality in mid-scale hotels. Int. J. Contemp. Hosp. Manag. 2015, 27, 87–106. [Google Scholar] [CrossRef]
  45. Vazquez, R.; Rodríguez-Del Bosque, I.A.; Díaz, A.M.; Ruiz, A.V. Service quality in supermarket retailing: Identifying critical service experiences. J. Retail. Consum. Serv. 2001, 8, 1–14. [Google Scholar] [CrossRef]
  46. Mauri, A.G.; Minazzi, R.; Muccio, S. A review of literature on the gaps model on service quality: A 3-decades period: 1985–2013. Int. Bus. Res. 2013, 6, 134–144. [Google Scholar] [CrossRef]
  47. Buttle, F. SERVQUAL: Review, critique, research agenda. Eur. J. Mark. 1995, 30, 8–32. [Google Scholar] [CrossRef]
  48. Parasuraman, A.; Zeithaml, V.A.; Berry, L.L. Servqual: A multiple-item scale for measuring consumer perc. J. Retail. 1988, 64, 12. [Google Scholar]
  49. Siddiqi, K.O. Interrelations between service quality attributes, customer satisfaction and customer loyalty in the retail banking sector in Bangladesh. Int. J. Bus. Manag. 2011, 6, 12–36. [Google Scholar] [CrossRef]
  50. Ladhari, R.; Souiden, N.; Ladhari, I. Determinants of loyalty and recommendation: The role of perceived service quality, emotional satisfaction and image. J. Financ. Serv. Mark. 2011, 16, 111–124. [Google Scholar] [CrossRef]
  51. Lau, M.M.; Cheung, R.; Lam, A.Y.; Chu, Y.T. Measuring service quality in the banking industry: A Hong Kong based study. Contemp. Manag. Res. 2013, 9, 263–282. [Google Scholar] [CrossRef]
  52. Parasuraman, A.; Zeithaml, V.A.; Berry, L.L. Reassessment of expectations as a comparison standard on measuring service quality: Implications for further research. J. Mark. 1994, 58, 111–124. [Google Scholar] [CrossRef]
  53. Parasuraman, A.; Berry, L.L.; Zeithaml, V.A. Understanding customer expectations of service. Sloan Manag. Rev. 1991, 32, 39–48. [Google Scholar]
  54. Ennew, C.; Waite, N.; Waite, R. Financial Services Marketing: An International Guide to Principles and Practice; Routledge: London, UK, 2013; ISBN 978-0-415-52167-3. [Google Scholar]
  55. Pakurár, M.; Haddad, H.; Nagy, J.; Popp, J.; Oláh, J. The Service Quality Dimensions that Affect Customer Satisfaction in the Jordanian Banking Sector. Sustainability 2019, 11, 1113. [Google Scholar] [CrossRef]
  56. Peng, L.S.; Moghavvemi, S. The dimension of service quality and its impact on customer satisfaction, trust, and loyalty: A case of Malaysian banks. Asian J. Bus. Account. 2015, 8, 91–122. [Google Scholar]
  57. Munusamy, J.; Chelliah, S.; Mun, H.W. Service quality delivery and its impact on customer satisfaction in the banking sector in Malaysia. Int. J. Innov. Manag. Technol. 2010, 1, 398–404. [Google Scholar]
  58. Krishnamurthy, R.; SivaKumar, M.A.K.; Sellamuthu, P. Influence of service quality on customer satisfaction: Application of SERVQUAL model. Int. J. Bus. Manag. 2010, 5, 117–124. [Google Scholar] [CrossRef]
  59. Selvakumar, J.J. Impact of service quality on customer satisfaction in public sector and private sector banks. Purushartha J. Manag. Ethics Spirit 2016, 8, 1–12. [Google Scholar]
  60. Ananth, A.; Ramesh, R.; Prabaharan, B. Service quality gap analysis in private sector bank-a customer perspective. Indian J. Commer. Manag. Stud. 2010, 2, 245–252. [Google Scholar]
  61. Kant, R.; Jaiswal, D. The impact of perceived service quality dimensions on customer satisfaction: An empirical study on public sector banks in India. Int. J. Bank Mark. 2017, 35, 411–430. [Google Scholar] [CrossRef]
  62. Shanka, M.S. Bank service quality, customer satisfaction and loyalty in Ethiopian banking sector. J. Bus. Admin. Manag. Sci. Res. 2012, 1, 1–9. [Google Scholar]
  63. Navaratnaseel, J.; Periyathampy, E. Impact of Servıce Quality on Customer Satisfaction: A Study on Customers of Commercial Bank of Ceylon PLC Trincomalee District. In Proceedings of the Reshaping Management and Economic Thinking through Integrating Eco-Friendly and Ethical Practices, 3rd International Conference on Management and Economics, Ruhuna, Sri Lanka, 26–27 February 2014; pp. 359–364. [Google Scholar]
  64. Khan, M.A.; Sobaih, A.E.E.; Lee, K.; Ha, I. Cultural differences and McDonald’s: A multi-country comparative study. Int. J. Bus. Glob. 2022, 31, 391–411. [Google Scholar] [CrossRef]
  65. Sun, G.; D’Alessandro, S.; Johnson, L. Traditional culture, political ideologies, materialism and luxury consumption in China. Int. J. Consum. Stud. 2014, 38, 578–585. [Google Scholar] [CrossRef]
  66. De Mooij, M.; Hofstede, G. The Hofstede model: Applications to global branding and advertising strategy and research. Int. J. Advert. 2010, 29, 85–110. [Google Scholar] [CrossRef]
  67. Hofstede, G. Empirical Models of Cultural Differences. In Contemporary Issues in Cross-Cultural Psychology; Swets & Zeitlinger Publishers: Lisse, The Netherlands, 1991. [Google Scholar]
  68. Dawar, N.; Parker, P. Marketing universals: Consumers’ use of brand name, price, physical appearance, and retailer reputation as signals of product quality. J. Mark. 1994, 58, 81–95. [Google Scholar]
  69. Roth, M.S. The effects of culture and socioeconomics on the performance of global brand image strategies. J. Mark. Res. 1995, 32, 163–175. [Google Scholar] [CrossRef]
  70. Saleh, F.; Ryan, C. Analysing Service Quality in the Hospitality Industry Using the SERVQUAL Model. Serv. Ind. J. 1991, 11, 324–345. [Google Scholar] [CrossRef]
  71. Muneeb, F.M.; Chughtai, M.S.; Anjum, U.; Ma, J. Fostering Employee’s Service Quality and Customer Satisfaction: Evidence from Emerging Pakistan. Bus. Ethics Leadersh. 2019, 3, 47–67. [Google Scholar] [CrossRef]
  72. Elo, S.; Kääriäinen, M.; Kanste, O.; Pölkki, T.; Utriainen, K.; Kyngäs, H. Qualitative content analysis: A focus on trustworthiness. SAGE Open 2014, 4, 1–10. [Google Scholar] [CrossRef]
  73. Roussel, P. Ladders Development Methods for Survey Questionnaires. In Human Resource Management: Social Science Research Methods; Roussel, P., Wacheux, F., Eds.; De Boeck: Brussels, Belgium, 2005. [Google Scholar]
  74. Krejcie, R.V.; Morgan, D.W. Determining sample size for research activities. Educ. Psychol. Meas. 1970, 30, 607–610. [Google Scholar] [CrossRef]
  75. Taherdoost, H. Sampling methods in research methodology; how to choose a sampling technique for research. Int. J. Acad. Res. Manag. 2016, 5, 18–27. [Google Scholar] [CrossRef]
  76. Zeithaml, V.A.; Parasuraman, A.; Malhotra, A. Service quality delivery through web sites: A critical review of extant knowledge. J. Acad. Mark. Sci. 2002, 30, 362–375. [Google Scholar] [CrossRef]
  77. Sohn, C.; Tadisina, S.K. Development of e-service quality measure for internet-based financial institutions. Total Qual. Manag. 2008, 19, 903–918. [Google Scholar] [CrossRef]
  78. Ding, Y.; Keh, H.T. Consumer reliance on intangible versus tangible attributes in service evaluation: The role of construal level. J. Acad. Mark. Sci. 2017, 45, 848–865. [Google Scholar] [CrossRef]
Figure 1. A summary of the research framework (developed the author).
Logistics 07 00094 g001
Table 1. Participant Demographics.
DistributionFrequencyPercentage
GenderMale36490.1
Female409.9
AgeBetween 18–30 years16039.6
Between 31–40 years14034.7
Between 41–50 years6816.8
Over 50 years368.9
NationalitySaudi19849.1
Non-Saudi20650.9
Number of times using parcel delivery service 1 time a month11027.2
2 times a month11628.7
3 times a month327.9
4 to 5 times a month327.9
6 to 10 times a month4611.4
More than 10 times a month6816.9
Table 2. The Descriptive Results.
ClauseMeanStd. DeviationLevel
Tangibility3.680.24high
Staff are well dressed and neat3.710.31high
Have up-to-date equipment3.370.20middle
They exhibit good manners3.980.18high
They provide good packaging3.670.28high
They smile while performing the service3.680.27high
Reliability3.780.22high
They are supportive3.670.27high
They are dependable3.780.22high
They perform the service as promised3.910.18high
Responsiveness3.540.34middle
They are helpful3.440.29middle
They inform us about services3.490.46middle
They check customer satisfaction3.450.41middle
They greet the customer3.730.27high
They provide the service promptly3.620.30middle
Assurance3.710.31high
They are polite to customers3.850.21high
They communicate with us in a kind and cordial tone3.810.31high
They advise undecided customers3.620.37middle
They are knowledgeable 3.530.31middle
Empathy3.730.27high
They anticipate customers’ needs3.860.21high
They respect the customer3.840.31high
They address the customer by name3.750.27high
They perform the service with individual attention3.450.31middle
Overall Service Satisfaction3.750.25high
Logistics services provided in Saudi Arabia is the best choice3.550.28middle
I think the service provided by logistics companies in Saudi Arabia meets my expectations3.960.19high
I am overall satisfied with the logistics services in Saudi Arabia3.750.28high
Table 3. The Results of Pearson Correlation Test.
TangibilityReliabilityResponsivenessAssuranceEmpathyOverall Service Satisfaction
Tangibility1
Reliability0.503 **1
Responsiveness0.403 **0.421 **1
Assurance0.607 **0.530 **0.399 **1
Empathy0.579 **0.519 **0.484 **0.501 **1
Overall Service Satisfaction0.542 **0.443 **0.611 **0.452 **0.535 **1
** p < 0.01.
Table 4. The Result of Multiple Regression.
D.VModel SummaryANOVACoefficients
RR2FSigVariableBStandard ErrorTSig
Overall Service Satisfaction0.8660.75056.2830.000Tangibility0.3050.392.810.043
Reliability0.4570.1373.340.001
Responsiveness0.2910.1511.9270.046
Assurance0.0650.1420.0640.651
Empathy0.4560.1602.8490.005
Table 5. A Comparison of Overall Satisfaction with Parcel Delivery Service between Saudi and Non-Saudi.
NationalityNMeanStd. DeviationTSig. (2-Tailed)
Overall SatisfactionSaudi283.951.142.0520.045
Non Saudi723.411.23
Disclaimer/Publisher’s Note: The statements, opinions and data contained in all publications are solely those of the individual author(s) and contributor(s) and not of MDPI and/or the editor(s). MDPI and/or the editor(s) disclaim responsibility for any injury to people or property resulting from any ideas, methods, instructions or products referred to in the content.

