Article

Analyzing Key Performance Indicators for Mobility Logistics in Smart and Sustainable Cities: A Case Study Centered on Barcelona

by
Raquel Soriano-Gonzalez
1,
Elena Perez-Bernabeu
1,
Yusef Ahsini
1,
Patricia Carracedo
1,
Andres Camacho
2 and
Angel A. Juan
1,*
1
Research Center on Production Management and Engineering, Universitat Politècnica de València, Ferrandiz-Carbonell, 03802 Alcoy, Spain
2
Department of Communications, Universitat Politècnica de València, Ferrandiz-Carbonell, 03802 Alcoy, Spain
*
Author to whom correspondence should be addressed.
Logistics 2023, 7(4), 75; https://doi.org/10.3390/logistics7040075
Submission received: 10 August 2023 / Revised: 8 October 2023 / Accepted: 12 October 2023 / Published: 16 October 2023

Abstract

:
Background: This article identifies and examines key performance indicators (KPIs) related to citizen mobility logistics in smart and sustainable urban areas. It begins with a comprehensive literature review to identify essential KPIs, offering valuable insights for both public and private stakeholders, including policymakers and mobility service providers. Drawing from various mobility projects in smart cities, the study extracts common KPIs and best practices. The focus of the paper then turns to Barcelona, Spain, where KPIs that matter most are analyzed. Methods: Using open data from the city council spanning from 2017 onwards, the study provides insights into the evolving mobility logistics landscape. KPIs from other European cities are also considered by utilizing similar open data sources. This comparative analysis provides valuable benchmarks and reveals disparities in mobility logistics. Throughout this investigation, the paper emphasizes the role of data quality in KPI selection. Results: Reliable open data significantly influence indicator choices and present challenges when comparing cities. Remarkably, the findings consistently highlight environmental data as an area requiring attention in sustainable mobility logistics. Conclusions: This paper makes contributions by identifying and examining KPIs relevant to citizen mobility logistics in smart and sustainable urban areas. It offers insights by applying these KPIs to Barcelona and conducting comparative analyses with other European cities. These findings serve as a valuable resource for policymakers, city planners, and mobility experts.

1. Introduction

Mobility and transportation logistics are vital elements in developing smart and sustainable cities worldwide [1,2]. The growth of on-demand economies and e-commerce [3] has led to an increase in transportation and mobility activities in urban and metropolitan areas [4,5] and in last-mile logistics [6,7,8]. Consequently, the use of zero-emission vehicles such as electric vehicles [9,10], unmanned aerial vehicles [11], and autonomous vehicles [12,13] has been steadily rising in cities. This trend has increased the popularity of new transportation services, carsharing and ridesharing [14,15,16], or bike sharing services [17]. As these changes reshape urban transportation, it becomes increasingly crucial to identify KPIs capable of effectively measuring the current state of mobility logistics in smart and sustainable urban areas worldwide. European cities, in particular, have made this a primary objective [18]. Governments are implementing numerous programs for smart cities and intelligent infrastructure aimed at enhancing people’s quality of life and assisting city administrators in improving the efficiency and management of public infrastructures [19,20].
Sustainable mobility logistics [21,22], a fundamental component of smart cities, is defined as meeting society’s need for freedom of movement, access, communication, commerce, and relationships without compromising essential human or ecological values, both now and in the future [23,24]. This holistic concept encompasses dimensions such as the global environment, quality of life, economic success, and transportation systems [19]. While these topics have garnered significant attention from researchers and there is an ongoing effort to standardize KPIs for citizen mobility [25], a major challenge lies in the lack of necessary data and the quality of the available indicators [26,27]. Furthermore, each city collects a distinct set of data to calculate its own KPIs [28], making it difficult to establish fair comparisons and assess performance in promoting mobility logistics practices and policies [29]. This work aims to address these challenges by utilizing the Open Data Barcelona initiative (https://opendata-ajuntament.barcelona.cat, accessed on 11 October 2023), as well as similar open data sources across Europe. An effort is made to calculate KPI values that are both meaningful to urban logistics planners [30] and based on high-quality data that can be readily obtained from many modern cities.
The research questions and the objectives for each stage of the present study are shown in Figure 1. Thus, the following research questions are formulated: (i) what are the most commonly used KPIs for quantifying sustainable mobility?; (ii) how does the data source influence the choice of KPIs?; (iii) how can open data initiatives, like Open Data Barcelona, support KPIs calculation in urban logistics?; and (iv) what is the current state of mobility logistics in the city of Barcelona and how does it compare with other Euroepan cities? Likewise, the associated specific goals are as follows: (i) to review and classify urban logistics KPIs in the scientific literature; (ii) to select sustainable urban logistics KPIs based on open data repositories; (iii) to perform a data analysis of the selected KPIs for the city of Barcelona; and (iv) to complete a comparison of KPIs across different European cities.
Accordingly, the main contributions of this work can be summarized as follows: (i) an extensive literature review aimed at identifying and categorizing key performance indicators relevant to citizens’ mobility in smart and sustainable urban areas, thus creating a framework of mobility logistics; (ii) the computation of the proposed KPIs for the city of Barcelona as a case study; and (iii) a comparison of KPIs among different European cities.
The rest of the paper follows the structure described next. Section 2 provides a comprehensive literature review on the utilization of KPIs in the context of mobility logistics in smart and sustainable cities, while classifying the identified KPIs into different dimensions: environmental, socio-economic, and transportation. Section 3 focuses on selecting particularly valuable KPIs for city managers. Specific KPIs are selected and then computed for the city of Barcelona using an adapted version of the Eltis methodology in Section 4. Section 5 shows a comparative analysis with KPI values from other European cities. Section 6 provides a comprehensive analysis of the KPIs, their implications, and comparative insights. Finally, Section 7 presents the main findings and limitations of this study, while suggesting possible directions for future research.

2. Literature Review

In order to analyze related work on the topics of this paper, the following keywords have been considered: “smart cities”, “smart mobility”, “sustainable mobility”, and “key performance indicators”. Online databases such as Scopus and Web of Science are used as search engines, as they include a wide range of relevant journals and technical reports. With this search, a total of 47 scientific articles were downloaded. Only 14 were used in the literature review since they proposed KPIs on sustainable urban mobility in smart cities [31]. In addition, this information has been supplemented with websites maintained by the European Commission and several city councils. In the literature on smart and sustainable cities, articles analyzing the characteristics of these urban regions, along with information facilitating visualization, are readily available. For example, the article by Javed et al. [32] discusses the requirements for a city to be considered as ‘smart’, including its technological and implementation challenges. Likewise, Han and Kim [33] develop research on the smart city mobility process and how it affects other urban development areas. Studies on smart city modeling can be found in De Sanctis et al. [34], which uses engineering techniques to model smart cities and KPIs to obtain an evaluation engine and an automatic visualization of indicators. Similarly, in order to facilitate decision-making, Inac and Oztemel [35] describe a city evaluation model based on the digital transformation of transportation services. Kourtzanidis et al. [36] report on a new framework for globally assessing the footprint of smart city projects, including the necessary methods for standardization, weighting, and aggregation of KPIs. The model proposed by Pereira et al. [37] links mobility terms to show flexible, multidimensional relationships, thus demonstrating that transportation services cannot be considered separately within the smart city. Larrinaga [38] provides a holistic architecture that integrates different urban measures in the city of Vitoria-Gasteiz. Their work shows a simulation platform in which intelligent algorithms and KPI calculation methods deliver results in the form of dashboards for decision-making.
Ntafalias et al. [39] present some approaches to define KPIs as a tool to measure different impacts on cities, a deep understanding of the city’s objectives, and an in-depth analysis of the actions planned by stakeholders. In addition, Quijano et al. [40] define a framework for assessing smart and sustainable cities using KPIs to holistically cover all key pillars: environment, energy, mobility, information and communication technologies (ICTs), citizens, economy, and governance. They define concepts and terms to guide urban planners in implementing smart cities. Pinna et al. [41] explore the main aspects of smart mobility in different Italian cities, concluding that both car and bike-sharing mobility is changing in recent years. Nagy and Csiszár [42] review and analyze the quality of smart mobility, proposing an optimization method to reach acceptable levels of defined KPIs. Moreover, shared mobility systems are analyzed in the paper by Golpayegani et al. [43]. These authors highlight some critical requirements that are needed to facilitate shared mobility systems. Different evaluation criteria have been found; [44,45] assess cooperative, autonomous, shared, and electric mobility applications. These authors propose to replace traditional methods with techniques that include new technologies. They use four types of horizontal evaluation: KPIs to assess performance and impacts, focused interviews, variations in safety audits, and matrix evaluation of qualitative terms. Al Haddad et al. [46] evaluate urban air mobility and propose an evaluation methodology that combines subjective methods (rating) with more objective statistical methods (standard deviation and mean). Both authors encounter obstacles in the accessibility of data and subjectivity in the weighting of the KPIs. Paiva et al. [47] perform an overview of how smart mobility fits into smart cities by characterizing its main attributes and the key benefits of using smart and sustainable mobility in a smart city ecosystem.
The European Commission has developed a comprehensive set of practical and reliable indicators (SUMI) that helps cities to make a standardized assessment of their mobility system and to measure improvements resulting from new mobility practices or policies (https://transport.ec.europa.eu/transport-themes/clean-transport-urban-transport/sumi_es, accessed on 11 October 2023). These indicators are a tool to identify the strengths and weaknesses of their mobility system in order to make improvements and to be able to assess the changes made and their impact. Furthermore, the Urban Mobility Observatory, also funded by the European Commission, provides information and experiences in the field of urban mobility in Europe (https://www.eltis.org/mobility-plans/european-platform, accessed on 11 October 2023). It introduces a guide to the methodology and methods of calculating sustainable urban mobility indicators, the so-called Eltis Method. The European Commission’s SHOW project, based on the automation of smart mobility operating models for global adoption, supports the migration towards efficient and sustainable urban transport, and also selects indicators that are relevant to the business and operating models of shared, connected, electrified, and autonomous fleets (https://show-project.eu/, accessed on 11 October 2023).
The objective of this work is twofold: (i) to establish a comprehensive set of KPIs that enable a thorough assessment of mobility performance, with a particular emphasis on sustainability; and (ii) to identify the strengths and weaknesses of the mobility logistics system in modern cities, focusing specifically on the city of Barcelona. The KPIs have been categorized into three main groups, according to their nature: (i) environmental indicators; (ii) socio-economic indicators; and (iii) transportation-related indicators. In order to determine the relevance of each indicator for this study, each one was examined and evaluated, considering the associated categories of municipalities, private transportation companies, and end-users. Notice that a single KPI may have value across multiple categories. The socio-economic KPI analysis is presented in Table 1. The detailed analysis of transportation-related KPIs can be found in Table 2, as well as in Table 3. Lastly, the results of the environmental KPI analysis are summarized in Table 4.
The results presented in these tables demonstrate the considerable interest of the research community in developing KPIs to measure various dimensions of smart and sustainable cities. Multiple KPIs can be employed to assess the performance of a city, depending on the specific dimension being evaluated. While there is no definitive formula for selecting the most appropriate KPIs, several general guidelines can be observed. Thus, cities should prioritize measuring the aspects that truly matter to their specific context and objectives. It is important to note that, while some of the defined KPIs may appear similar, they are not necessarily assessed in the same manner. Therefore, the selection of KPIs should align with the desired outcome and be guided by predefined criteria. City policymakers should provide precise definitions for each KPI, as different authors may employ different KPIs to measure similar concepts. It is worth noting that studies focusing on KPIs for end-users are relatively scarce, although some authors have examined satisfaction levels with carsharing services as an example [52].

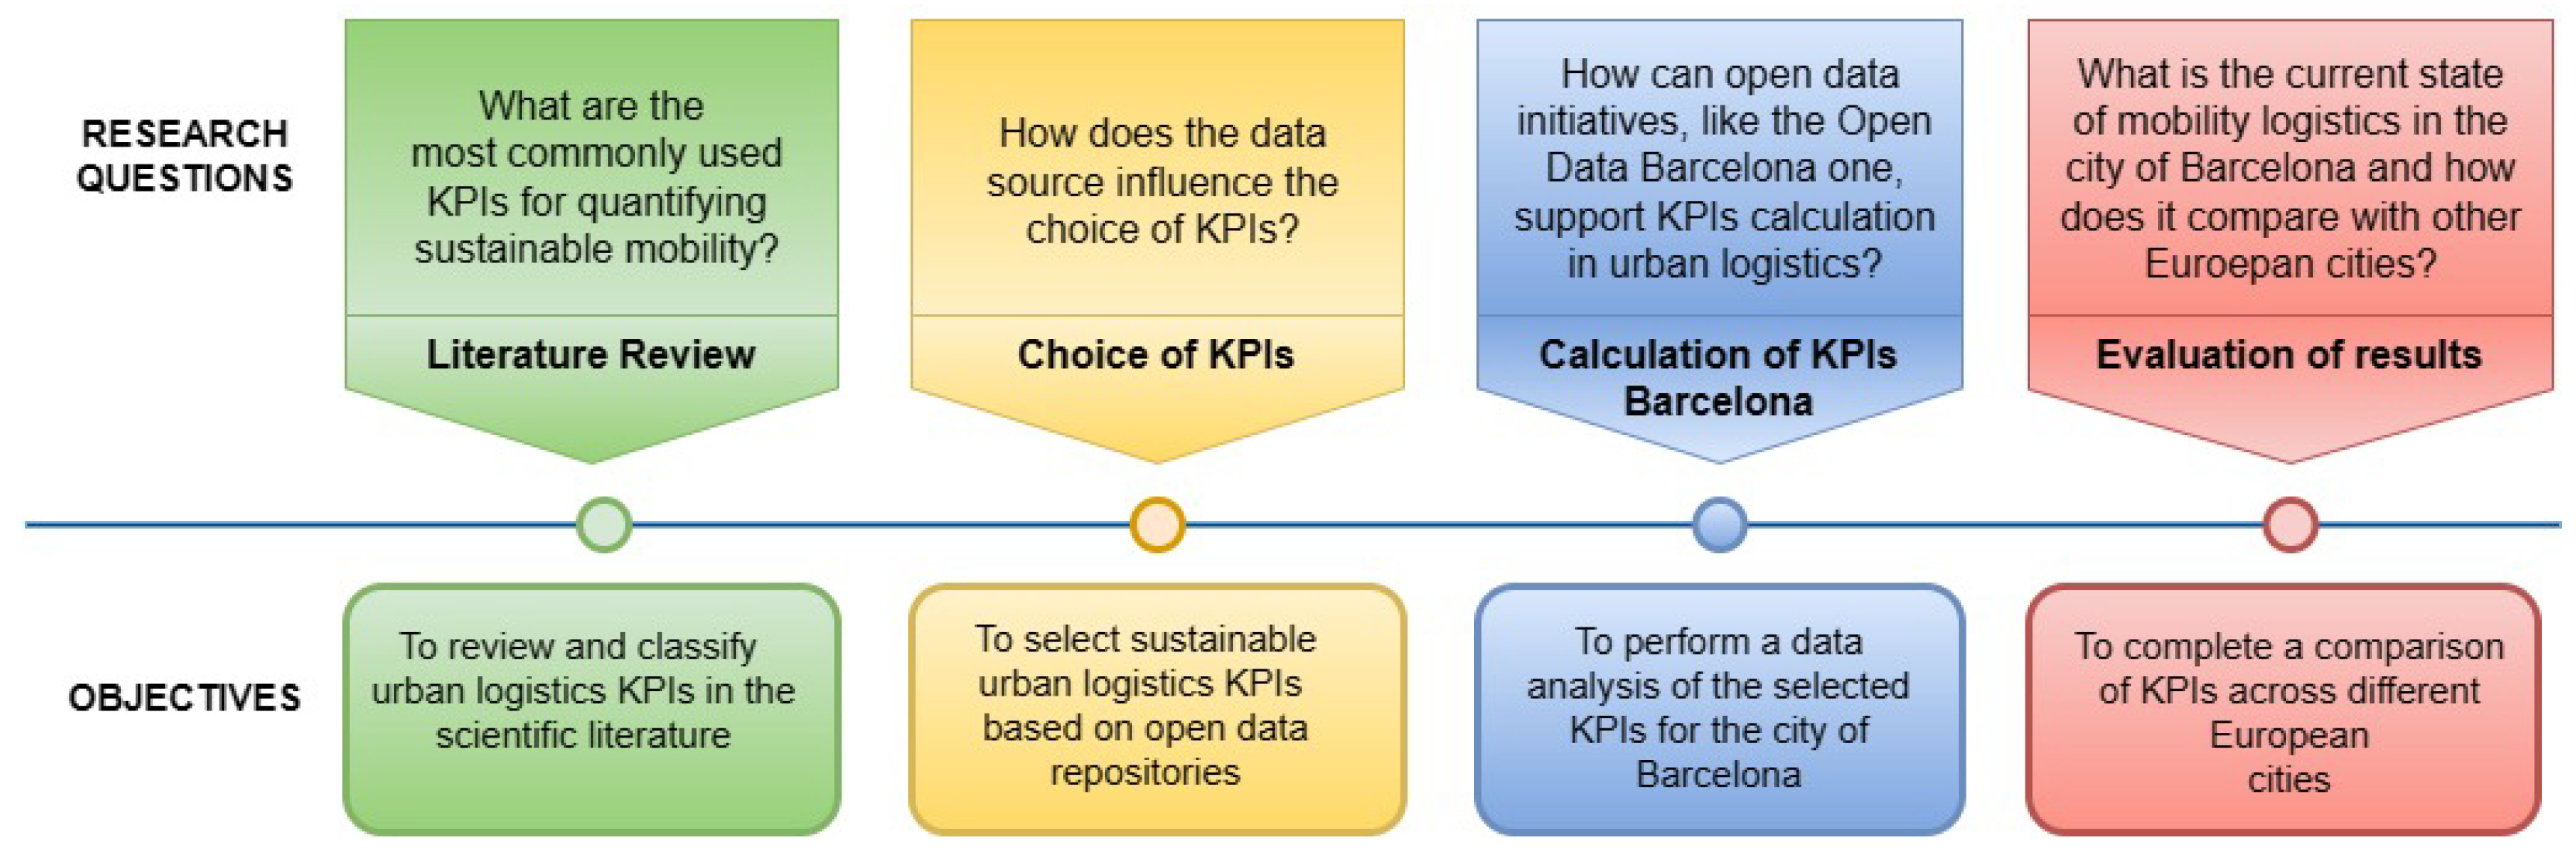
3. Research Methodology

In the literature review, different frameworks for assessing the city as smart or sustainable have been introduced. The KPIs proposed in these studies can be used by city managers not only to measure the current state of their city, but also to compare it with other cities that also provide public data on similar dimensions, in order to study the temporal evolution of the indicators in the city and to assess the impact of the policies implemented. Thus, for instance, Kourtzanidis et al. [36] propose a model using a 5-point scale to evaluate smart cities based on three dimensions. The first aims to evaluate the success of a project based on predefined performance parameters. The second focuses on the impact of the project on the sustainability of the city and compares it to the objectives of strategic plans. The third dimension assesses four pre-defined sectors of interest. Inac and Oztemel [35] show an evaluation model for cities that measures the digital transformation of their transport services. Using a 4-point scale, their model incorporates a set of smart city KPIs with their respective assessment criteria to determine the level of smart transport systems. It also employs a mathematical model to make strategic assessments and identify investment priorities. Ntafalias et al. [39] propose a 7-step methodology for assessing the impact of smart city interventions and present a case study for the city of Espoo in Finland. It is used to determine the effects of eco-innovation, which is an essential part of digital transformation processes. Another methodology was proposed by the European Commission in the framework of the Sustainable Urban Mobility Development Plans (2017–2020), called the Sustainable Urban Mobility Indicators (SUMI) method, which was developed for cities and urban areas to identify the strengths and weaknesses of their mobility systems, hoping to help in achieving EU policy objectives. Data from 50 European cities create a database that provides maximum, minimum, and acceptable values for each KPI.
The Eltis method improves on the SUMI method by incorporating KPI values calculated in seven cities around the world to refine some of the original methodologies. It uses a 10-level scale and a time-based and relevant SMART (Specific, Measurable, Achievable, Relevant, Time-based) methodology that allows cities to make a standardized assessment of their mobility system and measure improvements resulting from the incorporation of new sustainable practices. Among the various methods discussed, the Eltis method has been chosen for two key reasons. Firstly, the selected KPIs are specifically tailored to analyze mobility in smart cities, focusing on assessing transportation systems and the city’s capacity to embrace more sustainable mobility practices. Secondly, the utilization of a scale ranging from 1 to 10 for the indicators facilitates a rapid assessment of the city’s current state and enhances comprehension of the potential impact that future measures can achieve. Furthermore, it enables easy comparison with other cities possessing similar characteristics. The choice is further justified by the fact that the indicators proposed by the Eltis method have emerged as frequently recurring in the aforementioned tables, indicating that multiple authors have endorsed their relevance. Hence, this method ensures alignment with widely accepted and shared indicators in the research community.
Within the framework of the Eltis method, a comprehensive analysis of relevant indicators is conducted to assess urban sustainability, particularly in the context of sustainable mobility and logistics within a city. Specific definitions proposed by the Eltis method are employed for each indicator, and each indicator is evaluated using a parameter designed to measure its sustainability score. Further information regarding these parameters and formulas can be found in the link provided by the European Commission’s Urban Mobility Observatory (https://www.eltis.org/sites/default/files/trainingmaterials/smp2.0_sustainable-mobility-indicators_2ndedition.pdf, accessed on 11 October 2023).
This process involves the individual assessment of each indicator, identifying the necessary variables for precise calculation and measurement. For additional Key Performance Indicators (KPIs) related to sustainable mobility and logistics, the same guidelines established by the Eltis method are followed. These guidelines encompass seven key categories of variables used in the indicator calculation process, including common input variables, indicator-specific input variables, default-value variables, conversion-value variables, output variables, calculated values, and informative input variables. Once the necessary variables for the indicator calculation are identified, the next step involves sourcing these variables from available open data sources, such as the city’s official websites and data repositories. The availability of these variables in open data sources is essential to ensure transparency and accessibility of the data used in evaluating urban sustainability and sustainable mobility. This study also includes the exploration of population surveys from open data platforms, which can provide valuable information about quality of life, citizen behaviors, and population habits. Regarding the calculation of indicator scores, the Eltis method bases its scoring on the position of the parameter value within a range that spans from the best (10) to the worst (0) parameter values, following the recommendations established by the European Commission’s Urban Mobility Observatory.
Regarding calculating new indicators aimed at enhancing the set of KPIs for measuring sustainable mobility, a methodology consistent with that applied in the Eltis method has been followed. The calculation method for each indicator has been clearly defined, specifying the required variables for determination. This ensures comparability and consistency in measuring sustainability in the realm of sustainable mobility and logistics. These expansions and adjustments to the evaluation methodology contribute to a more comprehensive and precise understanding of urban sustainability, allowing for a thorough assessment that covers both the traditional aspects of the Eltis method and new elements identified in the scientific literature. This approach, supported by rigorous methodology and the use of rating scales ranging from 0 to 10, strengthens the scientific foundation of the study and its capacity to offer meaningful insights into the field of urban sustainability and sustainable mobility.
In summary, this methodology ensures a rigorous and comprehensive approach to evaluating urban sustainability and sustainable mobility and logistics through specific indicators. Open data sources and precise calculation techniques are leveraged to obtain reliable and transparent results.
The data analysis in this article was conducted using Python 3.10. Libraries such as NumPy [53], Pandas [54], Seaborn [55], and Matplotlib [56] were employed for data analysis and visualization. Additionally, the Folium library (Folium) [57] was utilized to work with the map of Barcelona and generate heat maps. Coordinates for points of interest in Barcelona were obtained using the Geocoder library [58].

4. A Case Study Involving the City of Barcelona

This section aims to provide a comprehensive case study focused on the city of Barcelona, Spain. The information presented here is based on thoroughly analyzing the existing literature, reports, and data sources (https://www.barcelona.cat/es/, and https://ajuntament.barcelona.cat/es/, both accessed on 11 October 2023). Barcelona’s geographical location on the Mediterranean coast has played a pivotal role in its development and attractiveness. The city’s proximity to the sea has facilitated trade, cultural exchanges, and tourism, contributing to its vibrant and cosmopolitan character. The surrounding hills and mountains not only enhance the city’s natural beauty, but also provide opportunities for recreational activities and offer breathtaking views. The history of Barcelona is deeply rooted in its ancient past, with traces of Roman settlements still visible today. Economically, Barcelona plays a significant role in the global stage. It serves as a hub for trade, finance, and innovation, attracting both domestic and foreign investments. The city’s diversified economy spans various sectors, including tourism, industry, technology, and services. Barcelona’s tourism industry, in particular, has experienced remarkable growth, drawing millions of visitors each year to explore its historical sites, renowned museums, and vibrant nightlife.
However, alongside its economic success, Barcelona faces social challenges that come with urban development. Economic inequality and gentrification have become pressing issues, leading to social disparities and the displacement of local communities. The city’s authorities are actively addressing these concerns through social policies and affordable housing initiatives to promote inclusivity and social cohesion. Environmental sustainability is another crucial aspect of Barcelona’s development. The city has embraced the principles of sustainability, focusing on energy efficiency, waste management, and transportation. Initiatives such as the expansion of public transportation, the promotion of cycling infrastructure, and the implementation of green spaces contribute to reducing pollution and enhancing the quality of life for residents [59]. The city’s governance and planning processes are managed by the Barcelona City Council, which operates within a local political system. Collaborating with various institutions and organizations, the council strives to ensure sustainable and equitable development. They implement strategic plans and projects to enhance public infrastructure, preserve cultural heritage, and promote social and economic well-being. Barcelona has experienced both successes and challenges in its urban development. Successful initiatives include revitalizing the waterfront, which transformed an industrial area into attractive public space. Additionally, Barcelona’s commitment to sustainable tourism has been recognized globally, enhancing its reputation as a leading destination. However, the city also faces the challenge of managing the impacts of mass tourism, finding a balance between economic growth and preserving the local environment and quality of life. Looking ahead, Barcelona continues to pursue a sustainable and inclusive vision for the future. The city aims to strengthen its position as a hub for innovation, technology, and entrepreneurship. Plans are underway to further enhance public transportation, invest in renewable energy, and create green infrastructure. These developments seek to improve the overall urban experience, mitigate environmental impact, and ensure a high quality of life for residents and visitors alike.
In this section, an in-depth examination of KPIs is conducted, utilizing information sourced from Open Data Barcelona. The availability and relevance of the data were carefully assessed to determine which KPIs could be calculated using this dataset, also indicating the data source and the time interval of the measurement. Using this approach, four KPIs were identified that could be derived directly from the raw data obtained from Open Data Barcelona. These KPIs include “accidents”, “net transport funding”, “affordability of public transport for the poorest group”, and “active mobility opportunities”. For these indicators, the required data were easily accessible and were applied to the equations proposed by the Eltis method specific to each KPI. In addition, the scaling suggested was incorporated to obtain the final value for each KPI. Valuable information about Barcelona’s performance was obtained on these specific KPIs by using the available data and applying the appropriate calculations. This data-driven analysis provides a comprehensive understanding of various aspects of mobility and transport in the city, supporting evidence-based decision-making for urban planning and sustainable development initiatives Table 5.
Notice that not all data are updated. For instance, active mobility opportunity data are from 2017. Hence, one of the enhancements that can be proposed to the city council is to provide real-time data, so that KPI computation shows a real snapshot of the current state of sustainable mobility in the city. To establish a comprehensive set of indicators using the data available from Open Data Barcelona, certain modifications to the Eltis method were implemented for specific indicators. These modifications were introduced by (i) incorporating existing data from studies outside the realm of mobility studies and (ii) adapting the indicators to align with the data obtained from the Open Data platform. A more holistic and multidimensional perspective was achieved by incorporating data from diverse sources, including studies beyond the scope of mobility. This approach allowed for a broader assessment of the city’s performance of the proposed indicators, encompassing various aspects beyond traditional mobility considerations.
Furthermore, adjustments were made to ensure the indicators were aligned with the specific data available on the Open Data platform. This involved refining the measurement criteria and methodologies to effectively capture the desired indicators using the provided data. These modifications allowed for a more accurate evaluation of the city’s performance of the identified indicators while maximizing the utilization of the available data resources. By employing these modifications, a comprehensive set of indicators was created that effectively leveraged the data provided by Open Data Barcelona. This enhanced methodology facilitates a more comprehensive assessment of the city’s mobility and transportation systems, offering valuable insights for urban planners, policymakers, and researchers in pursuing sustainable and smart city development.
Table 6 presents the indicators that required adaptation for their utilization with the Eltis method. In the cases of ‘noise pollution’, “public spaces quality”, “emissions of greenhouse gases”, and “security”, the adaptations primarily relate to the source of the data. Regarding noise pollution, the data were obtained from a study specifically focused on noise levels in the city. For the indicators of security and public spaces quality, data were derived from opinion surveys about services in Barcelona. In the case of emissions of greenhouse gases, the data originate from official city sources due to the unavailability of direct traffic-related emission calculations stemming from the absence of complete traffic data. For the remaining indicators in Table 6, more extensive modifications were made, as they deviate from the required data specified by the Eltis method while still addressing the same concept. In the case of the adapted indicator of public transportation accessibility, survey data on transport services for individuals with reduced mobility was unavailable. As a result, an alternative indicator was devised to assess not the subjective opinion of services, but rather their actual adaptability for individuals with reduced mobility. In Equation (1), for transportation mode i, the indicator I A c c measures the ratio of adapted services ( M G D i ) to the total number of services ( n i ), considering the adaptability of bus and metro stations in Barcelona:
I A c c = i M G D i n i
One of the KPIs in urban transportation is the average traffic congestion experienced by the city. Barcelona provides congestion data on its website, with ratings on a scale of 1 to 5, where 1 indicates very fluid traffic, 2 represents fluid traffic, 3 signifies dense traffic, 4 denotes very dense traffic, and 5 represents congestion. These data are regularly updated every 15 minutes, ensuring a comprehensive and up-to-date database. The Eltis congestion measure is determined by calculating the trip-weighted average ratio of peak and free-flow travel times, considering 10 main avenue, T r a m j , with j { 1 , 2 , , 10 } . In this case study, the aforementioned congestion range was adopted, and the average value of each main avenue was computed, comparing it with the average number of peak hours on the same avenue, as denoted in Equation (2). This allowed us to quantify the increase in congestion during peak hours and apply the same scale as the Eltis method:
I C = j 1 Traffic conditions at rush hour Average traffic status ( free flow ) T r a m j · 100
To compute the pollution KPI for traffic in Barcelona, a significant challenge arises due to the absence of a traffic model that provides vehicle–kilometer values for the city. Additionally, there is a lack of available open data regarding the volume of activity based on transportation mode, vehicle type, and the proportion of fuel types used per vehicle and transportation mode. Given the importance of this indicator, which utilizes health values as a basis for determining the relative weight of pollutants in terms of their impact on air quality, the concept of this indicator was modified to assess air quality using the available data, taking into account the health values established by the World Health Organization (WHO).
After examining the available data, three pollutant emission indicators have been identified: PM10 concentration, PM2.5 concentration, and NO 2 concentration, all measured in µg/m 3 . Notice that the values obtained for PM 2.5 , PM 10 , and NO 2 reflect not only the concentration of pollutants emitted from transportation sources, but also from all activities that contribute to these particle emissions within the city. Such data are typically available and up-to-date for all cities. The dataset contains hourly data for these pollutants, so the measurement frequency of this indicator may vary depending on each city. It is defined using the daily average concentration value within the specified range, and it is recommended to measure it every year. In order to establish a scale consistent with the Eltis methodology, a scale from 0 to 10 was employed to register emissions for all three pollutants. The scale values will be determined based on the maximum emission values recommended by the WHO to protect the population from the harmful effects associated with these pollutants (https://www.who.int/en/news-room/fact-sheets/detail/ambient-(outdoor)-air-quality-and-health, accessed on 11 October 2023), specifically, a scale value of 0 to PM 10 concentrations equal to or greater than 45 µg/m 3 , PM 2.5 concentrations equal to or greater than 15 µg/m 3 , and NO 2 concentrations of 25 µg/m 3 or higher. Moreover, several studies have utilized these emission indicators to assess air quality, providing additional support for the selection of PM 10 emissions, PM 2.5 emissions [44], and NO 2 emissions [39,46].
Despite these modifications to the data sources, the scale established by the Eltis method has been retained, as the adaptations made primarily concern the data collection process rather than the underlying indicators themselves. This ensures consistency with the Eltis method and allows for meaningful comparison and evaluation across the identified indicators. These adaptations enable the integration of additional relevant data sources, providing a more comprehensive assessment of the city’s mobility performance. In order to complete the study, a transportation KPI is developed to define the modal share of sustainable transportation. This indicator is determined in the studies by Al Haddad et al. [46], Giannopoulos [44], and Ntafalias et al. [39], as well as by the European Commission’s definition of sustainable transportation I T s o s , as the percentage of the population using sustainable methods in the regular use of public transportation c T S i —collective public transportation systems, walking, cycling, carsharing, or scooters—of total population C a p , as shown in Equation (3). This indicator has an annual time range, as the data are typically obtained from population surveys.
I T s o s = i c T S i C a p
Ideally, in the long run, sustainable mobility in cities should approximate a percentage as close as possible to 100 % . The scale used in this paper ranges from 0 to 10, which is equivalent to 0 to 100 percent, used in some official documentation of the European Union. There is a proposal for a regulation of the European Parliament and of the Council on Union guidelines for the development of the Trans-European Transport Network (TEN-T), amending Regulation (EU) 2021/1153 and Regulation (EU) No 913/2010 and repealing Regulation (EU) 1315/2013, encouraging decarbonization and digitalization of the transportation systems in the Union, requiring these for a robust regulatory framework (https://www.europarl.europa.eu/RegData/docs_autres_institutions/commission_europeenne/com/2021/0812/COM_COM(2021)0812_EN.pdf, accessed on 11 October 2023).

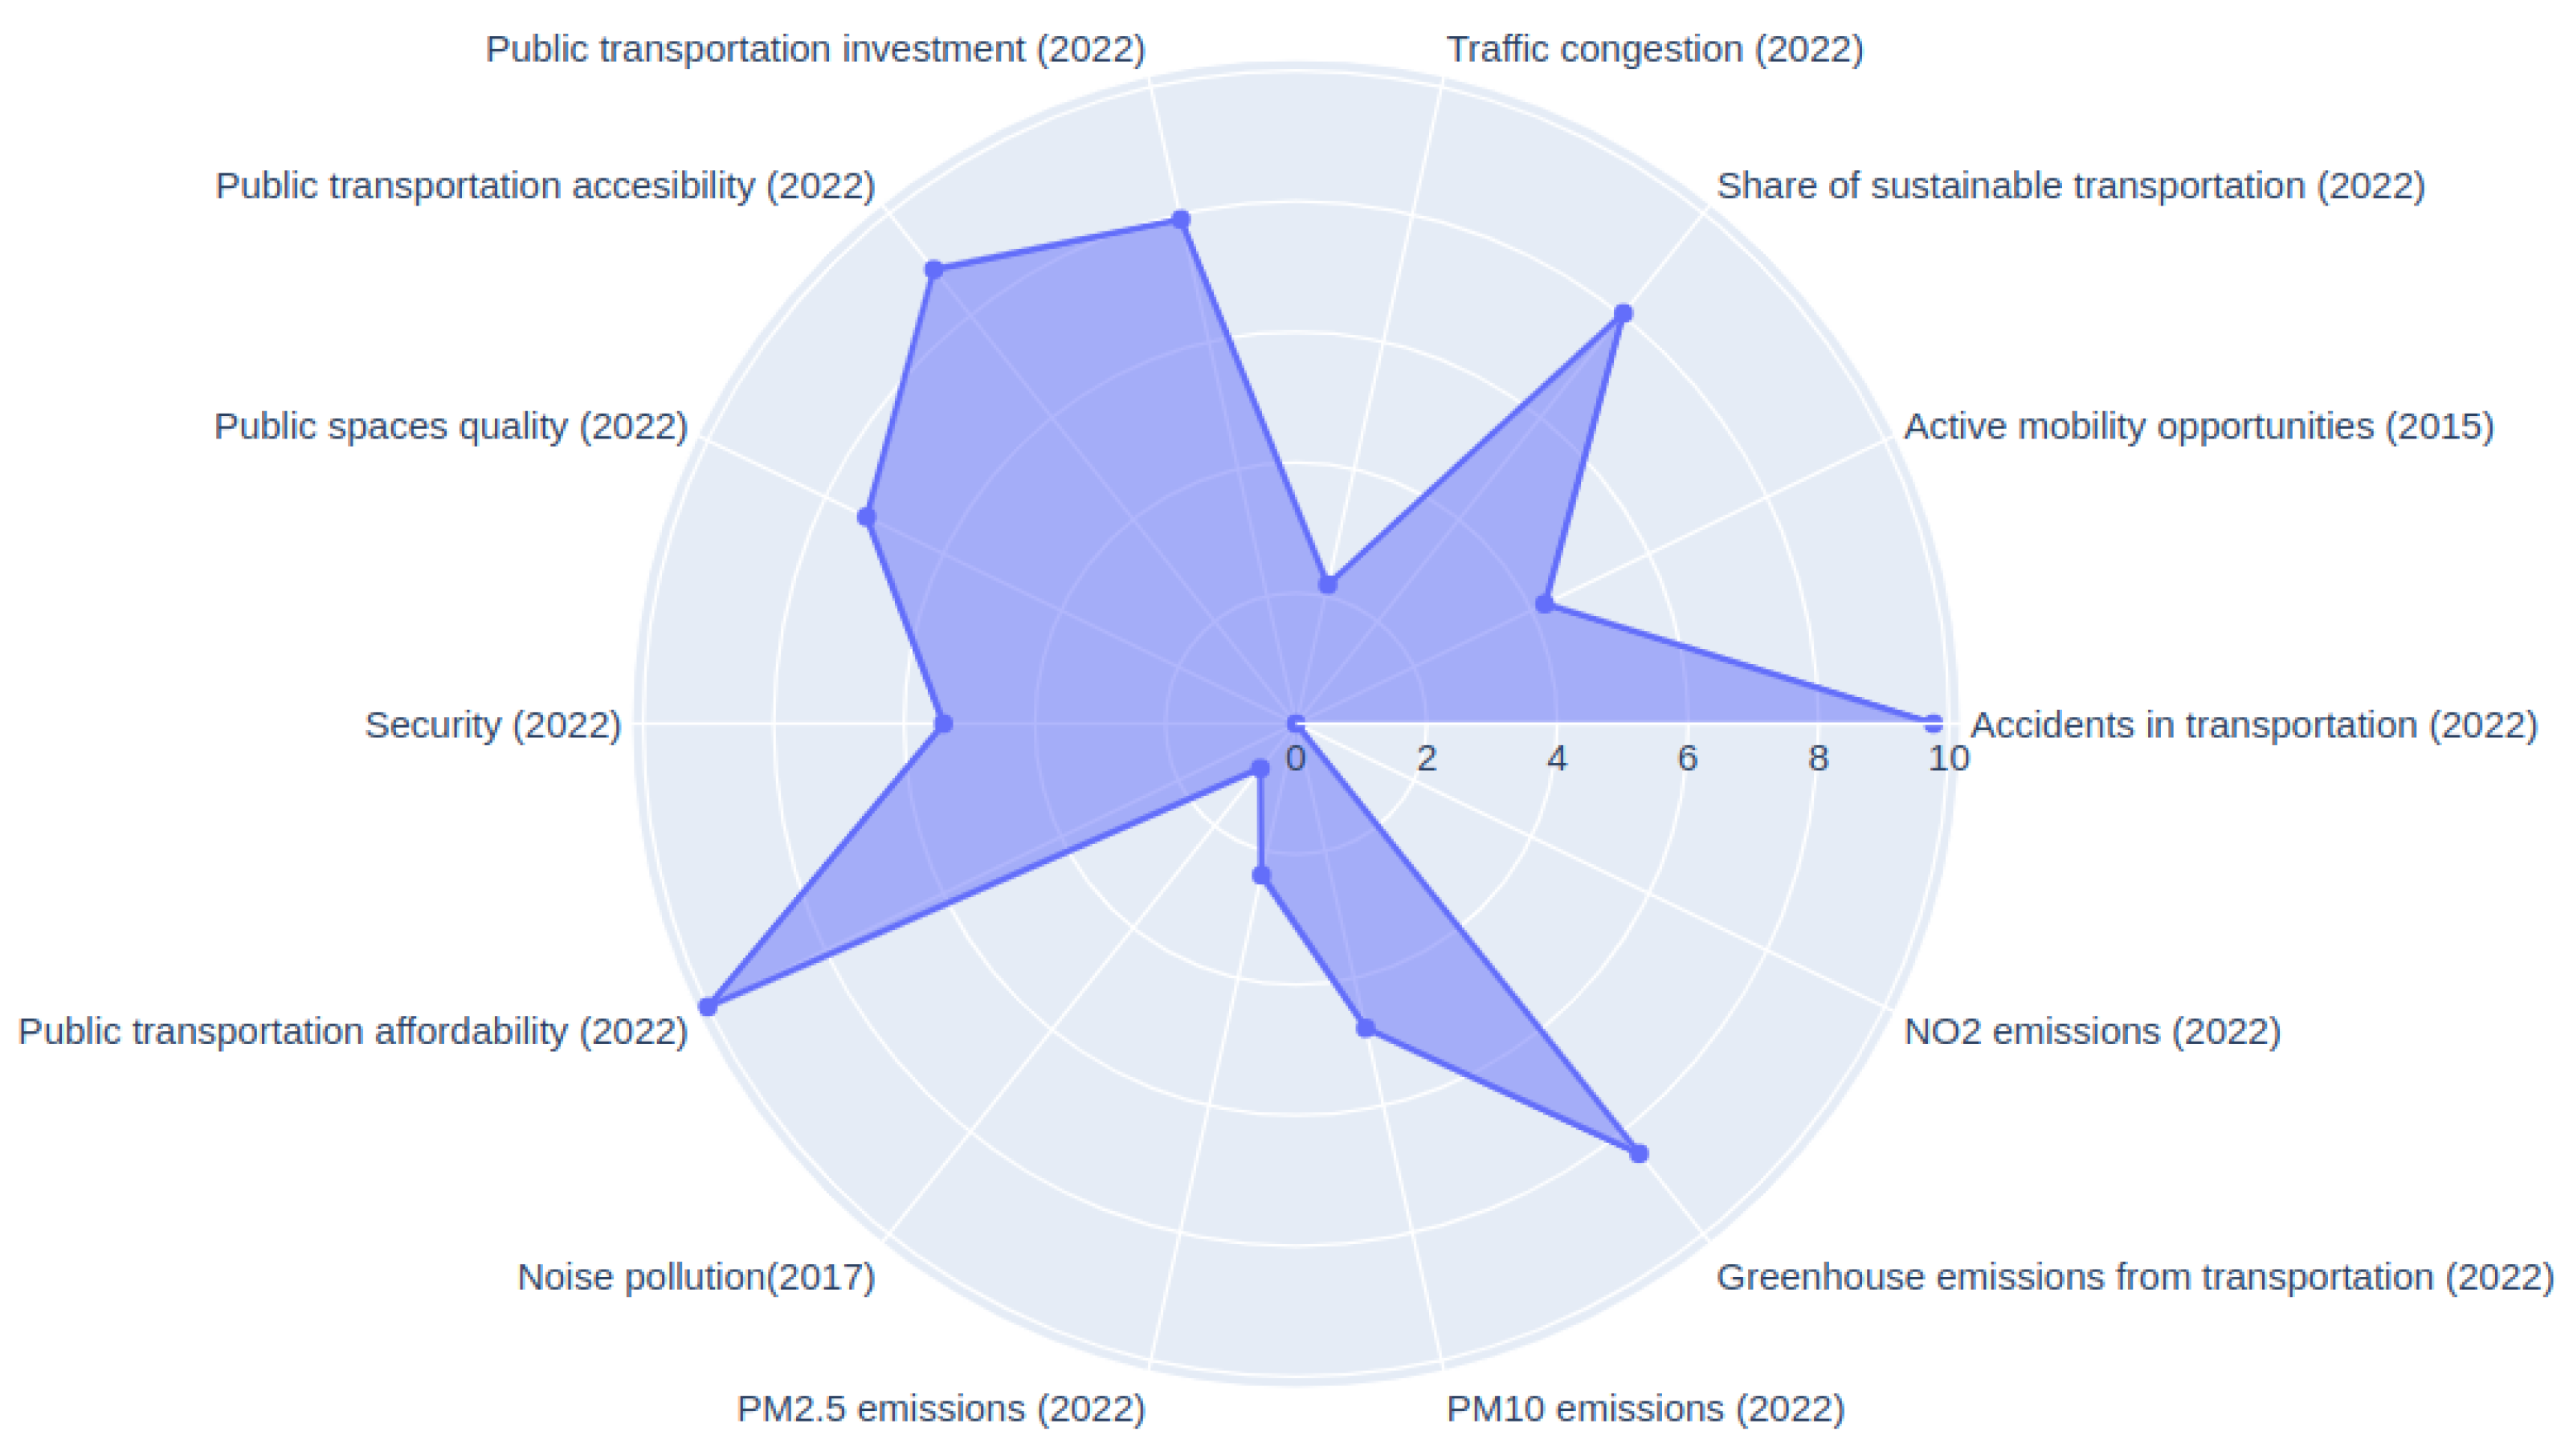
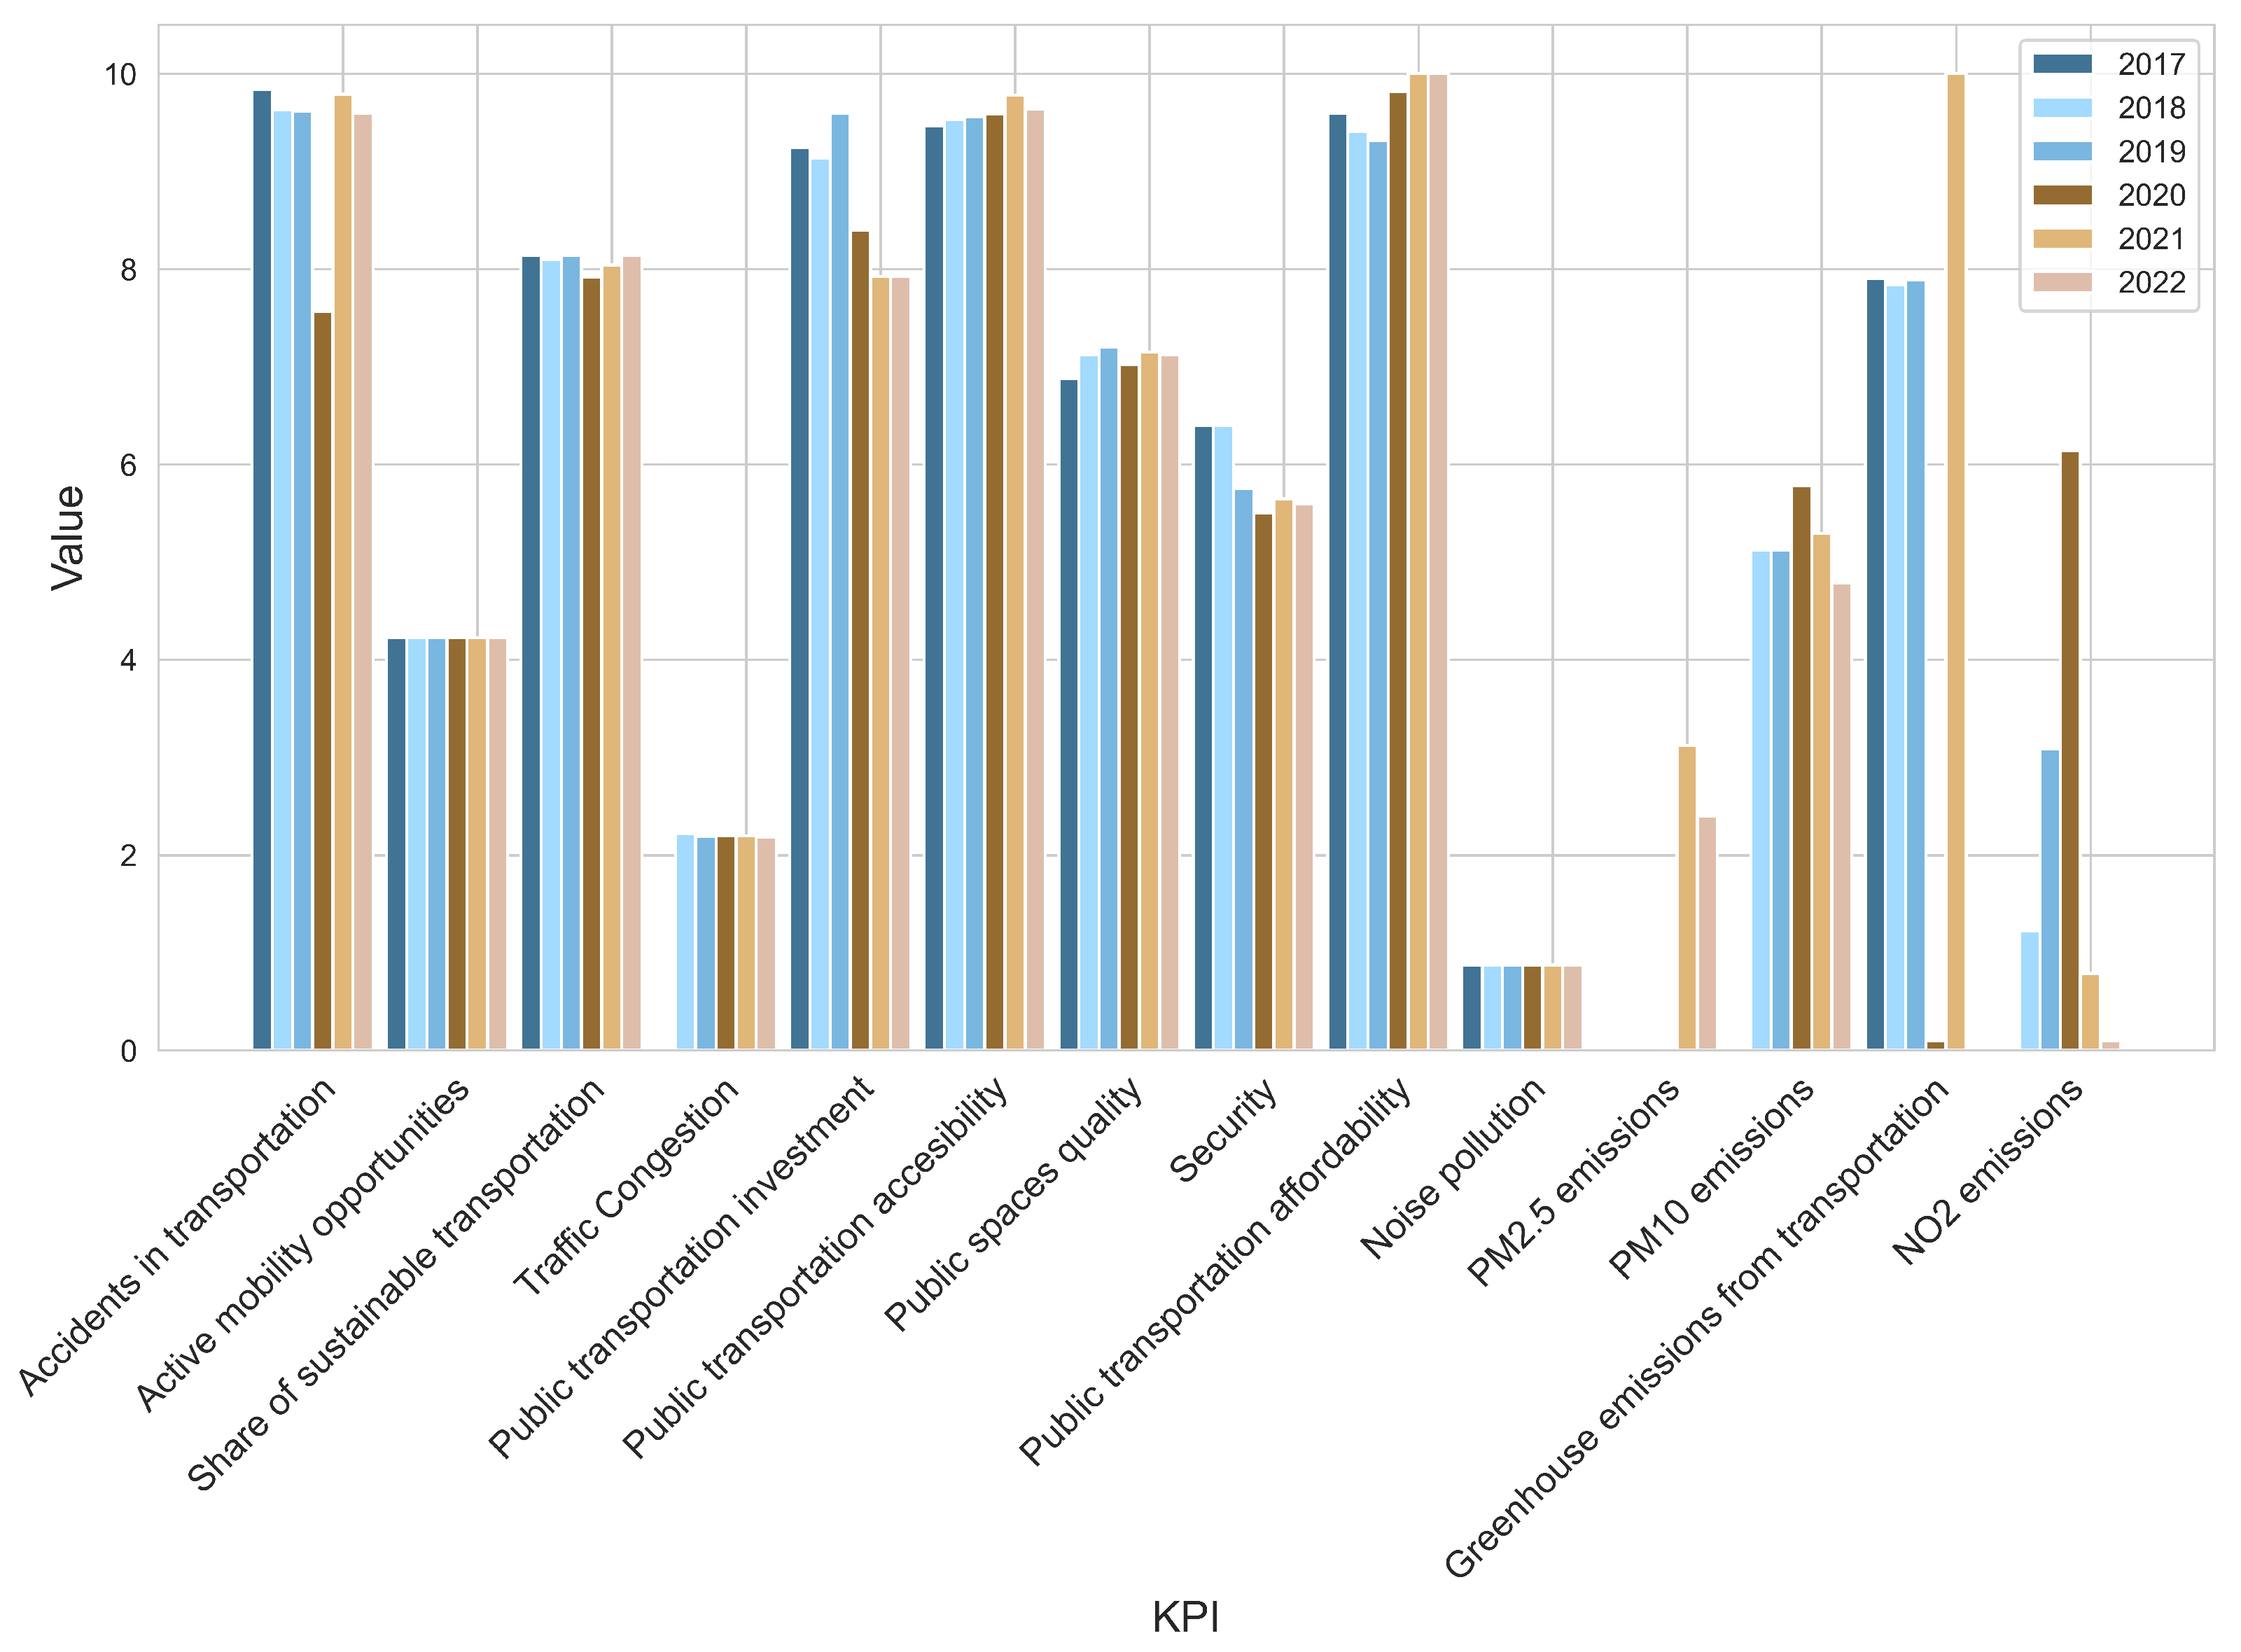
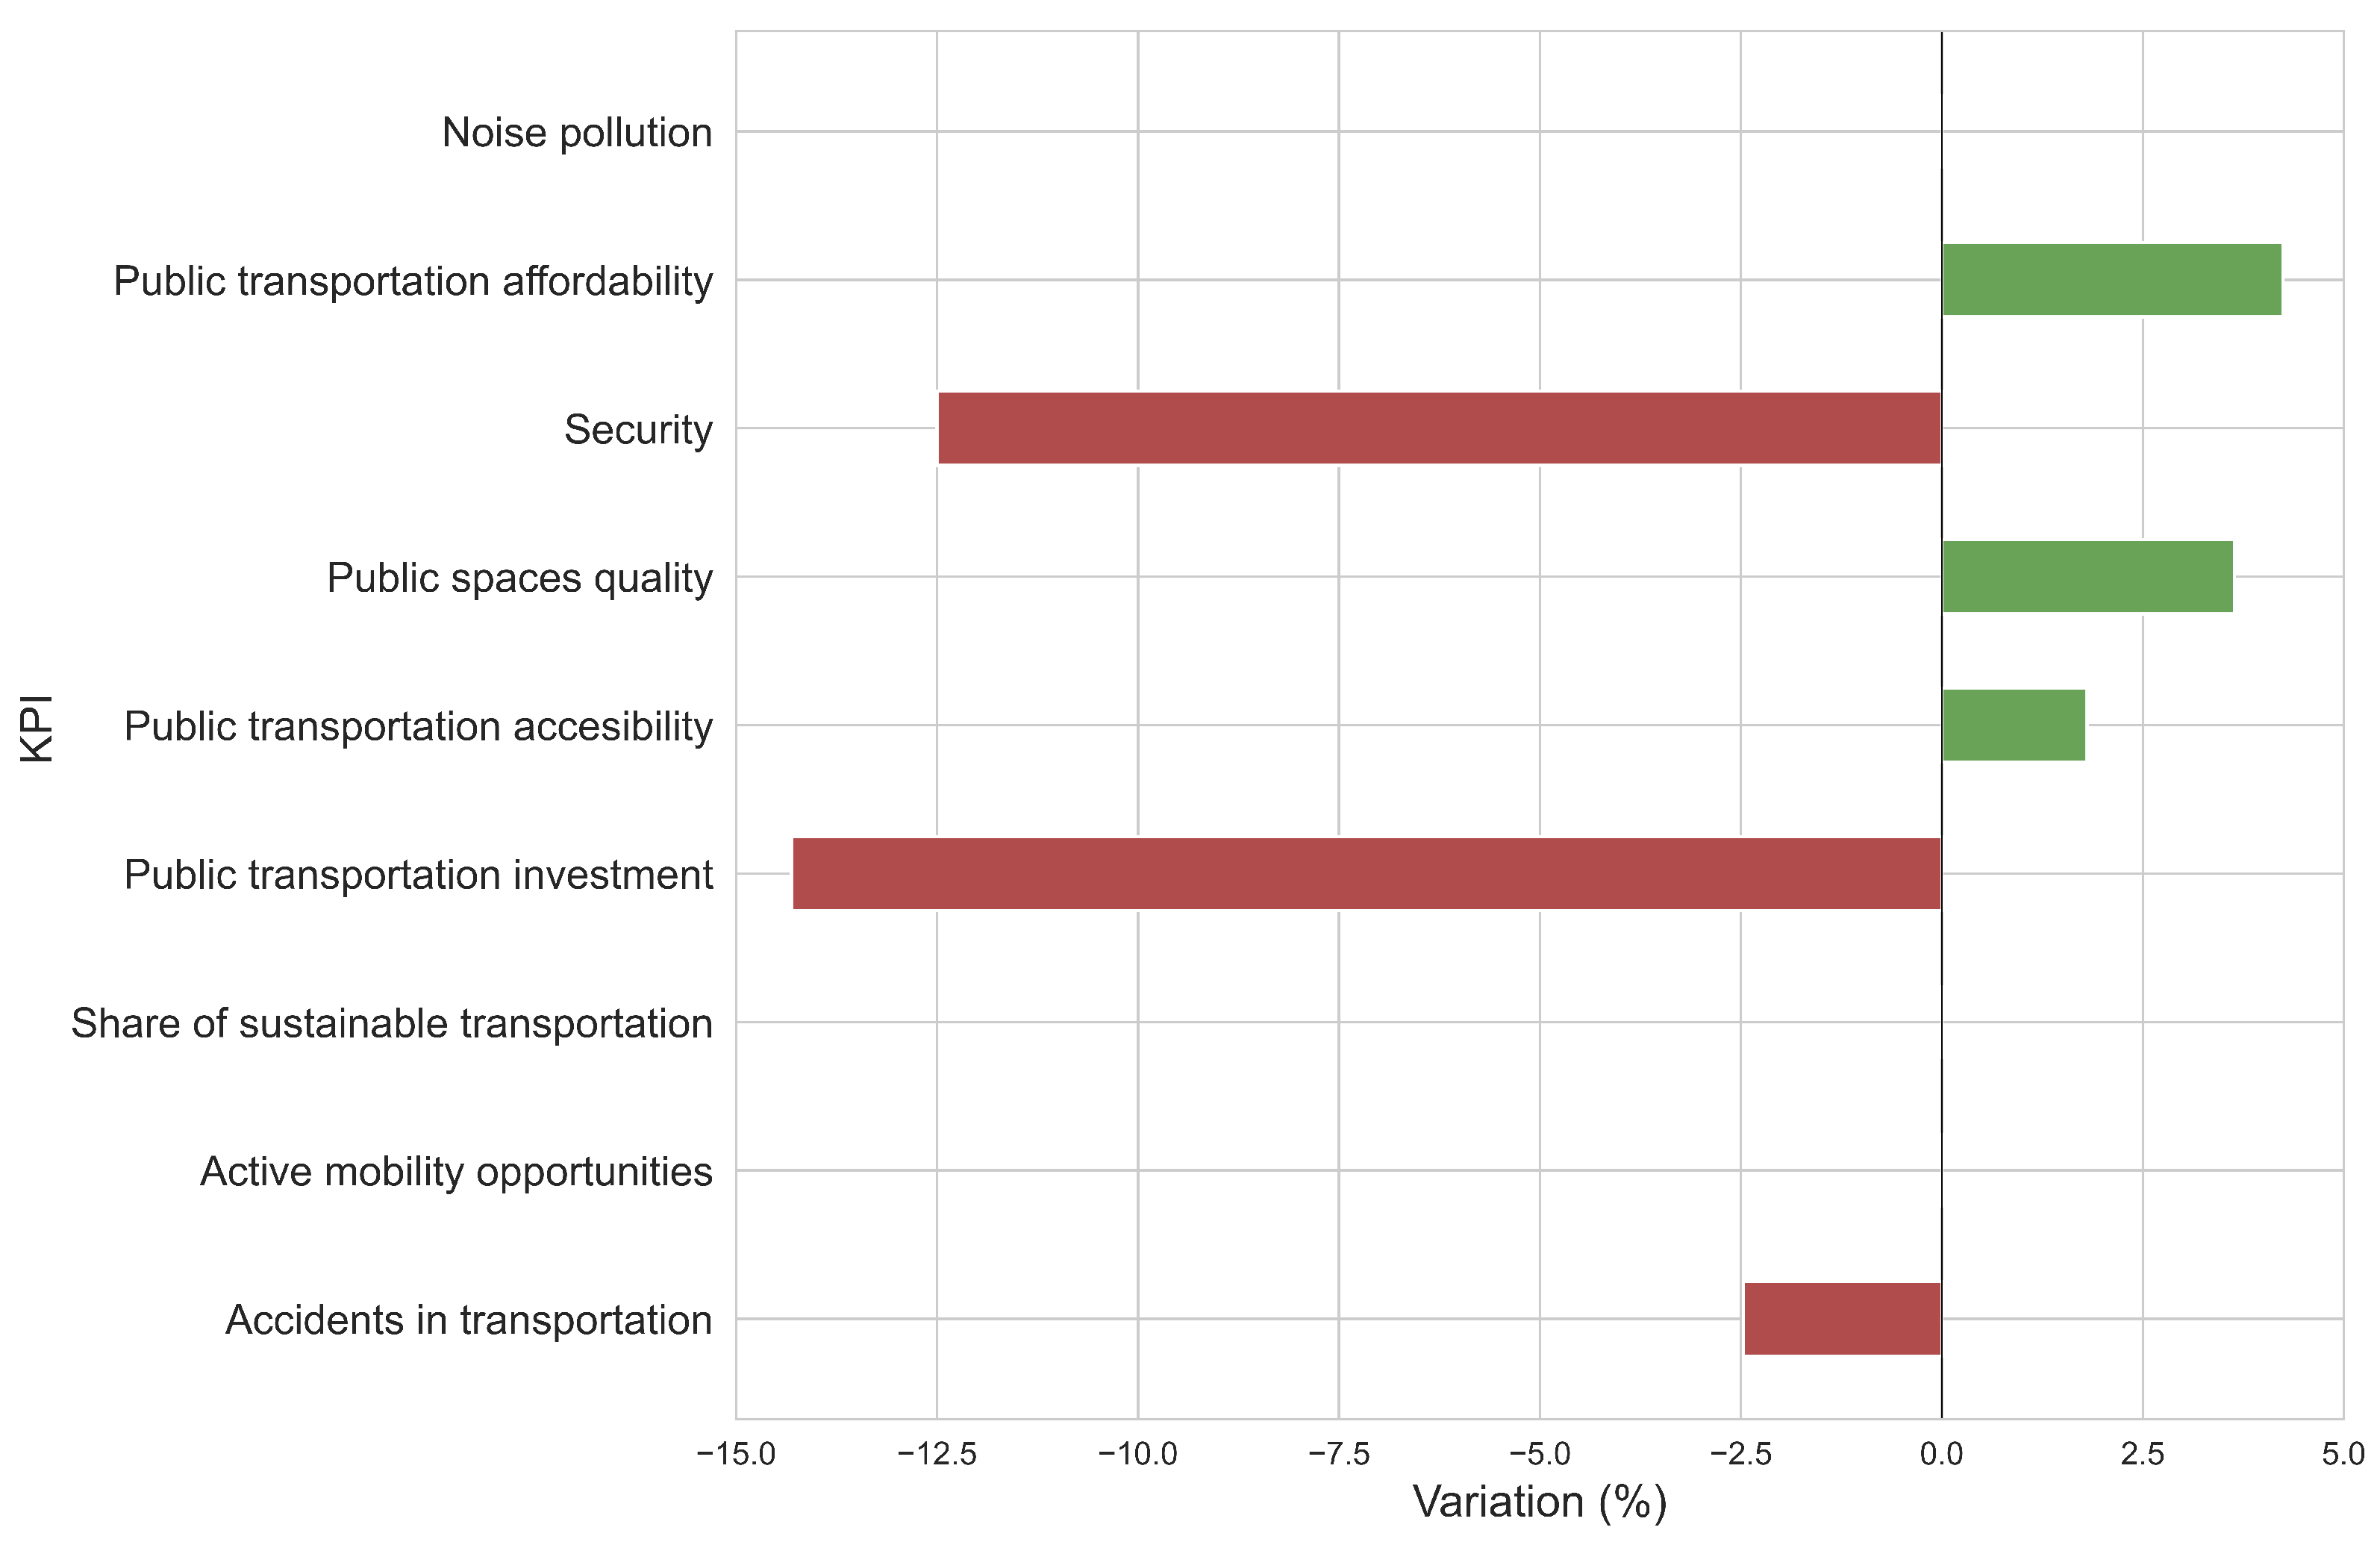
Measuring KPI Values for the City of Barcelona

In this study, a total of 14 KPIs for Barcelona were obtained: 5 related to the socio-economic study, 4 referring to sustainable transportation in the city, and the remaining 5 assessing environmental issues. By representing the results of the KPIs defined for the study in a radar-like graph (Figure 2), one can observe the city’s sustainable mobility state. The KPIs close to the reference value 0 indicate where policies should be directed to make noticeable improvements. KPIs close to 10 indicate that the corresponding KPI is excellent, according to the considered European framework.
The graph for the city of Barcelona shows that policies are needed to improve environmental markers—such as the KPIs for noise and particulate matter. Also, transportation policies are required to improve traffic congestion in the city. These would be the areas on which changes should be focused if a more sustainable city is to be achieved. Figure 2 also shows the dates in which data were updated on the Open Data Barcelona site. It would be interesting for the city to have a higher frequency of updated data, allowing researchers to compute the KPIs every few months and quantify the improvements and changes in each area studied.
Figure 3 illustrates the scaled values of the selected indicators from 2017 to 2022. This graph highlights two key aspects: (i) the importance of accurately defining the temporal dimension of the indicators and (ii) the utility of this information provided in quantifying the impact of implemented mobility policies.
Temporal considerations play a significant role in the definition of the KPIs. Many indicators are appropriately defined within one year, as the data used to derive them are typically sourced from surveys or budgets conducted annually. On the one hand, certain indicators, such as noise pollution, which is currently assessed every 5 years, have longer intervals that may hinder capturing the effects of changes and evaluating decision-making accurately. The “opportunity for active mobility” indicator also lacks updated data, despite public investments in street improvements, pedestrian zones, cycle lanes, and 30 km/h zones. Consequently, this indicator may exhibit improvements that are not observable due to the lack of timely data availability. On the other hand, there are indicators, such as “pollutant emissions”, which offer hourly data. In fact, “congestion” provides data at 15 min intervals. These indicators present an opportunity to extract richer information. Relying solely on an average annual value for the entire city may not accurately represent the prevailing conditions in the urban environment.
Figure 4 displays the temporal evolution of the KPIs over recent years. While focusing on the three indicators that have experienced the most notable positive or negative changes during this period, it is evident that the deterioration in certain indicators has outweighed the improvements observed in others.
These findings shed light on the challenges faced in achieving sustainable mobility goals. Despite efforts to implement measures to enhance mobility, the negative changes in certain indicators show a greater impact on the overall mobility landscape. This highlights the need for further examination and targeted interventions to address the factors contributing to these negative trends. The analysis of these KPIs contributes to a better understanding of the complex dynamics and trade-offs involved in shaping urban mobility systems. This underscores the importance of continuous monitoring and adaptation of policies to mitigate the adverse effects and promote positive transformations in the pursuit of sustainable and resilient urban mobility.

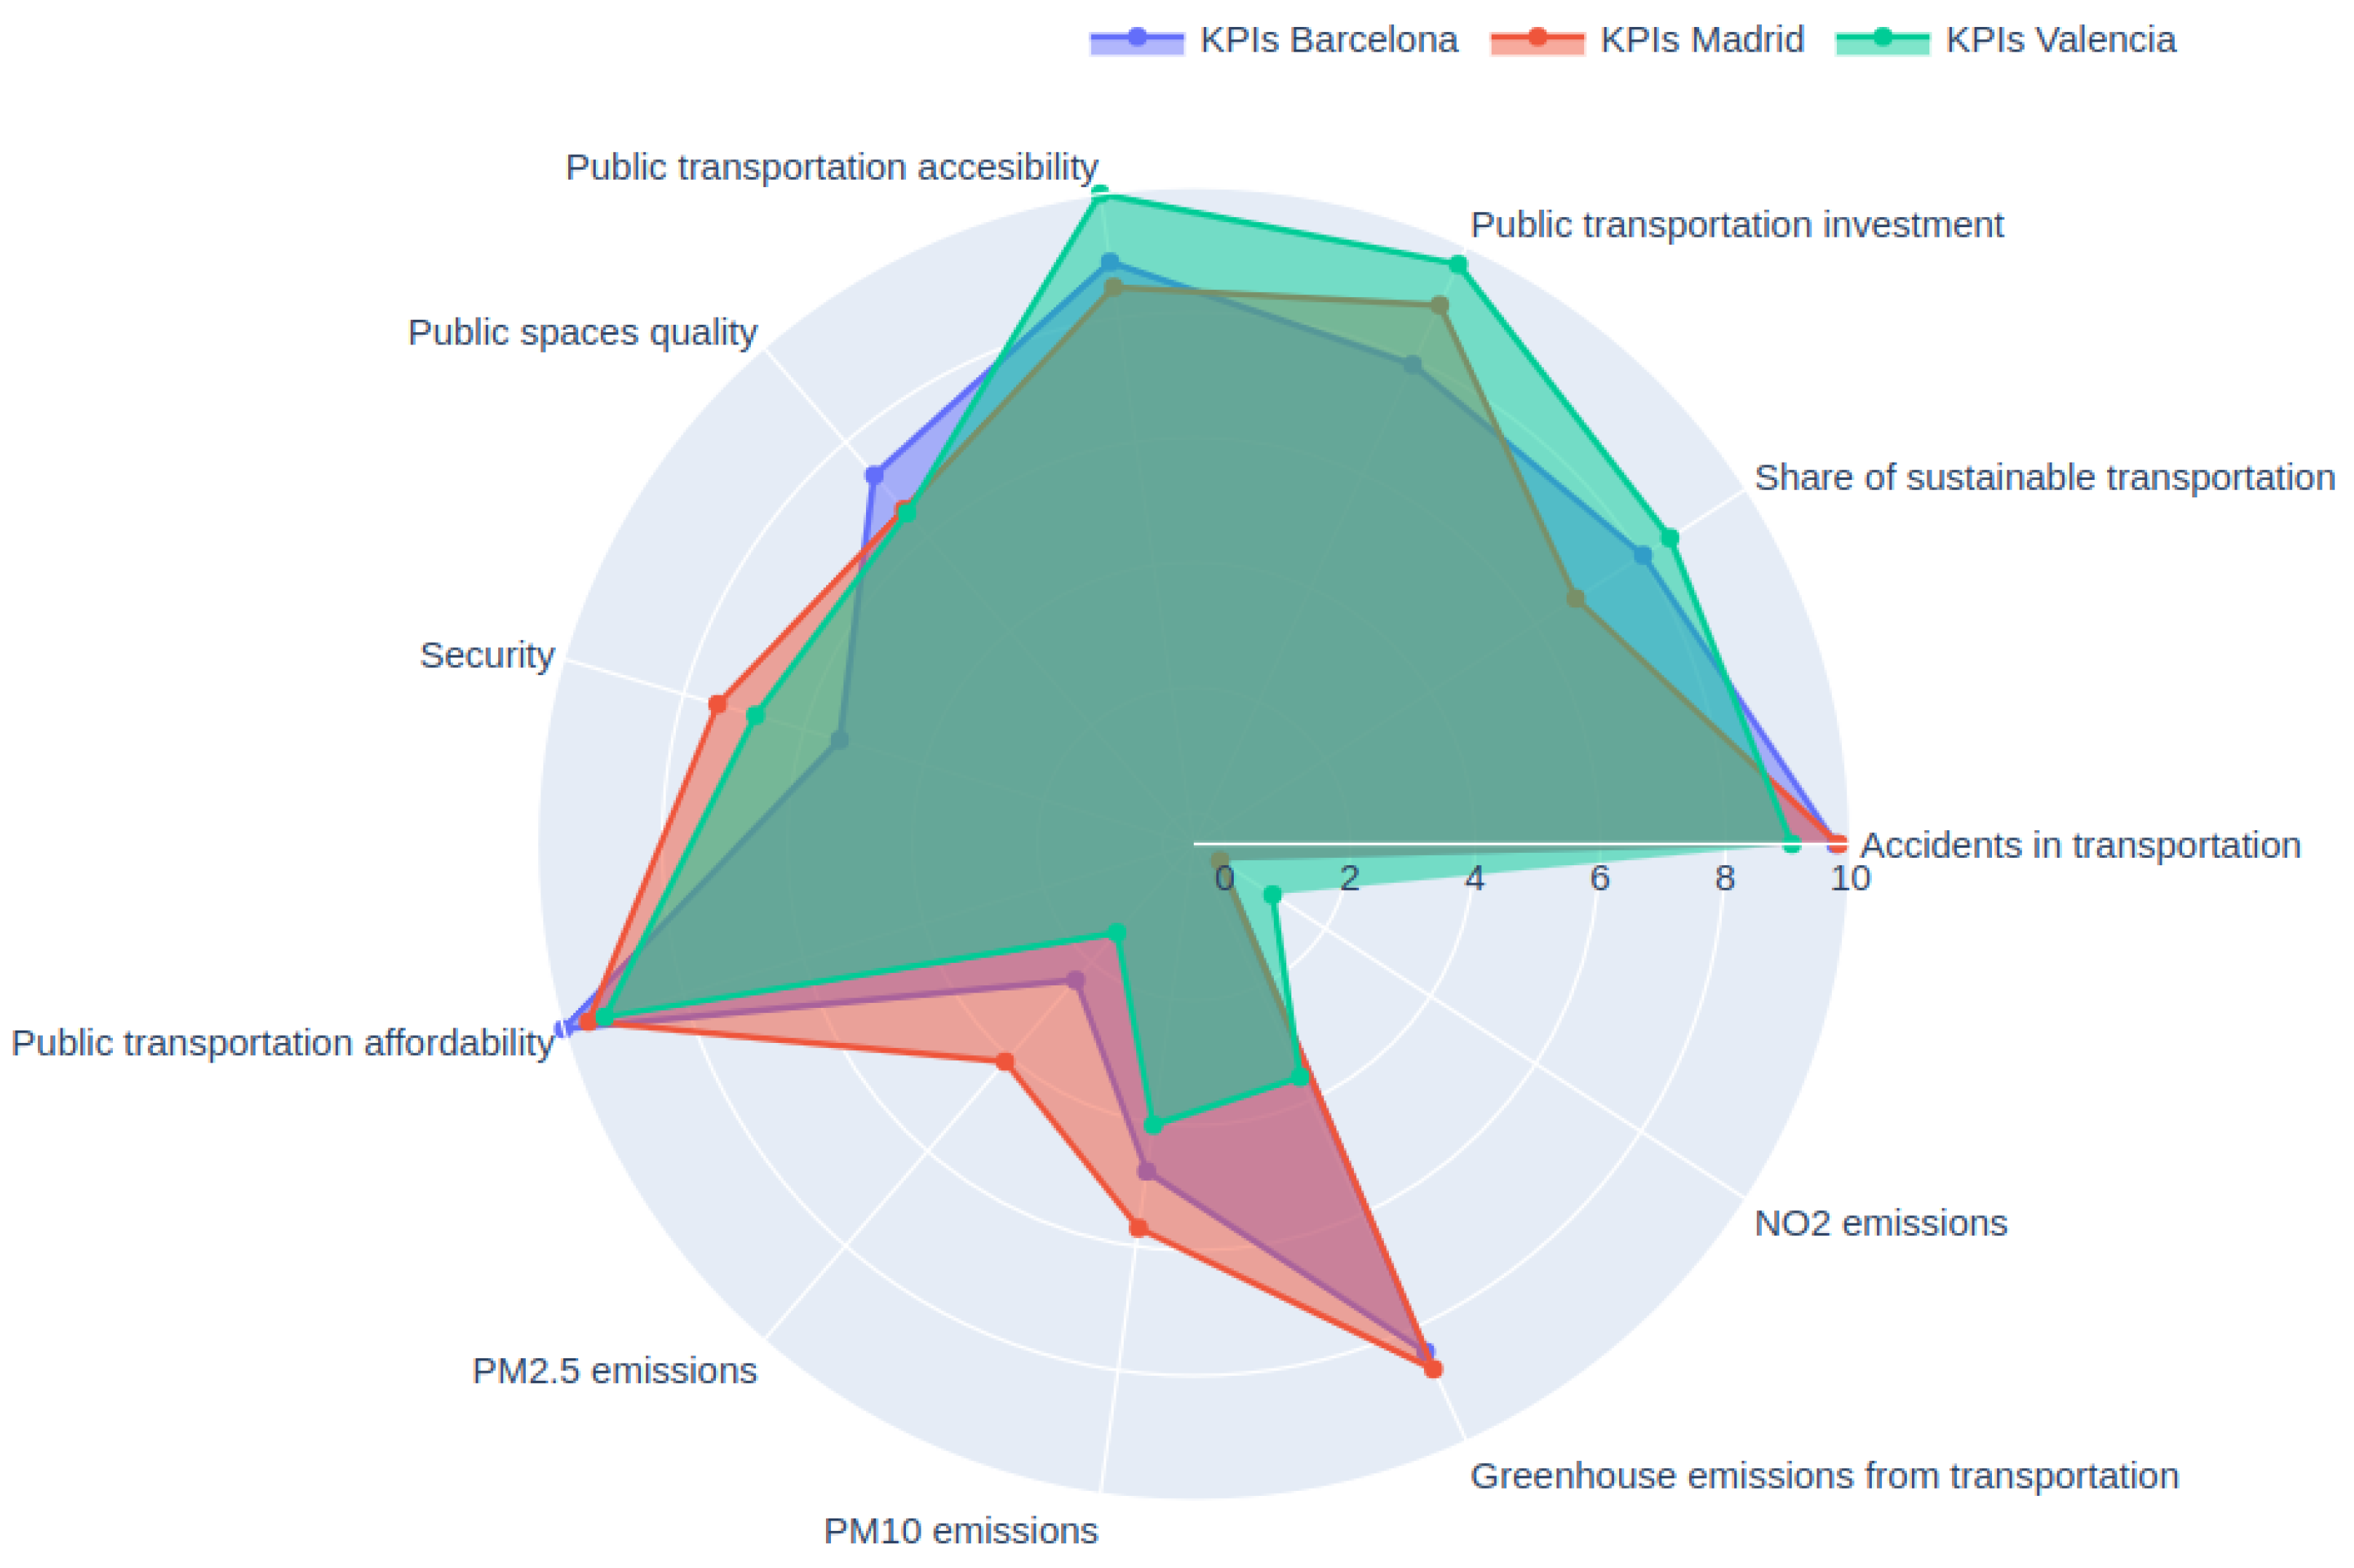
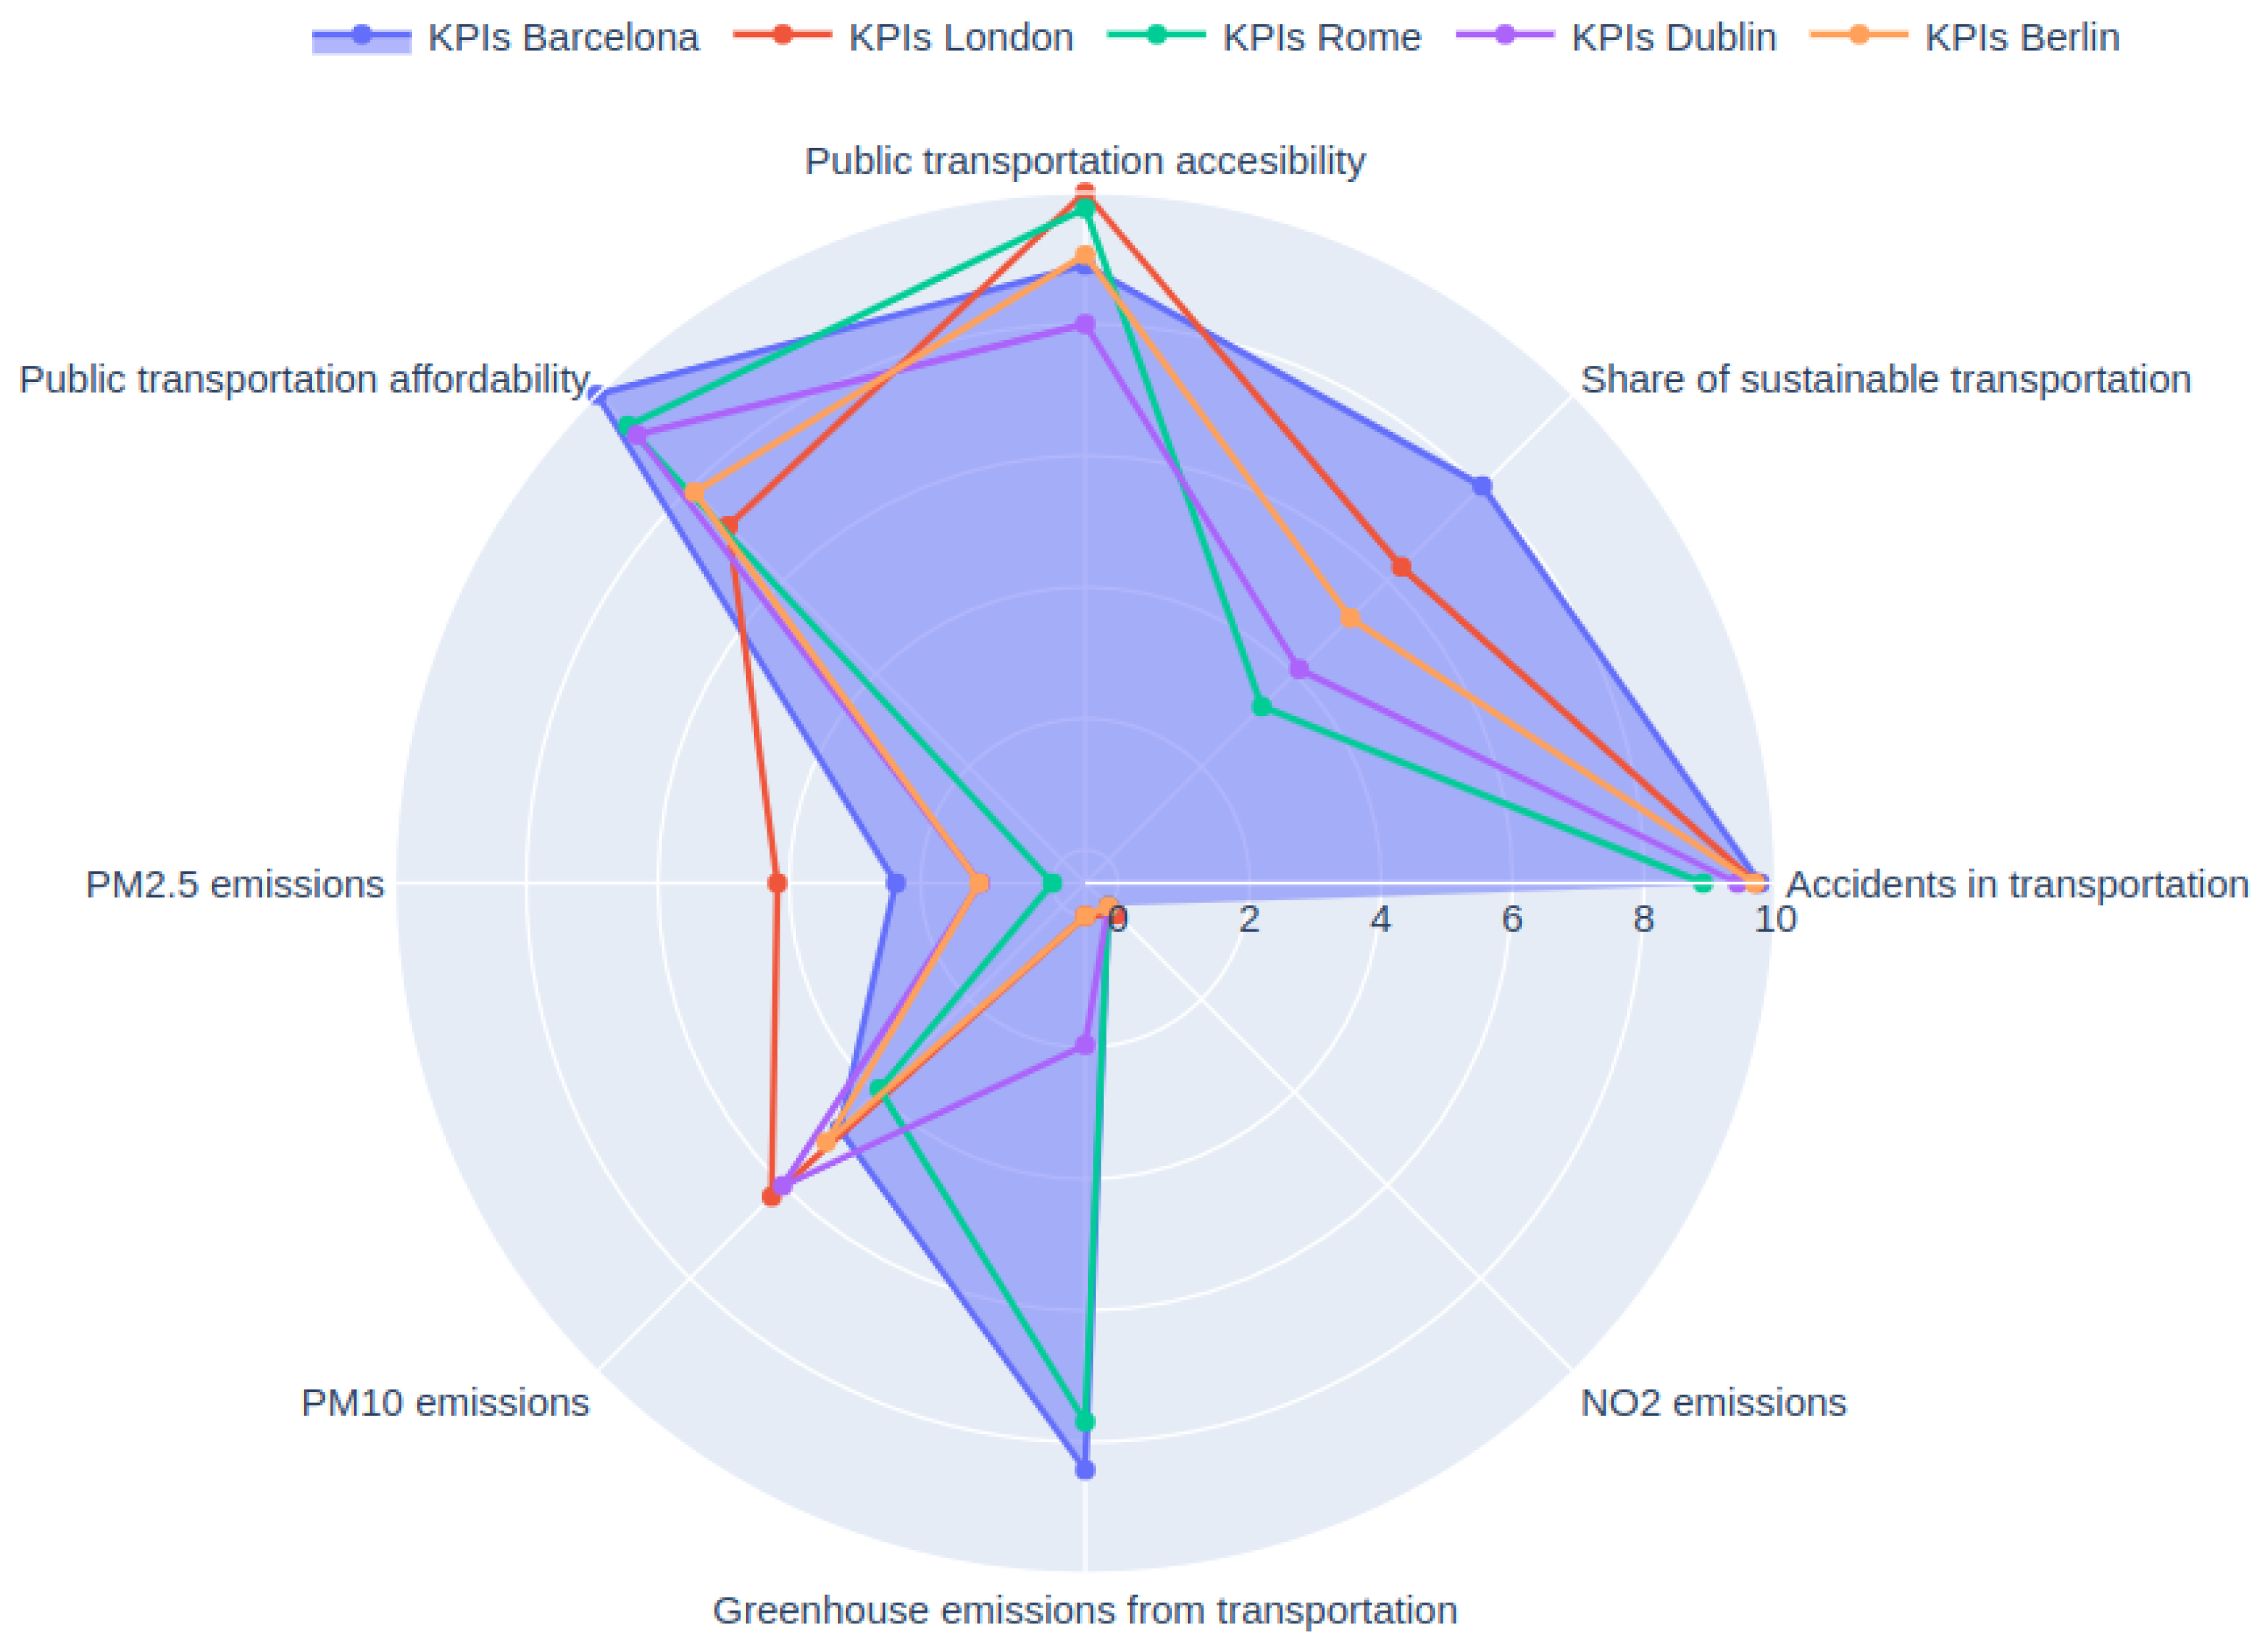
5. Comparing KPIs across Cities

One of the motivations behind selecting the aforementioned KPIs and employing a scale of 0 to 10 is to facilitate cross-city comparisons with other European urban areas offering similar data. This approach allows for providing tailored recommendations to policymakers in each city based on their respective baseline results. However, while exploring open data about other European cities, two primary challenges were encountered: data availability and data currency. Specifically, not all data are regularly updated, and not all city websites grant access to the information necessary for calculating the KPIs. Figure 5 compares three of the largest Spanish cities: Barcelona, Madrid, and Valencia. Likewise, Figure 6 offers a comparison with several European cities: Barcelona, London, Rome, Dublin, and Berlin. The selection of these cities was made based on the existence of available open data.
This approach acknowledges the existing variations in data accessibility and updates among different cities. Nonetheless, it facilitates meaningful comparisons and insights that can contribute to a more holistic understanding of urban mobility dynamics. By considering both Spanish and European contexts, this analysis provides valuable information for policymakers and stakeholders seeking to improve urban mobility and city logistics across different scales and geographical contexts [60,61]. The comparison among Spanish cities reveals that Madrid and Barcelona exhibit similar values across all indicators. However, Valencia demonstrates superior performance in transport-related indicators while displaying significantly poorer results in environmental indicators. This comparative analysis is valuable for benchmarking and policy replication, considering the impact on specific indicators and the ripple effects on other areas. With respect to European cities, substantial variations can be observed from one city to another. Barcelona, for instance, lags behind other cities in terms of public transport accessibility, with London and Rome outperforming it in this regard. Similarly, when it comes to particulate emissions, Dublin and London demonstrate better results compared to Barcelona. Therefore, Barcelona can draw valuable lessons from these cities to foster a process of continuous improvement in sustainable mobility.

6. Discussion

This study offers a comprehensive analysis of KPIs related to urban mobility and sustainability, specifically focusing on the city of Barcelona. The examination of these KPIs provides valuable insights into the state of urban mobility and sustainability in the aforementioned city, offering both strengths and areas that require attention. One of the noteworthy findings is the strong performance of Barcelona in certain KPIs. The city excels in “public transportation accessibility”, indicating that a significant portion of the population has access to public transportation services. This achievement is critical for reducing private vehicle usage, alleviating traffic congestion, and lowering greenhouse gas emissions. Barcelona’s commitment to investment in public transportation infrastructure has contributed to this positive outcome. Another area of strength is the “affordability of public transportation”, which suggests that public transportation is reasonably priced for the population, particularly the poorest quartile. Affordable public transportation is essential for promoting inclusivity and ensuring that all segments of society can access mobility options.
While Barcelona demonstrates strengths in several KPIs, there are also notable challenges, particularly in the environmental dimension. The indicators related to air quality, such as “NO 2 emissions”, “PM 2.5 emissions”, and “PM 10 emissions”, reveal areas where the city faces environmental concerns. High concentrations of air pollutants, including nitrogen dioxide and particulate matter, can have adverse health effects on residents and contribute to poor air quality. The “traffic congestion” KPI underscores the need for measures to alleviate congestion during peak hours. Congested traffic leads not only to frustration among commuters, but also results in increased travel times and fuel consumption, further exacerbating environmental issues. The comparative analysis with other Spanish and European cities provides valuable insights into Barcelona’s performance. It is evident that Barcelona shares similarities with Madrid in terms of KPI values, indicating that both cities face similar challenges and opportunities. However, the comparison with European cities like London, Rome, Dublin, and Berlin reveals variations in performance. A critical aspect highlighted in this study is the importance of data availability and temporality. The lack of up-to-date data for certain indicators, such as “opportunity for active mobility”, poses challenges in assessing the impact of recent policy measures. Therefore, it is imperative for municipalities to increase data collection frequency and make data available in open-access formats to support evidence-based decision-making.

7. Conclusions

Using the existing scientific literature on smart and sustainable urban areas, this article identifies the main KPIs for measuring the quality of citizens’ mobility systems. These KPIs are classified according to the following dimensions: socioeconomic, transportation, and the environment. Subsequently, by utilizing open data sources and an adapted version of the Eltis method, the values of these KPIs are computed for the city of Barcelona, for which a detailed analysis is provided. To compare the obtained KPIs for Barcelona with those associated with other Spanish and European cities, additional open data sources are employed, along with the adapted Eltis method.
Concerning Barcelona, the principal KPIs indicating a high level of quality included “public transportation accessibility”, “transportation accidents”, “greenhouse gas emissions from transportation activities”, “affordability of public transportation”, “percentage of sustainable transportation”, and “investment in public transportation”. Similarly, areas requiring improvement—the focus of urban policies—were identified. These encompassed “traffic congestion”, “NO 2 emissions”, “PM 2.5 emissions”, “PM 10 emissions”, and “noise pollution”. Therefore, higher values in these indicators were preferable, representing the primary objectives. The distinguished high-quality KPIs underscored the strengths of Barcelona, while other areas necessitating enhancements were identified as well.
Facilitating knowledge exchange and experience sharing among cities is imperative for advancing sustainable mobility agendas across Europe. The proposed methodological framework provides a means to assess the interdependencies among various indicators, enabling a comprehensive comprehension of the implications and trade-offs associated with policy decisions. In addition to the foremost outcomes, which hold significant value for public and private policymakers in urban areas worldwide, the study highlights aspects that require careful consideration to enhance the capacity for building smarter and more sustainable cities. These include (i) the necessity of collecting a common dataset across diverse cities for KPI computation; (ii) the need for including the KPI timestamp in order to reflect urban realities accurately; and (iii) the relevant role of municipal councils in increasing data collection frequency and making it available in an open-access format through their respective websites.
This study has also some inherent limitations. Firstly, the gathered results rely on data available from publicly accessible sources. Therefore, the precision of results is contingent upon data quality and availability, and direct control over this process was not exercised. Furthermore, variations in KPIs’ update frequencies could miss short-term changes in urban mobility. Another limitation pertains to data availability in other cities for meaningful comparisons. Disparities in the quality and quantity of data provided by different municipalities may pose challenges for accurate cross-city comparisons, emphasizing the need for collaborative efforts to standardize data collection and access across European cities.
In future endeavors, the plan is to expand this study to encompass non-European cities. Regarding Barcelona, there is an intention to explore potential correlations between measured values of specific environmental KPIs and recorded transportation data in the urban area. This research will facilitate the development of machine-learning models capable of predicting how changes in transportation habits and modes could impact environmental KPIs. It is essential to underscore that the NO 2 indicator consistently yielded subpar results across all analyzed cities, emphasizing the urgent need for a comprehensive study and a more precise definition of this indicator at a European scale. This concern is based on the low ratings received and the lack of sufficiently detailed definition, particularly when considering daily fluctuations in NO 2 emissions, which can exceed the maximum allowed limit by a factor up to three in certain city areas. These future research directions can make a significant contribution to the understanding of citizen mobility logistics in urban environments.

Author Contributions

Conceptualization, E.P.-B. and A.A.J.; methodology, R.S.-G.; software, Y.A.; validation, P.C. and A.C.; writing—original draft preparation, R.S.-G. and Y.A.; writing—review and editing, A.A.J.; supervision, E.P.-B. and P.C. All authors have read and agreed to the published version of the manuscript.

Funding

This work was partially funded by the European Commission project UP2030 (HORIZON-MISS-2021-CIT-02-01-101096405), the Alcoi’s City Council (Catedra Alcoi Smart City), and the Spanish Ministry of Science and Innovation (PID2022-138860NB-I00 and RED2022-134703-T).

Data Availability Statement

See Table 5 and Table 6.

Conflicts of Interest

The authors declare no conflict of interest.

References

  1. Oliveira, T.A.; Gabrich, Y.B.; Ramalhinho, H.; Oliver, M.; Cohen, M.W.; Ochi, L.S.; Gueye, S.; Protti, F.; Pinto, A.A.; Ferreira, D.V.; et al. Mobility, citizens, innovation and technology in digital and smart cities. Future Internet 2020, 12, 22. [Google Scholar] [CrossRef]
  2. Kaspi, M.; Raviv, T.; Ulmer, M.W. Directions for future research on urban mobility and city logistics. Networks 2022, 79, 253–263. [Google Scholar] [CrossRef]
  3. Cano, J.A.; Londoño-Pineda, A.; Rodas, C. Sustainable logistics for e-commerce: A literature review and bibliometric analysis. Sustainability 2022, 14, 12247. [Google Scholar] [CrossRef]
  4. Ren, R.; Hu, W.; Dong, J.; Sun, B.; Chen, Y.; Chen, Z. A systematic literature review of green and sustainable logistics: Bibliometric analysis, research trend and knowledge taxonomy. Int. J. Environ. Res. Public Health 2020, 17, 261. [Google Scholar] [CrossRef] [PubMed]
  5. Lu, M.; Xie, R.; Chen, P.; Zou, Y.; Tang, J. Green transportation and logistics performance: An improved composite index. Sustainability 2019, 11, 2976. [Google Scholar] [CrossRef]
  6. Bosona, T. Urban freight last mile logistics—Challenges and opportunities to improve sustainability: A literature review. Sustainability 2020, 12, 8769. [Google Scholar] [CrossRef]
  7. Melkonyan, A.; Gruchmann, T.; Lohmar, F.; Kamath, V.; Spinler, S. Sustainability assessment of last-mile logistics and distribution strategies: The case of local food networks. Int. J. Prod. Econ. 2020, 228, 107746. [Google Scholar] [CrossRef]
  8. Muñoz-Villamizar, A.; Solano-Charris, E.L.; Reyes-Rubiano, L.; Faulin, J. Measuring Disruptions in Last-Mile Delivery Operations. Logistics 2021, 5, 17. [Google Scholar] [CrossRef]
  9. Juan, A.A.; Mendez, C.A.; Faulin, J.; De Armas, J.; Grasman, S.E. Electric vehicles in logistics and transportation: A survey on emerging environmental, strategic, and operational challenges. Energies 2016, 9, 86. [Google Scholar] [CrossRef]
  10. Jang, Y.J.; Jeong, S.; Lee, M.S. Initial energy logistics cost analysis for stationary, quasi-dynamic, and dynamic wireless charging public transportation systems. Energies 2016, 9, 483. [Google Scholar] [CrossRef]
  11. Mohsan, S.A.H.; Khan, M.A.; Noor, F.; Ullah, I.; Alsharif, M.H. Towards the unmanned aerial vehicles (UAVs): A comprehensive review. Drones 2022, 6, 147. [Google Scholar] [CrossRef]
  12. Seuwou, P.; Banissi, E.; Ubakanma, G. The future of mobility with connected and autonomous vehicles in smart cities. In Digital Twin Technologies and Smart Cities; Springer: Cham, Switzerland, 2020; pp. 37–52. [Google Scholar]
  13. Bakalos, N.; Papadakis, N.; Litke, A. Public perception of autonomous mobility using ML-based sentiment analysis over social media data. Logistics 2020, 4, 12. [Google Scholar] [CrossRef]
  14. Martins, L.d.C.; Tordecilla, R.D.; Castaneda, J.; Juan, A.A.; Faulin, J. Electric vehicle routing, arc routing, and team orienteering problems in sustainable transportation. Energies 2021, 14, 5131. [Google Scholar] [CrossRef]
  15. Roblek, V.; Meško, M.; Podbregar, I. Impact of car sharing on urban sustainability. Sustainability 2021, 13, 905. [Google Scholar] [CrossRef]
  16. Esfandabadi, Z.S.; Diana, M.; Zanetti, M.C. Carsharing services in sustainable urban transport: An inclusive science map of the field. J. Clean. Prod. 2022, 357, 131981. [Google Scholar] [CrossRef]
  17. Macioszek, E.; Świerk, P.; Kurek, A. The bike-sharing system as an element of enhancing sustainable mobility—A case study based on a city in Poland. Sustainability 2020, 12, 3285. [Google Scholar] [CrossRef]
  18. Tsavachidis, M.; Le Petit, Y. Re-shaping urban mobility–Key to Europe’s green transition. J. Urban Mobil. 2022, 2, 100014. [Google Scholar] [CrossRef]
  19. Gallo, M.; Marinelli, M. Sustainable mobility: A review of possible actions and policies. Sustainability 2020, 12, 7499. [Google Scholar] [CrossRef]
  20. Yang, F.; Wen, X.; Aziz, A.; Luhach, A.K. The need for local adaptation of smart infrastructure for sustainable economic management. Environ. Impact Assess. Rev. 2021, 88, 106565. [Google Scholar] [CrossRef]
  21. Holden, E.; Banister, D.; Gössling, S.; Gilpin, G.; Linnerud, K. Grand Narratives for sustainable mobility: A conceptual review. Energy Res. Soc. Sci. 2020, 65, 101454. [Google Scholar] [CrossRef]
  22. Mansouri, B.; Sahu, S.; Ülkü, M.A. Toward greening city logistics: A systematic review on corporate governance and social responsibility in managing urban distribution centers. Logistics 2023, 7, 19. [Google Scholar] [CrossRef]
  23. Bıyık, C.; Abareshi, A.; Paz, A.; Ruiz, R.A.; Battarra, R.; Rogers, C.D.; Lizarraga, C. Smart mobility adoption: A review of the literature. J. Open Innov. Technol. Mark. Complex. 2021, 7, 146. [Google Scholar] [CrossRef]
  24. Dalla Chiara, B.; Musso, A.; Ottomanelli, M. Sustainable cities: Innovative solutions for mobility and logistics. Transp. Policy 2019, 80, 94–96. [Google Scholar] [CrossRef]
  25. Caputo, F.; Magliocca, P.; Canestrino, R.; Rescigno, E. Rethinking the Role of Technology for Citizens’ Engagement and Sustainable Development in Smart Cities. Sustainability 2023, 15, 10400. [Google Scholar] [CrossRef]
  26. Ko, E.; Kim, H.; Lee, J. Survey data analysis on intention to use shared mobility services. J. Adv. Transp. 2021, 2021, 5585542. [Google Scholar] [CrossRef]
  27. Maldonado Silveira Alonso Munhoz, P.A.; da Costa Dias, F.; Kowal Chinelli, C.; Azevedo Guedes, A.L.; Neves dos Santos, J.A.; da Silveira e Silva, W.; Pereira Soares, C.A. Smart mobility: The main drivers for increasing the intelligence of urban mobility. Sustainability 2020, 12, 10675. [Google Scholar] [CrossRef]
  28. Chang, V. An ethical framework for big data and smart cities. Technol. Forecast. Soc. Chang. 2021, 165, 120559. [Google Scholar] [CrossRef]
  29. Angelakoglou, K.; Nikolopoulos, N.; Giourka, P.; Svensson, I.L.; Tsarchopoulos, P.; Tryferidis, A.; Tzovaras, D. A methodological framework for the selection of key performance indicators to assess smart city solutions. Smart Cities 2019, 2, 269–306. [Google Scholar] [CrossRef]
  30. Büyüközkan, G.; Ilıcak, Ö. Smart urban logistics: Literature review and future directions. Socio-Econ. Plan. Sci. 2022, 81, 101197. [Google Scholar] [CrossRef]
  31. Buhari, S.O.; Aponjolosun, M.O.; Oni, B.G.; Sam, M.W. Sustainable urban mobility: An approach to urbanization and motorization challenges in Nigeria, a case of Lagos state. J. Sustain. Dev. Transp. Logist. 2020, 5, 90–97. [Google Scholar] [CrossRef]
  32. Javed, A.R.; Shahzad, F.; ur Rehman, S.; Zikria, Y.B.; Razzak, I.; Jalil, Z.; Xu, G. Future smart cities requirements, emerging technologies, applications, challenges, and future aspects. Cities 2022, 129, 103794. [Google Scholar] [CrossRef]
  33. Han, D.; Kim, J.H. Multiple Smart Cities: The Case of the Eco Delta City in South Korea. Sustainability 2022, 14, 6243. [Google Scholar] [CrossRef]
  34. De Sanctis, M.; Iovino, L.; Rossi, M.T.; Wimmer, M. MIKADO: A smart city KPIs assessment modeling framework. Softw. Syst. Model. 2022, 21, 281–309. [Google Scholar] [CrossRef]
  35. Inac, H.; Oztemel, E. An assessment framework for the transformation of mobility 4.0 in smart cities. Systems 2021, 10, 1. [Google Scholar] [CrossRef]
  36. Kourtzanidis, K.; Angelakoglou, K.; Apostolopoulos, V.; Giourka, P.; Nikolopoulos, N. Assessing impact, performance and sustainability potential of smart city projects: Towards a case agnostic evaluation framework. Sustainability 2021, 13, 7395. [Google Scholar] [CrossRef]
  37. Pereira, A.M.; Hykšová, M.; Přibyl, O.; Maerivoet, S.; Overvoorde, R.; Paruscio, V.; Mylonas, C.; Vega, C.; Recolons, P.; Covelli, C.; et al. Tools for Mobility Analysis: What are the challenges and solutions for planning and operations of mobility services? In Proceedings of the 2022 Smart City Symposium Prague (SCSP), Prague, Czech Republic, 26–27 May 2022; pp. 1–6. [Google Scholar] [CrossRef]
  38. Larrinaga, F. Towards the implementation of services for the digital transformation of smart cities: The case of Vitoria-Gasteiz (Spain). Sensors 2021, 21, 8061. [Google Scholar] [CrossRef]
  39. Ntafalias, A.; Papadopoulos, G.; Papadopoulos, P.; Huovila, A. A comprehensive methodology for assessing the impact of smart city interventions: Evidence from Espoo transformation process. Smart Cities 2022, 5, 90–107. [Google Scholar] [CrossRef]
  40. Quijano, A.; Hernández, J.L.; Nouaille, P.; Virtanen, M.; Sánchez-Sarachu, B.; Pardo-Bosch, F.; Knieilng, J. Towards sustainable and smart cities: Replicable and KPI-driven evaluation framework. Buildings 2022, 12, 233. [Google Scholar] [CrossRef]
  41. Pinna, F.; Masala, F.; Garau, C. Urban policies and mobility trends in Italian smart cities. Sustainability 2017, 9, 494. [Google Scholar] [CrossRef]
  42. Nagy, S.; Csiszár, C. The quality of smart mobility: A systematic review. In Zeszyty Naukowe; Transport/Politechnika Slaska: Katowice, Poland, 2020. [Google Scholar]
  43. Golpayegani, F.; Guériau, M.; Laharotte, P.A.; Ghanadbashi, S.; Guo, J.; Geraghty, J.; Wang, S. Intelligent Shared Mobility Systems: A Survey on Whole System Design Requirements, Challenges and Future Direction. IEEE Access 2022, 10, 35302–35320. [Google Scholar] [CrossRef]
  44. Giannopoulos, A.T. Assessing the impact of case mobility: Issues and recommendations from Greece. J. Eng. Appl. Sci. 2021, 68, 1. [Google Scholar] [CrossRef]
  45. Chung, S.H. Applications of smart technologies in logistics and transport: A review. Transp. Res. Part E Logist. Transp. Rev. 2021, 153, 102455. [Google Scholar] [CrossRef]
  46. Al Haddad, C.; Fu, M.; Straubinger, A.; Plötner, K.; Antoniou, C. Choosing Suitable Indicators for the Assessment of urban air mobility: A case study of upper Bavaria, germany. Eur. J. Transp. Infrastruct. Res. 2020, 20, 214–232. [Google Scholar] [CrossRef]
  47. Paiva, S.; Ahad, M.A.; Tripathi, G.; Feroz, N.; Casalino, G. Enabling technologies for urban smart mobility: Recent trends, opportunities and challenges. Sensors 2021, 21, 2143. [Google Scholar] [CrossRef] [PubMed]
  48. Sun, J.; Liu, S.; Zhang, X.; Gong, D. Simulation-based modelling of the impact of Ridesharing on Urban System. Int. J. Simul. Model. (IJSIMM) 2022, 21, 148–159. [Google Scholar] [CrossRef]
  49. Giorgione, G.; Bolzani, L.; Viti, F. Assessing two-way and one-way carsharing: An agent-based simulation approach. Transp. Res. Procedia 2021, 52, 541–548. [Google Scholar] [CrossRef]
  50. Prinz, C.; Willnat, M.; Brendel, A.B.; Lichtenberg, S.; Kolbe, L. CASSI: Designing a simulation environment for vehicle relocation in carsharing. AIS Trans. Hum. Comput. Interact. 2021, 13, 12–37. [Google Scholar] [CrossRef]
  51. Jittrapirom, P.; Boonsiripant, S.; Phamornmongkhonchai, M. Aligning stakeholders’ mental models on carsharing system using remote focus group method. Transp. Res. Part D Transp. Environ. 2021, 101, 103122. [Google Scholar] [CrossRef]
  52. Chen, M.; Sun, Y.; Waygood, E.O.D.; Yu, J.; Zhu, K. User characteristics and service satisfaction of car sharing systems: Evidence from Hangzhou, China. PLoS ONE 2022, 17, e0263476. [Google Scholar] [CrossRef]
  53. Kadhim, R.W.; jaffar Raheem, M.; Mohialden, Y.M.; Hussien, N.M. A Review of the Implementation of NumPy and SciPy Packages in Science and Math. Turk. J. Comput. Math. Educ. (TURCOMAT) 2022, 13, 663–667. [Google Scholar]
  54. McKinney, W. Python for Data Analysis; O’Reilly Media, Inc.: Sebastopol, CA, USA, 2022. [Google Scholar]
  55. Nelli, F. Data Visualization with matplotlib and Seaborn. In Python Data Analytics: With Pandas, NumPy, and Matplotlib; Springer: Berlin/Heidelberg, Germany, 2023; pp. 183–257. [Google Scholar]
  56. Dhruv, A.J.; Patel, R.; Doshi, N. Python: The Most Advanced Programming Language for Computer Science Applications; Science and Technology Publications, Lda: Setúbal, Portugal, 2021; pp. 292–299. [Google Scholar]
  57. OZMEN, E. Event Density Visualization with Python Folium Library for Public Complaint Management: An Application with 311 Calls. In Research & Reviews in Science and Mathematics-I; 2021; Available online: https://www.gecekitapligi.com/Webkontrol/uploads/Fck/sciences1_1.pdf (accessed on 11 October 2023).
  58. Dumedah, G. Address points of landmarks and paratransit services as a credible reference database for geocoding. Trans. GIS 2021, 25, 1027–1048. [Google Scholar] [CrossRef]
  59. Patella, S.M.; Grazieschi, G.; Gatta, V.; Marcucci, E.; Carrese, S. The adoption of green vehicles in last mile logistics: A systematic review. Sustainability 2020, 13, 6. [Google Scholar] [CrossRef]
  60. Jardas, M.; Perić Hadžić, A.; Tijan, E. Defining and Measuring the Relevance of Criteria for the Evaluation of the Inflow of Goods in City Centers. Logistics 2021, 5, 44. [Google Scholar] [CrossRef]
  61. Nataraj, S.; Ferone, D.; Quintero-Araujo, C.; Juan, A.; Festa, P. Consolidation centers in city logistics: A cooperative approach based on the location routing problem. Int. J. Ind. Eng. Comput. 2019, 10, 393–404. [Google Scholar] [CrossRef]
Figure 1. Outline of research questions and objectives.
Logistics 07 00075 g001
Figure 2. KPI values for the city of Barcelona.
Logistics 07 00075 g002
Figure 3. Evolution of KPIs over the past years.
Logistics 07 00075 g003
Figure 4. Variation of KPIs over time in Barcelona.
Logistics 07 00075 g004
Figure 5. Comparison of KPI results across Spanish cities.
Logistics 07 00075 g005
Figure 6. Comparison of KPI results across European cities.
Logistics 07 00075 g006
Table 1. Socio-economic KPIs identified in the literature.
ReferenceKPIsCity ManagerPrivate Comp.End-User
Al Haddad et al. [46]Housing cost (change in housing due to land-use for carsharing)x
Al Haddad et al. [46]Investment costsxx
Al Haddad et al. [46]Operation cost (EUR)xx
Kourtzanidis et al. [36]Total Annual Costs %xx
SHOWTotal costs per vehicle over its lifetime (EUR)/vehicle-year x
SHOWStructure and share of variable costs (maintenance, personnel, energy consumption)xx
SHOWRevenue per vehicle (EUR)/vehicle-km x
Ntafalias et al. [39]/Kourtzanidis et al. [36]Return on investment (%) x
SHOWMinimum level of necessary investment (EUR) to start operationxx
Kourtzanidis et al. [36]Total Investments EUR/m2xx
SHOWRatio of money gained or lost on an investment relative to the amount of money invested (%) x
SHOWShare of revenue from each revenue stream (incl. subsidies and subventions)(%) x
Ntafalias et al. [39]/Kourtzanidis et al. [36]Payback time (years) x
Ntafalias et al. [39]Debt Service Coverage ratio (%) x
Inac and Oztemel [35]Economic power of City Gross Domestic Product per capita (GDP)x
EltisEconomic opportunityx
EltisNet public financexx
Table 2. Transportation KPIs identified in the literature—Part 1.
ReferenceKPIsCity ManagerPrivate Comp.End-User
Al Haddad et al. [46]Total travel time saved (Total travel time saved compared to status quo-minutes) xx
Al Haddad et al. [46]Travel time budget x
Sun et al. [48]Total passenger travel time (including a penalty for each unsatisfied user) x
SHOWAverage time the end-user is waiting (min) x
SHOWAverage time the vehicle is standing (min) x
Giannopoulos [44]Average time to reach a stop (a select number of stops before and after) x
Al Haddad et al. [46]/SHOWUtilization rate/Ratio between vehicle time in circulation and vehicle time in rest (%) x
Giannopoulos [44]Average travel times over select routes x
SUMI/EltisCommuting travel time xx
SHOWAverage trip duration (min) xx
SHOWAverage time traveled by users with the service (min/user-trip ) x
Sun et al. [48]Detour time (h)xx
Sun et al. [48]Passenger travel time, in terms of average waiting time (min), average on-board time, and average total travel time (min) xx
Inac and Oztemel [35]Travel time management commute time by public transportation (min)x
Al Haddad et al. [46]/Giannopoulos [44]/Sun et al. [48]Total number of passenger trips x
Kourtzanidis et al. [36]Number of passengers using the new vehicles %xx
SHOWAverage daily number of trips (EUR)/vehicle-km or (EUR)/vehicle-trip x
SHOWAverage number of persons in a vehicle with respect to total vehicle capacity (%) x
Al Haddad et al. [46]/Inac and Oztemel [35]/SUMI/EltisCongestion (Congestion on the ground - hour or vehicle/km traveled)xx
Al Haddad et al. [46]Vehicle-km traveled x
Giorgione et al. [49]Total booking distance (km) x
Sun et al. [48]Mileage saving rate (%) x
Giorgione et al. [49]Total length driven per day x
Al Haddad et al. [46]/Giannopoulos [44]Safety (number of accidents) x
SUMITraffic safety active modesx x
Inac and Oztemel [35]/SUMI/EltisIncident management negative impact performance Index (Road deaths per million inhabitants)xx
Giannopoulos [44]Nº of fatalities in road accidents (before and after carsharing) x
SHOWRatio between empty and non-empty trips (%) x
SHOWNumber of years a fleet of vehicles or infrastructure is expected to last (years) x
Al Haddad et al. [46]Efficiency (empty fleet )/fleet management x
Ntafalias et al. [39]Car sharing rate increase (%)xx
Prinz et al. [50]Utilization ratio (hours vehicles used/h vehicles available) x
Giorgione et al. [49]Bookings (number of total reservations, number of reservations by type of member) x
Ntafalias et al. [39]Increase in smart charging points (%)xx
Kourtzanidis et al. [36]Number of EV charging points (points/1000 inh)xx
Kourtzanidis et al. [36]Annual Energy delivered by charging points kWhxx
Ntafalias et al. [39]Utilization of charging stations (%)xx
Al Haddad et al. [46]Average travel speed per mode x
Table 3. Transportation KPIs identified in the literature—Part 2.
ReferenceKPIsCity ManagerPrivate Comp.End-User
Giannopoulos [44]Average speed (average speed over select nº of routes) xx
Inac and Oztemel [35]Whether climate conditions have and impact on transportationxx
Inac and Oztemel [35]Whether topology conditions affect transportationxx
Al Haddad et al. [46]Public transportation modal sharex
Giannopoulos [44]% usage of non-motorized transportation modesx
Giannopoulos [44]Occupancy rates of private vehicles (before/after carsharing)xx
Ntafalias et al. [39]Targeted share of bicycle and pedestrian mobility modex
Ntafalias et al. [39]Estimated share of vehicle: km by chargeable vehicles, Hybrid Electric Vehicles, Battery Electric vehiclesx
Ntafalias et al. [39]Transportation behavior (%)xx
SUMI/EltisMulti-modal integrationxxx
Inac and Oztemel [35]Urban mobility index ratexx
Al Haddad et al. [46]Inconvenience (Access, egress, waiting time)xxx
SHOWProportion of deliveries and pickups made in the right time slot x
SHOWProportion of deliveries and pickups made in the right quantity (no loss or theft) (%) x
Al Haddad et al. [46]On-time performancexx
Al Haddad et al. [46]Induced demand x
Al Haddad et al. [46]/Jittrapirom et al. [51]Availabilityx
SHOWLevel of service personalization xx
Al Haddad et al. [46]Flexibility (In the network design)xx
Al Haddad et al. [46]Scalability (Extent to which alternative is scalable) x
Giannopoulos [44]Reliability (% of schedule reliability in a select nº stops) x
Jittrapirom et al. [51]Functionalityx
Inac and Oztemel [35]Freight vehicle traffic rate percentage of freight vehicles in total trafficxx
SHOWAccessibility of low-density areas (%) xx
SUMI/EltisUrban functional diversityxx
SUMI/EltisOpportunity for Active Mobilityxx
SHOWCapacity of a service to retain customers (%) xx
Kourtzanidis et al. [36]/SHOWShared EVs and Bicycles Penetration Rate %xxx
Kourtzanidis et al. [36]Parking with available spacesxxx
Table 4. Environmental KPIs identified in the literature.
ReferenceKPIsCity ManagerPrivate Comp.End-User
Al Haddad et al. [46]Energy consumptionxxx
SUMI/EltisEnergy efficiencyxx
Kourtzanidis et al. [36]Self-sufficiency ratio %x
Ntafalias et al. [39]/Kourtzanidis et al. [36]Self-consumption rate increase (%)x x
Ntafalias et al. [39]Energy storage increase (%)x
Ntafalias et al. [39]Decrease of energy import share (%)x
Ntafalias et al. [39]Onsite Energy ratio (%)x
Kourtzanidis et al. [36]Energy Savings %x
Kourtzanidis et al. [36]Energy System Flexibility %x
Ntafalias et al. [39]Percentage of locally produced energy (heat, cool, electricity) compared to baseline (%)x
Ntafalias et al. [39]Total electricity demand reduction (Wh)x
Ntafalias et al. [39]Reduction heating demand reduction (Wh)x
Ntafalias et al. [39]Excess Heat recovery ratio (%)x
Ntafalias et al. [39]Peak load (electricity) reduction (%)x
Ntafalias et al. [39]Peak load (heating) reduction (%)x
Giannopoulos [44]/Ntafalias et al. [39]Total hydrocarbon energy consumption of private vehicles per dayx
Al Haddad et al. [46]/SUMI/EltisNoise emissionsxxx
Al Haddad et al. [46]Visual pollutionx x
Ntafalias et al. [39]/Al Haddad et al. [46]/
SUMI/EltisKourtzanidis et al. [36]
Air Quality (ppm)xxx
Giannopoulos [44]/Al Haddad et al. [46]/
Ntafalias et al. [39]/Kourtzanidis et al. [36]
CO2 emissions from car traffic (measurements of CO2 concentrations at select nº of points by the road)xx
Giannopoulos [44]PM10 and PM25 emissions (measurements of PM10 and PM25 concentrations at select nº of points by the road)xx
Giannopoulos [44]/Al Haddad et al. [46]/
Ntafalias et al. [39]
NOx emissions (measurements of NOx concentrations at select nº of points by the road)xx
Inac and Oztemel [35]Pollution Reduction active trips ratex
SUMI/Eltis/[36]Greenhouse gas emissionsxx
Ntafalias et al. [39]Reduction of CO2 emissions (tonnes/year)x
Ntafalias et al. [39]Number of early-stage solutions investigatedx
Ntafalias et al. [39]Number of innovative energy technologies incorporated in virtual twin for simulations purposesx
Ntafalias et al. [39]Increase of smart energy infrastructuresx
Al Haddad et al. [46]Battery life cyclexx
Al Haddad et al. [46]Impact of constructionx
Al Haddad et al. [46]Animal impactx
Al Haddad et al. [46]In missionx
Al Haddad et al. [46]High frequency/5G influencex
Kourtzanidis et al. [36]kWp photovoltaic in-stalled
per 100 inhabitants kWp/100 inh
x
Table 5. Barcelona KPIs computed using the Eltis method.
KPIsDefinitionData OriginTime RangeUnits
Accidents in transportationNumber of deaths by road and transportation accidents in the city per 100,000 inhabitantshttps://www.barcelona.catyearlyfatalities/100,000 capite
Public transportation investmentNet revenues from government and other public authorities from transportation-related taxes and charges, minus operating and other transportation-related costs—investments are excluded from the parameter calculationshttps://ajuntament.barcelona.catyearly%
Affordability of public transportation for the poorest groupShare of the public transportation cost for fulfilling basic activities of the household budget for the poorest quartile of the population—based on the relations between the cost for 60https://ajuntament.barcelona.cathttps://www.idescat.catyearly%
Opportunity for active mobilityOptions and infrastructure for active mobility (walking and cycling)–the length of roads and streets with sidewalks and cycle paths, 30 km/h zones, and pedestrian zones are related to the total length of the city’s road networkhttps://opendata-ajuntament.barcelona.catyearly% road length
Table 6. Computing KPIs for Barcelona using an adaptation of the Eltis method.
KPIsDefinitionData OriginTime RangeUnits
Noise pollutionPercentage of population hindered by city transportation noise based on hindrance factors for noise level measurementshttps://ajuntament.barcelona.catyearly% of population
Public spaces qualitySubjective appreciation of the public area quality, attractive areas such as pedestrian streets or squares with social activitieshttps://opendata-ajuntament.barcelona.catyearly10-point scale
Public transportation accessibilityAccess to public transportation for people with reduced mobilityhttps://www.tmb.catyearly%
Emissions of greenhouse gases (GHG)Tonne CO 2 equivalent well-to-wheel emissions by urban transportation per year and person by all city passenger and freight transportation modeshttps://www.energia.barcelonayearlytonne CO 2 eq/cap per year
SecurityReported perception about crime-related security in the city transportation systemhttps://opendata-ajuntament.barcelona.catyearly10-point scale
Traffic congestionDelays in road traffic during peak hours compared to free traffichttps://opendata-ajuntament.barcelona.catdiary%
PM 2.5 emissions (µg/m 3 )PM 2.5 emissions in the city’s atmospherehttps://opendata-ajuntament.barcelona.catdiaryµg/m 3
PM10 10 emissions (µg/m 3 )PM 10 emissions in the city’s atmospherehttps://opendata-ajuntament.barcelona.catdiaryµg/m 3
NO 2 emissions (µg/m 3 )NO 2 emissions in the city’s atmospherehttps://opendata-ajuntament.barcelona.catdiaryµg/m 3
Disclaimer/Publisher’s Note: The statements, opinions and data contained in all publications are solely those of the individual author(s) and contributor(s) and not of MDPI and/or the editor(s). MDPI and/or the editor(s) disclaim responsibility for any injury to people or property resulting from any ideas, methods, instructions or products referred to in the content.

