Article

Transportation-Induced Carbon Emissions Jeopardize Healthcare Logistics Sustainability: Toward a Healthier Today and a Better Tomorrow

1
Department of Economics, The University of Haripur, Haripur 22620, Pakistan
2
School of Public Administration, Xi’an University of Architecture and Technology, Xi’an 710000, China
3
Department of Business Administration, The Superior University, Lahore 54000, Pakistan
4
Industrial Engineering and Management, Lappeenranta-Lahti University of Technology LUT, P.O. Box 20, FI-53851 Lappeenranta, Finland
5
Fakultas Ekonomi dan Bisnis, Universitas Pembangunan Nasional “Veteran” Jawa Timur, Surabaya 60294, Indonesia
6
Centre for Foundation and Continuing Education (PPAL), Department of Nationhood and Civilization, Universiti Malaysia Terengganu (UMT), Kuala Nerus 21300, Terengganu, Malaysia
7
Faculty of Leadership and Management, Universiti Sains Islam Malaysia, Nilai 71800, Negeri Sembilan, Malaysia
8
Faculty of Social Sciences & Humanities, Universiti Teknologi Malaysia (UTM), Skudai 81310, Johor, Malaysia
*
Authors to whom correspondence should be addressed.
Logistics 2022, 6(2), 27; https://doi.org/10.3390/logistics6020027
Submission received: 21 March 2022 / Revised: 3 April 2022 / Accepted: 11 April 2022 / Published: 15 April 2022

Abstract

:
Background: Logistics operations are considered essential for transporting commodities from one location to another, helping to promote global economic activity. On the other hand, its negative impact eclipses its positive impact, namely the rise in healthcare expenditures due to its ecological footprint. Globally, rising out-of-pocket health expenses result from logistic-induced carbon emissions, posing a danger to the long-term viability of healthcare. Methods: Based on this critical fact, this study examined the impact of logistics operations on healthcare costs by controlling for carbon emissions, fuel imports, and economic development across a large cross-section of 131 nations by using the Robust Least Squares Regression. Results: The findings demonstrate a U-shaped association between logistical operations and healthcare expenditures, i.e., if there is a 1% increase in logistics operations, healthcare expenditures decrease by −2.421% initially, while at later stages, healthcare costs would increase by 0.139%. On the other hand, increased fuel imports and economic growth due to logistics activities are increasing healthcare expenditures with an elasticity estimate of 0.087% and 0.147%, respectively. According to the forecasting predictions, logistics-induced carbon emissions, fuel imports, and economic expansion will increase healthcare expenses. Conclusions: A sustainable logistics operation is critical for strengthening healthcare infrastructure and meeting the global carbon neutrality goal.

1. Introduction

Logistics activities are an integral part of the supply chain process, performing various functions such as customs clearance, trade and transportation infrastructure, international shipments, logistics competence, tracking and tracing consignments, and meeting delivery deadlines [1,2,3]. The green supply chain method is critical for enhancing environmental quality and reducing healthcare costs, assisting economies in moving toward a clean and green agenda [4,5,
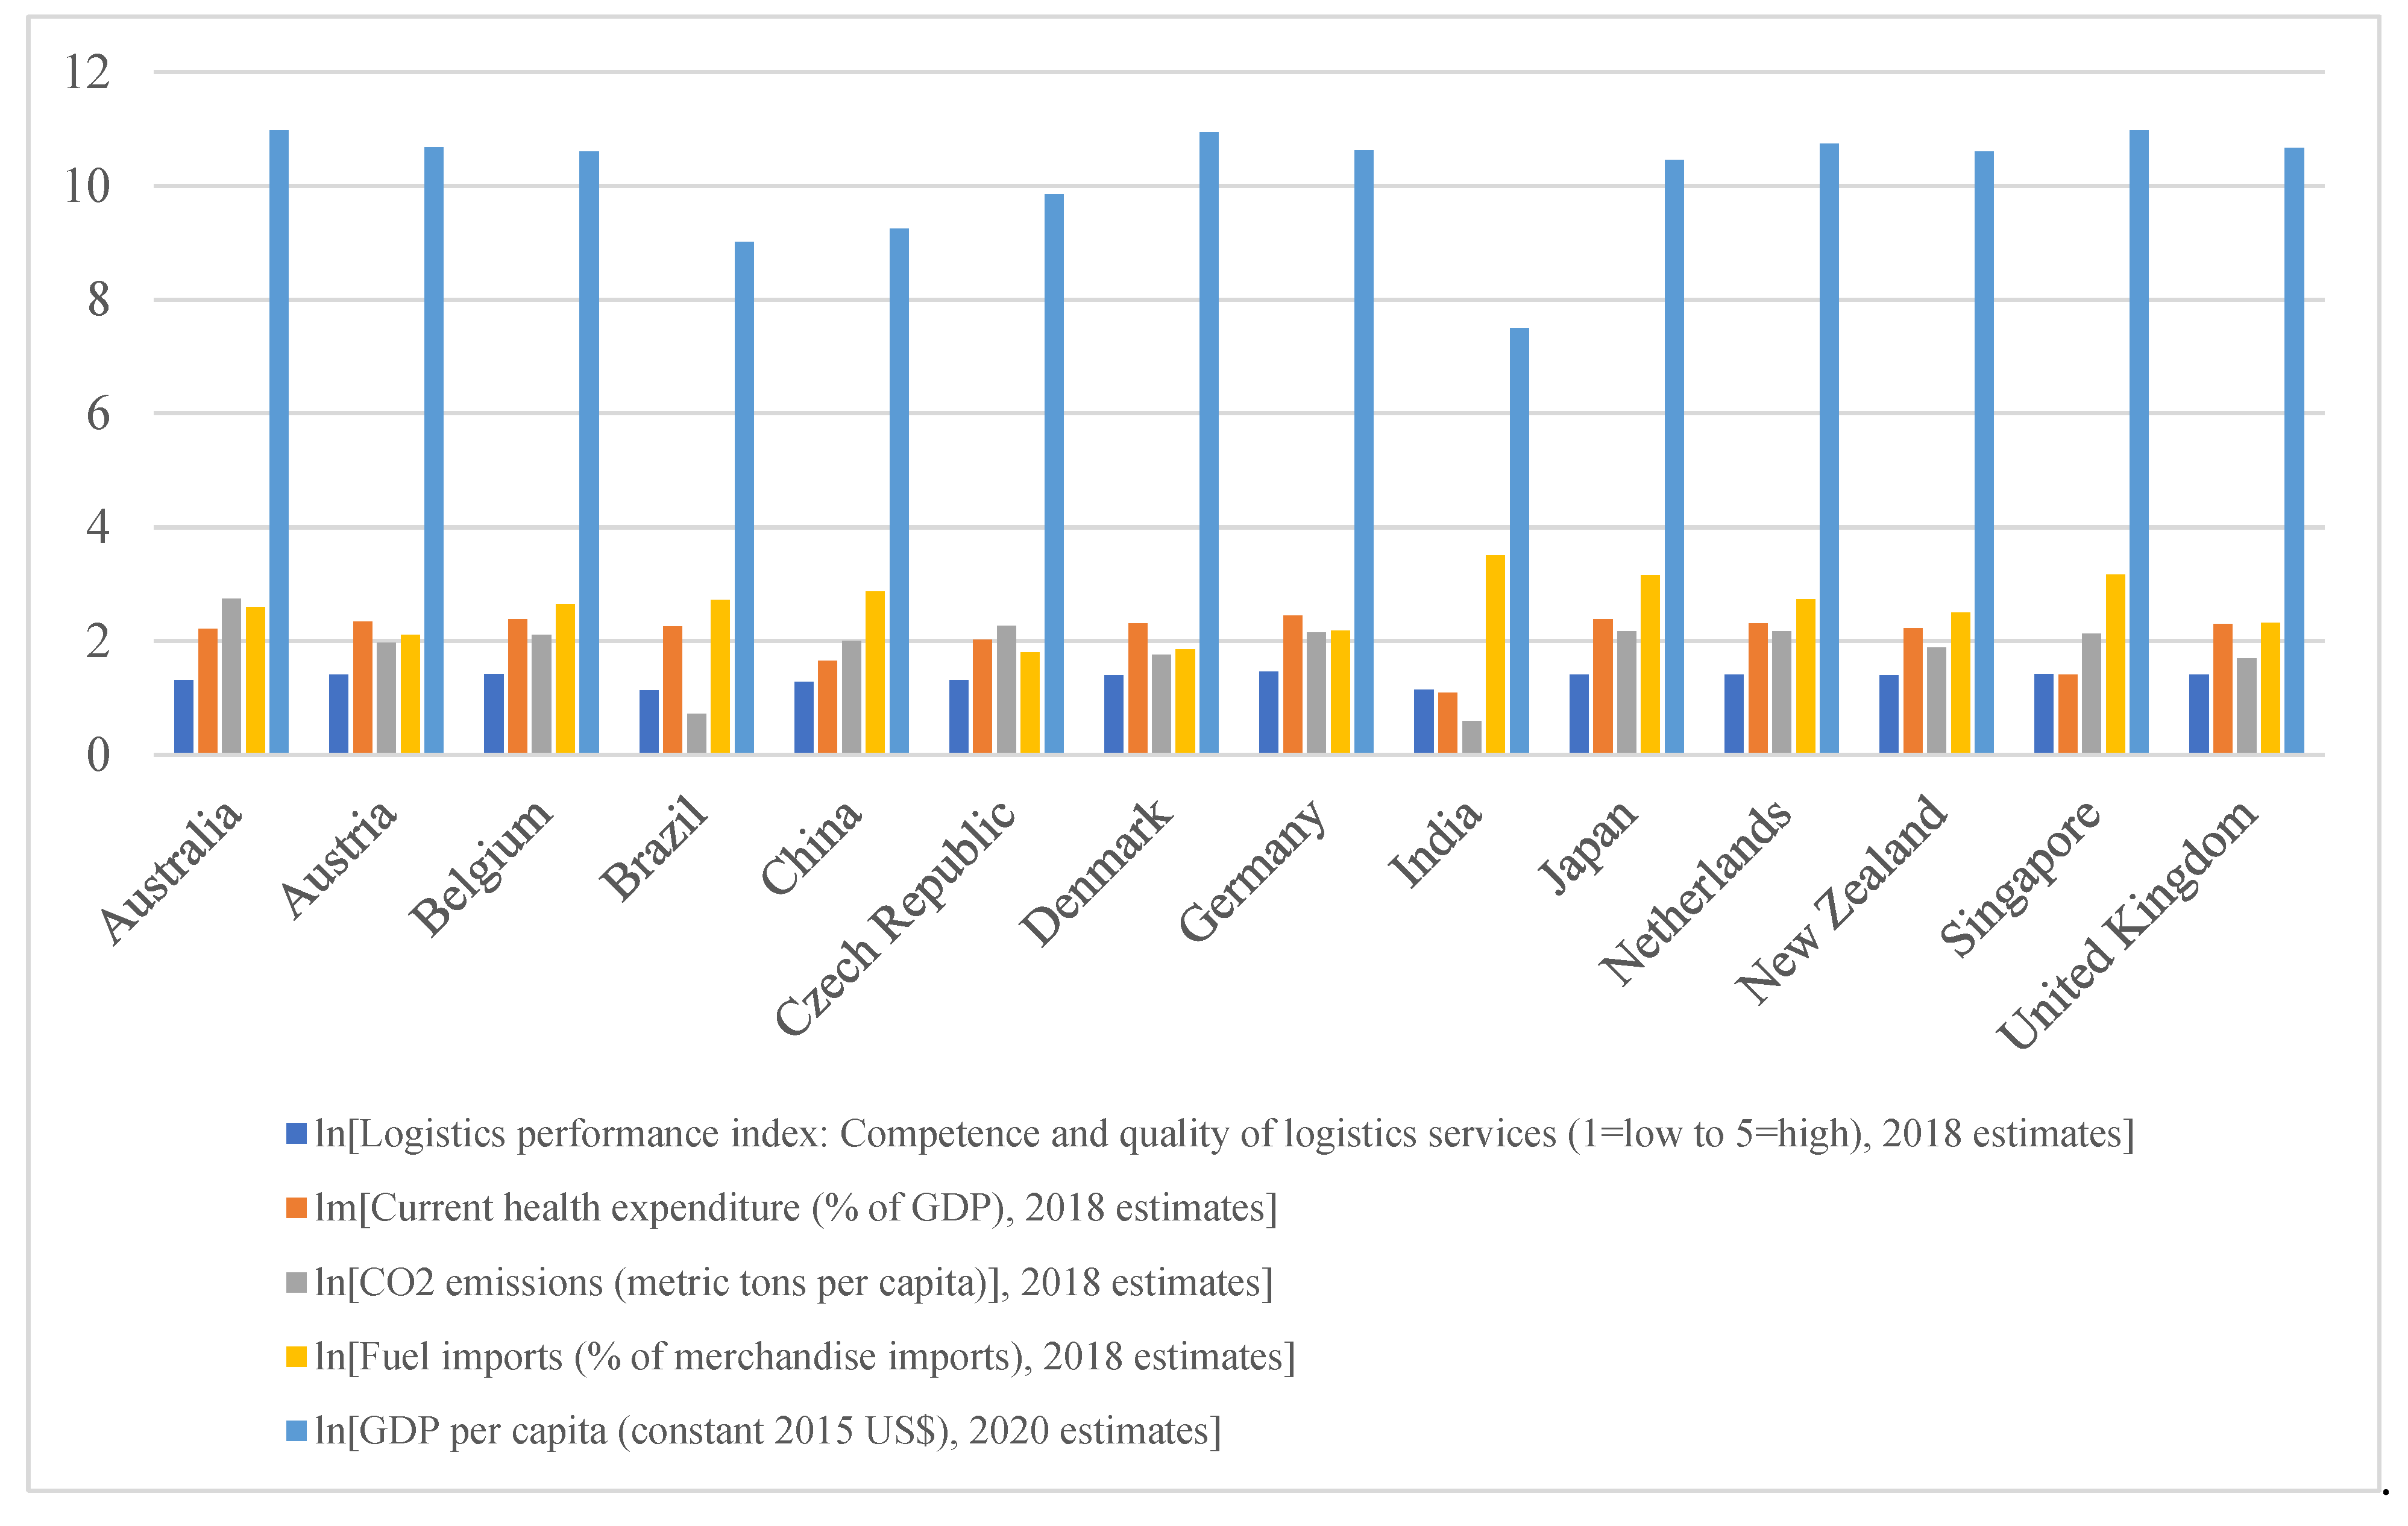
6]. According to the worldwide dataset, nations that engage in more logistical activities are expected to incur more healthcare costs due to increased logistics-related carbon emissions, fuel imports, and economic activity. For instance, if we closely monitor the trend analysis of the following countries, we see that the Australian economy’s moderate logistics activities (logistics performance index (LPI)) index value is 3.71. This resulted in a tremendous increase in healthcare expenditures (9.155 percent of gross domestic product (GDP)), while Australia released carbon emissions of approximately 15.475 metric tonnes per capita in 2018. Additionally, the country’s fuel imports accounted for 13.312 percent of goods exports (2018 estimates), boosting the economy’s GDP per capita to 58,043.58 US dollars (2020 estimates). The Austrian and Belgian economies have a high LPI index score, 4.08 and 4.13, respectively, emitting more than seven metric tonnes of carbon dioxide per capita and increasing healthcare expenses by more than 10% of their GDP. Belgium’s economy is significantly reliant on fuel imports, accounting for 14.136 percent of item imports, compared to Austria’s economy, which imports fuel at an 8.178 percent rate, helping to boost their economies’ per capita income to around USD 40,381.54 and USD 43,327.35, respectively. Brazil, China, the Czech Republic, and India score reasonably in the LPI while growing their reliance on imported fuels to power economic activity. Japan, the Netherlands, New Zealand, Singapore, and the United Kingdom excel in LPI while increasing healthcare spending to mitigate the harmful impact of carbon emissions caused by importing fuels and fueling economic activity [7]. For convenience, Figure 1 depicts a trend analysis of the parameters mentioned above.
Based on this crucial discussion, it is evident that unsustainable logistics activities hamper the healthcare sustainability agenda because of increasing carbon emissions, importing fuels, and continued economic activity. Earlier studies mainly worked on the stated topic and found some interesting findings that helped to build the empirical model for the green supply chain management process. For instance, Khan et al. [8] collected data from Association of Southeast Asian Nations (ASEAN) countries from 2011 to 2019 to assess the dynamic relationship between logistics performance, green energy consumption, crime rate, and inbound tourism. The results show that renewable energy demand, economic growth, and logistics performance attracted inbound tourists for safe visitation. On the other hand, rising crime rates discourage inbound tourists in various countries. Sasmaz et al. [9] assessed the causal relationships between healthcare expenditures and renewable energy demand in 27 European Union (EU) member countries. They found that the EU countries that joined the EU before 2000 found a unidirectional causal relationship between the stated variables.
On the other hand, bidirectional relationships were found between the variables for those countries that joined the EU after 2000. Austria, Finland, Bulgaria, Croatia, and Malta confirmed the energy-led health hypothesis, whereas Denmark, Greece, Portugal, Estonia, and Romania confirmed health-led energy consumption. The study concludes that green energy sources help to improve health outcomes. Hence, renewable energy sources should be included in the national energy grid to move forward towards attaining healthcare sustainability across European countries. Anser et al. [10] discussed the vulnerability caused by the COVID-19 pandemic, which paralyzed all economic activities, including causing disruptions in the healthcare supply chain process, which were deemed as limiting the supply of protective healthcare equipment and medications. In general, the study results show that an increase in coronavirus cases and deaths was associated with limited healthcare supply chain processes. On the other hand, an increased recovery rate helped to ease the COVID-19 measures to increase healthcare supply chain activities worldwide. The need for sustained logistics supply must be undisrupted to mitigate the coronavirus pandemic. Li et al. [11] analyzed the green logistics activities in One Belt and Road initiative countries from 2007 to 2019. The results found that green logistics activities helped to mitigate adverse environmental externalities and improve economic activity. The study emphasized the need to improve the green supply chain process, which helps countries to move forward towards clean and green developmental initiatives.
The most recent literature available on logistics-associated emissions that impede economic and healthcare sustainability agendas, i.e., Li et al. [12], argued that food supply chain emissions are widely displayed in Japan’s food production, wholesale, and retail stages. The need to reduce the carbon footprint of supply chain processes would necessitate an increase in local consumption of fresh fruit, vegetables, and meat, which would improve the healthcare sustainability agenda. Paschalidou et al. [13] evaluated different emissions released by the transportation sector in Greece from 1990 to 2017. They discovered that, except for railways, other modes of transportation, including road transportation, aviation, and navigation, significantly increased greenhouse gases (GHGs), negatively affecting the country’s health and wealth. Smart transportation is vital for improving environmental quality. Guo and Wang [14] examined 30 provincial datasets from the Chinese economy from 2003 to 2017 and discovered that a rising population, unsustainable production technology, and logistics-induced energy all influenced carbon emissions. Hence, it is essential to limit the growing population, use cleaner production technologies, and switch from non-renewable to renewable energy sources in logistics operations. All these factors would be helpful to attain socio-economic and environmental sustainability. Bhargava et al. [15] concluded that intelligent and sustainable logistics operations are imperative to improve logistics timelines and trade quality and infrastructure to improve customer satisfaction. The use of artificial intelligence in logistics operations and industrial smartness with technology would be helpful to move forward towards a sustainability agenda. Zhao et al. [16] considered a provincial dataset of 30 Chinese cities for 2002–2017 and assessed the level of the intelligent transportation sector in the country. The results show that transportation released carbon emissions mitigated by smart transportation through a channel of increasing economies of scale, transportation structure, and technology used in the transportation sector. As a result, it is preferable to maintain momentum in the use of smart technology in vehicle modifications that improve environmental quality and logistics performance. Based on the cited literature, this study hypothesizes the following:
Hypothesis 1 (H1).
Logistics activities likely exhibit a nonlinear relationship with healthcare expenditures.
Hypothesis 2 (H2).
Logistics-induced carbon emissions likely damage the healthcare infrastructure.
Hypothesis 3 (H3).
Logistics-induced carbon emissions and economic activities likely increase healthcare costs across countries.
Based on the stated discussion, the novel contribution of the study is analyzing the effects of unsustainable logistics operations on the healthcare sustainability agenda. It is primarily compromised by unsustainable trade and transportation infrastructure and meets the timeliness required to deliver the item through speed transactions, which requires more energy and damages the natural environment. The earlier studies mainly focused on unsustainable logistics issues that harmed the global environment. In contrast, many studies examined its impact on increasing healthcare costs [17,18,19]. Hence, this study mainly focused on logistics performance activities and their impact on sustainable healthcare in a large panel of 131 countries. Furthermore, this study analyzed logistics-induced carbon emissions activities, which are mainly released due to unsustainable fuel used in vehicles to ship delivery items from one place to another, resulting in damage to environmental quality and the healthcare sustainability agenda. The earlier studies were limited to analyzing the stated relationships that were overcome in this study for proposing green supply chain policies [20,21]. Finally, this study used logistics-induced fuel imports and economic activities that primarily deteriorate the healthcare infrastructure through the high risk of importing energy fuels and massive production, which increase economic profits at the cost of health damage. The earlier studies were limited to systematically finding the relationships between the variables and limiting their impact to a few countries or regions [22,23,24,25]. In comparison, this study provides a more systematic way of analyzing the stated relationship by taking relevant factors for this relationship and covering a large cross-section of countries.
The following research questions emerged with this crucial discussion: first, can logistics operations be clean and green? The various modes of transportation used in the shipment of goods are primarily responsible for the deterioration of environmental quality. The use of non-renewable fuels in logistics operations exacerbates carbon emissions, which leads to many health impacts and increases healthcare costs. Second, do logistics-induced fuel imports threaten the sustainable healthcare agenda? Along with the logistics-induced carbon emissions, importing crude oil and petroleum products also causes severe environmental destruction. It produces several toxic pollutants into the atmosphere through the transportation of goods and services worldwide. Hence, its impact also puts much strain on the sustainable healthcare agenda, which leads to increased out-of-pocket healthcare expenditures. Finally, do logistics-induced economic activities damage the global environment and increase healthcare costs? Continued economic growth through increasing supply chain processes and logistics-induced economic activities supports the country’s vision of international collaboration and opening its foreign borders to trade goods and services. At the same time, its massive, unsustainable transportation leads to deteriorating environmental quality and healthcare infrastructure. The need for efficient logistics operations requires more greening options to sustain its activities that help to improve healthcare infrastructure globally.
The following research objectives have been set to answer the stated research questions:
  • To examine the nonlinear relationship between logistics operations and healthcare expenditures across countries.
  • To evaluate the influence of carbon-induced emissions on healthcare costs.
  • To assess the impact of carbon-induced fuel imports and economic activities on the sustainable healthcare agenda, and
  • To conduct an analysis of the predicted associations between the specified variables.
The study employed a robust least-squares regression and innovation accounting approach to evaluate the stated objectives for possible long-term policy implications.

2. Methods

The study collected data from a large cross-section of 131 countries based on the 2018 and 2020 datasets. The sample of countries used in the study is shown in Table A1 in the Appendix for ready reference. Healthcare expenditures (denoted by HEXP) as a percentage of GDP served as a response variable, whereas the logistics performance index (denoted by LPI) showing the competency and quality of logistics services with an index value ranging between low (value 1) and high (value 5) served as an explanatory variable. Moreover, the square of LPI was used to assess the nonlinear relationship with healthcare expenditures across countries. The study calculated three different types of logistics operations, including logistics-induced carbon emissions (denoted by LICARB), logistics-induced fuel imports (denoted by LIFIMP), and logistics-induced economic growth (denoted by LIEG) by means the interaction of (i) LPI and carbon emissions to obtain an estimate in metric tones per capita, (ii) LPI and fuel imports to obtain an estimate as a percentage of merchandise imports, and (iii) LPI and GDP per capita to obtain an estimate in constant 2015 US%. The data for GDP per capita were taken from 2020, while the remaining variables’ data were obtained from 2018 available data for each country used in the estimation. The data were taken from the World Bank [7] database. Table 1 shows the list of variables for ready reference.
Logistics operations mainly compromise green environmental agendas that hamper economic activity [26]. Technology innovation was critical in balancing negative environmental externalities [27] and advancing ecological sustainability [28]. Healthcare issues can be exacerbated by causing disruptions to supply chain processes [29] that need to be sustained through corporate social responsibility [30]. Supply chain operations have been widely discussed in the wake of the COVID-19 pandemic and have an essential role in supplying preventive healthcare equipment [31]. Based on the crucial findings, this study developed the following equation for empirical illustration:
ln ( H E X P ) 2008 , 131 = α 0 + α 1 ln ( L P I ) 2008 , 131 + α 2 S Q L P I 2008 , 131 + α 3 ln ( L I C A R B ) 2008 , 131 + α 4 ln ( L I F I M P ) 2008 , 131 + α 5 ln ( L I E G ) 2020 , 131 + ε t , 131
The following expected relationships between the variables are:
  • ln H E X P ) ln ( L P I ) < 0 The higher the level of healthcare logistics activities, the less harmful they are to achieve fewer health impacts and lower healthcare cost.
  • ln H E X P ) ( S Q L P I ) > 0 The doubling of the logistics operations increases healthcare costs by verifying the U-shaped relationship between them.
  • ln H E X P ) ln ( L I C A R B ) < 0 The greater the logistics-induced carbon emissions, the greater the damage to health, which increases healthcare prices.
  • ln H E X P ) ln ( L I F I M P ) < 0 The greater the logistics-induced fuel imports, the greater the healthcare costs.
  • ln H E X P ) ln ( L I E G ) < 0 The increase in logistics-induced economic growth will translate into increased healthcare expenditures.
The constant in Equation (1) is the positive integer, which implies that in the absence of the explanatory variables, healthcare expenditures are likely to increase in the current time period. This study used robust least squares (RLS) regression for parameter estimates. Before using the stated regression, the pre-requisite tests need to be performed, including leverage plots and influence statistics. The former test assesses the possible discontinuities in the regressors, while the latter suggests the number of discontinuities that arise in the given model. The RLS regression instrument showed three possible alternatives to the obtained parameter estimates, i.e.,
  • M-Estimator: Huber [32] developed the M-estimator that addresses the size of the residual that deviates from its actual size and shows an increase in size. The primary rationale is that the possible discontinuities in the response variable that arise mainly cause a greater change in the residual size, markedly different from the actual norm. Influence statistics would be helpful to detect the discontinuities in the response variable.
  • S-Estimator: Rousseeuw and Yohai [33] extended the RLS regression by correcting the structural discontinuities in the regressors that show high leverages in the data series. Hence, it is corrected accordingly.
  • MM-Estimator: Yohai [34] combined both the M-estimator and S-estimator to overcome the issue of discontinuities in the endogenous and exogenous variables and give robust parameter estimates.
After obtaining the RLS estimates, the study used an impulse response function (IRF) and variance decomposition analysis (VDA). The former test suggests the positive or negative shocks on the response variable by their explanatory factors over a time horizon. In contrast, the latter test suggests the magnitude of the influencing response variable by their regressors over time. Equation (2) shows that the innovation accounting matrix equation includes both the IRF and VDA estimates for ready reference.
V a r ( σ ( H E X P , L P I ) = V a r ( E [ σ L P I ] ) + E [ V a r ( σ L P I ) ] V a r ( E [ σ L P I ] V a r ( σ [ H E X P , L P I ) ] V a r ( σ ( H E X P , S Q L P I ) = V a r ( E [ σ S Q L P I ] ) + E [ V a r ( σ S Q L P I ) ] V a r ( E [ σ S Q L P I ] ) V a r ( σ [ H E X P , S Q L P I ) ] V a r ( σ ( H E X P , L I C A R B ) = V a r ( E [ σ L I C A R B ] ) + E [ V a r ( σ L I C A R B ) ] V a r ( E [ σ L I C A R B ] ) V a r ( σ [ H E X P , L I C A R B ) ] V a r ( σ ( H E X P , L I F I M P ) = V a r ( E [ σ L I F I M P ] ) + E [ V a r ( σ L I F I M P ) ] V a r ( E [ σ L I F I M P ] ) V a r ( σ [ H E X P , L I F I M P ) ] V a r ( σ ( H E X P , L I E G ) = V a r ( E [ σ L I E G ] ) + E [ V a r ( σ L I E G ) ] V a r ( E [ σ L I E G ] ) V a r ( σ [ H E X P , L I E G ) ]
Equation (2) shows the variation in the healthcare model, accompanied by the different regressors used in the study, including LPI, SQLPI, LICARB, LIFIMP, and LIEG. The expected mean value of the stated regressors tend to influence the outcome variable, which would likely to show the variance of the variables over time.
Equation (3) shows the mean sequence error (MSE) term for the list of explanatory variables, i.e.,
M S E μ = E L P I [ M S E μ ( L P I ) ] M S E μ = E S Q L P I [ M S E μ ( S Q L P I ) ] M S E μ = E L I C A R B [ M S E μ ( L I C A R B ) ] M S E μ = E L I F I M P [ M S E μ ( L I F I M P ) ] M S E μ = E L I E G [ M S E μ ( L I E G ) ]
The MSE influenced the expected value of the studied variables that influenced the outcome variable over a time horizon.

3. Results

Table 2 shows the descriptive statistics of the variables. The mean value of healthcare expenditures is 6.563% of GDP, with a maximum value of 16.687% and a minimum value of 1.936%. The standard deviation value is 2.586% of GDP. The positively skewed distribution and high kurtosis value of the stated variable are also observed. The LPI value falls between 4.310 and 1.930, with a range of 2.380. The mean value of logistics-induced carbon emissions is 15.686 metric tonnes per capita, with a maximum value of 110.861 metric tonnes per capita. Logistics-induced fuel imports and economic growth have a mean value of 41.504% of merchandise exports and USD 54,686.07, respectively.
Table 3 shows the correlation matrix and demonstrates that LPI and its square value positively correlate with healthcare expenditures, implying that LPI factors increase healthcare costs because of their unsustainable supply chain process. Logistics-induced carbon emissions and economic growth were positively correlated with healthcare costs. Both factors adversely affected the healthcare sustainability plan that needs to be corrected through the efficient use of green fuel in operations. There is a positive correlation between logistics-induced economic growth and carbon emissions, implying that continued economic growth causes greater carbon emissions in the supply chain process.
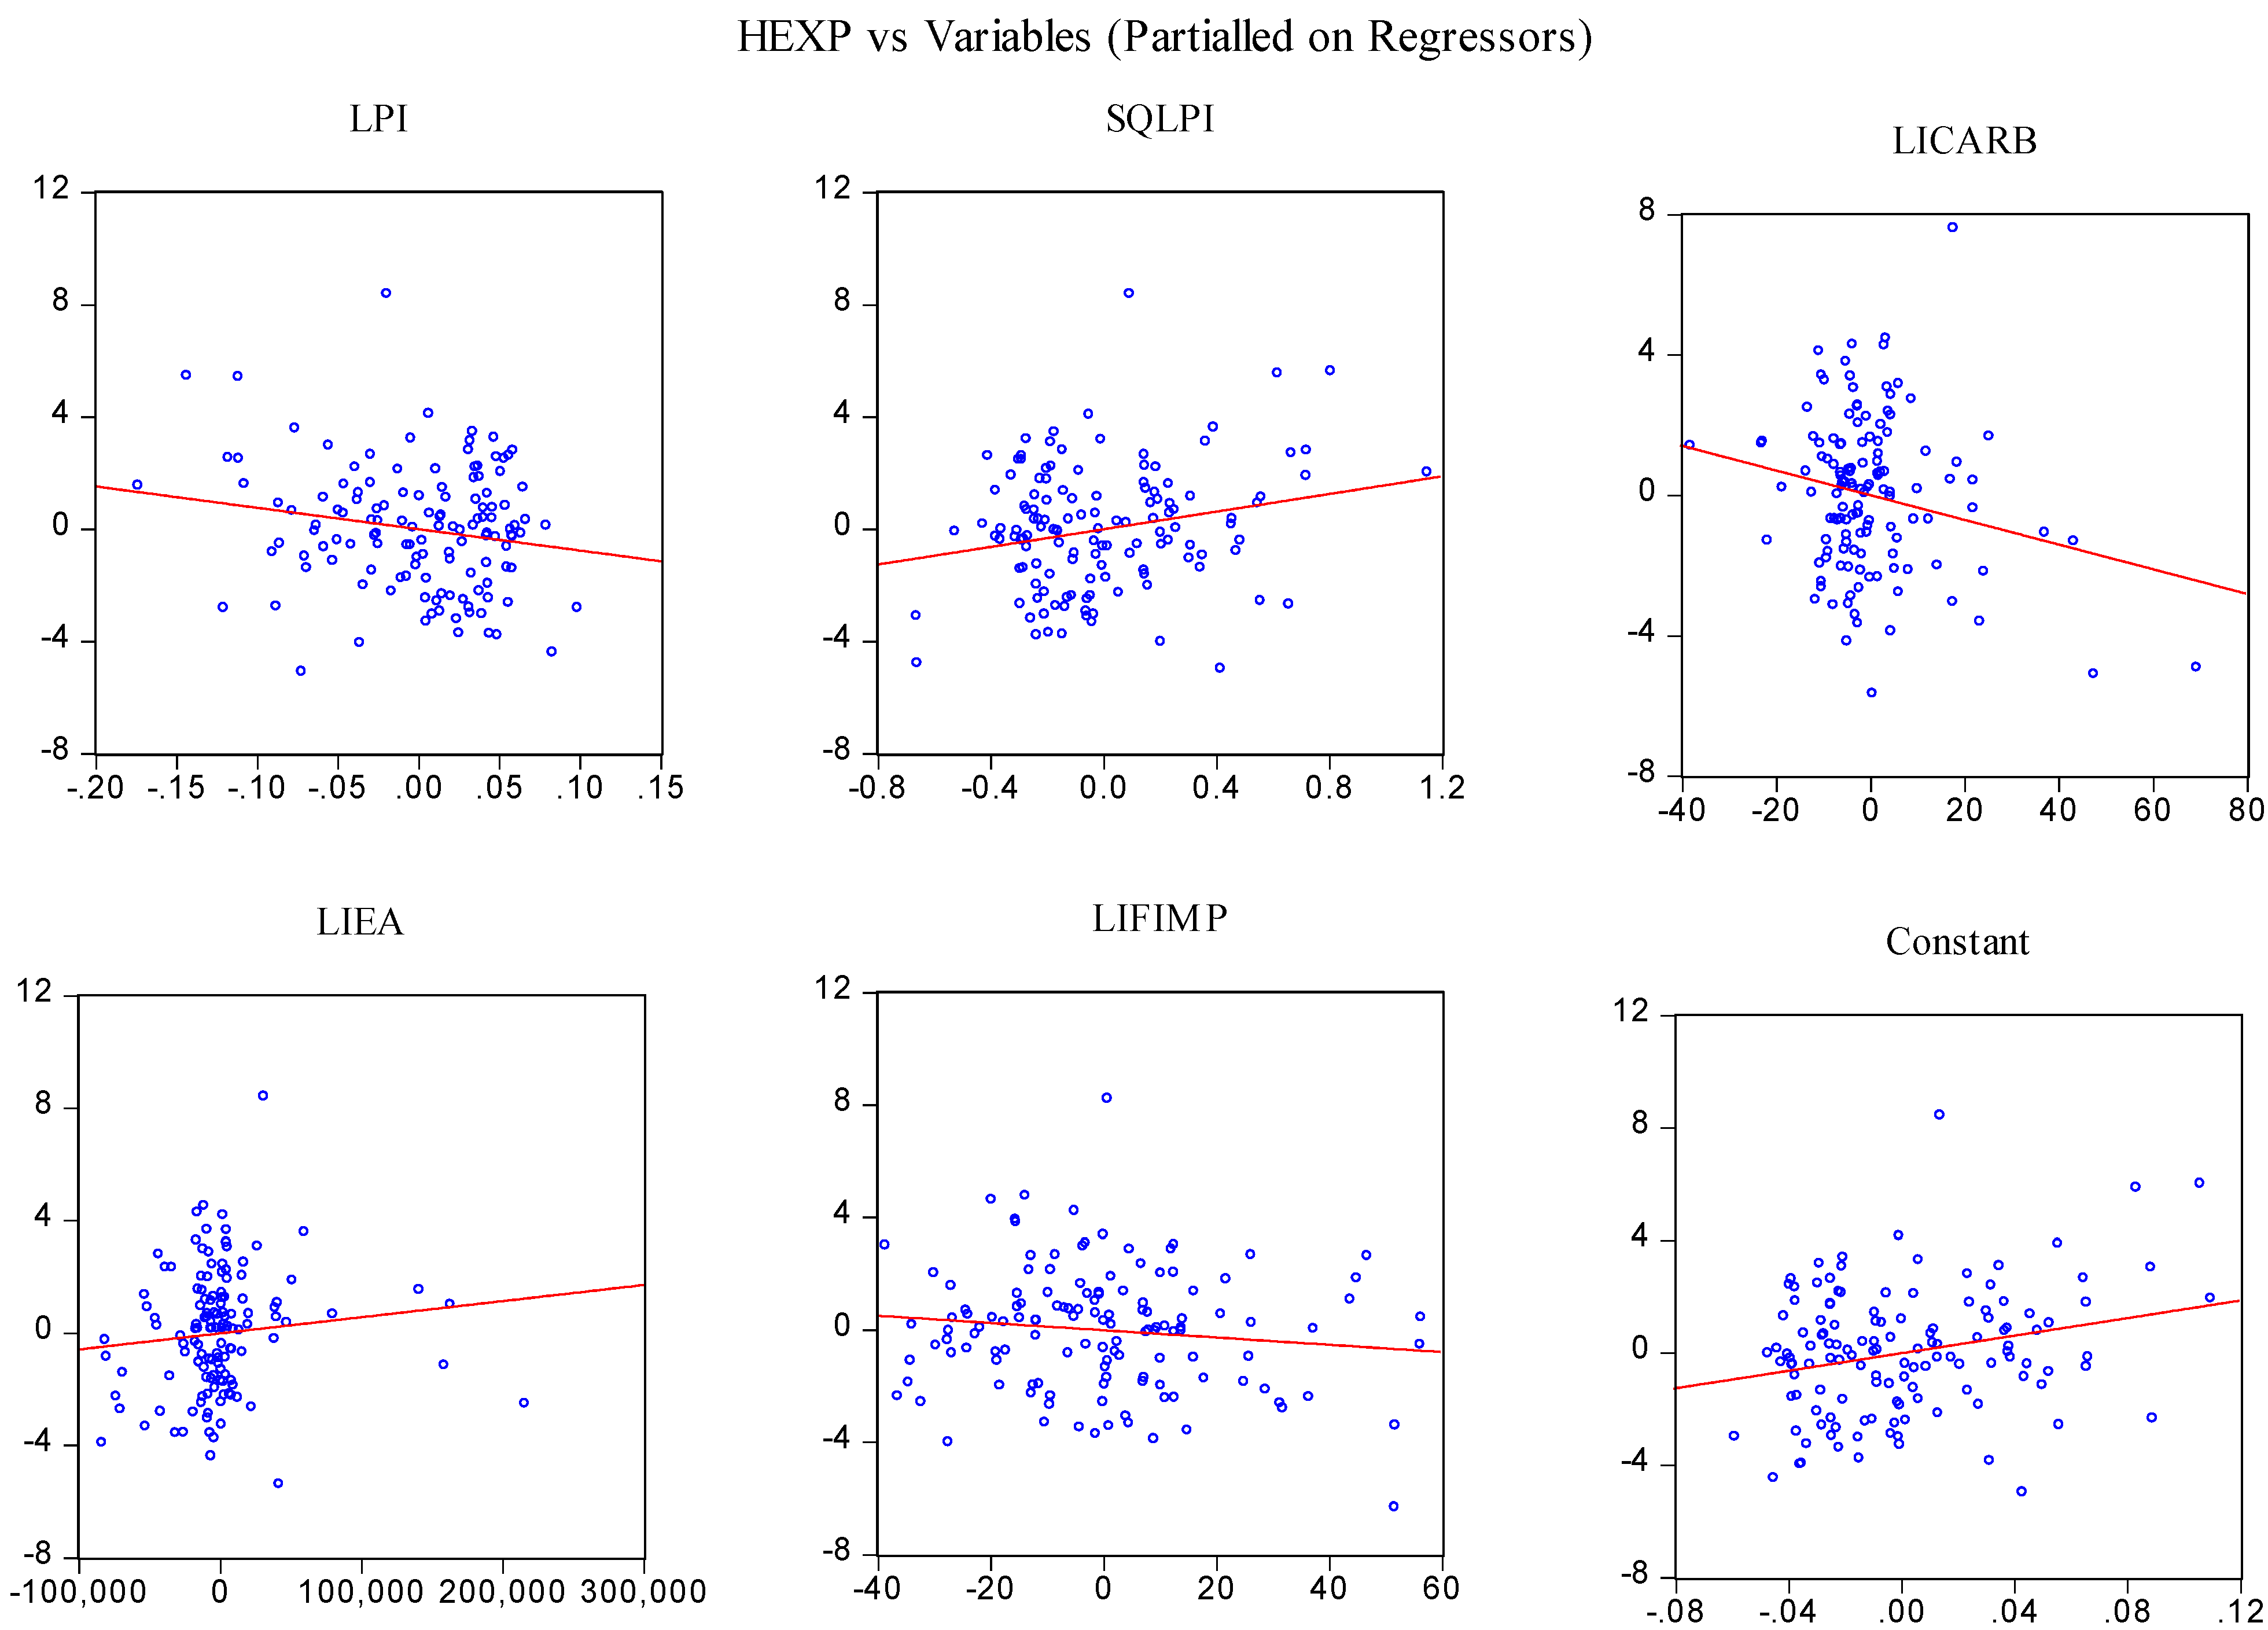
Figure 2 shows the leverage plots of the exogenous variables concerning their regression. It shows that in most cases, the cross-sectional variables have a disjointed impact on the response variable because of the different structural shocks in their economies. The high dispersion of the variables against the dependent variable shows different discontinuities in the variable series. Hence, it is essential to evaluate the number of outliers in the given model.
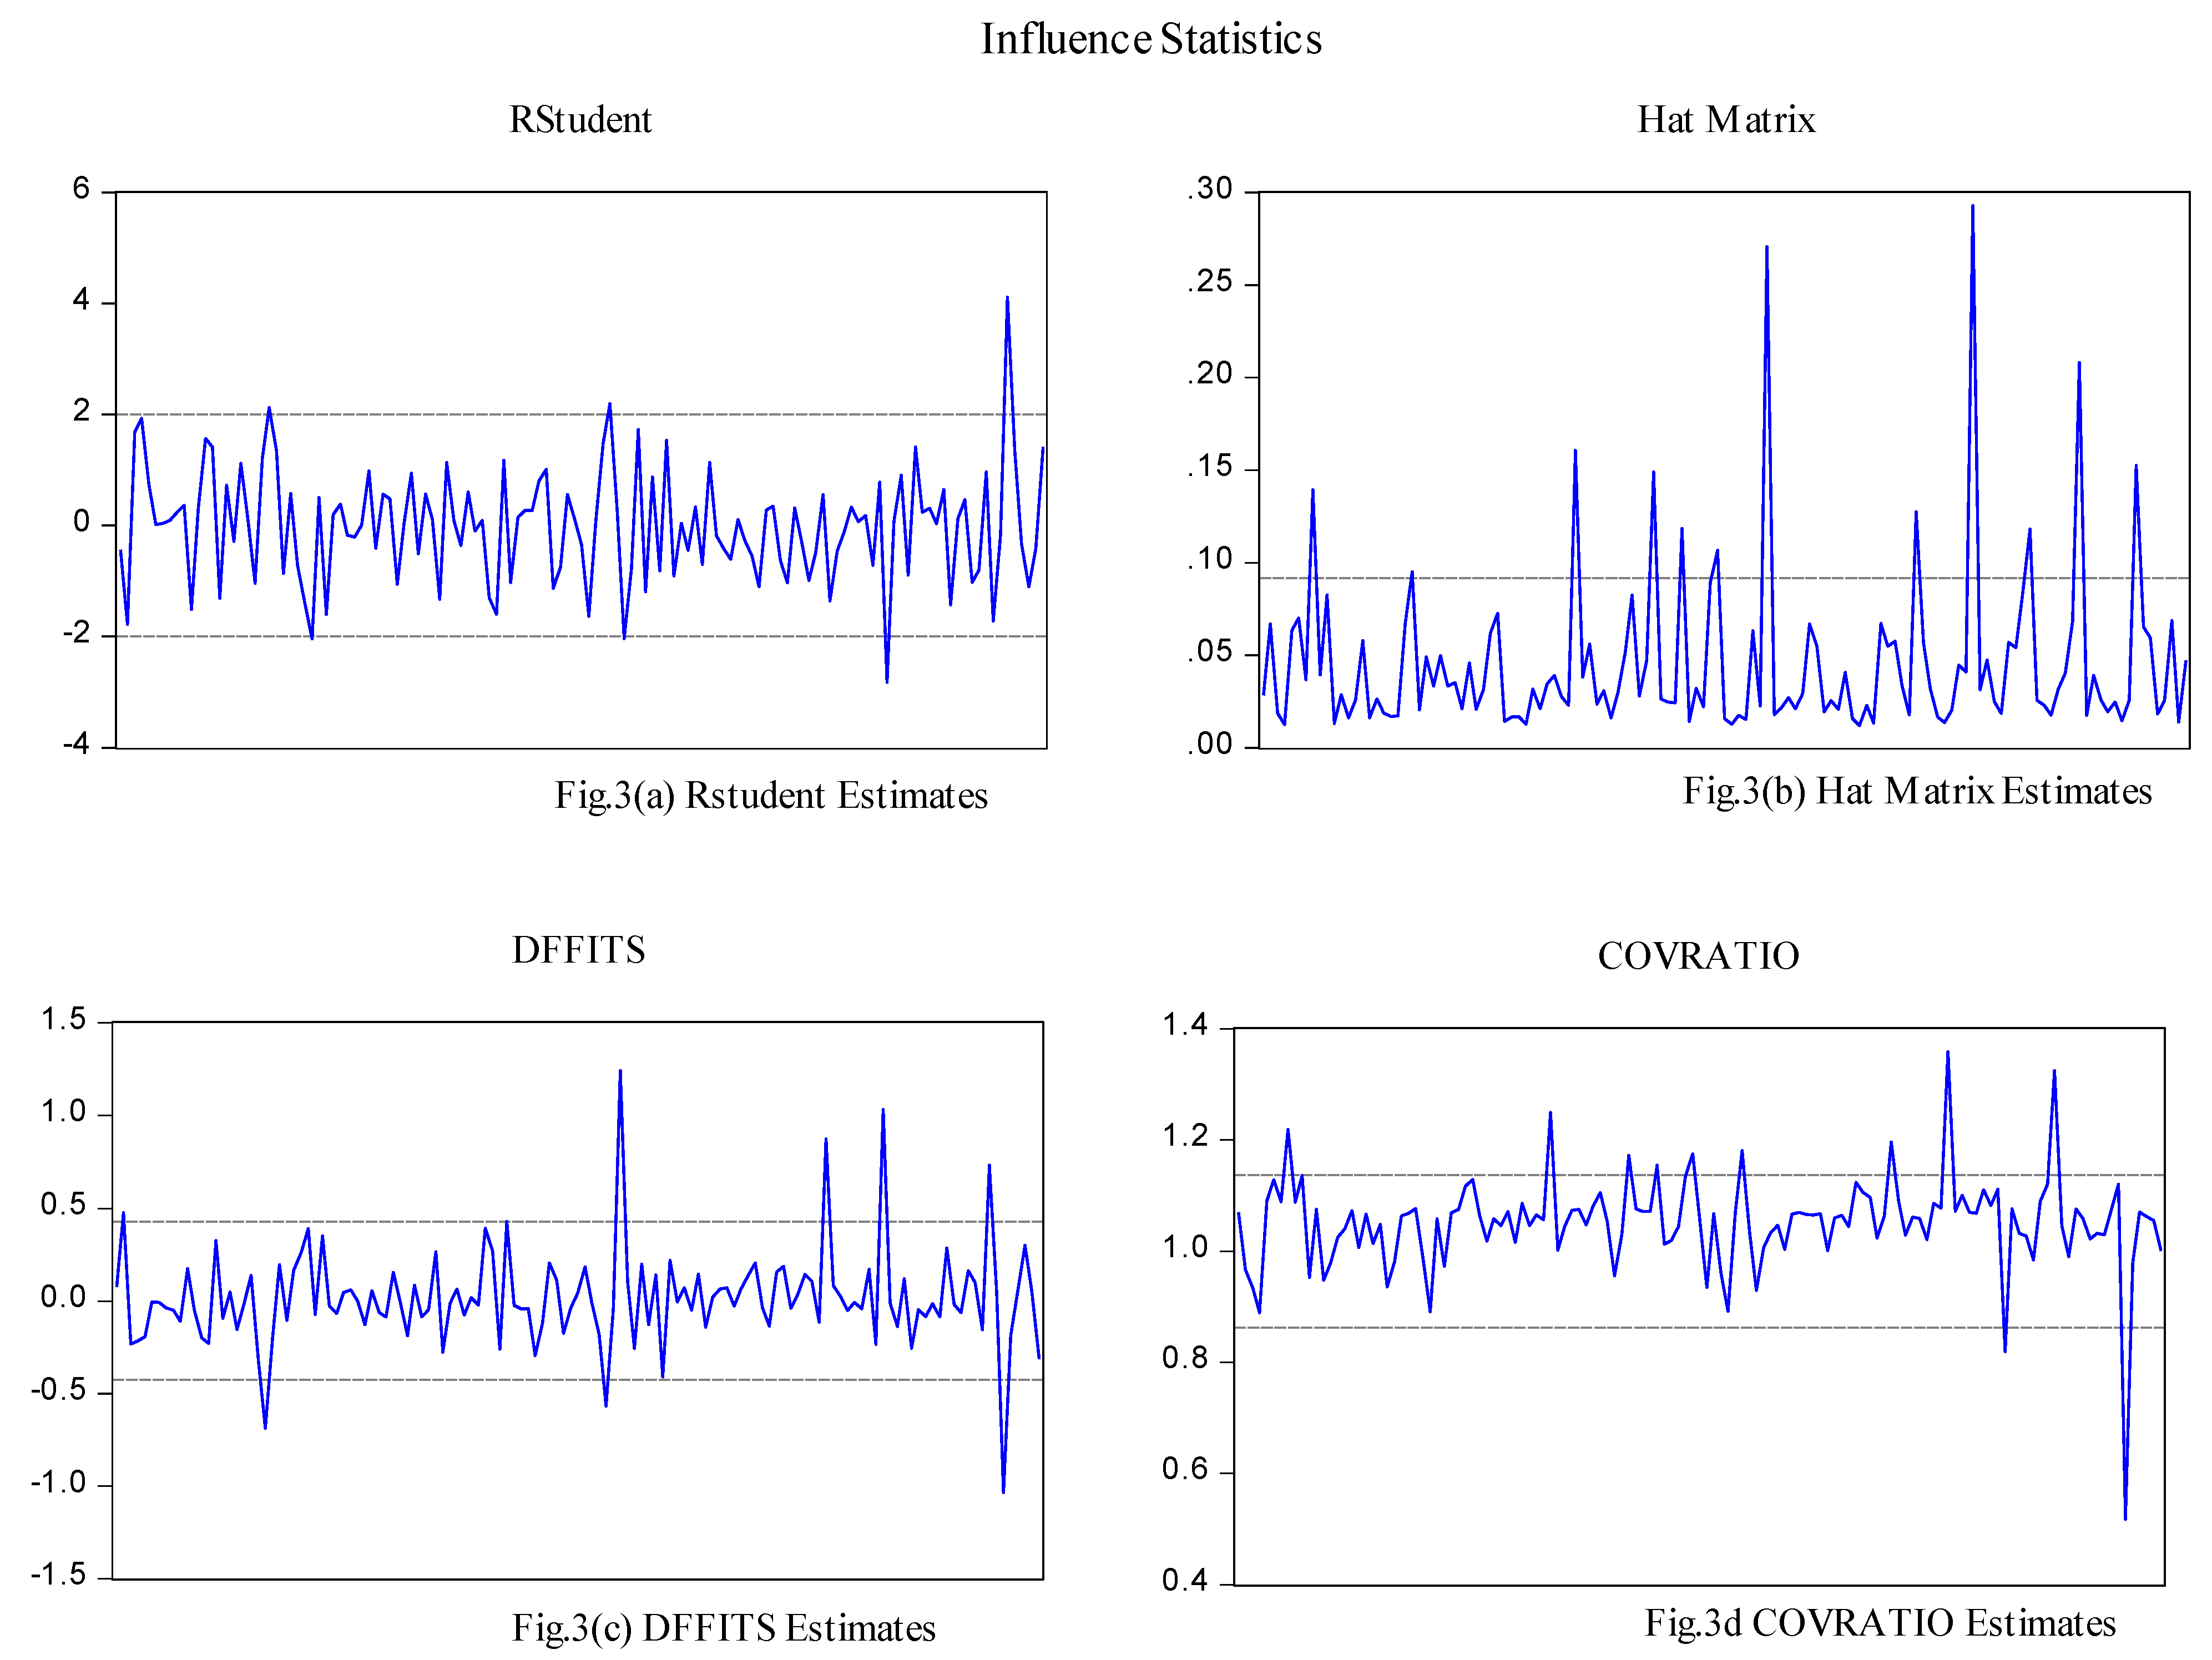
Figure 3 shows the influence statistics that help to assess the presence of possible outliers in the given model. R Student’s statistics show that two outliers exist in the model. The Hat matrix shows eleven outliers, while DFFITS shows seven possible outliers, and COVRATIO shows nine outliers in the given model. Hence, it is evident that the given cross-section is heterogeneous and has a distinct structural transformation across the sample.
Table 4 shows the RLS regression estimates and found that LPI harms healthcare expenditures. Its square term shows a positive effect, confirming the U-shaped relationship. Healthcare expenditures decrease along with an increase in LPI activities initially. In contrast, at later stages of economic growth, an increase in LPI activities increases healthcare costs and eventually increases healthcare expenditures across countries. The more elastic relationship initially found between LPI and healthcare expenditures turned into a less elastic relationship while doubling logistics activities. Hence, it is vital to conduct a more critical analysis of the stated variables in the presence of carbon emissions, fuel imports, and economic growth.
The results further show the positive relationship between logistics-induced fuel imports and healthcare expenditures, which implies that the greater the logistics-induced fuel imports, the greater the increase in healthcare costs, which confirms the unsustainable supply chain process across countries. The elasticity estimates show that if there is a 1% increase in logistics-induced fuel imports, health expenditures increase by 0.087%. Furthermore, the positive relationship between logistics-induced economic growth and healthcare expenditures implies that logistics-induced economic activities hamper the healthcare sustainability agenda across countries. The elasticity estimates show that if there is a 1% increase in the logistics-induced economic growth, health costs increase by 0.147%. The stated result estimates are higher than the logistics-induced fuel imports, indicating that continued economic activities are the main cause of an increase in logistics-induced environmental degradation across countries.
The diagnostic estimates confirmed that the model is free from autocorrelation and heteroskedasticity issues. Further, the Ramsey RESET test confirmed that the model is functionally stable over time. 
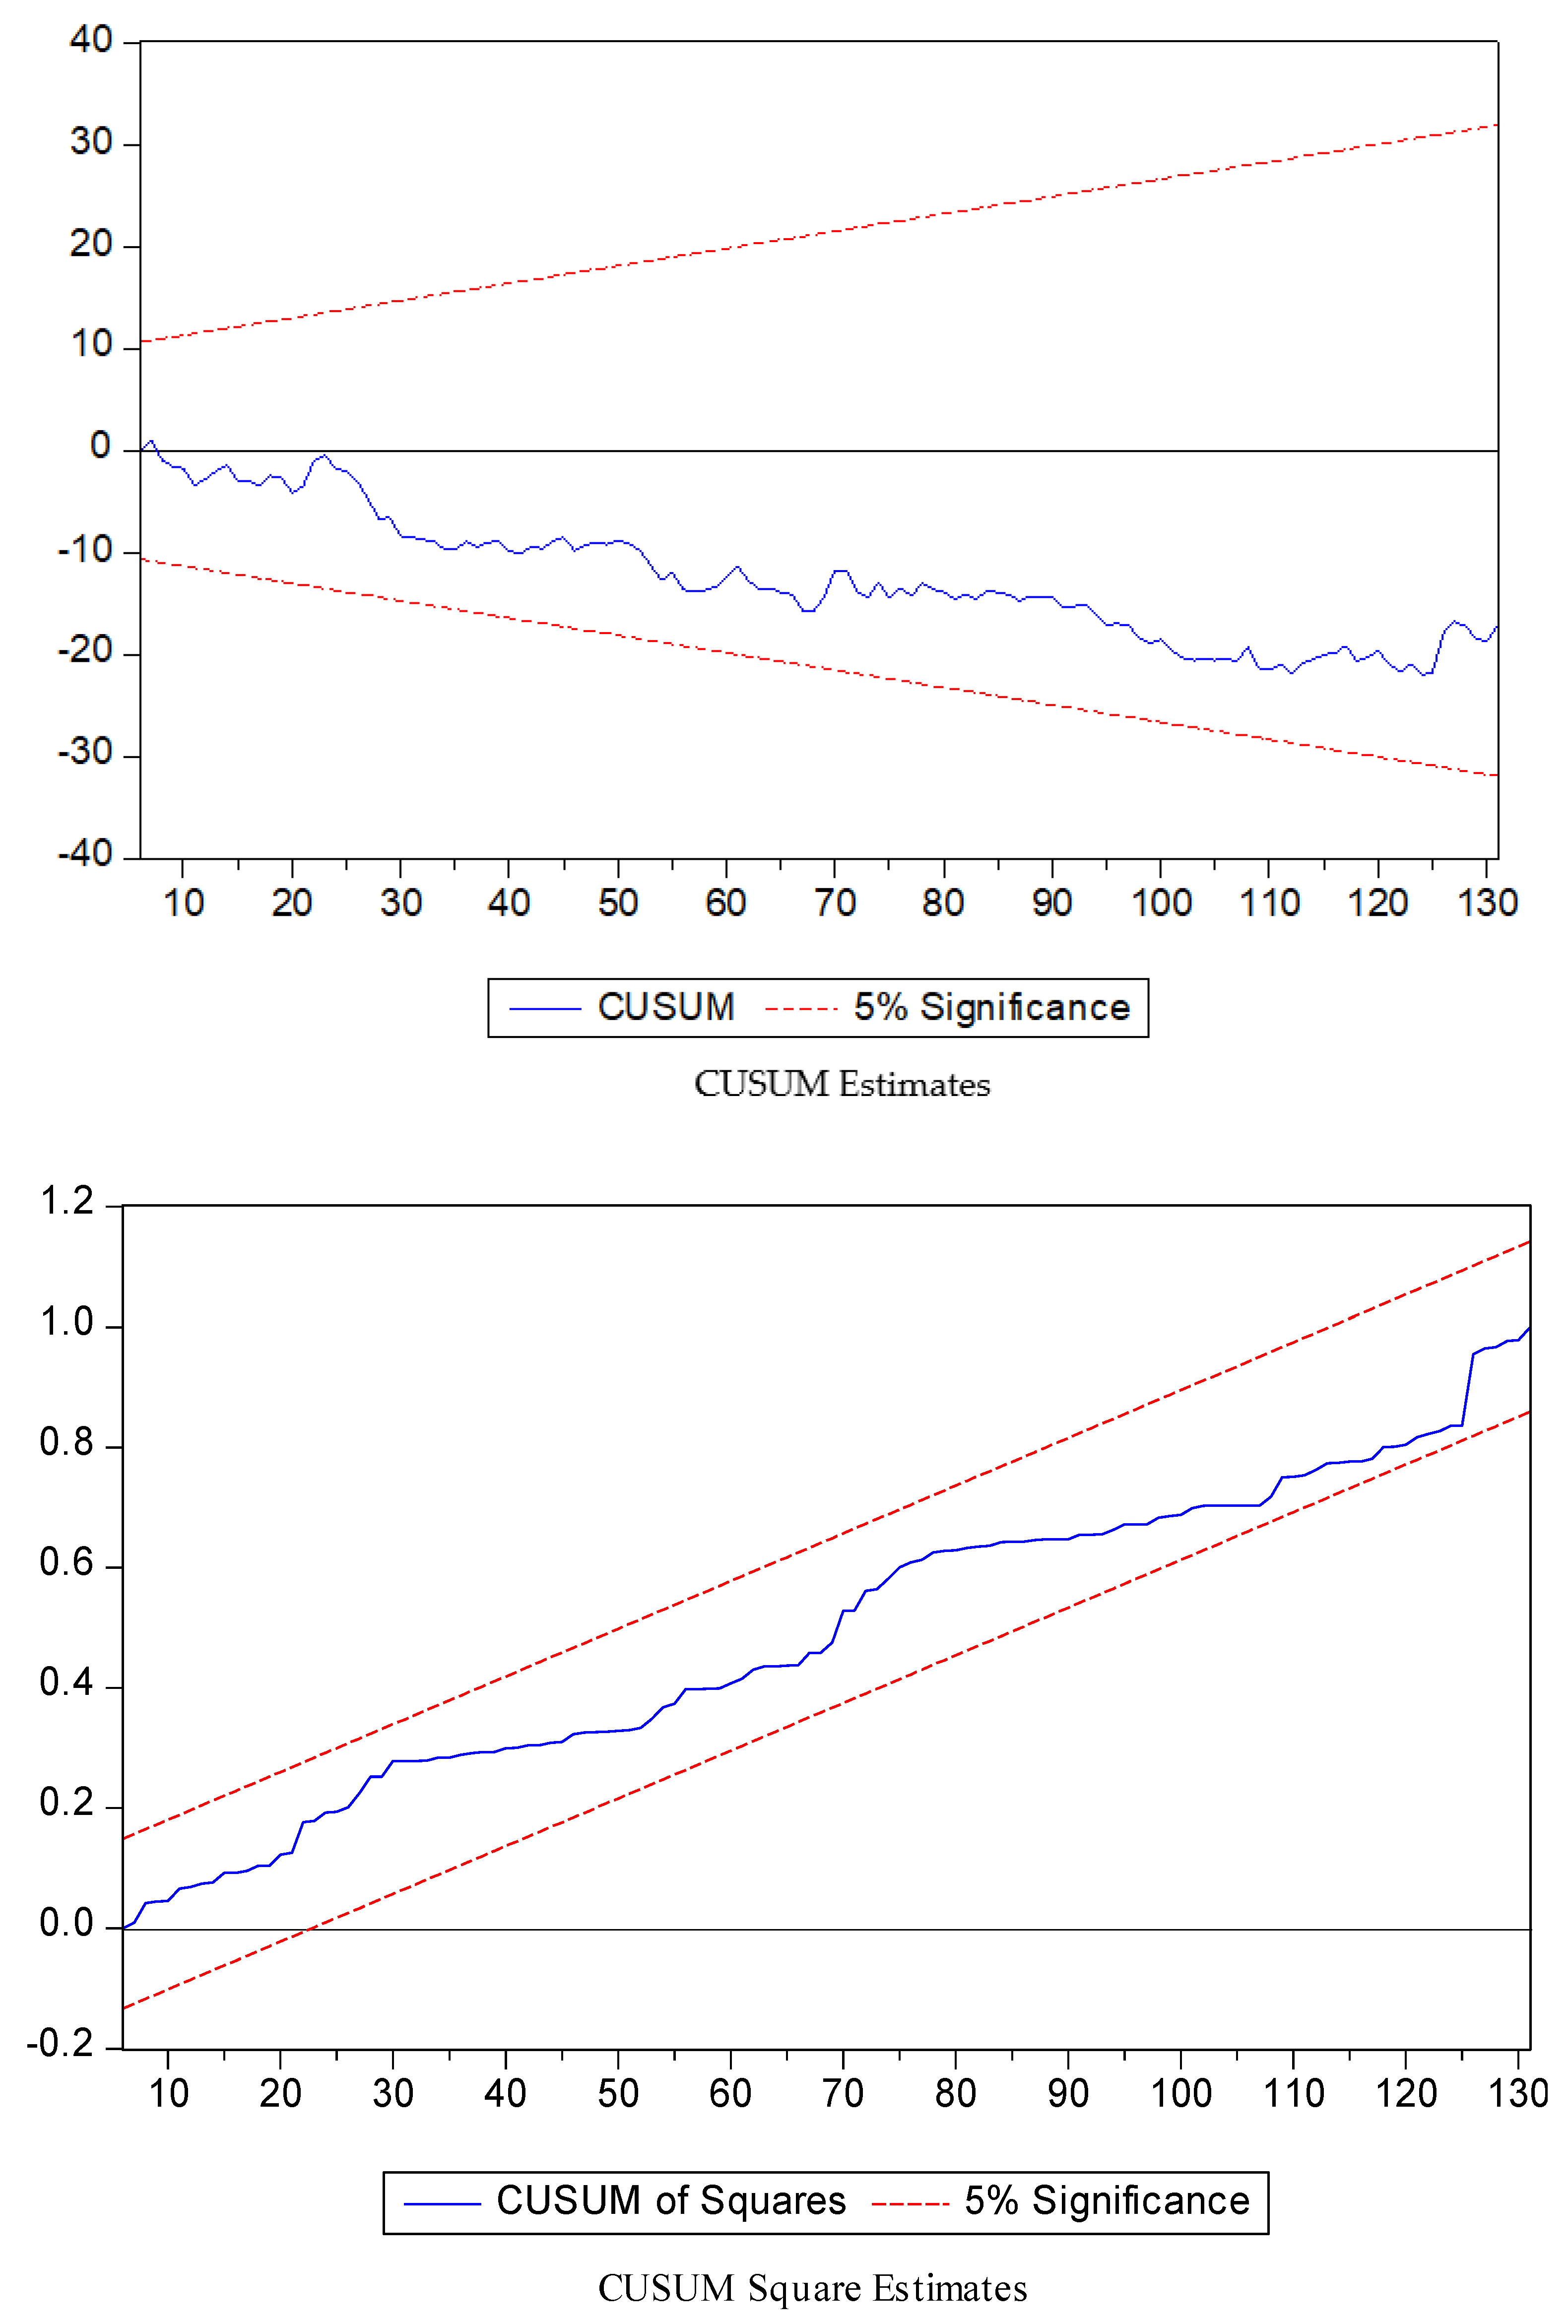
Figure 4 shows the CUSUM and CUSUM square statistics and confirms that the model estimates are significant at a 5% level of confidence, and the model is empirically sound.
Table 5 shows the IRF estimates that suggest that logistics-induced fuel imports would likely have a negative impact on the healthcare sustainability agenda that is likely to increase healthcare costs because of unsustainable fuels in the supply chain process. The healthcare supply chain and continued economic growth would likely reduce healthcare expenditures in the next month.
Table 6 shows the VDA estimates, suggesting that its own shocks would likely influence healthcare expenditures in the coming months. The LPI would likely exert greater variance error shocks on healthcare expenditures with a magnitude of 1.912% over a time horizon. Logistics-induced fuel imports would exert a variance shock of 0.808% on healthcare costs, while the least influenced would be logistics-induced economic growth, which has a variance of 0.086% over time.

4. Discussion

The RLS regression estimates suggest the following results that are in line with the earlier studies, i.e.,
  • Sound logistics operations improve a country’s economic growth via transportation by operating goods and services from one place to another [35]. Healthcare logistics supply chain activities minimize healthcare uncertainties and help to build healthcare infrastructure to avoid any contagious diseases [36]. During the COVID-19 pandemic, the logistics activities were limited, adversely affecting the healthcare sustainability agenda. With relaxing lockdown situations, the healthcare logistics regarding protective equipment became timely and settled down during the crisis [37,38]. Efficient logistics policies remain necessary to improve the healthcare sustainability agenda worldwide [39,40].
  • The transportation sector is considered responsible for increasing carbon emissions due to non-renewable fuels in logistics operations [41]. Logistics-induced carbon emissions are critical factors that sabotage the green supply chain process [42]. The massive trafficking of goods requires more energy to load and unload the commodities, increasing environmental costs [43]. Healthcare costs increase due to massive unsustainable transactions of goods from one place to another [44]. Hence, it is desirable to use green energy sources in logistics operations that are less sensitive to air pollution. This would eventually be helpful to improve healthcare infrastructure [45].
  • Massive fuel imports are another challenge for the green development agenda, increasing GHG emissions and climatic vulnerability [46]. The environmental costs associated with high imports of non-renewable fuels across countries are also linked to health impacts [47]. Logistics-induced fuel imports deteriorate environmental quality, linked to increased healthcare expenditures globally [48]. The need to replace fuel imports with cleaner technology goods imports to improve the global healthcare agenda is clear [49].
  • Continued economic growth has a different impact on the sustainable healthcare agenda. On the one hand, it increases the healthcare budget to minimize healthcare uncertainties by allocating increased healthcare funds in the national bill [50]. On the other hand, economies can sustainably pursue a green healthcare agenda through cleaner technology spillovers [51]. Logistics-induced economic growth has further disjointed effects on healthcare costs. On the one hand, it reduces healthcare expenditures through a continuous supply of healthcare protective instruments [52]. On the other hand, it damages the healthcare sustainability agenda due to a massive increase in carbon and fuel imports worldwide [53]. The need for sustained economic policies is imperative to improve the green supply chain process that helps to reduce environmental costs and improve the healthcare agenda across countries [54].
  • The results of the study are similar to those of Khan et al. [55], who argued that unsustainable logistics operations increase healthcare costs, because of the greater use of fossil fuels in the supply chain process, increasing carbon emissions across SAARC countries. The current study results are much more comprehensive by using a wider cross-section of countries.
Sustained efforts are needed to streamline logistics activities to reduce negative environmental externalities that arise from using non-renewable fuels to transport goods. These are limited by using green energy sources in supply chain processes, cleaner technology imports, and sustainable economic activities worldwide.

5. Conclusions and Policy Implications

The sustainable healthcare agenda is affected mainly in the wake of the COVID-19 pandemic due to the disruption of healthcare logistics regarding the supply of equipment. Furthermore, the supply chain process is compromised by using non-renewable fuels to transport goods from one place to another, which obstructs the green developmental agenda. This study analyzes the role of logistics operations in healthcare in a cross-section of 131 countries and found that logistics-induced carbon emissions, fuel imports, and economic growth exacerbated negative healthcare externalities, leading to increased healthcare prices across countries. Furthermore, the results confirm the U-shaped relationship between logistics activities and health impacts. This study concludes that greening the supply chain process would be helpful to improve vehicle performance, lowering fuel imports and carbon damage on the way forward towards healthcare sustainability. The following key recommendations are suggested to policymakers to devise sustainable logistics policies to improve healthcare infrastructure worldwide:
  • The increasing cost of environmental damage is directly linked to the healthcare infrastructure. The transportation sector is considered one of the crucial sectors with a substantial share of carbon emissions, increasing GHG emissions. The shipment of goods from one place to another requires more significant energy sources to run the supply chain process. Carbon dioxide is mainly released during the transportation of goods because of non-renewable fuels. Inbound and outbound logistics operations adversely affected the healthcare sustainability agenda, and this effect needs to be mitigated through green energy sources used in logistics operations worldwide. Furthermore, different environmental certifications can be issued to those logistics firms that adopt cleaner technological initiatives, renewable energy sources in transportation, and eco-friendly vehicle transportation.
  • Fuel imports, including crude oil and petroleum products, serve as an energy security issue, since most countries import fuel from other countries through different modes of transportation. Logistics transportation, financial, and handling risks are mainly associated with fuel imports that need to be minimized through smart logistics operations, including supportive insurance programs, green energy used in transportation, and shortening route length. Importing fuel threatens the sustainable healthcare agenda, which remains a crucial debate in the green supply chain process. Sustainable logistics operations handle easily imported fuels while reducing healthcare costs that are exacerbated due to non-renewable fuels that cause mortalities and morbidities worldwide.
  • Continued economic growth supports attaining a sustainable healthcare agenda by minimizing carbon emissions and reducing fuel imports. Furthermore, efficient logistics activities help to reduce transportation emissions, improve vehicle conditions, and improve the goods shipment process, helping to sustain the country’s economic growth. The following sub-policies help to improve logistics activities and move forward toward a green supply chain process, i.e.,
    (a)
    Adopting efficient fuel technologies in logistics operations would achieve dual sustainable objectives, by reducing carbon emissions and improving healthcare infrastructure worldwide.
    (b)
    Industrial sustainability mainly helps to improve green supply chain processes that mitigate vehicle emissions by moving towards alternative transportation sources.
    (c)
    Financial liberalization policies strain economic activities due to massive inbound FDI, leading to the pollution haven hypothesis. Furthermore, it strains the healthcare agenda, increasing healthcare prices across countries. Green financing policies and logistics efficiency policies would likely reduce the overburden of healthcare resources.
    (d)
    Advancement in cleaner technologies and shortening shipment routes help to minimize carbon emissions.
    (e)
    Sustainable insurance coverage is the optimal solution to privatizing the healthcare system and logistics operations to improve air quality levels and the healthcare agenda.
Based on the crucial findings and their possible policy recommendations, the need to design efficient logistics policies that provide sustainable supply chain processes to mitigate carbon emissions and improve standard quality of life worldwide is evident.

Author Contributions

Conceptualization, U.A., M.K.A. and K.Z.; methodology, U.A., K.Z., M.K.A., W.H., H.S. and A.R.A.A.; software, K.Z.; validation, A.R.A.A., M.K.J. and K.S.; formal analysis, U.A., K.Z., M.K.A., W.H., M.K.J. and K.S.; investigation, H.S. and A.R.A.A.; resources, M.K.J. and K.S.; data curation, K.S.; writing—original draft preparation, U.A., K.Z., M.K.A., W.H., H.S. and A.R.A.A.; writing—review and editing, U.A., K.Z., M.K.J. and K.S.; visualization, K.S.; supervision, U.A. and K.Z.; project administration, M.K.A., W.H., H.S. and A.R.A.A.; funding acquisition, U.A. All authors have read and agreed to the published version of the manuscript.

Funding

This research received no external funding.

Institutional Review Board Statement

Not applicable.

Informed Consent Statement

Not applicable.

Data Availability Statement

The data are freely available at World Development Indicators published by the World Bank (2021) at https://databank.worldbank.org/source/world-development-indicators (accessed on 15 January 2022).

Conflicts of Interest

The authors declare no conflict of interest.

Appendix A

Table A1. Sample of countries.
AlbaniaCanadaFinlandJordanMexicoQatarTurkey
AngolaCentral African RepublicFranceKazakhstanMoldovaRomaniaUganda
ArgentinaChileGambia, TheKenyaMongoliaRussian FederationUkraine
ArmeniaChinaGeorgiaKorea, Rep.MontenegroRwandaUnited Arab Emirates
AustraliaColombiaGermanyKuwaitMoroccoSao Tome and PrincipeUnited Kingdom
AustriaComorosGhanaKyrgyz RepublicMyanmarSaudi ArabiaUnited States
Bahamas, TheCongo, Dem. Rep.GreeceLao PDRNepalSenegalUruguay
BahrainCongo, Rep.GuatemalaLatviaNetherlandsSierra LeoneUzbekistan
BelarusCosta RicaGuyanaLebanonNew ZealandSingaporeVietnam
BelgiumCote d’IvoireHondurasLesothoNigerSlovak RepublicZambia
BeninCroatiaHungaryLithuaniaNigeriaSloveniaZimbabwe
BoliviaCyprusIcelandLuxembourgNorth MacedoniaSolomon IslandsTotal: 131 countries
Bosnia and HerzegovinaCzech RepublicIndiaMadagascarNorwaySouth Africa
BrazilDenmarkIndonesiaMalawiOmanSpain
Brunei DarussalamDominican RepublicIran, Islamic Rep.MalaysiaPakistanSweden
BulgariaEcuadorIrelandMaldivesParaguaySwitzerland
Burkina FasoEgypt, Arab Rep.IsraelMaliPeruTajikistan
BurundiEl SalvadorItalyMaltaPhilippinesThailand
CambodiaEstoniaJamaicaMauritaniaPolandTogo
CameroonFijiJapanMauritiusPortugalTunisia

References

  1. Gani, A. The logistics performance effect in international trade. Asian J. Shipp. Logist. 2017, 33, 279–288. [Google Scholar] [CrossRef]
  2. Çelebi, D. The role of logistics performance in promoting trade. Marit. Econ. Logist. 2019, 21, 307–323. [Google Scholar] [CrossRef]
  3. Begum, S.; Ashfaq, M.; Xia, E.; Awan, U. Does green transformational leadership lead to green innovation? The role of green thinking and creative process engagement. Bus. Strat. Environ. 2022, 31, 580–597. [Google Scholar] [CrossRef]
  4. Jia, J.; Anser, M.K.; Peng, M.Y.P.; Nassani, A.A.; Haffar, M.; Zaman, K. Economic and ecological complexity in the wake of COVID-19 pandemic: Evidence from 60 countries. Econ. Res.-Ekon. Istraživanja 2021. [Google Scholar] [CrossRef]
  5. Mahroof, K.; Omar, A.; Rana, N.P.; Sivarajah, U.; Weerakkody, V. Drone as a Service (DaaS) in promoting cleaner agricultural production and Circular Economy for ethical Sustainable Supply Chain development. J. Clean. Prod. 2021, 287, 125522. [Google Scholar] [CrossRef]
  6. Alhawari, O.; Awan, U.; Bhutta, M.K.S.; Ülkü, M.A. Insights from circular economy literature: A review of extant definitions and unravelling paths to future research. Sustainability 2021, 13, 859. [Google Scholar] [CrossRef]
  7. World Bank. World Development Indicators; World Bank: Washington, DC, USA, 2021. [Google Scholar]
  8. Khan, S.A.R.; Godil, D.I.; Yu, Z.; Abbas, F.; Shamim, M.A. Adoption of renewable energy sources, low-carbon initiatives, and advanced logistical infrastructure—an step toward integrated global progress. Sustain. Dev. 2022, 30, 275–288. [Google Scholar] [CrossRef]
  9. Sasmaz, M.U.; Karamıklı, A.; Akkucuk, U. The relationship between renewable energy use and health expenditures in EU countries. Eur. J. Health Econ. 2021, 22, 1129–1139. [Google Scholar] [CrossRef]
  10. Anser, M.K.; Khan, M.A.; Nassani, A.A.; Abro MM, Q.; Zaman, K.; Kabbani, A. Does COVID-19 pandemic disrupt sustainable supply chain process? Covering some new global facts. Env. Sci. Pollut. Res. 2021, 28, 59792–59804. [Google Scholar] [CrossRef]
  11. Li, X.; Sohail, S.; Majeed, M.T.; Ahmad, W. Green logistics, economic growth, and environmental quality: Evidence from one belt and road initiative economies. Environ. Sci. Pollut. Res. 2021, 28, 30664–30674. [Google Scholar] [CrossRef]
  12. Li, X.; Ouyang, Z.; Zhang, Q.; Shang, W.L.; Huang, L.; Wu, Y.; Gao, Y. Evaluating food supply chain emissions from Japanese household consumption. Appl. Energy 2022, 306, 118080. [Google Scholar] [CrossRef]
  13. Paschalidou, A.K.; Petrou, I.; Fytianos, G.; Kassomenos, P. Anatomy of the atmospheric emissions from the transport sector in Greece: Trends and challenges. Environ. Sci. Pollut. Res. 2022. [Google Scholar] [CrossRef] [PubMed]
  14. Guo, X.; Wang, D. Analysis of the spatial relevance and influencing factors of carbon emissions in the logistics industry from China. Environ. Sci. Pollut. Res. 2022, 29, 2672–2684. [Google Scholar] [CrossRef] [PubMed]
  15. Bhargava, A.; Bhargava, D.; Kumar, P.N.; Sajja, G.S.; Ray, S. Industrial IoT and AI implementation in vehicular logistics and supply chain management for vehicle mediated transportation systems. Int. J. Syst. Assur. Eng. Manag. 2022. [Google Scholar] [CrossRef]
  16. Zhao, C.; Wang, K.; Dong, X.; Dong, K. Is smart transportation associated with reduced carbon emissions? The case of China. Energy Econ. 2022, 105, 105715. [Google Scholar] [CrossRef]
  17. Larson, P.D. Relationships between logistics performance and aspects of sustainability: A cross-country analysis. Sustainability 2021, 13, 623. [Google Scholar] [CrossRef]
  18. Awan, U. Impact of social supply chain practices on social sustainability performance in manufacturing firms. Int. J. Innov. Sustain. Dev. 2019, 13, 198–219. [Google Scholar] [CrossRef]
  19. Dong, B.; Ikonnikova, I.; Rogulin, R.; Sakulyeva, T.; Mikhaylov, A. Environmental-economic approach to optimization of transport communication in megacities. J. Environ. Sci. Health Part A 2021, 56, 660–666. [Google Scholar] [CrossRef]
  20. Anser, M.; Khan, M.; Awan, U.; Batool, R.; Zaman, K.; Imran, M.; Sasmoko; Indrianti, Y.; Khan, A.; Bakar, Z. The role of technological innovation in a dynamic model of the environmental supply chain curve: Evidence from a panel of 102 countries. Processes 2020, 8, 1033. [Google Scholar] [CrossRef]
  21. Ikram, M.; Sroufe, R.; Awan, U.; Abid, N. Enabling Progress in Developing Economies: A Novel Hybrid Decision-Making Model for Green Technology Planning. Sustainability 2021, 14, 258. [Google Scholar] [CrossRef]
  22. Khan, S.A.R.; Zhang, Y.; Kumar, A.; Zavadskas, E.; Streimikiene, D. Measuring the impact of renewable energy, public health expenditure, logistics, and environmental performance on sustainable economic growth. Sustain. Dev. 2020, 28, 833–843. [Google Scholar] [CrossRef]
  23. Khan, R.; Awan, U.; Zaman, K.; Nassani, A.A.; Haffar, M.; Abro, M.M.Q. Assessing Hybrid Solar-Wind Potential for Industrial Decarbonization Strategies: Global Shift to Green Development. Energies 2021, 14, 7620. [Google Scholar] [CrossRef]
  24. Awan, U.; Sroufe, R.; Shahbaz, M. Industry 4.0 and the circular economy: A literature review and recommendations for future research. Bus. Strat. Environ. 2021, 30, 2038–2060. [Google Scholar] [CrossRef]
  25. Gaur, A.; Gurjar, S.K.; Chaudhary, S. Circular system of resource recovery and reverse logistics approach: Key to zero waste and zero landfill. In Advanced Organic Waste Management; Elsevier: Amsterdam, The Netherlands, 2022; pp. 365–381. [Google Scholar]
  26. Li, J.; Anser, M.K.; Tabash, M.I.; Nassani, A.A.; Haffar, M.; Zaman, K. Technology-and logistics-induced carbon emissions obstructing the Green supply chain management agenda: Evidence from 101 countries. Int. J. Logist. Res. Appl. 2021. [Google Scholar] [CrossRef]
  27. Magazzino, C.; Alola, A.A.; Schneider, N. The trilemma of innovation, logistics performance, and environmental quality in 25 topmost logistics countries: A quantile regression evidence. J. Clean. Prod. 2021, 322, 129050. [Google Scholar] [CrossRef]
  28. Suki, N.M.; Suki, N.M.; Sharif, A.; Afshan, S. The role of logistics performance for sustainable development in top Asian countries: Evidence from advance panel estimations. Sustain. Dev. 2021, 29, 595–606. [Google Scholar] [CrossRef]
  29. Sasmoko Lodhi, M.S.; Aziz, A.R.A.; Bandar, N.F.A.; Embong, R.; Jabor, M.K.; Anis, S.N.M.; Zaman, K. Healthcare preventive measures, logistics challenges and corporate social responsibility during the COVID-19 pandemic: Break the ice. Foresight 2021. [Google Scholar] [CrossRef]
  30. Anser, M.K.; Yousaf, S.U.; Hyder, S.; Nassani, A.A.; Zaman, K.; Abro, M.M.Q. Socio-economic and corporate factors and COVID-19 pandemic: A wake-up call. Environ. Sci. Pollut. Res. 2021, 28, 63215–63226. [Google Scholar] [CrossRef]
  31. Qin, X.; Godil, D.I.; Khan, M.K.; Sarwat, S.; Alam, S.; Janjua, L. Investigating the effects of COVID-19 and public health expenditure on global supply chain operations: An empirical study. Oper. Manag. Res. 2021. [Google Scholar] [CrossRef]
  32. Huber, P.J. Robust regression: Asymptotics, conjectures and Monte Carlo. Ann. Stat. 1973, 1, 799–821. [Google Scholar] [CrossRef]
  33. Rousseeuw, P.J.; Yohai, V.J. Robust Regression by Means of S-Estimators. In Robust and Nonlinear Time Series; Lecture Notes in Statistics No. 26; Franke, J., Härdle, W., Martin, D., Eds.; Springer: Berlin, Germany, 1984. [Google Scholar]
  34. Yohai, V.J. High breakdown-point and high efficiency robust estimates for regression. Ann. Stat. 1987, 15, 642–656. [Google Scholar] [CrossRef]
  35. Pradhan, R.P.; Arvin, M.B.; Nair, M. Urbanization, transportation infrastructure, ICT, and economic growth: A temporal causal analysis. Cities 2021, 115, 103213. [Google Scholar] [CrossRef]
  36. Bag, S.; Gupta, S.; Choi, T.M.; Kumar, A. Roles of Innovation Leadership on Using Big Data Analytics to Establish Resilient Healthcare Supply Chains to Combat the COVID-19 Pandemic: A Multimethodological Study. IEEE Trans. Eng. Manag. 2021. [Google Scholar] [CrossRef]
  37. Khan, H.U.R.; Usman, B.; Zaman, K.; Nassani, A.A.; Haffar, M.; Muneer, G. The impact of carbon pricing, climate financing, and financial literacy on COVID-19 cases: Go-for-green healthcare policies. Environ. Sci. Pollut. Res. 2022. [Google Scholar] [CrossRef]
  38. Raj, A.; Mukherjee, A.A.; de Sousa Jabbour, A.B.L.; Srivastava, S.K. Supply Chain Management during and post-COVID-19 Pandemic: Mitigation Strategies and Practical Lessons Learned. J. Bus. Res. 2022, 142, 1125–1139. [Google Scholar] [CrossRef]
  39. Nundy, S.; Ghosh, A.; Mesloub, A.; Albaqawy, G.A.; Alnaim, M.M. Impact of COVID-19 pandemic on socio-economic, energy-environment and transport sector globally and sustainable development goal (SDG). J. Clean. Prod. 2021, 312, 127705. [Google Scholar] [CrossRef]
  40. Marek, W. Will the consequences of COVID-19 trigger a redefining of the role of transport in the development of sustainable tourism? Sustainability 2021, 13, 1887. [Google Scholar]
  41. Sohail, M.T.; Ullah, S.; Majeed, M.T.; Usman, A. Pakistan management of green transportation and environmental pollution: A nonlinear ARDL analysis. Environ. Sci. Pollut. Res. 2021, 28, 29046–29055. [Google Scholar] [CrossRef]
  42. Tang, Z.; Liu, X.; Wang, Y. Integrated optimization of sustainable transportation and inventory with multiplayer dynamic game under carbon tax policy. Math. Probl. Eng. 2020, 2020, 4948383. [Google Scholar] [CrossRef]
  43. Mohtashami, Z.; Aghsami, A.; Jolai, F. A green closed loop supply chain design using queuing system for reducing environmental impact and energy consumption. J. Clean. Prod. 2020, 242, 118452. [Google Scholar] [CrossRef]
  44. Sriyanto, S.; Lodhi, M.S.; Salamun, H.; Sardin, S.; Pasani, C.F.; Muneer, G.; Zaman, K. The role of healthcare supply chain management in the wake of COVID-19 pandemic: Hot off the press. Foresight 2021. [Google Scholar] [CrossRef]
  45. An, H.; Razzaq, A.; Nawaz, A.; Noman, S.M.; Khan, S.A.R. Nexus between green logistic operations and triple bottom line: Evidence from infrastructure-led Chinese outward foreign direct investment in Belt and Road host countries. Environ. Sci. Pollut. Res. 2021, 28, 51022–51045. [Google Scholar] [CrossRef] [PubMed]
  46. Ali, E.B.; Anufriev, V.P.; Amfo, B. Green economy implementation in Ghana as a road map for a sustainable development drive: A review. Sci. Afr. 2021, 12, e00756. [Google Scholar] [CrossRef]
  47. Yang, B.; Usman, M. Do industrialization, economic growth and globalization processes influence the ecological footprint and healthcare expenditures? Fresh insights based on the STIRPAT model for countries with the highest healthcare expenditures. Sustain. Prod. Consum. 2021, 28, 893–910. [Google Scholar] [CrossRef]
  48. Khan, S.A.R.; Yu, Z.; Umar, M.; Zia-ul-haq, H.M.; Tanveer, M.; Janjua, L.R. Renewable energy and advanced logistical infrastructure: Carbon-free economic development. Sustain. Dev. 2021. [Google Scholar] [CrossRef]
  49. Hepburn, C.; Qi, Y.; Stern, N.; Ward, B.; Xie, C.; Zenghelis, D. Towards carbon neutrality and China’s 14th Five-Year Plan: Clean energy transition, sustainable urban development, and investment priorities. Environ. Sci. Technol. 2021, 8, 100130. [Google Scholar] [CrossRef]
  50. Bilgili, F.; Kuşkaya, S.; Khan, M.; Awan, A.; Türker, O. The roles of economic growth and health expenditure on CO2 emissions in selected Asian countries: A quantile regression model approach. Environ. Sci. Pollut. Res. 2021, 28, 44949–44972. [Google Scholar] [CrossRef]
  51. Akhtar, M.Z.; Zaman, K.; Rehman, F.U.; Nassani, A.A.; Haffar, M.; Abro, M.M.Q. Evaluating pollution damage function through carbon pricing, renewable energy demand, and cleaner technologies in China: Blue versus green economy . Environ. Sci. Pollut. Res. 2021, 29, 24878–24893. [Google Scholar] [CrossRef]
  52. Sheehan, J.R.; Lyons, B.; Holt, F. The use of Lean Methodology to reduce personal protective equipment wastage in children undergoing congenital cardiac surgery, during the COVID-19 pandemic. Pediatric Anesth. 2021, 31, 213–220. [Google Scholar] [CrossRef]
  53. Hakkim, H.; Kumar, A.; Sinha, B.; Sinha, V. Air pollution scenario analyses of fleet replacement strategies to accomplish reductions in criteria air pollutants and 74 VOCs over India. Atmos. Environ. X 2022, 13, 100150. [Google Scholar] [CrossRef]
  54. Rizki, A.F.; Augustine, Y. Green supply chain management practices: Direct effects sustainability performance. Technol. Soc. Sci. J. 2022, 28, 389–407. [Google Scholar] [CrossRef]
  55. Khan, S.A.R.; Jian, C.; Zhang, Y.; Golpîra, H.; Kumar, A.; Sharif, A. Environmental, social and economic growth indicators spur logistics performance: From the perspective of South Asian Association for Regional Cooperation countries. J. Clean. Prod. 2019, 214, 1011–1023. [Google Scholar] [CrossRef]
Figure 1. Trend analysis of logistics-induced carbon emissions, fuel imports, and economic growth. Source: World Bank [7].
Logistics 06 00027 g001
Figure 2. Leverage plots.
Logistics 06 00027 g002
Figure 3. Influence statistics. Source: Authors’ estimates. Note: Two parallel black lines show average deviation, while red lines show variables ‘dispersion around mean.
Logistics 06 00027 g003
Figure 4. CUSUM and CUSUM square estimates. Source: Authors’ estimates. The red line shows the critical value, while the blue line shows the 95% confidence interval.
Logistics 06 00027 g004
Table 1. List of variables.
VariablesSymbolUnit/MeasurementReferred toExpected Sign
Dependent Variable
Healthcare expendituresHEXP% of GDPHealthcare costs-----
Independent Variables
Logistics Performance IndexLPIIndex value between 1 (low) and 5 (high)Logistics OperationsPositive
Square of LPISQLPINegative
Logistics-Induced Carbon EmissionsLICARBLPI × Carbon emissions (metric tons per capita)Logistics operations increases carbon emissionsPositive
Logistics-Induced Fuel ImportsLIFIMPLPI × Fuel Imports (% of merchandise imports)Logistics operations increases fuel importsPositive
Logistics-Induced carbon emissionsLICARBLPI × Carbon emissions (metric tons per capita)Logistics operations increases carbon emissionsPositive
Logistics-Induced Economic GrowthLIEGLPI × GDP per capita (constant 2015 USD)Logistics operations supports economic activitiesPositive
Table 2. Descriptive statistics.
MethodsHEXPLPILICARBLIFIMPLIEG
Mean6.5636782.91007615.6868941.5047554,686.07
Maximum16.687114.310000110.8615103.8875393,030.3
Minimum1.9364921.9300000.0651611.619918630.7111
Std.Dev.2.5865840.59953018.3078921.4210578,335.60
Skewness0.5508240.5987512.0868920.4515991.961479
Kurtosis3.4447232.2989348.7993893.3442796.560456
Note: HEXP represents healthcare expenditures, LPI represents the logistics performance index, LICARB represents logistics-induced carbon emissions, LIFIMP represents logistics-induced fuel imports, and LIEG represents logistics-induced economic growth.
Table 3. Correlation matrix.
VariablesHEXPLPISQLPILICARBLIFIMPLIEG
HEXP1
LPI0.4491
(0.000)-----
SQLPI0.4720.9951
(0.000)(0.000)-----
LICARB0.1690.6260.6201
(0.052)(0.000)(0.000)-----
LIFIMP−0.0150.1710.165−0.0811
(0.858)(0.050)(0.059)(0.353)-----
LIEG0.4480.7920.8120.6480.0021
(0.000)(0.000)(0.000)(0.000)(0.981)-----
Note: HEXP represents healthcare expenditures, LPI represents the logistics performance index, SQLPI represents the square of LPI, LICARB represents logistics-induced carbon emissions, LIFIMP represents logistics-induced fuel imports, and LIEG represents logistics-induced economic growth. The small bracket offers the probability value.
Table 4. Robust least squares regression estimates.
Dependent Variable: ln(HEXP).
VariableCoefficientStd. Errorz-StatisticProb.
ln(LPI)−2.4212900.927344−2.6109950.0090
SQLPI0.1396390.0492372.8360820.0046
ln(LICARB)−0.0595360.050321−1.1831290.2368
ln(LIFIMP) a0.0874660.0529801.7989150.0721
ln(LIEG)0.1477160.0630192.3439840.0191
C1.7992170.7273792.4735600.0134
Robust Statistics
R20.217331Adjusted R20.186024
Rw20.320703Adjust Rw20.320703
Rn241.65057Prob(Rn2)0.000000
Diagnostic Test Estimates
Breusch-Godfrey Serial Correlation LM Test:
F-statistic1.824789Prob. F(2124)0.1656
Obs*R-squared3.745370Prob. Chi-Square(2)0.1537
Heteroskedasticity Test: Breusch-Pagan-Godfrey
F-statistic1.731107Prob. F(4126)0.1472
Obs*R-squared6.824179Prob. Chi-Square(4)0.1455
Ramsey RESET Test
MethodsValuedfProbability
t-statistic0.6442311250.5206
F-statistic0.415034(1, 125)0.5206
Likelihood ratio0.43423510.5099
Note: HEXP represents healthcare expenditures, LPI represents the logistics performance index, SQLPI represents the square of LPI, LICARB represents logistics-induced carbon emissions, LIFIMP represents logistics-induced fuel imports, and LIEG represents logistics-induced economic growth. a represents the RLS-S estimator while excluding LPI and SQLPI from the regression.
Table 5. IRF estimates of HEXP.
MonthHEXPLPILICARBLIFIMPLIEG
12.6245960.0000000.0000000.0000000.000000
20.1306100.2704010.0281610.2382060.032791
3−0.2963380.2480390.1400700.038015−0.068149
4−0.003645−0.035328−0.012916−0.002168−0.020594
50.028501−0.043974−0.004322−0.013650−0.004917
6−0.0032880.0089120.000738−0.0014080.006088
7−0.0031170.0103630.000869−0.002259−0.001901
80.001241−0.002021−0.0004850.000717−0.001231
97.07E−05−0.0026910.0002230.0006240.000719
10−0.0002930.0003716.65E−05−0.0001520.000351
Note: HEXP represents healthcare expenditures, LPI represents the logistics performance index, LICARB represents logistics-induced carbon emissions, LIFIMP represents logistics-induced fuel imports, and LIEG represents logistics-induced economic growth.
Table 6. VDA estimates.
MonthS.E.HEXPLPILICARBLIFIMPLIEG
12.624596100.00000.0000000.0000000.0000000.000000
22.65278998.128161.0389890.0112690.8063070.015279
32.68558096.964101.8668030.2830240.8067750.079302
42.68592596.939321.8836220.2852640.8066320.085160
52.68647996.910611.9096390.2854050.8088810.085460
62.68650396.909021.9107050.2854070.8088940.085972
72.68652796.907461.9121600.2854130.8089510.086021
82.68652896.907371.9122140.2854160.8089570.086042
92.68653096.907261.9123120.2854160.8089610.086049
102.68653096.907261.9123140.2854160.8089620.086051
Note: HEXP represents healthcare expenditures, LPI represents the logistics performance index, LICARB represents logistics-induced carbon emissions, LIFIMP represents logistics-induced fuel imports, and LIEG represents logistics induced economic growth.
Publisher’s Note: MDPI stays neutral with regard to jurisdictional claims in published maps and institutional affiliations.

