1. Introduction
In industrial economics, “Everything is worth what its purchaser will pay for it” (Publilius Syrus, 1st Century B.C., cited in [
1]). Unfortunately, this is not reflected in current green supply chain management (GSCM) practices. Indeed, the cost of GSCM implementation is greater than the expected return [
2,
3]. The main reason for this is the cost of changing practices, including those surrounding human resources [
3], and adopting new green systems [
4]. Consequently, it is not surprising that financial barriers represent one of the main obstacles to GSCM implementation [
2,
3,
5,
6].
It must be noted that the costs of being green are associated with not only environmental elements but also organizational functions [
7]. Hervani et al. [
5] explained this viewpoint through their equation-based definition of GSCM: GSCM = [Green Purchasing (GP)] + [Green Manufacturing (GM)/Materials Management (MM)] + [Green Distribution (GD)/Marketing] + [Reverse Logistics].
Specifically, linking environmental-related strategic purchasing activities to supply chain management (SCM) practices facilitates GSCM implementation [
8]. This, in turn, creates new dimensions for sophisticated networks of buyers and sellers in various industries [
5,
9]. This complex situation for supply chain stakeholders highlights the need for the implementation of supply chain finance (SCF), a solution developed by academicians and practitioners.
SCF has been defined as a facilitator of the physical and information flows of the financial products and services provided by financial institutions [
10]. It is the ability to optimize supply chains to enable financial infrastructures and cash flows [
11]. Wuttke et al. [
12] defined SCF as cash flow optimization with respect to planning, management, and control to improve material flows. Other studies have offered similar definitions [
13,
14,
15,
16,
17,
18]. These studies suggest that financial, physical, technological, human, and organizational resource flows are key to SCF. Thus, the definitions are centered around the concept of the “flow” (i.e., flow of information, materials, and other resources) along the supply chain. This indicates the need for a focus on the five Vs of big data: value, volume, velocity, variety, and veracity. Moreover, recent industrial economics studies have also emphasized the importance of big data as a vital dimension in such a dynamic era [
19,
20,
21,
22,
23,
24].
Touboulic et al. [
25] emphasized that the current SC practices are still influenced by the idea that the developing countries represent a collection of suppliers to the well-established firms in the developed countries; accordingly, SCM is in need of being restructured. Indeed, for SCM, restructuring the relationships among the different stakeholders is an issue that has attracted much attention, and consequently, the field of Operations Management (OM) represents an appropriate field for decision-making (DM) and/or multicriteria decision-making (MCDM) applications [
26]. For example, the variety of the variables and constraints corresponding to the vehicle routing problem (VRP) results in formulation of different algorithms in order to optimize various logistics problems [
27]. Likewise, in order to decrease the environmental impacts created by the transportation fleets during transfer of goods among different logistics centers, the queuing theory has been employed [
28]. Tundys and Wiśniewski [
29] investigated various tools and techniques for measuring the performance of GSCM and they clearly stated that future research attempts should focus on developing “friendly” managerial tools in order to assess GSCM practices. Such interactions among environmental aspects and SCM issues create an appropriate environment in which MCDM tools, such as TOPSIS, are utilized in order to solve GSCM issues [
30]. Fuzzy TOPSIS and ELECTRE have recently been applied in order to handle the issue of selecting green suppliers considering green practices [
31].
On top of this, with the increasing number of the recently published GSCM research works that highlight the significance of the issue of “resources” in GSCM practices [
32,
33], and with consideration of the fact that promising technologies such as blockchain, Internet of Things (IoT), Artificial Intelligence (AI), and data analytics represent the most advanced platforms and/or the state-of-the-art technical facilitators for the data exchanging processes among the SCF stakeholders [
34], in which the flow of big data within the interactive environment represents a cornerstone for formulating a trusted and reliable platform [
35], this paper proposes a strategic roadmap to handle the issue of resource allocation among the GSCM practices. Hence, the corresponding complex hypothesis herein imposes a potential for different strategic configurations to be executed as a result of dealing with different sets of resources needed to be utilized by each GSCM practice. Consequently, three research questions can be formulated:
Research Question 1 (RQ1): How do the five Vs of big data interact with each other to improve SCF practices?
Research Question 2 (RQ2): To what extent are GSCM practice-related data accurate, valuable, big, plentiful, and fast in terms of improving the data flow to facilitate the SCF implementation?
Research Question 3 (RQ3): How do we achieve optimal resource mobilization for GSCM practices considering their different contributions to the SCF implementation?
This paper used the five Vs of big data as a platform for testing the role of GSCM practices in improving SCF implementation. Considering the fact that MCDM methods facilitate the formulation of different strategies and the creation of evaluation processes, especially in logistics [
36], three MCDM methods were employed. The fuzzy analytic network process (ANP) was employed to prioritize the five Vs by their contributions to SCF. The fuzzy technique for order preference by similarity to ideal solution (TOPSIS) was used to evaluate GSCM practices on the basis of these criteria. To improve the implementation of SCF, this study also provides a roadmap for the visualization of the optimum resource mobilization of GSCM practices through interpretive structural modeling (ISM). The rest of the paper is organized as follows:
Section 2 introduces the eight GSCM practices extracted from the literature. Some recent MCDM relevant applications are also presented at the end of
Section 2. The employed methods and contexts of their application are presented in
Section 3.
Section 4 provides the results of the proposed model. The implications, contributions, and directions for future studies are presented in
Section 5. Finally,
Section 6 presents the conclusion for this paper. A list of acronyms and their descriptions are presented in
Table 1.
3. Methods and Applications
Three MCDM methods were employed: fuzzy ANP, fuzzy TOPSIS, and ISM. The employment of these methods can be justified by looking at the three research questions separately and collectively. RQ1 aims to investigate the interactions among the “five Vs. of big data” to improve SCF practices. Such interactions imply the existence of “dependency” and “feedback” relationships among the “five Vs”. The ANP, in particular, is a best fit tool that can discover, handle, and quantify such relationships [
114,
115]. This point has also been discussed and validated in many ANP-based research works [
116,
117,
118]. RQ2 aims to evaluate eight different GSCM practices with respect to the five criteria (i.e., the five Vs). This is a typical MCDM problem that is can be resolved by TOPSIS and, academically, TOPSIS represents the most commonly acceptable MCDM tool to handle such an issue, particularly, in the fields of SCM and the environment [
119]. Note that both ANP and TOPSIS were carried out with the aid of the fuzzy set theory because the fuzzy-based ANP and TOPSIS reduce the effect of subjectivity [
120,
121]. Regarding RQ3, optimal resource mobilization cannot be attained unless the eight GSCM practices receive the entitled priority in terms of which practice should be implemented before the other one. Such a special configuration of a decision-making situation requires a tool that can handle the complexity amongst the investigated practices [
106]. Hence, in this regard, ISM was found to be a better application because it has been widely validated as an effective decision-making method and, specifically, as a tool to handle the complexity issue [
122]. Collectively, the sequence the three techniques are applied in creates a hybrid self-assessment model to measure the environmental maturity of the SCF (
Figure 1).
3.1. Fuzzy Analytic Network Process
The ANP is the generalized form of the analytic hierarchy process (AHP), a well-known MCDM technique [
115]. Consequently, the AHP and fuzzy AHP can be considered special ANP and fuzzy ANP cases. Accordingly, the fuzzy ANP has been used as an extension of the traditional fuzzy AHP applications [
123,
124]. In AHP and fuzzy AHP, groups of elements are organized in a hierarchal structure. The application of the ANP and fuzzy ANP facilitates the formulation of more complex relationships through sets of clusters (network-based structure). These ideas have been explored in several studies [
125,
126,
127].
In the ANP, a numerical scale is used to make sets of judgments, and in the fuzzy ANP, a linguistic scale is used. The MCDM literature provides several approaches to the implementation of the fuzzy AHP and ANP [
128,
129,
130,
131,
132,
133,
134,
135,
136]. However, most of these approaches are complex. Hence, Chang’s extent analysis has been considered the most accepted method because of its simplicity [
124,
137,
138]. The present study employed Chang’s extent analysis, which has been applied in previous studies [
138,
139].
To implement Chang’s extent analysis, let
symbolize the object set such that
and
symbolizes the goal set such that
This application of Chang’s extent analysis implies that the objects are considered independently in a sequential approach. In addition, for each independent object (i.e.,
), the analysis is executed for each goal,
. Accordingly,
numbers of extent analyses are executed as follows:
where
symbolizes the triangular fuzzy numbers.
symbolizes the membership function of the triangular fuzzy number. According to Erensal et al. [
137], Chang’s extent analysis can be illustrated in four steps:
Step 1: For each object
, the fuzzy synthetic extent can be expressed as:
As expressed in Equation (2),
symbolizes the extended multiplication of two fuzzy numbers. To perform
,
extent analysis values are executed such that:
From Equation (2),
can be obtained by performing the fuzzy addition operation of
as shown in Equation (4):
The inverse of the vector can then be obtained:
where
,
,
> 0. After that, the
can eventually be obtained such that:
Step 2: The opportunity that [
can be expressed as:
Figure 2 illustrates all the cases of
. For example, in the case of
>
>
, point
z represents the value that matches the highest intersection point of
(which is point
). Both values,
and
, are required to compare
.
Step 3: The chance of the occurrence of a convex fuzzy number greater than
convex fuzzy numbers
can be expressed as follows:
Step 4: The last step is to find the weight vector for
such that:
3.2. Fuzzy TOPSIS
The fuzzy TOPSIS was developed by Chen [
140] to address the issue of uncertainty in MCDM problems. With the fuzzy TOPSIS, decision-makers,
use linguistic terms to rate the criteria and alternatives. Accordingly,
represents the weight of the criterion
assigned by the
such that
Correspondingly,
represents the weight of the alternative
with respect to
assigned by the
, such that
Several studies [
38,
141] have summarized the fuzzy TOPSIS as follows:
Accordingly, the closest alternative to the FPIS is considered the best alternative.
3.3. Interpretive Structural Modeling
Several studies have discussed the mathematical foundation of ISM [
142,
143,
144]. The philosophical background was presented by Warfield [
145]. ISM is a mathematical technique to simplify the multifaceted relationships of any group of elements to develop a meaningful model for decision-makers [
146]. It illustrates and explains the relationships among groups of entities, such as factors, elements, practices, barriers, and initiatives [
111,
146,
147,
148,
149,
150]. On the basis of applications in the literature [
147,
150,
151], the steps in ISM are as follows:
Identifying the practices, such as factors, initiatives, barriers, or elements, to be examined.
Describing the contextual relationships among the sets of practices through four symbols:
V: if implementing practice Ä leads to the successful implementation of practice Ë.
A: if implementing practice Ë leads to the successful implementation of practice Ä.
X: if both practice Ä and practice Ë lead to successful reciprocal implementation.
O: if there is no relationship between practice Ä and practice Ë.
Forming the structural self-interaction matrix (SSIM) as a result of the pair-wise contextual relationships among the examined practices.
Extracting the reachability matrix from the SSIM, which is converted into an initial reachability matrix in accordance with the following replacement rules:
If the (α, β) entry is V, then the (α, β) entry in the reachability matrix becomes 1, and the (β, α) entry becomes 0.
If the (α, β) entry is A, then the (α, β) entry in the reachability matrix becomes 0, and the (β, α) entry becomes 1.
If the (α, β) entry is X, then the (α, β) entry in the reachability matrix becomes 1, and the (β, α) entry also becomes 1.
If the (α, β) entry is O, then the (α, β) entry in the reachability matrix becomes 0, and the (β, α) entry also becomes 0.
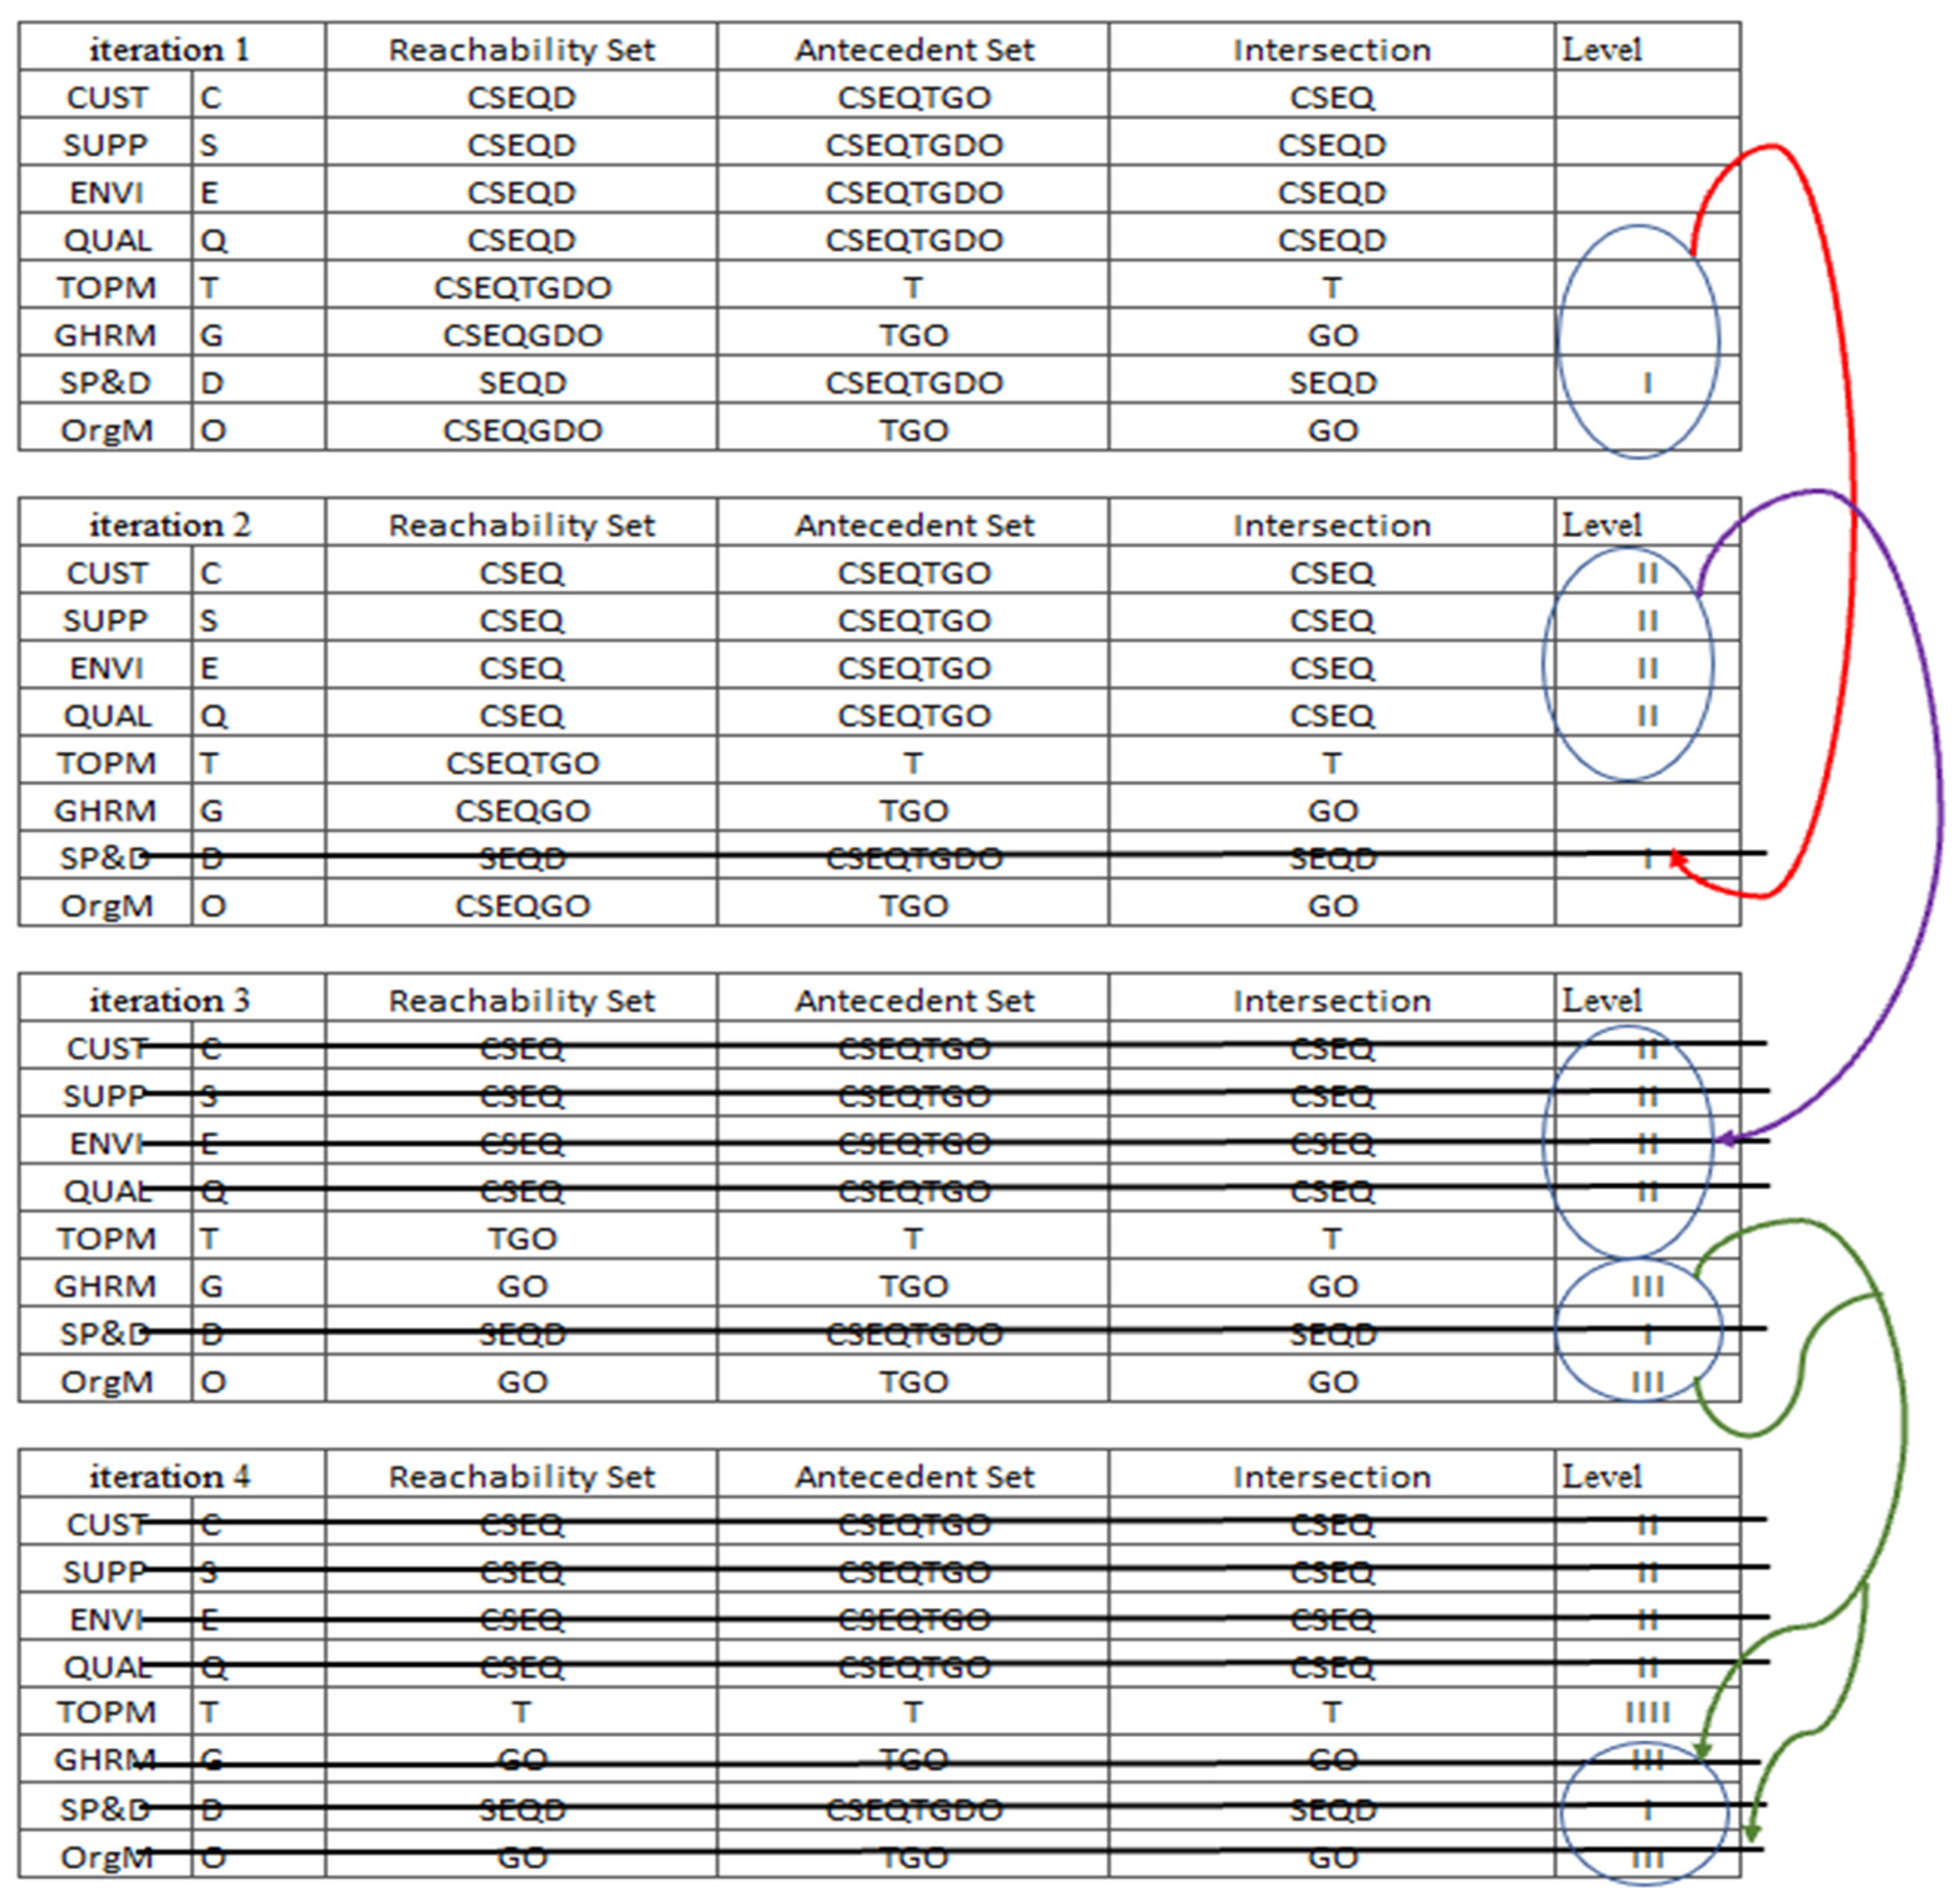
The initial reachability matrix then has to be tested for transitivity to ensure that if practice Ä leads to the implementation of practice Ë, and practice Ë leads to the implementation of practice Ü, then practice Ä leads to practice Ü. The resulting matrix is referred to as the final reachability matrix.
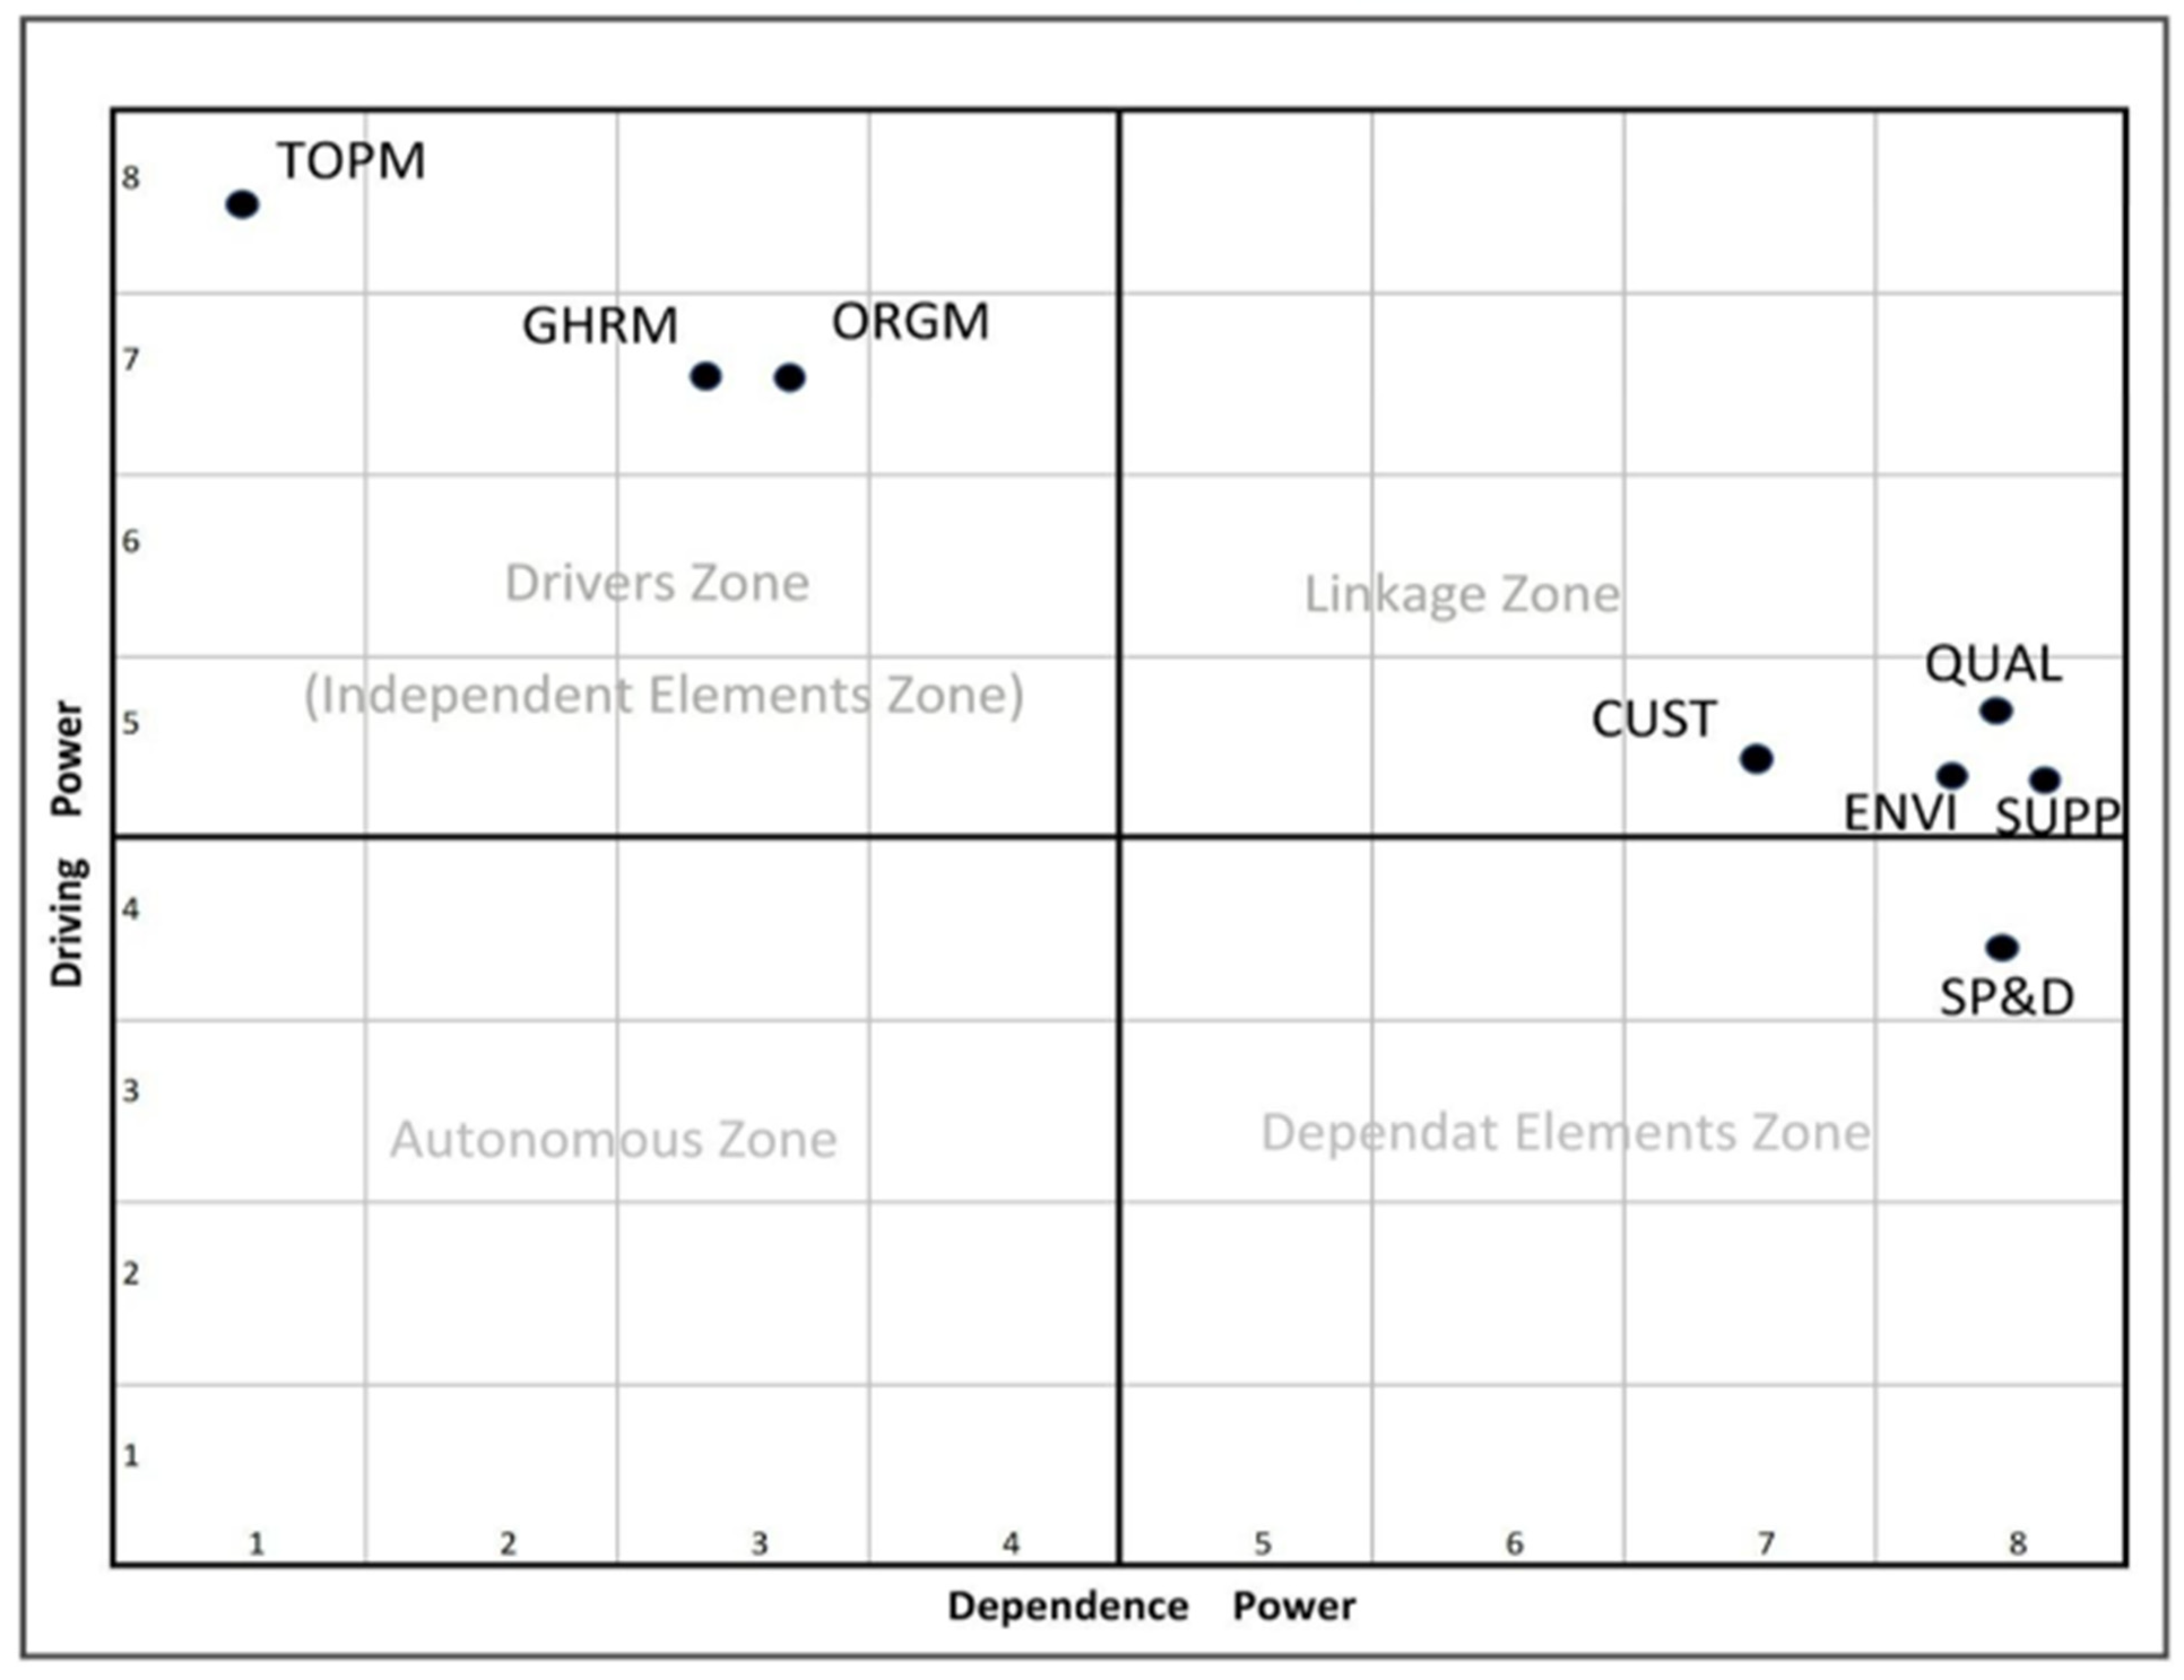
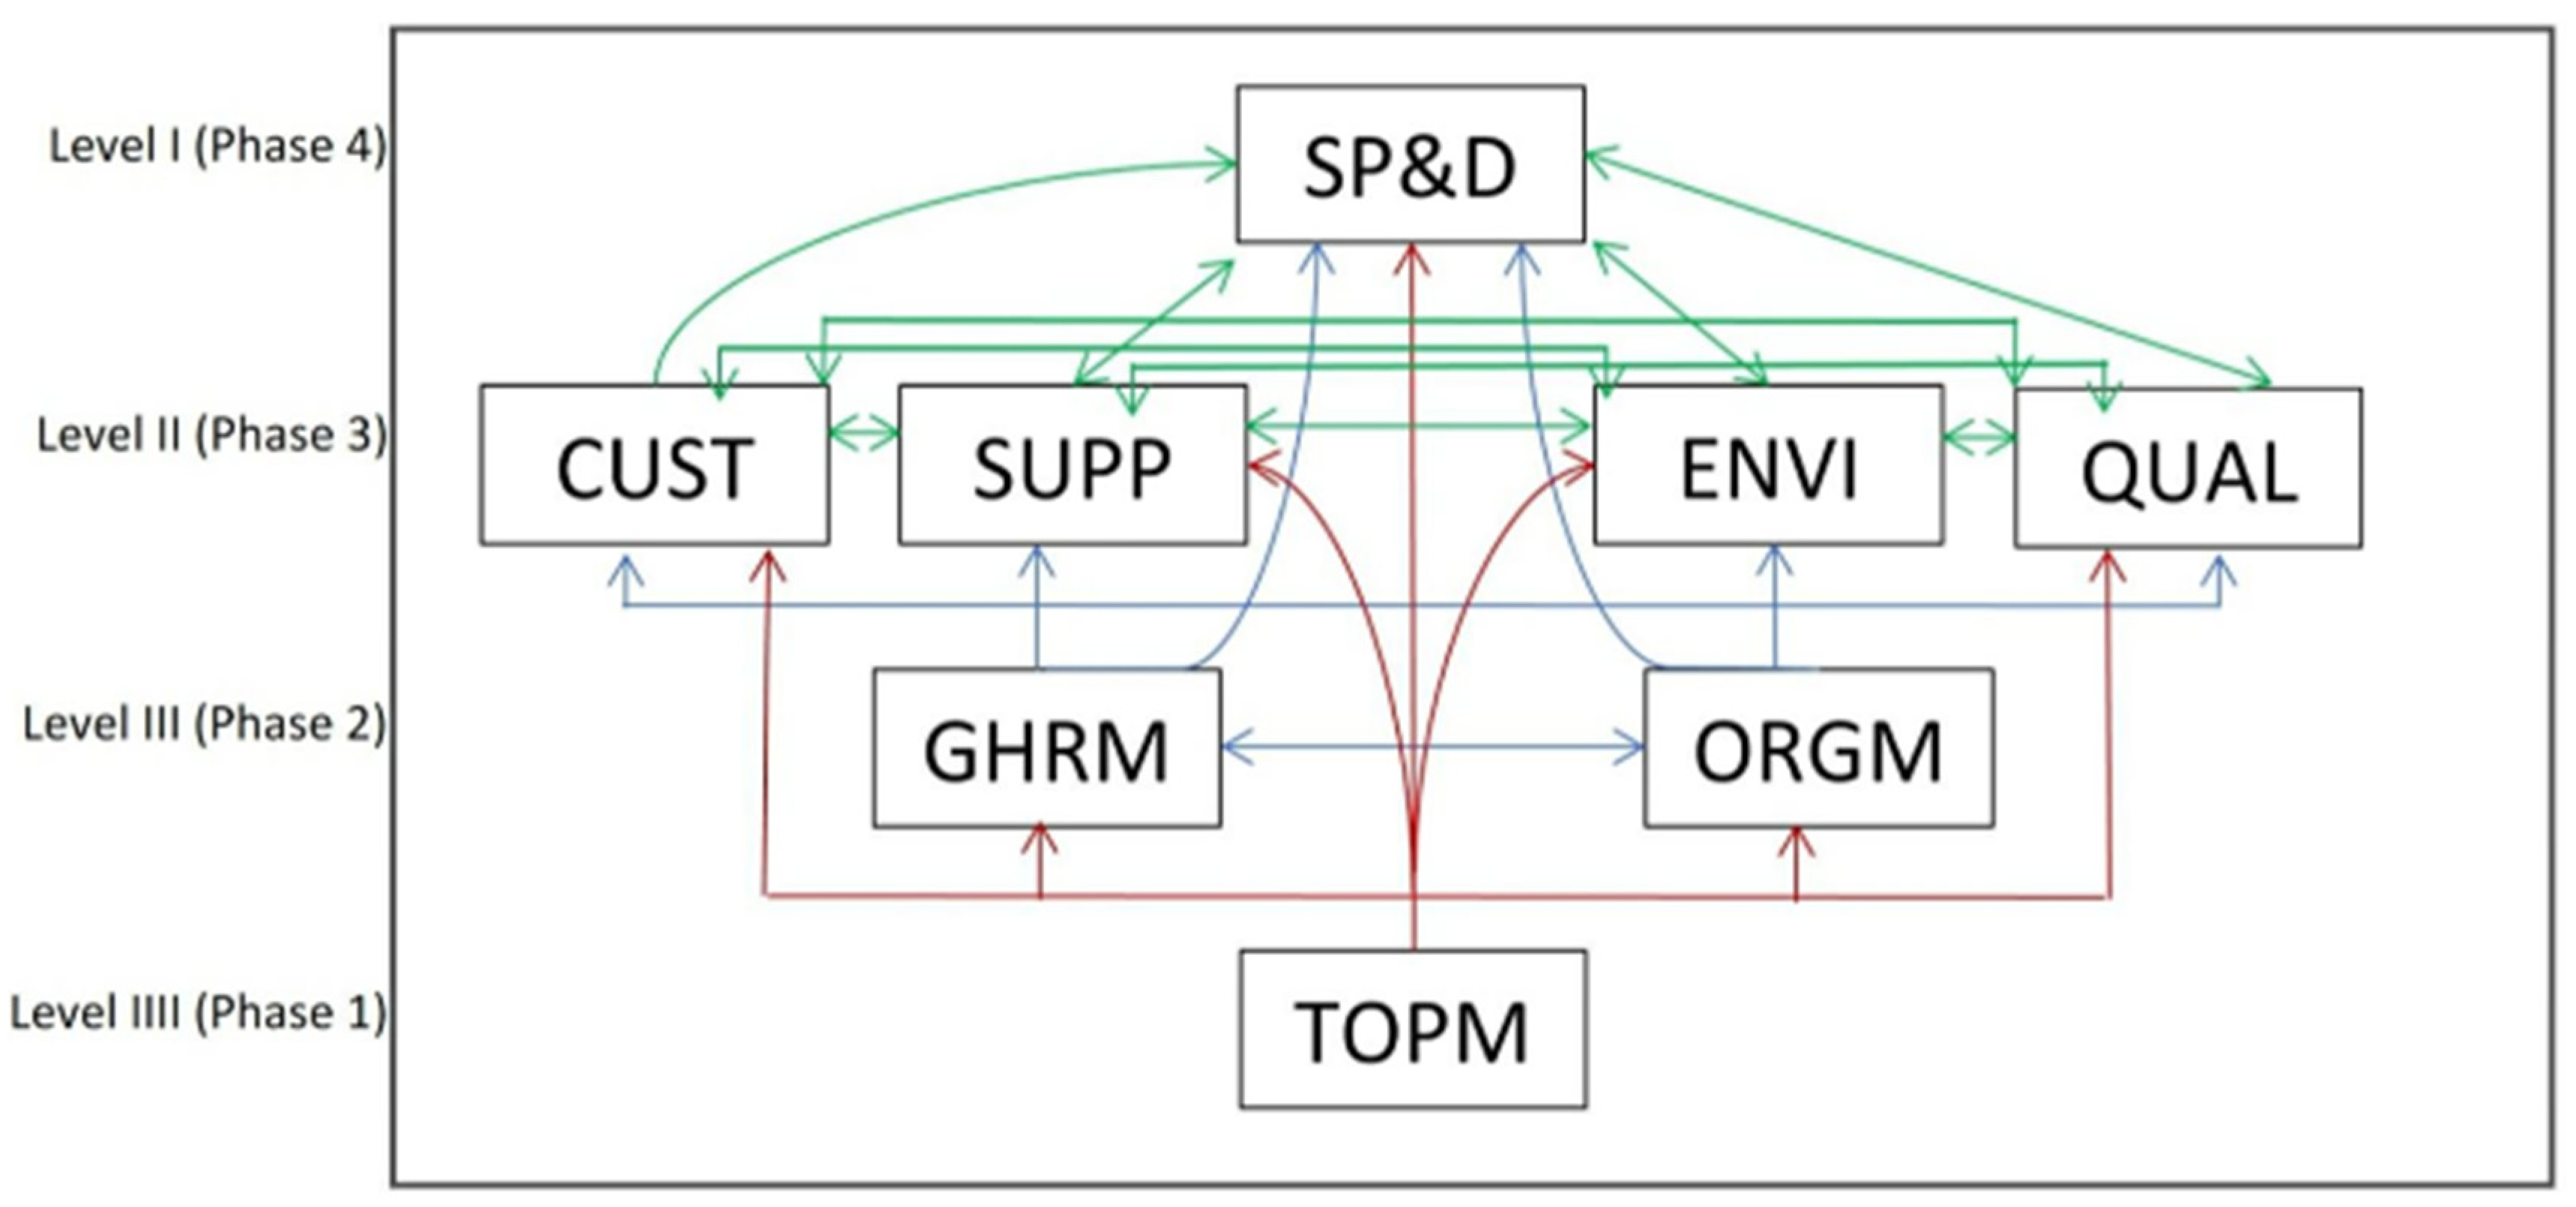
Based on the final reachability matrix, the set of practices can be classified into four categories: driving, linkage, dependent, and autonomous.
Based on the final reachability matrix, the set of practices can also be hierarchized. The final diagraph can then be developed in accordance with the identified levels.
3.4. The Application of Fuzzy ANP
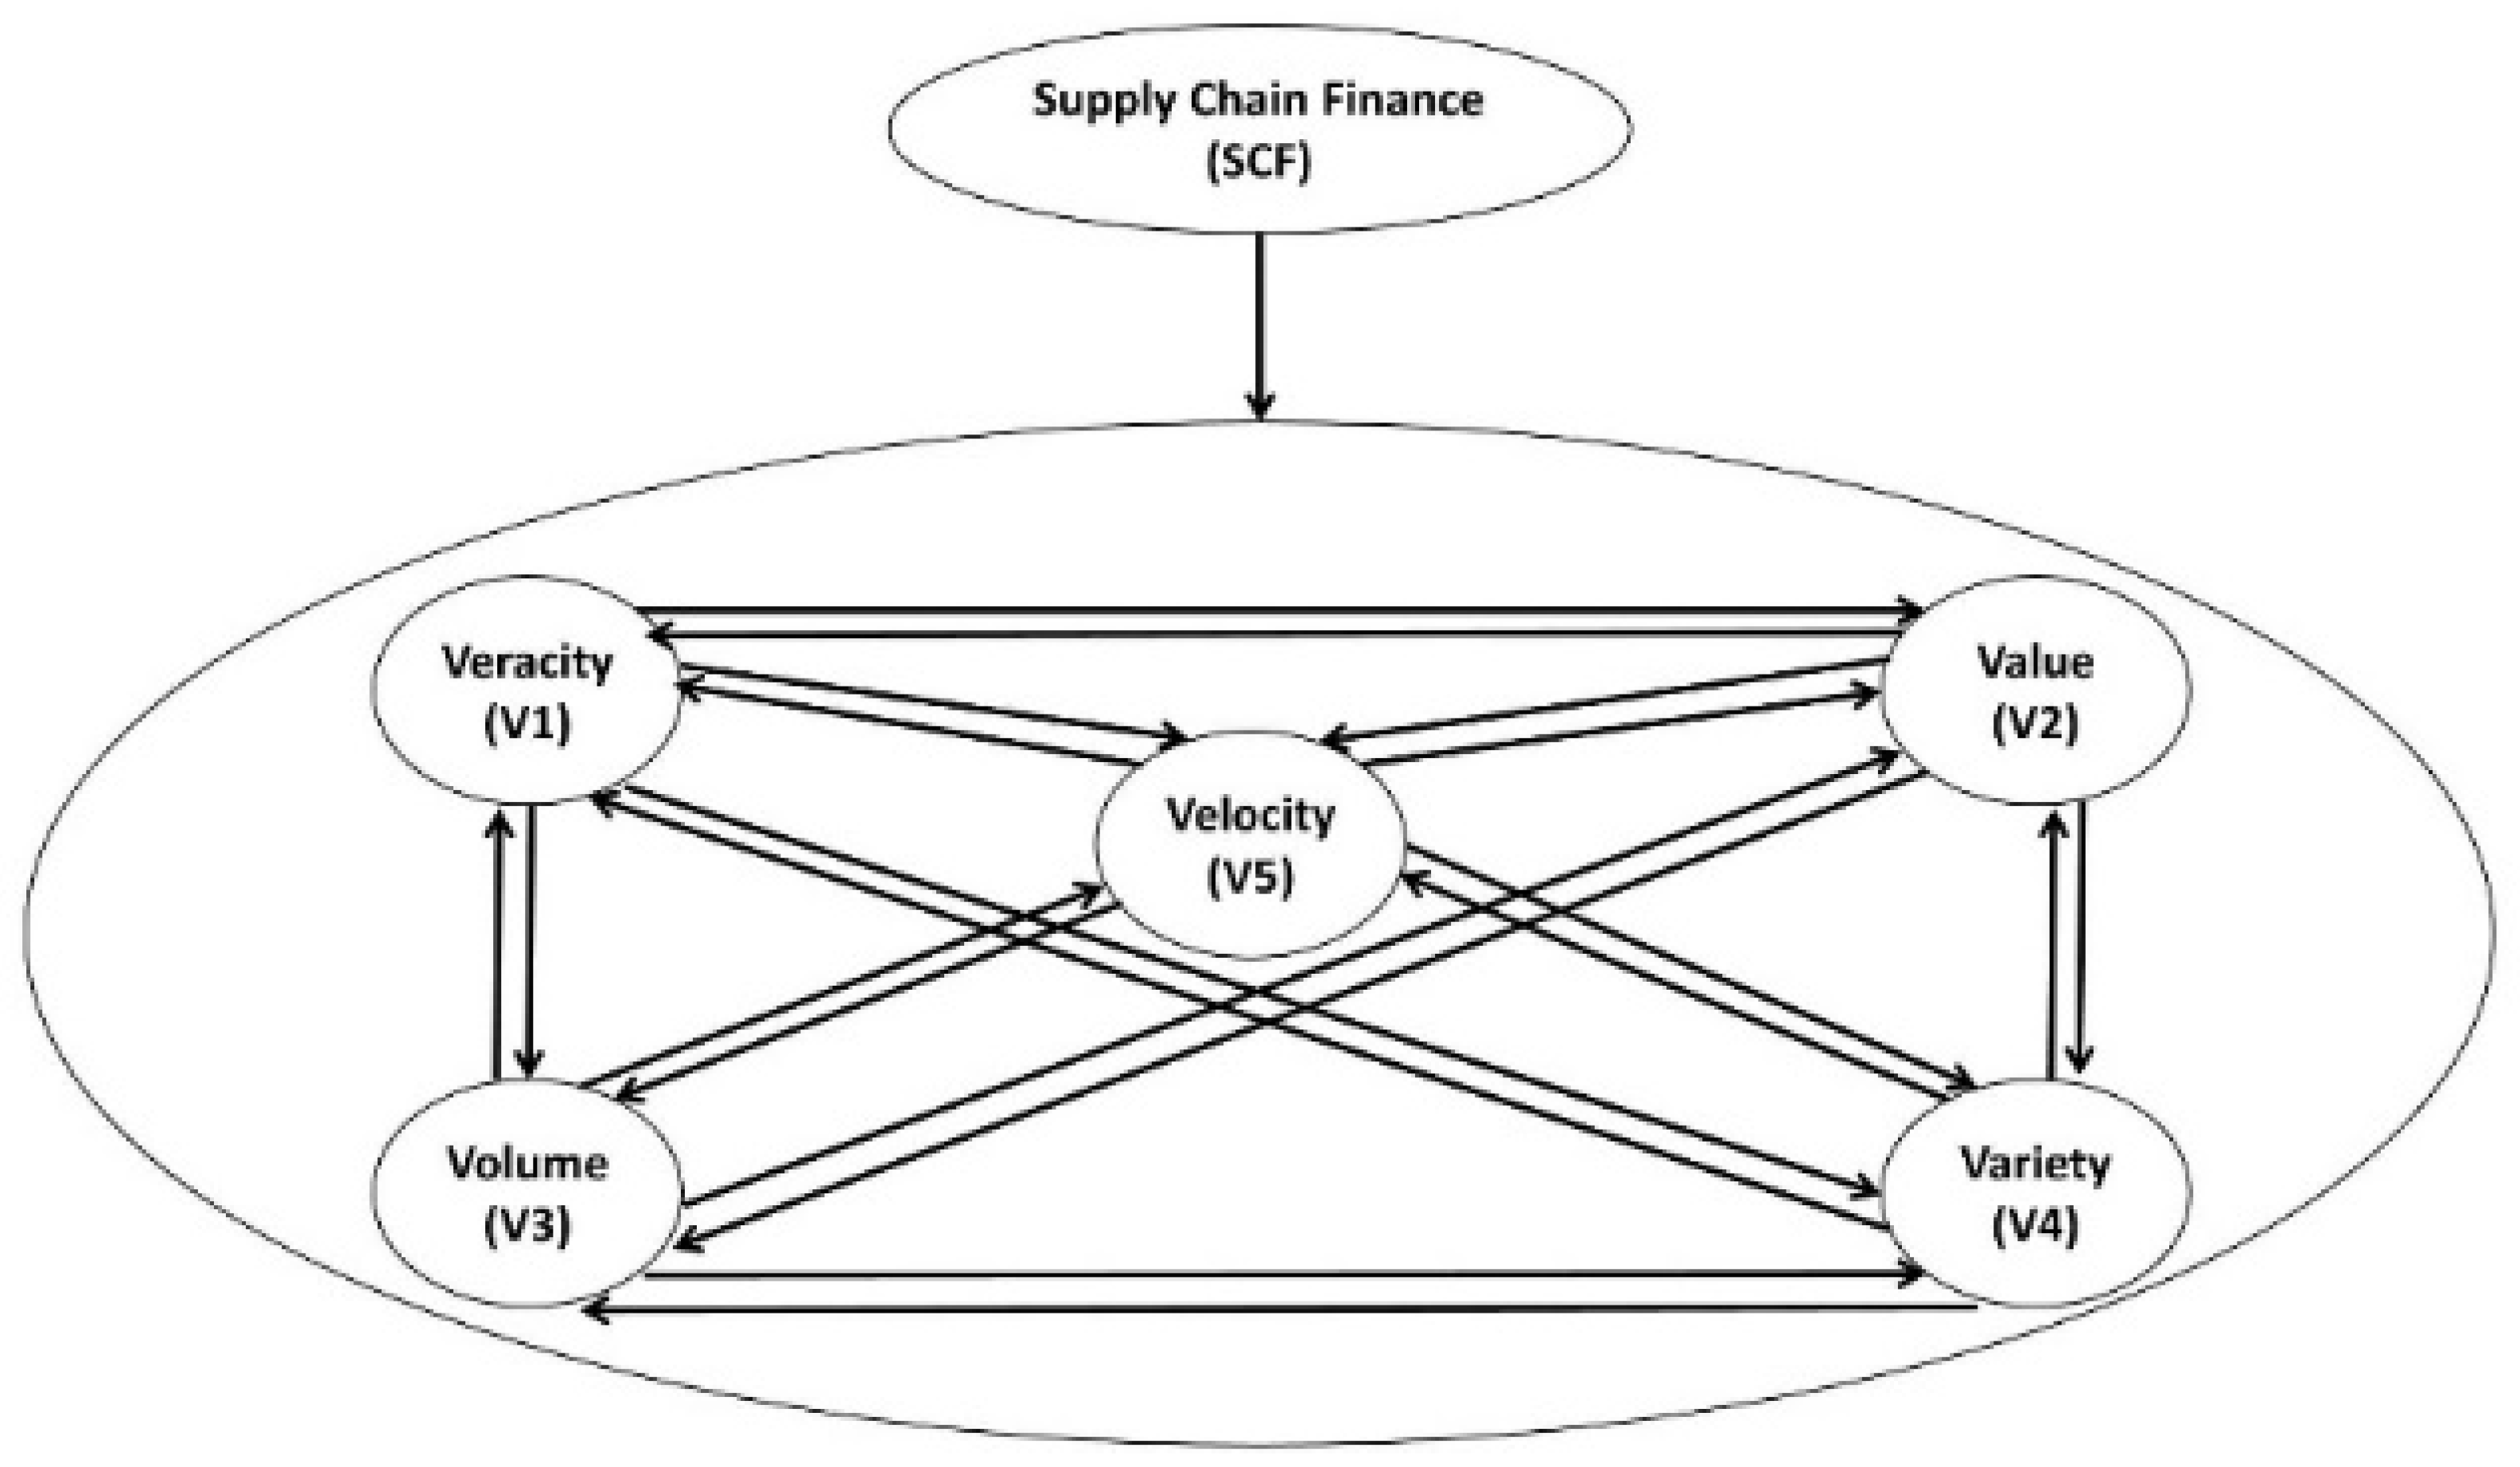
Outer- and inner-dependence relationships were considered in the proposed fuzzy ANP model. As shown in
Figure 3, the arrow from the SCF cluster to the big data cluster indicates the outer-dependence relationship in that all five Vs were weighted by their contributions to SCF practices. The arrows that connect the five Vs inside their cluster represent the inner-dependence relationships among the five Vs.
For the application of the fuzzy ANP model, the opinions of experts from one of the international leading food and retail holding companies were solicited. Accordingly, a group of experts in the field of SCM, including the supply and demand director, were selected. For this study, all selected experts were well-educated, holding critical managerial positions, and capable of dealing with various SCM issues concerning different contexts. To conduct fuzzy ANP and fuzzy TOPSIS, two different questionnaires were presented to the experts within several sequence sets of meetings until the consensus was reached. For fuzzy ANP, experts’ views on the significance of each “V” in improving the implementation of SCF were sought. For example, they were asked about the importance of data velocity vs. data value in the improvement of SCF practices. All the Vs were compared on the fuzzy ANP linguistic scale (
Table 3).
It is worth mentioning herein that, according to Yin [
152], the outcome of any case study can be validated analytically (i.e., analytical generalization) either by replication logic, in the case of having multiple case studies, or by theory development, as conducted in the current single case study (i.e., decision-making theory). Hence, Yin emphasized that the focus should be on the case study as an “opportunity to shed empirical light on some theoretical concepts or principles … that is, analytic genaralization” regardless of the number of cases. This is completely different from the traditional statistical validation of most quantitative research works. Further details regarding case study validation using the approach of analytical generalization can be found in [
152]. Additionally, most of the ANP-based case studies have been validated and generalized analytically, not statistically, with small sample sizes [
118,
153].
3.5. The Application of Fuzzy TOPSIS
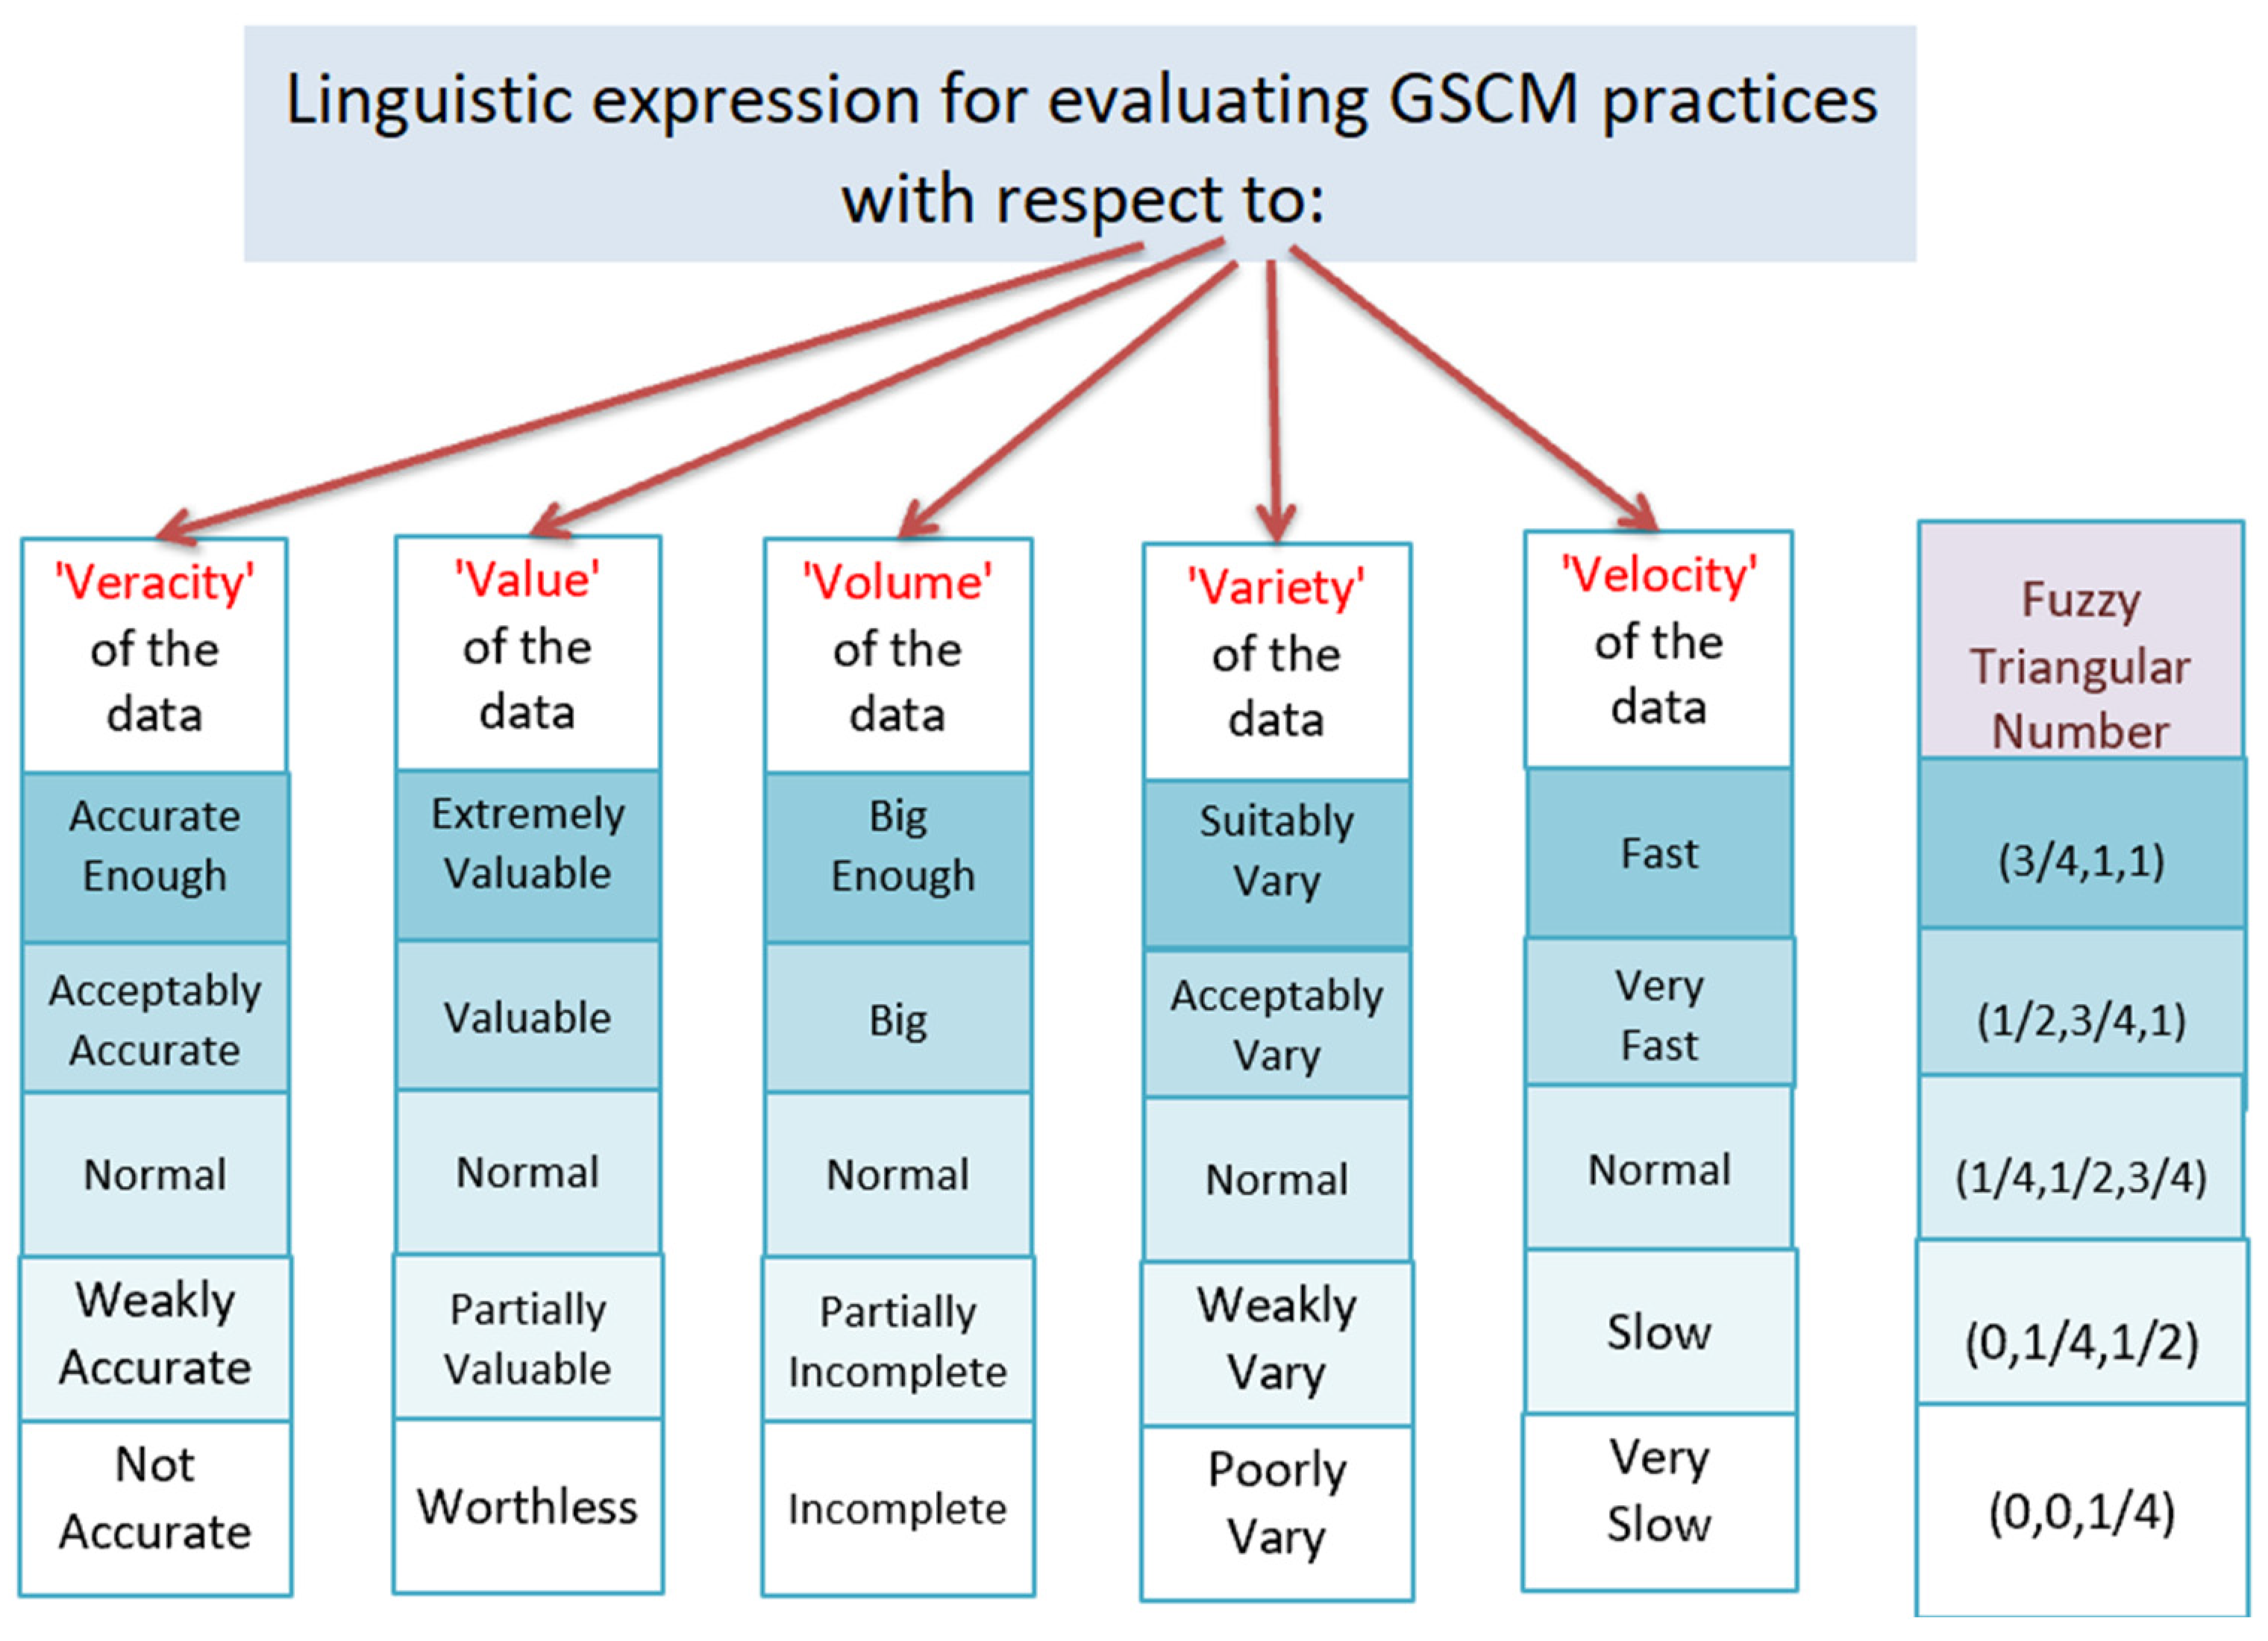
The extracted weights generated by the fuzzy ANP were considered in the development of the fuzzy TOPSIS model. The five Vs facilitated the rating of GSCM practices on the basis of their contributions to SCF practices. Experts used the fuzzy TOPSIS scale to evaluate each GSCM practice on each criterion (
Figure 4). For example, the following question was posed to the experts: to what extent are the QUAL-related data as a GSCM practice “big” enough to improve the data flows to facilitate the SCF implementation? As indicated in
Figure 4, the corresponding linguistic rates for answering the question were “big enough”, “big”, “normal”, “partially incomplete”, and “incomplete.” All GSCM practices can be rated on the corresponding linguistic fuzzy TOPSIS scale (
Figure 4).
3.6. The Application of ISM
The ISM approach was employed to prioritize the GSCM practices by their reciprocal influence. Specifically, ISM was performed to identify the GSCM practices that should be implemented first regardless of their importance, criticality, or readiness scores. ISM achieved two significant outcomes:
classification of GCSM practices into four categories: independent (drivers or driving practices), linkage, dependent, and autonomous practices;
identification of the influence of each GSCM practice.
Further explanations of the proposed indices (i.e., the integration of the fuzzy TOPSIS and ISM outcomes) and key results are presented in the next section.
5. Implications, Contributions, and Directions for Future Studies
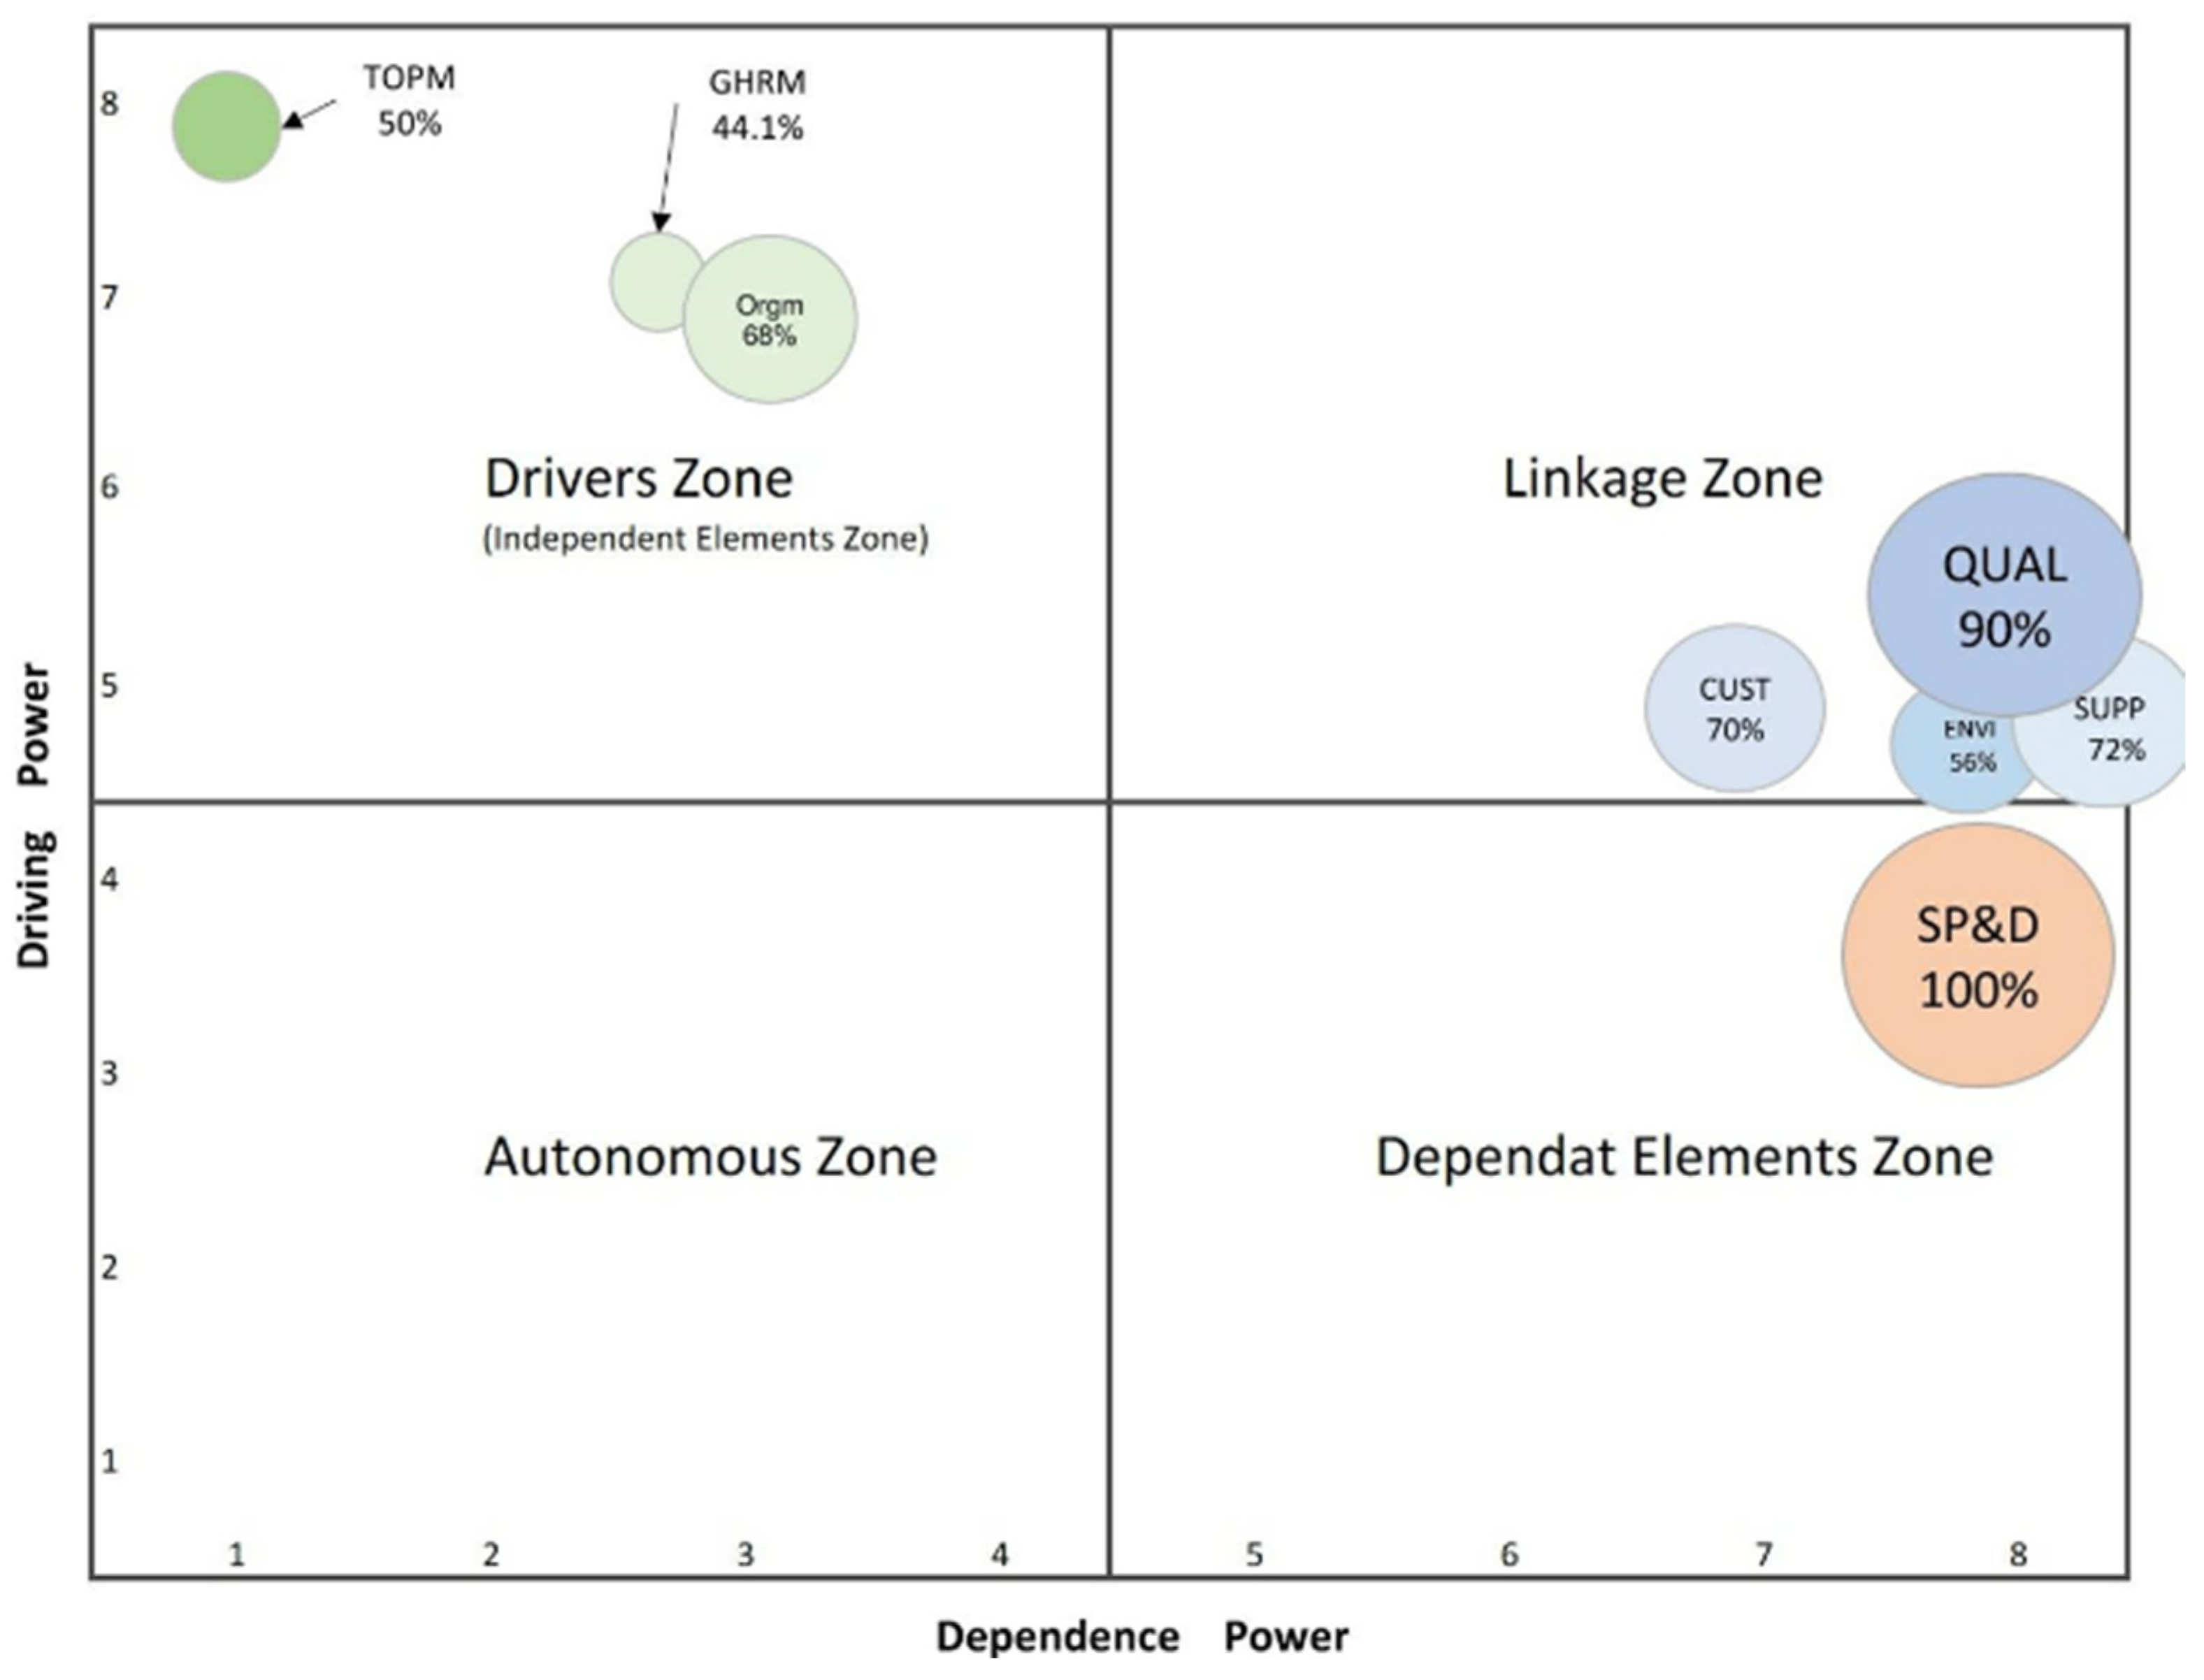
Synergized outcomes can be extracted when ISM results are interpreted by RRI scores or vice versa. In
Figure 8, which is an adjustment of
Figure 5, the size of the bubble is a reflection of the corresponding RRI score for each GSCM practice. It indicates that the drivers (independent practices) are less ready for facilitating SCF implementation than the linkage practices or the sole dependent practice—i.e., SP&D. For example, TOPM was considered as a driver. The corresponding RRI score was very low (50%). This indicates that TOPM lacked sufficient readiness or maturity to enhance SCF. Nevertheless, it was assumed to be the most ready practice because of the corresponding results for its driving power (8—i.e., high), dependence power (1—i.e., low), and phase or priority level (Phase 1). In contrast, SP&D was considered a dependent practice. The corresponding RRI score was the highest (100%). This indicates that SP&D was the readiest practice. However, this was counter to its corresponding driving power (4), which was the lowest; dependence power (8), which was the highest (i.e., = 8); and phase or priority level, which was the lowest (Phase 4).
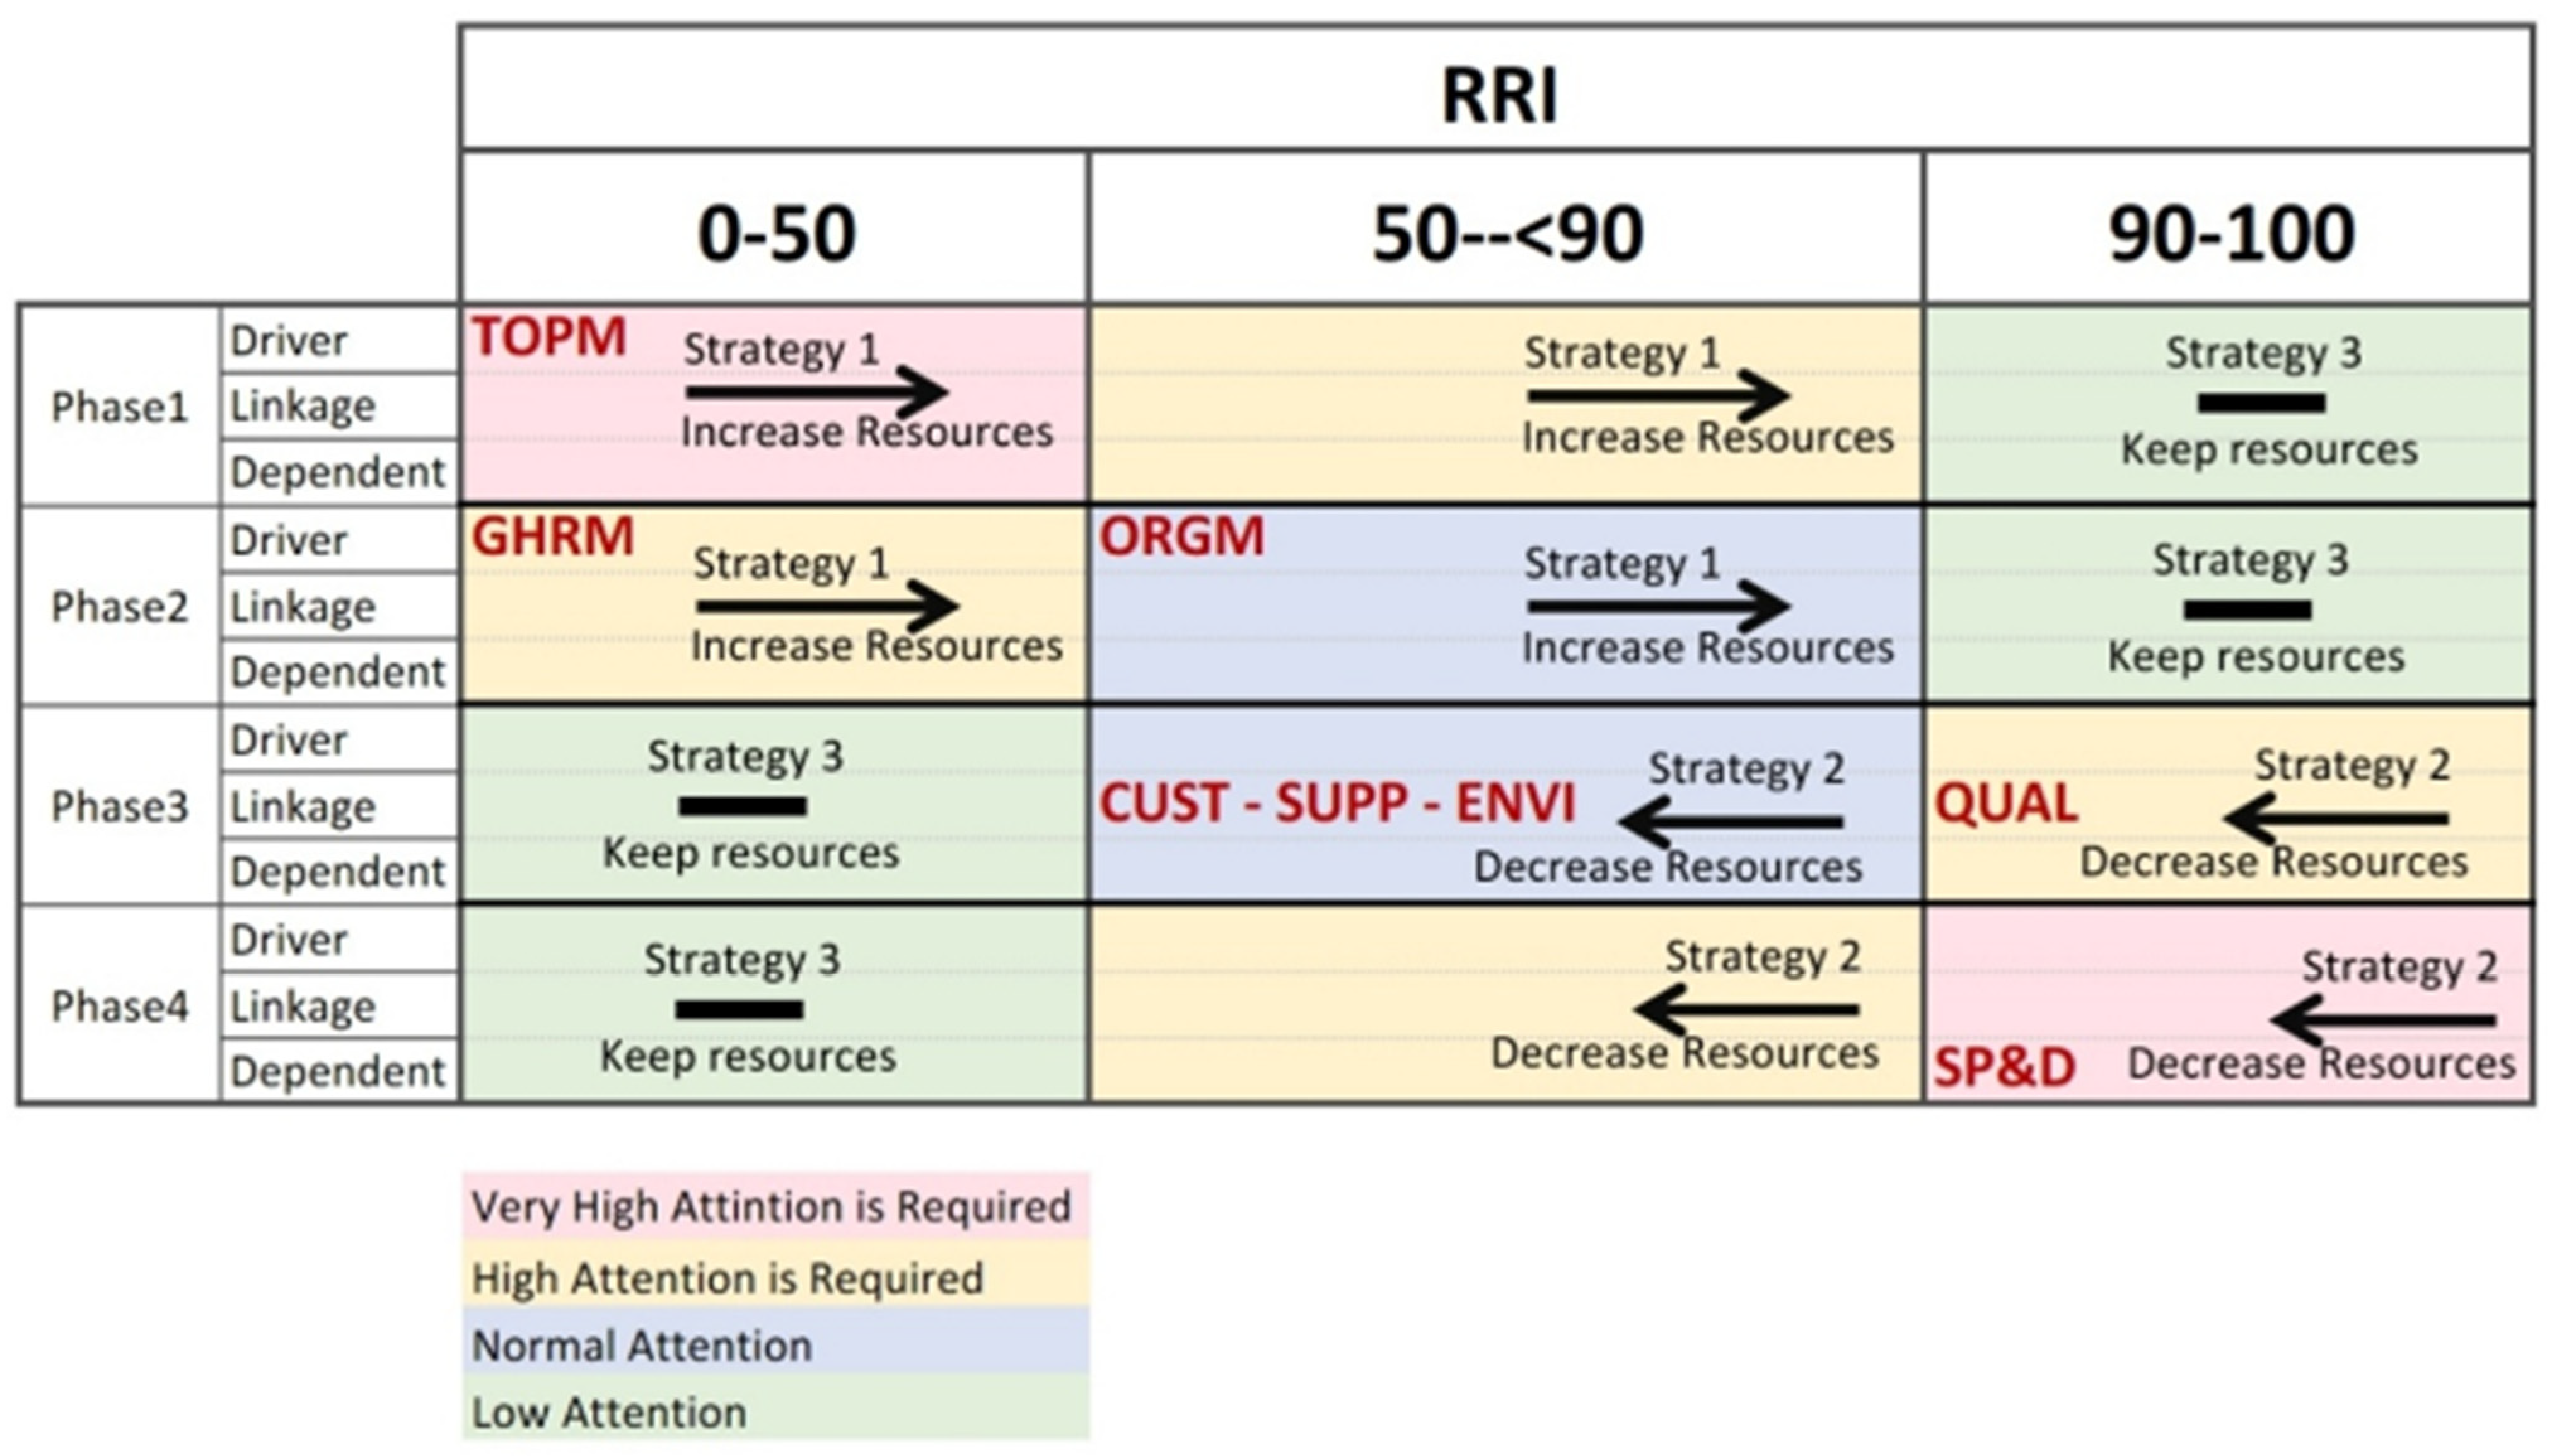
To overcome this issue, the present study developed a strategic matrix tool (SMT), which is important for the reorganization and remobilization of the available resources. In
Figure 9, the prioritized phases are listed vertically by the corresponding GSCM practice categories (zones). This also illustrates the horizontal classification of the RRI scores into three categories: 1, RRI score ≤ 50%; 2, RRI score ≥ 50% up to 90%; and 3, RRI score = 90% up to 100%. Therefore, three strategies were developed. The first (Strategy 1) refers to the process of increasing the allocated resources for each GSCM practice located in any square labeled “very high”, “high”, or “normal” attention in Phases 1 and 2 (
Figure 9). The second (Strategy 2) refers to the decrease in the allocated resources for each GSCM practice located in any square labeled “very high”, “high”, or “normal” attention in Phases 3 or 4. The third (Strategy 3) is the maintenance of the same level of resources for each GSCM practice located in any square labeled “low” attention in Phases 1, 2, 3, or 4. The strategies for each practice are assigned on the basis of their location in the SMT (
Figure 9).
This study contributes to the context of MCDM and its applications in GSCM from different angles. From a technical point of view, in order to evaluate the eight GSCM practices, fuzzy TOPSIS was conducted innovatively by using the relevant linguistic expression corresponding to to each V of big data (i.e., each criterion), as shown in
Figure 4, which is a relatively more appropriate and accurate application compared to several traditional applications of fuzzy TOPSIS. Additionally, the study succeeded in visualizing the resources throughout a developed version of the ISM’s final structure as shown in
Figure 8. Such an innovative representation facilitates the resource allocation adjustment process to ensure better utilization of resources by each GSCM practice. Specifically, note that the size of the bubble is a reflection of the dedicated resources for each GSCM practice, which is a developed and unique form of ISM results representation.
Such technical contributions lead the talk to the practical/managerial contributions of the developed model. With such innovative tools proposed herein (i.e., BRI, RRI, and SMT), decision-makers can precisely allocate the required resources for the “demanding” GSCM practices with respect to the appropriate phase (i.e., timing). This can be performed by reducing the amount of resources dedicated to the GSCM practices in which resources are overutilized (i.e., saturated practices). Such strategic managerial actions can be executed with the aid of the three proposed strategies, as illustrated in the proposed SMT (
Figure 9). By following such an approach, practitioners can allocate more resources confidently to the independent GSCM practices (drivers) such as TOPM, GHRM, and ORGM because the current dedicated resources for these practices are below their requirements as “drivers”. Similarly, resources can be deducted confidently from the dependent GSCM practices such as QUAL, SP&D, ENVI, CUST, and SUPP. Such MCDM-driven practical/managerial approaches for resource allocation and/or strategy creation are applicable in many fields including sustainability [
154,
155,
156,
157].
In this study, opinion-based measures for big data were employed when carrying out fuzzy ANP and fuzzy TOPSIS. However, the employment of a data-driven approach would provide more accurate interpretations. To illustrate this, instead of using linguistic terms in measuring the GSCM practices with respect to the five Vs (
Figure 4), the volume of data, for example, can be measured in Terabytes (TB) or even Petabytes (PB), the velocity of the data can also be measured, for example, in TB per second (TB/s), and so. Another direction for future research can be investigated within the context of resource utilization. Specifically, the required resources for each GSCM practice can be cascaded into a further levels of details such as the types of resources to be utilized (human, technical, organizational, physical, or financial), as discussed and illustrated in [
118].


