
Multi-Spectral Food Classification and Caloric Estimation Using Predicted Images

Department of Electrical and Electronic Engineering, Konkuk University, 1 Hwayang-dong, Gwangjin-gu, Seoul 143-701, Republic of Korea
Foods 2024, 13(4), 551; https://doi.org/10.3390/foods13040551
Submission received: 5 January 2024
/
Revised: 7 February 2024
/
Accepted: 9 February 2024
/
Published: 11 February 2024
(This article belongs to the Special Issue Applications of Spectroscopy Combined Machine Learning in Food Quality and Safety)
Abstract
:In nutrition science, methods that accomplish continuous recognition of ingested foods with minimal user intervention have great utility. Our recent study showed that using images taken at a variety of wavelengths, including ultraviolet (UV) and near-infrared (NIR) bands, improves the accuracy of food classification and caloric estimation. With this approach, however, analysis time increases as the number of wavelengths increases, and there are practical implementation issues associated with a large number of light sources. To alleviate these problems, we proposed a method that used only standard red-green-blue (RGB) images to achieve performance that approximates the use of multi-wavelength images. This method used RGB images to predict the images at each wavelength (including UV and NIR bands), instead of using the images actually acquired with a camera. Deep neural networks (DNN) were used to predict the images at each wavelength from the RGB images. To validate the effectiveness of the proposed method, feasibility tests were carried out on 101 foods. The experimental results showed maximum recognition rates of 99.45 and 98.24% using the actual and predicted images, respectively. Those rates were significantly higher than using only the RGB images, which returned a recognition rate of only 86.3%. For caloric estimation, the minimum values for mean absolute percentage error (MAPE) were 11.67 and 12.13 when using the actual and predicted images, respectively. These results confirmed that the use of RGB images alone achieves performance that is similar to multi-wavelength imaging techniques.
1. Introduction
Understanding the nutritional content of foods consumed is important for the proper treatment of a variety of conditions, which is not limited to problems associated with metabolic diseases such as obesity [1]. To accomplish such an understanding, it is necessary to continuously monitor the type and amount of ingested food. Conventional methods of monitoring the type and amount of food consumed are manual recording methods [2,3,4]. Recently, diet-related apps have been implemented on mobile devices to make it easier for users. The accuracy of this approach, however, is affected by user error and inattention, which makes it less useful.
To partially solve this problem, several types of automatic food recognizers (AFRs) have been developed by which the amounts of and types ingested foods were continuously monitored with minimal user intervention. AFRs are divided into several categories based on what cues are used for classification. A technique that uses sound (acoustics) to identify food types is based on the sounds produced when food is chewed or swallowed [5,6,7,8,9]. Throat microphones [5,6] and in-ear microphone [7,8,9] were used as the acoustic sensors. When applying an HMM-based recognizer to acoustic signals recorded by a throat microphone to classify seven foods, a recognition rate of 81.5∼90.1% was reported [6]. In a food recognition study using an in-ear microphone, it was reported to achieve an accuracy of 66∼79% for seven different foods [8]. However, since it is difficult to distinguish different foods based on acoustic signals alone, there are limits to what can be achieved with acoustic cues.
Since foods have their own unique shapes, textures, and colors, visual cues have been used to classify food types and estimate portion sizes [10,11,12,13,14,15,16,17,18,19,20,21]. From a classical vision-based pattern recognition perspective, automatic food classification is implemented through a series of processes: segmentation, feature selection, and classification of food images. As neural networks have been applied to various image recognition tasks, attempts have been made to use artificial neural networks (ANN) to categorize food types [14,19,20] and estimate the calorie content of foods [14,18,21]. Caloric estimation using visual cues is based on the following assumptions: (1) The calorie counts per size (weight) of a food are uniquely determined by the food item. (2) Food items can be identified primarily by their appearance. (3) The size of a food can be estimated from visual information. When using a convolutional neural network (CNN) to classify foods and predict calories for 15 different food items, it was found to be more accurate than classical pattern recognition [14]. Previous image-based food analysis techniques have primarily used RGB images acquired under visible light. This method has the advantage of easy image acquisition, but it is limited by poor food recognition accuracy for visually similar foods. Another limitation is the inability to utilize the specific response that certain foods emit to ultraviolet and infrared light.
To overcome these limitations, food analysis based on multispectral analysis has been widely adopted [22,23,24,25,26,27,28,29,30,31,32,33,34,35,36,37]. The basic principle is that each individual ingredient of a food has a unique absorption spectrum. Typically, water has a distinctly higher level of absorption in the IR region compared with that in the visible light region. Multispectral analysis has also been used to quantify various food components such as oil, water [22], vinegar [25], soluble protein [35], and sugar [26,27,28,29,30,31,32,33,34]. Such methods, however, required spectrometers, light sources, and hyperspectral image acquisition equipment, which led to problems such as cost, size, and power consumption, making it difficult to implement on wearable devices.
Multispectral imaging is a method of acquiring individual images from a single wavelength light source, including the UV and near-infrared (NIR) regions, and using them to analyze food [29,37]. This method does not require equipment such as a spectrophotometer and is easy to implement using an optical camera with several LEDs and a silicon imaging sensor, which allows an analysis of food using an approximated light absorption distribution. In a study of detecting vinegar and dressing oil on the surface of lettuce leaves using a light source composed of 10 LEDs with different wavelengths, an accuracy of 84.2% was achieved when using five LEDs [25]. Multiwavelength imaging techniques have been widely applied to the detection and quantification of various components in food. (e.g., sugar in sugarcane [27], water in beef [22], sugar in peaches [28], soluble solids in pomegranates [31], sugar in apples [26], sugar in black tea [33], sugar in potatoes [32], and soluble protein in oilseed rape leaves [35]). The calorie content of a food can be calculated from the estimated amount of each ingredient.
In this study, we applied multiwavelength imaging techniques to the task of categorizing foods and estimating their caloric content. The feasibility of using NIR/UV images for food classification and caloric estimation was verified in terms of accuracy. This was especially true for similar looking foods. Despite the many advantages of multi-wavelength imaging techniques, several issues remain that should be addressed for practical implementation using small wearable devices. Since the number of wavelengths is related to the resolution of the absorption/reflective spectrum of a multiwavelength image, accomplishing accuracy in food analysis makes it highly preferable to use as large a number of wavelengths as possible. Using many wavelengths, however, increases the problems associated with light source control along with drive circuitry, which leads to problems such as large bulk, high power consumption, and heat generation. Another issue is the increased time required for food analysis. Even if the analysis itself is completed in a very short time, the total acquisition time of the image (before analysis) increases linearly with the number of wavelengths applied. When the above issues are considered, choosing a smaller number of wavelengths is preferable from the perspective of practical implementation.
In the present study, we focused on ways to mitigate the challenges caused by acquiring multi-wavelength images while retaining the advantages of multi-wavelength imaging. Previous work has investigated the use of RGB images to estimate other types of images, such as depth distribution [38,39] and semantic segmentation map [40]. An attempt has also been made to use RGB images to predict IR images for the visualization of vegetation map [41,42] and vein patterns [43]. In the present study, we proposed a method that uses image conversion techniques to produce single-wavelength predictions of UV/NIR images from RGB images to accomplish food classification and caloric estimation. Before recommending such a method, there was a clear need to guarantee that the single-wavelength images estimated from the RGB image would approximate the actual images. Therefore, we evaluated the performance of image conversion for a variety of everyday foods with respect to the accuracy of food classification and caloric estimation.
2. Materials and Methods
2.1. Data Acquisition
The types of foods used in this study are listed in Table 1, along with their calorie counts. The foods used in the experiment were selected from everyday foods, taking into account various physical properties and health effects. Calorie counts for each food were calculated using the calorie-per-weight value and measured weight, if Nutrition Facts are available. For foods without nutrition facts, calorie values were calculated using various nutritional information (food composition, calorie-per-weight, cooking method, etc) published by the Korea Food and Drug Administration (KFDA) [44] and measured weights. Actual measured caloric values were accomplished without using the food analysis equipment in this study, because unevenly distributed food ingredients could lead to different values depending on the sample location. Moreover, the objective was to estimate representative caloric counts using visual cues, and it was reasonable to use values measured by a recognized organization. All liquid foods were captured by placing the same amount of food in the same cup. This was done to suppress the adverse effects that could be caused by different cup shapes and volumes on food classification and caloric estimation. There were many food pairs that were visually similar but nutritionally different, such as (coffee, coffee with sugar), (cider, water), (tofu, milk pudding), (milk soda, milk).The usefulness of UV and NIR images for food classification and caloric estimation was effectively demonstrated by the selection of these foods.
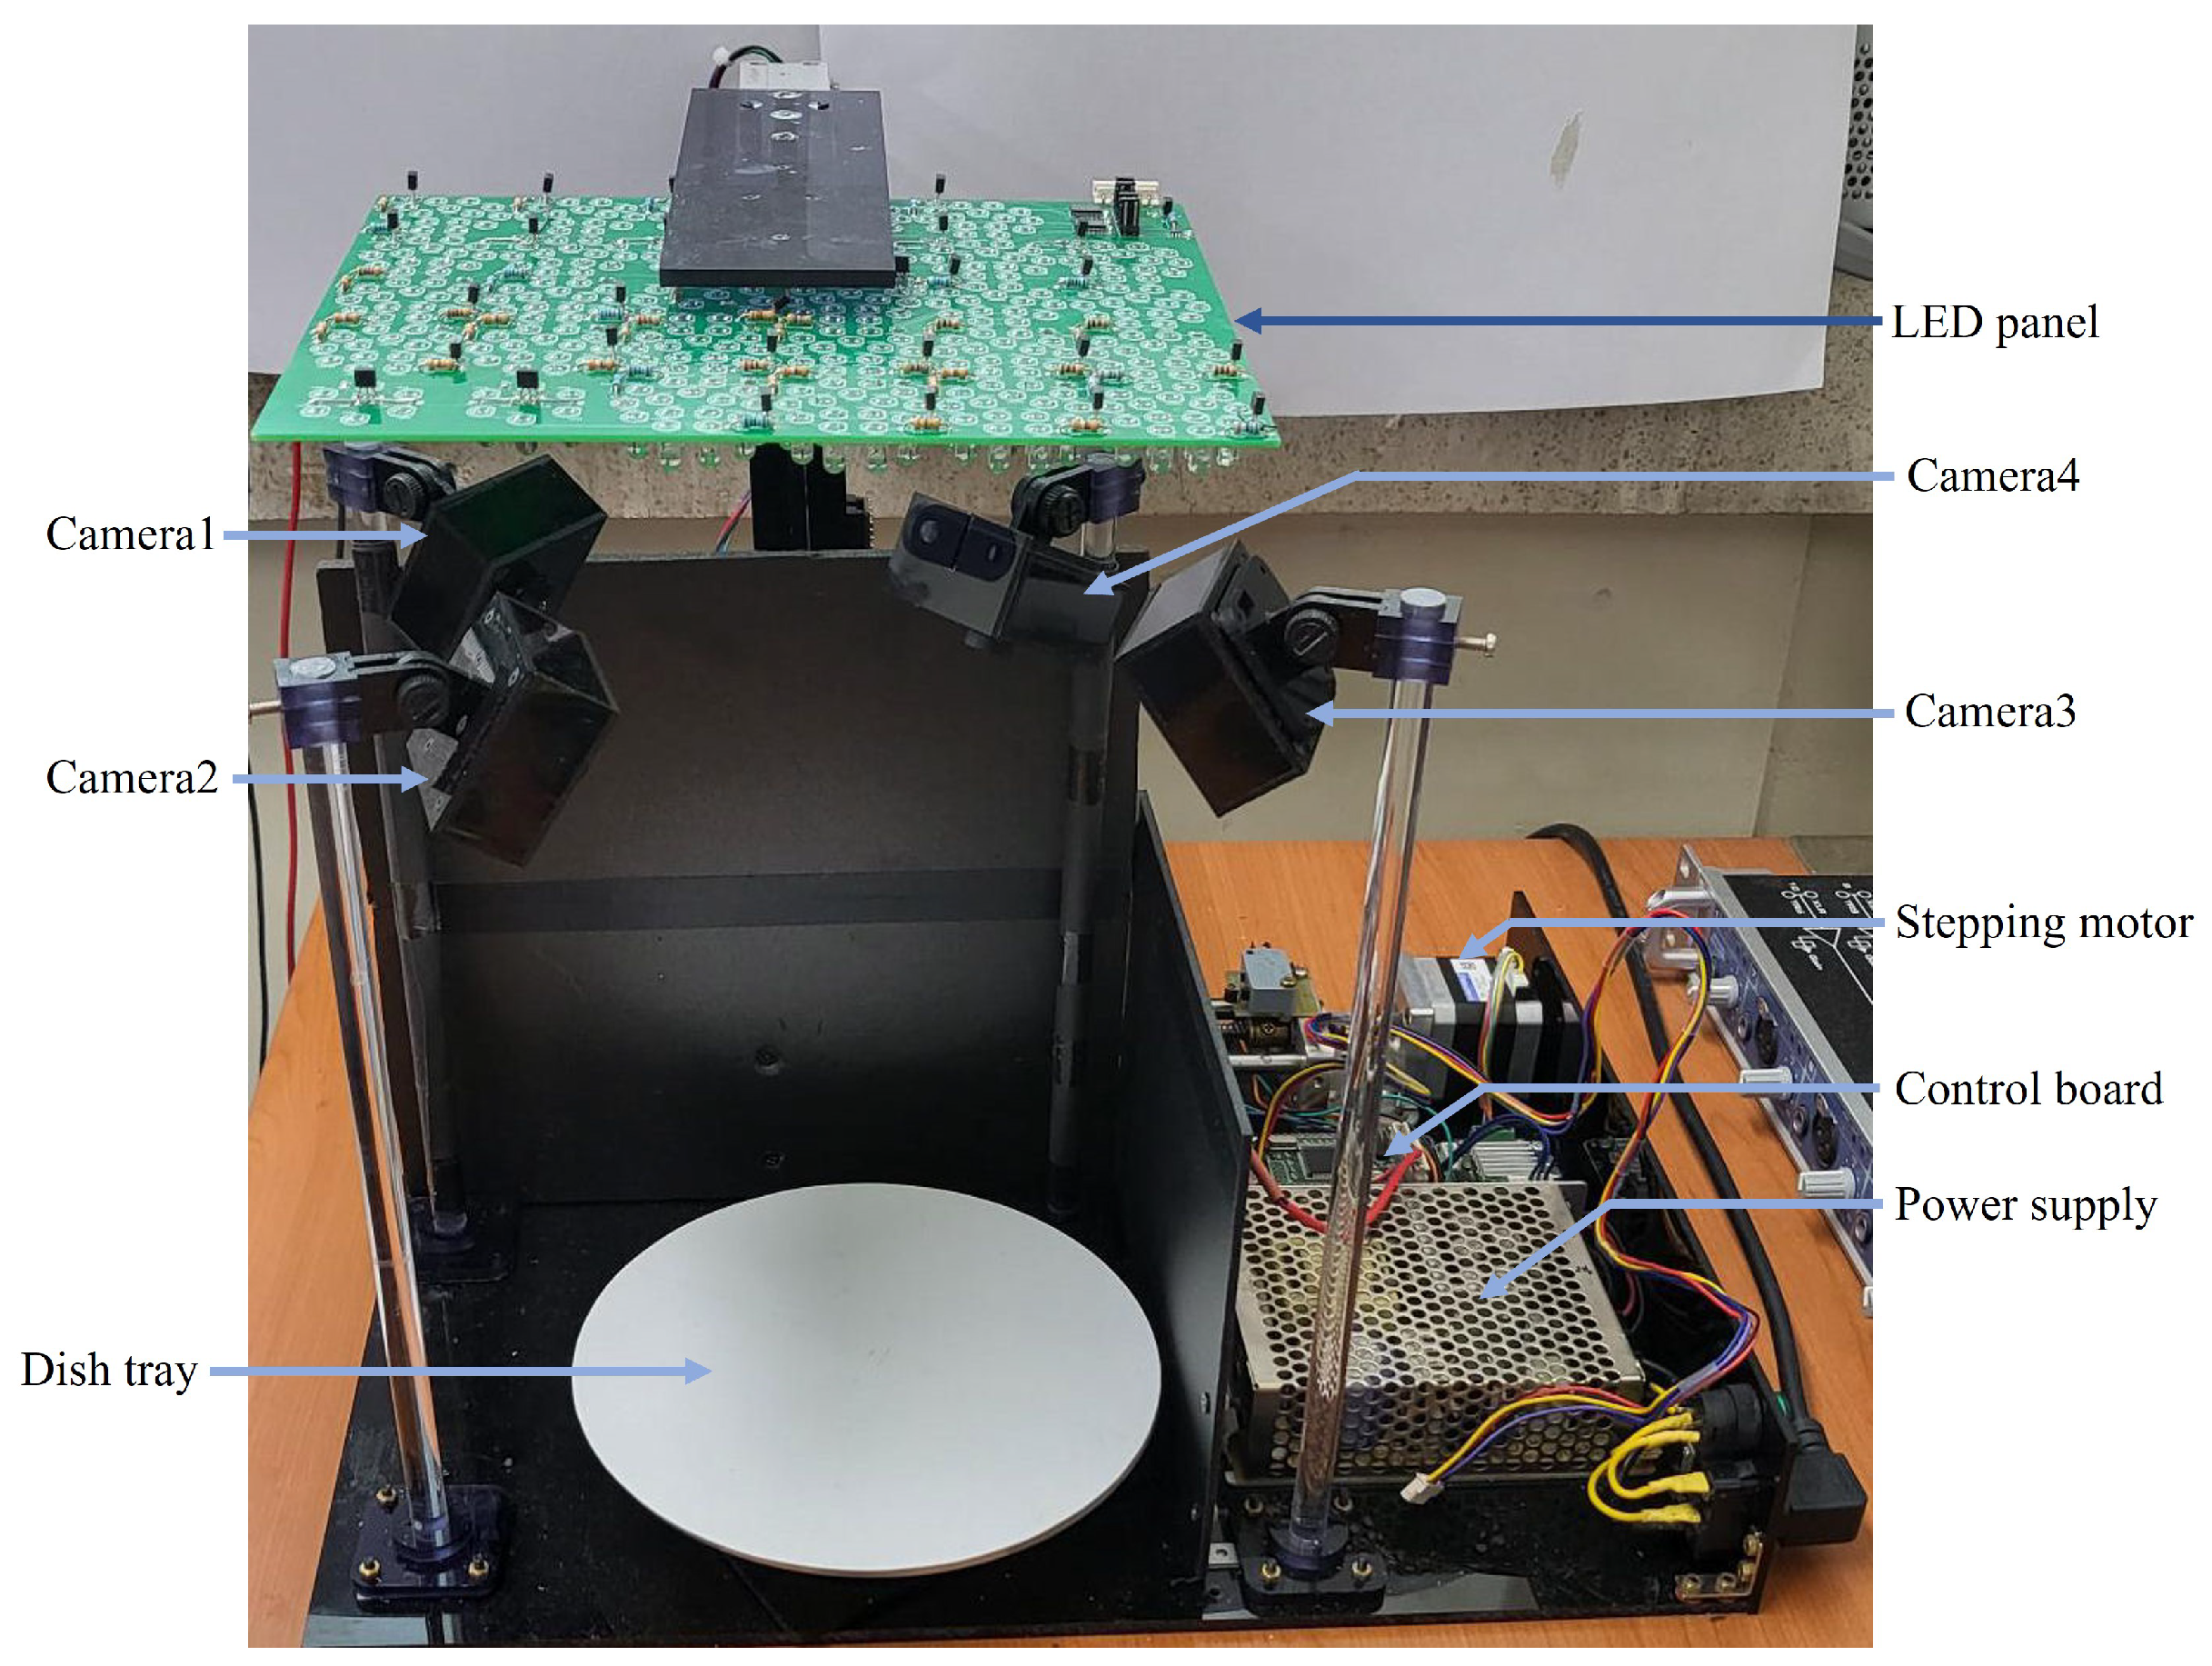
The acquisition of multispectral images was achieved by using a custom-made image acquisition system shown in Figure 1. The food was placed on a tray and the distance between the tray and the light source was approximately 25 cm. Four digital cameras (Arducam 1080p, Nanjing, China) were used, each facing the center of the food tray, with an acquired image size of 640 × 480 pixels (HV). The camera was equipped with a CMOS imaging sensor (Omnivision OV2710, Santa Clara, CA, USA) had a field of view of 100° × 138° (HD). The depth of each pixel was represented at 16 bits.
Each camera was equipped with an IR cut filter that was activated by an external control signal. By using this, visible light was blocked when capturing NIR images. The light source was made up of a total of 20 LEDs (Marubeni 5 through hole-type, Chiyoda-ku, Tokyo, Japan) emitting different wavelengths of light (385, 405, 430, 470, 490, 510, 560, 590, 625, 645, 660, 810, 850, 870, 890, 910, 950, 970, 1020 nm, and white). The wavelengths were chosen to ensure that the quantum efficiency of the image sensor in the camera used was at least 10%. The white LEDs were used to acquire the RGB images and the other LEDs were intended to obtain the images of the corresponding wavelengths. Each light source consisted of 10 white LEDs and 30 LEDs for each wavelength. The light source for each wavelength was shaped like a circle with a diameter of 42 mm. This was calculated from the radiation angle of the adopted LEDs and the distance between the light source and the food so that entire area of the food tray was illuminated. The center of the light source at a specific wavelength was shifted to that of the food tray before image acquisition at that wavelength. A linear stage driven by a stepping motor (Sanyo-Denki SF2422-12B41, Toshima-ku, Tokyo, Japan) was used to move the light source.
Data augmentation in previous studies was achieved primarily through artificial image transformation. In this study, however, four separate cameras and a rotating table were employed to obtain real images from as many angles as possible. The angular resolution of the rotary table was adjustable from 1 to 30°. A microcontroller that received control commands from a desktop PC performed all operations of the acquisition system, including moving the LED panel, rotating the table, and turning on and off each LED. Two datasets were prepared for food classification and calorie estimation, respectively. The individual data in the first dataset consisted of image-food item pairs, and the individual data in the second dataset consisted of image-calorie value (presented in Table 1) pairs. For foods without nutrition facts (bread and butter, coffee with sugar, sweet milk, steamed pork, steamed rice, rice cake, rice cake and honey, and salad1 with olive oil), the calorie count was calculated by the following process:
- (1)
- Get the nutritional information for the individual ingredients in the food.
- (2)
- Measure the weight of each ingredient in the food.
- (3)
- Calculate the total calories using the nutritional information and the weight of each ingredient.
- (4)
- Mix the ingredients sufficiently (in the case of mixed foods) and acquire the image.
For foods for which nutrition facts were provided, calories were calculated using only the measured weight and nutrition information for the food.
2.2. Food Classification and Caloric Estimation
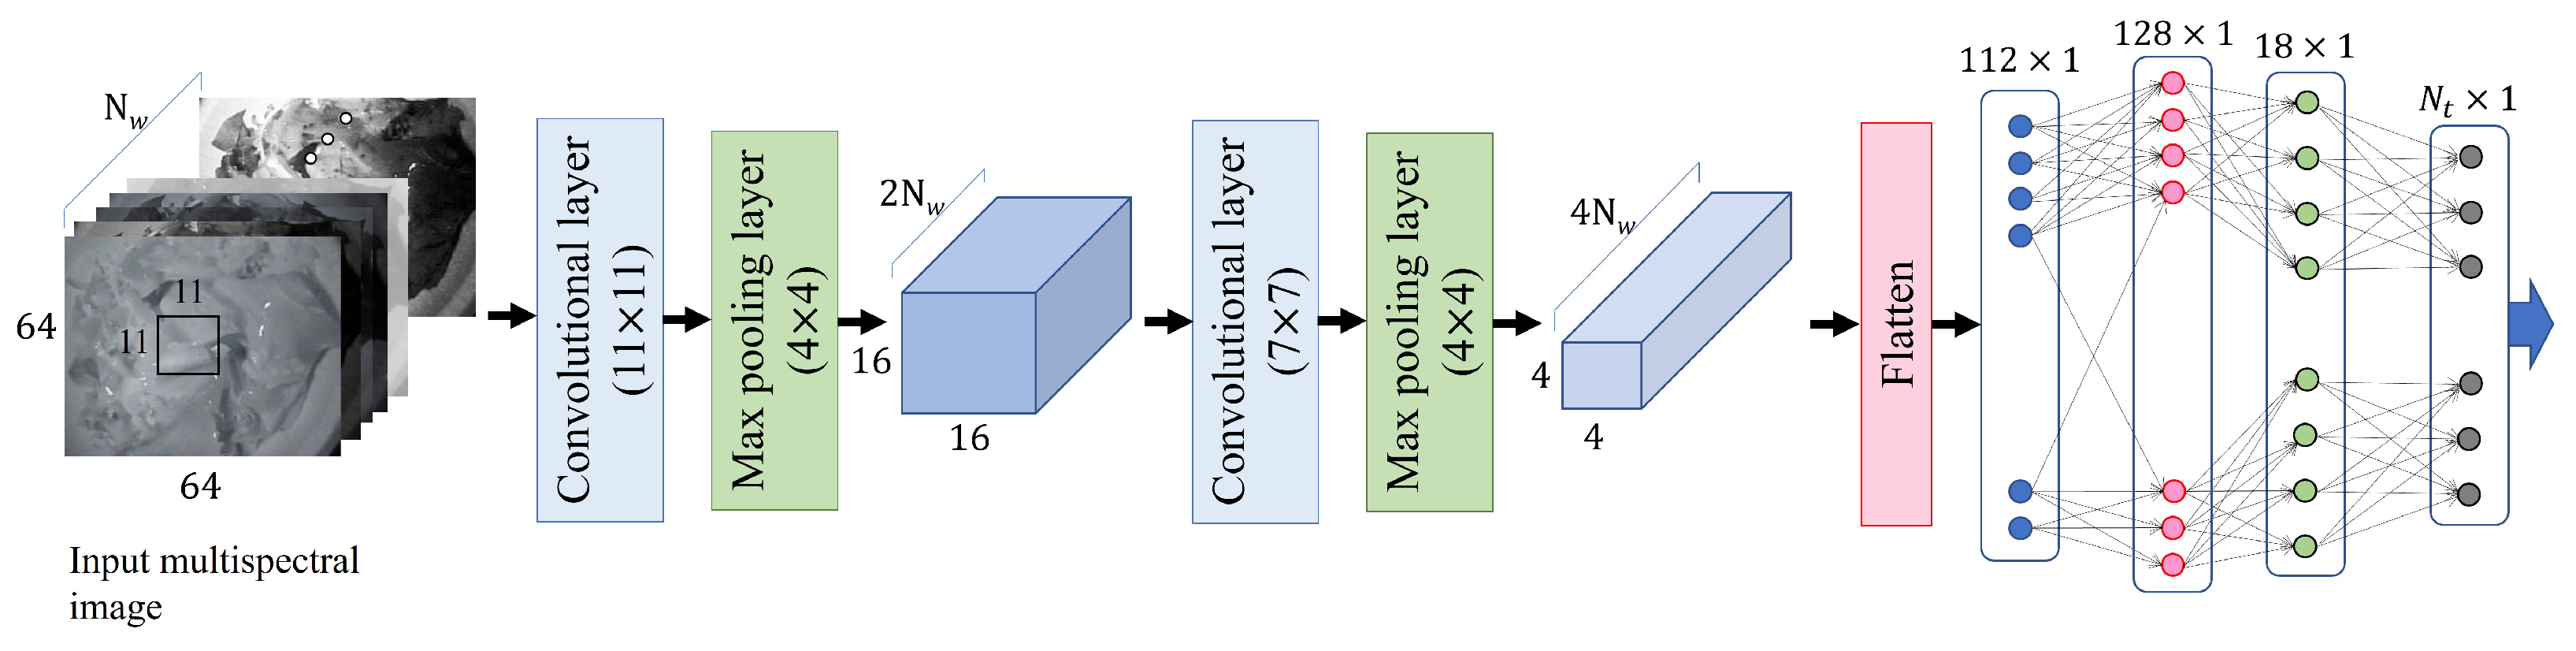
Automatic food classification can be formulated as a general pattern recognition problem based on images. In the multi-wavelength approach, instead of using just one of the RGB images, a combination of images acquired at each wavelength was used to classify the food items or to estimate the specific ingredients or calories in a particular food. Accordingly, two issues should be considered: the design of the pattern recognition methods particularly for food images and the optimal wavelength combinations in terms of food classification/analysis. In the present study, convolutional neural networks (CNNs) were employed to classify food images. A validation dataset was used to heuristically determine the architecture of the CNN (Figure 2). The ratio of the number of images in the validation and learning datasets was 1:10. Since pattern recognition was performed within a single category of food recognition, the resultant CNN had a relatively simple architecture compared with previously developed CNNs (e.g., VGG-16 [14], ResNet152+ANN [19], Inception-v3) that considered a variety of images and categories.
Rather than the full size of an image, it was experimentally confirmed that a reduced image (64 × 64) was more beneficial in terms of classification/estimation accuracy. No cropping was needed to extract the food portion. Accordingly, the steps for classification and estimation could be carried out on the entire image, which included both background and food.
A rectified linear unit (ReLU) was used as the activation function for all of the hidden layers. For the output layer, a soft-max function and a linear combination function were adopted for food classification and caloric estimation, respectively. The loss function for caloric estimation was given by the mean absolute percentage error (MAPE). The MAPE in calories for the i-th food item is given by
where and are the estimated and true calories, respectively, for the i-th food item. As for food classification, the cross-entropy was adopted as the loss function. As shown in Table 1, some foods have a reference caloric value of zero, in which case the MAPE cannot be calculated. In the present study, a caloric amount of zero was replaced with a minimum value of 5 (kcal), as defined by [44]. When training CNNs for both caloric estimation and food classification, the losses converged when the number of epochs exceeded 1000. The mini-batch size was set to 32, which produced the best performance in all cases.
Although the determination of the optimal wavelength combination was an offline process, training and evaluating a CNN for every combination of wavelengths was very time consuming. In this study, a piecewise selection method [45] was used to reduce the time to determine the optimal combination as opposed to obtaining similar results by using a brute-force grid search. A piecewise selection method is basically an incremental construction method. The set of wavelengths is constructed step by step by adding or removing wavelengths either to or from the previously constructed set.
2.3. Prediction of UV/NIR Images Using RGB Images
In food analysis, UV/NIR images have many advantages over optical RGB images from a complementary perspective, but there are some issues that must be addressed from an implementation perspective. Compared with RGB images that can be acquired under natural light, capturing UV/NIR images requires a separate light source that emits light in that specific range of wavelengths. This means a separate space and drive circuit for the UV/NIR light source is required, which is problematic for smaller-sized wearable devices. The camera employed in this study has a quantum efficiency of more than 40% in the 385–1020 nm wavelength band, which eliminates the need for additional UV/NIR cameras. Images for each wavelength cannot be simultaneously acquired, however, and must be gathered in separate acquisition instances. As the number of wavelengths increases, image acquisition time increases, which can lead to issues such as camera displacement effects during acquisition, as well as to long periods of time needed for analysis. This means that achieving high performance in food analysis comes at the cost of increased hardware complexity and longer analysis times.
If it is possible to obtain UV/NIR images from RGB images, the benefits of UV/NIR imaging for food analysis could be realized with much less time for acquisition and with no changes in hardware. Previous studies have demonstrated the feasibility of using RGB images to predict a different domain for its application-specific representation [41]. This study aims to improve the accuracy of food classification and caloric estimation using UV/NIR images predicted from RGB images instead of captured (real) UV/NIR images by using the image conversion techniques.
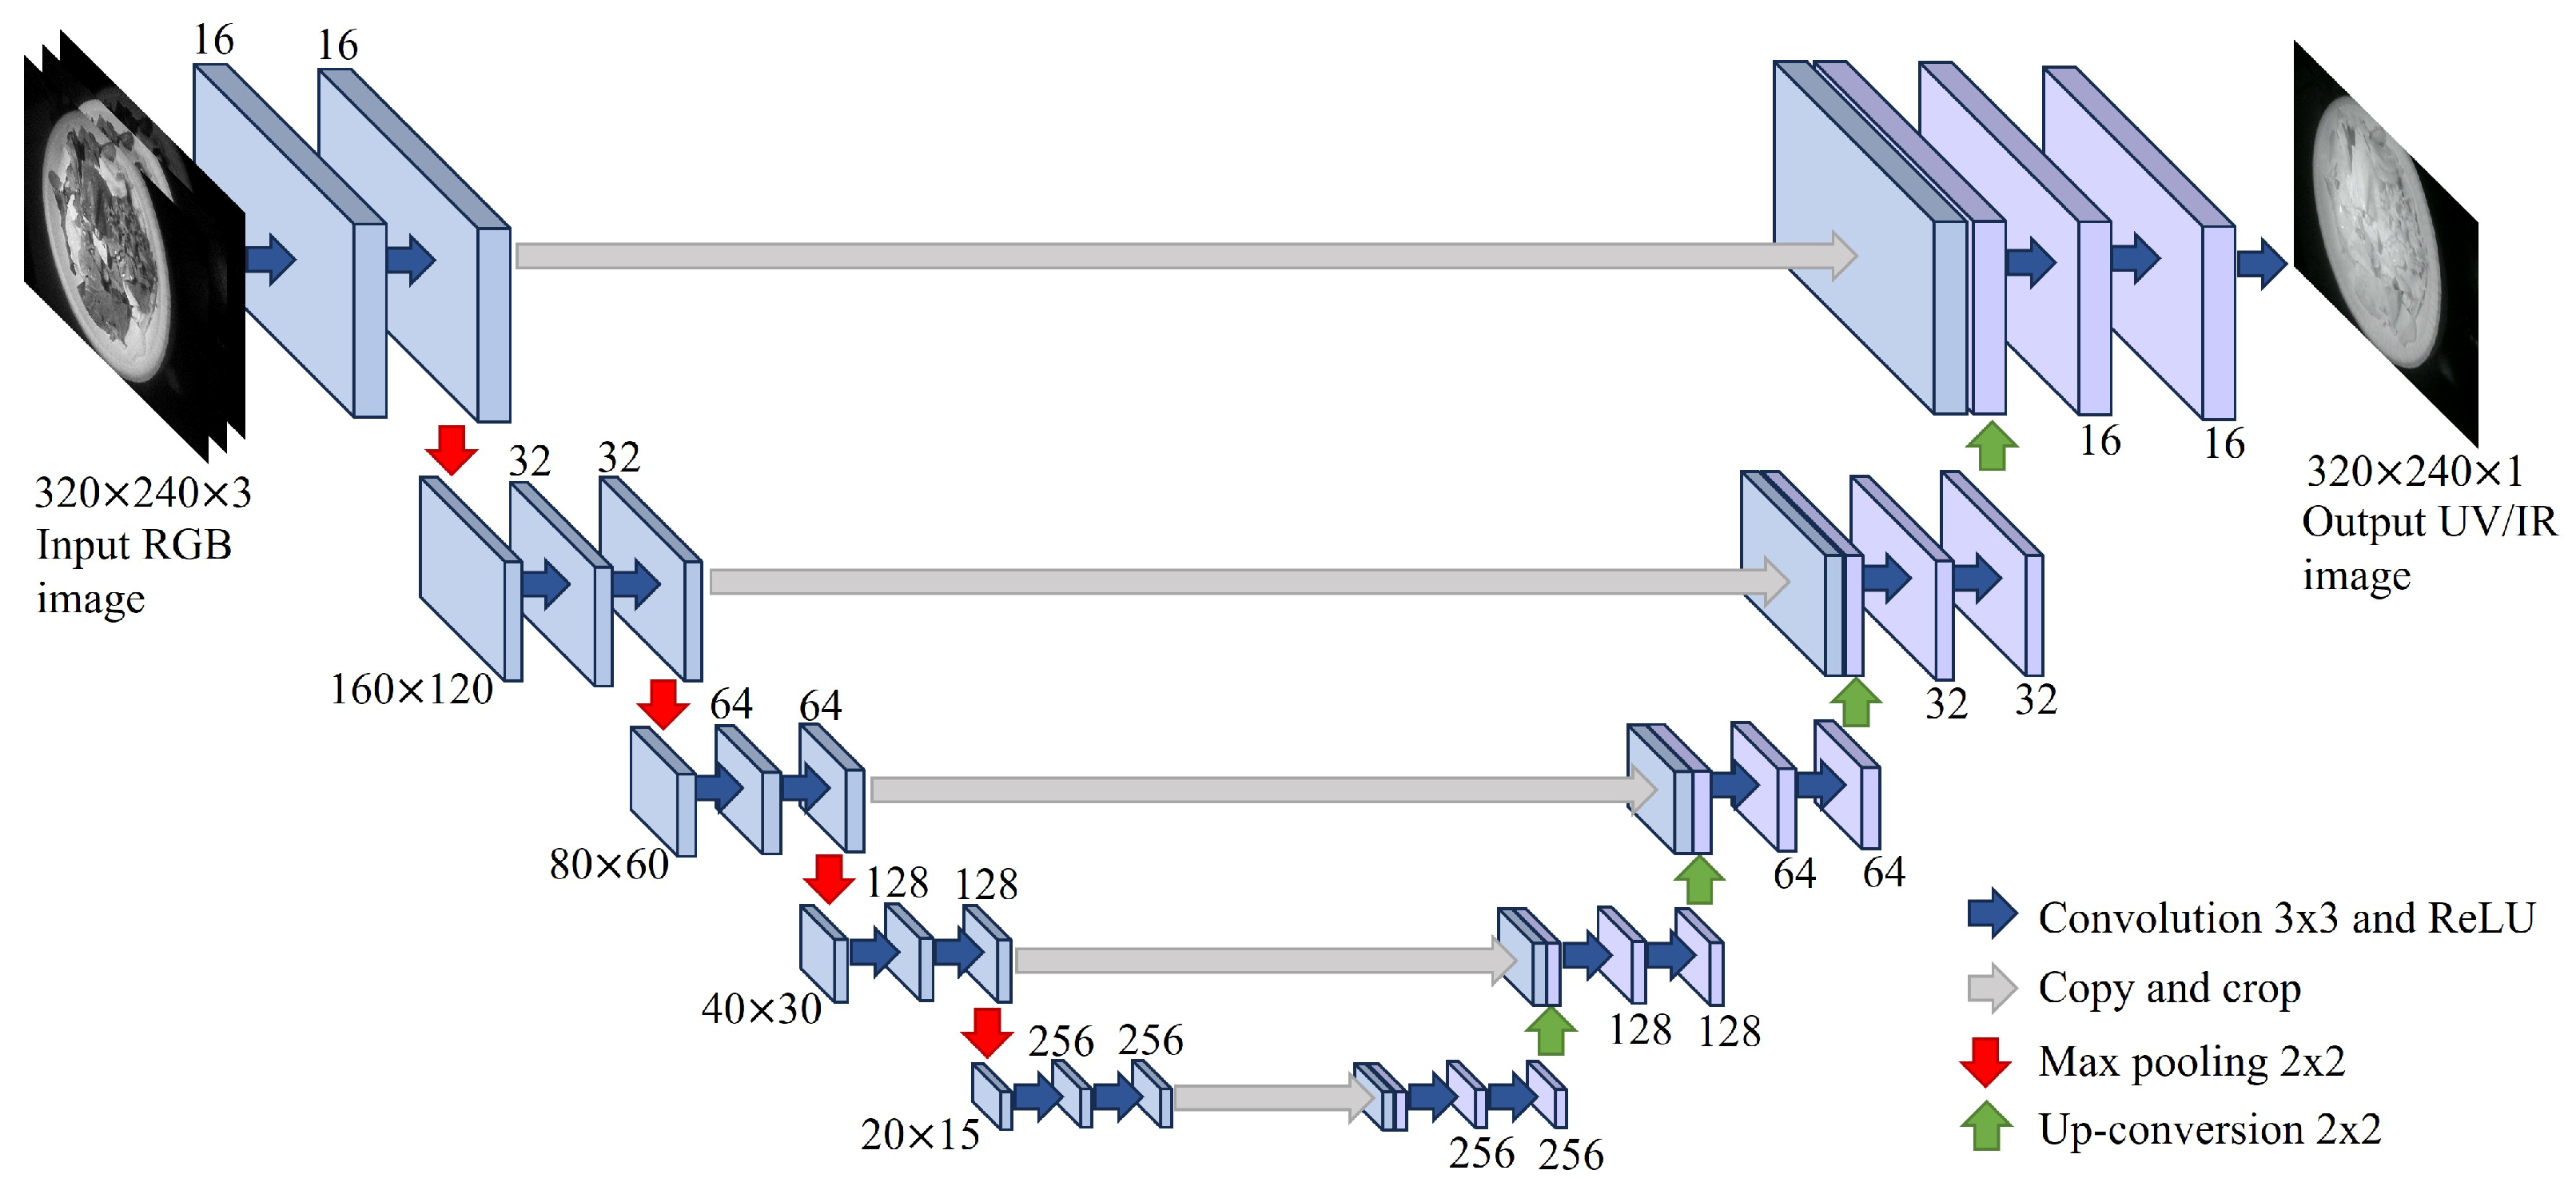
Using RGB images to estimate UV/NIR images could be basically be formulated as a problem of finding the pixel-by-pixel mapping rules between the two images. This is based on the assumption that a large amount of low-level information, such as the location of edges, is shared between the two images [43]. Despite the existence of shared information between the two images, each image has unique characteristics that cannot be explained by a simple dependency relationship. Therefore, it was reasonable that the correspondence between the two images was represented by non-linear mapping rules such as those of deep neural networks [38,40,41,42,43,46]. Similarly, a CNN was adopted to estimate UV/NIR images from RGB images in the present study. The CNN architecture used in this study is shown in Figure 3, which basically is similar to that of U-net [46]. In a previous study, a dual encoder-decoder based architecture with different depths [41] and conditional generative adversarial networks [42,43] was employed to estimate NIR images from optical RGB images. These two architectures were tested in terms of food recognition and caloric estimation accuracy on the image dataset used in the present study. No clear performance advantage over the structure shown in Figure 3 was observed in our experiments. A small modification was made to the architecture of the original U-net to meet the objectives of the present study (food classification and caloric estimation). At each layer, the convolution kernel size (3 × 3), image depth (3-16-32-64-128-256-256-128-64-32-16-1) and pooling type (2 × 2 max pooling) was determined empirically using the validation dataset.
A backpropagation algorithm using the Minimum Mean Square Error (MMSE) Square Error (MMSE) criterion was used to train the CNN. The objective function is given by the mean square error between the estimated and the actual UV (or NIR) images, as follows:
where is the output of the CNN with a set of kernels where the input RGB image is given. denotes the target image (UV or NIR image) at frame index n and N is the total number of training images. In order to improve the learning convergence, a stochastic gradient descent algorithm was performed in mini-batches with multiple epochs. The updated estimate of the set of kernels with a learning rate is iteratively calculated as follows:
For image-to-image conversion, there are several metrics that could be employed to evaluate the performance of a trained neural networks. In this study, however, performance should be evaluated in terms of caloric estimation and food classification accuracy rather than how visually similar the estimated images are to the actual image. To this end, each metric was quantitatively analyzed for estimation accuracy to determine which had more significantly appraised the performance. The results are presented in the following experimental results section.
3. Experimental Results
3.1. Image Conversion
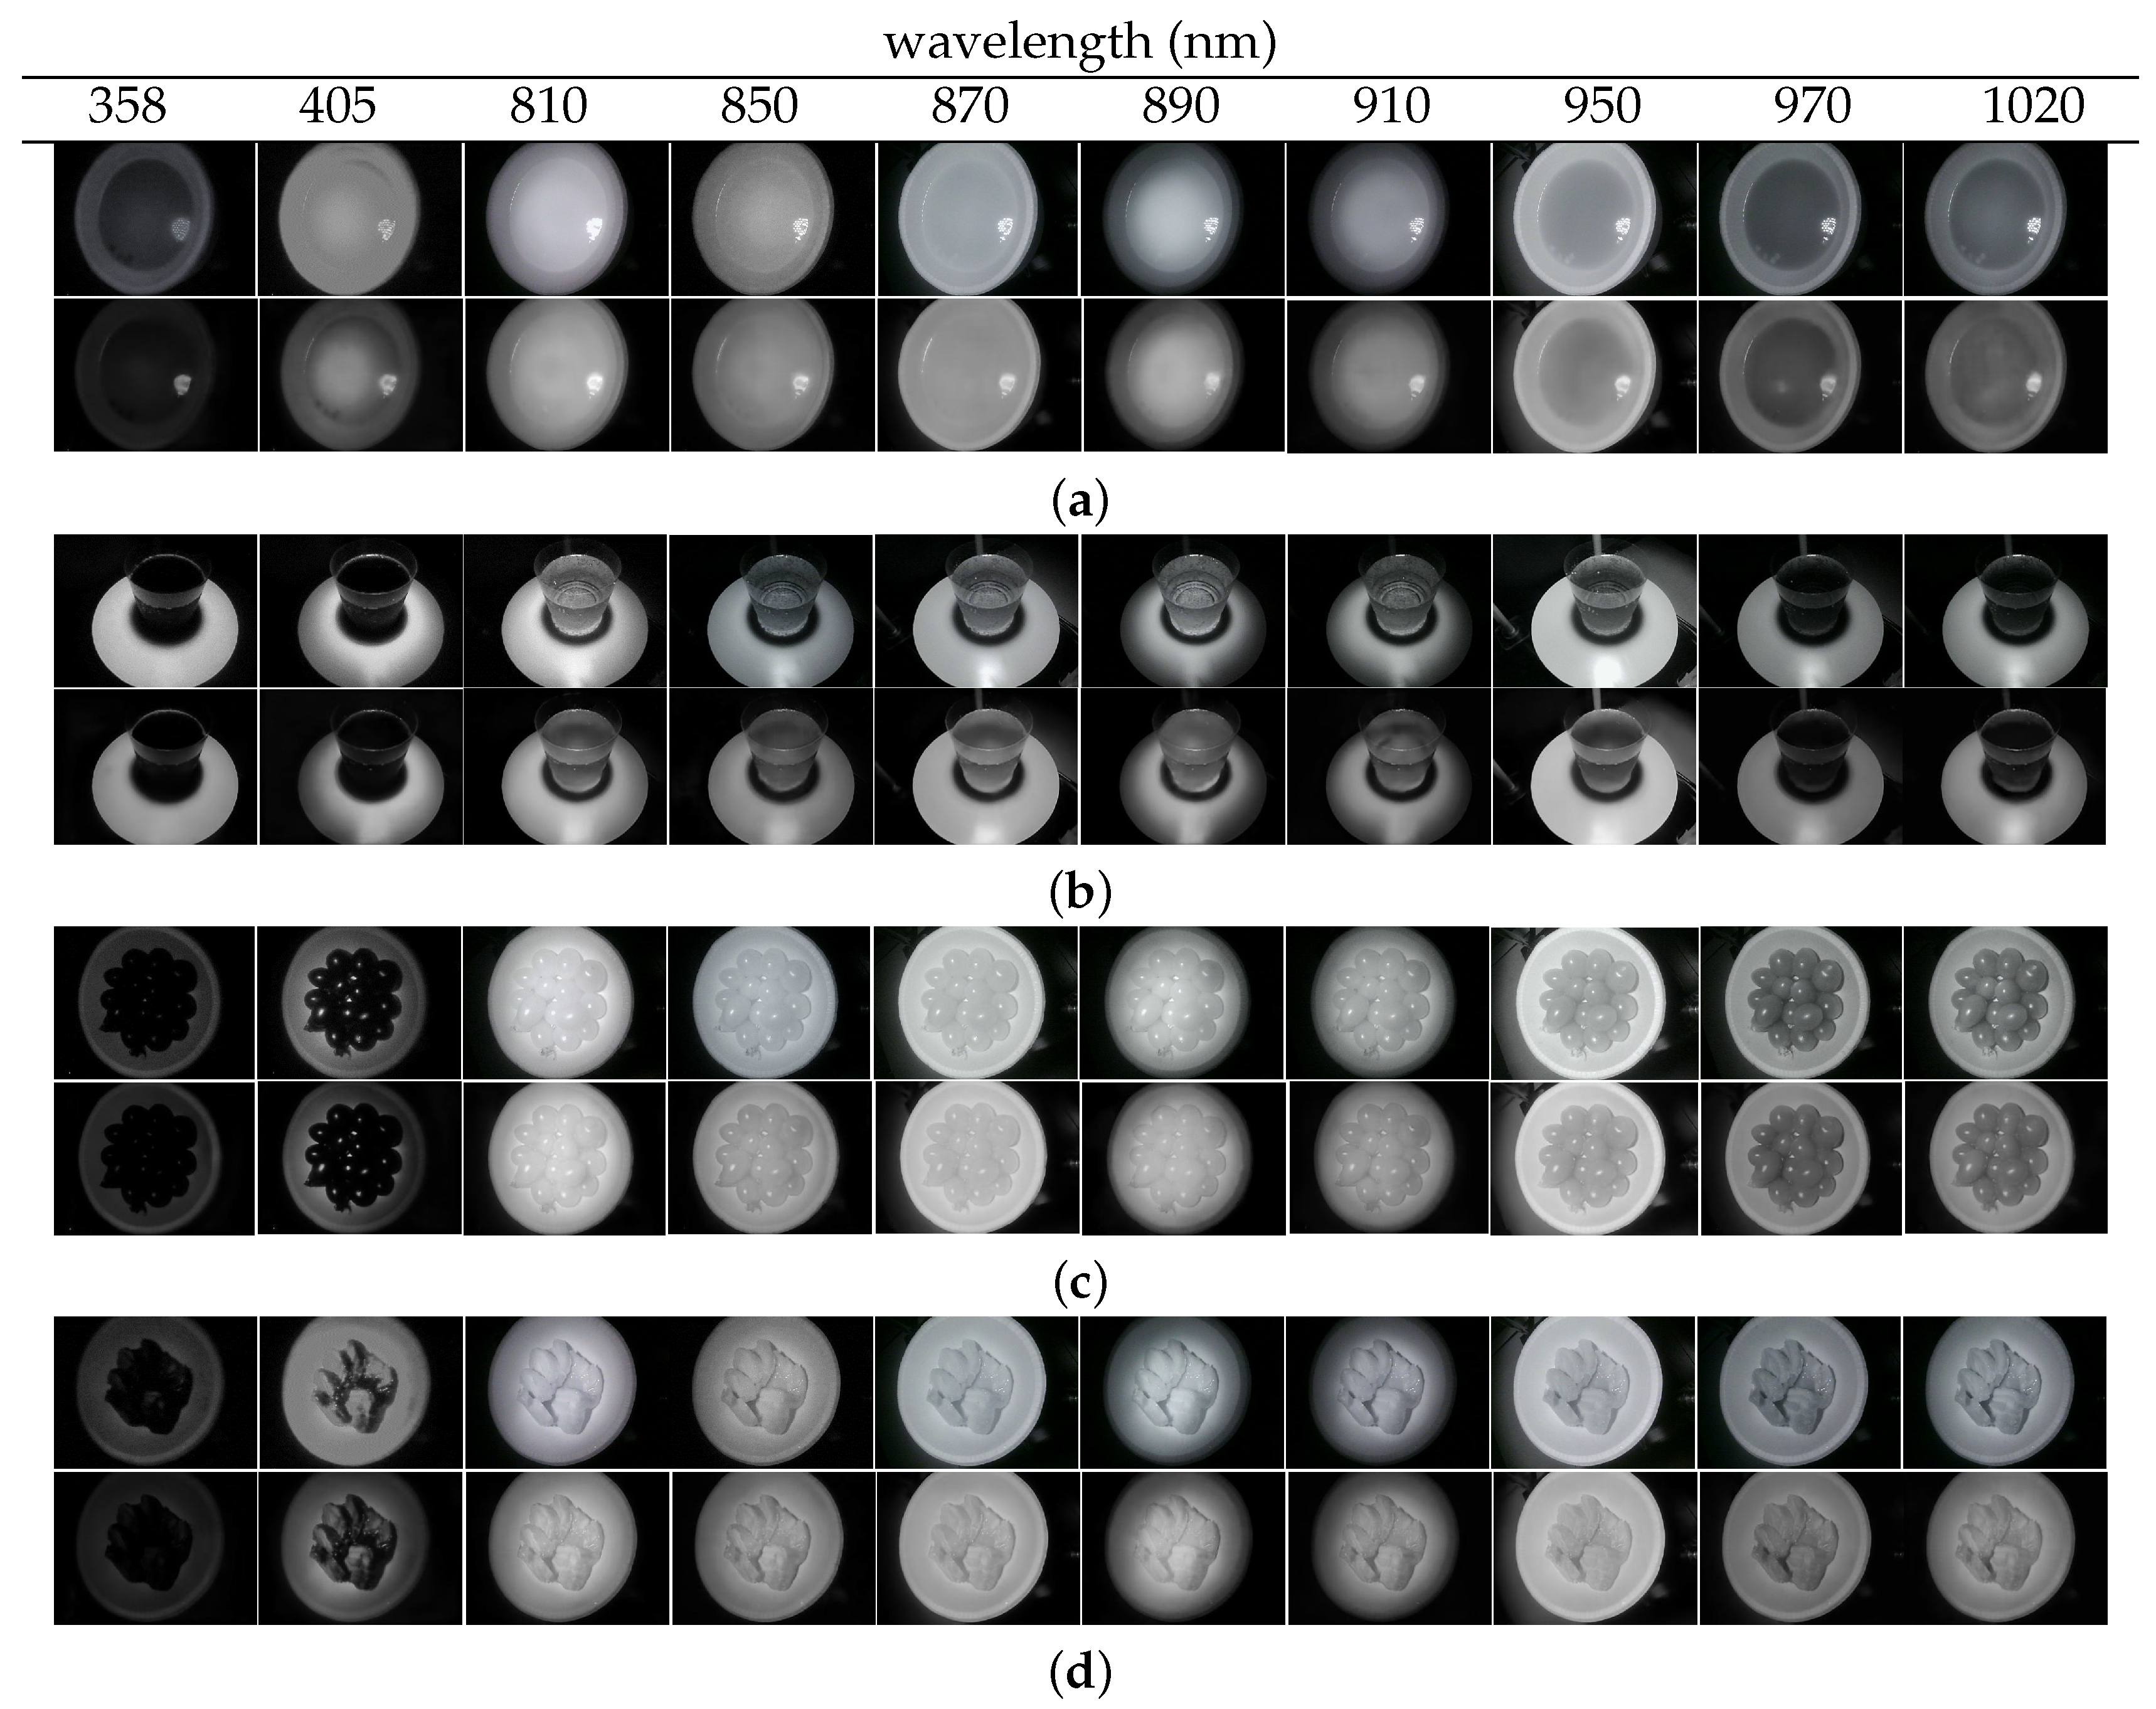
We first evaluated the performance of the image conversion (RGB-to-UV and RGB-to-NIR). A total of 10,908 pairs of RGB-(UV/NIR) images were used to train the CNN for image conversion, and 3636 RGB images were evaluated separately. The wavelengths targeted for conversion were 385, 405, 810, 850, 870, 890, 910, 950, 970 and 1020 nm, with an equal number of images in each wavelength. Objective measures used to evaluate the conversion performance included peak signal-to-noise ratio (PSNR) and structural similarity index mapping (SSIM) [47]. The results appear in Table 2. The PSNR showed values that approximated 30 dB for all wavelengths except for 385 nm. The highest PSNR of 34.28 dB was observed at the 385 nm wavelength, which correspondingly had the lowest error. When similar values for SNR were observed at all wavelengths, this was due mainly to the fact that the morphological characteristics of similar food items were not changed, and only the brightness values within each boundary of the image were affected. In applications such as image compression, if the PSNR of the restored image is close to 30 dB, the corresponding image is visually similar to the original image without unnoticeable distortion. Thus, the experimental results indicate that the image at each wavelength predicted by RGB could serve as a substitute for the actual acquired image from a visual perspective. The SSIM values for each wavelength also showed no significant deviation from the overall average. However, the SSIM showed behavior that differed slightly from that of the PSNR. The maximum SSIM was obtained at 810 nm. The SSIM was lowest at 405 nm, but the PSNR was relatively high (31.05 dB) at that wavelength. Although the target image was different, the results are generally similar to previous RGB-to-NIR image conversion techniques (e.g., SSIM value of 0.847 at 820 nm [42]).
Examples of the UV/NIR images predicted from RGB images appear in Figure 4, along with the actual captured images for comparison. As shown in the figure, the predicted images are in close visual agreement with the actual images acquired by the camera. These results were somewhat expected based on the objective metrics. However, some spots in areas of uniform brightness (e.g., the coke region in the “coke image”) were occasionally found in the predicted image.
3.2. Food Classification
The correct classification rates for food images according to the number of wavelengths when using actual images from the camera appear in Table 3. For comparison, the four different NN architectures using RGB images alone were tested, which included VGG-16 nets [14], ResNet152+ANN [19], and a wide hierarchical subnetwork-based neural network (WI-HSNN) [20]. The output nodes of these neural networks were adjusted to match the number of food items adopted in this study, and the classification accuracy was compared with the proposed NN architecture. All images, except for the RGB images, were acquired from UV and NIR light sources.
The four neural networks using only RGB images showed similar classification accuracy, as shown in Table 3. The proposed neural network architecture revealed only a 0.81% difference in classification accuracy compared to the WI-HSNN, which showed the highest accuracy. The results showed that the addition of just a single wavelength image at 970 nm to the RGB image increased the recognition rate by 10.32%. This was due primarily to a significant increase in recognition rates for food pairs that looked very similar but had differences between the UV or NIR images [45]. The highest recognition rate was 99.45% when recognition was performed using eight single-wavelength images in addition to the RGB image. When all wavelengths of images (11 including the RGB image) were used, the recognition rate was slightly lower than its maximum, which was likely a result of overtraining due to excessive image usage. The correlation coefficient between the recognition rate and the number of wavelengths was 0.767, which indicated a significant increase in the recognition rate with the number of wavelengths. However, this also indicated that increasing the recognition rate comes at a cost: more lights, more image acquisition time, etc.
As a way to solve this problem, the results of food recognition obtained by using the predicted UV/NIR images from RGB images are presented in Table 4. The average PSNRs and SSIMs are also presented as prediction performance metrics for images at each selected wavelength. As with using the actual captured image, adding the predicted single-wavelength image improved the classification rate by 5% over using the RGB image alone. The maximum accuracy was obtained when all single wavelength images were combined with the RGB image to train the neural network for food classification, with a value of 98.24%. It is noteworthy that in this case, all single-wavelength images were obtained from RGB images, so there was no need to increase either the acquisition time or the number of wavelengths (or, equivalently, the number of light sources) as when using actual images. The selected wavelengths were different from when actual images were used and the classification rates were slightly lower than when using actual images. The difference in the maximum classification rate between the two cases (using actual or predicted images) was only 1.21%. Using the actual images, however, would require a total of nine image acquisitions, which implies nine different LED light sources and a nine-folds increase in acquisition time.
The relationships between each of the image conversion metrics and the recognition rates were also analyzed. There was a positive correlation between the PSNR and the classification rate, with a value of 0.340, which is insignificant. The correlation coefficient between SSIM and the recognition rate was −0.522, which means that even if the predicted image approximates the actual image in terms of SSIM metrics, the recognition rate could be worse. These results suggest that the metrics employed for image prediction are not significantly related to recognition rate.
The experiment was also conducted in which the conversion rules (RGB-to-UV, RGB-to-NIR) from the images acquired in this study were applied to the images in the well-known food image dataset, such as FOOD-101. Since the reference images (single wavelength images) were not available in FOOD-101, it was impossible to evaluate the performance of image conversion in terms of PSNR, SSIM, etc. However, meaningful performance improvements were achieved, when food classification rules were constructed using the estimated UV/NIR images. This indicates that although the conversion rules were not built from the FOOD-101 dataset, these conversion rules were useful for multi-wavelength food classification for the FOOD-101 dataset.
3.3. Caloric Estimation
The results of estimating calories from images of food appear in Table 5 when training a neural network using RGB images alone and UV/NIR images together. In the case of using RGB image alone, the VGG-16 nets with the linear activation function at the output node [14] was also tested for comparison. The two neural networks using only RGB images reveled similar performance in terms of MAPE (28.65 vs. 27.95). The MAPE was decreased by 24.12% (from 28.65 to 21.74) when one NIR image at 970nm was used with an RGB image. This was the maximum reduction that could be achieved by increasing the number of wavelengths by one, which indicates that the addition of only a single wavelength image to an RGB image could result in the greatest reduction in MAPE.
While the MAPE values decreased as the number of wavelengths increased, there was a significant increase in MAPE values when using images of all wavelengths adopted in this study. This appears to be a side effect of using too many multiwavelength images, as evidenced by the fact that the MAPE value actually increases as the number of images increases from 8 to 9. Excluding the maximum number of wavelengths (11), the correlation coefficient between MAPE and the number of wavelengths is −0.8471, indicating that MAPE decreases significantly with the number of wavelengths. Linear regression analysis also showed that the MAPE was decreased by 1.034 when the number of wavelengths was increased by one. The minimum MAPE (11.67) was obtained when a total of 8 images was used, which includes RGB images. Similar to food classification, it is apparent that an 8-fold acquisition of images is required compared with the conventional method using only RGB images.
So far, the results were obtained by using the actually captured images. The results of caloric estimation using UV/NIR images predicted from RGB images are presented in Table 6. The results are similar to using actual acquired images. When the neural network was trained by adding just one type of single-wavelength NIR image to the RGB image, a 37.55% reduction in MAPE was achieved. The first wavelength selected was 970 nm, which approximates the 950 nm that was observed when using the actual images. The correlation coefficient between MAPE and the number of images (number of wavelengths) was −0.7166, which is slightly lower than when using actual acquisition images. The lowest MAPE value was obtained when a total of 11 images was used, indicating that more images were needed when using predicted images compared with using actual images, such as for food classification. The difference in the minimum MAPE value between using the actual acquisition images and using the estimated images was only 0.46, which was is not a significant difference. Such results demonstrate that image conversion techniques are useful in caloric estimation with high accuracy while overcoming the challenges associated with an increased number of light sources and repeated image acquisition.
A correlation analysis between the accuracy of caloric estimation and the objective metrics of image conversion was also investigated. Both PSNR and SSIM have negative correlation coefficients, which means that a better conversion performance equates to a more accurate caloric estimation. However, the absolute value of the correlation coefficient is very small (0.097 and 0.256 for PSNR and SSIM, respectively), and indicates that PSNR and SSIM, which we used as metrics of conversion performance in this study, do not significantly affect the accuracy of caloric estimation. These results suggest that, as in food classification, the metrics in image conversion that are more closely related to the accuracy of caloric estimation should be explored.
4. Conclusions
Image-based food analysis technology is an attractive method since it does not require expensive specialized equipment and can be implemented on existing wearable devices. It is essential that the precision of image-based analysis is at least comparable to what could be achieved with specialized equipment. To this end, multi-wavelength image analysis was adopted in which multiple images acquired from multiple narrow-band wavelength light sources including UV and NIR lights were used. Such an approach showed significantly higher accuracy in food classification and caloric estimation compared to using RGB images only. There are the drawbacks, however, of requiring multiple light sources and long acquisition times. To mitigate these problems, we propose the use of converted RGB images instead of actual UV/NIR images acquired using a camera.
It was experimentally confirmed that the UV/NIR images estimated from the RGB images were very similar to the originals from both visual and objective perspectives. The performance of the multi-wavelength food analysis techniques using the estimated images approximated the use of actual images in terms of both food classification and caloric estimation. In conclusion, high performance multi-wavelength imaging techniques could be achieved using conventional RGB images with only a software change. As future study, we will focus on image conversion techniques that improve not only the visual and objective similarities between the converted and original images, but also on the precision of food analysis.
Funding
This work was supported by the National Research Foundation of Korea (NRF) grant funded by the Korea government (MSIT) (No. 2022R1F1A10689-791220682073250102).
Institutional Review Board Statement
Not applicable.
Informed Consent Statement
Not applicable.
Data Availability Statement
The data presented in this study are available on request from the corresponding author.
Conflicts of Interest
The author declares no conflict of interest.
References
- Moayyedi, P. The epidemiology of obesity and gastrointestinal and other diseases: An overview. Dig. Dis. Sci. 2008, 9, 2293–2299. [Google Scholar] [CrossRef]
- Prentice, A.M.; Black, A.E.; Murgatroyd, P.R.; Goldberg, G.R.; Coward, W.A. Metabolism or appetite: Questions of energy balance with particular reference to obesity. J. Hum. Nutr. Diet. 1989, 2, 95–104. [Google Scholar] [CrossRef]
- De Castro, J.M. Methodology, correlational analysis, and interpretation of diet diary records of the food and fluid intake of free-living humans. Appetite 1994, 2, 179–192. [Google Scholar] [CrossRef] [PubMed]
- Kaczkowski, C.H.; Jones, P.J.H.; Feng, J.; Bayley, H.S. Four-day multimedia diet records underestimate energy needs in middle-aged and elderly women as determined by doubly-labeled water. J. Nutr. 2000, 4, 802–805. [Google Scholar] [CrossRef] [PubMed]
- Alshurafa, N.; Kalantarian, H.; Pourhomayoun, M.; Liu, J.; Sarin, S.; Sarrafzadeh, M. Recognition of nutrition-intake using time-frequency decomposition in a wearable necklace using a piezoelectric sensor. IEEE Sens. J. 2015, 7, 3909–3916. [Google Scholar] [CrossRef]
- Bi, Y.; Lv, M.; Song, C.; Xu, W.; Guan, N.; Yi, W. Autodietary: A wearable acoustic sensor system for food intake recognition in daily life. IEEE Sens. J. 2016, 3, 806–816. [Google Scholar] [CrossRef]
- Nishimura, J.; Kuroda, T. Eating habits monitoring using wireless wearable in-ear microphone. In Proceedings of the International Symposium on Wireless Pervasive Communication, Santorini, Greece, 7–9 May 2008; pp. 130–133. [Google Scholar]
- Päfiler, S.; Wolff, M.; Fischer, W.-J. Food intake monitoring: An acoustical approach to automated food intake activity detection and classification of consumed food. Physiol. Meas. 2012, 33, 1073–1093. [Google Scholar]
- Shuzo, M.; Komori, S.; Takashima, T.; Lopez, G.; Tatsuta, S.; Yanagimoto, S.; Warisawa, S.; Delaunay, J.-J.; Yamada, I. Wearable eating habit sensing system using internal body sound. J. Adv. Mech. Des. Syst. Manuf. 2010, 1, 158–166. [Google Scholar] [CrossRef]
- Weiss, R.; Stumbo, P.J.; Divakaran, A. Automatic food documentation and volume computation using digital imaging and electronic transmission. J. Am. Diet. Assoc. 2010, 1, 42–44. [Google Scholar] [CrossRef]
- Sun, M.; Liu, Q.; Schmidt, K.; Yang, J.; Yao, N.; Fernstrom, J.D.; Fernstrom, M.H.; DeLany, J.P.; Sclabassi, R.J. Determination of food portion size by image processing. In Proceedings of the 30th Annual International Conference of the IEEE Engineering in Medicine and Biology Society, Vancouver, BC, Canada, 21–24 August 2008; pp. 871–874. [Google Scholar]
- Zhu, F.; Bosch, M.; Woo, I.; Kim, S.Y.; Boushey, C.J.; Ebert, D.S.; Delp, E.J. The use of mobile devices in aiding dietary assessment and evaluation. IEEE J. Sel. Topics Signal Process. 2010, 4, 756–766. [Google Scholar]
- Pouladzadeh, P.; Shirmohammadi, S.; Al-Maghrabi, R. Measuring calorie and nutrition from food image. IEEE Trans. Instrum. Meas. 2014, 8, 1947–1956. [Google Scholar] [CrossRef]
- Ege, T.; Yanai, K. Simultaneous estimation of food categories and calories with multi-task CNN. In Proceedings of the 15th International Conference on Machine Vision Applications, Nagoya, Japan, 8–12 May 2017; pp. 198–201. [Google Scholar]
- Ege, T.; Ando, Y.; Tanno, R.; Shimoda, W.; Yanai, K. Image-based estimation of real food size for accurate food calorie estimation. In Proceedings of the IEEE conference on Multimedia Information Processing and Retrieval, San Jose, CA, USA, 28–30 May 2019; pp. 274–279. [Google Scholar]
- Lee, K.-S. Automatic estimation of food intake amount using visual and ultrasonic signals. Electronics 2021, 10, 2153. [Google Scholar] [CrossRef]
- Dehais, J.; Anthimopoulos, M.; Shevchik, S.; Mougiakakou, S. Two-view 3D reconstruction for food volume estimation. IEEE Trans. Multimed. 2017, 5, 1090–1099. [Google Scholar] [CrossRef]
- Lubura, J.; Pezo, L.; Sandu, M.A.; Voronova, V.; Donsì, F.; Šic Žlabur, J.; Ribić, B.; Peter, A.; Šurić, J.; Brandić, I.; et al. Food Recognition and Food Waste Estimation Using Convolutional Neural Network. Electronics 2022, 11, 3746. [Google Scholar] [CrossRef]
- McAllister, P.; Zheng, H.; Bond, R.; Moorhead, A. Combining deep residual neural network features with supervised machine learning algorithms to classify diverse food image dataset. Comput. Biol. Med. 2018, 95, 217–233. [Google Scholar] [CrossRef] [PubMed]
- Zhang, W.; Wu, J.; Yang, Y. Wi-hsnn: A subnetwork-based encoding structure for dimension reduction and food classification via harnessing multi-cnn model high-level features. Neurocomputing 2020, 414, 57–66. [Google Scholar] [CrossRef]
- Dai, Y.; Park, S.; Lee, K. Utilizing Mask R-CNN for Solid-Volume Food Instance Segmentation and Calorie Estimation. Appl. Sci. 2022, 12, 10938. [Google Scholar] [CrossRef]
- Liu, J.; Cao, Y.; Wang, Q.; Pan, W.; Ma, F.; Liu, C.; Chen, W.; Yang, J.; Zheng, L. Rapid and non-destructive identification of water-injected beef samples using multispectral imaging analysis. Food Chem. 2016, 190, 938–943. [Google Scholar] [CrossRef] [PubMed]
- Sugiyama, J. Visualization of sugar content in the flesh of a melon by near-infrared imaging. J. Agric. Food Chem. 1999, 47, 2715–2718. [Google Scholar] [CrossRef] [PubMed]
- Ropodi, A.I.; Pavlidis, D.E.; Mohareb, F.; Pangaou, E.Z.; Nychas, E. Multispectral image analysis approach to detect adulteration of beef and pork in raw meats. Food Res. Int. 2015, 67, 12–18. [Google Scholar] [CrossRef]
- Raju, V.B.; Sazonov, E. Detection of oil-containing dressing on salad leaves using multispectral imaging. IEEE Access 2020, 8, 86196–86206. [Google Scholar] [CrossRef]
- Tang, C.; He, H.; Li, E.; Li, H. Multispectral imaging for predicting sugar content of Fuji apples. Opt. Laser Technol. 2018, 106, 280–285. [Google Scholar] [CrossRef]
- Nawi, N.M.; Chen, G.; Jensen, T.; Mehdizadeh, S.A. Prediction and classification of sugar content of sugarcane based on skin scanning using visible and shortwave near infrared. Biosyst. Eng. 2013, 115, 154–161. [Google Scholar] [CrossRef]
- Morishita, Y.; Omachi, T.; Asano, K.; Ohtera, Y.; Yamada, H. Study on non-destructive measurement of sugar content of peach fruit utilizing photonic crystal-type NIR spectroscopic camera. In Proceedings of the International Workshop on Emerging ICT, Sendai, Japan, 31 October–2 November 2016. [Google Scholar]
- Fu, X.; Wang, X.; Rao, X. An LED-based spectrally tuneable light source for visible and near-infrared spectroscopy analysis: A case study for sugar content estimation of citrus. Biosyst. Eng. 2017, 163, 87–93. [Google Scholar] [CrossRef]
- Gomes, V.M.; Fernandes, A.M.; Faia, A.; Melo-Pinto, P. Comparison of different approaches for the prediction of sugar content in new vintage of whole Port wine grape berries using hyperspectral imaging. Comput. Electron. Agric. 2017, 140, 244–254. [Google Scholar] [CrossRef]
- Khodabakhshian, R.; Emadi, B.; Khojastehpour, M.; Golzarian, M.R.; Sazgarnia, A. Development of a multispectral imaging system for online quality assessment of pomegranate fruit. Int. J. Food Prop. 2017, 20, 107–118. [Google Scholar] [CrossRef]
- Rady, A.M.; Guyer, D.E.; Watson, N.J. Near-infrared spectroscopy and hyperspectral imaging for sugar content evaluation in potatoes over multiple growing seasons. Food Anal. Methods 2021, 14, 581–595. [Google Scholar] [CrossRef]
- Wickramasinghe, W.A.N.D.; Ekanayake, E.M.S.L.N.; Wijedasa, M.A.C.S.; Wijesinghe, A.D.; Madhujith, T.; Ekanayake, M.P.B.; Godaliyadda, G.M.R.I.; Herath, H.M.V.R. Validation of multispectral imaging for the detection of sugar adulteration in black tea. In Proceedings of the 10th International Conference on Information and Automation for Sustainability, Padukka, Sri Lanka, 11–13 August 2021. [Google Scholar]
- Wu, D.; He, Y. Study on for soluble solids contents measurement of grape juice beverage based on Vis/NIRS and chemomtrics. Proc. SPIE 2007, 6788, 67882E. [Google Scholar]
- Zhang, C.; Liu, F.; Kong, W.; He, Y. Application of visible and near-infrared hyperspectral imaging to determine soluble protein content in oilseed rape leaves. Sensors 2015, 15, 16576–16588. [Google Scholar] [CrossRef]
- Ahn, D.; Choi, J.-Y.; Kim, H.-C.; Cho, J.-S.; Moon, K.-D. Estimating the composition of food nutrients from hyperspectral signals based on deep neural networks. Sensors 2019, 19, 1560. [Google Scholar] [CrossRef]
- Chungcharoen, T.; Donis-Gonzalez, I.; Phetpan, K.; Udompetnikul, V.; Sirisomboon, P.; Suwalak, R. Machine learning-based prediction of nutritional status in oil palm leaves using proximal multispectral images. Comput. Electron. Agric. 2022, 198, 107019. [Google Scholar] [CrossRef]
- Li, B.; Shen, C.; Dai, Y.; Hengel, A.; He, M. Depth and surface normal estimation from monocular images using regression on deep features and hierarchical CRFs. In Proceedings of the IEEE Conference Computer Vision Pattern Recognition, Boston, MA, USA, 7–12 June 2015; pp. 1119–1127. [Google Scholar]
- Liu, F.; Shen, C.; Lin, G.; Reid, I. Learning depth from single monocular images using deep convolutional neural fields. IEEE Trans. Pattern Anal. Mach. Intell. 2016, 38, 2024–2039. [Google Scholar] [CrossRef] [PubMed]
- Chen, L.-C.; Papandreou, G.; Kokkinos, I.; Murphy, K.; Yuille, A.L. DeepLab: Semantic image segmentation with deep convolutional nets atrous convolution and fully connected CRFs. IEEE Trans. Pattern Anal. Mach. Intell. 2018, 40, 834–848. [Google Scholar] [CrossRef]
- Aswatha, S.M.; Malladi, S.P.K.; Mukherjee, J. An encoder-decoder based deep architecture for visible to near infrared image transformation, In Proceedings of the 12th Indian Conference Computer Vision Graphic and Image Processing (ICVGIP), Jodhpur, Inida, 20–21 December 2021.
- Yuan, X.; Tian, J.; Reinartz, P. Generating artificial near infrared spectral band from RGB image using conditional generative adversarial network. ISPRS Ann. Photogramm. Remote Sens. Spat. Inf. Sci. 2020, 3, 279–285. [Google Scholar] [CrossRef]
- Keivanmarz, A.; Sharifzadeh, H.; Fleming, R. Vein pattern visualization using conditional generative adversarial networks. In Proceedings of the 2020 Asia-Pacific Signal and Information Processing Association Annual Summit and Conference (APSIPA ASC), Auckland, New Zealand, 7–10 December 2020; pp. 1310–1316. [Google Scholar]
- The Ministry of Korean Food and Drug Safety (KFDA). Food Nutrient Database. Available online: https://data.mfds.go.kr/nsd/obaaa/stdDbSrchRsltList.do (accessed on 3 February 2024).
- Lee, K.-S. Multispectral food classification and caloric estimation using convolutional neural networks. Foods 2023, 12, 3212. [Google Scholar] [CrossRef]
- Ronneberger, O.; Fischer, P.; Brox, T. U-net: Convolutional networks for biomedical image segmentation. In Proceedings of the International conference on Medical Image Computing and Computer Assisted Intervention, Toronto, ON, Canada, 5–9 October 2015; pp. 234–241. [Google Scholar]
- Wang, Z.; Bovik, A.C.; Sheikh, H.R.; Simoncelli, E.P. Image quality assessment: From error visibility to structural similarity. IEEE Trans. Image Process. 2004, 13, 600–612. [Google Scholar] [CrossRef] [PubMed]
Figure 1.
Photograph of the image acquisition system.

Figure 2.
The CNN architecture for food classification, where is the number of input images and is the number of targets. (101 for food classification and 1 for caloric estimation).
Figure 2.
The CNN architecture for food classification, where is the number of input images and is the number of targets. (101 for food classification and 1 for caloric estimation).

Figure 3.
The architecture of the CNN that was used to convert RGB images to UV/NIR images.

Figure 4.
Examples of the original (top)/predicted (bottom) images at each wavelength for (a) corn soup, (b) coke, (c) tomato, and (d) pork.
Figure 4.
Examples of the original (top)/predicted (bottom) images at each wavelength for (a) corn soup, (b) coke, (c) tomato, and (d) pork.


Table 1.
Dataset properties per food item.
| Food Name | Caloric Count (kcal) | Food Name | Calorie Count (kcal) |
|---|---|---|---|
| apple juice | N/a | pork (steamed) | 441.41 |
| almond milk | 41.57 | potato chips | 130.82 |
| banana | 127.80 | potato chips (onion flavor) | 133.95 |
| banana milk | 110.27 | sports drink (blue) | 17.00 |
| chocolate bar (high protein) | 167.00 | chocolate bar (with fruits) | 170.00 |
| beef steak | 319.39 | milk pudding | 189.41 |
| beef steak with source | 330.29 | ramen (Korean-style noodles) | 280.00 |
| black noodles | 170.00 | rice (steamed) | 258.45 |
| black noodles with oil | N/a | rice cake | 262.46 |
| blacktea | 52.68 | rice cake and honey | 288.60 |
| bread | 129.54 | rice juice | 106.21 |
| bread and butter | 182.04 | rice (steamed, low-calorie) | 171.18 |
| castela | 287.68 | multi-grain rice | 258.08 |
| cherryade | 79.06 | rice noodles | 140.00 |
| chicken breast | 109.00 | cracker | 217.88 |
| chicken noodles | 255.00 | salad1 (lettuce and cucumber) | 24.20 |
| black chocolate | 222.04 | salad1 with olive oil | 37.69 |
| milk chocolate | 228.43 | salad2 (cabbage and carrot) | 17.28 |
| chocolate milk | 122.62 | salad2 with fruit-dressing | 28.04 |
| cider | 70.55 | armond cereal (served with milk) | 217.36 |
| clam chowder | 90.00 | corn cereal (served with milk) | 205.19 |
| coffee | 18.56 | soybean milk | 85.95 |
| coffee with sugar (10%) | 55.74 | spagetti | 373.73 |
| coffee with sugar (20%) | 92.92 | kiwi soda (sugar-free) | 2.34 |
| coffee with sugar (30%) | 130.11 | tofu | 62.37 |
| coke | 76.36 | cherry tomato | 36.00 |
| corn milk | 97.18 | tomato juice | 59.80 |
| corn soup | 85.00 | cherry tomato and syrup | 61.90 |
| cup noodle | 120.00 | fruit soda | 27.04 |
| rice with tuna and pepper | 418.15 | vinegar | 20.16 |
| dietcoke | 0.00 | pure water | 0.00 |
| choclate bar | 249.00 | watermelon juice | 79.97 |
| roasted duck | 360.98 | grape soda | 92.43 |
| orange soda | 33.33 | grape soda (sugar-free) | 0.00 |
| orange soda (sugar-free) | 2.77 | fried potato | 331.50 |
| fried potato and powder | 364.92 | yogurt | 114.56 |
| sports drink | 47.23 | yogurt and sugar | 106.04 |
| ginger tea | 96.79 | milk soda | 86.84 |
| honey tea | 126.69 | salt crackers | 218.89 |
| caffelatte | 79.13 | onion soap | 83.00 |
| caffelatte with sugar (10%) | 115.66 | orange juice | 82.17 |
| caffelatte with sugar (20%) | 152.19 | peach (cutted) | 55.38 |
| caffelatte with sugar (30%) | 188.72 | pear juice | 90.02 |
| mango candy | 91.00 | peach and syrup | 124.80 |
| mango jelly | 212.43 | peanuts | 217.96 |
| milk | 94.50 | peanuts and salt | 218.21 |
| sweet milk | N/a | milk tea | 63.46 |
| green soda | 84.55 | pizza (beef) | 212.08 |
| pizza (seafood) | 148.83 | pizza (potato) | 179.34 |
| pizza (combination) | 175.87 | plain yogurt | 109.89 |
| sports drink (white) | 43.95 | ||
| mean | 139.27 | ||
| standard deviation | 101.36 | ||
Table 2.
Image prediction performance.
| Wavelength (nm) | 385 | 405 | 810 | 850 | 870 | 890 | 910 | 950 | 970 | 1020 | Avg. | Std. |
|---|---|---|---|---|---|---|---|---|---|---|---|---|
| PSNR (dB) | 34.28 | 31.05 | 30.18 | 29.71 | 30.15 | 30.76 | 30.63 | 29.38 | 30.06 | 29.87 | 30.61 | 1.38 |
| SSIM | 0.863 | 0.774 | 0.912 | 0.871 | 0.906 | 0.906 | 0.831 | 0.876 | 0.856 | 0.851 | 0.865 | 0.042 |
Table 3.
Food classification accuracies for each of selected wavelengths, in the case of using actual captured images.
Table 3.
Food classification accuracies for each of selected wavelengths, in the case of using actual captured images.
| No. of Images | Selected Wavelengths (nm) | Acc. (%) | ||||||||||
|---|---|---|---|---|---|---|---|---|---|---|---|---|
| 1 | RGB | (VGG16) [14] | 85.54 | |||||||||
| 1 | RGB | (ResNet152+ANN) [19] | 87.23 | |||||||||
| 1 | RGB | (WI-HSNN) [20] | 88.04 | |||||||||
| 1 | RGB | (proposed) | 86.30 | |||||||||
| 2 | RGB | 970 | 96.62 | |||||||||
| 3 | RGB | 910 | 970 | 98.60 | ||||||||
| 4 | RGB | 405 | 910 | 970 | 98.43 | |||||||
| 5 | RGB | 405 | 910 | 950 | 970 | 98.71 | ||||||
| 6 | RGB | 385 | 405 | 910 | 950 | 970 | 99.06 | |||||
| 7 | RGB | 385 | 405 | 890 | 910 | 950 | 970 | 99.23 | ||||
| 8 | RGB | 385 | 810 | 850 | 890 | 910 | 950 | 970 | 99.37 | |||
| 9 | RGB | 385 | 810 | 850 | 870 | 890 | 910 | 950 | 970 | 99.45 | ||
| 10 | RGB | 385 | 810 | 850 | 870 | 890 | 910 | 950 | 970 | 1020 | 99.06 | |
| 11 | RGB | 385 | 405 | 810 | 850 | 870 | 890 | 910 | 950 | 970 | 1020 | 99.15 |
Table 4.
Food classification accuracies, average PSNR, and average SSIM for each of selected wavelengths for food classification, in the case of using predicted images.
Table 4.
Food classification accuracies, average PSNR, and average SSIM for each of selected wavelengths for food classification, in the case of using predicted images.
| No. of Images | Selected Wavelengths (nm) | Acc. (%) | Avg. PSNR | Avg. SSIM | ||||||||||
|---|---|---|---|---|---|---|---|---|---|---|---|---|---|---|
| 1 | RGB | 90.23 | – | – | ||||||||||
| 2 | RGB | 950 | 95.24 | 29.38 | 0.876 | |||||||||
| 3 | RGB | 385 | 870 | 96.89 | 32.22 | 0.885 | ||||||||
| 4 | RGB | 385 | 870 | 1020 | 97.61 | 31.43 | 0.874 | |||||||
| 5 | RGB | 385 | 810 | 870 | 1020 | 96.59 | 31.12 | 0.883 | ||||||
| 6 | RGB | 385 | 810 | 850 | 870 | 970 | 98.13 | 30.88 | 0.882 | |||||
| 7 | RGB | 385 | 405 | 810 | 850 | 870 | 1020 | 97.91 | 30.87 | 0.863 | ||||
| 8 | RGB | 385 | 405 | 810 | 850 | 870 | 910 | 1020 | 97.85 | 30.84 | 0.858 | |||
| 9 | RGB | 385 | 405 | 810 | 850 | 870 | 910 | 970 | 1020 | 98.16 | 30.74 | 0.858 | ||
| 10 | RGB | 385 | 405 | 810 | 850 | 870 | 890 | 910 | 950 | 970 | 97.77 | 30.69 | 0.866 | |
| 11 | RGB | 385 | 405 | 810 | 850 | 870 | 890 | 910 | 950 | 970 | 1020 | 98.24 | 30.61 | 0.865 |
Table 5.
Caloric estimation results for each of selected wavelengths, in the case of using actual captured images.
Table 5.
Caloric estimation results for each of selected wavelengths, in the case of using actual captured images.
| No. of Images | Selected Wavelengths (nm) | MAPE | ||||||||||
|---|---|---|---|---|---|---|---|---|---|---|---|---|
| 1 | RGB | (VGG16) [14] | 27.95 | |||||||||
| 1 | RGB | (proposed) | 28.65 | |||||||||
| 2 | RGB | 970 | 21.74 | |||||||||
| 3 | RGB | 385 | 1020 | 18.54 | ||||||||
| 4 | RGB | 385 | 970 | 1020 | 18.30 | |||||||
| 5 | RGB | 385 | 850 | 970 | 1020 | 14.57 | ||||||
| 6 | RGB | 385 | 850 | 890 | 970 | 1020 | 14.29 | |||||
| 7 | RGB | 385 | 405 | 850 | 910 | 979 | 1020 | 12.63 | ||||
| 8 | RGB | 385 | 405 | 850 | 910 | 950 | 970 | 1020 | 11.67 | |||
| 9 | RGB | 385 | 405 | 850 | 870 | 910 | 950 | 970 | 1020 | 15.00 | ||
| 10 | RGB | 385 | 405 | 810 | 850 | 870 | 910 | 950 | 970 | 1020 | 12.68 | |
| 11 | RGB | 385 | 405 | 810 | 850 | 870 | 890 | 910 | 950 | 970 | 1020 | 21.42 |
Table 6.
Caloric estimation results for each of selected wavelengths, in the case of using predicted images.
Table 6.
Caloric estimation results for each of selected wavelengths, in the case of using predicted images.
| No. of Images | Selected Wavelengths (nm) | MAPE | Avg. PSNR | Avg. SSIM | ||||||||||
|---|---|---|---|---|---|---|---|---|---|---|---|---|---|---|
| 1 | RGB | 32.28 | – | – | ||||||||||
| 2 | RGB | 970 | 20.16 | 30.06 | 0.856 | |||||||||
| 3 | RGB | 385 | 970 | 17.59 | 32.17 | 0.859 | ||||||||
| 4 | RGB | 385 | 405 | 970 | 16.65 | 31.80 | 0.831 | |||||||
| 5 | RGB | 385 | 405 | 850 | 970 | 18.19 | 31.28 | 0.841 | ||||||
| 6 | RGB | 385 | 405 | 850 | 890 | 970 | 15.96 | 31.17 | 0.854 | |||||
| 7 | RGB | 385 | 850 | 870 | 890 | 970 | 1020 | 16.21 | 30.81 | 0.876 | ||||
| 8 | RGB | 385 | 405 | 850 | 870 | 890 | 970 | 1020 | 17.05 | 30.84 | 0.861 | |||
| 9 | RGB | 385 | 405 | 850 | 870 | 890 | 950 | 970 | 1020 | 17.41 | 30.66 | 0.863 | ||
| 10 | RGB | 385 | 405 | 810 | 850 | 870 | 890 | 910 | 950 | 1020 | 12.13 | 30.60 | 0.868 | |
| 11 | RGB | 385 | 405 | 810 | 850 | 870 | 890 | 910 | 950 | 970 | 1020 | 18.71 | 30.61 | 0.865 |
Disclaimer/Publisher’s Note: The statements, opinions and data contained in all publications are solely those of the individual author(s) and contributor(s) and not of MDPI and/or the editor(s). MDPI and/or the editor(s) disclaim responsibility for any injury to people or property resulting from any ideas, methods, instructions or products referred to in the content. |
© 2024 by the author. Licensee MDPI, Basel, Switzerland. This article is an open access article distributed under the terms and conditions of the Creative Commons Attribution (CC BY) license (https://creativecommons.org/licenses/by/4.0/).
Share and Cite
MDPI and ACS Style
Lee, K.-S. Multi-Spectral Food Classification and Caloric Estimation Using Predicted Images. Foods 2024, 13, 551. https://doi.org/10.3390/foods13040551
AMA Style
Lee K-S. Multi-Spectral Food Classification and Caloric Estimation Using Predicted Images. Foods. 2024; 13(4):551. https://doi.org/10.3390/foods13040551
Chicago/Turabian StyleLee, Ki-Seung. 2024. "Multi-Spectral Food Classification and Caloric Estimation Using Predicted Images" Foods 13, no. 4: 551. https://doi.org/10.3390/foods13040551
Note that from the first issue of 2016, this journal uses article numbers instead of page numbers. See further details here.