Article

Catabolism of Dictyophora indusiata Polysaccharide and Its Impacts on Gut Microbial Composition during In Vitro Digestion and Microbial Fermentation

1
Institute of Food Processing and Safety, College of Food Science, Sichuan Agricultural University, Ya’an 625014, China
2
Institute for Advanced Study, Chengdu University, Chengdu 610106, China
*
Authors to whom correspondence should be addressed.
Foods 2023, 12(9), 1909; https://doi.org/10.3390/foods12091909
Submission received: 13 March 2023 / Revised: 17 April 2023 / Accepted: 5 May 2023 / Published: 6 May 2023

Abstract

:
Dictyophora indusiata is one of the most famous edible mushrooms in China. D. indusiata polysaccharide (DP) has attracted increasing attention because of its multiple beneficial effects. In this study, the in vitro simulated digestion and microbial fermentation were designed to reveal the potential catabolic property of DP and its impacts on the modulation of gut microbial composition. The results showed that the reducing sugar content, total polysaccharides content, molecular weight, and rheological property of DP were not significantly altered under in vitro simulated digestive conditions. However, the molecular weight, apparent viscosity, and total polysaccharides content of indigestible DP (DPI) significantly decreased during in vitro fecal fermentation, and the reducing sugar content and the release of free monosaccharides notably increased, suggesting that DP could be degraded and used by gut microbiota. Additionally, the relative abundances of several beneficial bacteria, such as Bacteroides, Catenibacterium, Parabacteroides, and Megamonas, increased significantly, indicating that DP can regulate the composition and abundance of gut microbiota. Moreover, DP could also promote the production of SCFAs, thus changing the acid–base environment of the large intestine. The results of this study are beneficial for deeply clarifying the catabolic behavior of DP in the gastrointestinal tract, which can provide a theoretical basis for developing microbiota-directed products based on DP.

1. Introduction

Dictyophora indusiata belongs to the phylum Basidiomycetes and the family Phallaceae. D. indusiata is known as “the queen of mushrooms” due to its unusual and attractive appearance and its many health benefits [1]. In China, D. indusiata has a long history of cultivation, and it is favored by many people, not only for its rich taste, but also for its various health-promoting effects, such as antioxidant, immune regulation, anti-tumor, and neuroprotection effects [2,3,4,5]. Polysaccharides and their derivatives play an important role in life activities. According to previous studies, the carbohydrates in D. indusiata can reach 47% of the dry weight [1], and the polysaccharides from D. indusiata mainly contain a large amount of glucose and a small amount of galactose and mannose, mainly have a β-glucan structure, and exist as a triple helix conformation [3,4]. Because the human genome cannot produce enough carbohydrate active enzymes (CAZymes) to catabolize this kind of polysaccharide, the gut microbiota play a vital role in the catabolism of dietary polysaccharides [6,7].
Gut microbiota are a complex ecosystem of humans, and they can maintain the dynamic equilibrium in the host. Accumulating studies have recognized the critical roles of gut microbiota on the nutrition metabolism, host immunity, and other aspects of health [8,9]. When the gut microbiota are disordered, it may lead to obesity, diabetes, intestinal diseases, abnormal immune response, and other diseases [6]. Dietary polysaccharides can regulate the gut microbial community and be effectively utilized by specific gut microbiota to produce short-chain fatty acids (SCFAs) and other beneficial metabolic products [7,10]. It has been reported that the easily absorbed SCFAs can benefit the physiology of the host, such as enhancing energy absorption of intestinal epithelial cells, regulating host energy metabolism, and controlling body weight [10,11,12,13].
Recently, we have obtained a purified polysaccharide (DP) from the fruiting body of D. indusiata, which has been identified as a β-1,3-D-glucan with β-1,6-D-Glcp as branched chains. DP has a high molecular weight of 1.072 × 10⁶ Da and exhibits a rigid-rod chain conformation in NaCl solution. Additionally, DP possesses remarkable immunostimulatory activity in vivo, which is closely associated with its molecular weight and chain conformation [14]. In fact, the bioactivities of dietary polysaccharides are closely associated with their catabolism from the stomach to the colon [15]. Nevertheless, the digestive behavior and microbial fermentation characteristic of DP, as well as its potential to modulate the microbial composition, are still unclear. Therefore, in this study, the in vitro simulated digestion and microbial fermentation were designed to elucidate the potential catabolic property of DP in the gastrointestinal tract, which could lay a theoretical foundation for the development of microbiota-directed products based on DP.

2. Materials and Methods

2.1. Materials and Chemicals

The fruiting bodies of D. indusiata were purchased from Yibin, Sichuan Province, China. The raw materials were dried at 45 °C and milled into powders, then stored at −20 °C for further analysis. α-Amylase (1000 U/mg), pancreatin (4000 U/g), pepsin (3000 U/g), bile salt, cysteine, hemin, 1-phenyl-3-methyl-5-pyrazolone (PMP), resazurin, and vitamin K1 were all bought from Sigma-Aldrich (St. Louis, MO, USA). Other chemicals and reagents used in this work were of analytical grade.

2.2. Extraction and Isolation of Polysaccharides

The extraction and isolation of D. indusiata polysaccharide (DP) were carried out according to our prior methods [14]. In brief, DP was extracted by adding D. indusiata powder (1.0 g) into 22.0 mL of deionized water with the ultrasonic extraction amplitude of 57% and ultrasonic extraction time of 15 min. After ultrasound-assisted extraction, 95% of ethanol (v/v) was added in the supernatant at a volume ratio of 3:1 and settled for 12 h. After the precipitation was redissolved, the impurities were further removed by continuous precipitation with 95% (v/v) of ethanol at a final concentration of 30% (v/v). Afterwards, the precipitate was re-dissolved and then ultra-filtered with a 100.0 kDa ultrafiltration membrane. Finally, DP was obtained via freeze-drying at −80 °C for 48 h.

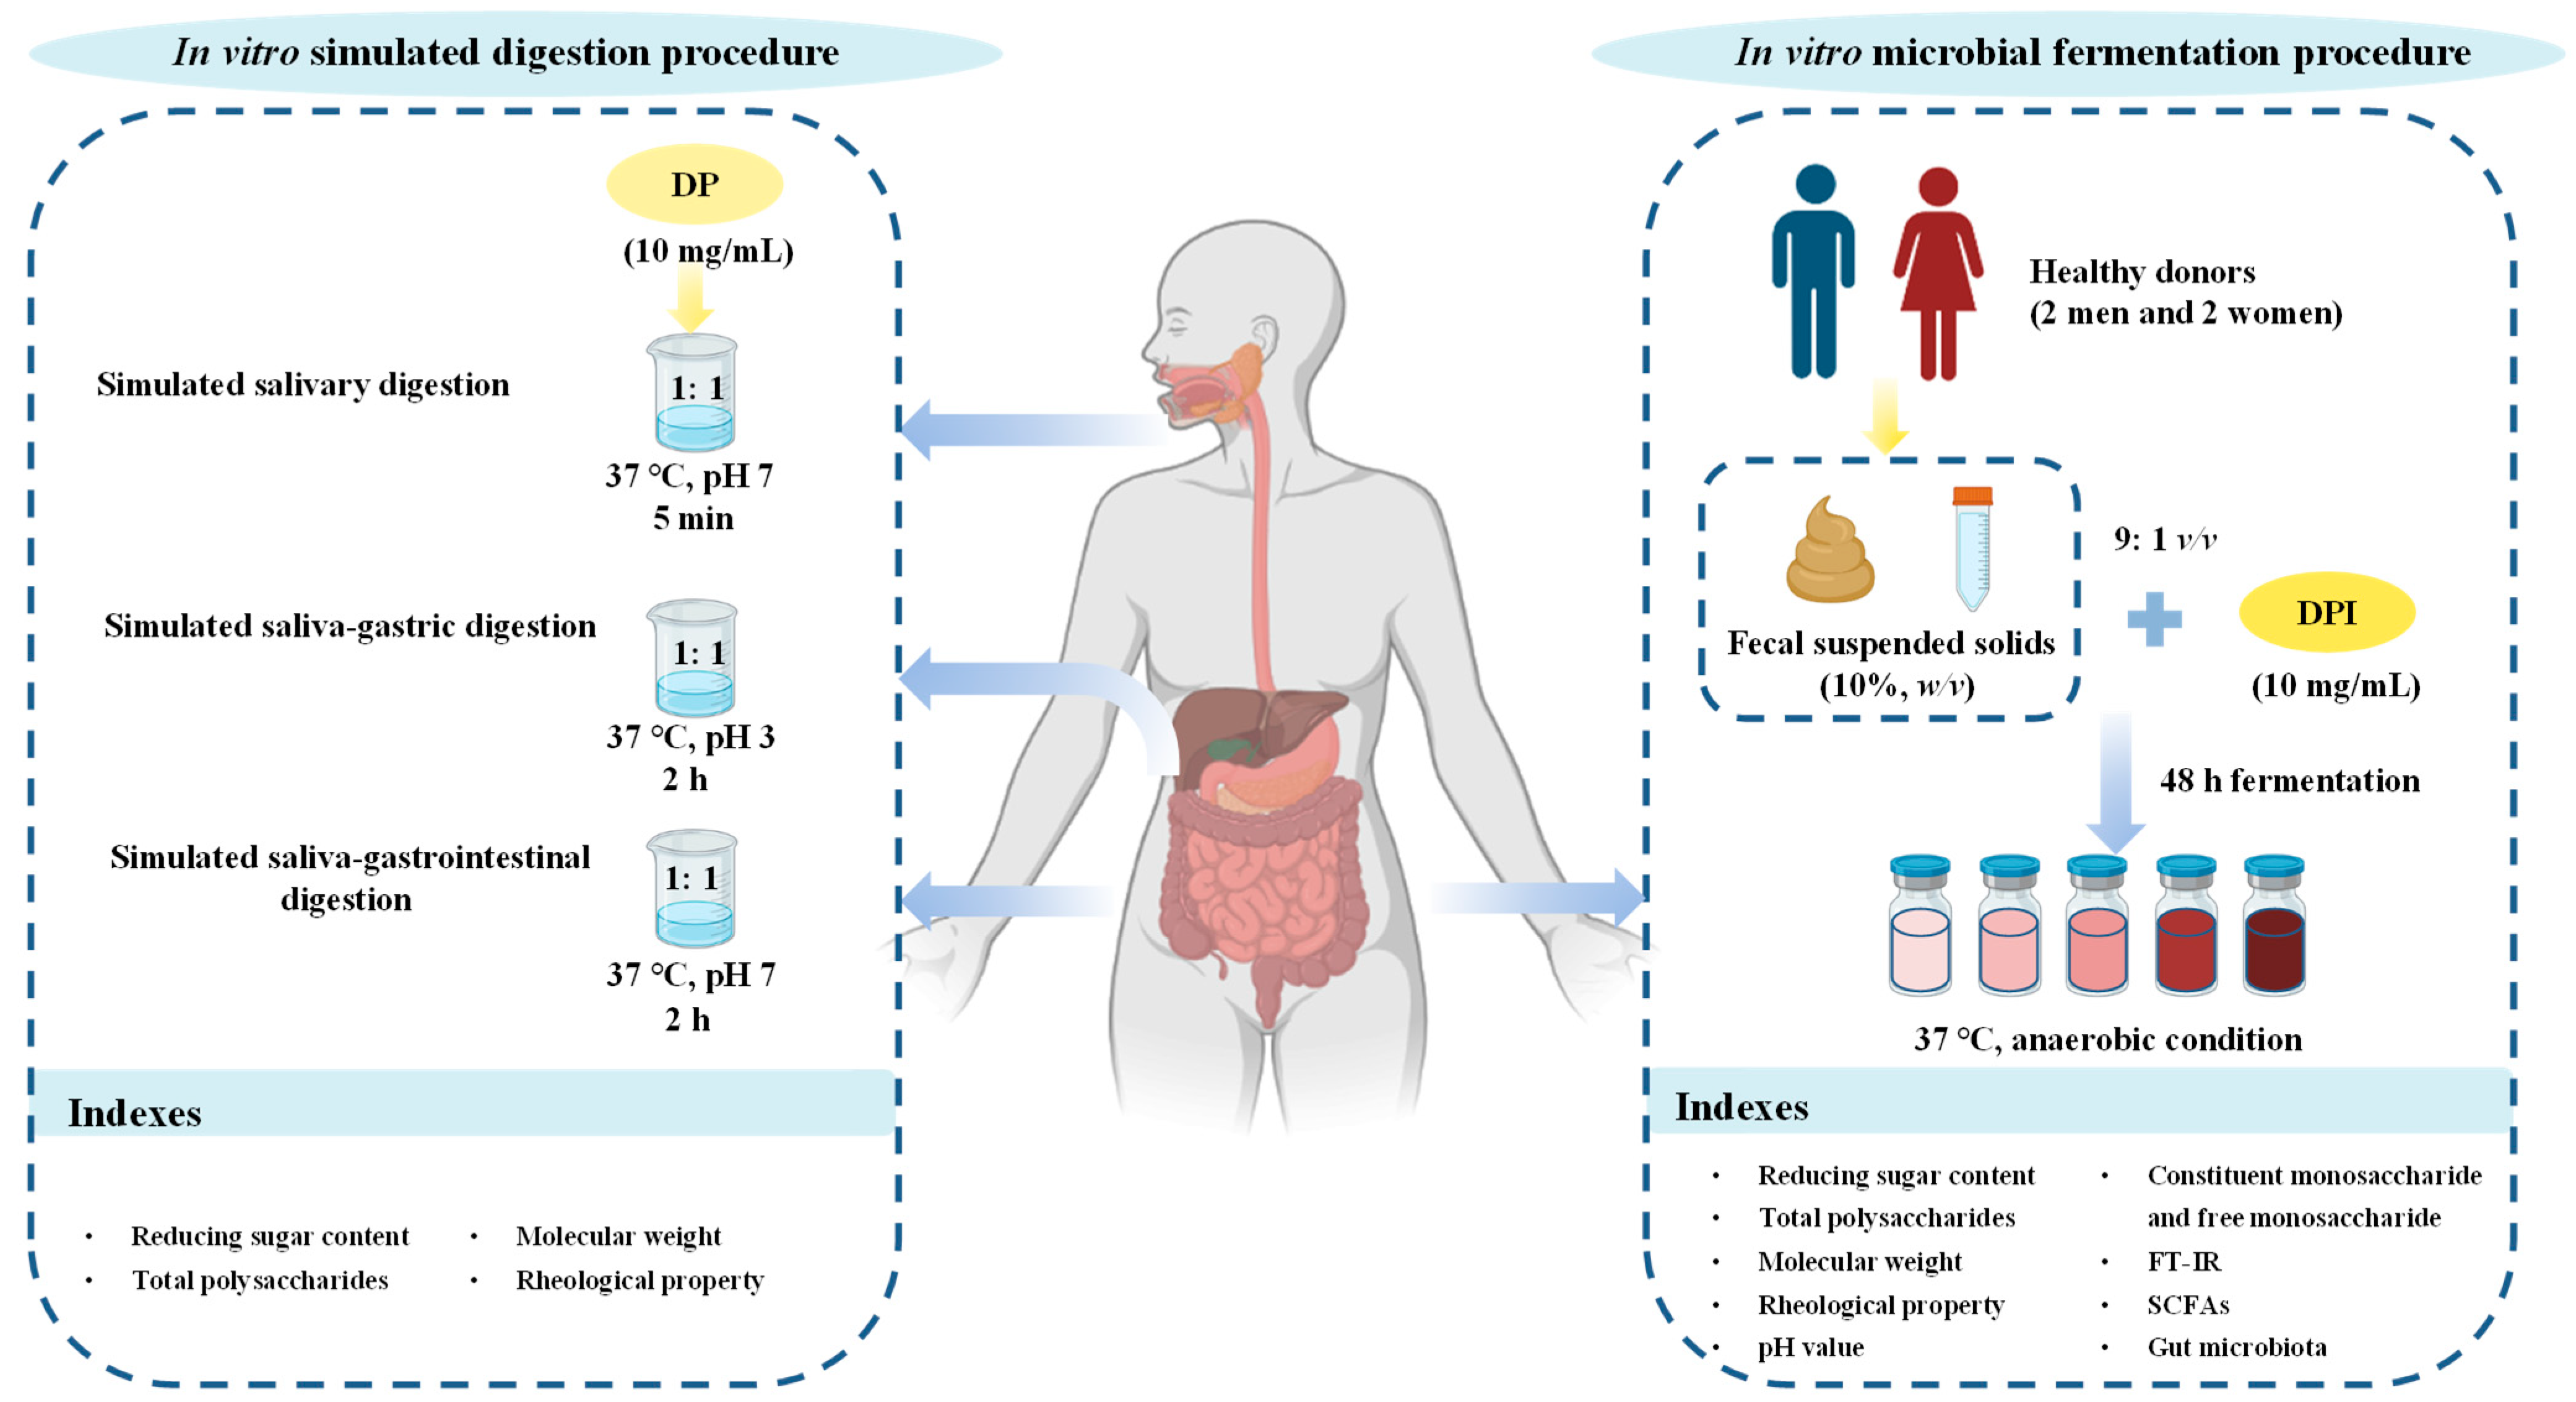
2.3. In vitro Simulated Digestion and Microbial Fermentation of DP

2.3.1. In Vitro Simulated Digestion Procedure

A schematic of the experimental designs of in vitro simulated digestion and microbial fermentation is shown in Figure 1. In brief, the preparation of simulated saliva, gastric juice, and intestinal juice in vitro refers to the method of Brodkorb et al. [16]. The simulated salivary stock solution (0.4 L) was composed of 0.5 M KCl (30.2 mL), 0.5 M KH2PO4 (7.4 mL), 1 M NaHCO3 (13.6 mL), 0.15 M MgCl2(H2O)6 (1.0 mL), 0.5 M (NH4)2CO3 (0.12 mL), and 6 M HCl (0.18 mL). A total of 10 mg/mL of DP solution was mixed with simulated salivary stock solution (1:0.8, v/v), and then α-amylase was added. The final concentration of α-amylase in the system was 75 U/mL, and the final concentration of CaCl2 (H2O)2 in the system was 1.5 mM. After fully mixing, the sterile water was added to adjust the final volume ratio of the DP solution and simulated saliva into 1:1 (v/v), and the mixture was reacted at 37 °C. After reaction for 0, 2, and 5 min, respectively, 10 mL of reaction solution was taken out and quickly placed in boiled water for 5 min.
The simulated gastric stock solution (0.4 L) was composed of 0.5 M KCl (13.8 mL), 0.5 M KH2PO4 (1.6 mL), 2 M NaCl (23.6 mL), 1 M NaHCO3 (25 mL), 0.15 M MgCl2(H2O)6 (0.8 mL), 0.5 M (NH4)2CO3 (1.0 mL), and 6 M HCl (2.6 mL). The residual reaction solution of salivary digestion was mixed with the simulated gastric stock solution (1:0.8, v/v), and pepsin and 0.3 M CaCl2 (H2O)2 were added to make the final concentration of 2000 U/mL and 0.15 mM in the system, respectively. In addition, the pH value of the system was adjusted to 3. After fully mixing, the sterile water was added to adjust the final volume ratio of the residual reaction solution of salivary digestion and the simulated gastric juice into 1:1 (v/v); it was then reacted at 37 °C. After reaction for 0, 0.5, 1, and 2 h, respectively, 10 mL of reaction solution was also taken out and quickly placed in boiled water for 5 min.
The simulated intestinal stock solution (0.4 L) was composed of 0.5 M KCl (13.6 mL), 0.5 M KH2PO4 (1.6 mL), 2 M NaCl (19.2 mL), 1 M NaHCO3 (85 mL), 0.15 M MgCl2(H2O)6 (2.2 mL), and 6 M HCl (1.4 mL). The residual reaction solution of gastric digestion was blended with the simulated intestinal stock solution (1:0.8, v/v), and 0.3 M CaCl2 (H2O)2, pancreatin, and bile salt were added to make the final concentrations in the system of 0.6 mM, 20 U/mL, and 10 mM, respectively. Then, the pH value of the system was adjusted to 7. After fully mixing, the sterile water was also added to adjust the final volume ratio of the residual reaction solution and the simulated intestinal solution into 1:1 (v/v), and the reaction was conducted at 37 °C. After reaction for 0, 0.5, 1, and 2 h, respectively, 10 mL of reaction solution was also taken out and quickly placed in boiled water for 5 min.
The digested solution was centrifuged and utilized for the determination of reducing the sugar content, and the rest of the solution was used to detect the physicochemical properties. Different digestive samples were named as DP-O (digested by oral digestion), DP g (digested by oral–gastric digestion), and DP-I (digested by oral–gastrointestinal digestion), respectively.

2.3.2. In Vitro Simulated Fermentation Procedure

As shown in Figure 1, the simulated fermentation of indigestible D. indusiata polysaccharide (DPI) in vitro was also conducted via the former method with minor modifications [10]. Fresh feces were collected from four healthy donors (2 men and 2 women, aged from 18–25) who were required to eat a normal diet (Chinese diet). A minimum of 3 months of treatment with antibiotics or probiotics was forbidden to donors. The stool donors all started defecating at the same time, and immediately after defecation, samples were taken and mixed evenly to prepare stool homogenates. Equal quantities of donors’ feces were mixed and then diluted with asepsis ameliorative normal saline (cysteine-HCl 0.5 g/L, NaCl 9.0 g/L) to prepare fecal suspended solids (10%, w/v). The fermentation medium (1 L) was composed of 2.0 g of yeast extract, 2.0 g of peptone, 0.1 g of NaCl, 0.04 g of K2HPO4, 0.04 g of KH2PO4, 0.01 g of CaCl2 · 6H2O, 0.01 g of MgSO4 · 7H2O, 2.0 g of NaHCO3, 0.02 g of heme, 0.5 g of cysteine hydrochloride, 0.5 g of bile salt, 2.0 mL of Tween 80, 1.0 mg of rezamycin, and 10 µL of vitamin K.
The fecal-suspended solid was added into the fermentation medium containing DPI (10 mg/mL, DPI group), the fermentation medium without other carbon sources (CK group), and the normal saline (Feces group) to make their volume ratio into 1:9. Afterwards, the mixture was fermented in an anaerobic incubator (BPN-300CS, Being Instrument, Shanghai, China) at 37 °C. At 0, 6, 12, 24 and 48 h fermentation, the starter fermentation solution was taken for detection and analysis. The samples obtained at different fermentation time points were named as DPI-0 h, DPI-6 h, DPI-12 h, DPI-24 h, and DPI-48 h, respectively. The gut microbial composition of the fermentation broth after in vitro fermentation for 48 h was analyzed.

2.4. Determination of Physicochemical Properties of DP during In Vitro Digestion and Fermentation

2.4.1. Determination of pH Value, Reducing Sugar Content (CR), and Total Polysaccharides Content

The pH value of the fermentation broth at each time point was measured by using a pH Meter (RMD-H800, Shanghai Lanchang Automation Technology Co., Ltd., Shanghai, China). The CR was detected using the DNS method with glucose as a reference. The evaluation of total polysaccharides content of DP, its digested samples (DP-O, DP-G, and DP-I), and its fermented samples (DPI-0 h, DPI-6 h, DPI-12 h, DPI-24 h, and DPI-48 h) was based on the phenol–sulfuric acid method with glucose as a reference. The total carbohydrate consumption was calculated to reflect the fermentability of DPI.

2.4.2. Determination of Molecular Weight

High-performance size-exclusion chromatography (HPSEC) was used to determine the molecular weights (Mw) and polydispersities (Mw/Mn) of DP, its digested samples (DP-O, DP-G and DP-I), and its fermented samples (DPI-0 h, DPI-6 h, DPI-12 h, DPI-24 h, and DPI-48 h) with a multi-angle laser light scattering and a refractive index detector (MALLS-RID, Wyatt Technology Co., Santa Barbara, CA, USA) [17]. The samples were separated using the Shodex OHpak SB-806 M HQ column (300 mm × 8.0 mm, i.d., Shodex, Japan) at a flow rate of 0.5 mL/min in a mobile phase of 0.9% (w/v) NaCl.

2.4.3. Determination of Rheological Property

According to the formerly reported method, a Discovery Hybrid Rheometer-1 (DHR-1, TA instruments, New Castle, DE, USA) was applied for rheological characterization of DP, its digested samples (DP-O, DP g and DP-I), and its fermented samples (DPI-0 h, DPI-6 h, DPI-12 h, DPI-24 h, and DPI-48 h) at a concentration of 20 mg/mL [10].

2.4.4. Determination of Constituent Monosaccharide and Released Free Monosaccharide

Based on the previous method, high-performance liquid chromatography (HPLC, Thermo Fisher Scientific U3000, Waltham, MA, USA) was applied for the constituent monosaccharide and released free monosaccharide determination [7]. The phenomenex gemini 5u C18 110A column (150 mm × 4.6 mm, 5 μm) was utilized. The phosphate-buffered solution (0.1 M, pH = 6.7) mixed with acetonitrile at a volume ratio of 83:17 was applied as the mobile phase. The mobile phase was eluted at the rate of 1.0 mL/min and measured at a 245-nm detection wavelength.

2.4.5. Fourier Transform Infrared (FT-IR) Spectroscopy Analysis

According to our previous method [10], the FT-IR characteristic bands of fermented samples (DPI-0 h, DPI-6 h, DPI-12 h, DPI-24 h, and DPI-48 h) were measured by using a Nicolet iS 10 FT-IR (Thermo Fisher Scientific, Waltham, MA, USA) in the frequency range of 500–4000 cm−1.

2.4.6. Determination of SCFAs

According to our previous study, the concentration of SCFAs produced during different fermentation stages was determined by using gas chromatography (GC, Agilent 7890B GC system (Agilent Technologies, Santa Clara, CA, USA) [10]. In brief, the fermented samples were centrifuged (6000× g, 10 min), and then the supernatant was sucked and mixed with an equal volume of internal standard solution (0.05 M 2-ethylbutyric acid). After filtration using 0.22 μm of the organic filter membrane, 1 μL of the sample was injected and separated using the HPINNOWAX column (30 m × 0.25 cm × 0.25 μm, Agilent Technologies, Palo Alto, CA, USA). Likewise, a calibration curve of the standards (acetic acid, propionic acid, n-butyric acid, i-butyric acid, n-valeric acid, and i-valeric acid) was established to calculate the concentration of SCFAs in each sample.

2.4.7. Analysis of Gut Microbiota

DNA was extracted from the samples after fermentation for 48 h, and then primers were designed based on the conserved region, which was performed as previously reported [18]. Briefly, DNA in fermented mixtures was extracted by using a QIAamp DNA stool mini kit (Qiagen, Shanghai, China) according to the manufacturer’s procedures. Next, universal primers (338F and 806R) were applied for the amplification of the 16S rRNA gene. The targeted sequences were amplified via PCR and its products were purified, quantified, and homogenized to get a sequencing library. On this basis, the library QC was performed for constructing libraries. Qualified libraries were sequenced using Illumina Novaseq 6000. First, the original sequenced sequence was filtered via Trimmatic v 0.33. Then, the primer sequence was identified and eliminated using cutadapt 1.9.1 to get the high-quality reads. Based on overlapping sequences, the filtered sequence of each sample was spliced using Usearch v.10.0, and then the length of the spliced data was filtered according to the length range of different regions. Chimeric sequences were discriminated and eliminated via UCHIME v4.2, and the effective data were obtained. Reads with similarity above 97.0% were clustered using Usearch to obtain OTUs. SILVA was used as the reference database to count the composition of the sample communities at different levels, and we applied QIIME software to create species abundance charts at different classification levels. Gene functions were predicted via PICRUSt software and analyzed according to the Kyoto Encyclopedia of Genes and Genomes (KEGG) database.

2.5. Statistical Analysis

All experiments were expressed as mean ± standard deviations of triplicate determinations. Statistical analysis was performed by OriginLab 2022 (OriginLab Corporation, Northampton, MA, USA). One-way analysis of variance (ANOVA) with Duncan’s multiple range test was carried out to determine any significant differences (p < 0.05).

3. Results and Discussion

3.1. Digestive Properties of DP during In Vitro Simulated Digestion

3.1.1. Reducing Sugar Content

During the initial digestion process, the CR in DP was 0.127 ± 0.011 mg/mL (Table 1). At the end of the salivary digestion stage, the CR had raised to 0.129 ± 0.002 mg/mL, indicating that DP could not be decomposed during oral digestion. This result may be due to the fact that, as the main enzyme in human saliva, salivary α-amylase usually acts on α-1,4-glycosidic linkages [19]. Similarly, the CR also had no significant change during gastric digestion, ranging from 0.252 ± 0.054 mg/mL to 0.295 ± 0.011 mg/mL. The presence of substances such as an acidic environment, electrolytes, and digestive enzymes in the stomach may have caused the change in the CR from the oral phase to the gastric phase. However, there was no significant change in the CR in the gastric phase, indicating that DP was not broken down and destroyed. Similar results were also found in the gastric digestion of Gracilaria rubra polysaccharides [20]. Due to the presence of reducing sugar in the simulated small intestine fluid, the CR in the initial simulated small intestine digestion increased to 0.789 ± 0.137 mg/mL [20]. However, the CR did not change significantly during the small intestinal digestion, indicating that DP was still stable at this digestion stage. In addition, the total polysaccharides content in DP, DP-O, DP-G, and DP-I was also stable, being in the range of 95.33%–96.53%. These results indicated that DP was overall stable under in vitro simulated digestive conditions, which might be attributed to the fact that DP has a high molecular weight of 1.072 × 10⁶ Da and exhibits a rigid-rod chain conformation in NaCl solution [14].

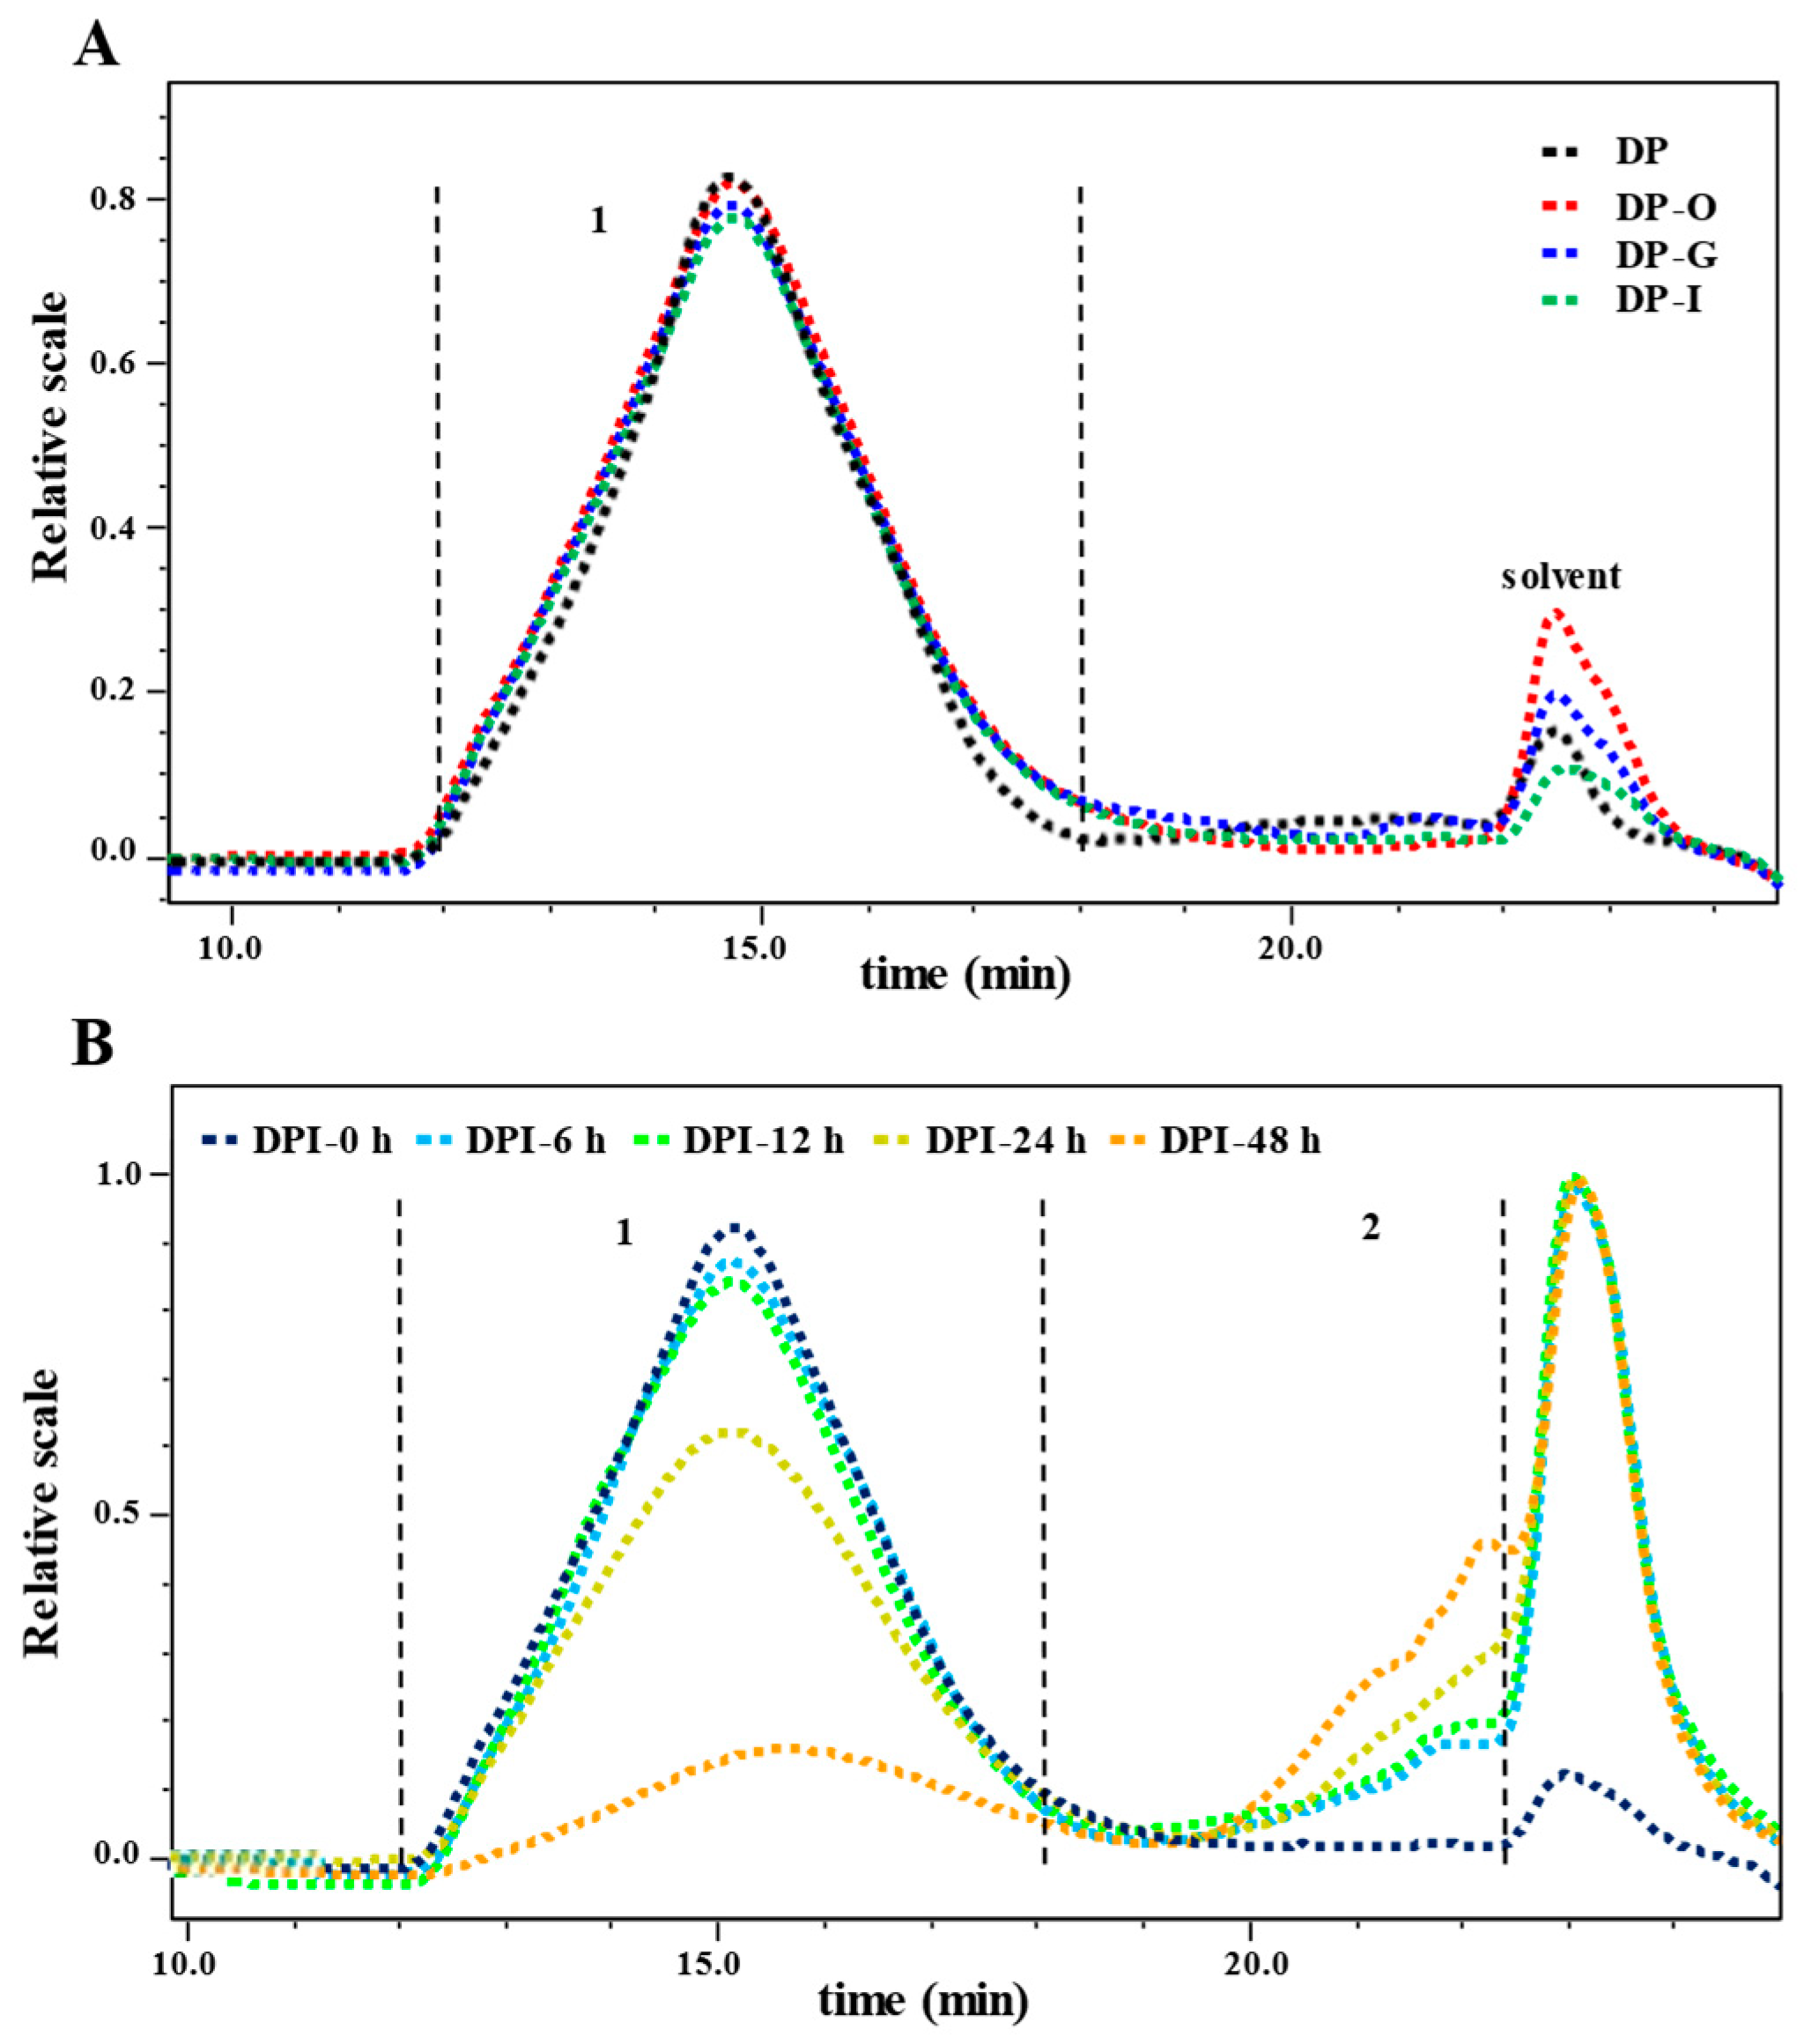
3.1.2. Molecular Weight

As shown in Table 2, the molecular weights of DP, DP-O, DP-G, and DP-I were 1.072 × 10⁶, 1.066 × 10⁶, 1.063 × 10⁶, and 1.061 × 10⁶ Da, respectively. As shown in Figure 2A, it could be seen that the peak did not move during in vitro simulated digestion, which meant that DP could not be digested. This result was analogous to the experimental results of previous studies [21,22]. Results further confirmed that DP was overall stable under in vitro simulated digestive conditions.

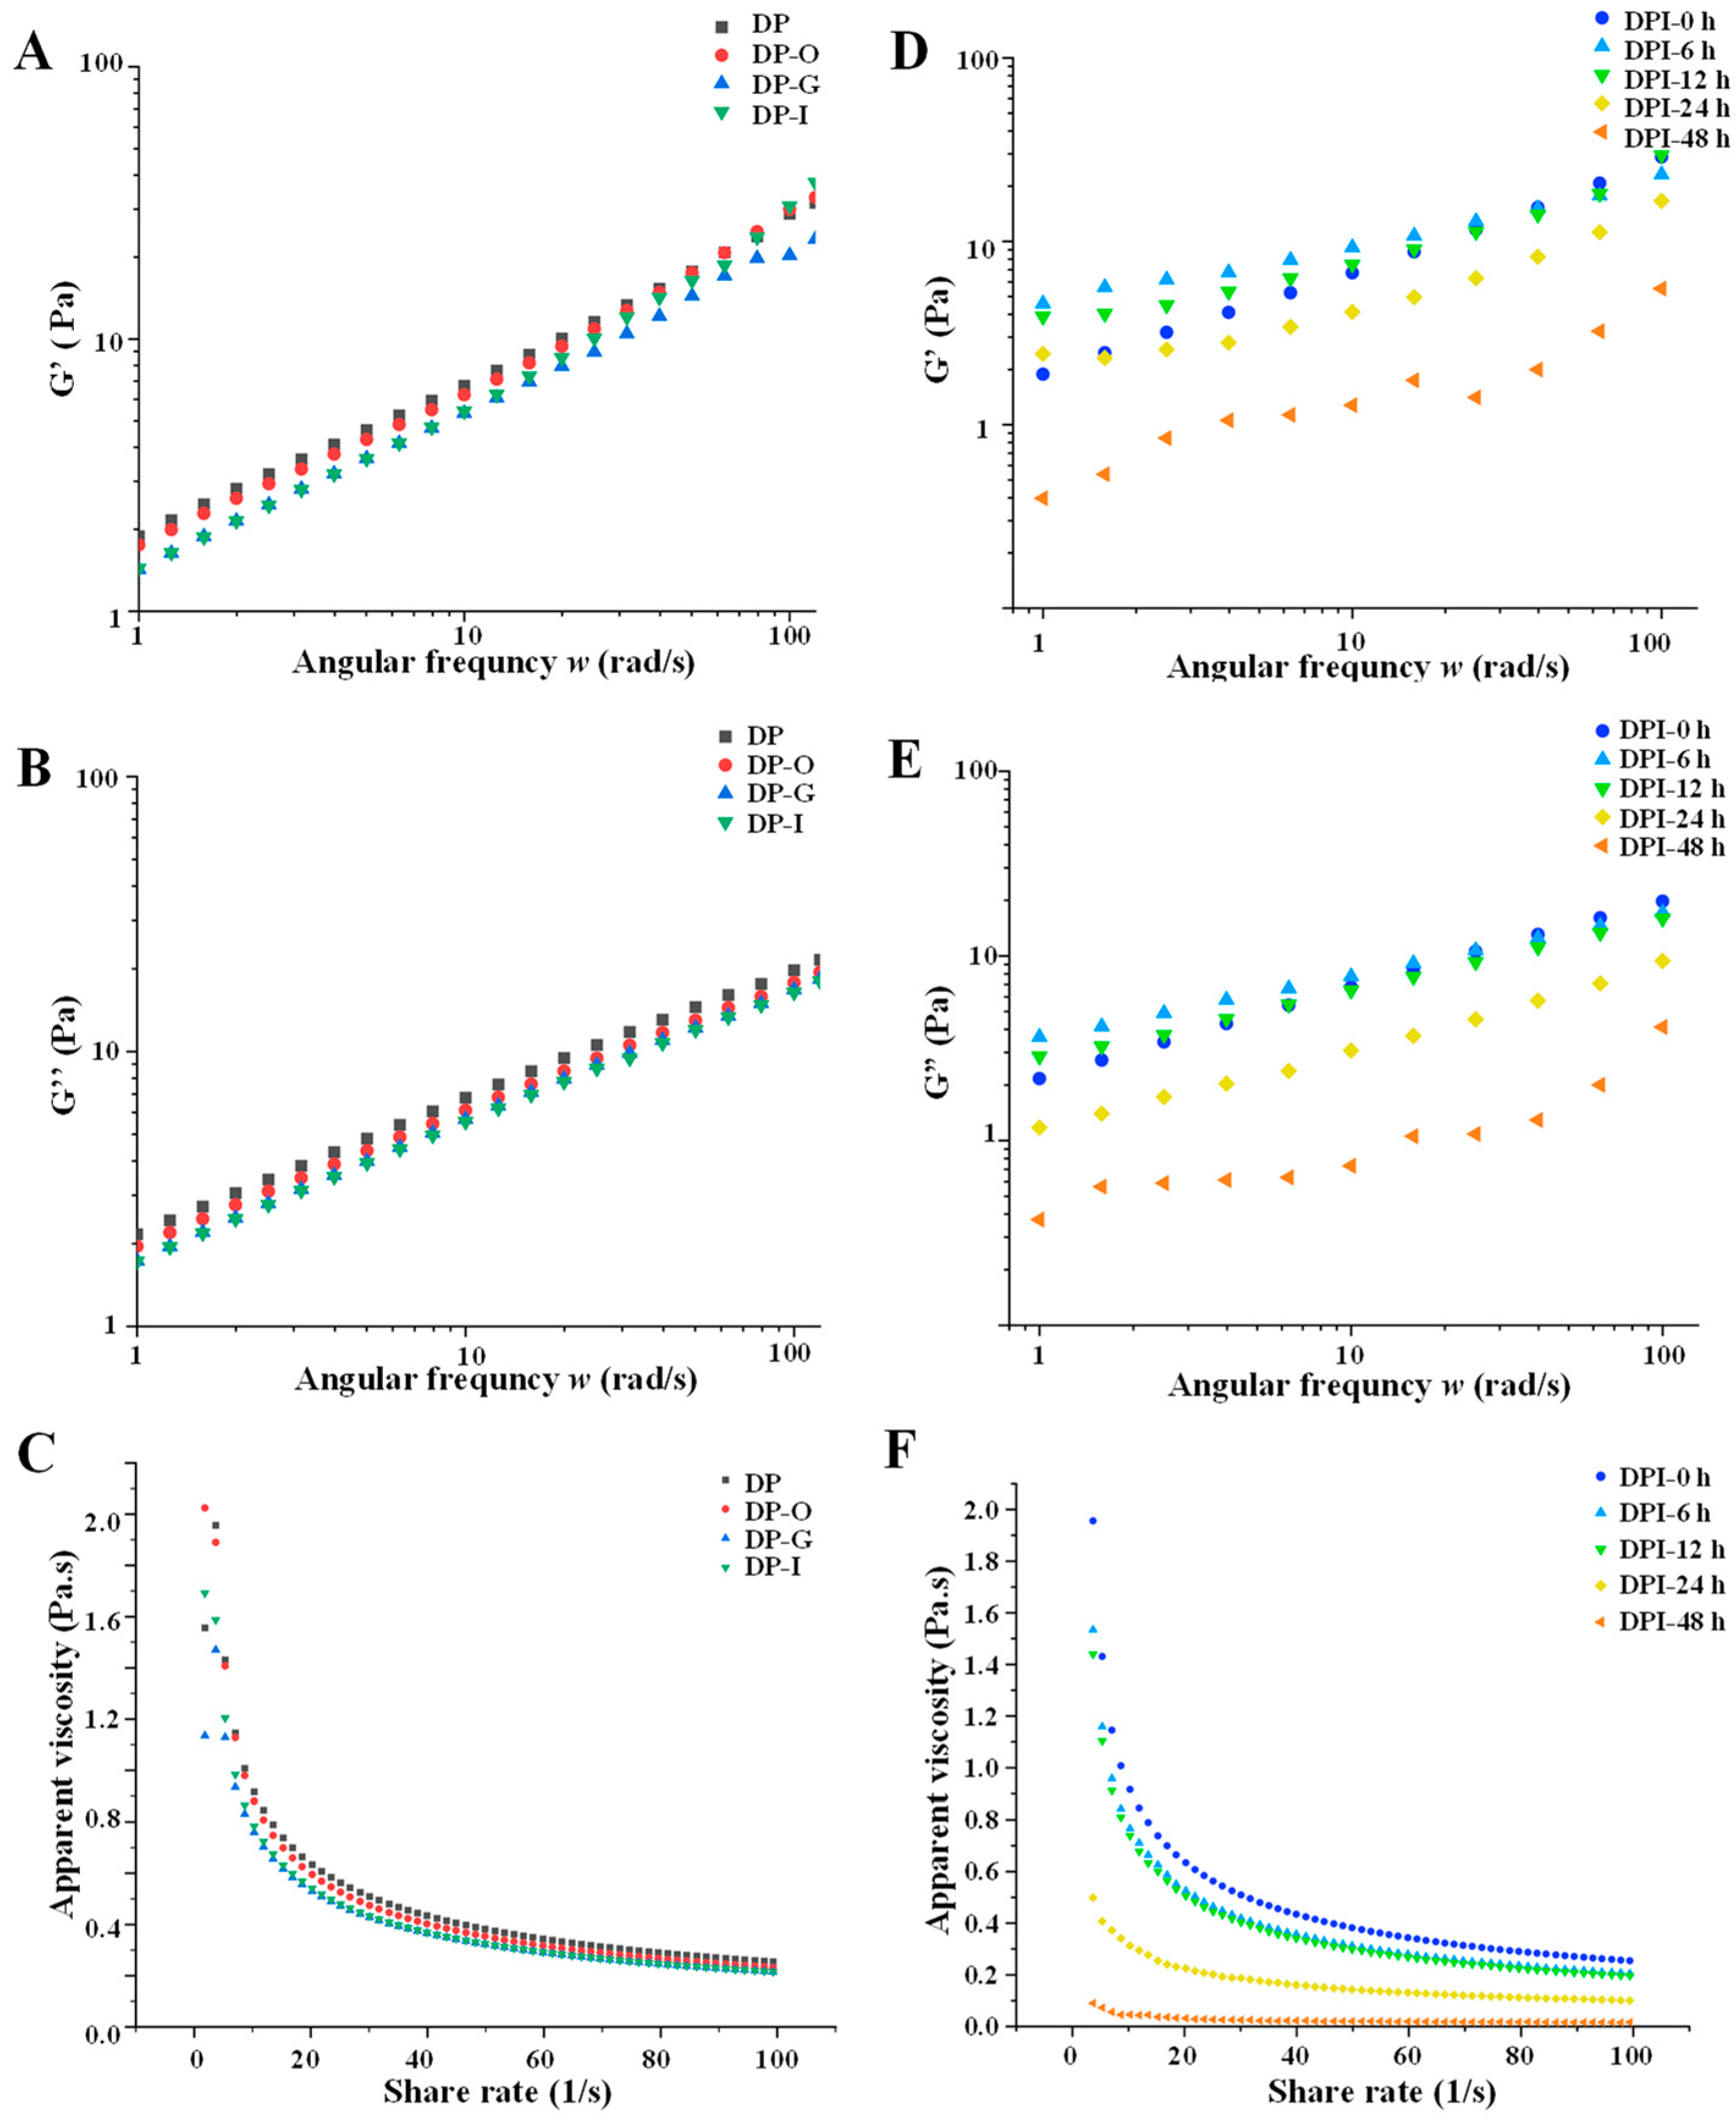
3.1.3. Rheological Properties

At 25 °C, the flow behaviors of DP before and after simulated digestion were determined over a shear rate range of 1–100 s−1. The results showed that the apparent viscosities of the samples (DP, DP-O, DP-G, and DP-I) were affected by the shear rate, respectively, and showed shear thinning behavior and Newtonian fluid behavior (Figure 3C). At the low shear rate, the typical shear thinning behavior could be observed, and there was a negative correlation between apparent viscosity and shear rate. Then, at the high shear rate, the samples showed a Newtonian plateau and remained at the apparent viscosity almost unchanged. This result was consistent with our previous results [10,18]. As shown in Figure 3A,B, the storage modulus (G′) of the samples at the low frequency was higher than the loss modulus (G″), which meant the viscoelastic behaviors of the samples were typical [23]. However, the opposite results were observed at high frequency, indicating that the samples had obvious trends in liquid properties, respectively. These results suggested that in vitro simulated digestion did not affect the G″ and G′ of DP. Overall, the apparent viscosity and modulus results indicated that DP was overall stable across different simulated digestion stages.

3.2. Microbial Fermentation Characteristic of DPI during In Vitro Fecal Fermentation

3.2.1. Changes in Total Polysaccharides Content and Reducing Sugar Content

According to the above results, the simulated digestive solutions did not break down DP, and the indigestible DP (DPI) could reach the large colon almost completely. As shown in Table 1, during the process of in vitro microbial fermentation, the CR of DPI did not change significantly at the time points from 0 h to 12 h, but increased sharply during 12–24 h (0.179 ± 0.005 to 1.539 ± 0.002 mg/mL) and continued to increase until 48 h (2.585 ± 0.021 mg/mL). This result was due to the fact that enzymes released by gut microbiota can act on most non-digestive polysaccharides, decompose the glycosidic linkages of polysaccharides, and produce reducing sugars, thereby stimulating the growth of gut microbiota, which leads to a reduction in the total polysaccharides content [7,10,24]. As shown in Table 2, after the microbial fermentation for 48 h, the total polysaccharides content of DPI decreased from 95.01 ± 1.07% to 51.12 ± 1.01%. At the end of microbial fermentation, the fermentation rate of DPI gradually increased to 46.20%, further indicating that DPI was continuously utilized and decomposed by gut microbiota. Previous studies have shown that intestinal microorganisms, especially Bacteroides, can use dietary polysaccharides as carbon sources for growth [7,20,25].

3.2.2. Changes in Molecular Weight

As shown in Table 2, the molecular weight of fraction 1 in DPI gradually decreased from 1.057 × 10⁶ to 0.595 × 10⁶ Da during the fermentation. Particularly, as demonstrated in Figure 2B, the retention time and peak area of DPI barely altered during the fermentation from 0 h to 12 h. However, after fermentation for 24 h, a degraded fragment (fraction 2) was found in DPI-24 h, and the peak area of fraction 1 in DPI-24 h significantly decreased. Indeed, the molecular weight of fraction 1 in DPI-24 h significantly decreased to 0.851 × 10⁶ Da, and its peak area decreased to 81.1%, while the molecular weight and peak area of fraction 2 increased to 1.519 × 10⁵ Da and 18.9%, respectively, indicating that the gut microbiota significantly decomposed DPI during the fermentation from 12 h to 24 h. Additionally, as the fermentation time progressed from 24 h to 48 h, the molecular weight of fraction 1 in DPI decreased from 0.851 × 10⁶ to 0.595 × 10⁶ Da, demonstrating that DPI was broken down into fragments by microorganisms for their growth. Similar phenomena have been observed in the experimental results of other researchers [7,10,20,25].

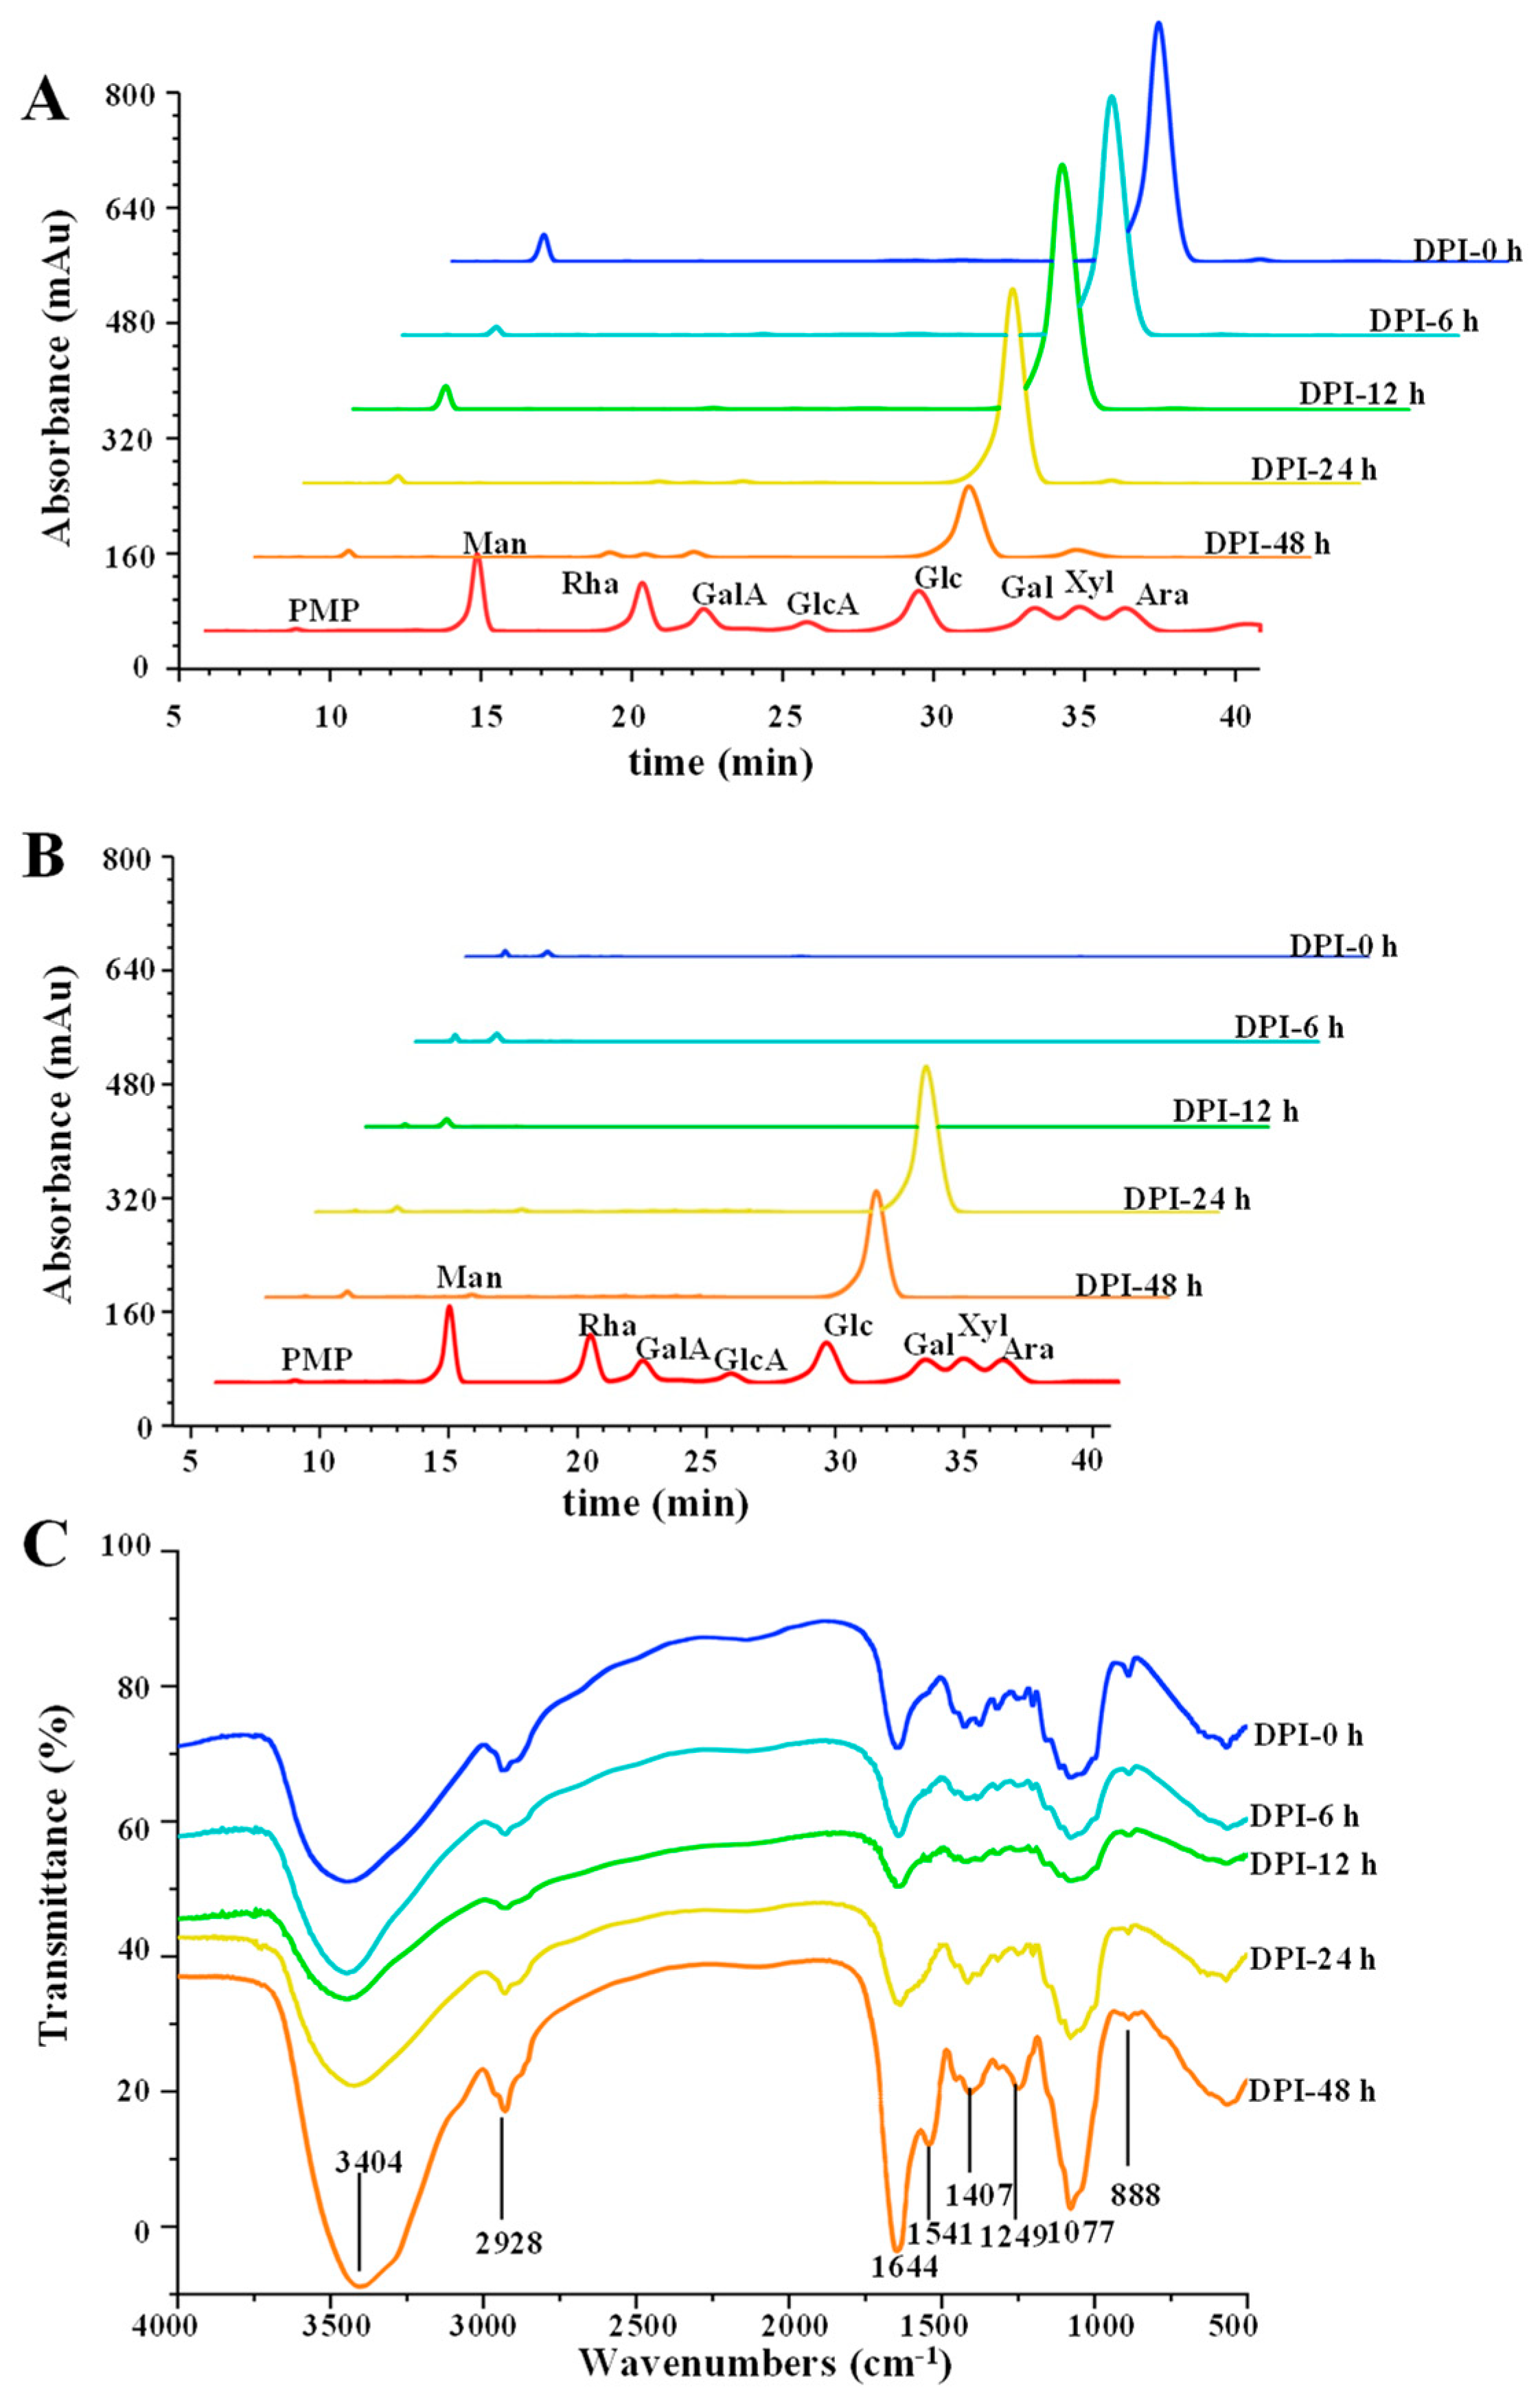
3.2.3. Changes in Monosaccharide Composition and Released Free Monosaccharide

As shown in Figure 4A, the contents of glucose in DPI-0 h, DPI-6 h, and DPI-12 h did not change significantly, but the contents of glucose in DPI-24 h and DPI-48 h decreased significantly, which were in agreement with the changes in total polysaccharides content and CR. The released free glucose was not measured in the fermentation broth of DPI-0 h, DPI-6 h, and DPI-12 h (Figure 4B), indicating that the gut microbiota were unable to effectively degrade DPI into monosaccharides during the fermentation from 0 h to 12 h [20]. The released free glucose was detected in the fermentation broth of DPI-24 h, which may be due to the combined action of microbial degradation and microbial utilization [7,20]. The decrease in released free glucose after the fermentation for 48 h indicated that the utilization rate of free glucose by gut microbiota was higher than the decomposition rate of DPI by gut microbiota, resulting in the decrease in glucose content [7,26].

3.2.4. Changes in FT-IR Spectra

As shown in Figure 4C, during the fermentation process, the characteristic absorption bands of the FT-IR spectra of the fermented samples were analogous. More specifically, the O-H tensile vibration had a connection with the absorption peak at 3404 cm−1 [27]. The peak at 2928 cm−1 was due to the C-H stretching vibration of the methylene group [28]. The signal peak of 1644 cm−1 may be due to bound water, and the C-O contraction vibration corresponded to the signal at 1407 cm−1 [4]. The absorption peak at 1250 cm−1 was according to C-O-C [25]. The signal at 1077 cm−1 came from the pyranosyl ring [29]. Signal representation at 888 cm−1 was attributed to β-glucan [30]. In addition, the infrared spectrum of DPI-48 h showed a small signal peak at 1541 cm−1, which may be N-H bending vibration or C-N stretching vibration of amide band, indicating that several bacteria could produce protein metabolites [29].

3.2.5. Changes in Rheological Properties

The apparent viscosity of polysaccharides perhaps changes the growth of microorganisms by influencing the permeation rate of nutrients, water, and oxygen in the medium [10,31]. Figure 3F showed the changes in apparent viscosity of DPI during in vitro fermentation. The results showed that the fermented samples showed non-Newtonian shear thinning behavior in the 0.01–50 s−1 shear rate range, but showed near Newtonian flow behavior in the 50–100 s−1 shear rate range [32]. Compared with DPI-0 h, DPI-6 h, and DPI-12 h, the apparent viscosity of DPI-24 h and DPI-48 h decreased significantly. This result may be due to the reduction in the molecular weight of DPI via simulated in vitro fermentation, which led to the decrease in viscosity and the change in the flow behavior of the polysaccharides solution, further supporting that human gut microbiota could utilize DPI [23]. During the whole fermentation process, the storage modulus (G′) and the loss modulus (G″) of the fermented samples decreased over time, and DPI-24 h and DPI-48 h decreased significantly (Figure 3D,E). This result may be related to the decrease in the total polysaccharides content of the fermented samples. In previous studies, it was found that the concentration of polysaccharides was closely associated with the magnitude of the loss modulus (G″) [33].

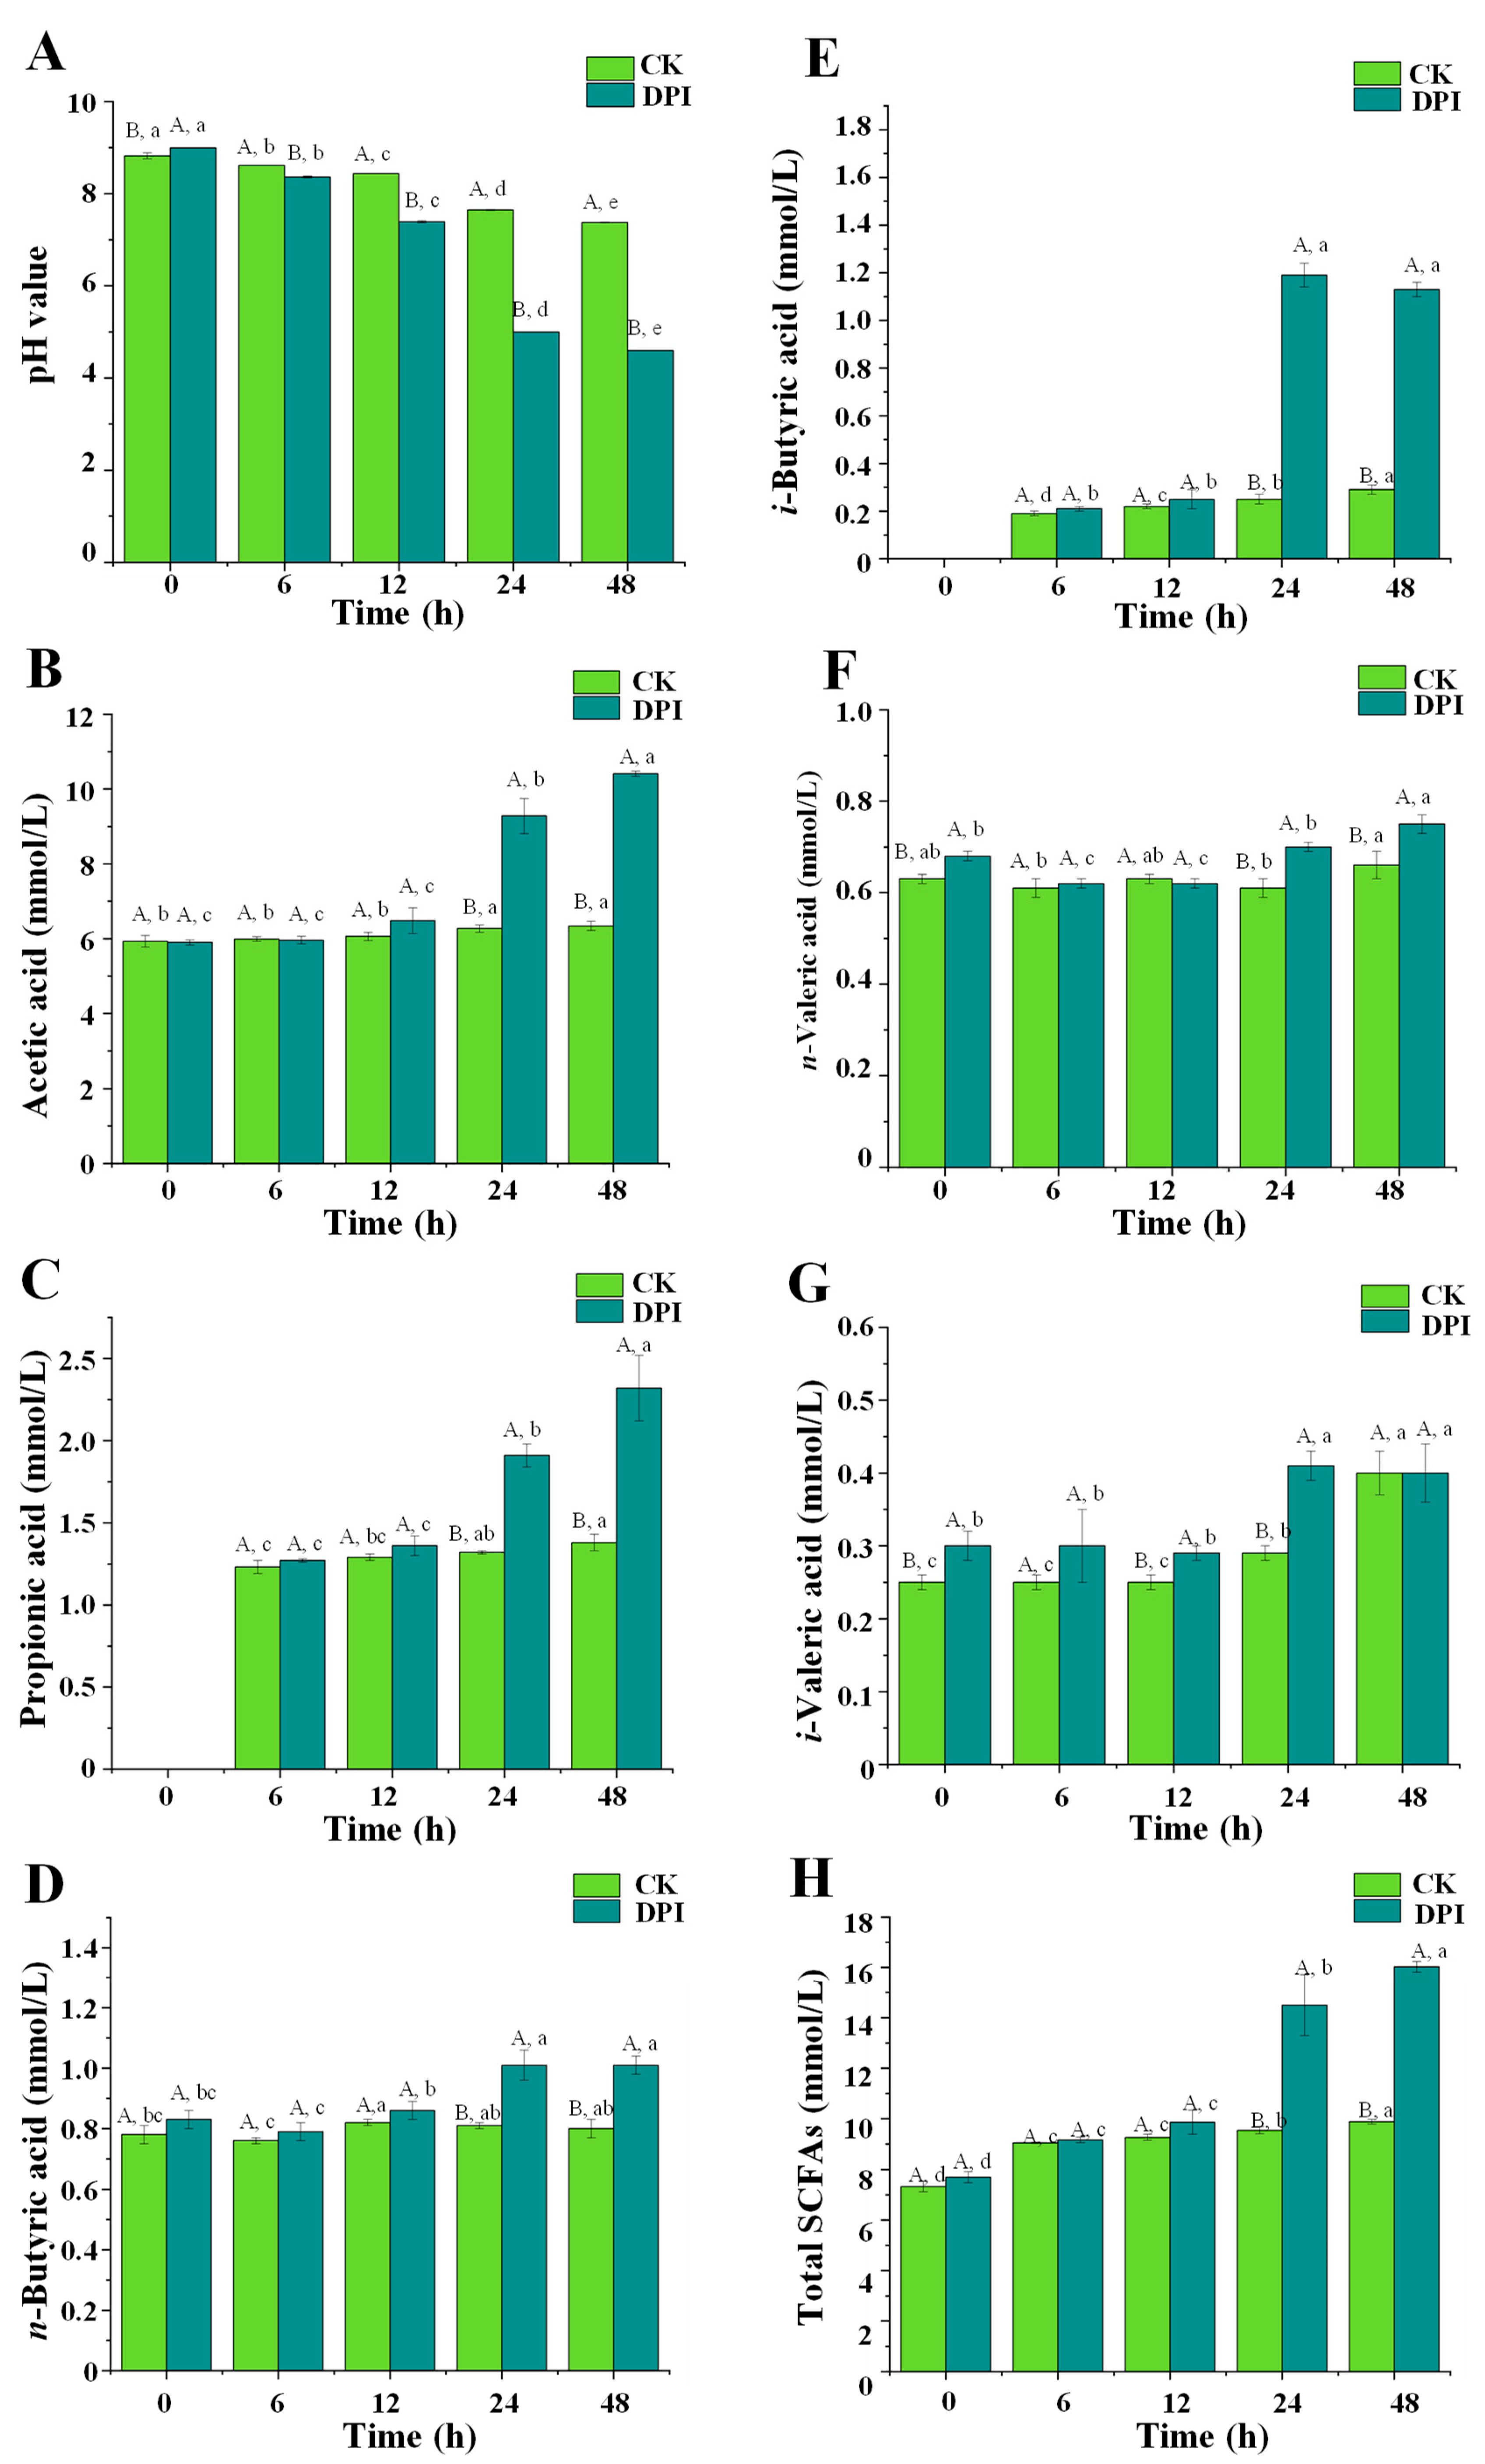
3.2.6. Changes in pH Value and Fermentation Products

Compared with the CK group, the pH value of DPI decreased significantly (Figure 5A), which decreased from 8.99 to 4.60, while the CK group only decreased from 8.82 to 7.37. It was probably due to the fact that DPI could promote the microbial metabolism to generate SCFAs [25]. This result was similar to the results of changes in the pH value and SCFAs of Cookeina speciosa glucans during in vitro fermentation, which also had a large molecular weight (2 × 10⁶ Da) [34]. More specifically, the pH value slightly decreased at the initial fermentation stage from 0 h to 12 h in the DPI group, while it decreased sharply from 12 h to 48 h. The low pH caused by SCFA production can promote some positive physiological effects in the colon. It was found that the low pH was considered to reduce the efficiency of conversion of primary bile acids to secondary bile acids and reduce their carcinogenic potential [35]. It was worth noting that the change behavior of pH value was almost consistent with the dynamic changes in total polysaccharides content and molecular weight in the DPI group during in vitro microbial fermentation. Several studies have shown that SCFAs can regulate energy expenditure and effectively control body weight as well as regulate epithelial cell proliferation and maintain epithelial barrier function to prevent colorectal cancer [11,12,36]. During the microbial fermentation from 12 h to 48 h, the content of total SCFAs in the DPI group increased significantly from 7.7 ± 0.22 mmol/L to 16.02 ± 0.22 mmol/L (Figure 5H). This result showed that the fecal microbial activity was lower in the early stage of fermentation (0–12 h) and higher in the middle (12–24 h) and late (24–48 h) stages of fermentation, which had a bearing on the change in pH value. Similar fermentation characteristics have also appeared in previous reports [29,37].
It can be seen from Figure 5B–G that the contents of acetic acid, propionic acid, n-butyric acid, i-butyric acid, n-valeric acid, and i-valeric acid increased significantly in the DPI group after in vitro fermentation for 48 h when compared with those of the CK group (p < 0.05). Indeed, these SCFAs increased rapidly during the fermentation from 12 h to 48 h, which was consistent with the dynamic changes in other physicochemical properties of DPI. The main incremental contributions of SCFAs, including acetate acid, propionic acid, and i-butyric acid, increased to 10.41 ± 0.77 mmol/L, 2.32 ± 0.20 mmol/L, and 1.13 ± 0.03 mmol/L, respectively. This result was also similar to previous studies [18,24]. Acetic acid can improve glucose homeostasis and insulin excretion in animal studies and has good regulation effects on liver function and cholesterol metabolism function [25,38]. Propionic acid, produced in the colon, may have a direct useful effect on adipose tissue by lessening obesity-associated inflammation and promoting glucose uptake and lipogenesis [39]. As an important energy substrate for maintaining the activity of colonic epithelial cells, butyrate has anti-inflammatory effects, and can also inhibit obesity and antagonize tumor production [21,25]. Acetic acid and propionic acid may be produced by Bacteroidetes through a series of glycoside hydrolases and carbohydrate metabolic pathways [21,40]. Clostridium contributes to the production of butyrate, and Megamonas also contributes to the production of SCFAs [41]. Although n-valeric acid and i-valeric acid increased significantly after in vitro fermentation for 48 h, their levels were low, perhaps owing to the fact that the microorganisms producing these SCFAs constituted only a small fraction of gut microbiota [37]. The small amount of SCFAs produced in the CK group after in vitro fermentation for 48 h may be due to the decomposition of some branched chain amino acids such as valine, leucine, and isoleucine [40].

3.2.7. Effect of DPI on the Microbial Composition
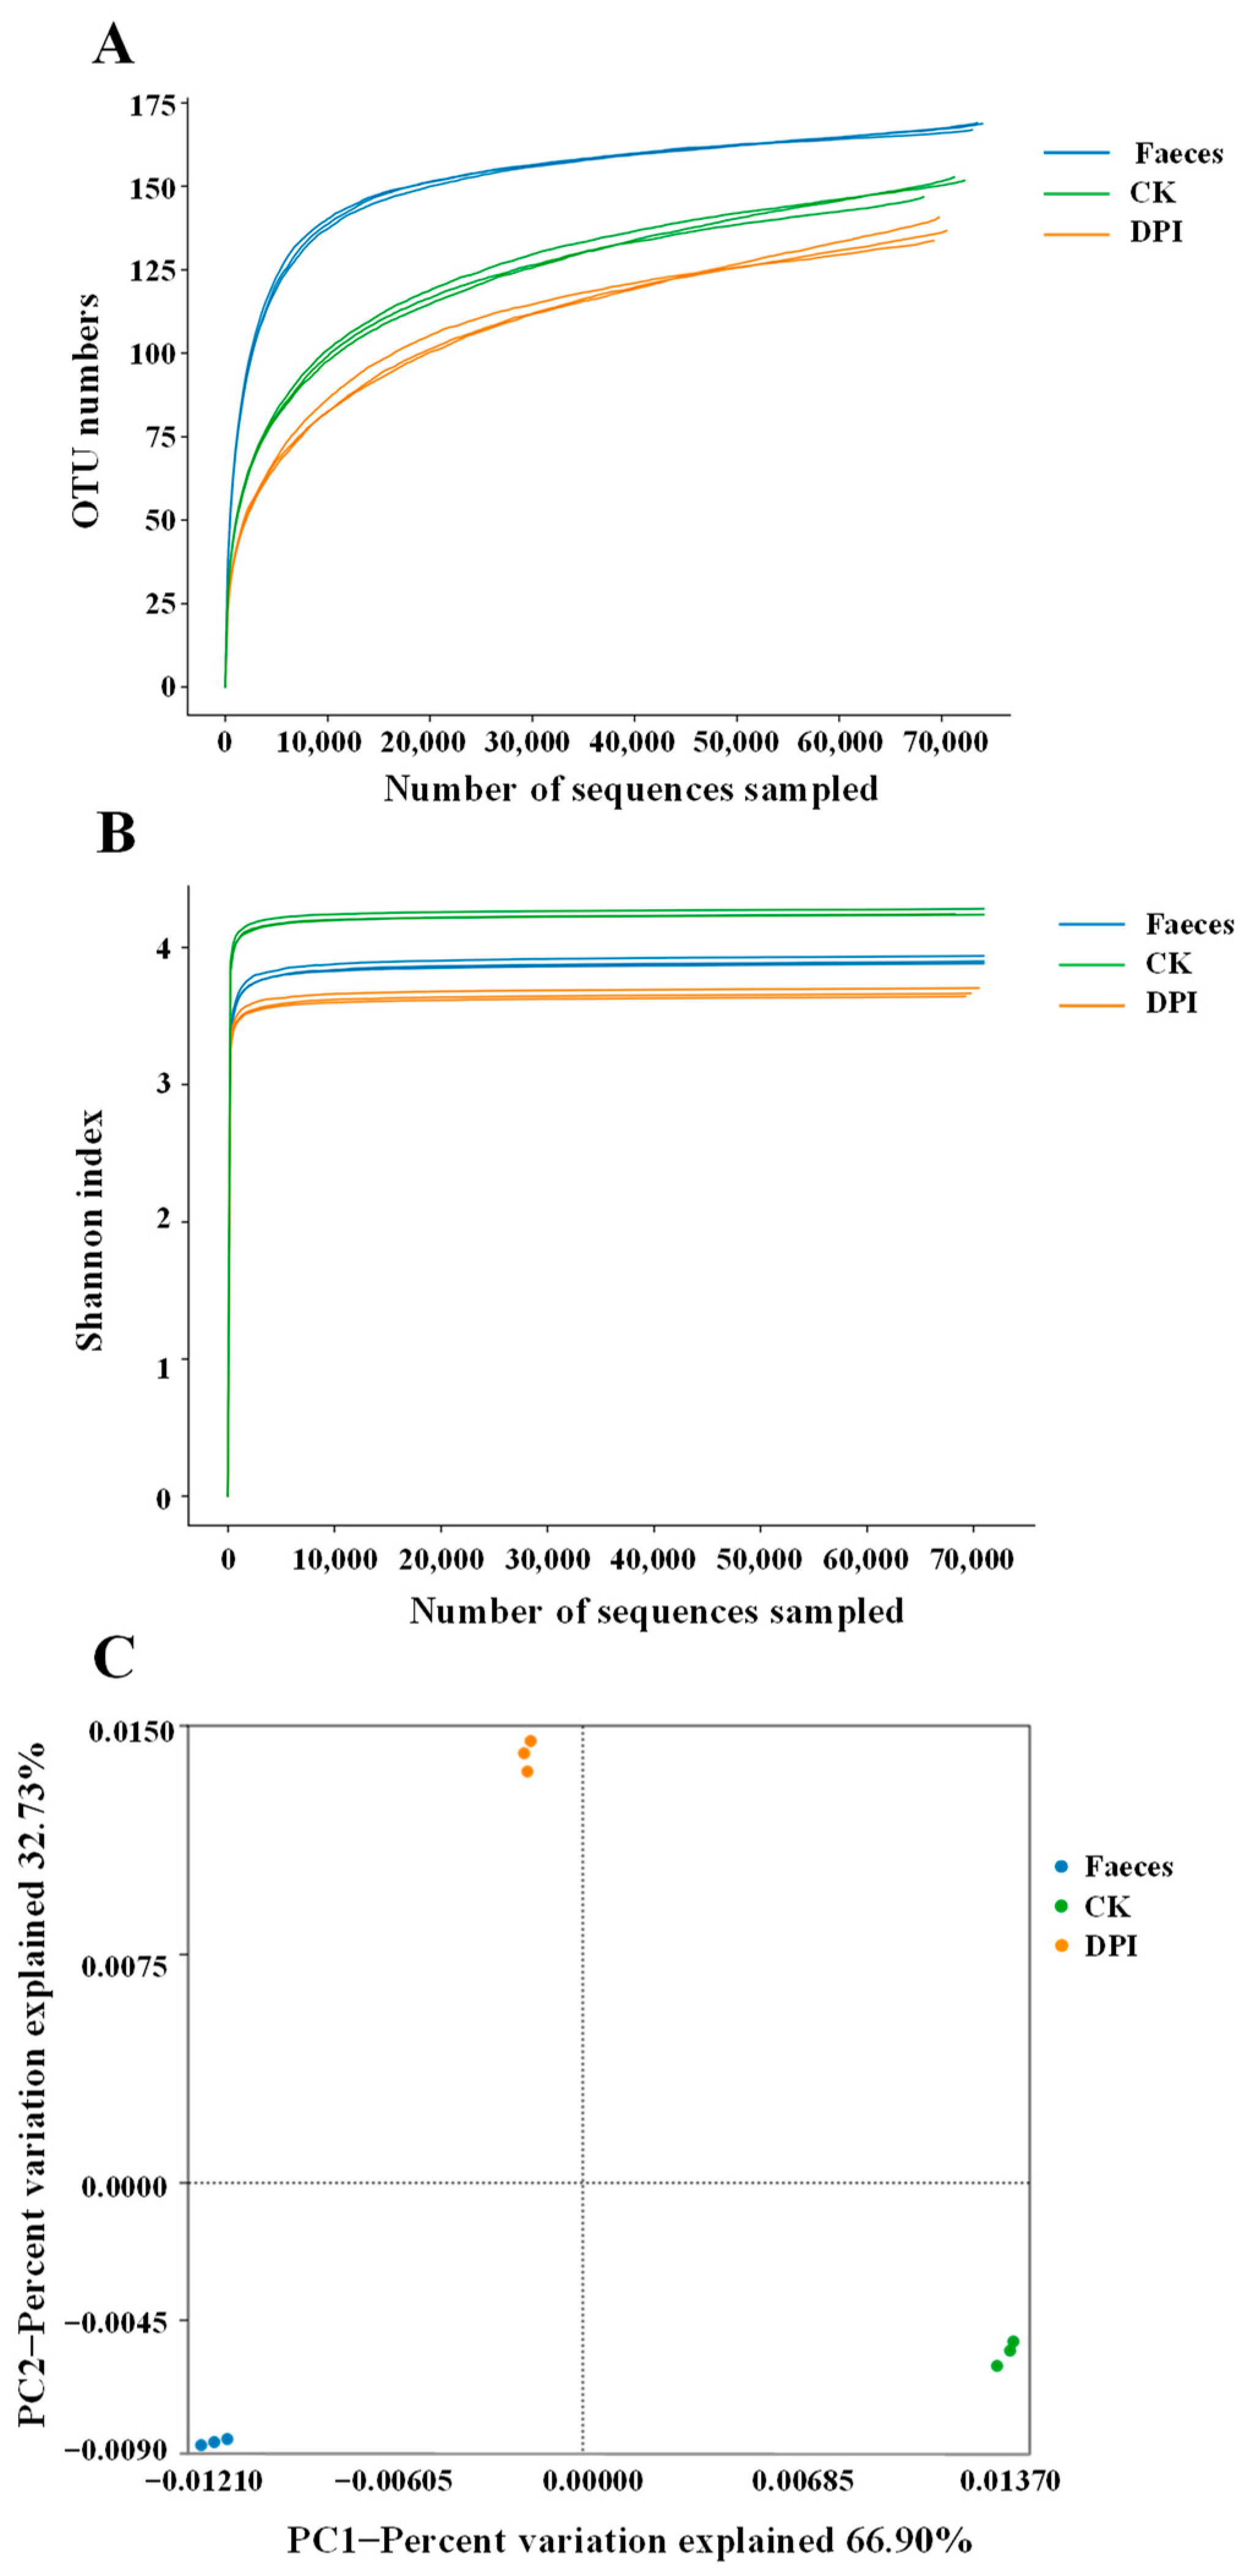
Diversity Analysis

The dilution curve and Shannon index are important indexes in α-diversity analysis, reflecting the species abundance and species diversity of samples. As shown in Figure 6A, when the sequencing depth and sample size were enlarged, it was difficult to find more OTUs, which suggested that the sample size and sequencing depth were sufficient to investigate gut microbiota. Similarly, the larger the Shannon index, the more species. When the curve tends to be gentle, the quantity of the sequencing data was sufficiently large (Figure 6B). It can be seen from both images that the abundance and diversity of the OTUs of the gut microbiota in the DPI group were significantly lower than those in the CK and Feces groups. The decrease in the Shannon index might be attributed to the competitive effect of the dominant microbial community, which is a common phenomenon after simulated fermentation of dietary polysaccharides with intestinal regulation function [25]. Principal component analysis (PCA) can show the genetic relationship of microbial communities among different groups [21]. As shown in Figure 6C, PC1 and PC2 contributed for 66.90% and 32.73% of the variation, respectively, which meant that there was a significant discrepancy in the gut microbial composition among DPI, CK, and Feces groups. The overall results showed that the gut microbial composition of the DPI group changed significantly compared with the CK and Feces groups.

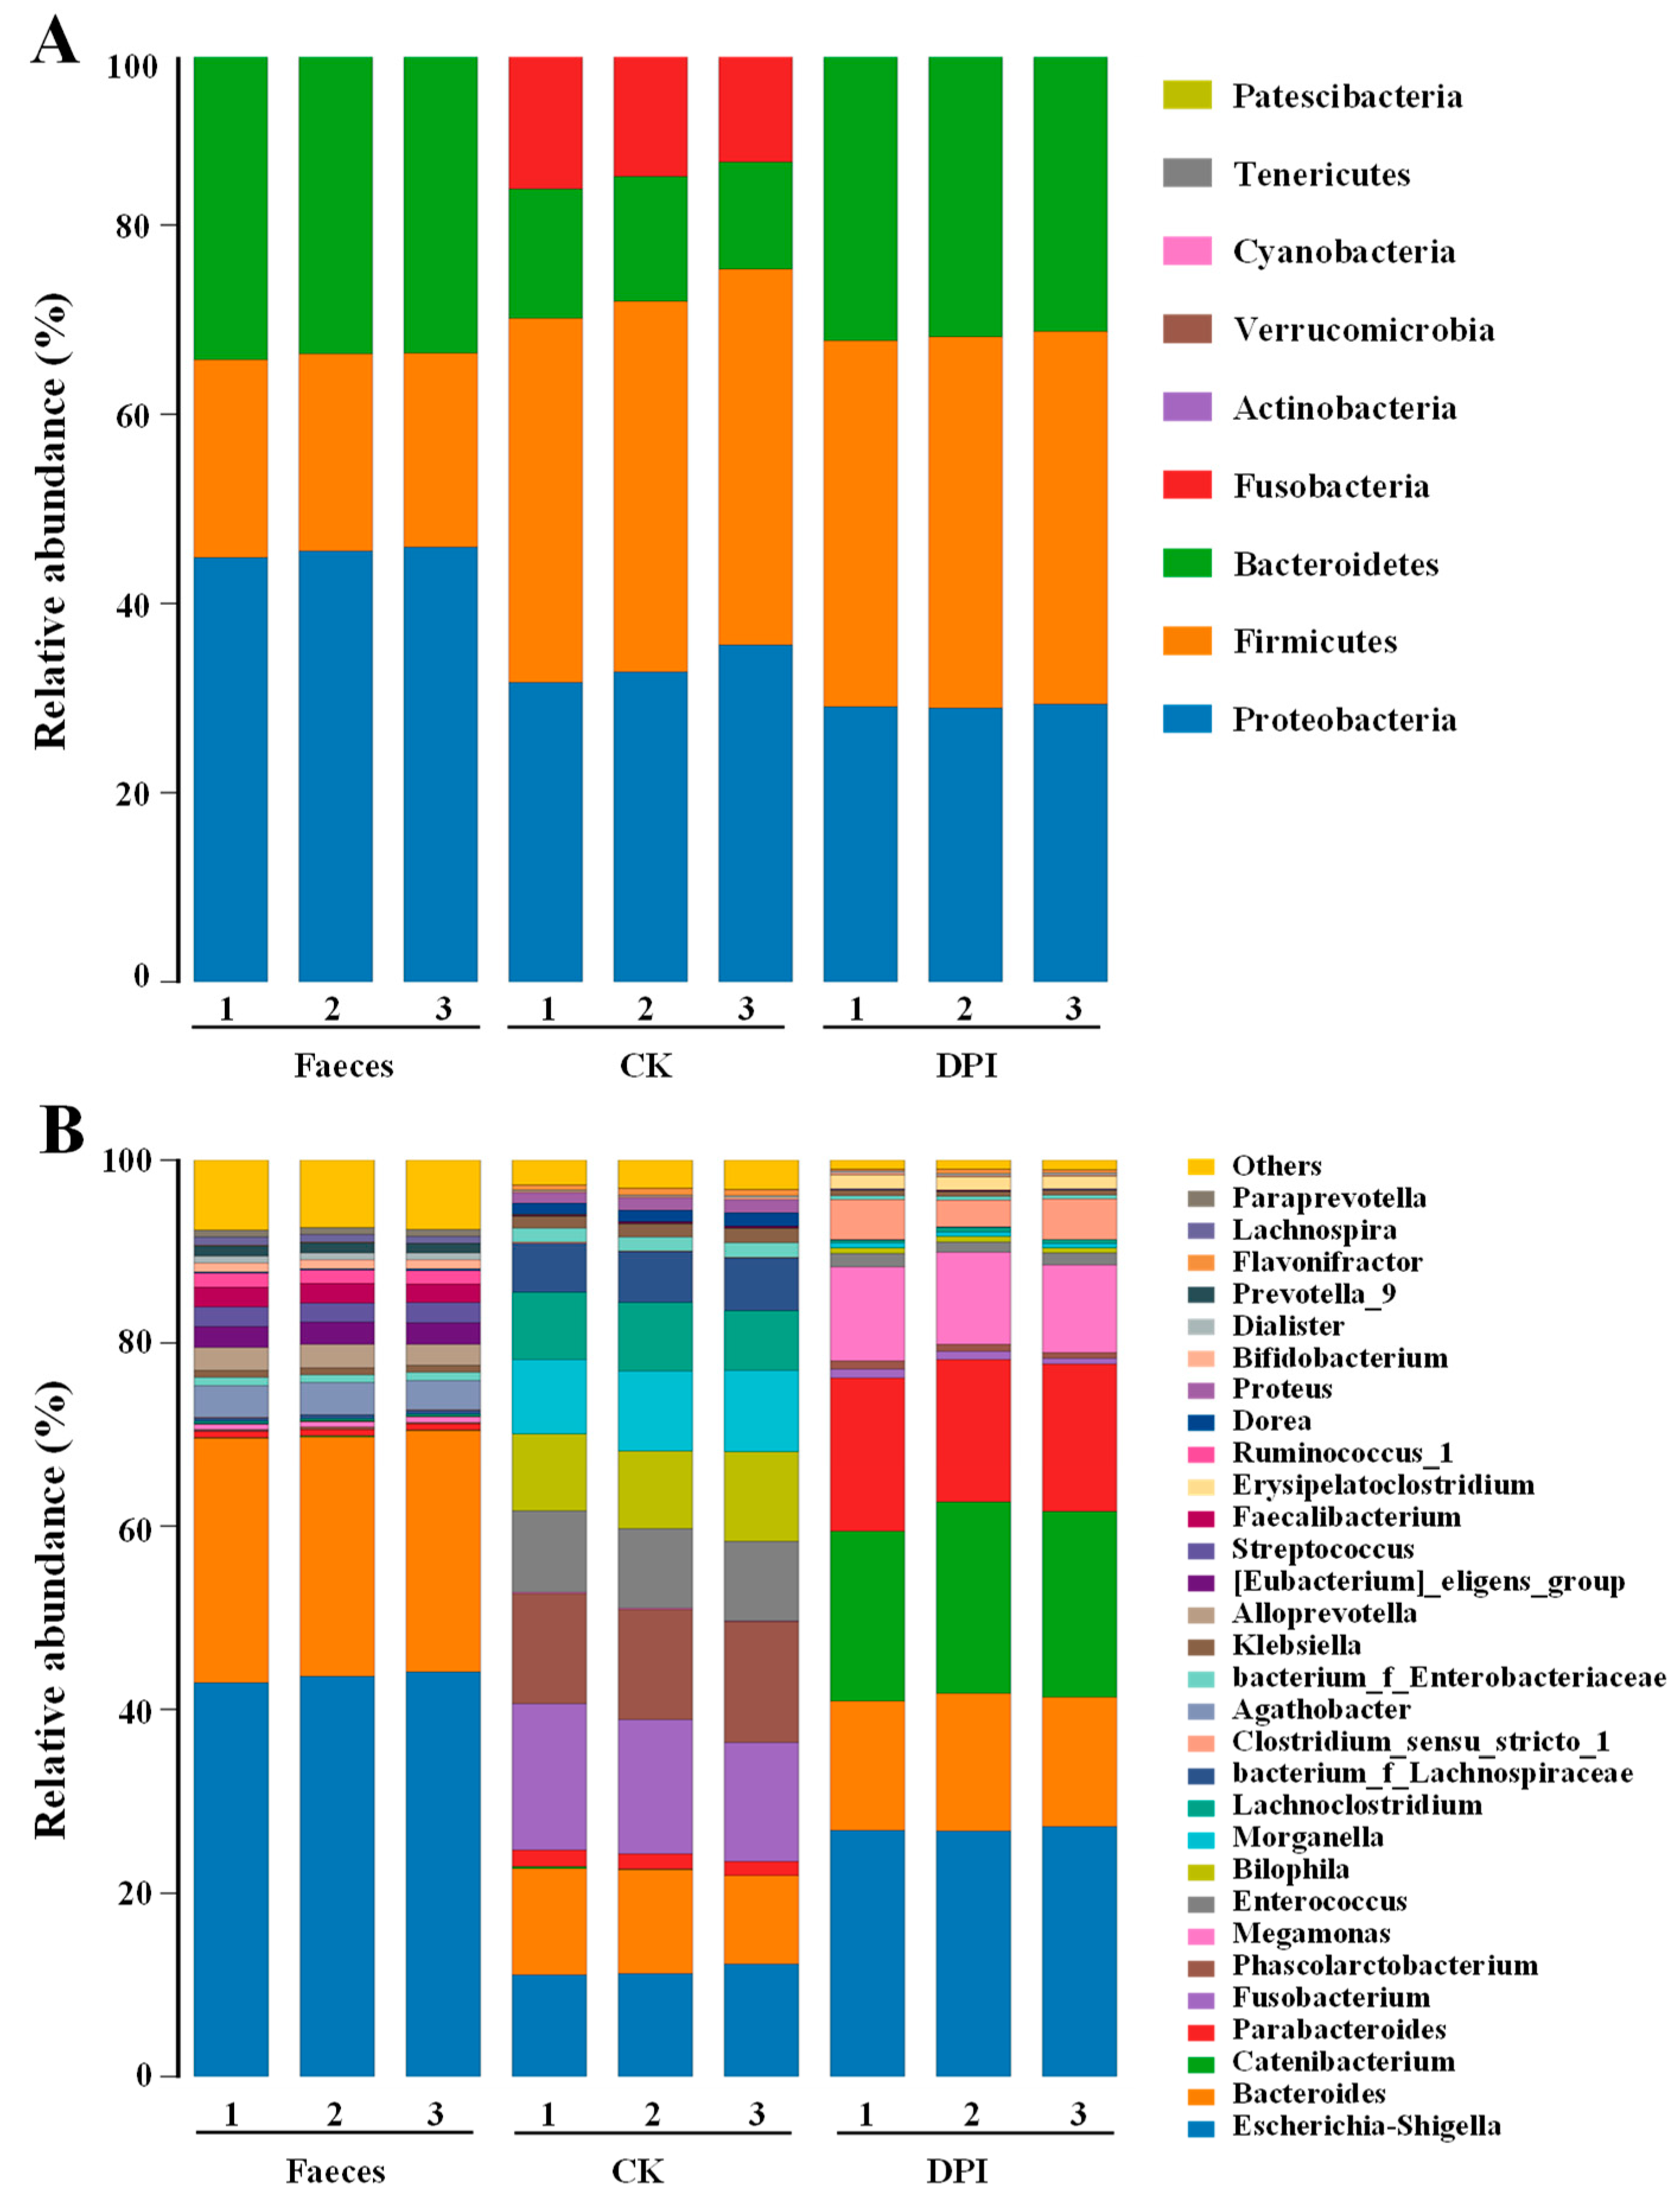
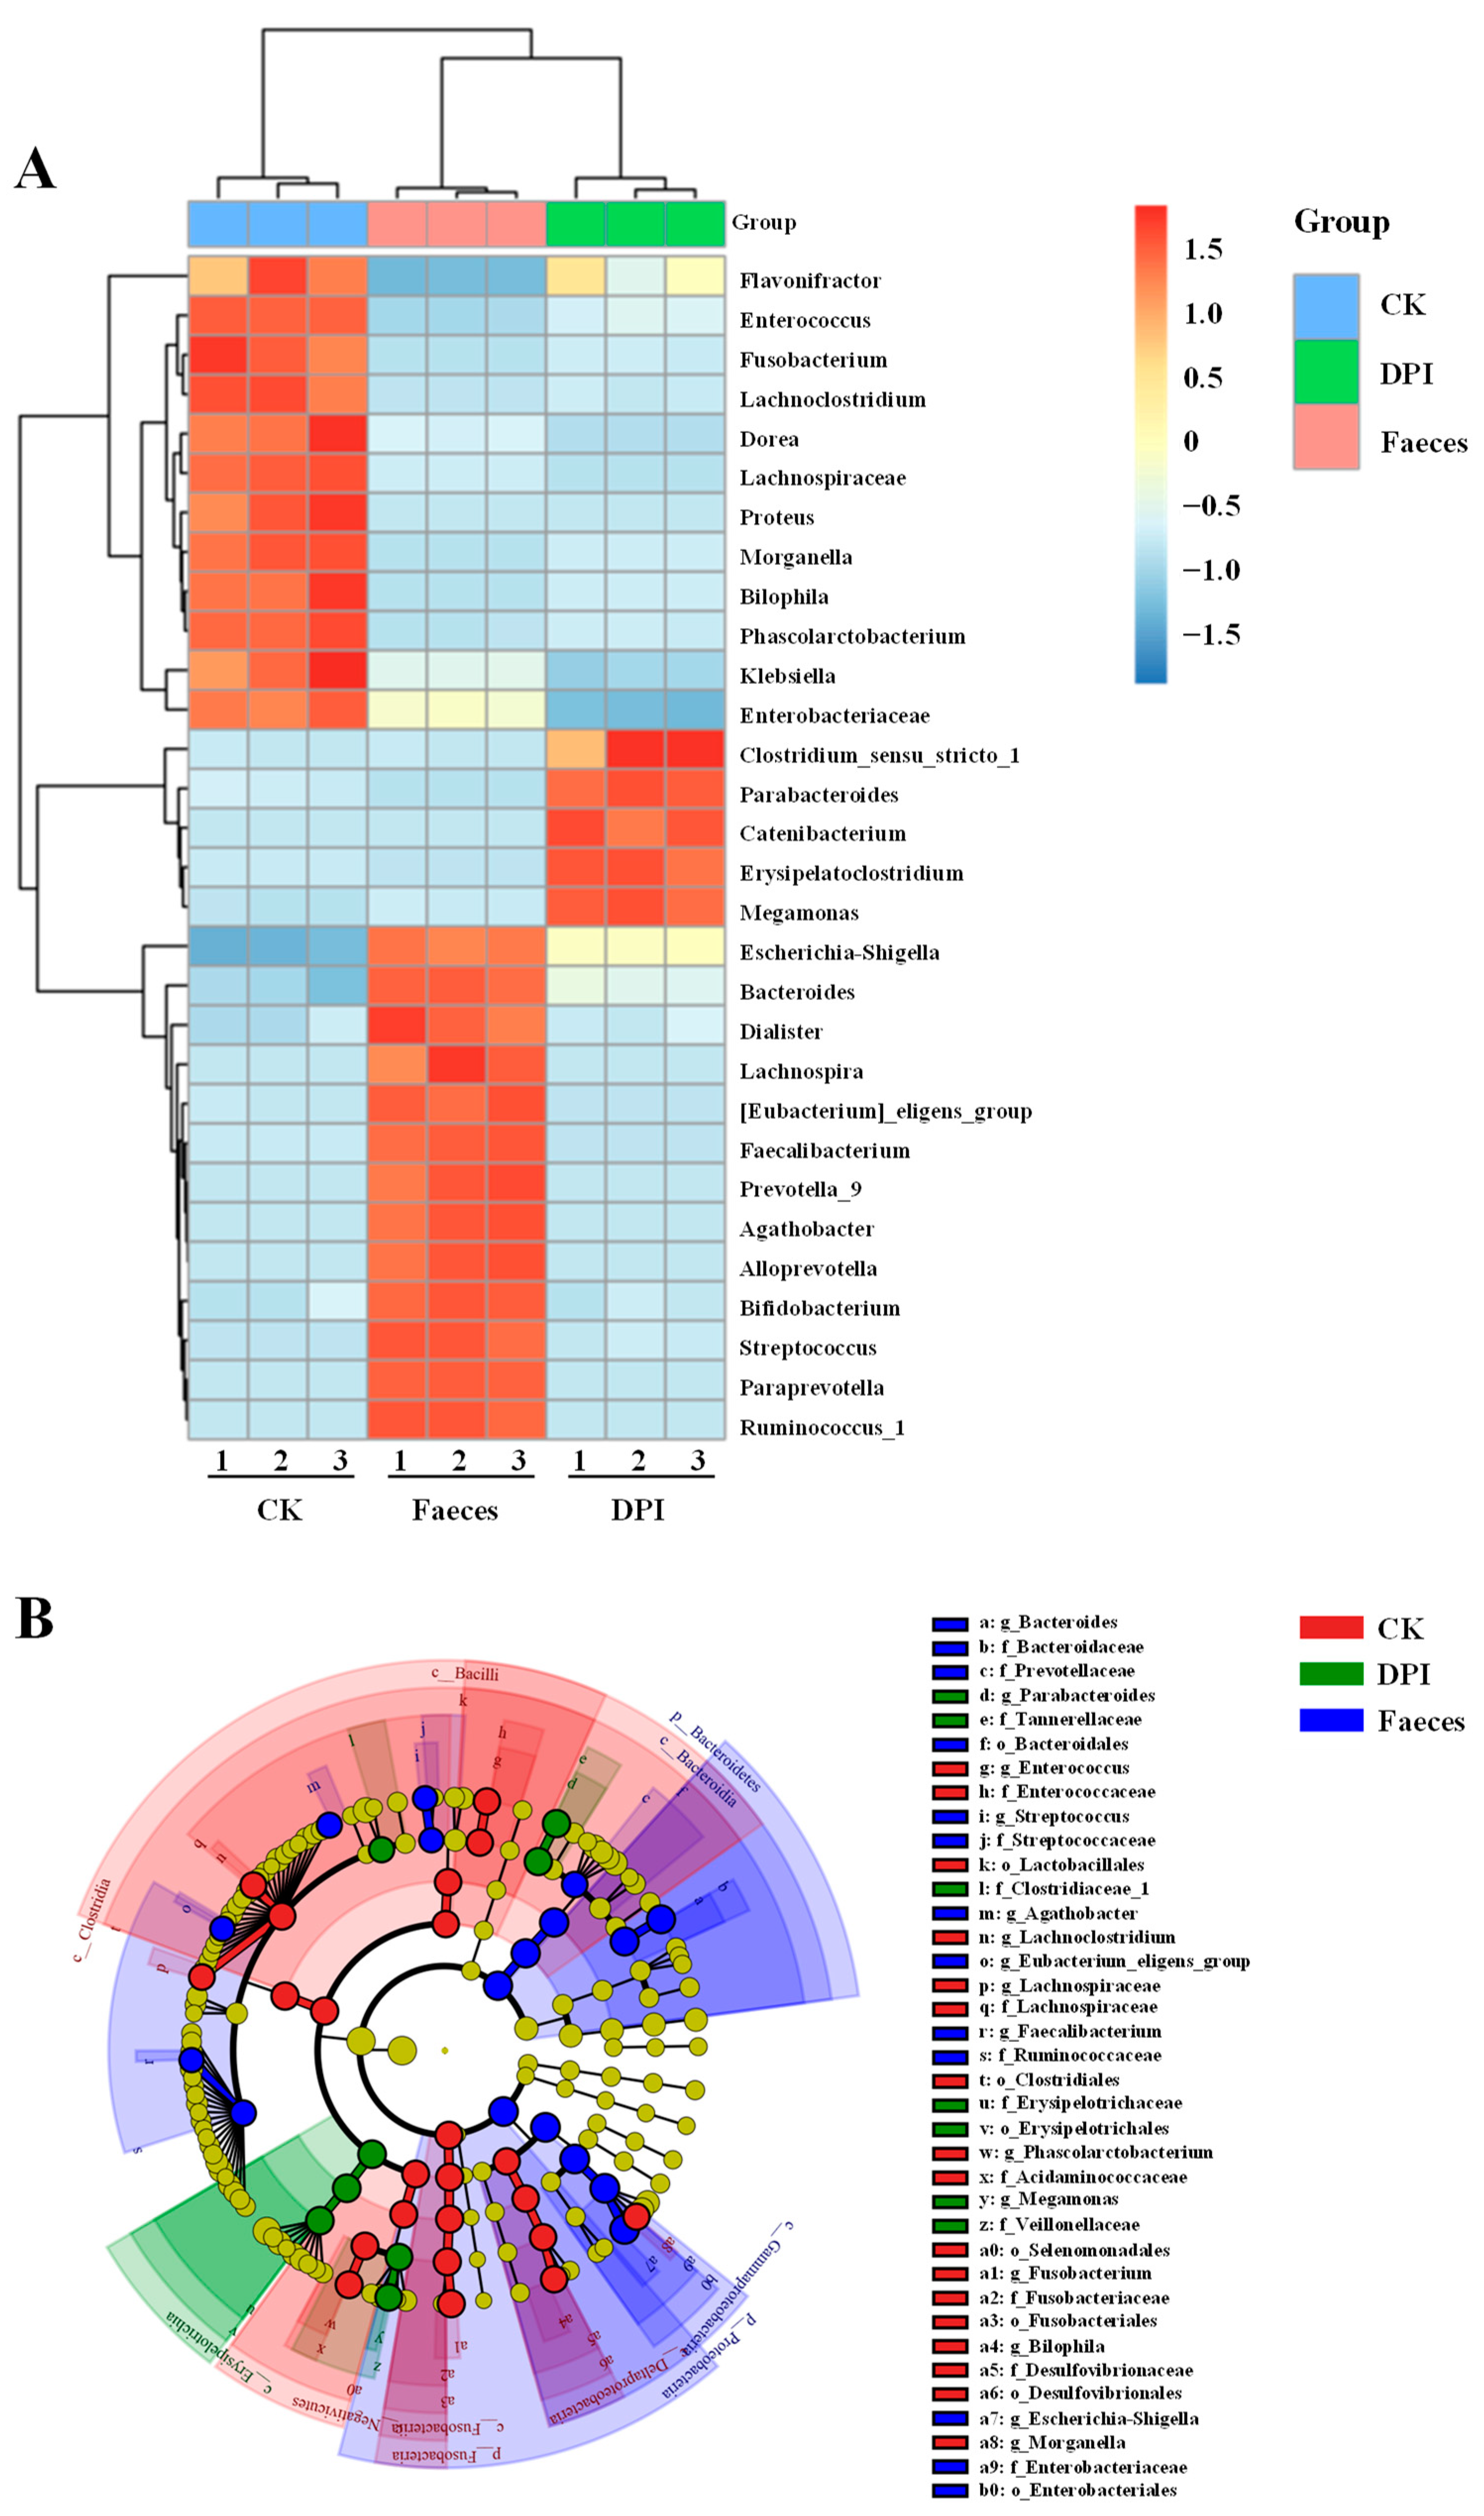
Species Annotation and Taxonomic Analysis

At the phylum level (Figure 7A), the DPI group was mainly made up of 39.10% Firmicutes, 30.54% Bacteroidetes, and 29.15% Proteobacteria, and the remaining 1.21% was mainly composed of Fusobacteria, Actinobacteria, and others. The dominant bacteria in the CK group were identified as 39.12% Firmicutes, 33.38% Proteobacteria, 14.49% Fusobacteria, and 12.71% Bacteroidetes. The Feces group was mainly composed of 45.49% Proteobacteria, 20.74% Firmicutes, and 32.48% Bacteroidetes. Compared with the CK and Feces groups, the DPI group significantly improved the relative abundance of Bacteroidetes and significantly reduced the relative abundances of Proteobacteria and Fusobacteria, which indicated that DPI had beneficial effects on the health of gut microbiota, which was similar to the effects of polysaccharides from Lentinula edodes and Pleurotus eryngii on regulating gut microbiota [26,42]. Recently, it has been found that the reduction of Firmicutes and Bacteroidetes and the imbalance of excessive growth of Proteobacteria and Bacillus are the characteristics of patients with inflammatory bowel disease (IBD) [43]. It can be seen that DPI has a positive, promoting effect on IBD. In addition, Bacteroidetes is one of the major gut microorganisms in charge of polysaccharide breakdown [44]. The expression of polysaccharide-degrading enzymes increases in Bacteroidetes and decreases in Firmicutes [45]. One of the biological indicators of obesity is the ratio of Firmicutes-to-Bacteroidetes (F/B), which is usually higher in obese patients [44]. DPI decreased the F:B ratio by raising the abundance of Bacteroidetes, which indicated that DPI might have the effect of reducing obesity. This result was similar to the results found in relation to polysaccharides from loquat leaves, okra, and Gracilaria rubra [7,20,24]. Fusobacteria are generally considered to be pathogens that increase conditionality due to nutritional lack [44]. The relative abundance of Proteobacteria is closely related to the function of intestinal epithelial cells, intestinal inflammation, and immune imbalance, which is an important index to measure intestinal health [46]. Collectively, these results indicated that DPI was able to regulate the composition of intestinal microorganisms, promoting the growth of several beneficial bacteria in particular.
At the genus level (Figure 7B), the DPI group was principally made up of 27.03% Escherichia-Shigella, 14.3% Bacteroides, 19.90% Catenibacterium, 16.14% Parabacteroides, 9.99% Megamonas, 3.90% Clostridium_sensu_stricto_1, and 1.45% Erysipelatoclostridium. Compared with the CK and Feces groups, the DPI group significantly increased the abundances of Catenibacterium, Parabacteroides, Megamonas, and Clostridium_sensu_stricto_1. Catenibacterium is able to metabolize acetic acid, butyric acid, and i-butyric acid using glucose, as extracted from oats β-glucan [47,48]. Recently, the in vivo study has found that Parabacteroides can reduce obesity, insulin tolerance, lipid metabolism chaos, and nonalcoholic fatty liver symptoms [49], and it can secrete β-glucosidase to participate in body metabolism and regulation and maintain the symbiotic relationship between mammals and microorganisms [50]. Based on the analysis of gut microbial composition in patients with cerebral infarction and ischemia, it was observed that the disease results in a low relative abundance of Megamonas in patients [51]. Therefore, DPI can increase Megamonas abundance, which was beneficial to reversing regulation of cerebral infarction and ischemia. Recently, Clostridium was proved to promote the induction of colonic Treg. TLR9 signaling can maintain immune homeostasis by limiting the transformation of Treg cells in the intestinal tract [52,53].
The DPI group also inhibited the proliferation of deleterious pathogenic bacteria compared with the CK and Feces groups. Escherichia-Shigella, Fusobacterium, Bilophila, Morganella, and Lachnoclostridium are all harmful pathogens in intestinal microorganisms. Fusobacterium is related to the pathogenesis of gastric cancer [54]. Bilophila can aggravate metabolic dysfunction induced by a high-fat diet in mice [55]. There is a clear relationship between Morganella and depression. Increasing its abundance will make the risk of depression higher than that of others [56]. Lachnoclostridium can cause atherosclerosis by increasing trimethylamine oxide damage to aortic health [57]. The relative abundance of Escherichia-Shigella increased in the DPI group. The reason for this phenomenon might be in connection with the growth of Escherichia-Shigella by using low molecular weight carbon sources to support itself [37].
The heat map of microbial composition is shown in Figure 8A, showing the abundance of the first 30 bacteria in the CK, DPI, and Feces groups at the genus level. It can be seen that DPI can change the composition of gut microbiota, and the relative abundances of Catenibacterium, Parabacteroides, Megamonas, and Clostridium increased. The clustering tree showed the similarity and distribution characteristics of different gut microbiota in composition. Cluster analysis showed that there was a significant difference in gut microbiota between the CK group and the DPI group. In addition, Lefse analysis is one of the most commonly used methods for analyzing discrepancies in the abundance of gut microbiota. The branch diagram showed the difference in the intestinal microbial community structure and main bacterial groups between the two groups (Figure 8B). Gut microbiota with a higher relative abundance in different groups correspond to three different colored nodes in the diagram. Compared with the CK group, Megamonas, Catenibacterium, and Parabacteroides in the DPI group were the dominant bacteria. These results indicated that DPI could effectively change the gut microbial composition. Nevertheless, polysaccharides derived from different edible mushrooms exhibited different effects on the regulation of gut microbial composition. For example, Flammulina velutipes polysaccharides mainly increased the number of Bifidobacterium and Bacteroidaceae and reduced the numbers of Lachnospiraceae and Enterococcaceae [58]. Pleurotus eryngii polysaccharides mainly upregulated the abundance of Firmicutes [26]. Tremella fuciformis polysaccharides could promote the relative abundances of Phascolarctobacterium, Bacteroides, and Lachnoclostridium [10].

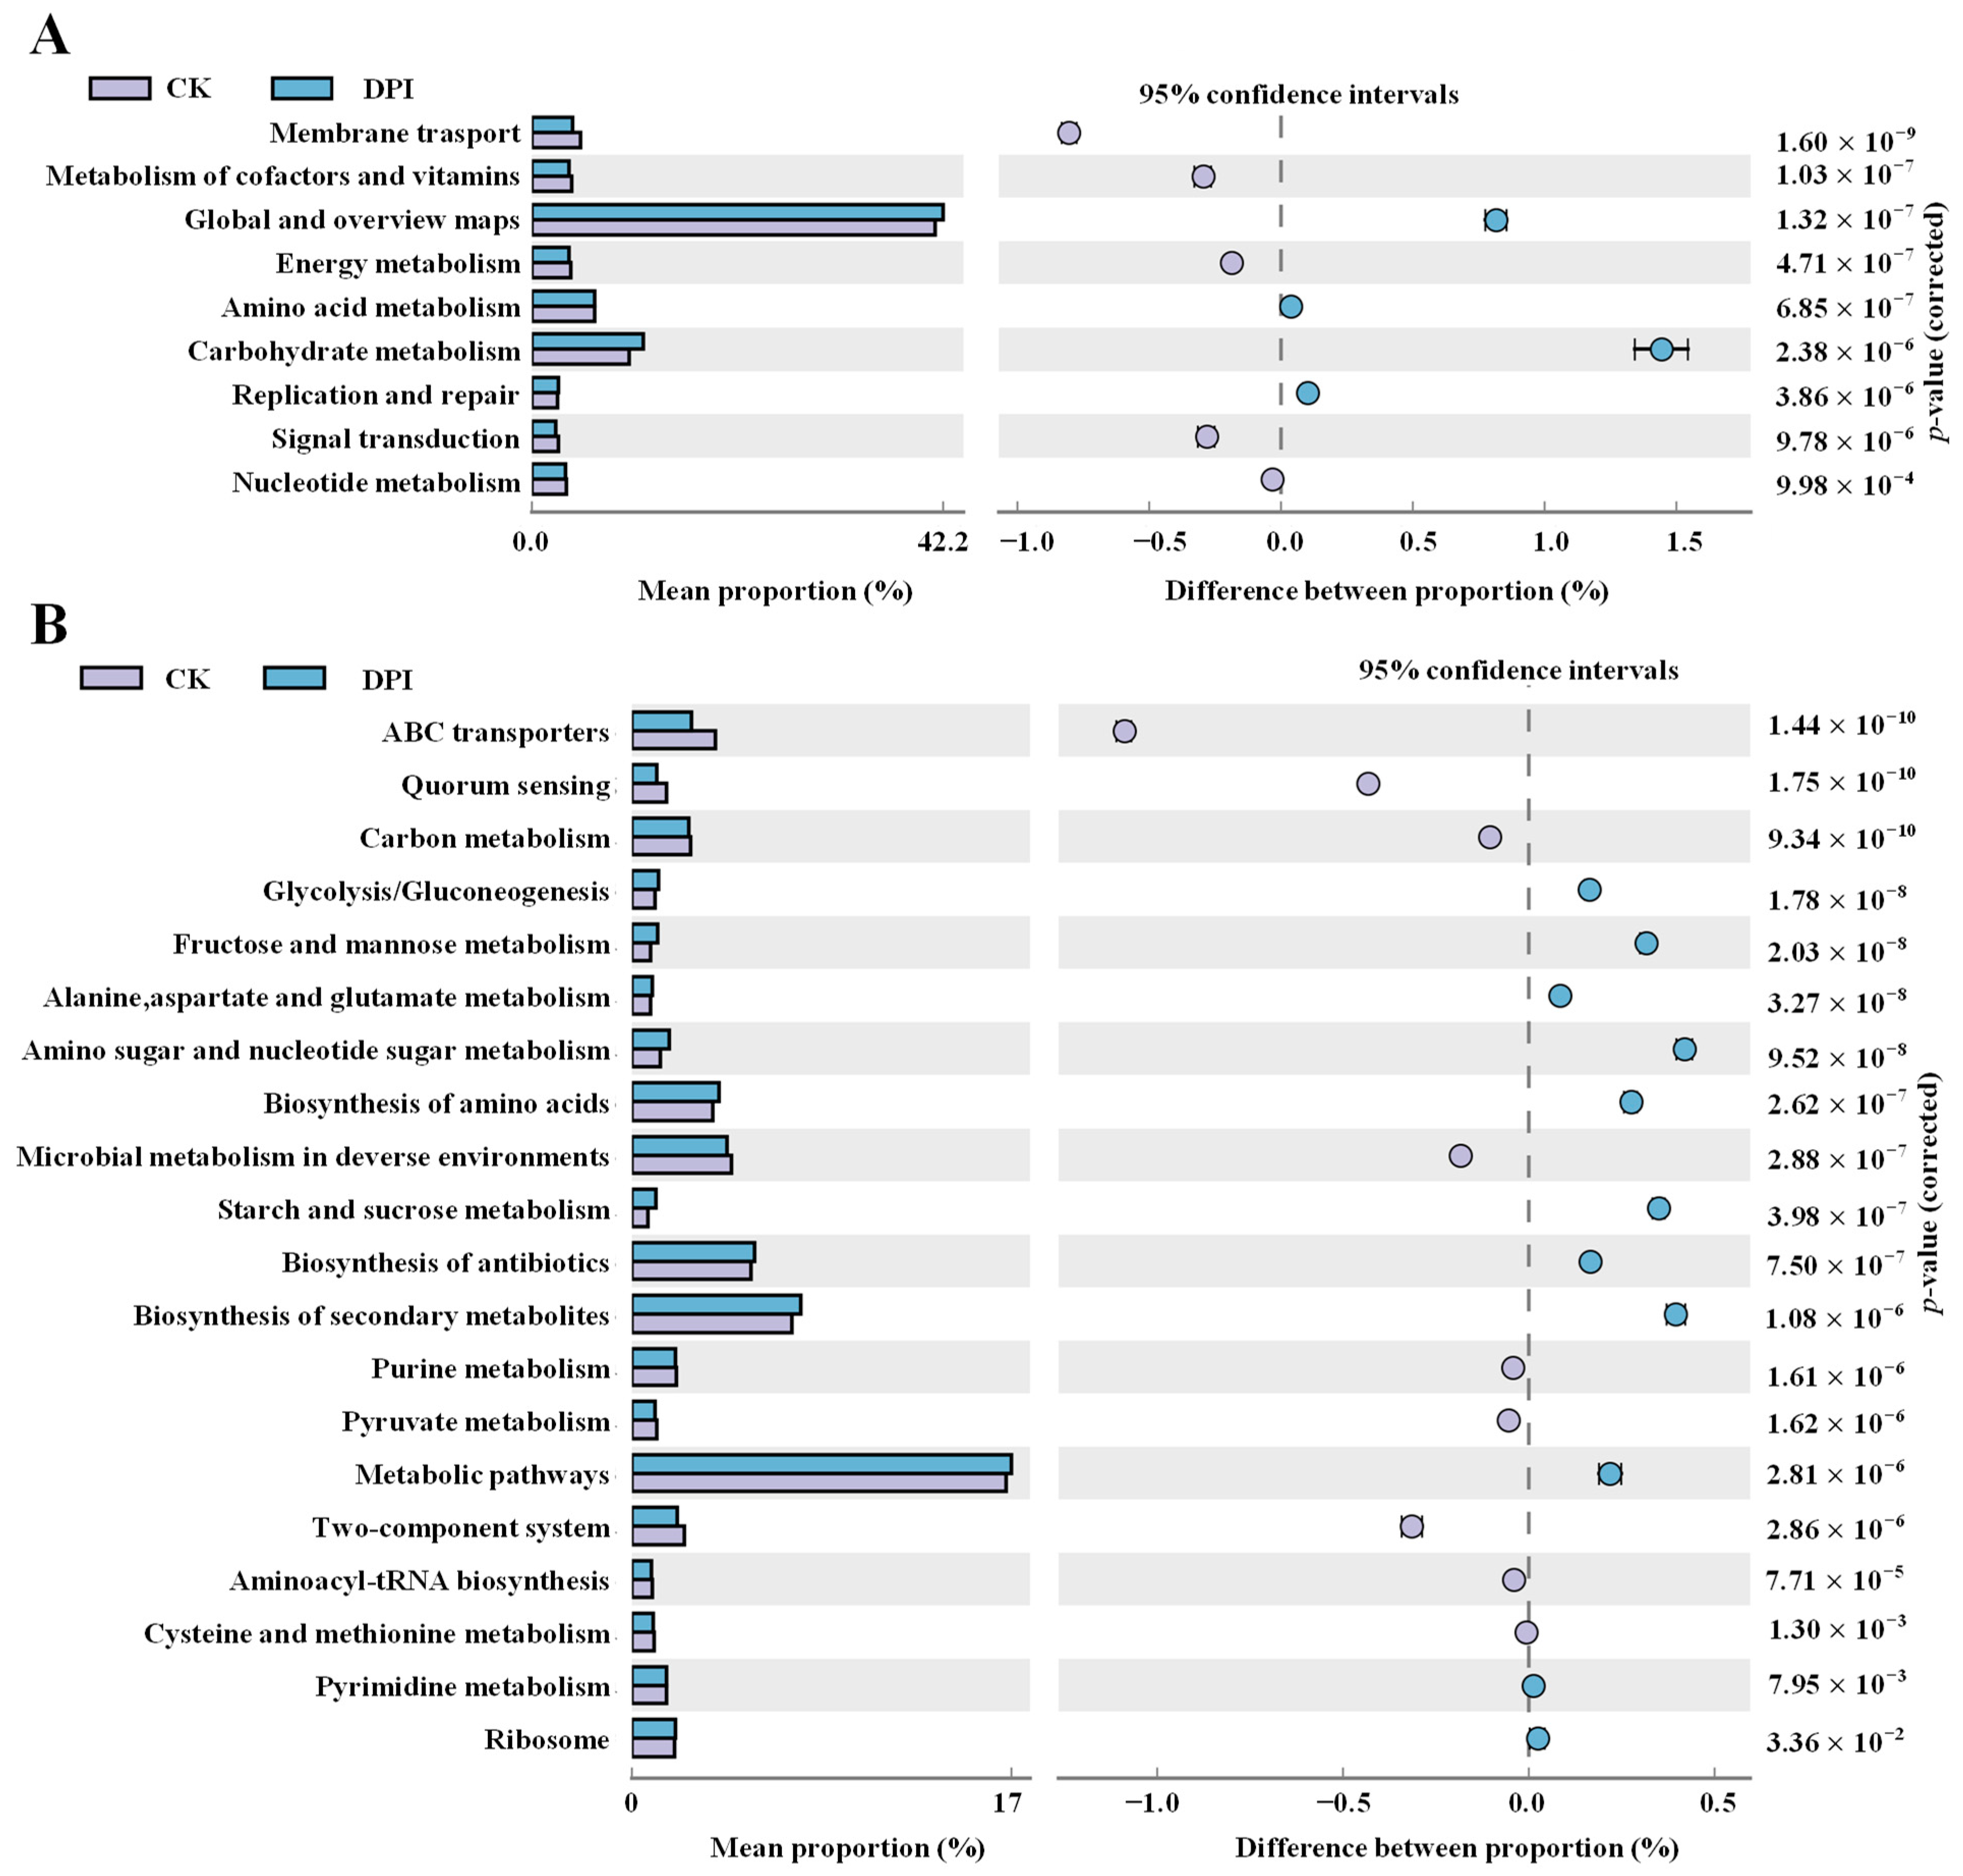
Functional Genes Prediction

The Kyoto encyclopedia of genes and genomes (KEGG) analysis was applied to predict the effect of DPI on functional metabolism following modulation of the gut microbiota. At level 2 (Figure 9A), the DPI could promote the “carbohydrate metabolism” and “global and overview maps” pathways, and more details presented in Level 3 (Figure 9B) indicated that “glycolysis/gluconeogenesis”, “fructose and mannose metabolism”, “alanine, aspartate and glucose metabolism”, “amino sugar and nucleoside sugar metabolism”, “biosynthesis of amino acids”, “Starch and sucrose metabolism”, “biosynthesis of antibiotics “, and “biosynthesis of secondary metabolites” were upregulated. It was predicted that DPI could promote the metabolic activity of gut microbiota and accelerate the metabolism of secondary products, amino acids, and antibiotics [59]. “Biosynthesis of secondary metabolites” is closely related to the “glycolysis/gluconeogenesis” pathway because the most common pathway to produce SCFAs in bacteria is through the glycolysis pathway [40]. The production of SCFAs is a highly complex and dynamic process. The researchers used radioisotope analysis to show that propionate was generated by a carbon dioxide fixation pathway while butyrate was most commonly formed by conventional acetyl-S coenzyme A condensation [60]. In addition, butyrate and propionate may be degraded into the smaller two carbon chain acetate by Clostridium species. Such interactions can involve the mutualistic production of SCFA [40]. Butyric acid is mostly absorbed by colon cells, while acetic acid and propionic acid can get into liver through the portal vein. Propionate is metabolized by hepatocytes, while acetic acid remains in the liver or is excreted into the peripheral venous system and then delivered to target organs by the circulatory system. They are not only energy sources but also key factors in gluconeogenesis and lipogenesis [20,40]. Therefore, it was speculated that DPI could regulate gut microbiota, affect energy homeostasis, and control energy storage and consumption [6].

4. Conclusions

This study found that DP was indigestible in the simulated saliva–gastrointestinal digestive system, indicating that DP was not destroyed by digestive juice and digestive enzymes and could arrive at the large colon smoothly. During in vitro microbial fermentation, the indigestible DP (DPI) was significantly decomposed and used by human gut microbiota, so as to regulate the composition of the microbial community. Specifically, DPI was able to promote the growth of Bacteroides, Catenibacterium, Parabacteroides, and Megamonas and inhibit the growth of detrimental bacteria. At the same time, DPI can induce the production of SCFAs during in vitro microbial fermentation, so as to change the acid–base environment of the large intestine. Collectively, the potential catabolic behavior of D. indusiata polysaccharide in the gastrointestinal tract was revealed in the present study. Nevertheless, studies that involve in vivo animal models should be carried out to further verify the catabolic behavior of D. indusiata polysaccharide.

Author Contributions

Conceptualization, D.-T.W. and Y.-X.Z.; methodology, Y.-X.Z., L.H. and D.-T.W.; investigation, Y.-X.Z., L.H., J.L. (Jie Li), J.L. (Jing Lei), and M.-X.F.; formal analysis, Y.-X.Z., D.-T.W., Q.Z. and W.Q.; data curation, D.-T.W. and Y.-X.Z.; writing—original draft, Y.-X.Z. and D.-T.W.; writing—review and editing, D.-T.W.; supervision, W.Q. and D.-T.W.; project administration, W.Q.; funding acquisition, D.-T.W. and W.Q. All authors have read and agreed to the published version of the manuscript.

Funding

This work was supported by the National Natural Science Foundation of China (No. 31901690), the Key R & D Project of Science and Technology Department of Sichuan Province (No. 2023YFN0011), and the Scientific Research Foundation of Chengdu University (No. 2081921047).

Institutional Review Board Statement

Not applicable.

Informed Consent Statement

Not applicable.

Data Availability Statement

Data are contained within the article.

Conflicts of Interest

The authors declare no conflict of interest.

References

  1. Habtemariam, S. The chemistry, pharmacology and therapeutic potential of the edible mushroom Dictyophora indusiata (Vent. ex. Pers.) Fischer (Synn. Phallus indusiatus). Biomedicines 2019, 7, 98. [Google Scholar] [CrossRef] [PubMed]
  2. Hua, Y.L.; Yang, B.; Tang, J.; Ma, Z.H.; Gao, Q.; Zhao, M.M. Structural analysis of water-soluble polysaccharides in the fruiting body of Dictyophora indusiata and their in vivo antioxidant activities. Carbohyd. Polym. 2012, 87, 343–347. [Google Scholar] [CrossRef] [PubMed]
  3. Deng, C.; Fu, H.T.; Teng, L.P.; Hu, Z.; Xu, X.; Chen, J.; Ren, T. Anti-tumor activity of the regenerated triple-helical polysaccharide from Dictyophora indusiata. Int. J. Biol. Macromol. 2013, 61, 453–458. [Google Scholar] [CrossRef]
  4. Liao, W.Z.; Luo, Z.; Liu, D.; Ning, Z.X.; Yang, J.G.; Ren, J.Y. Structure characterization of a novel polysaccharide from Dictyophora indusiata and its macrophage immunomodulatory activities. J. Agric. Food Chem. 2015, 63, 535–544. [Google Scholar] [CrossRef] [PubMed]
  5. Zhang, J.; Shi, R.; Li, H.; Xiang, Y.; Xiao, L.; Hu, M.; Ma, F.; Ma, C.W.; Huang, Z. Antioxidant and neuroprotective effects of Dictyophora indusiata polysaccharide in Caenorhabditis elegans. J. Ethnopharmacol. 2016, 192, 413–422. [Google Scholar] [CrossRef] [PubMed]
  6. Xu, X.F.; Xu, P.P.; Ma, C.W.; Tang, J.; Zhang, X.W. Gut microbiota, host health, and polysaccharides. Biotechnol. Adv. 2013, 31, 318–337. [Google Scholar] [CrossRef] [PubMed]
  7. Wu, D.T.; He, Y.; Yuan, Q.; Wang, S.P.; Gan, R.Y.; Hu, Y.C.; Zou, L. Effects of molecular weight and degree of branching on microbial fermentation characteristics of okra pectic-polysaccharide and its selective impact on gut microbial composition. Food Hydrocoll. 2022, 132, 107897. [Google Scholar] [CrossRef]
  8. Round, J.L.; Mazmanian, S.K. The gut microbiota shapes intestinal immune responses during health and disease. Nat. Rev. Immunol. 2009, 9, 313–323. [Google Scholar] [CrossRef]
  9. Turnbaugh, P.J.; Ley, R.E.; Mahowald, M.A.; Magrini, V.; Mardis, E.R.; Gordon, J.I. An obesity-associated gut microbiome with increased capacity for energy harvest. Nature 2006, 444, 1027–1031. [Google Scholar] [CrossRef] [PubMed]
  10. Wu, D.T.; An, L.Y.; Liu, W.; Hu, Y.C.; Wang, S.P.; Zou, L. In vitro fecal fermentation properties of polysaccharides from Tremella fuciformis and related modulation effects on gut microbiota. Food Res. Int. 2022, 156, 111185. [Google Scholar] [CrossRef] [PubMed]
  11. Canfora, E.E.; Jocken, J.W.; Blaak, E.E. Short-chain fatty acids in control of body weight and insulin sensitivity. Nat. Rev. Endocrinol. 2015, 11, 577–591. [Google Scholar] [CrossRef] [PubMed]
  12. Cani, P.D.; Neyrinck, A.M.; Fava, F.; Knauf, C.; Burcelin, R.G.; Tuohy, K.M.; Gibson, G.R.; Delzenne, N.M. Selective increases of bifidobacteria in gut microflora improve high-fat-diet-induced diabetes in mice through a mechanism associated with endotoxaemia. Diabetologia 2007, 50, 2374–2383. [Google Scholar] [CrossRef] [PubMed]
  13. Wang, M.; Veeraperumal, S.; Zhong, S.Y.; Cheong, K.L. Fucoidan-derived functional oligosaccharides: Recent developments, preparation, and potential applications. Foods 2023, 12, 878. [Google Scholar] [CrossRef] [PubMed]
  14. Wu, D.T.; Zhao, Y.X.; Yuan, Q.; Wang, S.; Gan, R.Y.; Hu, Y.C.; Zou, L. Influence of ultrasound assisted metal-free Fenton reaction on the structural characteristic and immunostimulatory activity of a β-D-glucan isolated from Dictyophora indusiata. Int. J. Biol. Macromol. 2022, 220, 97–108. [Google Scholar] [CrossRef]
  15. Wu, D.T.; Feng, K.L.; Li, F.; Hu, Y.C.; Wang, S.P.; Gan, R.Y.; Zou, L. In vitro digestive characteristics and microbial degradation of polysaccharides from lotus leaves and related effects on the modulation of intestinal microbiota. Cur. Res. Food Sci. 2022, 5, 752–762. [Google Scholar] [CrossRef]
  16. Brodkorb, A.; Egger, L.; Alminger, M.; Alvito, P.; Assuncao, R.; Ballance, S.; Bohn, T.; Bourlieu-Lacanal, C.; Boutrou, R.; Carriere, F.; et al. INFOGEST static in vitro simulation of gastrointestinal food digestion. Nat. Protoc. 2019, 14, 991–1014. [Google Scholar] [CrossRef] [PubMed]
  17. Hu, Y.C.; Hu, J.L.; Li, J.; Wang, J.; Zhang, X.Y.; Wu, X.Y.; Li, X.; Guo, Z.B.; Zou, L.; Wu, D.T. Physicochemical characteristics and biological activities of soluble dietary fibers isolated from the leaves of different quinoa cultivars. Food Res. Int. 2023, 163, 112166. [Google Scholar] [CrossRef]
  18. Wu, D.T.; Nie, X.R.; Gan, R.Y.; Guo, H.; Fu, Y.; Yuan, Q.; Zhang, Q.; Qin, W. In vitro digestion and fecal fermentation behaviors of a pectic polysaccharide from okra (Abelmoschus esculentus) and its impacts on human gut microbiota. Food Hydrocoll. 2021, 114, 106577. [Google Scholar] [CrossRef]
  19. Pedersen, A.M.; Bardow, A.; Jensen, S.B.; Nauntofte, B. Saliva and gastrointestinal functions of taste, mastication, swallowing and digestion. Oral Dis. 2002, 8, 117–129. [Google Scholar] [CrossRef]
  20. Di, T.; Chen, G.J.; Sun, Y.; Ou, S.Y.; Zeng, X.X.; Ye, H. In vitro digestion by saliva, simulated gastric and small intestinal juices and fermentation by human fecal microbiota of sulfated polysaccharides from Gracilaria rubra. J. Funct. Foods 2018, 40, 18–27. [Google Scholar] [CrossRef]
  21. Chen, L.G.; Liu, J.W.; Ge, X.D.; Xu, W.; Chen, Y.; Li, F.W.; Cheng, D.L.; Shao, R. Simulated digestion and fermentation in vitro by human gut microbiota of polysaccharides from Helicteres angustifolia L. Int. J. Biol. Macromol. 2019, 141, 1065–1071. [Google Scholar] [CrossRef] [PubMed]
  22. Fu, C.; Ye, K.; Ma, S.; Du, H.; Chen, S.; Liu, D.; Ma, G.; Xiao, H. Simulated gastrointestinal digestion and gut microbiota fermentation of polysaccharides from Agaricus bisporus. Food Chem. 2023, 418, 135849. [Google Scholar] [CrossRef]
  23. Zhong, K.; Zhang, Q.; Tong, L.T.; Liu, L.Y.; Zhou, X.R.; Zhou, S.M. Molecular weight degradation and rheological properties of schizophyllan under ultrasonic treatment. Ultrason. Sonochem. 2015, 23, 75–80. [Google Scholar] [CrossRef]
  24. Wu, D.T.; Fu, Y.; Guo, H.; Yuan, Q.; Nie, X.R.; Wang, S.P.; Gan, R.Y. In vitro simulated digestion and fecal fermentation of polysaccharides from loquat leaves: Dynamic changes in physicochemical properties and impacts on human gut microbiota. Int. J. Biol. Macromol. 2021, 168, 733–742. [Google Scholar] [CrossRef] [PubMed]
  25. Li, X.J.; Guo, R.; Wu, X.J.; Liu, X.; Ai, L.Z.; Sheng, Y.; Song, Z.B.; Wu, Y. Dynamic digestion of tamarind seed polysaccharide: Indigestibility in gastrointestinal simulations and gut microbiota changes in vitro. Carbohyd. Polym. 2020, 239, 116194. [Google Scholar] [CrossRef]
  26. Ma, G.X.; Xu, Q.; Du, H.J.; Kimatu, B.M.; Su, A.X.; Yang, W.J.; Hu, Q.H.; Xiao, H. Characterization of polysaccharide from Pleurotus eryngii during simulated gastrointestinal digestion and fermentation. Food Chem. 2022, 370, 131303. [Google Scholar] [CrossRef] [PubMed]
  27. Wang, W.S.; Song, X.L.; Gao, Z.; Zhao, H.J.; Wang, X.X.; Liu, M.; Jia, L. Anti-hyperlipidemic, antioxidant and organic protection effects of acidic-extractable polysaccharides from Dictyophora indusiata. Int. J. Biol. Macromol. 2019, 129, 281–292. [Google Scholar] [CrossRef]
  28. Shah, A.; Gani, A.; Masoodi, F.A.; Wani, S.M.; Ashwar, B.A. Structural, rheological and nutraceutical potential of β-glucan from barley and oat. Bioact. Carbohydr. Diet. Fibre 2017, 10, 10–16. [Google Scholar] [CrossRef]
  29. Zhou, X.; Zhang, Z.; Huang, F.H.; Yang, C.; Huang, Q.D. In vitro digestion and fermentation by human fecal microbiota of polysaccharides from flaxseed. Molecules 2020, 25, 4354. [Google Scholar] [CrossRef]
  30. Wang, J.; Xu, X.; Zheng, H.; Li, J.; Deng, C.; Xu, Z.; Chen, J. Structural characterization, chain conformation, and morphology of a β-(1→3)-D-glucan isolated from the fruiting body of Dictyophora indusiata. J. Agric. Food Chem. 2009, 57, 5918–5924. [Google Scholar] [CrossRef]
  31. Tamargo, A.; Cueva, C.; Alvarez, M.D.; Herranz, B.; Bartolome, B.; Moreno-Arribas, M.V.; Laguna, L. Influence of viscosity on the growth of human gut microbiota. Food Hydrocoll. 2018, 77, 163–167. [Google Scholar] [CrossRef]
  32. Nie, X.R.; Li, H.Y.; Du, G.; Lin, S.; Hu, R.; Li, H.Y.; Zhao, L.; Zhang, Q.; Chen, H.; Wu, D.T.; et al. Structural characteristics, rheological properties, and biological activities of polysaccharides from different cultivars of okra (Abelmoschus esculentus) collected in China. Int. J. Biol. Macromol. 2019, 139, 459–467. [Google Scholar] [CrossRef] [PubMed]
  33. Zhong, K.; Liu, L.Y.; Tong, L.T.; Zhong, X.; Wang, Q.; Zhou, S.M. Rheological properties and antitumor activity of schizophyllan produced with solid-state fermentation. Int. J. Biol. Macromol. 2013, 62, 12–17. [Google Scholar] [CrossRef]
  34. Cantu-Jungles, T.M.; Ruthes, A.C.; El-Hindawy, M.; Moreno, R.B.; Zhang, X.; Cordeiro LM, C.; Hamaker, B.R.; Iacomini, M. In vitro fermentation of Cookeina speciosa glucans stimulates the growth of the butyrogenic Clostridium cluster XIVa in a targeted way. Carbohydr. Polym. 2018, 183, 219–229. [Google Scholar] [CrossRef] [PubMed]
  35. Nugent, A.P. Health properties of resistant starch. Nutr. Bull. 2005, 30, 27–54. [Google Scholar] [CrossRef]
  36. Ding, H.H.; Cui, S.W.; Goff, H.D.; Gong, J. Short-chain fatty acid profiles from flaxseed dietary fibres after in vitro fermentation of pig colonic digesta: Structure–function relationship. Bioact. Carbohydr. Diet. Fibre 2015, 6, 62–68. [Google Scholar] [CrossRef]
  37. Zhang, X.; Aweya, J.J.; Huang, Z.X.; Kang, Z.Y.; Bai, Z.H.; Li, K.H.; He, X.T.; Liu, Y.; Chen, X.Q.; Cheong, K.L. In vitro fermentation of Gracilaria lemaneiformis sulfated polysaccharides and its agaro-oligosaccharides by human fecal inocula and its impact on microbiota. Carbohyd Polym. 2020, 234, 115894. [Google Scholar] [CrossRef]
  38. Canfora, E.E.; Blaak, E.E. Acetate: A diet-derived key metabolite in energy metabolism: Good or bad in context of obesity and glucose homeostasis? Curr. Opin. Clin. Nutr. Metab. Care 2017, 20, 477–483. [Google Scholar] [CrossRef]
  39. Al-Lahham, S.; Roelofsen, H.; Rezaee, F.; Weening, D.; Hoek, A.; Vonk, R.; Venema, K. Propionic acid affects immune status and metabolism in adipose tissue from overweight subjects. Eur. J. Clin. Investig. 2012, 42, 357–364. [Google Scholar] [CrossRef]
  40. Tan, J.; McKenzie, C.; Potamitis, M.; Thorburn, A.N.; Mackay, C.R.; Macia, L. The role of short-chain fatty acids in health and disease. Adv. Immunol. 2014, 121, 91–119. [Google Scholar]
  41. Louis, P.; Flint, H.J. Diversity, metabolism and microbial ecology of butyrate-producing bacteria from the human large intestine. FEMS Microbiol. Lett. 2009, 294, 1–8. [Google Scholar] [CrossRef] [PubMed]
  42. Xu, X.F.; Zhang, X.W. Lentinula edodes-derived polysaccharide alters the spatial structure of gut microbiota in mice. PLoS ONE 2015, 10, e011503. [Google Scholar] [CrossRef] [PubMed]
  43. Frank, D.N.; St Amand, A.L.; Feldman, R.A.; Boedeker, E.C.; Harpaz, N.; Pace, N.R. Molecular-phylogenetic characterization of microbial community imbalances in human inflammatory bowel diseases. Proc. Natl. Acad. Sci. USA 2007, 104, 13780–13785. [Google Scholar] [CrossRef] [PubMed]
  44. Xu, S.Y.; Chen, X.Q.; Liu, Y.; Cheong, K.L. Ultrasonic/microwave-assisted extraction, simulated digestion, and fermentation in vitro by human intestinal flora of polysaccharides from Porphyra haitanensis. Int. J. Biol. Macromol. 2020, 152, 748–756. [Google Scholar] [CrossRef] [PubMed]
  45. Mahowald, M.A.; Rey, F.E.; Seedorf, H.; Turnbaugh, P.J.; Fulton, R.S.; Wollam, A.; Shah, N.; Wang, C.; Magrini, V.; Wilson, R.K.; et al. Characterizing a model human gut microbiota composed of members of its two dominant bacterial phyla. Proc. Natl. Acad. Sci. USA 2009, 106, 5859–5864. [Google Scholar] [CrossRef] [PubMed]
  46. Shin, N.R.; Whon, T.W.; Bae, J.W. Proteobacteria: Microbial signature of dysbiosis in gut microbiota. Trends Biotechnol. 2015, 33, 496–503. [Google Scholar] [CrossRef]
  47. Yang, J.Y.; Martinez, I.; Walter, J.; Keshavarzian, A.; Rose, D.J. In vitro characterization of the impact of selected dietary fibers on fecal microbiota composition and short chain fatty acid production. Anaerobe 2013, 23, 74–81. [Google Scholar] [CrossRef] [PubMed]
  48. Liu, C.; Du, P.; Cheng, Y.; Guo, Y.; Hu, B.; Yao, W.; Zhu, X.; Qian, H. Study on fecal fermentation characteristics of aloe polysaccharides in vitro and their predictive modeling. Carbohydr. Polym. 2021, 256, 117571. [Google Scholar] [CrossRef]
  49. Wang, K.; Liao, M.F.; Zhou, N.; Bao, L.; Ma, K.; Zheng, Z.Y.; Wang, Y.J.; Liu, C.; Wang, W.Z.; Wang, J.; et al. Parabacteroides distasonis alleviates obesity and metabolic dysfunctions via production of succinate and secondary bile acids. Cell Rep. 2019, 26, 222–235.e225. [Google Scholar] [CrossRef]
  50. Little, M.S.; Ervin, S.M.; Walton, W.G.; Tripathy, A.M.; Xu, Y.; Liu, J.R.; Redinbo, M. Active site flexibility revealed in crystal structures of Parabacteroides merdae β-glucuronidase from the human gut microbiome. Protein Sci. A Publ. Protein Soc. 2018, 27, 2010–2022. [Google Scholar] [CrossRef]
  51. Wang, Y.D.; Chen, G.J.; Peng, Y.J.; Rui, Y.; Zeng, X.X.; Ye, H. Simulated digestion and fermentation in vitro with human gut microbiota of polysaccharides from Coralline pilulifera. Lwt-Food Sci. Technol. 2019, 100, 167–174. [Google Scholar] [CrossRef]
  52. Hall, J.A.; Bouladoux, N.; Sun, C.M.; Wohlfert, E.A.; Blank, R.B.; Zhu, Q.; Grigg, M.E.; Berzofsky, J.A.; Belkaid, Y. Commensal DNA limits regulatory T cell conversion and is a natural adjuvant of intestinal immune responses. Immunity 2008, 29, 637–649. [Google Scholar] [CrossRef] [PubMed]
  53. Atarashi, K.; Tanoue, T.; Shima, T.; Imaoka, A.; Kuwahara, T.; Momose, Y.; Cheng, G.; Yamasaki, S.; Saito, T.; Ohba, Y.; et al. Induction of colonic regulatory T cells by indigenous Clostridium species. Science 2011, 331, 337–341. [Google Scholar] [CrossRef] [PubMed]
  54. Han, R.; Pang, D.R.; Wen, L.R.; You, L.J.; Huang, R.M.; Kulikouskaya, V. In vitro digestibility and prebiotic activities of a sulfated polysaccharide from Gracilaria lemaneiformis. J. Funct. Foods 2020, 64, 103652. [Google Scholar] [CrossRef]
  55. Natividad, J.M.; Lamas, B.; Pham, H.P.; Michel, M.L.; Rainteau, D.; Bridonneau, C.; da Costa, G.; van Hylckama Vlieg, J.; Sovran, B.; Chamignon, C.; et al. Bilophila wadsworthia aggravates high fat diet induced metabolic dysfunctions in mice. Nat. Commun. 2018, 9, 2802. [Google Scholar] [CrossRef]
  56. Qin, Y.W.; Havulinna, A.S.; Liu, Y.; Jousilahti, P.; Ritchie, S.C.; Tokolyi, A.; Sanders, J.G.; Valsta, L.; Brozynska, M.; Zhu, Q.; et al. Combined effects of host genetics and diet on human gut microbiota and incident disease in a single population cohort. Nat. Genet. 2022, 54, 134–142. [Google Scholar] [CrossRef]
  57. Cai, Y.Y.; Huang, F.Q.; Lao, X.; Lu, Y.; Gao, X.; Alolga, R.N.; Yin, K.; Zhou, X.; Wang, Y.; Liu, B.; et al. Integrated metagenomics identifies a crucial role for trimethylamine-producing Lachnoclostridium in promoting atherosclerosis. NPJ Biofilms Microbiomes 2022, 8, 11–23. [Google Scholar] [CrossRef]
  58. Su, A.X.; Ma, G.X.; Xie, M.H.; Ji, Y.; Li, X.F.; Zhao, L.Y.; Hu, Q.H. Characteristic of polysaccharides from Flammulina velutipes in vitro digestion under salivary, simulated gastric and small intestinal conditions and fermentation by human gut microbiota. Int. J. Food Sci. Technol. 2019, 54, 2277–2287. [Google Scholar] [CrossRef]
  59. Hu, B.; Liu, C.; Jiang, W.; Zhu, H.; Zhang, H.; Qian, H.; Zhang, W. Chronic in vitro fermentation and in vivo metabolism: Extracellular polysaccharides from Sporidiobolus pararoseus regulate the intestinal microbiome of humans and mice. Int. J. Biol. Macromol. 2021, 192, 398–406. [Google Scholar] [CrossRef]
  60. Miller, T.L.; Wolin, M.J. Pathways of acetate, propionate, and butyrate formation by the human fecal microbial flora. Appl. Environ. Microbiol. 1996, 62, 1589–1592. [Google Scholar] [CrossRef]
Figure 1. A schematic of the experimental designs of in vitro simulated digestion and microbial fermentation.
Foods 12 01909 g001
Figure 2. Changes in size exclusion chromatograms of D. indusiata polysaccharide during in vitro digestion (A) and microbial fermentation (B). The sample codes were consistent with that in Table 1.
Foods 12 01909 g002
Figure 3. Changes in storage modulus, loss modulus, and apparent viscosity of D. indusiata polysaccharide during in vitro digestion (AC) and microbial fermentation (DF). The sample codes were consistent with that in Table 1.
Foods 12 01909 g003
Figure 4. Changes in constituent monosaccharide (A), released free monosaccharide (B), and FT-IR spectra (C) of DPI during in vitro fermentation. PMP, 1-phenyl-3-methyl-5-pyrazolone; Man, mannose; Rha, rhamnose; GlcA, glucuronic acid; GalA, galacturonic acid; Glc, glucose; Gal, galactose; Xyl, xylose; Ara, arabinose.
Foods 12 01909 g004
Figure 5. Changes in pH value (A), acetic acid (B), propionic acid (C), n-butyric acid (D), i-butyric acid (E), n-valeric acid (F), i-valeric acid (G), and total SCFAs (H) of DPI during in vitro fermentation. CK, the negative control group; DPI, the DPI group; different capital letters represent significant differences (p < 0.05) at the same time in different groups (A–B). Different lowercase letters represent significant differences (p < 0.05) in the same group at different times (a–e).
Foods 12 01909 g005
Figure 6. Dilution curve (A), Shannon index (B), and PCA (C) of the gut microbiota of the different fermented samples. Feces, the original feces group; CK, the negative control group; DPI, the DPI group.
Foods 12 01909 g006
Figure 7. Species distribution at the phylum (A) and genus (B) levels of the different fermented samples. Feces, the original feces group; CK, the negative control group; DPI, the DPI group.
Foods 12 01909 g007
Figure 8. Heatmap analysis at the genus level (A) and Cladogram based on LEfSe analysis (B) of gut microbiota for different fermented samples. Feces, the original feces group; CK, the negative control group; DPI, the DPI group.
Foods 12 01909 g008
Figure 9. Differential analysis map of KEGG metabolic pathways at the second level (A) and third level (B) of classification.
Foods 12 01909 g009
Table 1. Changes in reducing sugar content (CR) of D. indusiata polysaccharide during digestion and fermentation in vitro.
ProcessesTimeCR (mg/mL)
Salivary digestion0 min0.127 ± 0.011 a
2 min0.130 ± 0.071 a
5 min0.129 ± 0.002 a
Gastric digestion0 h0.295 ± 0.011 a
0.5 h0.284 ± 0.006 a
1 h0.280 ± 0.022 a
2 h0.252 ± 0.054 a
Small intestinal digestion0 h0.789 ± 0.137 a
0.5 h0.652 ± 0.153 a
1 h0.619 ± 0.043 a
2 h0.762 ± 0.127 a
Microbial fermentation0 h0.194 ± 0.004 a
6 h0.198 ± 0.015 a
12 h0.179 ± 0.005 a
24 h1.539 ± 0.002 b
48 h2.585 ± 0.021 c
Values represent mean ± standard deviation, and superscripts a–c differ significantly (p < 0.05) among different stages.
Table 2. Changes in fermentability (%), total polysaccharides content (%), and molecular weight (Mw) of D. indusiata polysaccharide during digestion and fermentation in vitro.
DPDP-ODP-GDP-IDPI-0 hDPI-6 hDPI-12 hDPI-24 hDPI-48 h
Fermentability-----3.36 ± 0.91 d8.44 ± 0.48 c16.98 ± 0.29 b46.20 ± 1.05 a
Total polysaccharides96.53 ± 1.14 a95.57 ± 2.30 a95.49 ± 2.34 a95.33 ± 1.53 a95.01 ± 1.07 a91.82 ± 0.86 b88.99 ± 0.46 c80.88 ± 0.28 d51.12 ± 1.01 e
Mw (Da)
Fraction 1 × 10⁶ Da1.072 ± 0.037 a1.066 ± 0.041 a1.063 ± 0.036 a1.061 ± 0.036 a1.057 ± 0.029 a1.026 ± 0.032 ab0.982 ± 0.033 b0.851 ± 0.024 c0.595 ± 0.008 d
Relative peak areas (%) ----91.688.181.151.2
Fraction 2 × 10⁵ Da-----1.014 ± 0.035 c1.062 ± 0.042 c1.519 ± 0.041 b2.028 ± 0.042 a
Relative peak areas (%)-----8.412.518.948.8
DP, D. indusiata polysaccharide; DP-O, DP-G, and DP-I indicate DP digested by oral digestion, oral –gastric digestion, and oral–gastrointestinal digestion, respectively; DPI-0 h, DPI-6 h, DPI-12 h, DPI-24 h, and DPI-48 h indicate indigestible D. indusiata polysaccharide (DPI) after microbial fermentation for 0, 6, 12, 24 and 48 h, respectively; values represent mean ± standard deviation, and superscripts a–e differ significantly (p < 0.05) among samples.
Disclaimer/Publisher’s Note: The statements, opinions and data contained in all publications are solely those of the individual author(s) and contributor(s) and not of MDPI and/or the editor(s). MDPI and/or the editor(s) disclaim responsibility for any injury to people or property resulting from any ideas, methods, instructions or products referred to in the content.

