
Validation of an LC-MS/MS Method for the Determination of Abscisic Acid Concentration in a Real-World Setting
 , , , ,
  , , and
Abstract
:
1. Introduction
2. Materials and Methods
2.1. Study Design
2.1.1. Participants and Standardized Test Meal Composition
2.1.2. Experimental Procedures
2.2. Analytical Method
2.2.1. Chemicals and Reagents
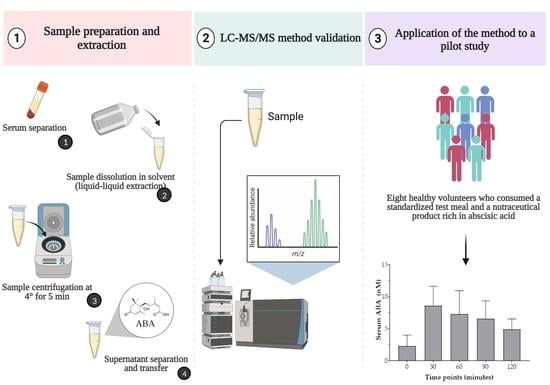
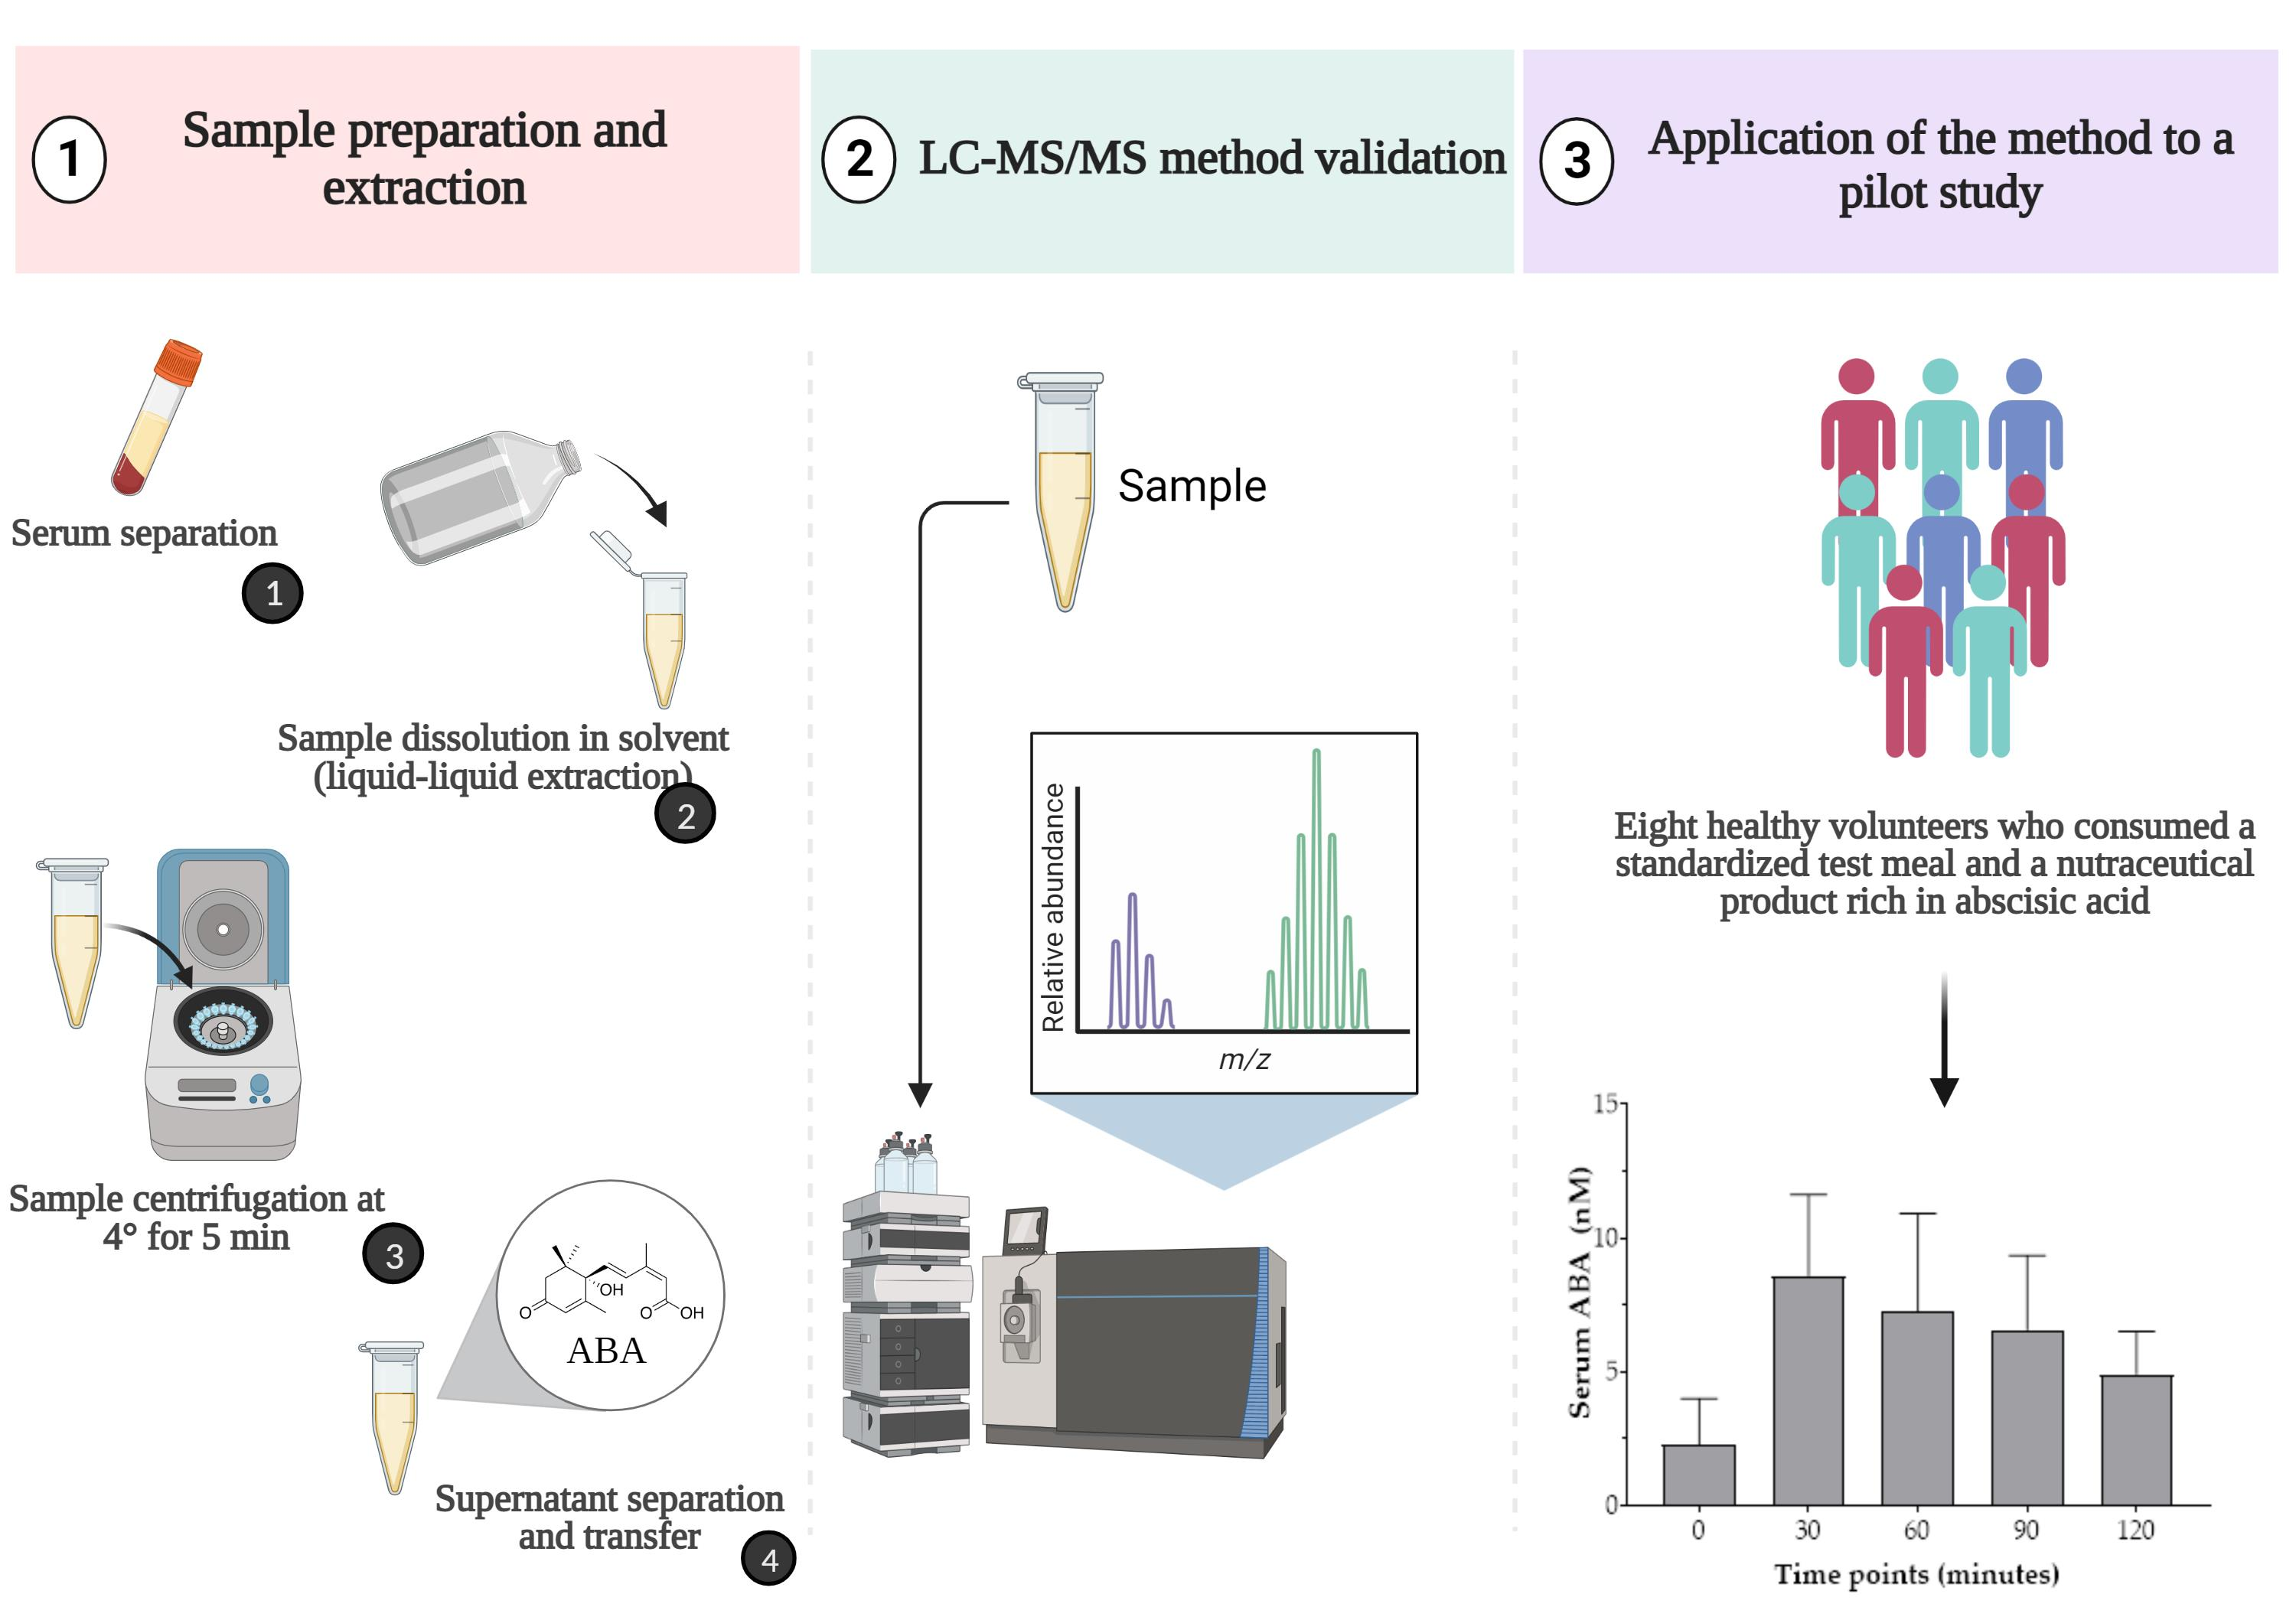
2.2.2. Real Sample Preparation and Extraction
2.2.3. Equipment
2.2.4. LC-MS/MS Conditions
2.2.5. Calibration Curve and Linearity
2.2.6. Limits of Detection (LOD) and Quantification (LOQ)
2.2.7. Precision and Accuracy
2.2.8. Selectivity
2.2.9. Carry-Over
2.2.10. Matrix Effect
2.2.11. Recovery
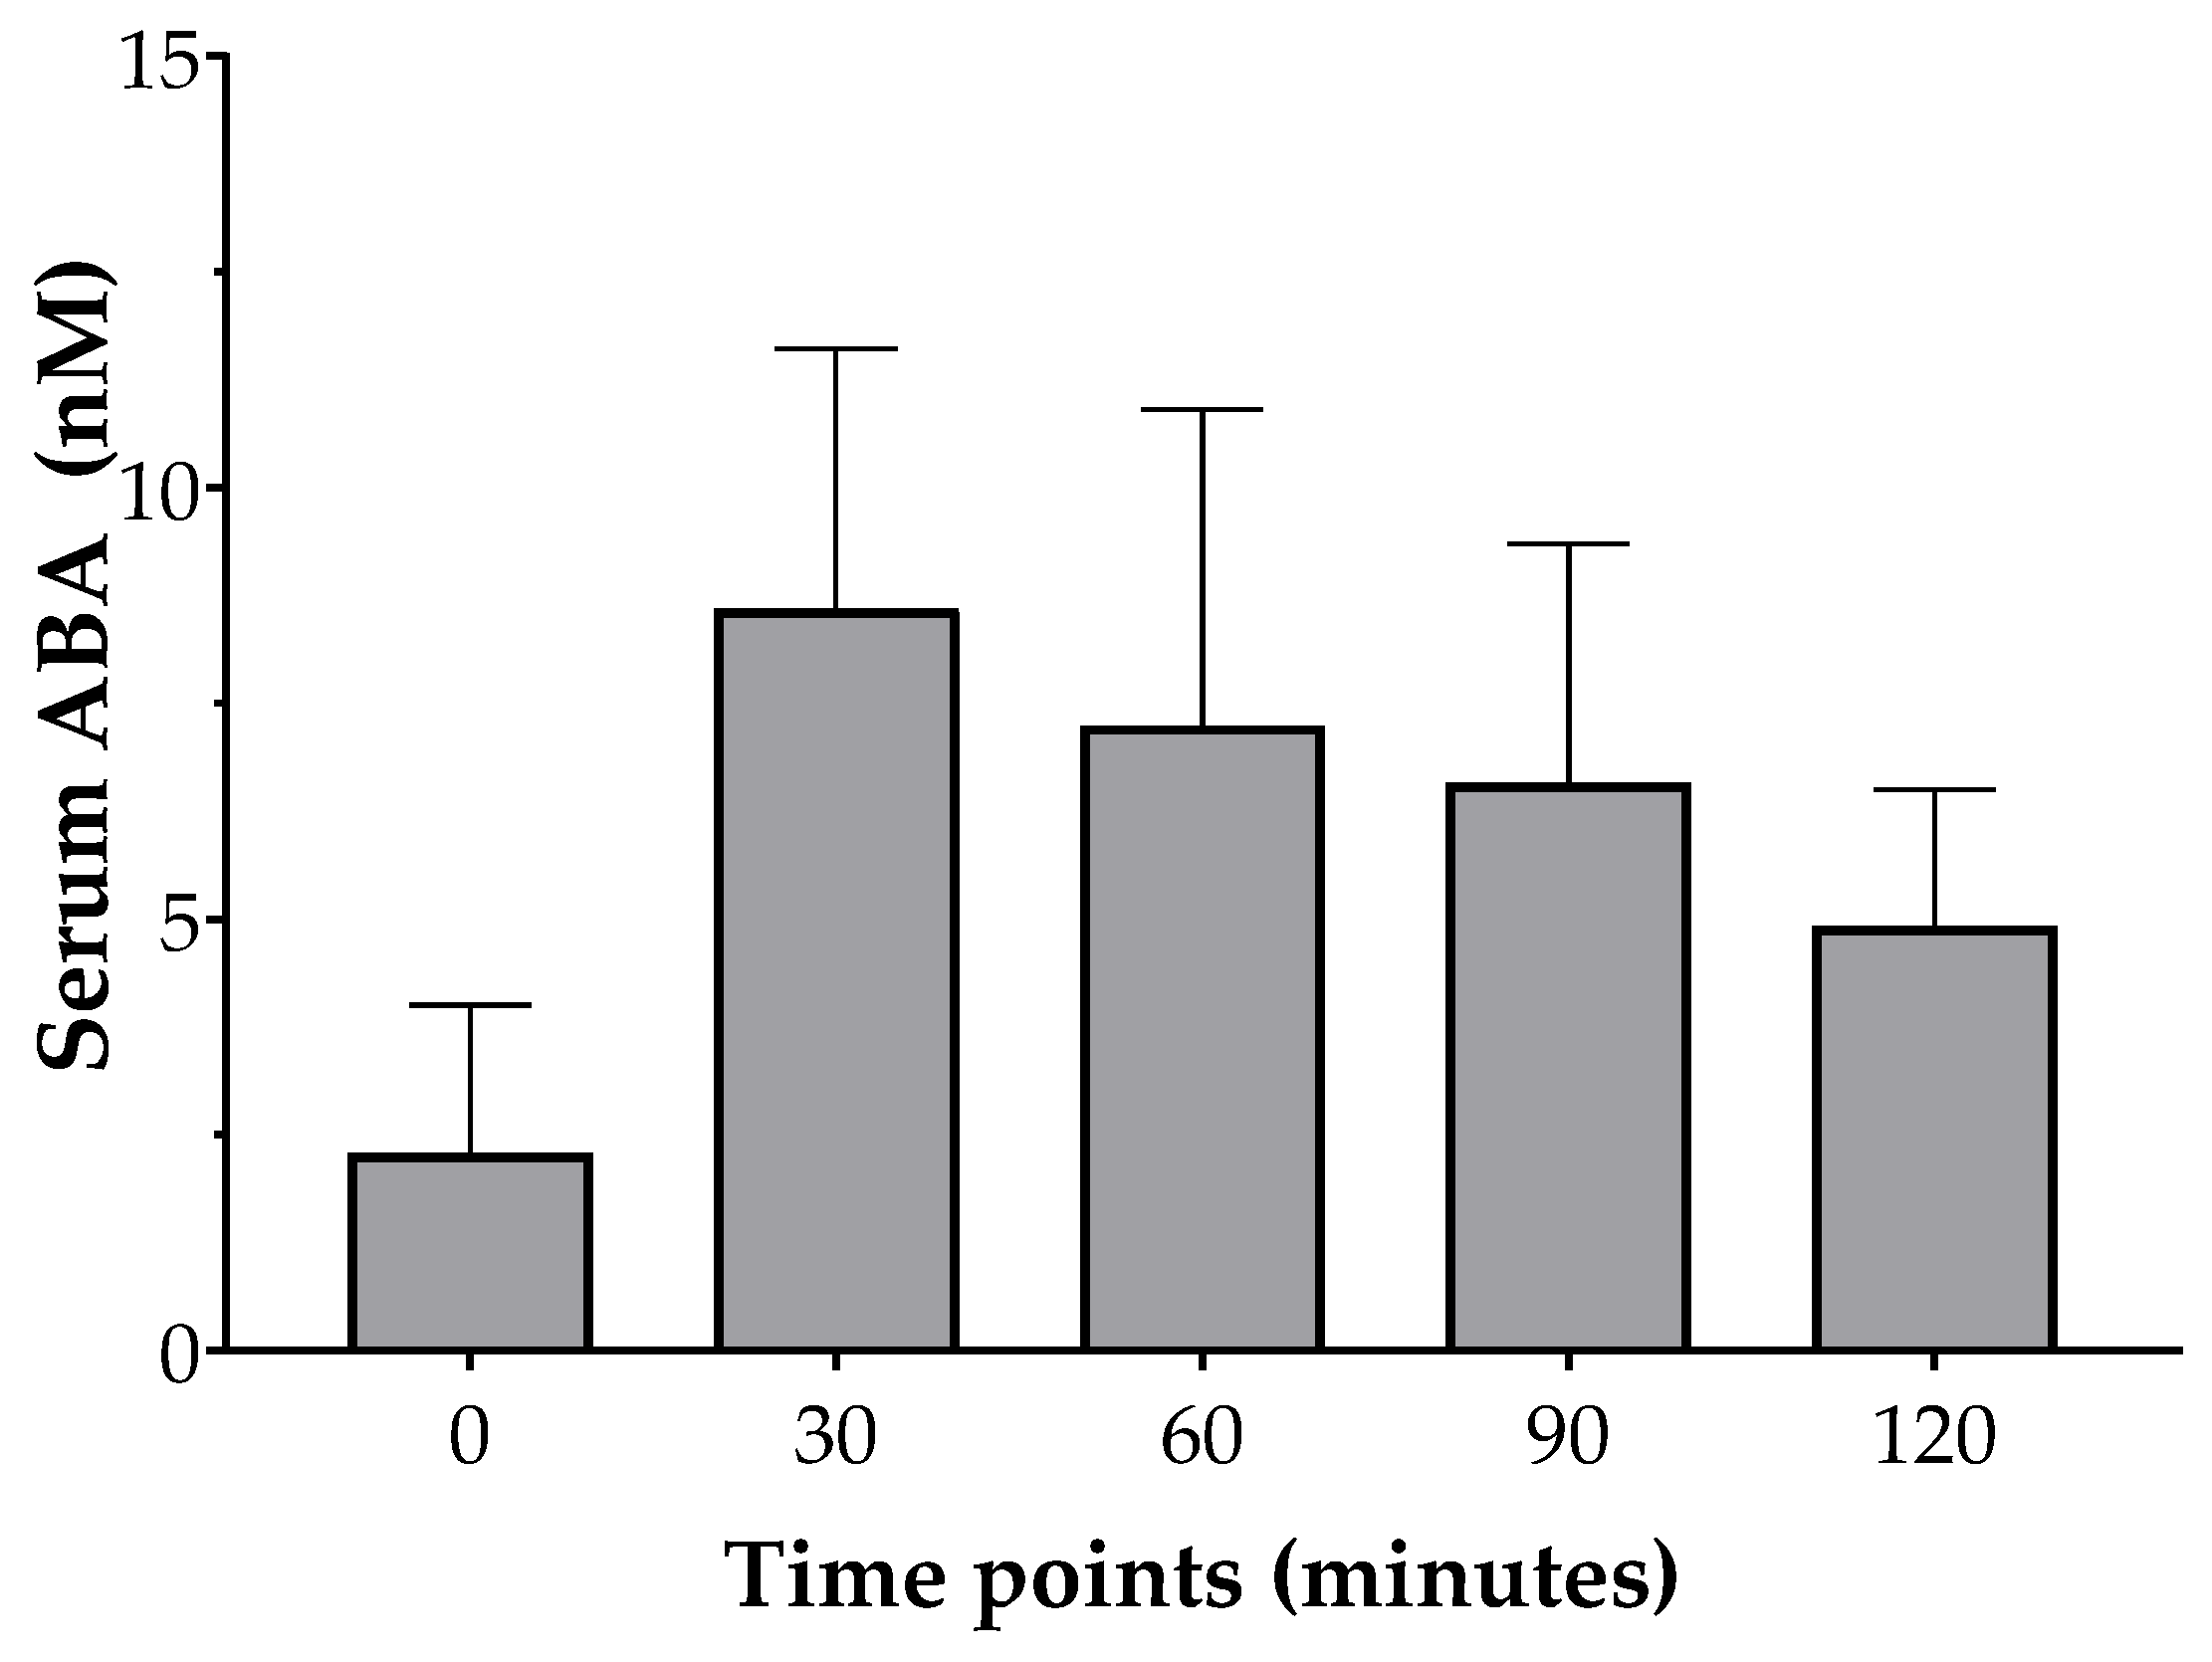
3. Results
3.1. Anthropometric and Glucometabolic Parameters
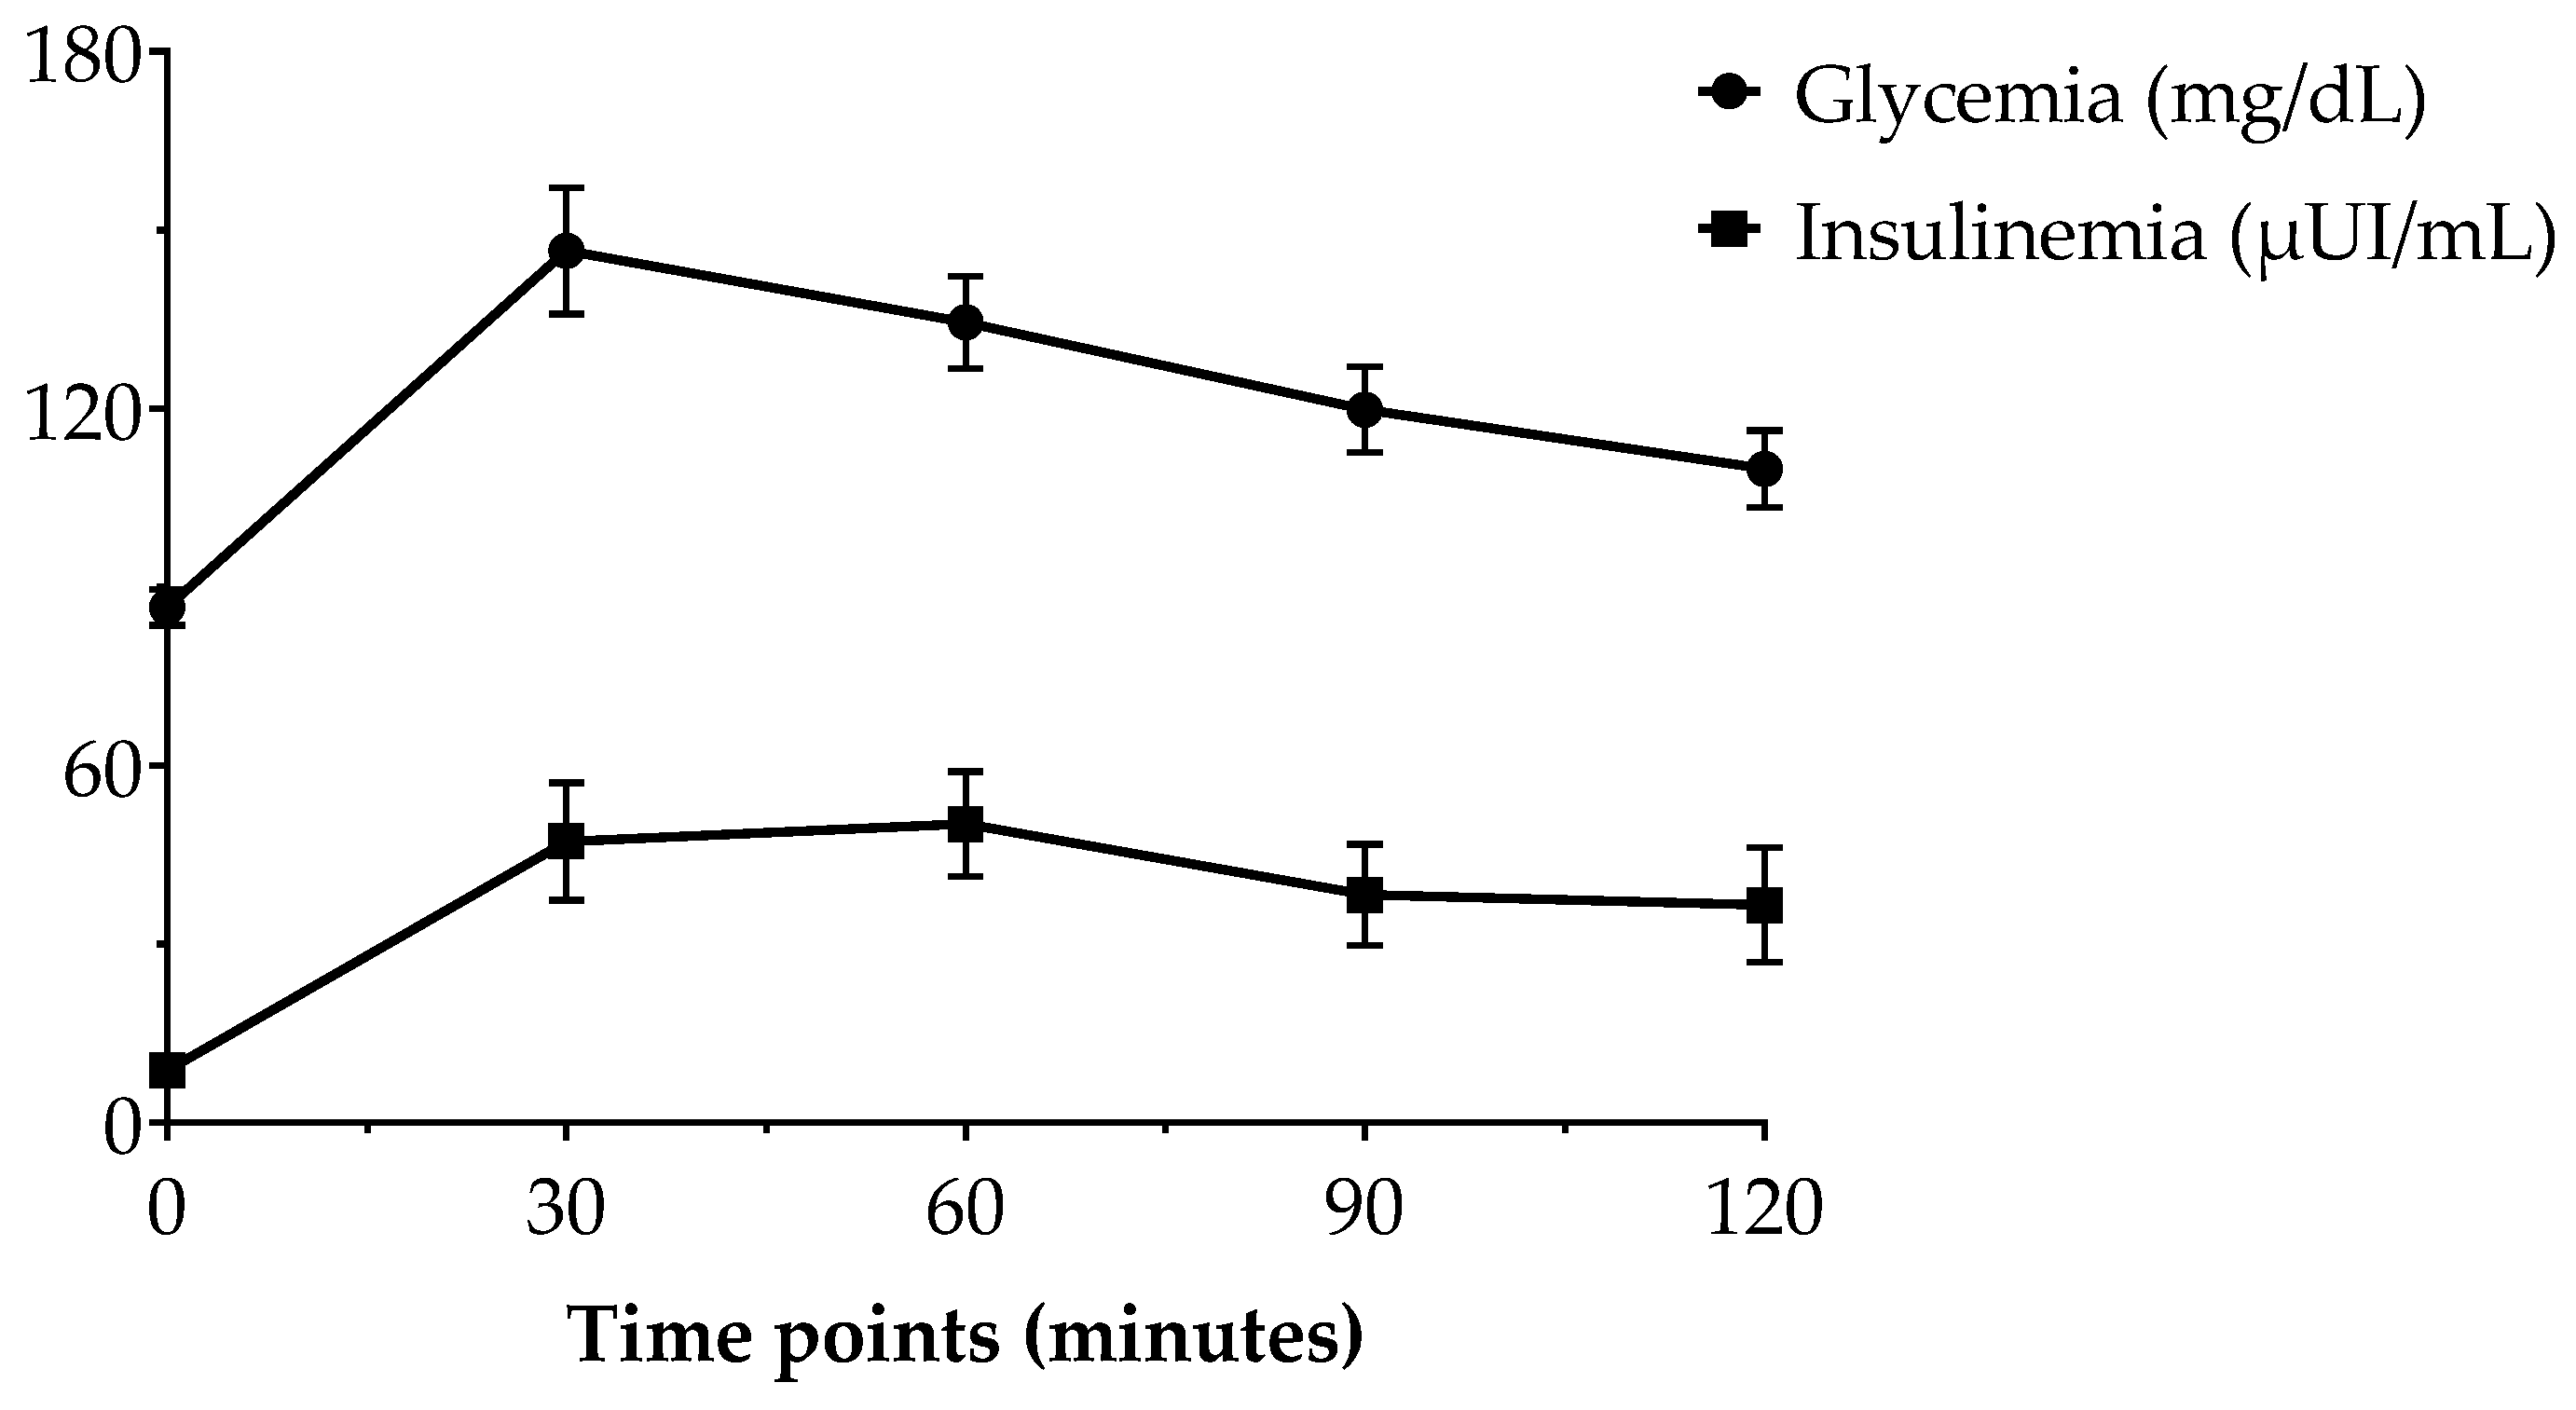
3.2. Two-Hour Glycemic and Insulinemic Responses to Standardized Test Meal
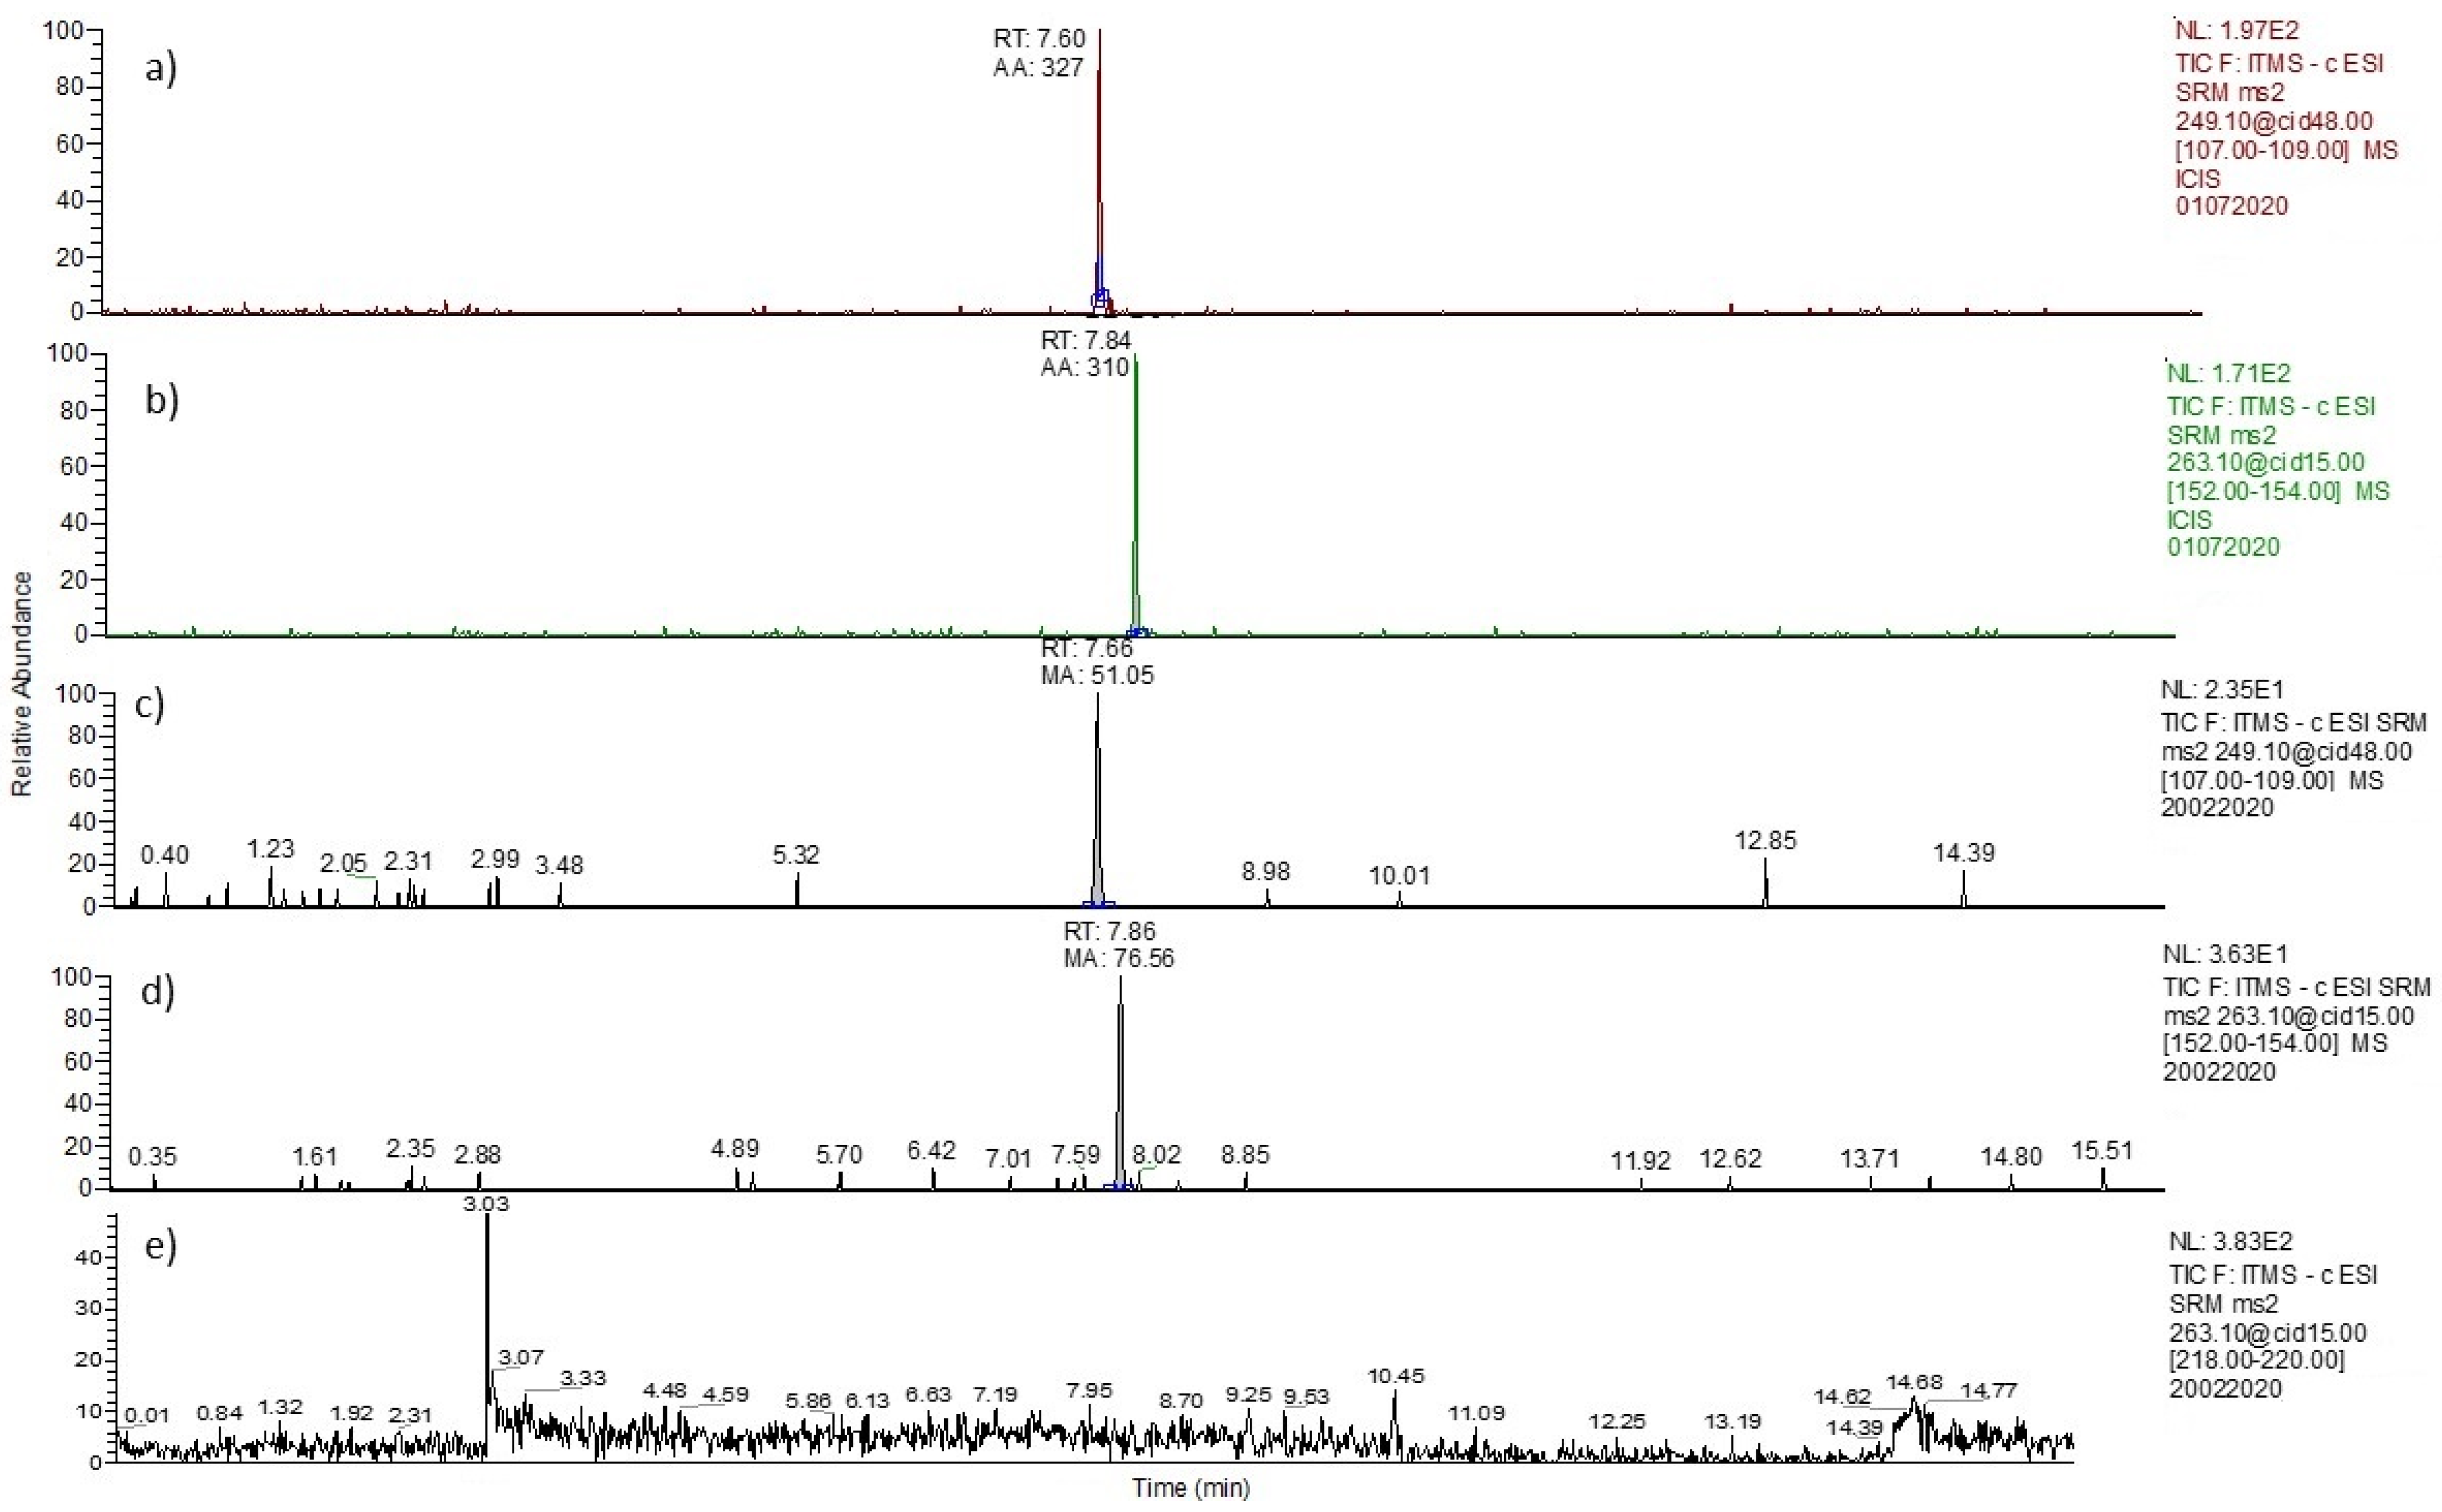
3.3. Optimization of Chromatographic Method
4. Discussion
5. Conclusions
Author Contributions
Funding
Institutional Review Board Statement
Informed Consent Statement
Data Availability Statement
Acknowledgments
Conflicts of Interest
References
- Finkelstein, R. Abscisic Acid Synthesis and Response. Arab. Book 2013, 11, e0166. [Google Scholar] [CrossRef] [PubMed] [Green Version]
- Brookbank, B.P.; Patel, J.; Gazzarrini, S.; Nambara, E. Role of basal aba in plant growth and development. Genes 2021, 12, 1936. [Google Scholar] [CrossRef] [PubMed]
- Hey, S.J.; Byrne, E.; Halford, N.G. The interface between metabolic and stress signalling. Ann. Bot. 2010, 105, 197–203. [Google Scholar] [CrossRef] [PubMed] [Green Version]
- Leng, P.; Yuan, B.; Guo, Y.; Chen, P. The role of abscisic acid in fruit ripening and responses to abiotic stress. J. Exp. Bot. 2014, 65, 4577–4588. [Google Scholar] [CrossRef]
- Liu, N. Effects of IAA and ABA on the Immature Peach Fruit Development Process. Hortic. Plant J. 2019, 5, 145–154. [Google Scholar] [CrossRef]
- Tenore, G.C.; Caruso, D.; D’avino, M.; Buonomo, G.; Caruso, G.; Ciampaglia, R.; Schiano, E.; Maisto, M.; Annunziata, G.; Novellino, E. A pilot screening of agro-food waste products as sources of nutraceutical formulations to improve simulated postprandial glycaemia and insulinaemia in healthy subjects. Nutrients 2020, 12, 1292. [Google Scholar] [CrossRef]
- Magnone, M.; Spinelli, S.; Begani, G.; Guida, L.; Sturla, L.; Emionite, L.; Zocchi, E. Abscisic Acid Improves Insulin Action on Glycemia in Insulin-Deficient Mouse Models of Type 1 Diabetes. Metabolites 2022, 12, 523. [Google Scholar] [CrossRef]
- Magnone, M.; Sturla, L.; Guida, L.; Spinelli, S.; Begani, G.; Bruzzone, S.; Fresia, C.; Zocchi, E. Abscisic acid: A conserved hormone in plants and humans and a promising aid to combat prediabetes and the metabolic syndrome. Nutrients 2020, 12, 1724. [Google Scholar] [CrossRef]
- Bruzzone, S.; Bodrato, N.; Usai, C.; Guida, L.; Moreschi, I.; Nano, R.; Antonioli, B.; Fruscione, F.; Magnone, M.; Scarfì, S.; et al. Abscisic acid is an endogenous stimulator of insulin release from human pancreatic islets with cyclic ADP ribose as second messenger. J. Biol. Chem. 2008, 283, 32188–32197. [Google Scholar] [CrossRef] [Green Version]
- Spinelli, S.; Begani, G.; Guida, L.; Magnone, M.; Galante, D.; D’Arrigo, C.; Scotti, C.; Iamele, L.; De Jonge, H.; Zocchi, E.; et al. LANCL1 binds abscisic acid and stimulates glucose transport and mitochondrial respiration in muscle cells via the AMPK/PGC-1α/Sirt1 pathway. Mol. Metab. 2021, 53, 101263. [Google Scholar] [CrossRef]
- Bruzzone, S.; Ameri, P.; Briatore, L.; Mannino, E.; Basile, G.; Andraghetti, G.; Grozio, A.; Magnone, M.; Guida, L.; Scarfì, S.; et al. The plant hormone abscisic acid increases in human plasma after hyperglycemia and stimulates glucose consumption by adipocytes and myoblasts; The plant hormone abscisic acid increases in human plasma after hyperglycemia and stimulates glucose consumption by adipocytes and myoblasts. FASEB J. Res. Commun. 2012, 26, 1251–1260. [Google Scholar] [CrossRef]
- Sturla, L.; Mannino, E.; Scarfì, S.; Bruzzone, S.; Magnone, M.; Sociali, G.; Booz, V.; Guida, L.; Vigliarolo, T.; Fresia, C.; et al. Abscisic acid enhances glucose disposal and induces brown fat activity in adipocytes in vitro and in vivo. Biochim. Biophys. Acta-Mol. Cell Biol. Lipids 2017, 1862, 131–144. [Google Scholar] [CrossRef] [PubMed]
- Magnone, M.; Emionite, L.; Guida, L.; Vigliarolo, T.; Sturla, L.; Spinelli, S.; Buschiazzo, A.; Marini, C.; Sambuceti, G.; De Flora, A.; et al. Insulin-independent stimulation of skeletal muscle glucose uptake by low-dose abscisic acid via AMPK activation. Sci. Rep. 2020, 10, 1454. [Google Scholar] [CrossRef] [PubMed] [Green Version]
- Schiano, E.; Maisto, M.; Piccolo, V.; Novellino, E.; Annunziata, G.; Ciampaglia, R.; Montesano, C.; Croce, M.; Caruso, G.; Iannuzzo, F.; et al. Beneficial Contribution to Glucose Homeostasis by an Agro-Food Waste Product Rich in Abscisic Acid: Results from a Randomized Controlled Trial. Foods 2022, 11, 2637. [Google Scholar] [CrossRef]
- Ameri, P.; Bruzzone, S.; Mannino, E.; Sociali, G.; Andraghetti, G.; Salis, A.; Ponta, M.L.; Briatore, L.; Adami, G.F.; Ferraiolo, A.; et al. Impaired increase of plasma abscisic acid in response to oral glucose load in type 2 diabetes and in gestational diabetes. PLoS ONE 2015, 10, e0115992. [Google Scholar] [CrossRef] [Green Version]
- Atkinson, F.S.; Villar, A.; Mul, A.; Zangara, A.; Risco, E.; Smidt, C.R.; Hontecillas, R.; Leber, A.; Bassaganya-riera, J. Abscisic acid standardized fig (Ficus carica) extracts ameliorate postprandial glycemic and insulinemic responses in healthy adults. Nutrients 2006, 11, 1757. [Google Scholar] [CrossRef] [Green Version]
- Guri, A.J.; Hontecillas, R.; Si, H.; Liu, D.; Bassaganya-Riera, J. Dietary abscisic acid ameliorates glucose tolerance and obesity-related inflammation in db/db mice fed high-fat diets. Clin. Nutr. 2007, 26, 107–116. [Google Scholar] [CrossRef]
- Magnone, M.; Ameri, P.; Salis, A.; Andraghetti, G.; Emionite, L.; Murialdo, G.; De Flora, A.; Zocchi, E. Microgram amounts of abscisic acid in fruit extracts improve glucose tolerance and reduce insulinemia in rats and in humans. FASEB J. 2015, 29, 4783–4793. [Google Scholar] [CrossRef] [Green Version]
- Derosa, G.; Maffioli, P.; D’angelo, A.; Preti, P.S.; Tenore, G.; Novellino, E. Abscisic acid treatment in patients with prediabetes. Nutrients 2020, 12, 2931. [Google Scholar] [CrossRef]
- Muoio, D.M.; Newgard, C.B. Mechanisms of disease: Molecular and metabolic mechanisms of insulin resistance and β-cell failure in type 2 diabetes. Nat. Rev. Mol. Cell Biol. 2008, 9, 193–205. [Google Scholar] [CrossRef]
- Ota, A.; Ulrih, N.P. An overview of herbal products and secondary metabolites used for management of type two diabetes. Front. Pharmacol. 2017, 8, 436. [Google Scholar] [CrossRef] [PubMed] [Green Version]
- Egbuna, C.; Awuchi, C.G.; Kushwaha, G.; Rudrapal, M.; Patrick-Iwuanyanwu, K.C.; Singh, O.; Odoh, U.E.; Khan, J.; Jeevanandam, J.; Kumarasamy, S.; et al. Bioactive Compounds Effective Against Type 2 Diabetes Mellitus: A Systematic Review. Curr. Top. Med. Chem. 2021, 21, 1067–1095. [Google Scholar] [CrossRef] [PubMed]
- Iannuzzo, F.; Piccolo, V.; Novellino, E.; Schiano, E.; Salviati, E.; Summa, V.; Campiglia, P.; Tenore, G.C.; Maisto, M. A Food-Grade Method for Enhancing the Levels of Low Molecular Weight Proanthocyanidins with Potentially High Intestinal Bioavailability. Int. J. Mol. Sci. 2022, 23, 13557. [Google Scholar] [CrossRef] [PubMed]
- Rein, M.J.; Renouf, M.; Cruz-Hernandez, C.; Actis-Goretta, L.; Thakkar, S.K.; da Silva Pinto, M. Bioavailability of bioactive food compounds: A challenging journey to bioefficacy. Br. J. Clin. Pharmacol. 2013, 75, 588–602. [Google Scholar] [CrossRef] [PubMed] [Green Version]
- Arif, M.A.; Alseekh, S.; Harb, J.; Fernie, A.; Frank, W. Abscisic acid, cold and salt stimulate conserved metabolic regulation in the moss Physcomitrella patens. Plant Biol. 2018, 20, 1014–1022. [Google Scholar] [CrossRef] [PubMed]
- Fang, Q.; Jiang, T.; Xu, L.; Liu, H.; Mao, H.; Wang, X.; Jiao, B.; Duan, Y.; Wang, Q.; Dong, Q.; et al. A salt-stress-regulator from the Poplar R2R3 MYB family integrates the regulation of lateral root emergence and ABA signaling to mediate salt stress tolerance in Arabidopsis. Plant Physiol. Biochem. 2017, 114, 100–110. [Google Scholar] [CrossRef]
- Manore, M.M. Exercise and the Institute of Medicine Recommendations for Nutrition. Curr. Sport. Med. Rep. 2005, 4, 193–198. [Google Scholar] [CrossRef]
- European Medicines Agency (EMA). Status of EMEA Scientific Guidelines and European Pharmacopoeia Monographs and Chapters in the Regulatory Framework Applicable to Medicinal Products; European Medicines Agency (EMA): Amsterdam, The Netherlands, 2008; pp. 2–4. [Google Scholar]
- Maisto, M.; Schiano, E.; Novellino, E.; Piccolo, V.; Iannuzzo, F.; Salviati, E.; Summa, V.; Annunziata, G.; Tenore, G.C. Application of a Rapid and Simple Technological Process to Increase Levels and Bioccessibility of Free Phenolic Compounds in Annurca Apple Nutraceutical Product. Foods 2022, 11, 1453. [Google Scholar] [CrossRef]
- Maisto, M.; Piccolo, V.; Novellino, E.; Schiano, E.; Iannuzzo, F.; Ciampaglia, R.; Summa, V.; Tenore, G.C. Optimization of Ursolic Acid Extraction in Oil from Annurca Apple to Obtain Oleolytes with Potential Cosmeceutical Application. Antioxidants 2023, 12, 224. [Google Scholar] [CrossRef]
- Pereira, M.N.; Matos, B.N.; Gratieri, T.; Cunha-Filho, M.; Gelfuso, G.M. Development and validation of a simple chromatographic method for simultaneous determination of clindamycin phosphate and rifampicin in skin permeation studies. J. Pharm. Biomed. Anal. 2018, 159, 331–340. [Google Scholar] [CrossRef]
- Di Lorenzo, R.; Neri, I.; Russo, G.; Laneri, S.; Grumetto, L. Tracking Down of a Selected Panel of Parabens: A Validated Method to Evaluate Their Occurrence in Skin Layers. Cosmetics 2022, 9, 102. [Google Scholar] [CrossRef]
- Whelan, L.C.; Geary, M.; Healy, J. A Novel, Simple Rapid Reverse-Phase HPLC-DAD Analysis, for the Simultaneous Determination of Phenolic Compounds and Abscisic Acid Commonly Found in Foodstuff and Beverages. J. Chromatogr. Sci. 2022, 60, 648–654. [Google Scholar] [CrossRef] [PubMed]
- Xiong, D.M.; Liu, Z.; Chen, H.; Xue, J.T.; Yang, Y.; Chen, C.; Ye, L.M. Profiling the dynamics of abscisic acid and ABA-glucose ester after using the glucosyltransferase UGT71C5 to mediate abscisic acid homeostasis in Arabidopsis thaliana by HPLC-ESI-MS/MS. J. Pharm. Anal. 2014, 4, 190–196. [Google Scholar] [CrossRef] [PubMed] [Green Version]
- Bosco, R.; Caser, M.; Vanara, F.; Scariot, V. Development of a rapid LC-DAD/FLD method for the simultaneous determination of auxins and abscisic acid in plant extracts. J. Agric. Food Chem. 2013, 61, 10940–10947. [Google Scholar] [CrossRef] [PubMed]
- Bai, Y.L.; Cai, B.D.; Luo, X.T.; Ye, T.T.; Feng, Y.Q. Simultaneous Determination of Abscisic Acid and Its Catabolites by Hydrophilic Solid-Phase Extraction Combined with Ultra High Performance Liquid Chromatography-Tandem Mass Spectrometry. J. Agric. Food Chem. 2018, 66, 10906–10912. [Google Scholar] [CrossRef]
- Pem, D.; Jeewon, R. Fruit and vegetable intake: Benefits and progress of nutrition education interventions-narrative review article. Iran. J. Public Health 2015, 44, 1309–1321. [Google Scholar]
- Zocchi, E.; Hontecillas, R.; Leber, A.; Einerhand, A.; Carbo, A.; Bruzzone, S.; Tubau-Juni, N.; Philipson, N.; Zoccoli-Rodriguez, V.; Sturla, L.; et al. Abscisic Acid: A Novel Nutraceutical for Glycemic Control. Front. Nutr. 2017, 4, 24. [Google Scholar] [CrossRef] [Green Version]


| Characteristics | Study Participants (n = 8) |
|---|---|
| Demographic and anthropometric parameters | |
| Male sex (No (%)) | 3 (37.5%) |
| White ethnicity (No (%)) | 8 (100%) |
| Age (years) | 34 ± 3.7 |
| Height (m) | 1.6 ± 0.9 |
| Weight (kg) | 71.2 ± 6.9 |
| BMI (kg/m2) | 24.6 ± 3.3 |
| WC (cm) | 89.4 ± 5.4 |
| Clinical parameters | |
| HbA1c (%) | 6.5 ± 0.4 |
| Triglycerides (mg/dL) | 105.2 ± 14.5 |
| Total cholesterol (mg/dL) | 171.3 ± 11.9 |
| HDL-C (mg/dL) | 46.7 ± 5.4 |
| LDL-C (mg/Dl) | 89.5 ± 7.6 |
| AST (UI/L) | 25.6 ± 3.9 |
| ALT (UI/L) | 18.7 ± 2.8 |
| Creatinine (mg/dL) | 0.9 ± 0.1 |
| Linear Range (ppb) | Slope | Intercept | R2 | Repeatability (n = 5) RSD % | Intermediate Precision (n = 10) RSD% | LOQ (ppb) | LOD (ppb) | Matrix Effect |
|---|---|---|---|---|---|---|---|---|
| 40.0–2.0 | 92.84 | −32.45 | 0.9981 | 2.30 | 12.01% | 5.31 | 1.59 | 39.97% |
| Spiking level (ppb) | 2 | 4 | 10 | 20 | 40 | |||
| Recovery (%) | 71.8 | 73.3 | 77.7 | 65.5 | 63.5 |
Disclaimer/Publisher’s Note: The statements, opinions and data contained in all publications are solely those of the individual author(s) and contributor(s) and not of MDPI and/or the editor(s). MDPI and/or the editor(s) disclaim responsibility for any injury to people or property resulting from any ideas, methods, instructions or products referred to in the content. |
© 2023 by the authors. Licensee MDPI, Basel, Switzerland. This article is an open access article distributed under the terms and conditions of the Creative Commons Attribution (CC BY) license (https://creativecommons.org/licenses/by/4.0/).
Share and Cite
Schiano, E.; Neri, I.; Maisto, M.; Novellino, E.; Iannuzzo, F.; Piccolo, V.; Summa, V.; Grumetto, L.; Tenore, G.C. Validation of an LC-MS/MS Method for the Determination of Abscisic Acid Concentration in a Real-World Setting. Foods 2023, 12, 1077. https://doi.org/10.3390/foods12051077
Schiano E, Neri I, Maisto M, Novellino E, Iannuzzo F, Piccolo V, Summa V, Grumetto L, Tenore GC. Validation of an LC-MS/MS Method for the Determination of Abscisic Acid Concentration in a Real-World Setting. Foods. 2023; 12(5):1077. https://doi.org/10.3390/foods12051077
Chicago/Turabian StyleSchiano, Elisabetta, Ilaria Neri, Maria Maisto, Ettore Novellino, Fortuna Iannuzzo, Vincenzo Piccolo, Vincenzo Summa, Lucia Grumetto, and Gian Carlo Tenore. 2023. "Validation of an LC-MS/MS Method for the Determination of Abscisic Acid Concentration in a Real-World Setting" Foods 12, no. 5: 1077. https://doi.org/10.3390/foods12051077